Differential methylation on the region level was computed based on a variety of metrics. Of particular interest for the following plots and analyses are the following quantities for each region: the mean methylation difference in a region of the two groups being and of quotient of mean methylation levelsas well as a p-value obtained from statistical testing (limma or t-test; depending on parameter settings). Additionally each region was assigned a rank based on each of these three criteria. A combined rank is computed as the maximum (i.e. worst) value among the three ranks. The smaller the combined rank for a region, the more evidence for differential methylation it exhibits. Regions were defined based on the region types specified in the analysis. This section includes scatterplots of the region group means as well as volcano plots of each pairwise comparison colored according to the combined rank of a given region.
The following rank cutfoffs have been automatically selected for the analysis of differentially methylated regions:
| cpgislands | genes | promoters | tiling1kb | gencode22promoters | ensembleRegBuildBPall | |
| mono vs. neut (based on cmp_ct_mono_vs_neut) | 0 | 0 | 0 | 0 | 0 | 0 |
| mono vs. neut (based on cmp_ct_mono_vs_neut_VB) | 0 | 0 | 0 | 0 | 0 | 0 |
| Mf vs. mono (based on cmp_ct_mono_vs_mf) | 0 | 0 | 0 | 0 | 0 | 0 |
| Mf vs. mono (based on cmp_ct_mono_vs_mf_VB) | 0 | 0 | 0 | 0 | 0 | 0 |
| EM vs. TN (based on cmp_ct_TCD4_TN_vs_CM) | 0 | 0 | 0 | 0 | 0 | 0 |
| EM vs. TN (based on cmp_ct_TCD4_TN_vs_EM) | 0 | 0 | 0 | 0 | 0 | 0 |
| CM vs. EM (based on cmp_ct_TCD4_CM_vs_EM) | 0 | 0 | 0 | 0 | 0 | 0 |
| EM vs. TN (based on cmp_ct_TCD8_TN_vs_CM) | 0 | 0 | 0 | 0 | 0 | 0 |
| EM vs. TN (based on cmp_ct_TCD8_TN_vs_EM) | 0 | 0 | 0 | 0 | 0 | 0 |
| CM vs. EM (based on cmp_ct_TCD8_CM_vs_EM) | 0 | 0 | 0 | 0 | 0 | 0 |
| meta vs. myel (based on cmp_ct_neut_myel_vs_meta) | 0 | 0 | 0 | 0 | 0 | 0 |
| band vs. meta (based on cmp_ct_neut_meta_vs_band) | 0 | 0 | 0 | 0 | 0 | 0 |
| band vs. segm (based on cmp_ct_neut_band_vs_segm) | 0 | 0 | 0 | 0 | 0 | 0 |
| early vs. mature (based on cmp_ct_neut_early_vs_mature) | 0 | 0 | 0 | 0 | 0 | 0 |
| comparison | |
| regions | |
| differential methylation measure |
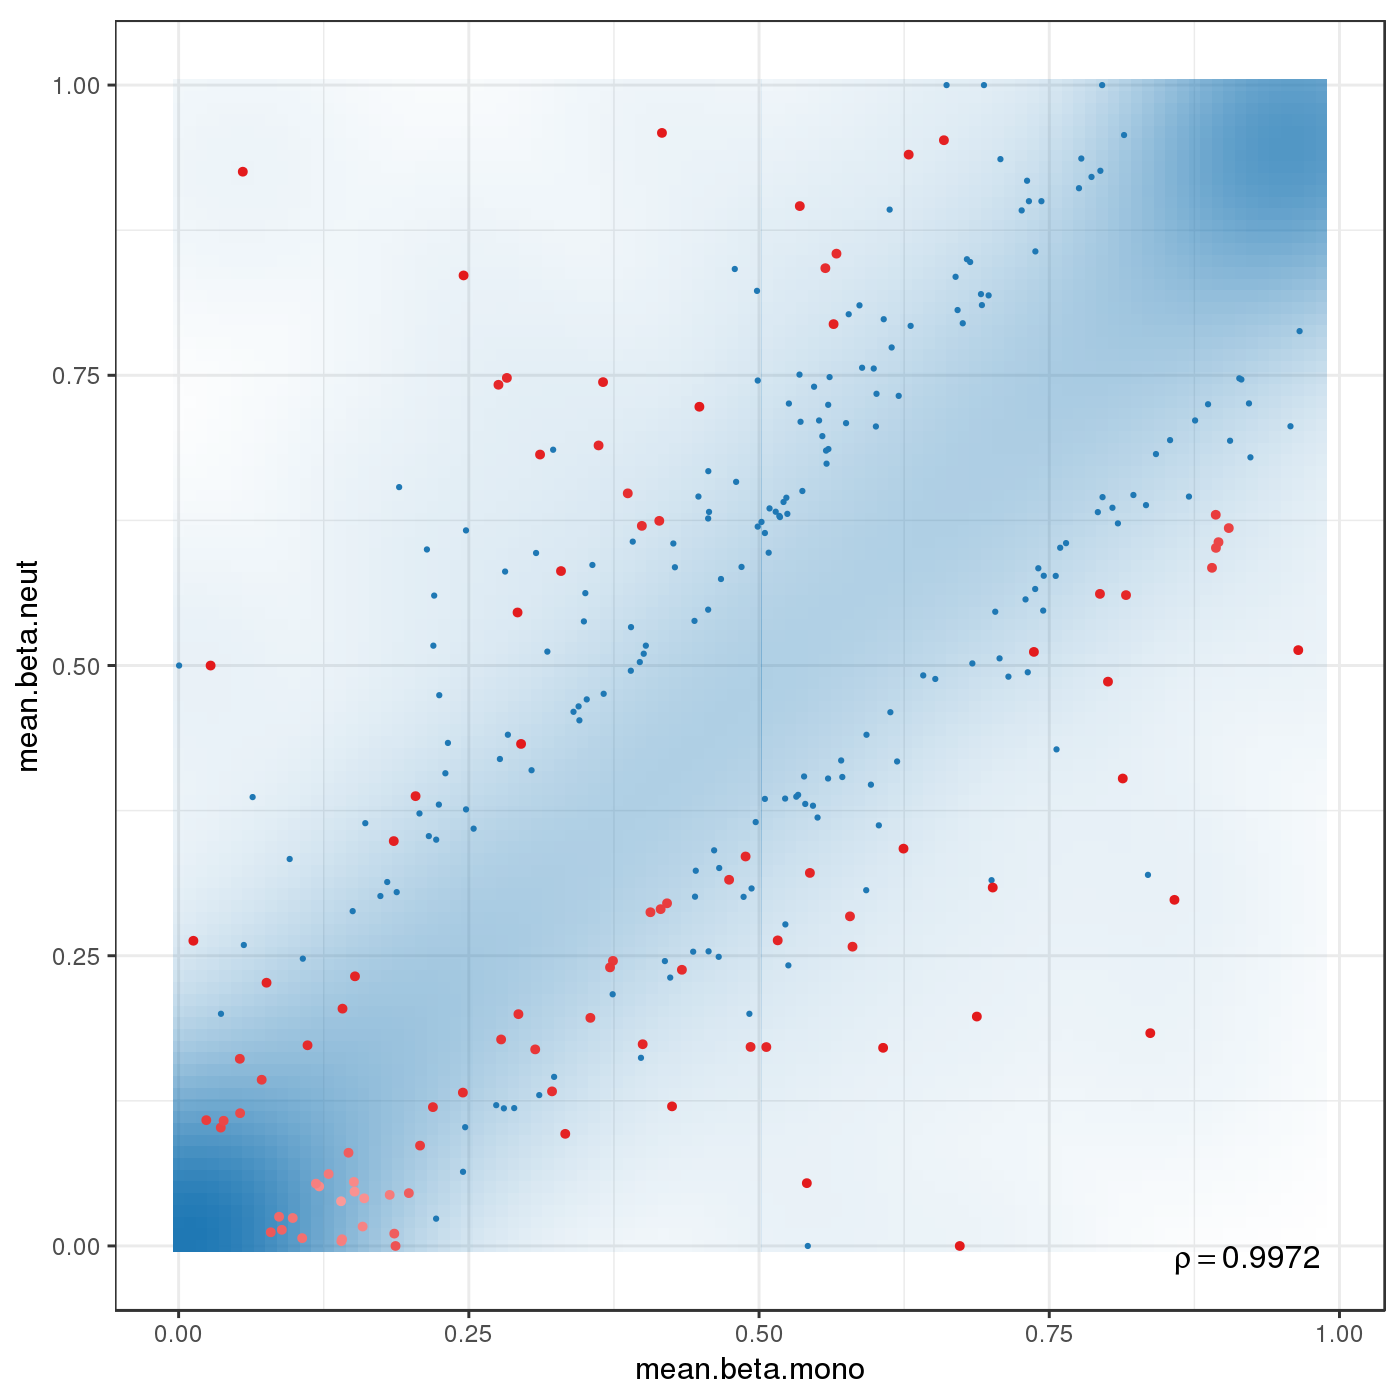
Scatterplot for differential methylation (regions). If the selected criterion is not rankGradient:
The transparency corresponds to point density. The 1% of the points in the sparsest populated plot regions are drawn explicitly.
Additionally, the colored points represent differentially methylated regions (according to the selected criterion).
If the selected criterion is rankGradient: median combined ranks accross hexagonal bins are shown
as a gradient according to the color legend.
| comparison | |
| regions | |
| difference metric | |
| significance metric |
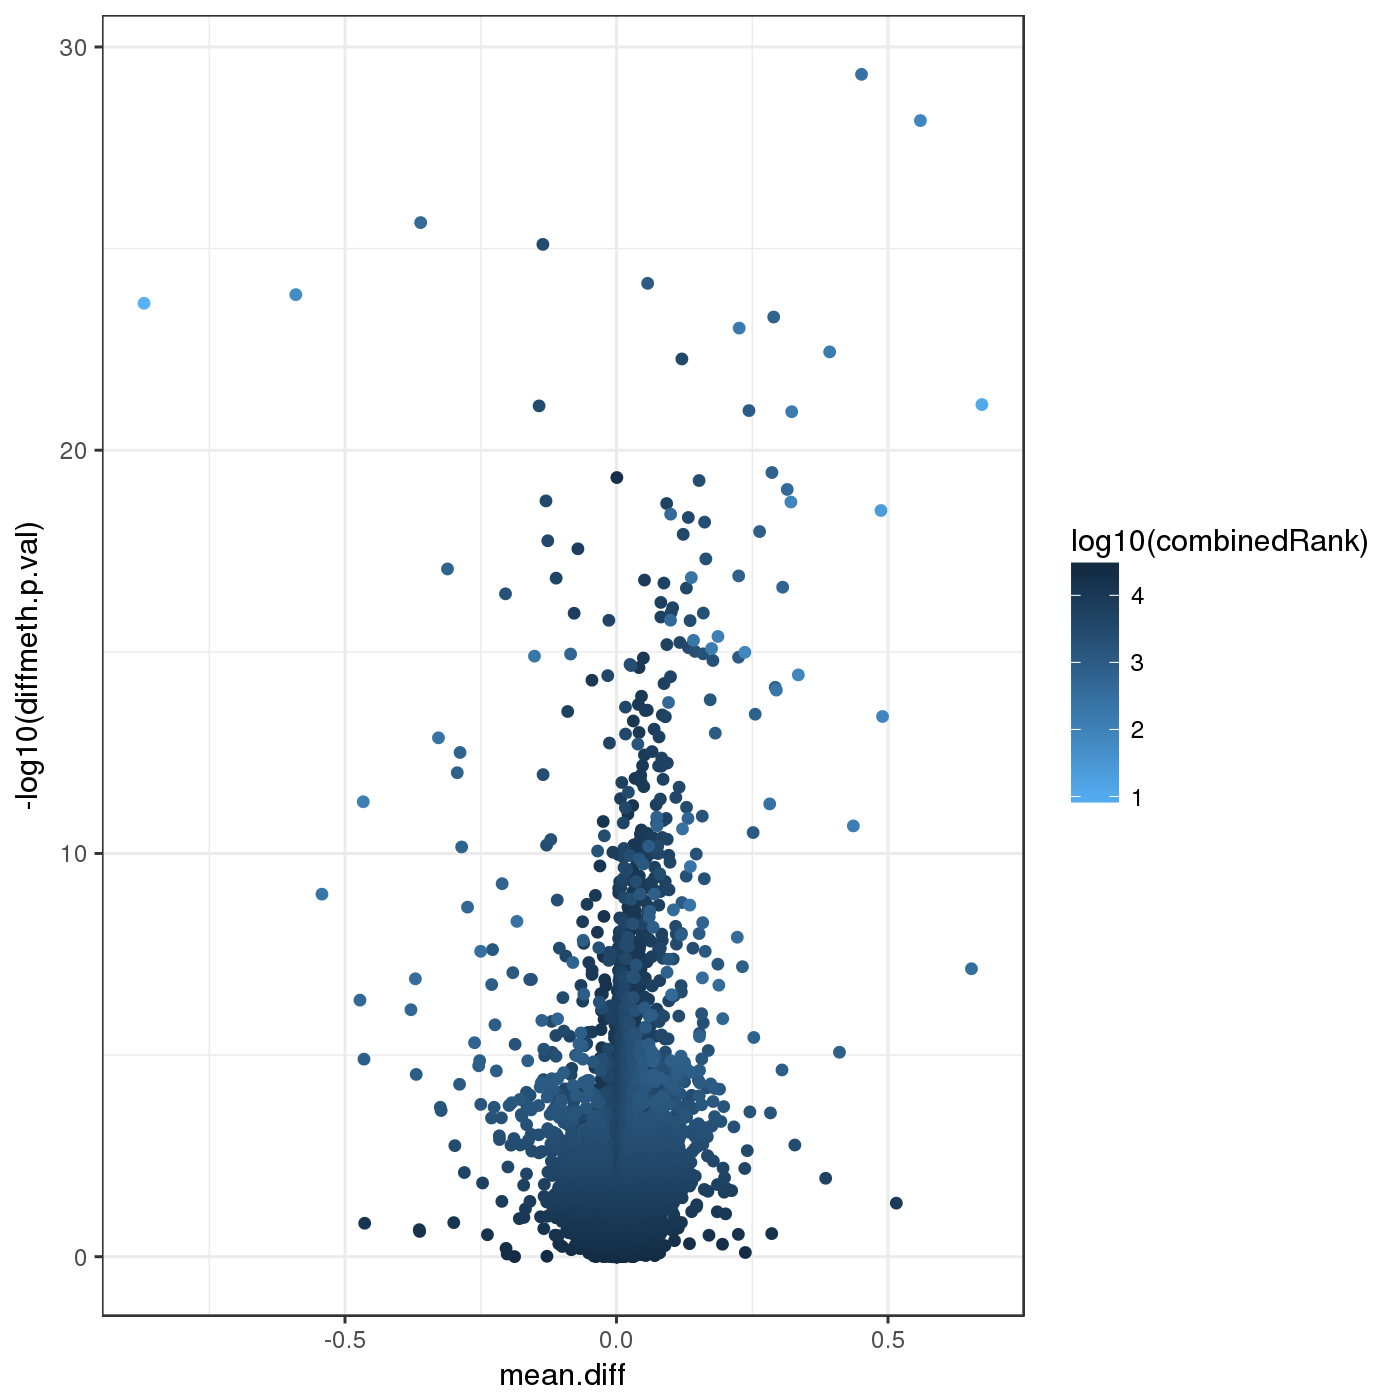
Volcano plot for differential methylation quantified by various metrics. Color scale according to combined ranking.
Differential Methylation Tables
A tabular overview of measures for differential methylation on the region level for the individual comparisons are provided in this section.
- id: region id
- Chromosome: chromosome of the region
- Start: start coordinate of the region
- End: end coordinate of the region
- mean.g1,mean.g2: (where g1 and g2 is replaced by the respective group names in the table) mean methylation in each of the two groups
- mean.diff: difference in methylation means between the two groups: mean.g1-mean.g2. In case of paired analysis, it is the mean of the pairwise differences.
- mean.quot.log2: log2 of the quotient in methylation: log2((mean.g1+epsilon)/(mean.g2+epsilon)), where epsilon:=0.01. In case of paired analysis, it is the mean of the pairwise quotients.
- diffmeth.p.val: p-value obtained from linear models employed in the limma package (or alternatively from a two-sided Welch t-test; which type of p-value is computed is specified in the differential.site.test.method option).
- max.g1,max.g2: maximum methylation level in group 1 and 2 respectively
- min.g1,min.g2: minimum methylation level in group 1 and 2 respectively
- sd.g1,sd.g2: standard deviation of methylation levels
- min.diff: Minimum of 0 and the smallest pairwise difference between samples of the two groups
- diffmeth.p.adj.fdr: FDR adjusted p-value of all sites
- combinedRank: mean.diff, mean.quot.log2 and diffmeth.p.val are ranked for all regions. This aggregates them using the maximum, i.e. worst rank of a site among the three measures
- num.na.g1,num.na.g2: number of NA methylation values for groups 1 and 2 respectively
- mean.covg.g1,mean.covg.g2: mean coverage of groups 1 and 2 respectively (In case of Infinium array methylation data, coverage is defined as combined beadcount.)
- min.covg.g1,min.covg.g2: minimum coverage of groups 1 and 2 respectively
- max.covg.g1,max.covg.g2: maximum coverage of groups 1 and 2 respectively
- covg.thresh.nsamples.g1,covg.thresh.nsamples.g2: number of samples in group 1 and 2 respectively exceeding the coverage threshold (5) for this region.
- Strand: strand of the site
- var.g1, var.g2: (g1 and g2 are replaced by the corrspondinhg group used in the differentiality analysis) the variances found in the groups
- var.diff: difference in variance values between the two groups g1 and g2 (=var.g1-var.g2). In case of paired analysis, it is the variance of the pairwise differences.
- var.log.ratio: Log2 of the ratio between the variances of the two groups g1 and g2 (=log2(var.g1+eps/var.g2+eps), default eps=0.01). In case of paired analysis, it is the variance of the pairwise quotients.
- diffVar.p.val: p-value resulting from applying the selected differentially variability method (diffVar or iEVORA)
- diffVar.p.adj.fdr: FDR-adjusted p-value for differential variability
- log10P: negative decadic logarithm of the p-value
- log10FDR: negative decadic logarithmn of the FDR-adjusted p-value
- combinedRank.var: var.diff, var.log.ratio and comb.p.val.var are ranked for all sites and the higher (=worst) rank is selected.
The tables for the individual comparisons can be found here:
| cpgislands | genes | promoters | tiling1kb | gencode22promoters | ensembleRegBuildBPall | |
| mono vs. neut (based on cmp_ct_mono_vs_neut) | csv | csv | csv | csv | csv | csv |
| mono vs. neut (based on cmp_ct_mono_vs_neut_VB) | csv | csv | csv | csv | csv | csv |
| Mf vs. mono (based on cmp_ct_mono_vs_mf) | csv | csv | csv | csv | csv | csv |
| Mf vs. mono (based on cmp_ct_mono_vs_mf_VB) | csv | csv | csv | csv | csv | csv |
| EM vs. TN (based on cmp_ct_TCD4_TN_vs_CM) | csv | csv | csv | csv | csv | csv |
| EM vs. TN (based on cmp_ct_TCD4_TN_vs_EM) | csv | csv | csv | csv | csv | csv |
| CM vs. EM (based on cmp_ct_TCD4_CM_vs_EM) | csv | csv | csv | csv | csv | csv |
| EM vs. TN (based on cmp_ct_TCD8_TN_vs_CM) | csv | csv | csv | csv | csv | csv |
| EM vs. TN (based on cmp_ct_TCD8_TN_vs_EM) | csv | csv | csv | csv | csv | csv |
| CM vs. EM (based on cmp_ct_TCD8_CM_vs_EM) | csv | csv | csv | csv | csv | csv |
| meta vs. myel (based on cmp_ct_neut_myel_vs_meta) | csv | csv | csv | csv | csv | csv |
| band vs. meta (based on cmp_ct_neut_meta_vs_band) | csv | csv | csv | csv | csv | csv |
| band vs. segm (based on cmp_ct_neut_band_vs_segm) | csv | csv | csv | csv | csv | csv |
| early vs. mature (based on cmp_ct_neut_early_vs_mature) | csv | csv | csv | csv | csv | csv |
Differential Variability
Differential variability on the region level was computed similar to differential methylation, but the mean of variances, the log-ratio of the quotient of variances as well as the p-values from the differentiality test were employed. Ranking was performed in line with the ranking of differential methylation.
The following rank cutoffs have been automatically selected for the analysis of differentially variable regions:
| cpgislands | genes | promoters | tiling1kb | gencode22promoters | ensembleRegBuildBPall | |
| mono vs. neut (based on cmp_ct_mono_vs_neut) | 0 | 0 | 0 | 0 | 0 | 0 |
| mono vs. neut (based on cmp_ct_mono_vs_neut_VB) | 0 | 0 | 0 | 0 | 0 | 0 |
| Mf vs. mono (based on cmp_ct_mono_vs_mf) | 0 | 0 | 0 | 0 | 0 | 0 |
| Mf vs. mono (based on cmp_ct_mono_vs_mf_VB) | 0 | 0 | 0 | 0 | 0 | 0 |
| EM vs. TN (based on cmp_ct_TCD4_TN_vs_CM) | 0 | 0 | 0 | 0 | 0 | 0 |
| EM vs. TN (based on cmp_ct_TCD4_TN_vs_EM) | 0 | 0 | 0 | 0 | 0 | 0 |
| CM vs. EM (based on cmp_ct_TCD4_CM_vs_EM) | 0 | 0 | 0 | 0 | 0 | 0 |
| EM vs. TN (based on cmp_ct_TCD8_TN_vs_CM) | 0 | 0 | 0 | 0 | 0 | 0 |
| EM vs. TN (based on cmp_ct_TCD8_TN_vs_EM) | 0 | 0 | 0 | 0 | 0 | 0 |
| CM vs. EM (based on cmp_ct_TCD8_CM_vs_EM) | 0 | 0 | 0 | 0 | 0 | 0 |
| meta vs. myel (based on cmp_ct_neut_myel_vs_meta) | 0 | 0 | 0 | 0 | 0 | 0 |
| band vs. meta (based on cmp_ct_neut_meta_vs_band) | 0 | 0 | 0 | 0 | 0 | 0 |
| band vs. segm (based on cmp_ct_neut_band_vs_segm) | 0 | 0 | 0 | 0 | 0 | 0 |
| early vs. mature (based on cmp_ct_neut_early_vs_mature) | 0 | 0 | 0 | 0 | 0 | 0 |
| comparison | |
| regions | |
| differential variability measure |
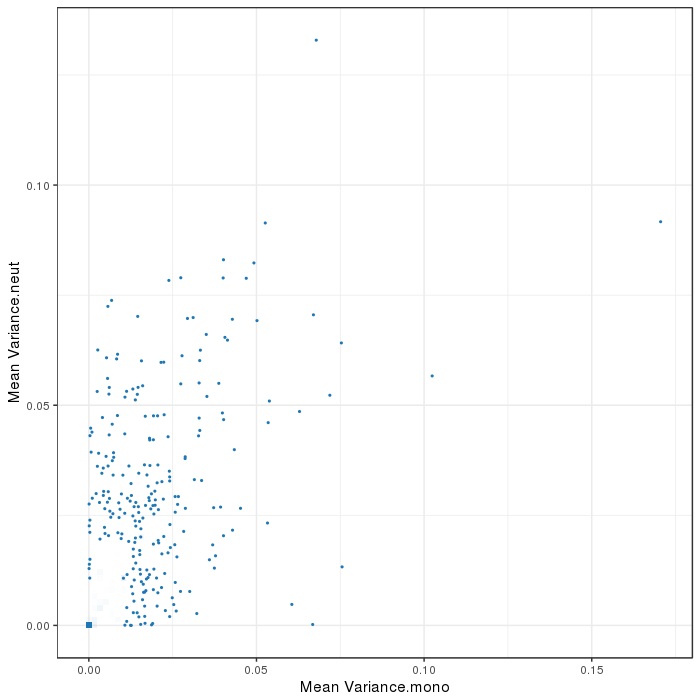
Scatterplot for differential variable regions. The transparency corresponds to point density. The 1% of the points in the sparsest populated plot regions are drawn explicitly. Additionally, the colored points represent differentially methylated regions (according to the selected criterion).
| comparison | |
| regions | |
| difference metric | |
| significance metric |
Volcano plot for differential variability quantified by various metrics. Color scale according to combined ranking.
| comparison | |
| regions | |
| rankCutoff |
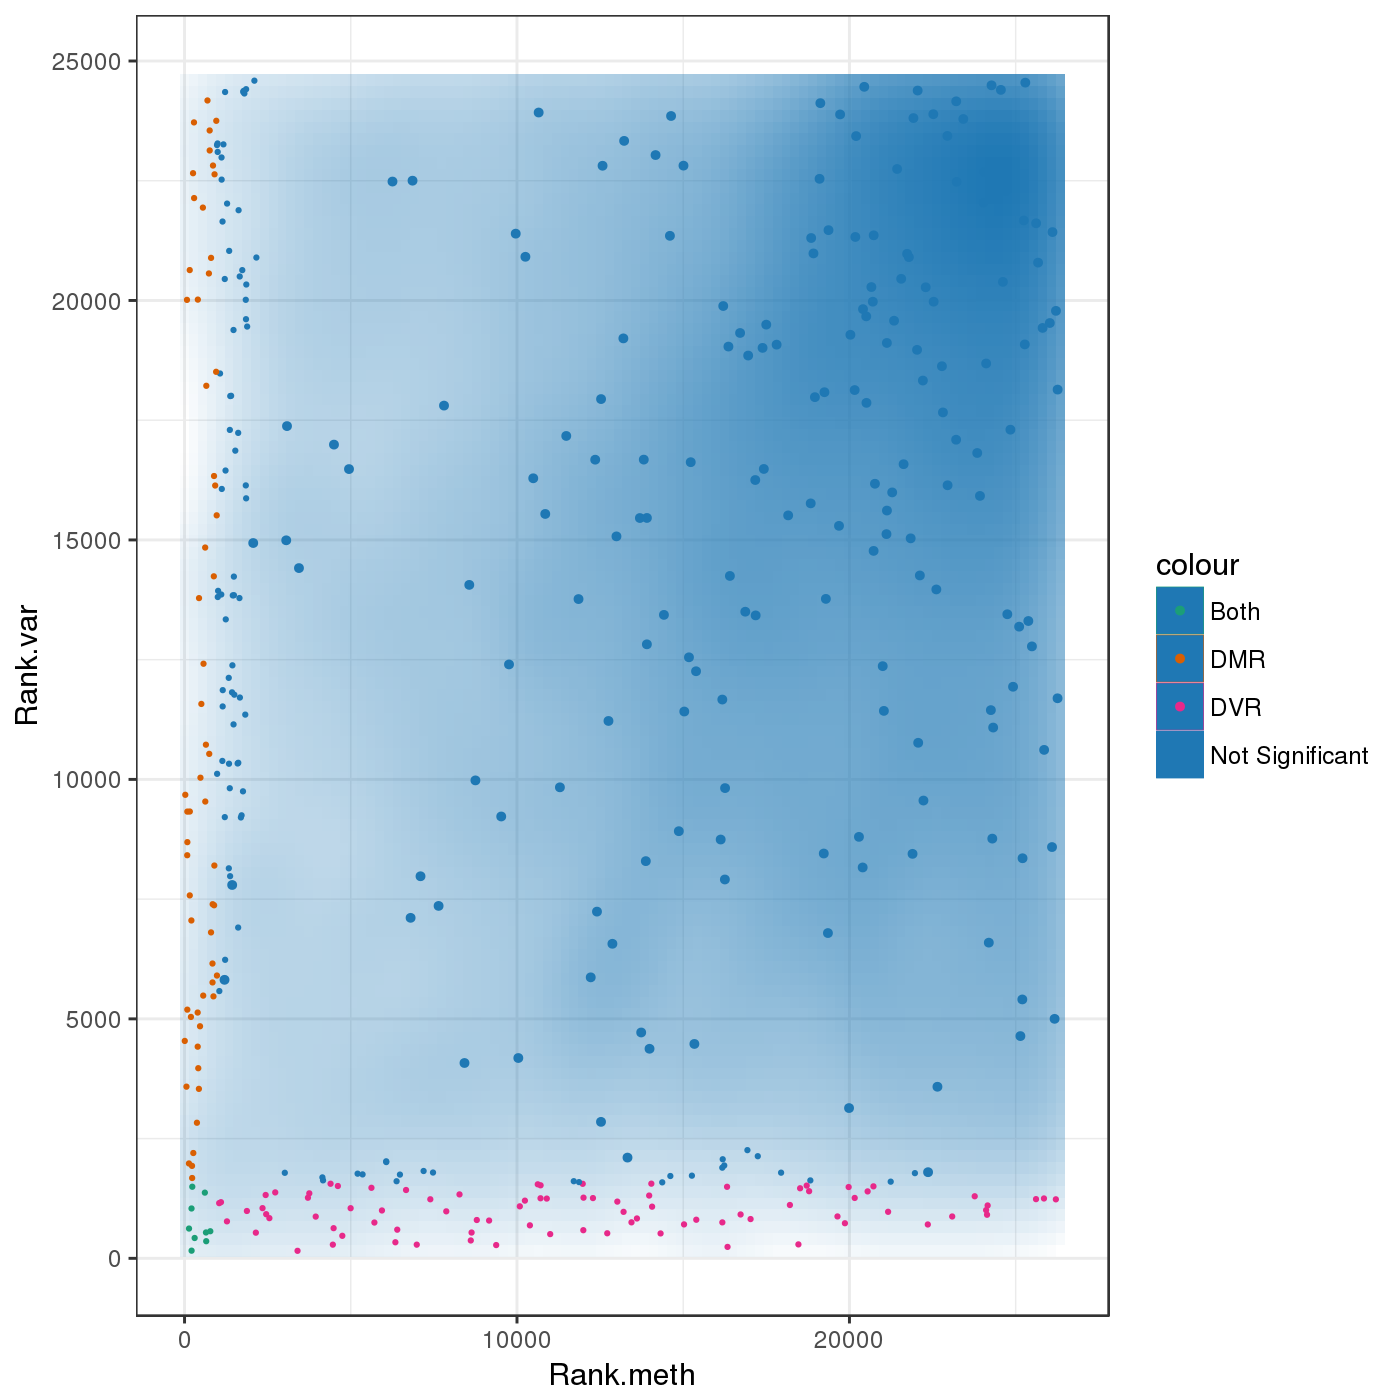
Scatterplot comparing differentially methylated (DMRs) and variable regions (DVRs), as well as regions that are both differentially methylated and variable.
GO Enrichment Analysis
GO Enrichment Analysis was conducted. The wordclouds and tables below contains significant GO terms as determined by a hypergeometric test.
| comparison | |
| Hypermethylation/hypomethylation | |
| ontology | |
| regions | |
| differential methylation measure |
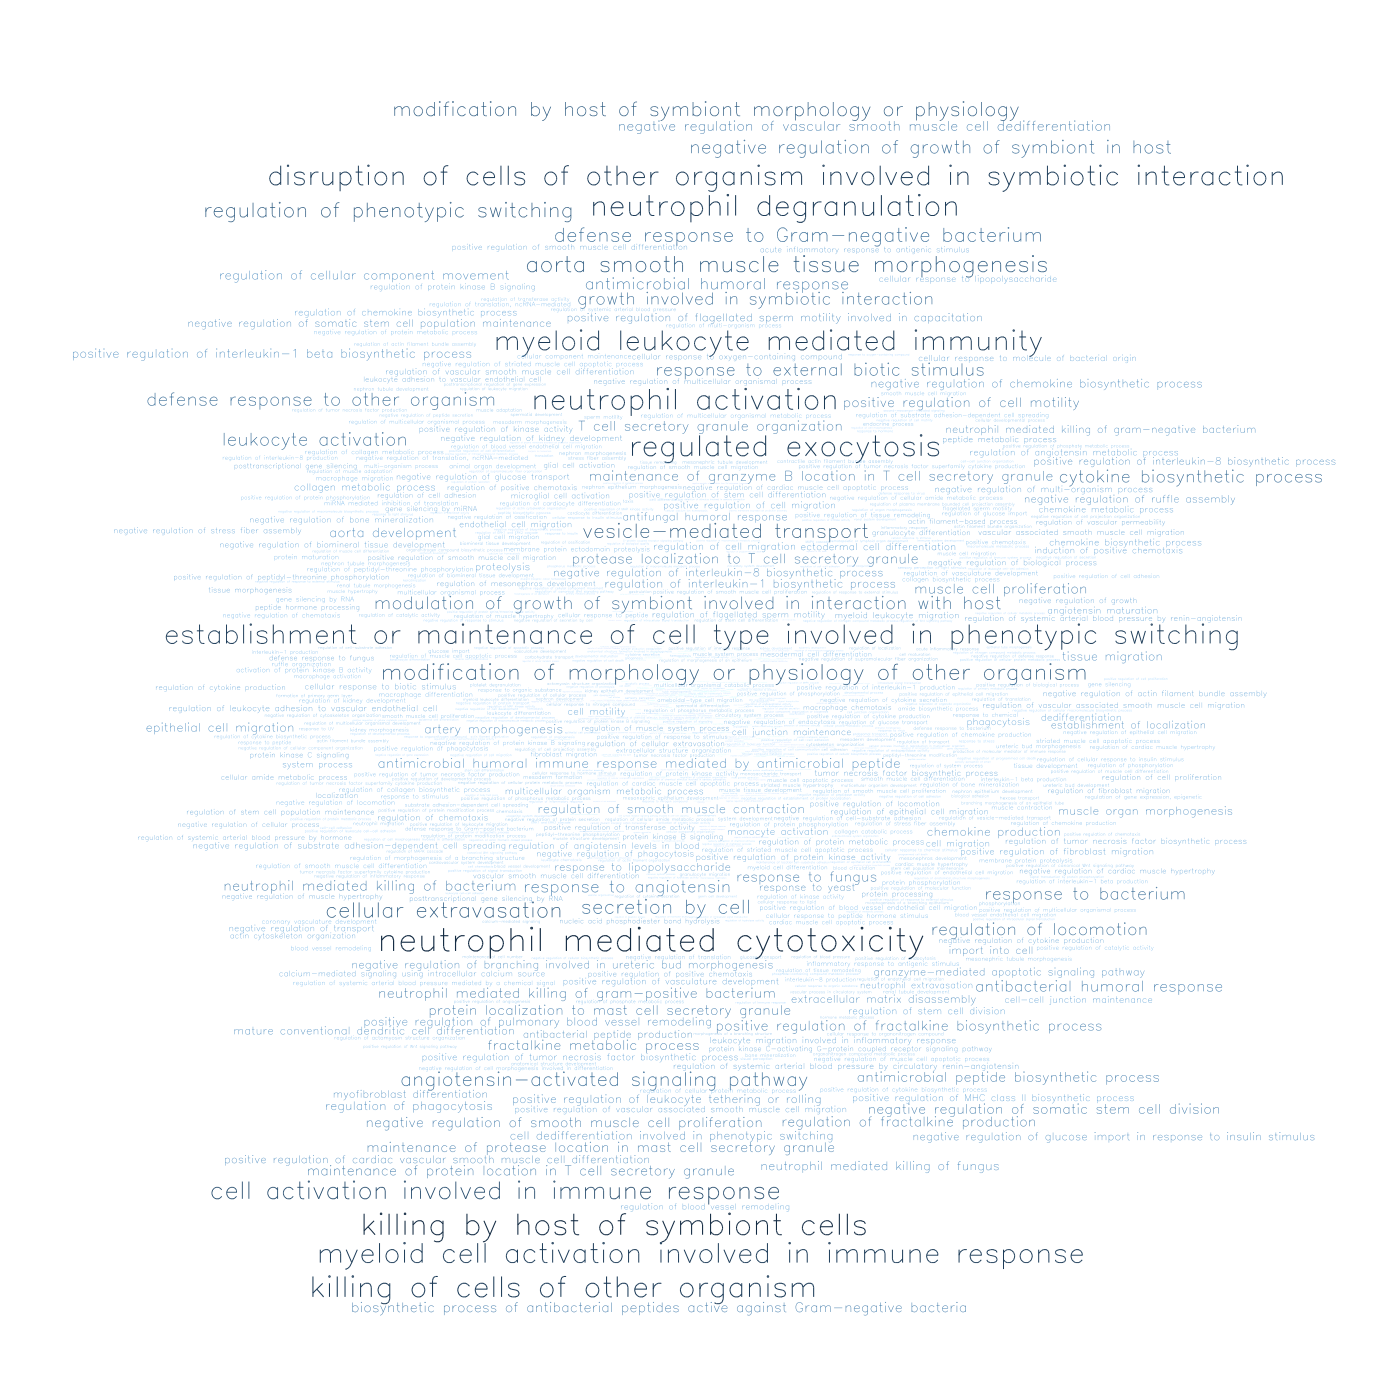
Wordclouds for GO enrichment terms.
| comparison | |
| Hypermethylation/hypomethylation | |
| ontology | |
| regions | |
| differential methylation measure |
| NA. |
| n/a |
| GOMFID | Pvalue | OddsRatio | ExpCount | Count | Size | Term |
| GO:2000113 | 0 | 9.2514 | 2.0861 | 11 | 1472 | negative regulation of cellular macromolecule biosynthetic process |
| GO:0009890 | 0 | 8.2421 | 2.3143 | 11 | 1633 | negative regulation of biosynthetic process |
| GO:0010629 | 0 | 7.2953 | 2.5793 | 11 | 1820 | negative regulation of gene expression |
| GO:0009790 | 0 | 8.8411 | 1.318 | 8 | 930 | embryo development |
| GO:2000774 | 1e-04 | 171.3968 | 0.0156 | 2 | 11 | positive regulation of cellular senescence |
| GO:0042127 | 2e-04 | 6.044 | 2.2208 | 9 | 1567 | regulation of cell proliferation |
| GO:0043583 | 2e-04 | 16.8484 | 0.2891 | 4 | 204 | ear development |
| GO:0009653 | 2e-04 | 5.286 | 3.4098 | 11 | 2406 | anatomical structure morphogenesis |
| GO:0080090 | 2e-04 | 5.093 | 8.234 | 17 | 5810 | regulation of primary metabolic process |
| GO:0007389 | 2e-04 | 10.865 | 0.5796 | 5 | 409 | pattern specification process |
| GO:0090596 | 4e-04 | 13.8298 | 0.3501 | 4 | 247 | sensory organ morphogenesis |
| GO:0044271 | 5e-04 | 4.4463 | 6.8338 | 15 | 4822 | cellular nitrogen compound biosynthetic process |
| GO:0000122 | 5e-04 | 7.2531 | 1.0742 | 6 | 758 | negative regulation of transcription from RNA polymerase II promoter |
| GO:0021884 | 6e-04 | 64.2143 | 0.0368 | 2 | 26 | forebrain neuron development |
| GO:1903507 | 7e-04 | 5.8314 | 1.6128 | 7 | 1138 | negative regulation of nucleic acid-templated transcription |
| GO:0051094 | 0.001 | 5.4808 | 1.7077 | 7 | 1205 | positive regulation of developmental process |
| GO:0051253 | 0.0011 | 5.4464 | 1.7177 | 7 | 1212 | negative regulation of RNA metabolic process |
| GO:0060429 | 0.0011 | 5.4464 | 1.7177 | 7 | 1212 | epithelium development |
| GO:0021723 | 0.0014 | Inf | 0.0014 | 1 | 1 | medullary reticular formation development |
| GO:0048894 | 0.0014 | Inf | 0.0014 | 1 | 1 | efferent axon development in a lateral line nerve |
| GO:0061452 | 0.0014 | Inf | 0.0014 | 1 | 1 | retrotrapezoid nucleus neuron differentiation |
| GO:1903769 | 0.0014 | Inf | 0.0014 | 1 | 1 | negative regulation of cell proliferation in bone marrow |
| GO:0090342 | 0.0015 | 39.4799 | 0.0581 | 2 | 41 | regulation of cell aging |
| GO:0034249 | 0.0016 | 9.2404 | 0.5173 | 4 | 365 | negative regulation of cellular amide metabolic process |
| GO:0010556 | 0.0017 | 10.3166 | 0.5579 | 4 | 593 | regulation of macromolecule biosynthetic process |
| GO:0021545 | 0.0021 | 33.4576 | 0.068 | 2 | 48 | cranial nerve development |
| GO:0048519 | 0.0022 | 3.6114 | 6.9344 | 14 | 4893 | negative regulation of biological process |
| GO:0065007 | 0.0026 | 9.6495 | 15.9961 | 22 | 11287 | biological regulation |
| GO:0021852 | 0.0028 | 736.5909 | 0.0028 | 1 | 2 | pyramidal neuron migration |
| GO:0021934 | 0.0028 | 736.5909 | 0.0028 | 1 | 2 | hindbrain tangential cell migration |
| GO:0048925 | 0.0028 | 736.5909 | 0.0028 | 1 | 2 | lateral line system development |
| GO:0071228 | 0.0028 | 736.5909 | 0.0028 | 1 | 2 | cellular response to tumor cell |
| GO:0072272 | 0.0028 | 736.5909 | 0.0028 | 1 | 2 | proximal/distal pattern formation involved in metanephric nephron development |
| GO:0110023 | 0.0028 | 736.5909 | 0.0028 | 1 | 2 | negative regulation of cardiac muscle myoblast proliferation |
| GO:1901003 | 0.0028 | 736.5909 | 0.0028 | 1 | 2 | negative regulation of fermentation |
| GO:0048731 | 0.0029 | 3.4751 | 6.2712 | 13 | 4425 | system development |
| GO:0021872 | 0.0031 | 26.9825 | 0.0836 | 2 | 59 | forebrain generation of neurons |
| GO:0042733 | 0.0036 | 25.2069 | 0.0893 | 2 | 63 | embryonic digit morphogenesis |
| GO:0006355 | 0.0041 | 3.4056 | 4.8866 | 11 | 3448 | regulation of transcription, DNA-templated |
| GO:0010660 | 0.0041 | 23.29 | 0.0964 | 2 | 68 | regulation of muscle cell apoptotic process |
| GO:0048663 | 0.0041 | 23.29 | 0.0964 | 2 | 68 | neuron fate commitment |
| GO:0003358 | 0.0042 | 368.2727 | 0.0043 | 1 | 3 | noradrenergic neuron development |
| GO:0030538 | 0.0042 | 368.2727 | 0.0043 | 1 | 3 | embryonic genitalia morphogenesis |
| GO:0035986 | 0.0042 | 368.2727 | 0.0043 | 1 | 3 | senescence-associated heterochromatin focus assembly |
| GO:0036023 | 0.0042 | 368.2727 | 0.0043 | 1 | 3 | embryonic skeletal limb joint morphogenesis |
| GO:0044336 | 0.0042 | 368.2727 | 0.0043 | 1 | 3 | canonical Wnt signaling pathway involved in negative regulation of apoptotic process |
| GO:0048619 | 0.0042 | 368.2727 | 0.0043 | 1 | 3 | embryonic hindgut morphogenesis |
| GO:0140076 | 0.0042 | 368.2727 | 0.0043 | 1 | 3 | negative regulation of lipoprotein transport |
| GO:2000111 | 0.0042 | 368.2727 | 0.0043 | 1 | 3 | positive regulation of macrophage apoptotic process |
| GO:2001141 | 0.0044 | 3.3719 | 4.9248 | 11 | 3475 | regulation of RNA biosynthetic process |
| GO:0031326 | 0.0048 | 7.6056 | 0.7433 | 4 | 790 | regulation of cellular biosynthetic process |
| GO:0035195 | 0.0056 | 9.3829 | 0.3656 | 3 | 258 | gene silencing by miRNA |
| GO:0007198 | 0.0057 | 245.5 | 0.0057 | 1 | 4 | adenylate cyclase-inhibiting serotonin receptor signaling pathway |
| GO:0072086 | 0.0057 | 245.5 | 0.0057 | 1 | 4 | specification of loop of Henle identity |
| GO:1901166 | 0.0057 | 245.5 | 0.0057 | 1 | 4 | neural crest cell migration involved in autonomic nervous system development |
| GO:0048562 | 0.0059 | 9.214 | 0.3742 | 3 | 276 | embryonic organ morphogenesis |
| GO:0006417 | 0.006 | 6.313 | 0.7469 | 4 | 527 | regulation of translation |
| GO:0016441 | 0.006 | 9.1282 | 0.3756 | 3 | 265 | posttranscriptional gene silencing |
| GO:0001656 | 0.0062 | 18.7271 | 0.119 | 2 | 84 | metanephros development |
| GO:1901576 | 0.0066 | 3.1178 | 8.6464 | 15 | 6101 | organic substance biosynthetic process |
| GO:0043009 | 0.0068 | 6.0727 | 0.7752 | 4 | 547 | chordate embryonic development |
| GO:0002568 | 0.0071 | 184.1136 | 0.0071 | 1 | 5 | somatic diversification of T cell receptor genes |
| GO:0015870 | 0.0071 | 184.1136 | 0.0071 | 1 | 5 | acetylcholine transport |
| GO:0016199 | 0.0071 | 184.1136 | 0.0071 | 1 | 5 | axon midline choice point recognition |
| GO:0033153 | 0.0071 | 184.1136 | 0.0071 | 1 | 5 | T cell receptor V(D)J recombination |
| GO:0051172 | 0.0071 | 3.9564 | 2.4469 | 7 | 2043 | negative regulation of nitrogen compound metabolic process |
| GO:0035282 | 0.0074 | 17.054 | 0.1304 | 2 | 92 | segmentation |
| GO:0007568 | 0.0075 | 8.4095 | 0.4067 | 3 | 287 | aging |
| GO:0031047 | 0.0075 | 8.3795 | 0.4082 | 3 | 288 | gene silencing by RNA |
| GO:0031324 | 0.0076 | 3.9739 | 2.4897 | 7 | 2194 | negative regulation of cellular metabolic process |
| GO:0042472 | 0.0078 | 16.6812 | 0.1332 | 2 | 94 | inner ear morphogenesis |
| GO:0009953 | 0.0079 | 16.5008 | 0.1346 | 2 | 95 | dorsal/ventral pattern formation |
| GO:0003360 | 0.0085 | 147.2818 | 0.0085 | 1 | 6 | brainstem development |
| GO:0014062 | 0.0085 | 147.2818 | 0.0085 | 1 | 6 | regulation of serotonin secretion |
| GO:0033504 | 0.0099 | 122.7273 | 0.0099 | 1 | 7 | floor plate development |
| GOMFID | Pvalue | OddsRatio | ExpCount | Count | Size | Term |
| GO:0070475 | 0 | 514.6349 | 0.0061 | 2 | 9 | rRNA base methylation |
| GO:0000154 | 3e-04 | 105.7778 | 0.0244 | 2 | 36 | rRNA modification |
| GO:1901506 | 7e-04 | Inf | 7e-04 | 1 | 1 | regulation of acylglycerol transport |
| GO:1905884 | 7e-04 | Inf | 7e-04 | 1 | 1 | negative regulation of triglyceride transport |
| GO:0001510 | 8e-04 | 59.8444 | 0.042 | 2 | 62 | RNA methylation |
| GO:0003245 | 0.002 | 810.8 | 0.002 | 1 | 3 | cardiac muscle tissue growth involved in heart morphogenesis |
| GO:0010868 | 0.002 | 810.8 | 0.002 | 1 | 3 | negative regulation of triglyceride biosynthetic process |
| GO:0071072 | 0.0034 | 405.35 | 0.0034 | 1 | 5 | negative regulation of phospholipid biosynthetic process |
| GO:1904684 | 0.0054 | 231.5857 | 0.0054 | 1 | 8 | negative regulation of metalloendopeptidase activity |
| GO:1905205 | 0.0088 | 135.05 | 0.0088 | 1 | 13 | positive regulation of connective tissue replacement |
| GO:0010666 | 0.0095 | 124.6538 | 0.0095 | 1 | 14 | positive regulation of cardiac muscle cell apoptotic process |
| GOMFID | Pvalue | OddsRatio | ExpCount | Count | Size | Term |
| GO:0050911 | 4e-04 | 32.3111 | 0.16 | 3 | 371 | detection of chemical stimulus involved in sensory perception of smell |
| GO:0009593 | 7e-04 | 26.4681 | 0.1941 | 3 | 450 | detection of chemical stimulus |
| GO:0050906 | 7e-04 | 25.7565 | 0.1993 | 3 | 462 | detection of stimulus involved in sensory perception |
| GO:0007606 | 8e-04 | 25.4145 | 0.2019 | 3 | 468 | sensory perception of chemical stimulus |
| GO:0021891 | 0.0026 | 540.5667 | 0.0026 | 1 | 6 | olfactory bulb interneuron development |
| GO:0021930 | 0.0043 | 300.2407 | 0.0043 | 1 | 10 | cerebellar granule cell precursor proliferation |
| GO:0021534 | 0.0047 | 270.2 | 0.0047 | 1 | 11 | cell proliferation in hindbrain |
| GO:0015671 | 0.0065 | 192.9524 | 0.0065 | 1 | 15 | oxygen transport |
| GOMFID | Pvalue | OddsRatio | ExpCount | Count | Size | Term |
| GO:1904628 | 0 | 1351.4167 | 0.003 | 2 | 8 | cellular response to phorbol 13-acetate 12-myristate |
| GO:0050918 | 2e-04 | 146.9818 | 0.0211 | 2 | 57 | positive chemotaxis |
| GO:0002548 | 2e-04 | 134.6917 | 0.0229 | 2 | 62 | monocyte chemotaxis |
| GO:0050829 | 3e-04 | 109.1149 | 0.0281 | 2 | 76 | defense response to Gram-negative bacterium |
| GO:0050830 | 4e-04 | 97.2289 | 0.0314 | 2 | 85 | defense response to Gram-positive bacterium |
| GO:0060326 | 0.0037 | 30.9399 | 0.0961 | 2 | 260 | cell chemotaxis |
| GO:0050900 | 0.0088 | 19.578 | 0.1501 | 2 | 406 | leukocyte migration |
| GOMFID | Pvalue | OddsRatio | ExpCount | Count | Size | Term |
| GO:0050832 | 2e-04 | 124.9653 | 0.0216 | 2 | 39 | defense response to fungus |
| GO:0061844 | 3e-04 | 94.2915 | 0.0283 | 2 | 51 | antimicrobial humoral immune response mediated by antimicrobial peptide |
| GO:0007634 | 6e-04 | Inf | 6e-04 | 1 | 1 | optokinetic behavior |
| GO:0021560 | 0.0011 | 2027.375 | 0.0011 | 1 | 2 | abducens nerve development |
| GO:0021599 | 0.0011 | 2027.375 | 0.0011 | 1 | 2 | abducens nerve formation |
| GO:0035606 | 0.0011 | 2027.375 | 0.0011 | 1 | 2 | peptidyl-cysteine S-trans-nitrosylation |
| GO:0044657 | 0.0011 | 2027.375 | 0.0011 | 1 | 2 | pore formation in membrane of other organism during symbiotic interaction |
| GO:0052043 | 0.0011 | 2027.375 | 0.0011 | 1 | 2 | modification by symbiont of host cellular component |
| GO:0052185 | 0.0011 | 2027.375 | 0.0011 | 1 | 2 | modification of structure of other organism involved in symbiotic interaction |
| GO:0052332 | 0.0011 | 2027.375 | 0.0011 | 1 | 2 | modification by organism of membrane in other organism involved in symbiotic interaction |
| GO:0060876 | 0.0011 | 2027.375 | 0.0011 | 1 | 2 | semicircular canal formation |
| GO:0070488 | 0.0011 | 2027.375 | 0.0011 | 1 | 2 | neutrophil aggregation |
| GO:0048702 | 0.0033 | 405.375 | 0.0033 | 1 | 6 | embryonic neurocranium morphogenesis |
| GO:0051673 | 0.0033 | 405.375 | 0.0033 | 1 | 6 | membrane disruption in other organism |
| GO:0042473 | 0.005 | 253.3125 | 0.005 | 1 | 9 | outer ear morphogenesis |
| GO:0060872 | 0.005 | 253.3125 | 0.005 | 1 | 9 | semicircular canal development |
| GO:0070475 | 0.005 | 253.3125 | 0.005 | 1 | 9 | rRNA base methylation |
| GO:0097398 | 0.005 | 253.3125 | 0.005 | 1 | 9 | cellular response to interleukin-17 |
| GO:0030595 | 0.0051 | 23.2386 | 0.1104 | 2 | 199 | leukocyte chemotaxis |
| GO:0006959 | 0.0061 | 21.1693 | 0.1209 | 2 | 218 | humoral immune response |
| GO:0017014 | 0.0066 | 184.1932 | 0.0067 | 1 | 12 | protein nitrosylation |
| GO:0032119 | 0.0066 | 184.1932 | 0.0067 | 1 | 12 | sequestering of zinc ion |
| GO:0042742 | 0.0072 | 19.3511 | 0.132 | 2 | 238 | defense response to bacterium |
| GO:0002523 | 0.0077 | 155.8365 | 0.0078 | 1 | 14 | leukocyte migration involved in inflammatory response |
| GO:0051852 | 0.0077 | 155.8365 | 0.0078 | 1 | 14 | disruption by host of symbiont cells |
| GO:0030322 | 0.0088 | 135.0417 | 0.0089 | 1 | 16 | stabilization of membrane potential |
| GOMFID | Pvalue | OddsRatio | ExpCount | Count | Size | Term |
| GO:0002263 | 1e-04 | 31.588 | 0.2851 | 4 | 661 | cell activation involved in immune response |
| GO:0002275 | 6e-04 | 31.1647 | 0.1876 | 3 | 507 | myeloid cell activation involved in immune response |
| GO:0050868 | 7e-04 | 67.1917 | 0.0423 | 2 | 98 | negative regulation of T cell activation |
| GO:0043312 | 8e-04 | 25.4709 | 0.2014 | 3 | 467 | neutrophil degranulation |
| GO:0042119 | 8e-04 | 24.8637 | 0.2062 | 3 | 478 | neutrophil activation |
| GO:0002444 | 0.0011 | 22.6471 | 0.2256 | 3 | 523 | myeloid leukocyte mediated immunity |
| GO:0071626 | 0.0013 | 1351.6667 | 0.0013 | 1 | 3 | mastication |
| GO:0098583 | 0.0013 | 1351.6667 | 0.0013 | 1 | 3 | learned vocalization behavior |
| GO:1905747 | 0.0013 | 1351.6667 | 0.0013 | 1 | 3 | negative regulation of saliva secretion |
| GO:1905748 | 0.0013 | 1351.6667 | 0.0013 | 1 | 3 | hard palate morphogenesis |
| GO:0002695 | 0.0017 | 43.7415 | 0.0643 | 2 | 149 | negative regulation of leukocyte activation |
| GO:2000552 | 0.0017 | 901.0556 | 0.0017 | 1 | 4 | negative regulation of T-helper 2 cell cytokine production |
| GO:0022408 | 0.0018 | 43.149 | 0.0651 | 2 | 151 | negative regulation of cell-cell adhesion |
| GO:0045321 | 0.002 | 23.3071 | 0.3032 | 3 | 975 | leukocyte activation |
| GO:0046903 | 0.002 | 13.1151 | 0.6474 | 4 | 1501 | secretion |
| GO:0007356 | 0.0022 | 675.75 | 0.0022 | 1 | 5 | thorax and anterior abdomen determination |
| GO:0021650 | 0.0022 | 675.75 | 0.0022 | 1 | 5 | vestibulocochlear nerve formation |
| GO:1901078 | 0.0022 | 675.75 | 0.0022 | 1 | 5 | negative regulation of relaxation of muscle |
| GO:0045055 | 0.0025 | 16.483 | 0.3058 | 3 | 709 | regulated exocytosis |
| GO:0045343 | 0.003 | 450.4444 | 0.003 | 1 | 7 | regulation of MHC class I biosynthetic process |
| GO:0006959 | 0.0036 | 29.6407 | 0.094 | 2 | 218 | humoral immune response |
| GO:0021562 | 0.0039 | 337.7917 | 0.0039 | 1 | 9 | vestibulocochlear nerve development |
| GO:0042742 | 0.0043 | 27.0949 | 0.1027 | 2 | 238 | defense response to bacterium |
| GO:0030432 | 0.0043 | 300.2407 | 0.0043 | 1 | 10 | peristalsis |
| GO:0021559 | 0.0047 | 270.2 | 0.0047 | 1 | 11 | trigeminal nerve development |
| GO:0002281 | 0.0052 | 245.6212 | 0.0052 | 1 | 12 | macrophage activation involved in immune response |
| GO:0016998 | 0.0052 | 245.6212 | 0.0052 | 1 | 12 | cell wall macromolecule catabolic process |
| GO:0031223 | 0.0052 | 245.6212 | 0.0052 | 1 | 12 | auditory behavior |
| GO:0035112 | 0.0056 | 225.1389 | 0.0056 | 1 | 13 | genitalia morphogenesis |
| GO:0071360 | 0.006 | 207.8077 | 0.006 | 1 | 14 | cellular response to exogenous dsRNA |
| GO:0071554 | 0.006 | 207.8077 | 0.006 | 1 | 14 | cell wall organization or biogenesis |
| GO:0008595 | 0.0065 | 192.9524 | 0.0065 | 1 | 15 | anterior/posterior axis specification, embryo |
| GO:0035458 | 0.0065 | 192.9524 | 0.0065 | 1 | 15 | cellular response to interferon-beta |
| GO:0009605 | 0.0066 | 9.1817 | 0.889 | 4 | 2061 | response to external stimulus |
| GO:0002710 | 0.0077 | 158.8725 | 0.0078 | 1 | 18 | negative regulation of T cell mediated immunity |
| GO:0007350 | 0.0077 | 158.8725 | 0.0078 | 1 | 18 | blastoderm segmentation |
| GO:0097094 | 0.0077 | 158.8725 | 0.0078 | 1 | 18 | craniofacial suture morphogenesis |
| GO:1903037 | 0.0079 | 19.6272 | 0.1406 | 2 | 326 | regulation of leukocyte cell-cell adhesion |
| GO:0035743 | 0.0082 | 150.037 | 0.0082 | 1 | 19 | CD4-positive, alpha-beta T cell cytokine production |
| GO:0033141 | 0.009 | 135.0167 | 0.0091 | 1 | 21 | positive regulation of peptidyl-serine phosphorylation of STAT protein |
| GO:0002724 | 0.0095 | 128.5794 | 0.0095 | 1 | 22 | regulation of T cell cytokine production |
| GO:0090103 | 0.0099 | 122.7273 | 0.0099 | 1 | 23 | cochlea morphogenesis |
| GOMFID | Pvalue | OddsRatio | ExpCount | Count | Size | Term |
| GO:0002263 | 2e-04 | 23.6895 | 0.3258 | 4 | 661 | cell activation involved in immune response |
| GO:0002275 | 0.001 | 23.372 | 0.2188 | 3 | 507 | myeloid cell activation involved in immune response |
| GO:0050868 | 0.001 | 55.9896 | 0.0483 | 2 | 98 | negative regulation of T cell activation |
| GO:0043312 | 0.0012 | 20.3754 | 0.2302 | 3 | 467 | neutrophil degranulation |
| GO:0042119 | 0.0013 | 19.8897 | 0.2356 | 3 | 478 | neutrophil activation |
| GO:0071626 | 0.0015 | 1158.5 | 0.0015 | 1 | 3 | mastication |
| GO:0098583 | 0.0015 | 1158.5 | 0.0015 | 1 | 3 | learned vocalization behavior |
| GO:1905747 | 0.0015 | 1158.5 | 0.0015 | 1 | 3 | negative regulation of saliva secretion |
| GO:1905748 | 0.0015 | 1158.5 | 0.0015 | 1 | 3 | hard palate morphogenesis |
| GO:0002444 | 0.0017 | 18.1165 | 0.2578 | 3 | 523 | myeloid leukocyte mediated immunity |
| GO:2000552 | 0.002 | 772.2857 | 0.002 | 1 | 4 | negative regulation of T-helper 2 cell cytokine production |
| GO:0002695 | 0.0023 | 36.449 | 0.0734 | 2 | 149 | negative regulation of leukocyte activation |
| GO:0022408 | 0.0023 | 35.9553 | 0.0744 | 2 | 151 | negative regulation of cell-cell adhesion |
| GO:0007356 | 0.0025 | 579.1786 | 0.0025 | 1 | 5 | thorax and anterior abdomen determination |
| GO:0021650 | 0.0025 | 579.1786 | 0.0025 | 1 | 5 | vestibulocochlear nerve formation |
| GO:1901078 | 0.0025 | 579.1786 | 0.0025 | 1 | 5 | negative regulation of relaxation of muscle |
| GO:0060348 | 0.0032 | 30.2147 | 0.0882 | 2 | 179 | bone development |
| GO:0045343 | 0.0034 | 386.0714 | 0.0035 | 1 | 7 | regulation of MHC class I biosynthetic process |
| GO:0046903 | 0.0038 | 9.8357 | 0.7399 | 4 | 1501 | secretion |
| GO:0045321 | 0.0039 | 15.537 | 0.3638 | 3 | 975 | leukocyte activation |
| GO:0045055 | 0.0039 | 13.1856 | 0.3495 | 3 | 709 | regulated exocytosis |
| GO:0050896 | 0.0043 | Inf | 4.0446 | 8 | 8205 | response to stimulus |
| GO:0048705 | 0.0044 | 25.7874 | 0.103 | 2 | 209 | skeletal system morphogenesis |
| GO:0021562 | 0.0044 | 289.5179 | 0.0044 | 1 | 9 | vestibulocochlear nerve development |
| GO:0006959 | 0.0048 | 24.6991 | 0.1075 | 2 | 218 | humoral immune response |
| GO:0030432 | 0.0049 | 257.3333 | 0.0049 | 1 | 10 | peristalsis |
| GO:0021559 | 0.0054 | 231.5857 | 0.0054 | 1 | 11 | trigeminal nerve development |
| GO:0042742 | 0.0057 | 22.5777 | 0.1173 | 2 | 238 | defense response to bacterium |
| GO:0002281 | 0.0059 | 210.5195 | 0.0059 | 1 | 12 | macrophage activation involved in immune response |
| GO:0016998 | 0.0059 | 210.5195 | 0.0059 | 1 | 12 | cell wall macromolecule catabolic process |
| GO:0031223 | 0.0059 | 210.5195 | 0.0059 | 1 | 12 | auditory behavior |
| GO:0035112 | 0.0064 | 192.9643 | 0.0064 | 1 | 13 | genitalia morphogenesis |
| GO:0071360 | 0.0069 | 178.1099 | 0.0069 | 1 | 14 | cellular response to exogenous dsRNA |
| GO:0071554 | 0.0069 | 178.1099 | 0.0069 | 1 | 14 | cell wall organization or biogenesis |
| GO:0008595 | 0.0074 | 165.3776 | 0.0074 | 1 | 15 | anterior/posterior axis specification, embryo |
| GO:0035458 | 0.0074 | 165.3776 | 0.0074 | 1 | 15 | cellular response to interferon-beta |
| GO:0002710 | 0.0088 | 136.1681 | 0.0089 | 1 | 18 | negative regulation of T cell mediated immunity |
| GO:0007350 | 0.0088 | 136.1681 | 0.0089 | 1 | 18 | blastoderm segmentation |
| GO:0097094 | 0.0088 | 136.1681 | 0.0089 | 1 | 18 | craniofacial suture morphogenesis |
| GO:0035743 | 0.0093 | 128.5952 | 0.0094 | 1 | 19 | CD4-positive, alpha-beta T cell cytokine production |
| GOMFID | Pvalue | OddsRatio | ExpCount | Count | Size | Term |
| GO:0006614 | 4e-04 | 96.0655 | 0.0318 | 2 | 86 | SRP-dependent cotranslational protein targeting to membrane |
| GO:0072599 | 5e-04 | 83.1237 | 0.0366 | 2 | 99 | establishment of protein localization to endoplasmic reticulum |
| GO:0000184 | 7e-04 | 72.5766 | 0.0418 | 2 | 113 | nuclear-transcribed mRNA catabolic process, nonsense-mediated decay |
| GO:0006612 | 0.0013 | 52.8651 | 0.0569 | 2 | 154 | protein targeting to membrane |
| GO:0019083 | 0.0016 | 47.497 | 0.0632 | 2 | 171 | viral transcription |
| GO:0006413 | 0.0017 | 46.3873 | 0.0647 | 2 | 175 | translational initiation |
| GO:0043043 | 0.0021 | 19.3041 | 0.2965 | 3 | 802 | peptide biosynthetic process |
| GO:0031424 | 0.0028 | 35.7121 | 0.0836 | 2 | 226 | keratinization |
| GO:0006364 | 0.0033 | 32.8807 | 0.0906 | 2 | 245 | rRNA processing |
| GO:0043603 | 0.0053 | 13.7885 | 0.4067 | 3 | 1100 | cellular amide metabolic process |
| GO:0006402 | 0.0058 | 24.4585 | 0.1209 | 2 | 327 | mRNA catabolic process |
| GO:0009913 | 0.0065 | 22.8761 | 0.129 | 2 | 349 | epidermal cell differentiation |
| GO:0043588 | 0.0088 | 19.4791 | 0.1508 | 2 | 408 | skin development |
| GOMFID | Pvalue | OddsRatio | ExpCount | Count | Size | Term |
| GO:0002517 | 0.003 | 491.3333 | 0.003 | 1 | 12 | T cell tolerance induction |
| GO:0030511 | 0.0059 | 234.8116 | 0.0059 | 1 | 24 | positive regulation of transforming growth factor beta receptor signaling pathway |
| GO:0033198 | 0.0074 | 186.1609 | 0.0074 | 1 | 30 | response to ATP |
| GO:0048536 | 0.0088 | 154.1905 | 0.0089 | 1 | 36 | spleen development |
| GO:0031670 | 0.0096 | 141.9912 | 0.0096 | 1 | 39 | cellular response to nutrient |
| GOMFID | Pvalue | OddsRatio | ExpCount | Count | Size | Term |
| GO:0060044 | 0.0033 | 476.7353 | 0.0033 | 1 | 18 | negative regulation of cardiac muscle cell proliferation |
| GO:0071800 | 0.0039 | 405.15 | 0.0039 | 1 | 21 | podosome assembly |
| GO:0061117 | 0.0042 | 368.2727 | 0.0043 | 1 | 23 | negative regulation of heart growth |
| GO:0055026 | 0.0059 | 261.2097 | 0.0059 | 1 | 32 | negative regulation of cardiac muscle tissue development |
| GO:0048635 | 0.0092 | 165.0714 | 0.0092 | 1 | 50 | negative regulation of muscle organ development |
| GO:1901862 | 0.0092 | 165.0714 | 0.0092 | 1 | 50 | negative regulation of muscle tissue development |
| GOMFID | Pvalue | OddsRatio | ExpCount | Count | Size | Term |
| GO:0070488 | 0 | Inf | 9e-04 | 2 | 2 | neutrophil aggregation |
| GO:0032119 | 0 | 648.48 | 0.0052 | 2 | 12 | sequestering of zinc ion |
| GO:0002523 | 0 | 540.3333 | 0.006 | 2 | 14 | leukocyte migration involved in inflammatory response |
| GO:0055069 | 1e-04 | 249.1692 | 0.0121 | 2 | 28 | zinc ion homeostasis |
| GO:0050832 | 1e-04 | 174.973 | 0.0168 | 2 | 39 | defense response to fungus |
| GO:2001244 | 2e-04 | 124.3846 | 0.0233 | 2 | 54 | positive regulation of intrinsic apoptotic signaling pathway |
| GO:0032602 | 4e-04 | 87.2865 | 0.0328 | 2 | 76 | chemokine production |
| GO:0006919 | 5e-04 | 83.8701 | 0.0341 | 2 | 79 | activation of cysteine-type endopeptidase activity involved in apoptotic process |
| GO:0030593 | 6e-04 | 75.0512 | 0.038 | 2 | 88 | neutrophil chemotaxis |
| GO:0019730 | 7e-04 | 70.1304 | 0.0405 | 2 | 94 | antimicrobial humoral response |
| GO:0046916 | 7e-04 | 70.1304 | 0.0405 | 2 | 94 | cellular transition metal ion homeostasis |
| GO:0043312 | 8e-04 | 25.4709 | 0.2014 | 3 | 467 | neutrophil degranulation |
| GO:0042119 | 8e-04 | 24.8637 | 0.2062 | 3 | 478 | neutrophil activation |
| GO:0035606 | 9e-04 | 2703.5 | 9e-04 | 1 | 2 | peptidyl-cysteine S-trans-nitrosylation |
| GO:0050729 | 9e-04 | 59.6815 | 0.0474 | 2 | 110 | positive regulation of inflammatory response |
| GO:0002275 | 0.001 | 22.8285 | 0.2239 | 3 | 519 | myeloid cell activation involved in immune response |
| GO:0002444 | 0.0011 | 22.6471 | 0.2256 | 3 | 523 | myeloid leukocyte mediated immunity |
| GO:0097530 | 0.0011 | 53.6733 | 0.0526 | 2 | 122 | granulocyte migration |
| GO:2001056 | 0.0012 | 52.3545 | 0.0539 | 2 | 125 | positive regulation of cysteine-type endopeptidase activity |
| GO:0002224 | 0.0012 | 51.5104 | 0.0548 | 2 | 127 | toll-like receptor signaling pathway |
| GO:0051092 | 0.0013 | 49.9008 | 0.0565 | 2 | 131 | positive regulation of NF-kappaB transcription factor activity |
| GO:0043065 | 0.0015 | 20.1188 | 0.2528 | 3 | 586 | positive regulation of apoptotic process |
| GO:0030307 | 0.0017 | 43.4432 | 0.0647 | 2 | 150 | positive regulation of cell growth |
| GO:0010942 | 0.0019 | 18.4098 | 0.2752 | 3 | 638 | positive regulation of cell death |
| GO:0002263 | 0.0021 | 17.7401 | 0.2851 | 3 | 661 | cell activation involved in immune response |
| GO:0010952 | 0.0021 | 38.9261 | 0.072 | 2 | 167 | positive regulation of peptidase activity |
| GO:0045055 | 0.0025 | 16.483 | 0.3058 | 3 | 709 | regulated exocytosis |
| GO:0071947 | 0.0026 | 540.5667 | 0.0026 | 1 | 6 | protein deubiquitination involved in ubiquitin-dependent protein catabolic process |
| GO:0030595 | 0.003 | 32.5381 | 0.0858 | 2 | 199 | leukocyte chemotaxis |
| GO:0043281 | 0.003 | 32.5381 | 0.0858 | 2 | 199 | regulation of cysteine-type endopeptidase activity involved in apoptotic process |
| GO:0018119 | 0.0037 | 360.2667 | 0.0037 | 1 | 10 | peptidyl-cysteine S-nitrosylation |
| GO:0042742 | 0.0043 | 27.0949 | 0.1027 | 2 | 238 | defense response to bacterium |
| GO:0002758 | 0.0055 | 23.8119 | 0.1165 | 2 | 270 | innate immune response-activating signal transduction |
| GO:0051235 | 0.0063 | 22.1306 | 0.1251 | 2 | 290 | maintenance of location |
| GO:0060397 | 0.0065 | 192.9524 | 0.0065 | 1 | 15 | JAK-STAT cascade involved in growth hormone signaling pathway |
| GO:0045089 | 0.0081 | 19.3228 | 0.1428 | 2 | 331 | positive regulation of innate immune response |
| GO:0002544 | 0.009 | 135.0167 | 0.0091 | 1 | 21 | chronic inflammatory response |
| GO:0007159 | 0.0094 | 17.9299 | 0.1536 | 2 | 356 | leukocyte cell-cell adhesion |
| GO:0045321 | 0.0094 | 10.1033 | 0.4848 | 3 | 1124 | leukocyte activation |
| GO:0071378 | 0.0099 | 122.7273 | 0.0099 | 1 | 23 | cellular response to growth hormone stimulus |
| GO:2001233 | 0.0099 | 17.3775 | 0.1583 | 2 | 367 | regulation of apoptotic signaling pathway |
| GO:0051090 | 0.01 | 17.329 | 0.1587 | 2 | 368 | regulation of DNA binding transcription factor activity |
| GOMFID | Pvalue | OddsRatio | ExpCount | Count | Size | Term |
| GO:0070475 | 0 | 661.7551 | 0.005 | 2 | 9 | rRNA base methylation |
| GO:0030593 | 0 | 94.9118 | 0.0488 | 3 | 88 | neutrophil chemotaxis |
| GO:0097530 | 0 | 67.6513 | 0.0677 | 3 | 122 | granulocyte migration |
| GO:0000154 | 2e-04 | 136.0168 | 0.02 | 2 | 36 | rRNA modification |
| GO:0060326 | 3e-04 | 31.0564 | 0.1442 | 3 | 260 | cell chemotaxis |
| GO:0048247 | 4e-04 | 82.4694 | 0.0322 | 2 | 58 | lymphocyte chemotaxis |
| GO:0001510 | 5e-04 | 76.9524 | 0.0344 | 2 | 62 | RNA methylation |
| GO:0002548 | 5e-04 | 76.9524 | 0.0344 | 2 | 62 | monocyte chemotaxis |
| GO:0070098 | 8e-04 | 59.1282 | 0.0444 | 2 | 80 | chemokine-mediated signaling pathway |
| GO:0071347 | 0.0011 | 52.3766 | 0.0499 | 2 | 90 | cellular response to interleukin-1 |
| GO:0035606 | 0.0011 | 2027.375 | 0.0011 | 1 | 2 | peptidyl-cysteine S-trans-nitrosylation |
| GO:0070488 | 0.0011 | 2027.375 | 0.0011 | 1 | 2 | neutrophil aggregation |
| GO:0055076 | 0.0019 | 38.6579 | 0.0671 | 2 | 121 | transition metal ion homeostasis |
| GO:0035821 | 0.0026 | 33.2961 | 0.0776 | 2 | 140 | modification of morphology or physiology of other organism |
| GO:0071346 | 0.0026 | 33.2961 | 0.0776 | 2 | 140 | cellular response to interferon-gamma |
| GO:0042330 | 0.003 | 14.0341 | 0.3111 | 3 | 561 | taxis |
| GO:2000503 | 0.0033 | 405.375 | 0.0033 | 1 | 6 | positive regulation of natural killer cell chemotaxis |
| GO:0070374 | 0.0048 | 23.8512 | 0.1076 | 2 | 194 | positive regulation of ERK1 and ERK2 cascade |
| GO:0009636 | 0.0057 | 21.8879 | 0.117 | 2 | 211 | response to toxic substance |
| GO:0051345 | 0.0057 | 10.971 | 0.3937 | 3 | 710 | positive regulation of hydrolase activity |
| GO:0017014 | 0.0066 | 184.1932 | 0.0067 | 1 | 12 | protein nitrosylation |
| GO:0032119 | 0.0066 | 184.1932 | 0.0067 | 1 | 12 | sequestering of zinc ion |
| GO:0043922 | 0.0066 | 184.1932 | 0.0067 | 1 | 12 | negative regulation by host of viral transcription |
| GO:0002523 | 0.0077 | 155.8365 | 0.0078 | 1 | 14 | leukocyte migration involved in inflammatory response |
| GO:0038092 | 0.0077 | 155.8365 | 0.0078 | 1 | 14 | nodal signaling pathway |
| GO:0045087 | 0.0091 | 9.2126 | 0.4647 | 3 | 838 | innate immune response |
| GO:0032103 | 0.0093 | 16.9421 | 0.1503 | 2 | 271 | positive regulation of response to external stimulus |
| GO:0071356 | 0.0093 | 16.9421 | 0.1503 | 2 | 271 | cellular response to tumor necrosis factor |
| GO:0016072 | 0.0098 | 16.4446 | 0.1547 | 2 | 279 | rRNA metabolic process |
| GOMFID | Pvalue | OddsRatio | ExpCount | Count | Size | Term |
| GO:0008201 | 5e-04 | 23.8496 | 0.1561 | 3 | 158 | heparin binding |
| GO:0004252 | 6e-04 | 21.2202 | 0.1749 | 3 | 177 | serine-type endopeptidase activity |
| GO:0017171 | 0.001 | 17.888 | 0.2065 | 3 | 209 | serine hydrolase activity |
| GO:0008233 | 0.0024 | 8.6522 | 0.5969 | 4 | 604 | peptidase activity |
| GO:1903231 | 0.0053 | 21.055 | 0.1097 | 2 | 111 | mRNA binding involved in posttranscriptional gene silencing |
| GO:0004519 | 0.0061 | 19.4383 | 0.1186 | 2 | 120 | endonuclease activity |
| GO:0015643 | 0.0098 | 119.7407 | 0.0099 | 1 | 10 | toxic substance binding |
| GOMFID | Pvalue | OddsRatio | ExpCount | Count | Size | Term |
| GO:0008201 | 5e-04 | 23.8496 | 0.1561 | 3 | 158 | heparin binding |
| GO:0004252 | 6e-04 | 21.2202 | 0.1749 | 3 | 177 | serine-type endopeptidase activity |
| GO:0017171 | 0.001 | 17.888 | 0.2065 | 3 | 209 | serine hydrolase activity |
| GO:0004968 | 0.002 | 1078.2 | 0.002 | 1 | 2 | gonadotropin-releasing hormone receptor activity |
| GO:0008233 | 0.0024 | 8.6522 | 0.5969 | 4 | 604 | peptidase activity |
| GO:1903231 | 0.0053 | 21.055 | 0.1097 | 2 | 111 | mRNA binding involved in posttranscriptional gene silencing |
| GO:0015643 | 0.0098 | 119.7407 | 0.0099 | 1 | 10 | toxic substance binding |
| GOMFID | Pvalue | OddsRatio | ExpCount | Count | Size | Term |
| GO:0005216 | 0.0024 | 5.982 | 0.9482 | 5 | 404 | ion channel activity |
| GO:0017080 | 0.0027 | 28.8907 | 0.0775 | 2 | 33 | sodium channel regulator activity |
| GO:0005547 | 0.0029 | 27.9861 | 0.0798 | 2 | 34 | phosphatidylinositol-3,4,5-trisphosphate binding |
| GO:0022843 | 0.0034 | 10.902 | 0.3028 | 3 | 129 | voltage-gated cation channel activity |
| GO:0015267 | 0.0036 | 5.4359 | 1.0398 | 5 | 443 | channel activity |
| GO:0030366 | 0.0047 | 436.5135 | 0.0047 | 1 | 2 | molybdopterin synthase activity |
| GO:0005544 | 0.0048 | 21.3095 | 0.1033 | 2 | 44 | calcium-dependent phospholipid binding |
| GO:0004663 | 0.007 | 218.2432 | 0.007 | 1 | 3 | Rab geranylgeranyltransferase activity |
| GO:0005250 | 0.007 | 218.2432 | 0.007 | 1 | 3 | A-type (transient outward) potassium channel activity |
| GO:0043120 | 0.007 | 218.2432 | 0.007 | 1 | 3 | tumor necrosis factor binding |
| GO:0022832 | 0.0096 | 7.3978 | 0.4413 | 3 | 188 | voltage-gated channel activity |
| GOMFID | Pvalue | OddsRatio | ExpCount | Count | Size | Term |
| GO:0017080 | 0.0014 | 41.631 | 0.055 | 2 | 33 | sodium channel regulator activity |
| GO:0005547 | 0.0015 | 40.3275 | 0.0567 | 2 | 34 | phosphatidylinositol-3,4,5-trisphosphate binding |
| GO:0005544 | 0.0024 | 30.7067 | 0.0734 | 2 | 44 | calcium-dependent phospholipid binding |
| GO:0005216 | 0.0043 | 6.8535 | 0.6737 | 4 | 404 | ion channel activity |
| GO:0004663 | 0.005 | 310.7885 | 0.005 | 1 | 3 | Rab geranylgeranyltransferase activity |
| GO:0005250 | 0.005 | 310.7885 | 0.005 | 1 | 3 | A-type (transient outward) potassium channel activity |
| GO:0015267 | 0.0059 | 6.2292 | 0.7388 | 4 | 443 | channel activity |
| GO:0046923 | 0.0083 | 155.375 | 0.0083 | 1 | 5 | ER retention sequence binding |
| GO:0008318 | 0.01 | 124.2923 | 0.01 | 1 | 6 | protein prenyltransferase activity |
| GOMFID | Pvalue | OddsRatio | ExpCount | Count | Size | Term |
| GO:0061750 | 7e-04 | Inf | 7e-04 | 1 | 1 | acid sphingomyelin phosphodiesterase activity |
| GO:0005277 | 0.0022 | 735.2727 | 0.0022 | 1 | 3 | acetylcholine transmembrane transporter activity |
| GO:0038036 | 0.0059 | 210.013 | 0.0059 | 1 | 8 | sphingosine-1-phosphate receptor activity |
| GO:0051378 | 0.0074 | 163.3232 | 0.0074 | 1 | 10 | serotonin binding |
| GOMFID | Pvalue | OddsRatio | ExpCount | Count | Size | Term |
| GO:0051378 | 1e-04 | 237.6912 | 0.0117 | 2 | 10 | serotonin binding |
| GO:0043565 | 1e-04 | 8.9547 | 1.1689 | 7 | 996 | sequence-specific DNA binding |
| GO:0004861 | 1e-04 | 190.1294 | 0.0141 | 2 | 12 | cyclin-dependent protein serine/threonine kinase inhibitor activity |
| GO:0001227 | 1e-04 | 19.7904 | 0.257 | 4 | 219 | transcriptional repressor activity, RNA polymerase II transcription regulatory region sequence-specific binding |
| GO:0004993 | 3e-04 | 100.0124 | 0.0246 | 2 | 21 | G-protein coupled serotonin receptor activity |
| GO:0061750 | 0.0012 | Inf | 0.0012 | 1 | 1 | acid sphingomyelin phosphodiesterase activity |
| GO:0003700 | 0.0018 | 5.8904 | 1.386 | 6 | 1181 | DNA binding transcription factor activity |
| GO:0008013 | 0.0034 | 26.3056 | 0.0868 | 2 | 74 | beta-catenin binding |
| GO:0005277 | 0.0035 | 449.1389 | 0.0035 | 1 | 3 | acetylcholine transmembrane transporter activity |
| GO:0090722 | 0.0047 | 299.4074 | 0.0047 | 1 | 4 | receptor-receptor interaction |
| GO:0030594 | 0.005 | 21.2584 | 0.1068 | 2 | 91 | neurotransmitter receptor activity |
| GO:0004860 | 0.0052 | 20.7886 | 0.1091 | 2 | 93 | protein kinase inhibitor activity |
| GO:0030284 | 0.0059 | 224.5417 | 0.0059 | 1 | 5 | estrogen receptor activity |
| GO:0004857 | 0.0093 | 7.8765 | 0.4448 | 3 | 379 | enzyme inhibitor activity |
| GO:0038036 | 0.0094 | 128.2857 | 0.0094 | 1 | 8 | sphingosine-1-phosphate receptor activity |
| NA. |
| n/a |
| GOMFID | Pvalue | OddsRatio | ExpCount | Count | Size | Term |
| GO:0035757 | 0.0011 | Inf | 0.0011 | 1 | 1 | chemokine (C-C motif) ligand 19 binding |
| GO:0035758 | 0.0011 | Inf | 0.0011 | 1 | 1 | chemokine (C-C motif) ligand 21 binding |
| GO:0038117 | 0.0011 | Inf | 0.0011 | 1 | 1 | C-C motif chemokine 19 receptor activity |
| GO:0038121 | 0.0011 | Inf | 0.0011 | 1 | 1 | C-C motif chemokine 21 receptor activity |
| GO:0038100 | 0.0022 | 951.2353 | 0.0022 | 1 | 2 | nodal binding |
| GO:0070405 | 0.0024 | 31.4609 | 0.0734 | 2 | 66 | ammonium ion binding |
| GO:0005111 | 0.0033 | 475.5882 | 0.0033 | 1 | 3 | type 2 fibroblast growth factor receptor binding |
| GO:0005277 | 0.0033 | 475.5882 | 0.0033 | 1 | 3 | acetylcholine transmembrane transporter activity |
| GO:0005105 | 0.0044 | 317.0392 | 0.0044 | 1 | 4 | type 1 fibroblast growth factor receptor binding |
| GO:0090722 | 0.0044 | 317.0392 | 0.0044 | 1 | 4 | receptor-receptor interaction |
| GOMFID | Pvalue | OddsRatio | ExpCount | Count | Size | Term |
| GO:0032394 | 0 | Inf | 6e-04 | 2 | 2 | MHC class Ib receptor activity |
| GO:0042288 | 0 | 673.7083 | 0.0056 | 2 | 18 | MHC class I protein binding |
| GO:0005133 | 3e-04 | Inf | 3e-04 | 1 | 1 | interferon-gamma receptor binding |
| GO:0004522 | 0.0012 | 1348.5 | 0.0012 | 1 | 4 | ribonuclease A activity |
| GO:0030246 | 0.0025 | 41.155 | 0.0803 | 2 | 260 | carbohydrate binding |
| GO:0099600 | 0.0038 | 18.4159 | 0.3774 | 3 | 1222 | transmembrane receptor activity |
| GO:0038023 | 0.0044 | 17.4965 | 0.3956 | 3 | 1281 | signaling receptor activity |
| GO:0005102 | 0.0062 | 15.2778 | 0.4478 | 3 | 1450 | receptor binding |
| GO:0004993 | 0.0065 | 202.0625 | 0.0065 | 1 | 21 | G-protein coupled serotonin receptor activity |
| GO:0016894 | 0.0068 | 192.4286 | 0.0068 | 1 | 22 | endonuclease activity, active with either ribo- or deoxyribonucleic acids and producing 3'-phosphomonoesters |
| GO:0060089 | 0.0074 | 14.3366 | 0.4744 | 3 | 1536 | molecular transducer activity |
| GOMFID | Pvalue | OddsRatio | ExpCount | Count | Size | Term |
| GO:0008173 | 5e-04 | 73.2955 | 0.0352 | 2 | 57 | RNA methyltransferase activity |
| GO:0008757 | 0.0036 | 27.4555 | 0.0914 | 2 | 148 | S-adenosylmethionine-dependent methyltransferase activity |
| GO:0046703 | 0.0055 | 224.6111 | 0.0056 | 1 | 9 | natural killer cell lectin-like receptor binding |
| GO:0016741 | 0.0074 | 18.7406 | 0.1328 | 2 | 215 | transferase activity, transferring one-carbon groups |
| GOMFID | Pvalue | OddsRatio | ExpCount | Count | Size | Term |
| GO:0004984 | 2e-04 | 42.9783 | 0.1375 | 3 | 371 | olfactory receptor activity |
| GO:0004930 | 0.002 | 19.7222 | 0.2905 | 3 | 784 | G-protein coupled receptor activity |
| GO:0005344 | 0.0052 | 248.7846 | 0.0052 | 1 | 14 | oxygen carrier activity |
| GO:0099600 | 0.0072 | 12.2765 | 0.4529 | 3 | 1222 | transmembrane receptor activity |
| GO:0038023 | 0.0082 | 11.6635 | 0.4747 | 3 | 1281 | signaling receptor activity |
| GOMFID | Pvalue | OddsRatio | ExpCount | Count | Size | Term |
| GO:0042056 | 0 | 299.2037 | 0.0107 | 2 | 29 | chemoattractant activity |
| GOMFID | Pvalue | OddsRatio | ExpCount | Count | Size | Term |
| GO:0035662 | 0.0015 | 1155.7143 | 0.0015 | 1 | 3 | Toll-like receptor 4 binding |
| GO:0050544 | 0.0025 | 577.7857 | 0.0025 | 1 | 5 | arachidonic acid binding |
| GO:0036041 | 0.0054 | 231.0286 | 0.0054 | 1 | 11 | long-chain fatty acid binding |
| GO:0050786 | 0.0054 | 231.0286 | 0.0054 | 1 | 11 | RAGE receptor binding |
| GO:0022841 | 0.0079 | 153.9714 | 0.0079 | 1 | 16 | potassium ion leak channel activity |
| GO:0022842 | 0.0094 | 128.2857 | 0.0094 | 1 | 19 | narrow pore channel activity |
| GOMFID | Pvalue | OddsRatio | ExpCount | Count | Size | Term |
| GO:0008811 | 4e-04 | Inf | 4e-04 | 1 | 1 | chloramphenicol O-acetyltransferase activity |
| GO:0003796 | 0.0048 | 269.5333 | 0.0048 | 1 | 13 | lysozyme activity |
| GO:0005132 | 0.0063 | 202.1 | 0.0063 | 1 | 17 | type I interferon receptor binding |
| GOMFID | Pvalue | OddsRatio | ExpCount | Count | Size | Term |
| GO:0008811 | 4e-04 | Inf | 4e-04 | 1 | 1 | chloramphenicol O-acetyltransferase activity |
| GO:0003796 | 0.0056 | 224.5972 | 0.0056 | 1 | 13 | lysozyme activity |
| GO:0005132 | 0.0073 | 168.4062 | 0.0074 | 1 | 17 | type I interferon receptor binding |
| GO:0017134 | 0.0099 | 122.4318 | 0.0099 | 1 | 23 | fibroblast growth factor binding |
| GOMFID | Pvalue | OddsRatio | ExpCount | Count | Size | Term |
| GO:0035717 | 9e-04 | Inf | 9e-04 | 1 | 1 | chemokine (C-C motif) ligand 7 binding |
| GO:0071791 | 0.0017 | 1244.2308 | 0.0017 | 1 | 2 | chemokine (C-C motif) ligand 5 binding |
| GO:0004698 | 0.0035 | 414.6923 | 0.0035 | 1 | 4 | calcium-dependent protein kinase C activity |
| GO:0031726 | 0.0043 | 311 | 0.0043 | 1 | 5 | CCR1 chemokine receptor binding |
| GO:0001228 | 0.0044 | 10.9243 | 0.3433 | 3 | 397 | transcriptional activator activity, RNA polymerase II transcription regulatory region sequence-specific binding |
| GO:0031730 | 0.0052 | 248.7846 | 0.0052 | 1 | 6 | CCR5 chemokine receptor binding |
| GO:0003680 | 0.0069 | 177.6813 | 0.0069 | 1 | 8 | AT DNA binding |
| GO:0072542 | 0.0069 | 177.6813 | 0.0069 | 1 | 8 | protein phosphatase activator activity |
| GO:0102991 | 0.0069 | 177.6813 | 0.0069 | 1 | 8 | myristoyl-CoA hydrolase activity |
| GO:0042975 | 0.0078 | 155.4615 | 0.0078 | 1 | 9 | peroxisome proliferator activated receptor binding |
| GO:0016004 | 0.0095 | 124.3538 | 0.0095 | 1 | 11 | phospholipase activator activity |
| GO:0016290 | 0.0095 | 124.3538 | 0.0095 | 1 | 11 | palmitoyl-CoA hydrolase activity |
| GOMFID | Pvalue | OddsRatio | ExpCount | Count | Size | Term |
| GO:0035717 | 9e-04 | Inf | 9e-04 | 1 | 1 | chemokine (C-C motif) ligand 7 binding |
| GO:0003924 | 0.0014 | 16.5656 | 0.2292 | 3 | 265 | GTPase activity |
| GO:0071791 | 0.0017 | 1244.2308 | 0.0017 | 1 | 2 | chemokine (C-C motif) ligand 5 binding |
| GO:0005525 | 0.0029 | 12.6646 | 0.2975 | 3 | 344 | GTP binding |
| GO:0001883 | 0.003 | 12.4777 | 0.3018 | 3 | 349 | purine nucleoside binding |
| GO:0032549 | 0.0031 | 12.4409 | 0.3027 | 3 | 350 | ribonucleoside binding |
| GO:0019001 | 0.0034 | 12.016 | 0.313 | 3 | 362 | guanyl nucleotide binding |
| GO:0004698 | 0.0035 | 414.6923 | 0.0035 | 1 | 4 | calcium-dependent protein kinase C activity |
| GO:0005200 | 0.0035 | 26.5264 | 0.0891 | 2 | 103 | structural constituent of cytoskeleton |
| GO:0031726 | 0.0043 | 311 | 0.0043 | 1 | 5 | CCR1 chemokine receptor binding |
| GO:0031730 | 0.0052 | 248.7846 | 0.0052 | 1 | 6 | CCR5 chemokine receptor binding |
| GO:0072542 | 0.0069 | 177.6813 | 0.0069 | 1 | 8 | protein phosphatase activator activity |
| GO:0102991 | 0.0069 | 177.6813 | 0.0069 | 1 | 8 | myristoyl-CoA hydrolase activity |
| GO:0008047 | 0.008 | 8.7123 | 0.4272 | 3 | 494 | enzyme activator activity |
| GO:0016004 | 0.0095 | 124.3538 | 0.0095 | 1 | 11 | phospholipase activator activity |
| GO:0016290 | 0.0095 | 124.3538 | 0.0095 | 1 | 11 | palmitoyl-CoA hydrolase activity |
| GOMFID | Pvalue | OddsRatio | ExpCount | Count | Size | Term |
| GO:0005544 | 4e-04 | 85.381 | 0.0299 | 2 | 44 | calcium-dependent phospholipid binding |
| GO:0005146 | 0.0014 | 1617.8 | 0.0014 | 1 | 2 | leukemia inhibitory factor receptor binding |
| GO:0001135 | 0.0054 | 231.0286 | 0.0054 | 1 | 8 | transcription factor activity, RNA polymerase II transcription factor recruiting |
| GOMFID | Pvalue | OddsRatio | ExpCount | Count | Size | Term |
| GO:0003735 | 0 | 109.0952 | 0.0556 | 3 | 150 | structural constituent of ribosome |
| GO:0017134 | 0.0085 | 146.9273 | 0.0085 | 1 | 23 | fibroblast growth factor binding |
| GOMFID | Pvalue | OddsRatio | ExpCount | Count | Size | Term |
| GO:0043208 | 0.002 | 770.4286 | 0.002 | 1 | 8 | glycosphingolipid binding |
| GO:0004861 | 0.003 | 490.1515 | 0.003 | 1 | 12 | cyclin-dependent protein serine/threonine kinase inhibitor activity |
| GOMFID | Pvalue | OddsRatio | ExpCount | Count | Size | Term |
| GO:0003735 | 0 | 78.9803 | 0.1112 | 5 | 150 | structural constituent of ribosome |
| GO:0019843 | 8e-04 | 59.7185 | 0.0415 | 2 | 56 | rRNA binding |
| GO:0003676 | 0.002 | 6.3824 | 2.867 | 8 | 3868 | nucleic acid binding |
| GO:1903231 | 0.0029 | 29.4844 | 0.0823 | 2 | 111 | mRNA binding involved in posttranscriptional gene silencing |
| GO:0008142 | 0.0037 | 367.5909 | 0.0037 | 1 | 5 | oxysterol binding |
| GO:0003729 | 0.0053 | 22.1927 | 0.1126 | 2 | 181 | mRNA binding |
| GO:0016175 | 0.0067 | 183.75 | 0.0067 | 1 | 9 | superoxide-generating NADPH oxidase activity |
| GO:0016176 | 0.0074 | 163.3232 | 0.0074 | 1 | 10 | superoxide-generating NADPH oxidase activator activity |
| GOMFID | Pvalue | OddsRatio | ExpCount | Count | Size | Term |
| GO:0016175 | 0.0011 | 2022.5 | 0.0011 | 1 | 9 | superoxide-generating NADPH oxidase activity |
| GO:0016176 | 0.0012 | 1797.6667 | 0.0012 | 1 | 10 | superoxide-generating NADPH oxidase activator activity |
| GOMFID | Pvalue | OddsRatio | ExpCount | Count | Size | Term |
| GO:1903231 | 0 | 89.3 | 0.0548 | 3 | 111 | mRNA binding involved in posttranscriptional gene silencing |
| GO:0048030 | 0.002 | 770.4286 | 0.002 | 1 | 4 | disaccharide binding |
| GO:0005534 | 0.0025 | 577.7857 | 0.0025 | 1 | 5 | galactose binding |
| GO:0030246 | 0.0067 | 20.5736 | 0.1285 | 2 | 260 | carbohydrate binding |
| GOMFID | Pvalue | OddsRatio | ExpCount | Count | Size | Term |
| GO:0035662 | 0 | 6472.8 | 0.0013 | 2 | 3 | Toll-like receptor 4 binding |
| GO:0050544 | 0 | 2157.3333 | 0.0022 | 2 | 5 | arachidonic acid binding |
| GO:0036041 | 0 | 718.8444 | 0.0048 | 2 | 11 | long-chain fatty acid binding |
| GO:0050786 | 0 | 718.8444 | 0.0048 | 2 | 11 | RAGE receptor binding |
| GO:1901567 | 0 | 307.8476 | 0.0099 | 2 | 23 | fatty acid derivative binding |
| GO:0043177 | 0 | 69.0043 | 0.0765 | 3 | 177 | organic acid binding |
| GO:0033293 | 3e-04 | 115.1929 | 0.0251 | 2 | 58 | monocarboxylic acid binding |
| GO:0004966 | 0.003 | 449.3611 | 0.003 | 1 | 7 | galanin receptor activity |
| GO:0008017 | 0.0032 | 31.3314 | 0.0891 | 2 | 206 | microtubule binding |
| GO:0005540 | 0.0095 | 128.2698 | 0.0095 | 1 | 22 | hyaluronic acid binding |
| GOMFID | Pvalue | OddsRatio | ExpCount | Count | Size | Term |
| GO:0008009 | 3e-04 | 100.2174 | 0.0267 | 2 | 48 | chemokine activity |
| GO:0008173 | 4e-04 | 83.7714 | 0.0317 | 2 | 57 | RNA methyltransferase activity |
| GO:0038100 | 0.0011 | 2022.5 | 0.0011 | 1 | 2 | nodal binding |
| GO:0035662 | 0.0017 | 1011.1875 | 0.0017 | 1 | 3 | Toll-like receptor 4 binding |
| GO:0031726 | 0.0028 | 505.5312 | 0.0028 | 1 | 5 | CCR1 chemokine receptor binding |
| GO:0050544 | 0.0028 | 505.5312 | 0.0028 | 1 | 5 | arachidonic acid binding |
| GO:0008757 | 0.0029 | 31.3796 | 0.0823 | 2 | 148 | S-adenosylmethionine-dependent methyltransferase activity |
| GO:0031730 | 0.0033 | 404.4 | 0.0033 | 1 | 6 | CCR5 chemokine receptor binding |
| GO:0016741 | 0.0059 | 21.4192 | 0.1195 | 2 | 215 | transferase activity, transferring one-carbon groups |
| GO:0036041 | 0.0061 | 202.1375 | 0.0061 | 1 | 11 | long-chain fatty acid binding |
| GO:0050786 | 0.0061 | 202.1375 | 0.0061 | 1 | 11 | RAGE receptor binding |
| GO:0001664 | 0.0085 | 17.7734 | 0.1434 | 2 | 258 | G-protein coupled receptor binding |
| GO:0005126 | 0.0088 | 17.4275 | 0.1462 | 2 | 263 | cytokine receptor binding |
| GOMFID | Pvalue | OddsRatio | ExpCount | Count | Size | Term |
| GO:0017176 | 0.0025 | 577.7857 | 0.0025 | 1 | 5 | phosphatidylinositol N-acetylglucosaminyltransferase activity |
| GO:0019763 | 0.003 | 462.2 | 0.003 | 1 | 6 | immunoglobulin receptor activity |
| GO:0097027 | 0.0039 | 330.102 | 0.004 | 1 | 8 | ubiquitin-protein transferase activator activity |
| GO:0019864 | 0.0054 | 231.0286 | 0.0054 | 1 | 11 | IgG binding |
| GOMFID | Pvalue | OddsRatio | ExpCount | Count | Size | Term |
| GO:0003727 | 0.0016 | 40.6692 | 0.0594 | 2 | 74 | single-stranded RNA binding |
| GO:0004082 | 0.0032 | 449.2778 | 0.0032 | 1 | 4 | bisphosphoglycerate mutase activity |
| GO:0046538 | 0.0032 | 449.2778 | 0.0032 | 1 | 4 | 2,3-bisphosphoglycerate-dependent phosphoglycerate mutase activity |
| GO:0048248 | 0.004 | 336.9375 | 0.004 | 1 | 5 | CXCR3 chemokine receptor binding |
| GO:0043565 | 0.0065 | 6.8033 | 0.7998 | 4 | 996 | sequence-specific DNA binding |
| GO:0019957 | 0.0072 | 168.4271 | 0.0072 | 1 | 9 | C-C chemokine binding |
| GO:0035925 | 0.0096 | 122.4697 | 0.0096 | 1 | 12 | mRNA 3'-UTR AU-rich region binding |
| NA. |
| n/a |
| NA. |
| n/a |
| NA. |
| n/a |
| NA. |
| n/a |
| NA. |
| n/a |
| NA. |
| n/a |
| NA. |
| n/a |
| NA. |
| n/a |
| NA. |
| n/a |
| NA. |
| n/a |
| NA. |
| n/a |
| NA. |
| n/a |
| NA. |
| n/a |
| NA. |
| n/a |
| NA. |
| n/a |
| NA. |
| n/a |
| NA. |
| n/a |
| NA. |
| n/a |
| NA. |
| n/a |
| NA. |
| n/a |
| NA. |
| n/a |
| NA. |
| n/a |
| NA. |
| n/a |
| NA. |
| n/a |
| NA. |
| n/a |
| NA. |
| n/a |
| NA. |
| n/a |
| NA. |
| n/a |
| NA. |
| n/a |
| NA. |
| n/a |
| NA. |
| n/a |
| NA. |
| n/a |
| NA. |
| n/a |
| NA. |
| n/a |
| NA. |
| n/a |
| NA. |
| n/a |
| NA. |
| n/a |
| NA. |
| n/a |
| NA. |
| n/a |
| NA. |
| n/a |
| NA. |
| n/a |
| NA. |
| n/a |
| NA. |
| n/a |
| NA. |
| n/a |
| NA. |
| n/a |
| NA. |
| n/a |
| NA. |
| n/a |
| NA. |
| n/a |
| NA. |
| n/a |
| NA. |
| n/a |
| NA. |
| n/a |
| NA. |
| n/a |
| NA. |
| n/a |
| NA. |
| n/a |
| NA. |
| n/a |
| NA. |
| n/a |
| GOMFID | Pvalue | OddsRatio | ExpCount | Count | Size | Term |
| GO:0098542 | 0 | 14.7731 | 0.5705 | 6 | 463 | defense response to other organism |
| GO:0042119 | 0 | 14.3212 | 0.5878 | 6 | 477 | neutrophil activation |
| GO:0002275 | 0 | 13.1136 | 0.6396 | 6 | 519 | myeloid cell activation involved in immune response |
| GO:0002444 | 0 | 13.0349 | 0.6433 | 6 | 522 | myeloid leukocyte mediated immunity |
| GO:0031640 | 0 | 51.8342 | 0.0715 | 3 | 58 | killing of cells of other organism |
| GO:0016045 | 1e-04 | 180 | 0.0148 | 2 | 12 | detection of bacterium |
| GO:0002263 | 1e-04 | 10.194 | 0.8133 | 6 | 660 | cell activation involved in immune response |
| GO:0043312 | 1e-04 | 12.3891 | 0.5376 | 5 | 459 | neutrophil degranulation |
| GO:0045055 | 2e-04 | 9.4676 | 0.8725 | 6 | 708 | regulated exocytosis |
| GO:0098581 | 2e-04 | 112.4583 | 0.0222 | 2 | 18 | detection of external biotic stimulus |
| GO:0035821 | 7e-04 | 20.4033 | 0.175 | 3 | 142 | modification of morphology or physiology of other organism |
| GO:0032940 | 9e-04 | 5.842 | 1.6944 | 7 | 1375 | secretion by cell |
| GO:0019547 | 0.0012 | Inf | 0.0012 | 1 | 1 | arginine catabolic process to ornithine |
| GO:0044356 | 0.0012 | Inf | 0.0012 | 1 | 1 | clearance of foreign intracellular DNA by conversion of DNA cytidine to uridine |
| GO:0061015 | 0.0012 | Inf | 0.0012 | 1 | 1 | snRNA import into nucleus |
| GO:0070965 | 0.0012 | Inf | 0.0012 | 1 | 1 | positive regulation of neutrophil mediated killing of fungus |
| GO:0099046 | 0.0012 | Inf | 0.0012 | 1 | 1 | clearance of foreign intracellular nucleic acids |
| GO:1900150 | 0.0012 | Inf | 0.0012 | 1 | 1 | regulation of defense response to fungus |
| GO:1904676 | 0.0012 | Inf | 0.0012 | 1 | 1 | negative regulation of somatic stem cell division |
| GO:1905175 | 0.0012 | Inf | 0.0012 | 1 | 1 | negative regulation of vascular smooth muscle cell dedifferentiation |
| GO:0031343 | 0.0013 | 43.8184 | 0.053 | 2 | 43 | positive regulation of cell killing |
| GO:0032964 | 0.0014 | 41.7752 | 0.0555 | 2 | 45 | collagen biosynthetic process |
| GO:0043207 | 0.0014 | 7.4697 | 0.886 | 5 | 798 | response to external biotic stimulus |
| GO:0002376 | 0.0017 | 6.5914 | 1.4345 | 6 | 1548 | immune system process |
| GO:0061844 | 0.0018 | 36.6463 | 0.0628 | 2 | 51 | antimicrobial humoral immune response mediated by antimicrobial peptide |
| GO:0045321 | 0.0018 | 5.7965 | 1.3826 | 6 | 1122 | leukocyte activation |
| GO:0009620 | 0.0018 | 35.9111 | 0.0641 | 2 | 52 | response to fungus |
| GO:0006959 | 0.0023 | 13.067 | 0.2699 | 3 | 219 | humoral immune response |
| GO:0010963 | 0.0025 | 853.1053 | 0.0025 | 1 | 2 | regulation of L-arginine import |
| GO:0044663 | 0.0025 | 853.1053 | 0.0025 | 1 | 2 | establishment or maintenance of cell type involved in phenotypic switching |
| GO:0070949 | 0.0025 | 853.1053 | 0.0025 | 1 | 2 | regulation of neutrophil mediated killing of symbiont cell |
| GO:0070960 | 0.0025 | 853.1053 | 0.0025 | 1 | 2 | positive regulation of neutrophil mediated cytotoxicity |
| GO:0045087 | 0.0029 | 6.1533 | 1.0327 | 5 | 838 | innate immune response |
| GO:0010466 | 0.0033 | 11.5473 | 0.3044 | 3 | 247 | negative regulation of peptidase activity |
| GO:0032827 | 0.0037 | 426.5263 | 0.0037 | 1 | 3 | negative regulation of natural killer cell differentiation involved in immune response |
| GO:0035879 | 0.0037 | 426.5263 | 0.0037 | 1 | 3 | plasma membrane lactate transport |
| GO:0051714 | 0.0037 | 426.5263 | 0.0037 | 1 | 3 | positive regulation of cytolysis in other organism |
| GO:0090678 | 0.0037 | 426.5263 | 0.0037 | 1 | 3 | cell dedifferentiation involved in phenotypic switching |
| GO:0016192 | 0.004 | 4.3985 | 2.1873 | 7 | 1775 | vesicle-mediated transport |
| GO:0019732 | 0.0049 | 284.3333 | 0.0049 | 1 | 4 | antifungal humoral response |
| GO:0032792 | 0.0049 | 284.3333 | 0.0049 | 1 | 4 | negative regulation of CREB transcription factor activity |
| GO:0090467 | 0.0049 | 284.3333 | 0.0049 | 1 | 4 | arginine import |
| GO:2000552 | 0.0049 | 284.3333 | 0.0049 | 1 | 4 | negative regulation of T-helper 2 cell cytokine production |
| GO:0050830 | 0.0051 | 21.0784 | 0.1072 | 2 | 87 | defense response to Gram-positive bacterium |
| GO:0036446 | 0.0061 | 213.2368 | 0.0062 | 1 | 5 | myofibroblast differentiation |
| GO:0060414 | 0.0061 | 213.2368 | 0.0062 | 1 | 5 | aorta smooth muscle tissue morphogenesis |
| GO:1902023 | 0.0061 | 213.2368 | 0.0062 | 1 | 5 | L-arginine transport |
| GO:1904673 | 0.0061 | 213.2368 | 0.0062 | 1 | 5 | negative regulation of somatic stem cell population maintenance |
| GO:2000724 | 0.0061 | 213.2368 | 0.0062 | 1 | 5 | positive regulation of cardiac vascular smooth muscle cell differentiation |
| GO:0050896 | 0.0067 | 3.9199 | 10.1084 | 16 | 8203 | response to stimulus |
| GO:2000117 | 0.0073 | 17.3754 | 0.1294 | 2 | 105 | negative regulation of cysteine-type endopeptidase activity |
| GO:0010269 | 0.0074 | 170.5789 | 0.0074 | 1 | 6 | response to selenium ion |
| GO:0015727 | 0.0074 | 170.5789 | 0.0074 | 1 | 6 | lactate transport |
| GO:0060336 | 0.0074 | 170.5789 | 0.0074 | 1 | 6 | negative regulation of interferon-gamma-mediated signaling pathway |
| GO:0070383 | 0.0074 | 170.5789 | 0.0074 | 1 | 6 | DNA cytosine deamination |
| GO:0002697 | 0.0074 | 8.5448 | 0.4079 | 3 | 331 | regulation of immune effector process |
| GO:0001816 | 0.0078 | 5.937 | 0.8121 | 4 | 659 | cytokine production |
| GO:0070268 | 0.0084 | 16.1151 | 0.1392 | 2 | 113 | cornification |
| GO:0009253 | 0.0086 | 142.1404 | 0.0086 | 1 | 7 | peptidoglycan catabolic process |
| GO:0009635 | 0.0086 | 142.1404 | 0.0086 | 1 | 7 | response to herbicide |
| GO:0010668 | 0.0086 | 142.1404 | 0.0086 | 1 | 7 | ectodermal cell differentiation |
| GO:0032815 | 0.0086 | 142.1404 | 0.0086 | 1 | 7 | negative regulation of natural killer cell activation |
| GO:0051597 | 0.0086 | 142.1404 | 0.0086 | 1 | 7 | response to methylmercury |
| GO:0043313 | 0.0098 | 121.8271 | 0.0099 | 1 | 8 | regulation of neutrophil degranulation |
| GO:0043696 | 0.0098 | 121.8271 | 0.0099 | 1 | 8 | dedifferentiation |
| GO:0070269 | 0.0098 | 121.8271 | 0.0099 | 1 | 8 | pyroptosis |
| GO:1900239 | 0.0098 | 121.8271 | 0.0099 | 1 | 8 | regulation of phenotypic switching |
| GO:2000035 | 0.0098 | 121.8271 | 0.0099 | 1 | 8 | regulation of stem cell division |
| GOMFID | Pvalue | OddsRatio | ExpCount | Count | Size | Term |
| GO:0008584 | 0.0014 | 15.189 | 0.2243 | 3 | 130 | male gonad development |
| GO:0060010 | 0.0017 | Inf | 0.0017 | 1 | 1 | Sertoli cell fate commitment |
| GO:0061185 | 0.0017 | Inf | 0.0017 | 1 | 1 | negative regulation of dermatome development |
| GO:0061682 | 0.0017 | Inf | 0.0017 | 1 | 1 | seminal vesicle morphogenesis |
| GO:2000287 | 0.0017 | Inf | 0.0017 | 1 | 1 | positive regulation of myotome development |
| GO:0046661 | 0.0023 | 12.8416 | 0.264 | 3 | 153 | male sex differentiation |
| GO:0030850 | 0.003 | 27.6188 | 0.0811 | 2 | 47 | prostate gland development |
| GO:2000041 | 0.0034 | 600.037 | 0.0035 | 1 | 2 | negative regulation of planar cell polarity pathway involved in axis elongation |
| GO:0060350 | 0.0035 | 25.3579 | 0.088 | 2 | 51 | endochondral bone morphogenesis |
| GO:0060348 | 0.0035 | 10.9268 | 0.3088 | 3 | 179 | bone development |
| GO:0051094 | 0.0036 | 4.171 | 2.0806 | 7 | 1206 | positive regulation of developmental process |
| GO:0043124 | 0.004 | 23.4383 | 0.0949 | 2 | 55 | negative regulation of I-kappaB kinase/NF-kappaB signaling |
| GO:0045600 | 0.0043 | 22.5832 | 0.0983 | 2 | 57 | positive regulation of fat cell differentiation |
| GO:0045669 | 0.0045 | 22.1786 | 0.1001 | 2 | 58 | positive regulation of osteoblast differentiation |
| GO:0061458 | 0.005 | 6.5339 | 0.7022 | 4 | 407 | reproductive system development |
| GO:0060741 | 0.0052 | 300 | 0.0052 | 1 | 3 | prostate gland stromal morphogenesis |
| GO:0070458 | 0.0052 | 300 | 0.0052 | 1 | 3 | cellular detoxification of nitrogen compound |
| GO:1904715 | 0.0052 | 300 | 0.0052 | 1 | 3 | negative regulation of chaperone-mediated autophagy |
| GO:1990834 | 0.0052 | 300 | 0.0052 | 1 | 3 | response to odorant |
| GO:0045137 | 0.0052 | 9.4575 | 0.3554 | 3 | 206 | development of primary sexual characteristics |
| GO:0048705 | 0.0054 | 9.3181 | 0.3606 | 3 | 209 | skeletal system morphogenesis |
| GO:0048041 | 0.0066 | 17.9855 | 0.1225 | 2 | 71 | focal adhesion assembly |
| GO:0008588 | 0.0069 | 199.9877 | 0.0069 | 1 | 4 | release of cytoplasmic sequestered NF-kappaB |
| GO:0018916 | 0.0069 | 199.9877 | 0.0069 | 1 | 4 | nitrobenzene metabolic process |
| GO:0042662 | 0.0069 | 199.9877 | 0.0069 | 1 | 4 | negative regulation of mesodermal cell fate specification |
| GO:0090244 | 0.0069 | 199.9877 | 0.0069 | 1 | 4 | Wnt signaling pathway involved in somitogenesis |
| GO:1905903 | 0.0069 | 199.9877 | 0.0069 | 1 | 4 | negative regulation of mesoderm formation |
| GO:0021766 | 0.007 | 17.4767 | 0.1259 | 2 | 73 | hippocampus development |
| GO:0043627 | 0.007 | 17.4767 | 0.1259 | 2 | 73 | response to estrogen |
| GO:0003151 | 0.0072 | 17.2329 | 0.1277 | 2 | 74 | outflow tract morphogenesis |
| GO:0045621 | 0.0083 | 15.9014 | 0.138 | 2 | 80 | positive regulation of lymphocyte differentiation |
| GO:0034333 | 0.0085 | 15.6991 | 0.1397 | 2 | 81 | adherens junction assembly |
| GO:0060591 | 0.0086 | 149.9815 | 0.0086 | 1 | 5 | chondroblast differentiation |
| GO:0061056 | 0.0086 | 149.9815 | 0.0086 | 1 | 5 | sclerotome development |
| GO:1904956 | 0.0086 | 149.9815 | 0.0086 | 1 | 5 | regulation of midbrain dopaminergic neuron differentiation |
| GO:0045944 | 0.0087 | 3.8841 | 1.8442 | 6 | 1069 | positive regulation of transcription from RNA polymerase II promoter |
| GO:0001843 | 0.0094 | 14.9388 | 0.1466 | 2 | 85 | neural tube closure |
| GO:0007044 | 0.0098 | 14.5855 | 0.1501 | 2 | 87 | cell-substrate junction assembly |
| GOMFID | Pvalue | OddsRatio | ExpCount | Count | Size | Term |
| GO:2001236 | 2e-04 | 33.2524 | 0.1185 | 3 | 148 | regulation of extrinsic apoptotic signaling pathway |
| GO:1902042 | 4e-04 | 86.5401 | 0.0288 | 2 | 36 | negative regulation of extrinsic apoptotic signaling pathway via death domain receptors |
| GO:2000351 | 5e-04 | 75.4219 | 0.0328 | 2 | 41 | regulation of endothelial cell apoptotic process |
| GO:2001234 | 5e-04 | 24.2712 | 0.161 | 3 | 201 | negative regulation of apoptotic signaling pathway |
| GO:0042113 | 6e-04 | 22.4341 | 0.1738 | 3 | 217 | B cell activation |
| GO:0002642 | 8e-04 | Inf | 8e-04 | 1 | 1 | positive regulation of immunoglobulin biosynthetic process |
| GO:0030887 | 8e-04 | Inf | 8e-04 | 1 | 1 | positive regulation of myeloid dendritic cell activation |
| GO:1904155 | 8e-04 | Inf | 8e-04 | 1 | 1 | DN2 thymocyte differentiation |
| GO:1904156 | 8e-04 | Inf | 8e-04 | 1 | 1 | DN3 thymocyte differentiation |
| GO:0045321 | 0.0013 | 8.449 | 0.8987 | 5 | 1122 | leukocyte activation |
| GO:0034021 | 0.0016 | 1351.3333 | 0.0016 | 1 | 2 | response to silicon dioxide |
| GO:0036345 | 0.0016 | 1351.3333 | 0.0016 | 1 | 2 | platelet maturation |
| GO:0030098 | 0.0018 | 15.2435 | 0.2531 | 3 | 316 | lymphocyte differentiation |
| GO:0007166 | 0.002 | 6.0519 | 2.105 | 7 | 2628 | cell surface receptor signaling pathway |
| GO:0002377 | 0.0022 | 34.1036 | 0.0705 | 2 | 88 | immunoglobulin production |
| GO:1904019 | 0.0023 | 33.3244 | 0.0721 | 2 | 90 | epithelial cell apoptotic process |
| GO:0021553 | 0.0024 | 675.625 | 0.0024 | 1 | 3 | olfactory nerve development |
| GO:0048388 | 0.0024 | 675.625 | 0.0024 | 1 | 3 | endosomal lumen acidification |
| GO:0061368 | 0.0024 | 675.625 | 0.0024 | 1 | 3 | behavioral response to formalin induced pain |
| GO:0099566 | 0.0024 | 675.625 | 0.0024 | 1 | 3 | regulation of postsynaptic cytosolic calcium ion concentration |
| GO:0030097 | 0.003 | 8.5425 | 0.6456 | 4 | 806 | hemopoiesis |
| GO:0030644 | 0.0032 | 450.3889 | 0.0032 | 1 | 4 | cellular chloride ion homeostasis |
| GO:0045918 | 0.0032 | 450.3889 | 0.0032 | 1 | 4 | negative regulation of cytolysis |
| GO:0046666 | 0.0032 | 450.3889 | 0.0032 | 1 | 4 | retinal cell programmed cell death |
| GO:0060474 | 0.0032 | 450.3889 | 0.0032 | 1 | 4 | positive regulation of flagellated sperm motility involved in capacitation |
| GO:2001274 | 0.0032 | 450.3889 | 0.0032 | 1 | 4 | negative regulation of glucose import in response to insulin stimulus |
| GO:0008219 | 0.0034 | 5.8386 | 1.6677 | 6 | 2082 | cell death |
| GO:0006874 | 0.0034 | 12.0794 | 0.3172 | 3 | 396 | cellular calcium ion homeostasis |
| GO:0043069 | 0.0035 | 8.1977 | 0.6712 | 4 | 838 | negative regulation of programmed cell death |
| GO:0032747 | 0.004 | 337.7708 | 0.004 | 1 | 5 | positive regulation of interleukin-23 production |
| GO:0060385 | 0.004 | 337.7708 | 0.004 | 1 | 5 | axonogenesis involved in innervation |
| GO:0072679 | 0.004 | 337.7708 | 0.004 | 1 | 5 | thymocyte migration |
| GO:0002520 | 0.0043 | 7.6997 | 0.7121 | 4 | 889 | immune system development |
| GO:0051240 | 0.0043 | 6.242 | 1.1863 | 5 | 1481 | positive regulation of multicellular organismal process |
| GO:0072507 | 0.0046 | 10.8585 | 0.3516 | 3 | 439 | divalent inorganic cation homeostasis |
| GO:0051599 | 0.0048 | 270.2 | 0.0048 | 1 | 6 | response to hydrostatic pressure |
| GO:0097527 | 0.0048 | 270.2 | 0.0048 | 1 | 6 | necroptotic signaling pathway |
| GO:0002684 | 0.0051 | 7.3223 | 0.7465 | 4 | 932 | positive regulation of immune system process |
| GO:1902533 | 0.0053 | 7.2477 | 0.7537 | 4 | 941 | positive regulation of intracellular signal transduction |
| GO:0050906 | 0.0053 | 10.3225 | 0.3693 | 3 | 461 | detection of stimulus involved in sensory perception |
| GO:0030223 | 0.0056 | 225.1528 | 0.0056 | 1 | 7 | neutrophil differentiation |
| GO:0048290 | 0.0056 | 225.1528 | 0.0056 | 1 | 7 | isotype switching to IgA isotypes |
| GO:0001821 | 0.0064 | 192.9762 | 0.0064 | 1 | 8 | histamine secretion |
| GO:0038180 | 0.0064 | 192.9762 | 0.0064 | 1 | 8 | nerve growth factor signaling pathway |
| GO:0042045 | 0.0064 | 192.9762 | 0.0064 | 1 | 8 | epithelial fluid transport |
| GO:0071316 | 0.0064 | 192.9762 | 0.0064 | 1 | 8 | cellular response to nicotine |
| GO:1902715 | 0.0064 | 192.9762 | 0.0064 | 1 | 8 | positive regulation of interferon-gamma secretion |
| GO:0050865 | 0.0064 | 9.5884 | 0.3965 | 3 | 495 | regulation of cell activation |
| GO:0010623 | 0.0066 | 184.1591 | 0.0067 | 1 | 9 | programmed cell death involved in cell development |
| GO:0042221 | 0.0067 | 4.6388 | 3.3377 | 8 | 4167 | response to chemical |
| GO:0001766 | 0.0072 | 168.8438 | 0.0072 | 1 | 9 | membrane raft polarization |
| GO:0071803 | 0.0072 | 168.8438 | 0.0072 | 1 | 9 | positive regulation of podosome assembly |
| GO:0097011 | 0.0072 | 168.8438 | 0.0072 | 1 | 9 | cellular response to granulocyte macrophage colony-stimulating factor stimulus |
| GO:2000510 | 0.0072 | 168.8438 | 0.0072 | 1 | 9 | positive regulation of dendritic cell chemotaxis |
| GO:0050966 | 0.008 | 150.0741 | 0.008 | 1 | 10 | detection of mechanical stimulus involved in sensory perception of pain |
| GO:0051665 | 0.008 | 150.0741 | 0.008 | 1 | 10 | membrane raft localization |
| GO:0090331 | 0.0088 | 135.0583 | 0.0088 | 1 | 11 | negative regulation of platelet aggregation |
| GO:0007610 | 0.0088 | 8.5136 | 0.4445 | 3 | 555 | behavior |
| GO:0055065 | 0.0092 | 8.3568 | 0.4526 | 3 | 565 | metal ion homeostasis |
| GO:0043523 | 0.0095 | 15.7563 | 0.1498 | 2 | 187 | regulation of neuron apoptotic process |
| GO:0007623 | 0.0096 | 15.6706 | 0.1506 | 2 | 188 | circadian rhythm |
| GO:0034116 | 0.0096 | 122.7727 | 0.0096 | 1 | 12 | positive regulation of heterotypic cell-cell adhesion |
| GO:0030003 | 0.0099 | 8.1464 | 0.4638 | 3 | 579 | cellular cation homeostasis |
| GOMFID | Pvalue | OddsRatio | ExpCount | Count | Size | Term |
| GO:0060349 | 5e-04 | 22.7534 | 0.1518 | 3 | 88 | bone morphogenesis |
| GO:0001958 | 0.001 | 49.7754 | 0.0466 | 2 | 27 | endochondral ossification |
| GO:0048562 | 0.0013 | 9.6527 | 0.4813 | 4 | 279 | embryonic organ morphogenesis |
| GO:0021592 | 0.0017 | Inf | 0.0017 | 1 | 1 | fourth ventricle development |
| GO:0021993 | 0.0017 | Inf | 0.0017 | 1 | 1 | initiation of neural tube closure |
| GO:0060010 | 0.0017 | Inf | 0.0017 | 1 | 1 | Sertoli cell fate commitment |
| GO:0031076 | 0.0018 | 35.5319 | 0.0638 | 2 | 37 | embryonic camera-type eye development |
| GO:0016574 | 0.0021 | 32.7206 | 0.069 | 2 | 40 | histone ubiquitination |
| GO:0045321 | 0.0024 | 4.5103 | 1.9357 | 7 | 1122 | leukocyte activation |
| GO:0048701 | 0.0026 | 29.5971 | 0.0759 | 2 | 44 | embryonic cranial skeleton morphogenesis |
| GO:0051572 | 0.0034 | 600.037 | 0.0035 | 1 | 2 | negative regulation of histone H3-K4 methylation |
| GO:1904815 | 0.0034 | 600.037 | 0.0035 | 1 | 2 | negative regulation of protein localization to chromosome, telomeric region |
| GO:0008283 | 0.0044 | 3.4439 | 3.3952 | 9 | 1968 | cell proliferation |
| GO:0045669 | 0.0045 | 22.1786 | 0.1001 | 2 | 58 | positive regulation of osteoblast differentiation |
| GO:0002351 | 0.0052 | 300 | 0.0052 | 1 | 3 | serotonin production involved in inflammatory response |
| GO:0002554 | 0.0052 | 300 | 0.0052 | 1 | 3 | serotonin secretion by platelet |
| GO:0021678 | 0.0052 | 300 | 0.0052 | 1 | 3 | third ventricle development |
| GO:0033128 | 0.0052 | 300 | 0.0052 | 1 | 3 | negative regulation of histone phosphorylation |
| GO:0071593 | 0.0052 | 300 | 0.0052 | 1 | 3 | lymphocyte aggregation |
| GO:1901837 | 0.0052 | 300 | 0.0052 | 1 | 3 | negative regulation of transcription of nuclear large rRNA transcript from RNA polymerase I promoter |
| GO:1990834 | 0.0052 | 300 | 0.0052 | 1 | 3 | response to odorant |
| GO:0061035 | 0.0054 | 20.0248 | 0.1104 | 2 | 64 | regulation of cartilage development |
| GO:0008589 | 0.0061 | 18.8065 | 0.1173 | 2 | 68 | regulation of smoothened signaling pathway |
| GO:0006366 | 0.0061 | 3.2591 | 3.5625 | 9 | 2065 | transcription from RNA polymerase II promoter |
| GO:0002051 | 0.0069 | 199.9877 | 0.0069 | 1 | 4 | osteoblast fate commitment |
| GO:0016554 | 0.0069 | 199.9877 | 0.0069 | 1 | 4 | cytidine to uridine editing |
| GO:0021555 | 0.0069 | 199.9877 | 0.0069 | 1 | 4 | midbrain-hindbrain boundary morphogenesis |
| GO:0061086 | 0.0069 | 199.9877 | 0.0069 | 1 | 4 | negative regulation of histone H3-K27 methylation |
| GO:0042110 | 0.0069 | 5.9152 | 0.7729 | 4 | 448 | T cell activation |
| GO:0043627 | 0.007 | 17.4767 | 0.1259 | 2 | 73 | response to estrogen |
| GO:0002521 | 0.0077 | 5.7422 | 0.7953 | 4 | 461 | leukocyte differentiation |
| GO:0045621 | 0.0083 | 15.9014 | 0.138 | 2 | 80 | positive regulation of lymphocyte differentiation |
| GO:0034184 | 0.0086 | 149.9815 | 0.0086 | 1 | 5 | positive regulation of maintenance of mitotic sister chromatid cohesion |
| GO:0060591 | 0.0086 | 149.9815 | 0.0086 | 1 | 5 | chondroblast differentiation |
| GO:0048609 | 0.0091 | 4.417 | 1.3198 | 5 | 765 | multicellular organismal reproductive process |
| GO:0120034 | 0.0092 | 15.122 | 0.1449 | 2 | 84 | positive regulation of plasma membrane bounded cell projection assembly |
| GO:0060606 | 0.0096 | 14.7601 | 0.1484 | 2 | 86 | tube closure |
| GOMFID | Pvalue | OddsRatio | ExpCount | Count | Size | Term |
| GO:2000502 | 0 | 1200 | 0.0054 | 2 | 3 | negative regulation of natural killer cell chemotaxis |
| GO:0060326 | 1e-04 | 12.9761 | 0.4664 | 5 | 261 | cell chemotaxis |
| GO:2000402 | 1e-04 | 171.3651 | 0.0161 | 2 | 9 | negative regulation of lymphocyte migration |
| GO:0002689 | 4e-04 | 85.6455 | 0.0286 | 2 | 16 | negative regulation of leukocyte chemotaxis |
| GO:0070098 | 4e-04 | 24.1618 | 0.1429 | 3 | 80 | chemokine-mediated signaling pathway |
| GO:0045954 | 5e-04 | 70.5185 | 0.0339 | 2 | 19 | positive regulation of natural killer cell mediated cytotoxicity |
| GO:0043547 | 6e-04 | 8.5584 | 0.6969 | 5 | 390 | positive regulation of GTPase activity |
| GO:1901623 | 6e-04 | 63.0877 | 0.0375 | 2 | 21 | regulation of lymphocyte chemotaxis |
| GO:0051336 | 7e-04 | 5.0712 | 2.037 | 8 | 1140 | regulation of hydrolase activity |
| GO:0048247 | 0.0017 | 36.9074 | 0.0616 | 2 | 37 | lymphocyte chemotaxis |
| GO:0002715 | 0.0018 | 36.2918 | 0.0625 | 2 | 35 | regulation of natural killer cell mediated immunity |
| GO:0032078 | 0.0018 | Inf | 0.0018 | 1 | 1 | negative regulation of endodeoxyribonuclease activity |
| GO:1902204 | 0.0018 | Inf | 0.0018 | 1 | 1 | positive regulation of hepatocyte growth factor receptor signaling pathway |
| GO:1904155 | 0.0018 | Inf | 0.0018 | 1 | 1 | DN2 thymocyte differentiation |
| GO:1904156 | 0.0018 | Inf | 0.0018 | 1 | 1 | DN3 thymocyte differentiation |
| GO:0071346 | 0.0019 | 13.5295 | 0.2502 | 3 | 140 | cellular response to interferon-gamma |
| GO:0045429 | 0.0024 | 30.6971 | 0.0733 | 2 | 41 | positive regulation of nitric oxide biosynthetic process |
| GO:0019835 | 0.0025 | 29.9278 | 0.075 | 2 | 42 | cytolysis |
| GO:0031343 | 0.0027 | 29.196 | 0.0768 | 2 | 43 | positive regulation of cell killing |
| GO:0034260 | 0.0028 | 28.4991 | 0.0786 | 2 | 44 | negative regulation of GTPase activity |
| GO:0042330 | 0.0029 | 5.8622 | 1.0024 | 5 | 561 | taxis |
| GO:0002685 | 0.0032 | 11.353 | 0.2966 | 3 | 166 | regulation of leukocyte migration |
| GO:0045087 | 0.0032 | 4.8189 | 1.4974 | 6 | 838 | innate immune response |
| GO:0046373 | 0.0036 | 578.5714 | 0.0036 | 1 | 2 | L-arabinose metabolic process |
| GO:0050920 | 0.0038 | 10.628 | 0.3163 | 3 | 177 | regulation of chemotaxis |
| GO:0001910 | 0.004 | 23.4568 | 0.0947 | 2 | 53 | regulation of leukocyte mediated cytotoxicity |
| GO:0006968 | 0.0042 | 23.0043 | 0.0965 | 2 | 54 | cellular defense response |
| GO:0032729 | 0.0051 | 20.6169 | 0.1072 | 2 | 60 | positive regulation of interferon-gamma production |
| GO:0002548 | 0.0055 | 19.9272 | 0.1108 | 2 | 62 | monocyte chemotaxis |
| GO:0031295 | 0.0063 | 18.3886 | 0.1197 | 2 | 67 | T cell costimulation |
| GO:0046209 | 0.0069 | 17.5741 | 0.1251 | 2 | 70 | nitric oxide metabolic process |
| GO:0060474 | 0.0071 | 192.8333 | 0.0071 | 1 | 4 | positive regulation of flagellated sperm motility involved in capacitation |
| GO:0030101 | 0.0075 | 16.8284 | 0.1304 | 2 | 73 | natural killer cell activation |
| GO:0002708 | 0.0077 | 16.5936 | 0.1322 | 2 | 74 | positive regulation of lymphocyte mediated immunity |
| GO:1903426 | 0.0083 | 15.9269 | 0.1376 | 2 | 77 | regulation of reactive oxygen species biosynthetic process |
| GO:0072679 | 0.0089 | 144.6161 | 0.0089 | 1 | 5 | thymocyte migration |
| GOMFID | Pvalue | OddsRatio | ExpCount | Count | Size | Term |
| GO:0006955 | 0 | 28.6195 | 0.3161 | 6 | 257 | immune response |
| GO:0045321 | 0 | 7.7668 | 2.2813 | 12 | 1122 | leukocyte activation |
| GO:0002263 | 0 | 8.9551 | 1.342 | 9 | 660 | cell activation involved in immune response |
| GO:0006954 | 0 | 8.8278 | 1.3603 | 9 | 669 | inflammatory response |
| GO:0007166 | 0 | 4.8951 | 5.3434 | 16 | 2628 | cell surface receptor signaling pathway |
| GO:0070098 | 0 | 29.2577 | 0.1627 | 4 | 80 | chemokine-mediated signaling pathway |
| GO:0045087 | 0 | 6.9517 | 1.7039 | 9 | 838 | innate immune response |
| GO:0071347 | 0 | 25.8396 | 0.183 | 4 | 90 | cellular response to interleukin-1 |
| GO:0002322 | 0 | 348.2581 | 0.0102 | 2 | 5 | B cell proliferation involved in immune response |
| GO:0070374 | 0 | 15.1247 | 0.3945 | 5 | 194 | positive regulation of ERK1 and ERK2 cascade |
| GO:0007194 | 0 | 52.1484 | 0.0691 | 3 | 34 | negative regulation of adenylate cyclase activity |
| GO:0002548 | 1e-04 | 42.1777 | 0.0841 | 3 | 44 | monocyte chemotaxis |
| GO:0002687 | 1e-04 | 18.9567 | 0.246 | 4 | 121 | positive regulation of leukocyte migration |
| GO:0097530 | 1e-04 | 18.7949 | 0.2481 | 4 | 122 | granulocyte migration |
| GO:0031666 | 1e-04 | 174.0968 | 0.0163 | 2 | 8 | positive regulation of lipopolysaccharide-mediated signaling pathway |
| GO:0030803 | 1e-04 | 35.8933 | 0.0976 | 3 | 48 | negative regulation of cyclic nucleotide biosynthetic process |
| GO:0030815 | 1e-04 | 34.3617 | 0.1017 | 3 | 50 | negative regulation of cAMP metabolic process |
| GO:1900372 | 1e-04 | 33.6437 | 0.1037 | 3 | 51 | negative regulation of purine nucleotide biosynthetic process |
| GO:0060326 | 2e-04 | 11.1196 | 0.5307 | 5 | 261 | cell chemotaxis |
| GO:0071346 | 2e-04 | 16.289 | 0.2847 | 4 | 140 | cellular response to interferon-gamma |
| GO:0048247 | 2e-04 | 29.3491 | 0.1179 | 3 | 58 | lymphocyte chemotaxis |
| GO:0045980 | 4e-04 | 23.0386 | 0.1484 | 3 | 73 | negative regulation of nucleotide metabolic process |
| GO:0030502 | 5e-04 | 74.576 | 0.0325 | 2 | 16 | negative regulation of bone mineralization |
| GO:0002275 | 6e-04 | 6.794 | 1.0553 | 6 | 519 | myeloid cell activation involved in immune response |
| GO:0002444 | 6e-04 | 6.7532 | 1.0614 | 6 | 522 | myeloid leukocyte mediated immunity |
| GO:0090026 | 6e-04 | 65.246 | 0.0366 | 2 | 18 | positive regulation of monocyte chemotaxis |
| GO:0030593 | 7e-04 | 18.9553 | 0.1789 | 3 | 88 | neutrophil chemotaxis |
| GO:0031279 | 9e-04 | 17.6989 | 0.1911 | 3 | 94 | regulation of cyclase activity |
| GO:0051339 | 9e-04 | 17.5054 | 0.1932 | 3 | 95 | regulation of lyase activity |
| GO:0007214 | 0.001 | 49.6959 | 0.0468 | 2 | 23 | gamma-aminobutyric acid signaling pathway |
| GO:0002688 | 0.0013 | 15.6252 | 0.2155 | 3 | 106 | regulation of leukocyte chemotaxis |
| GO:0032940 | 0.0013 | 4.0715 | 2.7957 | 9 | 1375 | secretion by cell |
| GO:0002682 | 0.0013 | 7.1121 | 0.8434 | 5 | 479 | regulation of immune system process |
| GO:0050715 | 0.0015 | 14.7596 | 0.2277 | 3 | 112 | positive regulation of cytokine secretion |
| GO:0050900 | 0.0016 | 8.9959 | 0.5131 | 4 | 285 | leukocyte migration |
| GO:0006049 | 0.002 | Inf | 0.002 | 1 | 1 | UDP-N-acetylglucosamine catabolic process |
| GO:0006051 | 0.002 | Inf | 0.002 | 1 | 1 | N-acetylmannosamine metabolic process |
| GO:0048006 | 0.002 | Inf | 0.002 | 1 | 1 | antigen processing and presentation, endogenous lipid antigen via MHC class Ib |
| GO:0090122 | 0.002 | Inf | 0.002 | 1 | 1 | cholesterol ester hydrolysis involved in cholesterol transport |
| GO:0009225 | 0.002 | 33.6441 | 0.0671 | 2 | 33 | nucleotide-sugar metabolic process |
| GO:0030817 | 0.0022 | 12.9621 | 0.2582 | 3 | 127 | regulation of cAMP biosynthetic process |
| GO:0006040 | 0.0022 | 32.5907 | 0.0691 | 2 | 34 | amino sugar metabolic process |
| GO:0050921 | 0.0022 | 12.8576 | 0.2603 | 3 | 128 | positive regulation of chemotaxis |
| GO:0002521 | 0.0022 | 6.1642 | 0.9373 | 5 | 461 | leukocyte differentiation |
| GO:0043312 | 0.0024 | 6.0819 | 0.9495 | 5 | 467 | neutrophil degranulation |
| GO:0042119 | 0.0026 | 5.9492 | 0.9699 | 5 | 477 | neutrophil activation |
| GO:0045055 | 0.0027 | 4.905 | 1.4396 | 6 | 708 | regulated exocytosis |
| GO:0071675 | 0.0031 | 26.7295 | 0.0834 | 2 | 41 | regulation of mononuclear cell migration |
| GO:0002285 | 0.0037 | 10.6265 | 0.3131 | 3 | 154 | lymphocyte activation involved in immune response |
| GO:0030808 | 0.0038 | 10.4863 | 0.3172 | 3 | 156 | regulation of nucleotide biosynthetic process |
| GO:0052652 | 0.0041 | 10.2827 | 0.3233 | 3 | 159 | cyclic purine nucleotide metabolic process |
| GO:0002337 | 0.0041 | 506.125 | 0.0041 | 1 | 2 | B-1a B cell differentiation |
| GO:0071663 | 0.0041 | 506.125 | 0.0041 | 1 | 2 | positive regulation of granzyme B production |
| GO:1904808 | 0.0041 | 506.125 | 0.0041 | 1 | 2 | positive regulation of protein oxidation |
| GO:0071222 | 0.0044 | 9.9602 | 0.3335 | 3 | 164 | cellular response to lipopolysaccharide |
| GO:0030799 | 0.0048 | 9.6572 | 0.3436 | 3 | 169 | regulation of cyclic nucleotide metabolic process |
| GO:0019220 | 0.0051 | 3.2708 | 3.4057 | 9 | 1675 | regulation of phosphate metabolic process |
| GO:0042330 | 0.0052 | 5.0234 | 1.1407 | 5 | 561 | taxis |
| GO:0046651 | 0.0054 | 19.9812 | 0.1104 | 2 | 59 | lymphocyte proliferation |
| GO:0005975 | 0.0056 | 4.9315 | 1.161 | 5 | 571 | carbohydrate metabolic process |
| GO:0048584 | 0.0056 | 3.0497 | 4.1296 | 10 | 2031 | positive regulation of response to stimulus |
| GO:0050918 | 0.006 | 18.9349 | 0.1159 | 2 | 57 | positive chemotaxis |
| GO:0019262 | 0.0061 | 253.0469 | 0.0061 | 1 | 3 | N-acetylneuraminate catabolic process |
| GO:2000566 | 0.0061 | 253.0469 | 0.0061 | 1 | 3 | positive regulation of CD8-positive, alpha-beta T cell proliferation |
| GO:0048870 | 0.0064 | 3.3559 | 2.8832 | 8 | 1418 | cell motility |
| GO:0048534 | 0.0066 | 4.0576 | 1.7222 | 6 | 847 | hematopoietic or lymphoid organ development |
| GO:0070661 | 0.0067 | 17.7757 | 0.1236 | 2 | 66 | leukocyte proliferation |
| GO:0071216 | 0.0068 | 8.5154 | 0.3884 | 3 | 191 | cellular response to biotic stimulus |
| GO:0043900 | 0.0068 | 5.8838 | 0.7625 | 4 | 375 | regulation of multi-organism process |
| GO:0045670 | 0.0068 | 17.6468 | 0.124 | 2 | 61 | regulation of osteoclast differentiation |
| GO:0050670 | 0.0075 | 8.2062 | 0.4026 | 3 | 198 | regulation of lymphocyte proliferation |
| GO:2000391 | 0.0081 | 168.6875 | 0.0081 | 1 | 4 | positive regulation of neutrophil extravasation |
| GO:0050776 | 0.0086 | 3.822 | 1.8218 | 6 | 896 | regulation of immune response |
| GO:0070663 | 0.0086 | 7.7626 | 0.425 | 3 | 209 | regulation of leukocyte proliferation |
| GO:0036230 | 0.0089 | 145.5648 | 0.0089 | 1 | 5 | granulocyte activation |
| GO:0070167 | 0.0091 | 15.0799 | 0.1444 | 2 | 71 | regulation of biomineral tissue development |
| GO:0042113 | 0.0096 | 7.4687 | 0.4412 | 3 | 217 | B cell activation |
| GOMFID | Pvalue | OddsRatio | ExpCount | Count | Size | Term |
| GO:0006955 | 0 | 24.5276 | 0.3512 | 6 | 257 | immune response |
| GO:0070374 | 0 | 17.6159 | 0.4184 | 6 | 194 | positive regulation of ERK1 and ERK2 cascade |
| GO:0007166 | 0 | 4.9136 | 5.6673 | 17 | 2628 | cell surface receptor signaling pathway |
| GO:0006954 | 0 | 8.1477 | 1.4427 | 9 | 669 | inflammatory response |
| GO:0045321 | 0 | 6.2228 | 2.4196 | 11 | 1122 | leukocyte activation |
| GO:0070098 | 0 | 27.3667 | 0.1725 | 4 | 80 | chemokine-mediated signaling pathway |
| GO:0071347 | 0 | 24.1695 | 0.1941 | 4 | 90 | cellular response to interleukin-1 |
| GO:0002322 | 0 | 327.1111 | 0.0108 | 2 | 5 | B cell proliferation involved in immune response |
| GO:0007194 | 1e-04 | 48.8831 | 0.0733 | 3 | 34 | negative regulation of adenylate cyclase activity |
| GO:0002263 | 1e-04 | 7.0634 | 1.4233 | 8 | 660 | cell activation involved in immune response |
| GO:0002548 | 1e-04 | 39.361 | 0.0896 | 3 | 44 | monocyte chemotaxis |
| GO:0031666 | 1e-04 | 163.5253 | 0.0173 | 2 | 8 | positive regulation of lipopolysaccharide-mediated signaling pathway |
| GO:0002687 | 1e-04 | 17.7315 | 0.2609 | 4 | 121 | positive regulation of leukocyte migration |
| GO:0097530 | 1e-04 | 17.5801 | 0.2631 | 4 | 122 | granulocyte migration |
| GO:0030803 | 1e-04 | 33.6458 | 0.1035 | 3 | 48 | negative regulation of cyclic nucleotide biosynthetic process |
| GO:0030815 | 2e-04 | 32.2101 | 0.1078 | 3 | 50 | negative regulation of cAMP metabolic process |
| GO:1900372 | 2e-04 | 31.5371 | 0.11 | 3 | 51 | negative regulation of purine nucleotide biosynthetic process |
| GO:0071346 | 2e-04 | 15.2362 | 0.3019 | 4 | 140 | cellular response to interferon-gamma |
| GO:0060326 | 2e-04 | 10.377 | 0.5628 | 5 | 261 | cell chemotaxis |
| GO:0048247 | 3e-04 | 27.5114 | 0.1251 | 3 | 58 | lymphocyte chemotaxis |
| GO:0045087 | 3e-04 | 5.4851 | 1.8071 | 8 | 838 | innate immune response |
| GO:0045980 | 5e-04 | 21.596 | 0.1574 | 3 | 73 | negative regulation of nucleotide metabolic process |
| GO:0030502 | 5e-04 | 70.0476 | 0.0345 | 2 | 16 | negative regulation of bone mineralization |
| GO:0090026 | 7e-04 | 61.2841 | 0.0388 | 2 | 18 | positive regulation of monocyte chemotaxis |
| GO:0048584 | 7e-04 | 3.6633 | 4.3799 | 12 | 2031 | positive regulation of response to stimulus |
| GO:0002275 | 8e-04 | 6.3247 | 1.1192 | 6 | 519 | myeloid cell activation involved in immune response |
| GO:0002444 | 8e-04 | 6.2867 | 1.1257 | 6 | 522 | myeloid leukocyte mediated immunity |
| GO:0030593 | 9e-04 | 17.7684 | 0.1898 | 3 | 88 | neutrophil chemotaxis |
| GO:0031279 | 0.0011 | 16.5907 | 0.2027 | 3 | 94 | regulation of cyclase activity |
| GO:0051339 | 0.0011 | 16.4093 | 0.2049 | 3 | 95 | regulation of lyase activity |
| GO:0007214 | 0.0011 | 46.6782 | 0.0496 | 2 | 23 | gamma-aminobutyric acid signaling pathway |
| GO:0043900 | 0.0012 | 7.1284 | 0.8087 | 5 | 375 | regulation of multi-organism process |
| GO:0002688 | 0.0015 | 14.6468 | 0.2286 | 3 | 106 | regulation of leukocyte chemotaxis |
| GO:0006049 | 0.0022 | Inf | 0.0022 | 1 | 1 | UDP-N-acetylglucosamine catabolic process |
| GO:0006051 | 0.0022 | Inf | 0.0022 | 1 | 1 | N-acetylmannosamine metabolic process |
| GO:0048006 | 0.0022 | Inf | 0.0022 | 1 | 1 | antigen processing and presentation, endogenous lipid antigen via MHC class Ib |
| GO:0090122 | 0.0022 | Inf | 0.0022 | 1 | 1 | cholesterol ester hydrolysis involved in cholesterol transport |
| GO:0046651 | 0.0022 | 8.1306 | 0.5542 | 4 | 257 | lymphocyte proliferation |
| GO:0009225 | 0.0023 | 31.6012 | 0.0712 | 2 | 33 | nucleotide-sugar metabolic process |
| GO:0006040 | 0.0024 | 30.6117 | 0.0733 | 2 | 34 | amino sugar metabolic process |
| GO:0030817 | 0.0026 | 12.1505 | 0.2739 | 3 | 127 | regulation of cAMP biosynthetic process |
| GO:0050921 | 0.0026 | 12.0525 | 0.276 | 3 | 128 | positive regulation of chemotaxis |
| GO:0050776 | 0.0026 | 4.3043 | 1.9322 | 7 | 896 | regulation of immune response |
| GO:0007186 | 0.0027 | 3.9189 | 2.5024 | 8 | 1229 | G-protein coupled receptor signaling pathway |
| GO:0070661 | 0.0028 | 7.582 | 0.593 | 4 | 275 | leukocyte proliferation |
| GO:0002521 | 0.0029 | 5.7526 | 0.9941 | 5 | 461 | leukocyte differentiation |
| GO:0043312 | 0.0031 | 5.6757 | 1.0071 | 5 | 467 | neutrophil degranulation |
| GO:0043408 | 0.0032 | 4.7278 | 1.4772 | 6 | 685 | regulation of MAPK cascade |
| GO:0042119 | 0.0034 | 5.5519 | 1.0287 | 5 | 477 | neutrophil activation |
| GO:0071675 | 0.0035 | 25.1064 | 0.0884 | 2 | 41 | regulation of mononuclear cell migration |
| GO:0045055 | 0.0037 | 4.5662 | 1.5268 | 6 | 708 | regulated exocytosis |
| GO:0002337 | 0.0043 | 476.2941 | 0.0043 | 1 | 2 | B-1a B cell differentiation |
| GO:1904808 | 0.0043 | 476.2941 | 0.0043 | 1 | 2 | positive regulation of protein oxidation |
| GO:0030808 | 0.0046 | 9.8297 | 0.3364 | 3 | 156 | regulation of nucleotide biosynthetic process |
| GO:0052652 | 0.0048 | 9.6388 | 0.3429 | 3 | 159 | cyclic purine nucleotide metabolic process |
| GO:0071222 | 0.0052 | 9.3366 | 0.3537 | 3 | 164 | cellular response to lipopolysaccharide |
| GO:0010647 | 0.0054 | 3.2042 | 3.4245 | 9 | 1588 | positive regulation of cell communication |
| GO:0023056 | 0.0055 | 3.1907 | 3.4375 | 9 | 1594 | positive regulation of signaling |
| GO:0030799 | 0.0057 | 9.0525 | 0.3644 | 3 | 169 | regulation of cyclic nucleotide metabolic process |
| GO:0019262 | 0.0065 | 238.1324 | 0.0065 | 1 | 3 | N-acetylneuraminate catabolic process |
| GO:0042330 | 0.0067 | 4.6879 | 1.2098 | 5 | 561 | taxis |
| GO:0050918 | 0.0067 | 17.7851 | 0.1229 | 2 | 57 | positive chemotaxis |
| GO:0045670 | 0.0076 | 16.5752 | 0.1315 | 2 | 61 | regulation of osteoclast differentiation |
| GO:0019220 | 0.0077 | 3.0188 | 3.6121 | 9 | 1675 | regulation of phosphate metabolic process |
| GO:0032940 | 0.0077 | 3.214 | 2.9652 | 8 | 1375 | secretion by cell |
| GO:0071216 | 0.008 | 7.9822 | 0.4119 | 3 | 191 | cellular response to biotic stimulus |
| GO:0002925 | 0.0086 | 158.7451 | 0.0086 | 1 | 4 | positive regulation of humoral immune response mediated by circulating immunoglobulin |
| GO:2000391 | 0.0086 | 158.7451 | 0.0086 | 1 | 4 | positive regulation of neutrophil extravasation |
| GO:0048534 | 0.0088 | 3.7773 | 1.8266 | 6 | 847 | hematopoietic or lymphoid organ development |
| GO:0036230 | 0.0095 | 135.5086 | 0.0095 | 1 | 5 | granulocyte activation |
| GOMFID | Pvalue | OddsRatio | ExpCount | Count | Size | Term |
| GO:0015728 | 7e-04 | Inf | 7e-04 | 1 | 1 | mevalonate transport |
| GO:0051780 | 7e-04 | Inf | 7e-04 | 1 | 1 | behavioral response to nutrient |
| GO:1904155 | 7e-04 | Inf | 7e-04 | 1 | 1 | DN2 thymocyte differentiation |
| GO:1904156 | 7e-04 | Inf | 7e-04 | 1 | 1 | DN3 thymocyte differentiation |
| GO:0021553 | 0.0022 | 737.0909 | 0.0022 | 1 | 3 | olfactory nerve development |
| GO:0035879 | 0.0022 | 737.0909 | 0.0022 | 1 | 3 | plasma membrane lactate transport |
| GO:0048388 | 0.0022 | 737.0909 | 0.0022 | 1 | 3 | endosomal lumen acidification |
| GO:0061368 | 0.0022 | 737.0909 | 0.0022 | 1 | 3 | behavioral response to formalin induced pain |
| GO:0050900 | 0.0029 | 13.0811 | 0.3002 | 3 | 406 | leukocyte migration |
| GO:0030644 | 0.003 | 491.3636 | 0.003 | 1 | 4 | cellular chloride ion homeostasis |
| GO:0046666 | 0.003 | 491.3636 | 0.003 | 1 | 4 | retinal cell programmed cell death |
| GO:0060474 | 0.003 | 491.3636 | 0.003 | 1 | 4 | positive regulation of flagellated sperm motility involved in capacitation |
| GO:0060385 | 0.0037 | 368.5 | 0.0037 | 1 | 5 | axonogenesis involved in innervation |
| GO:0072679 | 0.0037 | 368.5 | 0.0037 | 1 | 5 | thymocyte migration |
| GO:0042110 | 0.0038 | 11.815 | 0.3312 | 3 | 448 | T cell activation |
| GO:0015727 | 0.0044 | 294.7818 | 0.0044 | 1 | 6 | lactate transport |
| GO:0051599 | 0.0044 | 294.7818 | 0.0044 | 1 | 6 | response to hydrostatic pressure |
| GO:0097527 | 0.0044 | 294.7818 | 0.0044 | 1 | 6 | necroptotic signaling pathway |
| GO:0048290 | 0.0052 | 245.6364 | 0.0052 | 1 | 7 | isotype switching to IgA isotypes |
| GO:0002285 | 0.0055 | 21.1395 | 0.1139 | 2 | 154 | lymphocyte activation involved in immune response |
| GO:0050954 | 0.0058 | 20.7265 | 0.1161 | 2 | 157 | sensory perception of mechanical stimulus |
| GO:0002291 | 0.0059 | 210.5325 | 0.0059 | 1 | 8 | T cell activation via T cell receptor contact with antigen bound to MHC molecule on antigen presenting cell |
| GO:0038180 | 0.0059 | 210.5325 | 0.0059 | 1 | 8 | nerve growth factor signaling pathway |
| GO:0071316 | 0.0059 | 210.5325 | 0.0059 | 1 | 8 | cellular response to nicotine |
| GO:0010623 | 0.0061 | 202.5875 | 0.0061 | 1 | 9 | programmed cell death involved in cell development |
| GO:2000510 | 0.0066 | 184.2045 | 0.0067 | 1 | 9 | positive regulation of dendritic cell chemotaxis |
| GO:0045321 | 0.0072 | 6.7531 | 0.8296 | 4 | 1122 | leukocyte activation |
| GO:0045078 | 0.0074 | 163.7273 | 0.0074 | 1 | 10 | positive regulation of interferon-gamma biosynthetic process |
| GO:0050966 | 0.0074 | 163.7273 | 0.0074 | 1 | 10 | detection of mechanical stimulus involved in sensory perception of pain |
| GO:0006955 | 0.0076 | 5.5611 | 1.3686 | 5 | 1851 | immune response |
| GO:0043523 | 0.0081 | 17.333 | 0.1383 | 2 | 187 | regulation of neuron apoptotic process |
| GO:0030002 | 0.0096 | 122.7727 | 0.0096 | 1 | 13 | cellular anion homeostasis |
| GO:0048266 | 0.0096 | 122.7727 | 0.0096 | 1 | 13 | behavioral response to pain |
| GO:0060009 | 0.0096 | 122.7727 | 0.0096 | 1 | 13 | Sertoli cell development |
| GO:0097296 | 0.0096 | 122.7727 | 0.0096 | 1 | 13 | activation of cysteine-type endopeptidase activity involved in apoptotic signaling pathway |
| GOMFID | Pvalue | OddsRatio | ExpCount | Count | Size | Term |
| GO:0032078 | 0.001 | Inf | 0.001 | 1 | 1 | negative regulation of endodeoxyribonuclease activity |
| GO:1900758 | 0.001 | Inf | 0.001 | 1 | 1 | negative regulation of D-amino-acid oxidase activity |
| GO:0048247 | 0.0016 | 38.469 | 0.0608 | 2 | 58 | lymphocyte chemotaxis |
| GO:0002548 | 0.0019 | 35.8956 | 0.0649 | 2 | 62 | monocyte chemotaxis |
| GO:0019075 | 0.0021 | 1013.25 | 0.0021 | 1 | 2 | virus maturation |
| GO:0007032 | 0.0023 | 32.4748 | 0.072 | 2 | 73 | endosome organization |
| GO:0070098 | 0.0031 | 27.5812 | 0.0838 | 2 | 80 | chemokine-mediated signaling pathway |
| GO:0048388 | 0.0031 | 506.5938 | 0.0031 | 1 | 3 | endosomal lumen acidification |
| GO:1900005 | 0.0031 | 506.5938 | 0.0031 | 1 | 3 | positive regulation of serine-type endopeptidase activity |
| GO:1901318 | 0.0031 | 506.5938 | 0.0031 | 1 | 3 | negative regulation of flagellated sperm motility |
| GO:0051341 | 0.0033 | 26.8883 | 0.0859 | 2 | 82 | regulation of oxidoreductase activity |
| GO:0042058 | 0.0035 | 25.9116 | 0.089 | 2 | 85 | regulation of epidermal growth factor receptor signaling pathway |
| GO:0030593 | 0.0037 | 25.0031 | 0.0922 | 2 | 88 | neutrophil chemotaxis |
| GO:0071347 | 0.0039 | 24.4318 | 0.0943 | 2 | 90 | cellular response to interleukin-1 |
| GO:0030644 | 0.0042 | 337.7083 | 0.0042 | 1 | 4 | cellular chloride ion homeostasis |
| GO:0046666 | 0.0042 | 337.7083 | 0.0042 | 1 | 4 | retinal cell programmed cell death |
| GO:2001237 | 0.0047 | 22.1526 | 0.1037 | 2 | 99 | negative regulation of extrinsic apoptotic signaling pathway |
| GO:1903772 | 0.0052 | 253.2656 | 0.0052 | 1 | 5 | regulation of viral budding via host ESCRT complex |
| GO:0051345 | 0.0055 | 6.7483 | 0.7447 | 4 | 711 | positive regulation of hydrolase activity |
| GO:0097527 | 0.0063 | 202.6 | 0.0063 | 1 | 6 | necroptotic signaling pathway |
| GO:0097530 | 0.0071 | 17.8811 | 0.1278 | 2 | 122 | granulocyte migration |
| GO:0032074 | 0.0073 | 168.8229 | 0.0073 | 1 | 7 | negative regulation of nuclease activity |
| GO:0071346 | 0.0092 | 15.5314 | 0.1466 | 2 | 140 | cellular response to interferon-gamma |
| GO:0090281 | 0.0094 | 126.6016 | 0.0094 | 1 | 9 | negative regulation of calcium ion import |
| GOMFID | Pvalue | OddsRatio | ExpCount | Count | Size | Term |
| GO:0000413 | 0 | 60.2571 | 0.0609 | 3 | 38 | protein peptidyl-prolyl isomerization |
| GO:1904240 | 0.0016 | Inf | 0.0016 | 1 | 1 | negative regulation of VCP-NPL4-UFD1 AAA ATPase complex assembly |
| GO:0038195 | 0.0032 | 648.12 | 0.0032 | 1 | 2 | urokinase plasminogen activator signaling pathway |
| GO:1903070 | 0.0048 | 324.04 | 0.0048 | 1 | 3 | negative regulation of ER-associated ubiquitin-dependent protein catabolic process |
| GO:0006457 | 0.0051 | 9.5648 | 0.354 | 3 | 221 | protein folding |
| GO:1903061 | 0.0064 | 216.0133 | 0.0064 | 1 | 4 | positive regulation of protein lipidation |
| GO:0042985 | 0.008 | 162 | 0.008 | 1 | 5 | negative regulation of amyloid precursor protein biosynthetic process |
| GO:2001268 | 0.008 | 162 | 0.008 | 1 | 5 | negative regulation of cysteine-type endopeptidase activity involved in apoptotic signaling pathway |
| GO:1901570 | 0.0083 | 15.9921 | 0.1378 | 2 | 86 | fatty acid derivative biosynthetic process |
| GOMFID | Pvalue | OddsRatio | ExpCount | Count | Size | Term |
| GO:0016810 | 9e-04 | 18.4771 | 0.1902 | 3 | 140 | hydrolase activity, acting on carbon-nitrogen (but not peptide) bonds |
| GO:0061135 | 0.0015 | 15.2216 | 0.2296 | 3 | 169 | endopeptidase regulator activity |
| GO:0030414 | 0.0015 | 15.0385 | 0.2324 | 3 | 171 | peptidase inhibitor activity |
| GO:0004869 | 0.0026 | 29.8426 | 0.0761 | 2 | 56 | cysteine-type endopeptidase inhibitor activity |
| GO:0004053 | 0.0027 | 769.9048 | 0.0027 | 1 | 2 | arginase activity |
| GO:0004991 | 0.0027 | 769.9048 | 0.0027 | 1 | 2 | parathyroid hormone receptor activity |
| GO:0047844 | 0.0041 | 384.9286 | 0.0041 | 1 | 3 | deoxycytidine deaminase activity |
| GO:0008745 | 0.0054 | 256.6032 | 0.0054 | 1 | 4 | N-acetylmuramoyl-L-alanine amidase activity |
| GO:0004459 | 0.0068 | 192.4405 | 0.0068 | 1 | 5 | L-lactate dehydrogenase activity |
| GO:0016019 | 0.0068 | 192.4405 | 0.0068 | 1 | 5 | peptidoglycan receptor activity |
| GO:0042289 | 0.0081 | 153.9429 | 0.0082 | 1 | 6 | MHC class II protein binding |
| GOMFID | Pvalue | OddsRatio | ExpCount | Count | Size | Term |
| GO:0016810 | 0.0011 | 16.7153 | 0.2075 | 3 | 140 | hydrolase activity, acting on carbon-nitrogen (but not peptide) bonds |
| GO:0061135 | 0.0019 | 13.7702 | 0.2505 | 3 | 169 | endopeptidase regulator activity |
| GO:0030414 | 0.002 | 13.6046 | 0.2535 | 3 | 171 | peptidase inhibitor activity |
| GO:0004053 | 0.003 | 702.8696 | 0.003 | 1 | 2 | arginase activity |
| GO:0004991 | 0.003 | 702.8696 | 0.003 | 1 | 2 | parathyroid hormone receptor activity |
| GO:0004869 | 0.0031 | 27.1263 | 0.083 | 2 | 56 | cysteine-type endopeptidase inhibitor activity |
| GO:0047844 | 0.0044 | 351.413 | 0.0044 | 1 | 3 | deoxycytidine deaminase activity |
| GO:0008745 | 0.0059 | 234.2609 | 0.0059 | 1 | 4 | N-acetylmuramoyl-L-alanine amidase activity |
| GO:0004459 | 0.0074 | 175.6848 | 0.0074 | 1 | 5 | L-lactate dehydrogenase activity |
| GO:0016019 | 0.0074 | 175.6848 | 0.0074 | 1 | 5 | peptidoglycan receptor activity |
| GO:0042289 | 0.0089 | 140.5391 | 0.0089 | 1 | 6 | MHC class II protein binding |
| GOMFID | Pvalue | OddsRatio | ExpCount | Count | Size | Term |
| GO:0003727 | 3e-04 | 25.18 | 0.1371 | 3 | 74 | single-stranded RNA binding |
| GO:0000334 | 0.0019 | Inf | 0.0019 | 1 | 1 | 3-hydroxyanthranilate 3,4-dioxygenase activity |
| GO:0016504 | 0.002 | 33.8803 | 0.0667 | 2 | 36 | peptidase activator activity |
| GO:0008134 | 0.0021 | 6.2904 | 0.932 | 5 | 503 | transcription factor binding |
| GO:0000253 | 0.0074 | 185.7241 | 0.0074 | 1 | 4 | 3-keto sterol reductase activity |
| GO:0044323 | 0.0074 | 185.7241 | 0.0074 | 1 | 4 | retinoic acid-responsive element binding |
| GOMFID | Pvalue | OddsRatio | ExpCount | Count | Size | Term |
| GO:0003727 | 0.0058 | 19.4372 | 0.1143 | 2 | 74 | single-stranded RNA binding |
| GO:0044323 | 0.0062 | 224.4861 | 0.0062 | 1 | 4 | retinoic acid-responsive element binding |
| GO:0008047 | 0.0065 | 6.1065 | 0.7612 | 4 | 493 | enzyme activator activity |
| GO:0004111 | 0.0092 | 134.675 | 0.0093 | 1 | 6 | creatine kinase activity |
| GO:0004308 | 0.0092 | 134.675 | 0.0093 | 1 | 6 | exo-alpha-sialidase activity |
| GO:0061133 | 0.0092 | 134.675 | 0.0093 | 1 | 6 | endopeptidase activator activity |
| GOMFID | Pvalue | OddsRatio | ExpCount | Count | Size | Term |
| GO:0005102 | 2e-04 | 12.2553 | 0.9844 | 6 | 1449 | receptor binding |
| GO:0004872 | 2e-04 | 11.8924 | 1.0116 | 6 | 1489 | receptor activity |
| GO:0004888 | 6e-04 | 10.6909 | 0.7983 | 5 | 1175 | transmembrane signaling receptor activity |
| GO:0005129 | 7e-04 | Inf | 7e-04 | 1 | 1 | granulocyte macrophage colony-stimulating factor receptor binding |
| GO:0010465 | 0.0014 | 1617.9 | 0.0014 | 1 | 2 | nerve growth factor receptor activity |
| GO:0004971 | 0.002 | 808.9 | 0.002 | 1 | 3 | AMPA glutamate receptor activity |
| GO:0005166 | 0.002 | 808.9 | 0.002 | 1 | 3 | neurotrophin p75 receptor binding |
| GO:0099583 | 0.002 | 808.9 | 0.002 | 1 | 3 | neurotransmitter receptor activity involved in regulation of postsynaptic cytosolic calcium ion concentration |
| GO:0004871 | 0.0025 | 7.7004 | 1.0768 | 5 | 1585 | signal transducer activity |
| GO:0048406 | 0.0041 | 323.5 | 0.0041 | 1 | 6 | nerve growth factor binding |
| GO:0005004 | 0.0047 | 269.5667 | 0.0048 | 1 | 7 | GPI-linked ephrin receptor activity |
| GO:0004713 | 0.0059 | 20.6822 | 0.1182 | 2 | 174 | protein tyrosine kinase activity |
| GO:0019957 | 0.0061 | 202.15 | 0.0061 | 1 | 9 | C-C chemokine binding |
| GO:0016493 | 0.0081 | 146.9909 | 0.0082 | 1 | 12 | C-C chemokine receptor activity |
| GO:0005125 | 0.009 | 16.5794 | 0.1467 | 2 | 216 | cytokine activity |
| GOMFID | Pvalue | OddsRatio | ExpCount | Count | Size | Term |
| GO:0000979 | 1e-04 | 39.6522 | 0.0899 | 3 | 56 | RNA polymerase II core promoter sequence-specific DNA binding |
| GO:0001047 | 0.0021 | 13.2144 | 0.2585 | 3 | 161 | core promoter binding |
| GO:0001012 | 0.0022 | 6.3187 | 0.9507 | 5 | 592 | RNA polymerase II regulatory region DNA binding |
| GO:0000976 | 0.0038 | 5.5496 | 1.0759 | 5 | 670 | transcription regulatory region sequence-specific DNA binding |
| GO:0043565 | 0.0042 | 4.5985 | 1.5994 | 6 | 996 | sequence-specific DNA binding |
| GO:0000981 | 0.0057 | 5.0342 | 1.1803 | 5 | 735 | RNA polymerase II transcription factor activity, sequence-specific DNA binding |
| GO:0010385 | 0.0064 | 215.4933 | 0.0064 | 1 | 4 | double-stranded methylated DNA binding |
| GO:0044323 | 0.0064 | 215.4933 | 0.0064 | 1 | 4 | retinoic acid-responsive element binding |
| GO:0008270 | 0.0068 | 4.8128 | 1.2317 | 5 | 767 | zinc ion binding |
| GO:0000975 | 0.0088 | 4.5018 | 1.312 | 5 | 817 | regulatory region DNA binding |
| GOMFID | Pvalue | OddsRatio | ExpCount | Count | Size | Term |
| GO:0008502 | 0 | Inf | 0.0042 | 2 | 2 | melatonin receptor activity |
| GO:0008843 | 0.0021 | Inf | 0.0021 | 1 | 1 | endochitinase activity |
| GO:0033798 | 0.0021 | Inf | 0.0021 | 1 | 1 | thyroxine 5-deiodinase activity |
| GO:0015459 | 0.0042 | 22.8878 | 0.0966 | 2 | 46 | potassium channel regulator activity |
| GO:0036461 | 0.0042 | 489.5758 | 0.0042 | 1 | 2 | BLOC-2 complex binding |
| GO:0042284 | 0.0042 | 489.5758 | 0.0042 | 1 | 2 | sphingolipid delta-4 desaturase activity |
| GO:0004800 | 0.0063 | 244.7727 | 0.0063 | 1 | 3 | thyroxine 5'-deiodinase activity |
| GO:0035651 | 0.0063 | 244.7727 | 0.0063 | 1 | 3 | AP-3 adaptor complex binding |
| GO:0035650 | 0.0084 | 163.1717 | 0.0084 | 1 | 4 | AP-1 adaptor complex binding |
| GO:0008236 | 0.0088 | 7.6822 | 0.4284 | 3 | 204 | serine-type peptidase activity |
| GOMFID | Pvalue | OddsRatio | ExpCount | Count | Size | Term |
| GO:0032394 | 0 | Inf | 0.0031 | 2 | 2 | MHC class Ib receptor activity |
| GO:0042288 | 0 | 146.8273 | 0.0278 | 3 | 18 | MHC class I protein binding |
| GO:0048020 | 0.0016 | 37.906 | 0.0602 | 2 | 39 | CCR chemokine receptor binding |
| GO:0008009 | 0.0025 | 30.4726 | 0.0741 | 2 | 48 | chemokine activity |
| GO:0004252 | 0.0025 | 12.5329 | 0.2733 | 3 | 177 | serine-type endopeptidase activity |
| GO:0005171 | 0.0031 | 673.5417 | 0.0031 | 1 | 2 | hepatocyte growth factor receptor binding |
| GO:0046556 | 0.0031 | 673.5417 | 0.0031 | 1 | 2 | alpha-L-arabinofuranosidase activity |
| GO:0017171 | 0.004 | 10.5649 | 0.3227 | 3 | 209 | serine hydrolase activity |
| GO:0004663 | 0.0046 | 336.75 | 0.0046 | 1 | 3 | Rab geranylgeranyltransferase activity |
| GO:0030246 | 0.0073 | 8.4413 | 0.4015 | 3 | 260 | carbohydrate binding |
| GO:0004046 | 0.0077 | 168.3542 | 0.0077 | 1 | 5 | aminoacylase activity |
| GO:0005096 | 0.008 | 8.12 | 0.4169 | 3 | 270 | GTPase activator activity |
| GO:0008318 | 0.0092 | 134.675 | 0.0093 | 1 | 6 | protein prenyltransferase activity |
| GO:0016427 | 0.0092 | 134.675 | 0.0093 | 1 | 6 | tRNA (cytosine) methyltransferase activity |
| GOMFID | Pvalue | OddsRatio | ExpCount | Count | Size | Term |
| GO:0004744 | 0.0016 | Inf | 0.0016 | 1 | 1 | retinal isomerase activity |
| GO:0036487 | 0.0016 | Inf | 0.0016 | 1 | 1 | nitric-oxide synthase inhibitor activity |
| GO:0052884 | 0.0016 | Inf | 0.0016 | 1 | 1 | all-trans-retinyl-palmitate hydrolase, 11-cis retinol forming activity |
| GO:0052885 | 0.0016 | Inf | 0.0016 | 1 | 1 | all-trans-retinyl-ester hydrolase, 11-cis retinol forming activity |
| GO:0046976 | 0.008 | 161.61 | 0.008 | 1 | 5 | histone methyltransferase activity (H3-K27 specific) |
| GOMFID | Pvalue | OddsRatio | ExpCount | Count | Size | Term |
| GO:0004667 | 0.0031 | 673.5417 | 0.0031 | 1 | 2 | prostaglandin-D synthase activity |
| GO:0004947 | 0.0031 | 673.5417 | 0.0031 | 1 | 2 | bradykinin receptor activity |
| GO:0045029 | 0.0031 | 673.5417 | 0.0031 | 1 | 2 | UDP-activated nucleotide receptor activity |
| GO:0071553 | 0.0031 | 673.5417 | 0.0031 | 1 | 2 | G-protein coupled pyrimidinergic nucleotide receptor activity |
| GO:0004165 | 0.0046 | 336.75 | 0.0046 | 1 | 3 | dodecenoyl-CoA delta-isomerase activity |
| GO:0016508 | 0.0046 | 336.75 | 0.0046 | 1 | 3 | long-chain-enoyl-CoA hydratase activity |
| GO:0032947 | 0.005 | 20.8942 | 0.1065 | 2 | 69 | protein complex scaffold activity |
| GO:0035594 | 0.0062 | 224.4861 | 0.0062 | 1 | 4 | ganglioside binding |
| GO:0051425 | 0.0062 | 224.4861 | 0.0062 | 1 | 4 | PTB domain binding |
| GO:0019534 | 0.0077 | 168.3542 | 0.0077 | 1 | 5 | toxin transmembrane transporter activity |
| GO:0016427 | 0.0092 | 134.675 | 0.0093 | 1 | 6 | tRNA (cytosine) methyltransferase activity |
| GOMFID | Pvalue | OddsRatio | ExpCount | Count | Size | Term |
| GO:0032089 | 0.003 | 702.8696 | 0.003 | 1 | 2 | NACHT domain binding |
| GO:0051425 | 0.0059 | 234.2609 | 0.0059 | 1 | 4 | PTB domain binding |
| GO:0016427 | 0.0089 | 140.5391 | 0.0089 | 1 | 6 | tRNA (cytosine) methyltransferase activity |
| GOMFID | Pvalue | OddsRatio | ExpCount | Count | Size | Term |
| GO:0005509 | 0.0011 | 5.9372 | 1.221 | 6 | 659 | calcium ion binding |
| GO:0004693 | 0.0014 | 41.1556 | 0.0556 | 2 | 30 | cyclin-dependent protein serine/threonine kinase activity |
| GO:0046523 | 0.0019 | Inf | 0.0019 | 1 | 1 | S-methyl-5-thioribose-1-phosphate isomerase activity |
| GO:0030354 | 0.0037 | 557.2414 | 0.0037 | 1 | 2 | melanin-concentrating hormone activity |
| GO:0004980 | 0.0055 | 278.6034 | 0.0056 | 1 | 3 | melanocyte-stimulating hormone receptor activity |
| GOMFID | Pvalue | OddsRatio | ExpCount | Count | Size | Term |
| GO:0008009 | 1e-04 | 41.3256 | 0.086 | 3 | 48 | chemokine activity |
| GO:0004872 | 2e-04 | 5.2251 | 2.667 | 10 | 1489 | receptor activity |
| GO:0004435 | 0.0011 | 47.8133 | 0.0484 | 2 | 27 | phosphatidylinositol phospholipase C activity |
| GO:0005126 | 0.0012 | 9.8242 | 0.4711 | 4 | 263 | cytokine receptor binding |
| GO:0048020 | 0.0016 | 38.7644 | 0.0588 | 2 | 34 | CCR chemokine receptor binding |
| GO:0003827 | 0.0018 | Inf | 0.0018 | 1 | 1 | alpha-1,3-mannosylglycoprotein 2-beta-N-acetylglucosaminyltransferase activity |
| GO:0035717 | 0.0018 | Inf | 0.0018 | 1 | 1 | chemokine (C-C motif) ligand 7 binding |
| GO:0045127 | 0.0018 | Inf | 0.0018 | 1 | 1 | N-acetylglucosamine kinase activity |
| GO:0071791 | 0.0036 | 577.1786 | 0.0036 | 1 | 2 | chemokine (C-C motif) ligand 5 binding |
| GO:0001730 | 0.0054 | 288.5714 | 0.0054 | 1 | 3 | 2'-5'-oligoadenylate synthetase activity |
| GO:0004965 | 0.0054 | 288.5714 | 0.0054 | 1 | 3 | G-protein coupled GABA receptor activity |
| GO:0005124 | 0.0054 | 288.5714 | 0.0054 | 1 | 3 | scavenger receptor binding |
| GO:0047374 | 0.0054 | 288.5714 | 0.0054 | 1 | 3 | methylumbelliferyl-acetate deacetylase activity |
| GO:0004698 | 0.0071 | 192.369 | 0.0072 | 1 | 4 | calcium-dependent protein kinase C activity |
| GO:0004771 | 0.0071 | 192.369 | 0.0072 | 1 | 4 | sterol esterase activity |
| GO:0004982 | 0.0071 | 192.369 | 0.0072 | 1 | 4 | N-formyl peptide receptor activity |
| GO:0048018 | 0.0078 | 5.7038 | 0.797 | 4 | 445 | receptor ligand activity |
| GO:0030883 | 0.0089 | 144.2679 | 0.009 | 1 | 5 | endogenous lipid antigen binding |
| GO:0030884 | 0.0089 | 144.2679 | 0.009 | 1 | 5 | exogenous lipid antigen binding |
| GO:0031726 | 0.0089 | 144.2679 | 0.009 | 1 | 5 | CCR1 chemokine receptor binding |
| GOMFID | Pvalue | OddsRatio | ExpCount | Count | Size | Term |
| GO:0004872 | 1e-04 | 5.4635 | 2.8509 | 11 | 1489 | receptor activity |
| GO:0008009 | 1e-04 | 38.369 | 0.0919 | 3 | 48 | chemokine activity |
| GO:0004435 | 0.0012 | 44.5103 | 0.0517 | 2 | 27 | phosphatidylinositol phospholipase C activity |
| GO:0030246 | 0.0015 | 9.2037 | 0.4978 | 4 | 260 | carbohydrate binding |
| GO:0005126 | 0.0015 | 9.0954 | 0.5036 | 4 | 263 | cytokine receptor binding |
| GO:0048020 | 0.0018 | 35.9911 | 0.063 | 2 | 34 | CCR chemokine receptor binding |
| GO:0003827 | 0.0019 | Inf | 0.0019 | 1 | 1 | alpha-1,3-mannosylglycoprotein 2-beta-N-acetylglucosaminyltransferase activity |
| GO:0035717 | 0.0019 | Inf | 0.0019 | 1 | 1 | chemokine (C-C motif) ligand 7 binding |
| GO:0045127 | 0.0019 | Inf | 0.0019 | 1 | 1 | N-acetylglucosamine kinase activity |
| GO:0004871 | 0.0022 | 3.7856 | 3.0347 | 9 | 1585 | signal transducer activity |
| GO:0071791 | 0.0038 | 538.6333 | 0.0038 | 1 | 2 | chemokine (C-C motif) ligand 5 binding |
| GO:0001730 | 0.0057 | 269.3 | 0.0057 | 1 | 3 | 2'-5'-oligoadenylate synthetase activity |
| GO:0004965 | 0.0057 | 269.3 | 0.0057 | 1 | 3 | G-protein coupled GABA receptor activity |
| GO:0005124 | 0.0057 | 269.3 | 0.0057 | 1 | 3 | scavenger receptor binding |
| GO:0047374 | 0.0057 | 269.3 | 0.0057 | 1 | 3 | methylumbelliferyl-acetate deacetylase activity |
| GO:0004888 | 0.0058 | 3.7437 | 2.2497 | 7 | 1175 | transmembrane signaling receptor activity |
| GO:0004698 | 0.0076 | 179.5222 | 0.0077 | 1 | 4 | calcium-dependent protein kinase C activity |
| GO:0004771 | 0.0076 | 179.5222 | 0.0077 | 1 | 4 | sterol esterase activity |
| GO:0004982 | 0.0076 | 179.5222 | 0.0077 | 1 | 4 | N-formyl peptide receptor activity |
| GO:0019863 | 0.0095 | 134.6333 | 0.0096 | 1 | 5 | IgE binding |
| GO:0030883 | 0.0095 | 134.6333 | 0.0096 | 1 | 5 | endogenous lipid antigen binding |
| GO:0030884 | 0.0095 | 134.6333 | 0.0096 | 1 | 5 | exogenous lipid antigen binding |
| GO:0031726 | 0.0095 | 134.6333 | 0.0096 | 1 | 5 | CCR1 chemokine receptor binding |
| GO:0048018 | 0.0098 | 5.2806 | 0.852 | 4 | 445 | receptor ligand activity |
| GOMFID | Pvalue | OddsRatio | ExpCount | Count | Size | Term |
| GO:0008009 | 1e-04 | 44.775 | 0.08 | 3 | 48 | chemokine activity |
| GO:0008061 | 1e-04 | 215.44 | 0.0133 | 2 | 8 | chitin binding |
| GO:0001664 | 8e-04 | 10.8935 | 0.4302 | 4 | 258 | G-protein coupled receptor binding |
| GO:0048020 | 8e-04 | 53.9431 | 0.0433 | 2 | 28 | CCR chemokine receptor binding |
| GO:0005126 | 9e-04 | 10.6799 | 0.4386 | 4 | 263 | cytokine receptor binding |
| GO:0008843 | 0.0017 | Inf | 0.0017 | 1 | 1 | endochitinase activity |
| GO:0036470 | 0.0017 | Inf | 0.0017 | 1 | 1 | tyrosine 3-monooxygenase activator activity |
| GO:0036478 | 0.0017 | Inf | 0.0017 | 1 | 1 | L-dopa decarboxylase activator activity |
| GO:0036524 | 0.0017 | Inf | 0.0017 | 1 | 1 | protein deglycase activity |
| GO:0045340 | 0.0017 | Inf | 0.0017 | 1 | 1 | mercury ion binding |
| GO:0016532 | 0.0033 | 621.6538 | 0.0033 | 1 | 2 | superoxide dismutase copper chaperone activity |
| GO:0031731 | 0.005 | 310.8077 | 0.005 | 1 | 3 | CCR6 chemokine receptor binding |
| GO:0047894 | 0.005 | 310.8077 | 0.005 | 1 | 3 | flavonol 3-sulfotransferase activity |
| GO:1903135 | 0.005 | 310.8077 | 0.005 | 1 | 3 | cupric ion binding |
| GO:0004568 | 0.0064 | 215.48 | 0.0064 | 1 | 4 | chitinase activity |
| GO:0004583 | 0.0067 | 207.1923 | 0.0067 | 1 | 4 | dolichyl-phosphate-glucose-glycolipid alpha-glucosyltransferase activity |
| GO:0004698 | 0.0067 | 207.1923 | 0.0067 | 1 | 4 | calcium-dependent protein kinase C activity |
| GO:0050294 | 0.0067 | 207.1923 | 0.0067 | 1 | 4 | steroid sulfotransferase activity |
| GO:0016530 | 0.0083 | 155.3846 | 0.0083 | 1 | 5 | metallochaperone activity |
| GO:0031726 | 0.0083 | 155.3846 | 0.0083 | 1 | 5 | CCR1 chemokine receptor binding |
| GO:0032184 | 0.0083 | 155.3846 | 0.0083 | 1 | 5 | SUMO polymer binding |
| GO:0044388 | 0.0083 | 155.3846 | 0.0083 | 1 | 5 | small protein activating enzyme binding |
| GO:1903136 | 0.0083 | 155.3846 | 0.0083 | 1 | 5 | cuprous ion binding |
| GO:0031730 | 0.01 | 124.3 | 0.01 | 1 | 6 | CCR5 chemokine receptor binding |
| GOMFID | Pvalue | OddsRatio | ExpCount | Count | Size | Term |
| GO:0036470 | 0.0014 | Inf | 0.0014 | 1 | 1 | tyrosine 3-monooxygenase activator activity |
| GO:0036478 | 0.0014 | Inf | 0.0014 | 1 | 1 | L-dopa decarboxylase activator activity |
| GO:0036524 | 0.0014 | Inf | 0.0014 | 1 | 1 | protein deglycase activity |
| GO:0045340 | 0.0014 | Inf | 0.0014 | 1 | 1 | mercury ion binding |
| GO:0016532 | 0.0028 | 734.8636 | 0.0028 | 1 | 2 | superoxide dismutase copper chaperone activity |
| GO:1903135 | 0.0043 | 367.4091 | 0.0043 | 1 | 3 | cupric ion binding |
| GO:0004583 | 0.0057 | 244.9242 | 0.0057 | 1 | 4 | dolichyl-phosphate-glucose-glycolipid alpha-glucosyltransferase activity |
| GO:0016530 | 0.0071 | 183.6818 | 0.0071 | 1 | 5 | metallochaperone activity |
| GO:0044388 | 0.0071 | 183.6818 | 0.0071 | 1 | 5 | small protein activating enzyme binding |
| GO:1903136 | 0.0071 | 183.6818 | 0.0071 | 1 | 5 | cuprous ion binding |
| GO:0051920 | 0.0099 | 122.4394 | 0.0099 | 1 | 7 | peroxiredoxin activity |
| GOMFID | Pvalue | OddsRatio | ExpCount | Count | Size | Term |
| GO:0001637 | 1e-04 | 140.487 | 0.0185 | 2 | 25 | G-protein coupled chemoattractant receptor activity |
| GO:0070095 | 0.0015 | 1470.7273 | 0.0015 | 1 | 2 | fructose-6-phosphate binding |
| GO:0071791 | 0.0015 | 1470.7273 | 0.0015 | 1 | 2 | chemokine (C-C motif) ligand 5 binding |
| GO:0004896 | 0.0017 | 39.7481 | 0.0615 | 2 | 83 | cytokine receptor activity |
| GO:0031781 | 0.003 | 490.1818 | 0.003 | 1 | 4 | type 3 melanocortin receptor binding |
| GO:0031782 | 0.003 | 490.1818 | 0.003 | 1 | 4 | type 4 melanocortin receptor binding |
| GO:0001653 | 0.0036 | 26.5421 | 0.0912 | 2 | 123 | peptide receptor activity |
| GO:0016494 | 0.0052 | 245.0455 | 0.0052 | 1 | 7 | C-X-C chemokine receptor activity |
| GO:0030215 | 0.0074 | 163.3333 | 0.0074 | 1 | 10 | semaphorin receptor binding |
| GO:0016493 | 0.0089 | 133.6198 | 0.0089 | 1 | 12 | C-C chemokine receptor activity |
| GOMFID | Pvalue | OddsRatio | ExpCount | Count | Size | Term |
| GO:0015130 | 7e-04 | Inf | 7e-04 | 1 | 1 | mevalonate transmembrane transporter activity |
| GO:0010465 | 0.0015 | 1470.7273 | 0.0015 | 1 | 2 | nerve growth factor receptor activity |
| GO:0045523 | 0.0015 | 1470.7273 | 0.0015 | 1 | 2 | interleukin-27 receptor binding |
| GO:0004896 | 0.0017 | 39.7481 | 0.0615 | 2 | 83 | cytokine receptor activity |
| GO:0005166 | 0.0022 | 735.3182 | 0.0022 | 1 | 3 | neurotrophin p75 receptor binding |
| GO:0030369 | 0.0022 | 735.3182 | 0.0022 | 1 | 3 | ICAM-3 receptor activity |
| GO:0015129 | 0.0037 | 367.6136 | 0.0037 | 1 | 5 | lactate transmembrane transporter activity |
| GO:0048406 | 0.0044 | 294.0727 | 0.0044 | 1 | 6 | nerve growth factor binding |
| GO:0005004 | 0.0052 | 245.0455 | 0.0052 | 1 | 7 | GPI-linked ephrin receptor activity |
| GO:0004065 | 0.0059 | 210.026 | 0.0059 | 1 | 8 | arylsulfatase activity |
| GO:0019957 | 0.0067 | 183.7614 | 0.0067 | 1 | 9 | C-C chemokine binding |
| GO:0016493 | 0.0089 | 133.6198 | 0.0089 | 1 | 12 | C-C chemokine receptor activity |
| GO:0099600 | 0.0097 | 6.158 | 0.9035 | 4 | 1219 | transmembrane receptor activity |
| GOMFID | Pvalue | OddsRatio | ExpCount | Count | Size | Term |
| GO:0001227 | 4e-04 | 12.9011 | 0.3652 | 4 | 219 | transcriptional repressor activity, RNA polymerase II transcription regulatory region sequence-specific binding |
| GO:0005307 | 0.0017 | Inf | 0.0017 | 1 | 1 | choline:sodium symporter activity |
| GO:0036313 | 0.0033 | 621.6538 | 0.0033 | 1 | 2 | phosphatidylinositol 3-kinase catalytic subunit binding |
| GO:0033829 | 0.005 | 310.8077 | 0.005 | 1 | 3 | O-fucosylpeptide 3-beta-N-acetylglucosaminyltransferase activity |
| GO:0004095 | 0.0067 | 207.1923 | 0.0067 | 1 | 4 | carnitine O-palmitoyltransferase activity |
| GO:0033265 | 0.0067 | 207.1923 | 0.0067 | 1 | 4 | choline binding |
| GO:0008013 | 0.0067 | 17.88 | 0.1234 | 2 | 74 | beta-catenin binding |
| GO:0005134 | 0.0083 | 155.3846 | 0.0083 | 1 | 5 | interleukin-2 receptor binding |
| GO:0001158 | 0.0094 | 14.9563 | 0.1467 | 2 | 88 | enhancer sequence-specific DNA binding |
| NA. |
| n/a |
| GOMFID | Pvalue | OddsRatio | ExpCount | Count | Size | Term |
| GO:0048020 | 5e-04 | 72.7027 | 0.0337 | 2 | 39 | CCR chemokine receptor binding |
| GO:0008009 | 8e-04 | 58.4457 | 0.0415 | 2 | 48 | chemokine activity |
| GO:0005126 | 0.0014 | 16.6962 | 0.2274 | 3 | 263 | cytokine receptor binding |
| GO:0048018 | 0.006 | 9.709 | 0.3848 | 3 | 445 | receptor ligand activity |
| GO:0015467 | 0.0086 | 138.188 | 0.0086 | 1 | 10 | G-protein activated inward rectifier potassium channel activity |
| GO:0039706 | 0.0086 | 138.188 | 0.0086 | 1 | 10 | co-receptor binding |
| GOMFID | Pvalue | OddsRatio | ExpCount | Count | Size | Term |
| GO:0001965 | 3e-04 | 100.0186 | 0.0246 | 2 | 19 | G-protein alpha-subunit binding |
| GO:0033829 | 0.0039 | 404.2 | 0.0039 | 1 | 3 | O-fucosylpeptide 3-beta-N-acetylglucosaminyltransferase activity |
| GOMFID | Pvalue | OddsRatio | ExpCount | Count | Size | Term |
| GO:0004033 | 2e-04 | 108.0468 | 0.0232 | 2 | 25 | aldo-keto reductase (NADP) activity |
| GO:0018455 | 9e-04 | Inf | 9e-04 | 1 | 1 | alcohol dehydrogenase [NAD(P)+] activity |
| GO:0047042 | 9e-04 | Inf | 9e-04 | 1 | 1 | androsterone dehydrogenase (B-specific) activity |
| GO:0016655 | 0.001 | 51.6923 | 0.0463 | 2 | 50 | oxidoreductase activity, acting on NAD(P)H, quinone or similar compound as acceptor |
| GO:0047006 | 0.0019 | 1155.3571 | 0.0019 | 1 | 2 | 17-alpha,20-alpha-dihydroxypregn-4-en-3-one dehydrogenase activity |
| GO:0018636 | 0.0028 | 577.6429 | 0.0028 | 1 | 3 | phenanthrene 9,10-monooxygenase activity |
| GO:0035662 | 0.0028 | 577.6429 | 0.0028 | 1 | 3 | Toll-like receptor 4 binding |
| GO:0047086 | 0.0028 | 577.6429 | 0.0028 | 1 | 3 | ketosteroid monooxygenase activity |
| GO:0047718 | 0.0028 | 577.6429 | 0.0028 | 1 | 3 | indanol dehydrogenase activity |
| GO:0047844 | 0.0028 | 577.6429 | 0.0028 | 1 | 3 | deoxycytidine deaminase activity |
| GO:0000253 | 0.0037 | 385.0714 | 0.0037 | 1 | 4 | 3-keto sterol reductase activity |
| GO:0004090 | 0.0037 | 385.0714 | 0.0037 | 1 | 4 | carbonyl reductase (NADPH) activity |
| GO:0008745 | 0.0037 | 385.0714 | 0.0037 | 1 | 4 | N-acetylmuramoyl-L-alanine amidase activity |
| GO:0047115 | 0.0037 | 385.0714 | 0.0037 | 1 | 4 | trans-1,2-dihydrobenzene-1,2-diol dehydrogenase activity |
| GO:0008270 | 0.0045 | 7.3456 | 0.7106 | 4 | 767 | zinc ion binding |
| GO:0016019 | 0.0046 | 288.7857 | 0.0046 | 1 | 5 | peptidoglycan receptor activity |
| GO:0050544 | 0.0046 | 288.7857 | 0.0046 | 1 | 5 | arachidonic acid binding |
| GO:0016614 | 0.0063 | 19.2885 | 0.1204 | 2 | 130 | oxidoreductase activity, acting on CH-OH group of donors |
| GO:0004032 | 0.0065 | 192.5 | 0.0065 | 1 | 7 | alditol:NADP+ 1-oxidoreductase activity |
| GO:0016810 | 0.0072 | 17.8796 | 0.1297 | 2 | 140 | hydrolase activity, acting on carbon-nitrogen (but not peptide) bonds |
| GO:0004126 | 0.0074 | 164.9898 | 0.0074 | 1 | 8 | cytidine deaminase activity |
| GO:0032052 | 0.0083 | 144.3571 | 0.0083 | 1 | 9 | bile acid binding |
| GO:0052650 | 0.0083 | 144.3571 | 0.0083 | 1 | 9 | NADP-retinol dehydrogenase activity |
| GO:0070700 | 0.0083 | 144.3571 | 0.0083 | 1 | 9 | BMP receptor binding |
| GOMFID | Pvalue | OddsRatio | ExpCount | Count | Size | Term |
| GO:0003755 | 0 | 55.296 | 0.0657 | 3 | 38 | peptidyl-prolyl cis-trans isomerase activity |
| GO:0030377 | 0.0017 | Inf | 0.0017 | 1 | 1 | urokinase plasminogen activator receptor activity |
| GO:0102339 | 0.0017 | Inf | 0.0017 | 1 | 1 | 3-oxo-arachidoyl-CoA reductase activity |
| GO:0102340 | 0.0017 | Inf | 0.0017 | 1 | 1 | 3-oxo-behenoyl-CoA reductase activity |
| GO:0102341 | 0.0017 | Inf | 0.0017 | 1 | 1 | 3-oxo-lignoceroyl-CoA reductase activity |
| GO:0102342 | 0.0017 | Inf | 0.0017 | 1 | 1 | 3-oxo-cerotoyl-CoA reductase activity |
| GO:0016853 | 0.0018 | 13.8337 | 0.2456 | 3 | 142 | isomerase activity |
| GO:0004666 | 0.0035 | 598.5926 | 0.0035 | 1 | 2 | prostaglandin-endoperoxide synthase activity |
| GO:0016509 | 0.0052 | 299.2778 | 0.0052 | 1 | 3 | long-chain-3-hydroxyacyl-CoA dehydrogenase activity |
| GOMFID | Pvalue | OddsRatio | ExpCount | Count | Size | Term |
| GO:0033862 | 0.0023 | Inf | 0.0023 | 1 | 1 | UMP kinase activity |
| GO:0035717 | 0.0023 | Inf | 0.0023 | 1 | 1 | chemokine (C-C motif) ligand 7 binding |
| GO:0047730 | 0.0023 | Inf | 0.0023 | 1 | 1 | carnosine synthase activity |
| GO:0102102 | 0.0023 | Inf | 0.0023 | 1 | 1 | homocarnosine synthase activity |
| GO:0102339 | 0.0023 | Inf | 0.0023 | 1 | 1 | 3-oxo-arachidoyl-CoA reductase activity |
| GO:0102340 | 0.0023 | Inf | 0.0023 | 1 | 1 | 3-oxo-behenoyl-CoA reductase activity |
| GO:0102341 | 0.0023 | Inf | 0.0023 | 1 | 1 | 3-oxo-lignoceroyl-CoA reductase activity |
| GO:0102342 | 0.0023 | Inf | 0.0023 | 1 | 1 | 3-oxo-cerotoyl-CoA reductase activity |
| GO:0004666 | 0.0047 | 436.5405 | 0.0047 | 1 | 2 | prostaglandin-endoperoxide synthase activity |
| GO:0004798 | 0.0047 | 436.5405 | 0.0047 | 1 | 2 | thymidylate kinase activity |
| GO:0047057 | 0.0047 | 436.5405 | 0.0047 | 1 | 2 | vitamin-K-epoxide reductase (warfarin-sensitive) activity |
| GO:0071791 | 0.0047 | 436.5405 | 0.0047 | 1 | 2 | chemokine (C-C motif) ligand 5 binding |
| GO:0004829 | 0.007 | 218.2568 | 0.007 | 1 | 3 | threonine-tRNA ligase activity |
| GO:0016509 | 0.007 | 218.2568 | 0.007 | 1 | 3 | long-chain-3-hydroxyacyl-CoA dehydrogenase activity |
| GO:0004127 | 0.0094 | 145.4955 | 0.0094 | 1 | 4 | cytidylate kinase activity |
| GO:1905394 | 0.0094 | 145.4955 | 0.0094 | 1 | 4 | retromer complex binding |
| GOMFID | Pvalue | OddsRatio | ExpCount | Count | Size | Term |
| GO:0032394 | 0 | Inf | 0.0052 | 2 | 2 | MHC class Ib receptor activity |
| GO:0042288 | 0.001 | 50.4156 | 0.0467 | 2 | 18 | MHC class I protein binding |
| GO:0031855 | 0.0026 | Inf | 0.0026 | 1 | 1 | oxytocin receptor binding |
| GO:0033897 | 0.0026 | Inf | 0.0026 | 1 | 1 | ribonuclease T2 activity |
| GO:0030246 | 0.0045 | 6.535 | 0.6744 | 4 | 260 | carbohydrate binding |
| GO:0005185 | 0.0052 | 393.8537 | 0.0052 | 1 | 2 | neurohypophyseal hormone activity |
| GO:0098640 | 0.0052 | 393.8537 | 0.0052 | 1 | 2 | integrin binding involved in cell-matrix adhesion |
| NA. |
| n/a |
| NA. |
| n/a |
| NA. |
| n/a |
| NA. |
| n/a |
| NA. |
| n/a |
| NA. |
| n/a |
| NA. |
| n/a |
| NA. |
| n/a |
| NA. |
| n/a |
| NA. |
| n/a |
| NA. |
| n/a |
| NA. |
| n/a |
| NA. |
| n/a |
| NA. |
| n/a |
| NA. |
| n/a |
| NA. |
| n/a |
| NA. |
| n/a |
| NA. |
| n/a |
| NA. |
| n/a |
| NA. |
| n/a |
| NA. |
| n/a |
| NA. |
| n/a |
| NA. |
| n/a |
| NA. |
| n/a |
| NA. |
| n/a |
| NA. |
| n/a |
| NA. |
| n/a |
| NA. |
| n/a |
| NA. |
| n/a |
| NA. |
| n/a |
| NA. |
| n/a |
| NA. |
| n/a |
| NA. |
| n/a |
| NA. |
| n/a |
| NA. |
| n/a |
| NA. |
| n/a |
| NA. |
| n/a |
| NA. |
| n/a |
| NA. |
| n/a |
| NA. |
| n/a |
| NA. |
| n/a |
| NA. |
| n/a |
| NA. |
| n/a |
| NA. |
| n/a |
| NA. |
| n/a |
| NA. |
| n/a |
| NA. |
| n/a |
| NA. |
| n/a |
| NA. |
| n/a |
| NA. |
| n/a |
| NA. |
| n/a |
| NA. |
| n/a |
| NA. |
| n/a |
| NA. |
| n/a |
| NA. |
| n/a |
| NA. |
| n/a |
| GOMFID | Pvalue | OddsRatio | ExpCount | Count | Size | Term |
| GO:0098542 | 0 | 14.7824 | 0.5702 | 6 | 463 | defense response to other organism |
| GO:0042119 | 0 | 14.3303 | 0.5874 | 6 | 477 | neutrophil activation |
| GO:0002275 | 0 | 13.122 | 0.6392 | 6 | 519 | myeloid cell activation involved in immune response |
| GO:0002444 | 0 | 13.0432 | 0.6429 | 6 | 522 | myeloid leukocyte mediated immunity |
| GO:0031640 | 0 | 51.8663 | 0.0714 | 3 | 58 | killing of cells of other organism |
| GO:0016045 | 1e-04 | 180.1111 | 0.0148 | 2 | 12 | detection of bacterium |
| GO:0002263 | 1e-04 | 10.2005 | 0.8128 | 6 | 660 | cell activation involved in immune response |
| GO:0043312 | 1e-04 | 12.3969 | 0.5373 | 5 | 459 | neutrophil degranulation |
| GO:0045055 | 2e-04 | 9.4737 | 0.8719 | 6 | 708 | regulated exocytosis |
| GO:0098581 | 2e-04 | 112.5278 | 0.0222 | 2 | 18 | detection of external biotic stimulus |
| GO:0035821 | 7e-04 | 20.416 | 0.1749 | 3 | 142 | modification of morphology or physiology of other organism |
| GO:0032940 | 9e-04 | 5.8459 | 1.6933 | 7 | 1375 | secretion by cell |
| GO:0019547 | 0.0012 | Inf | 0.0012 | 1 | 1 | arginine catabolic process to ornithine |
| GO:0044356 | 0.0012 | Inf | 0.0012 | 1 | 1 | clearance of foreign intracellular DNA by conversion of DNA cytidine to uridine |
| GO:0061015 | 0.0012 | Inf | 0.0012 | 1 | 1 | snRNA import into nucleus |
| GO:0070965 | 0.0012 | Inf | 0.0012 | 1 | 1 | positive regulation of neutrophil mediated killing of fungus |
| GO:0099046 | 0.0012 | Inf | 0.0012 | 1 | 1 | clearance of foreign intracellular nucleic acids |
| GO:1900150 | 0.0012 | Inf | 0.0012 | 1 | 1 | regulation of defense response to fungus |
| GO:1904676 | 0.0012 | Inf | 0.0012 | 1 | 1 | negative regulation of somatic stem cell division |
| GO:1905175 | 0.0012 | Inf | 0.0012 | 1 | 1 | negative regulation of vascular smooth muscle cell dedifferentiation |
| GO:0031343 | 0.0013 | 43.8455 | 0.053 | 2 | 43 | positive regulation of cell killing |
| GO:0032964 | 0.0014 | 41.801 | 0.0554 | 2 | 45 | collagen biosynthetic process |
| GO:0043207 | 0.0014 | 7.4745 | 0.8855 | 5 | 798 | response to external biotic stimulus |
| GO:0002376 | 0.0017 | 6.5963 | 1.4335 | 6 | 1548 | immune system process |
| GO:0061844 | 0.0018 | 36.6689 | 0.0628 | 2 | 51 | antimicrobial humoral immune response mediated by antimicrobial peptide |
| GO:0045321 | 0.0018 | 5.8003 | 1.3818 | 6 | 1122 | leukocyte activation |
| GO:0009620 | 0.0018 | 35.9333 | 0.064 | 2 | 52 | response to fungus |
| GO:0006959 | 0.0023 | 13.0752 | 0.2697 | 3 | 219 | humoral immune response |
| GO:0010963 | 0.0025 | 853.6316 | 0.0025 | 1 | 2 | regulation of L-arginine import |
| GO:0044663 | 0.0025 | 853.6316 | 0.0025 | 1 | 2 | establishment or maintenance of cell type involved in phenotypic switching |
| GO:0070949 | 0.0025 | 853.6316 | 0.0025 | 1 | 2 | regulation of neutrophil mediated killing of symbiont cell |
| GO:0070960 | 0.0025 | 853.6316 | 0.0025 | 1 | 2 | positive regulation of neutrophil mediated cytotoxicity |
| GO:0045087 | 0.0029 | 6.1573 | 1.032 | 5 | 838 | innate immune response |
| GO:0010466 | 0.0033 | 11.5545 | 0.3042 | 3 | 247 | negative regulation of peptidase activity |
| GO:0032827 | 0.0037 | 426.7895 | 0.0037 | 1 | 3 | negative regulation of natural killer cell differentiation involved in immune response |
| GO:0035879 | 0.0037 | 426.7895 | 0.0037 | 1 | 3 | plasma membrane lactate transport |
| GO:0051714 | 0.0037 | 426.7895 | 0.0037 | 1 | 3 | positive regulation of cytolysis in other organism |
| GO:0090678 | 0.0037 | 426.7895 | 0.0037 | 1 | 3 | cell dedifferentiation involved in phenotypic switching |
| GO:0016192 | 0.004 | 4.3987 | 2.1872 | 7 | 1776 | vesicle-mediated transport |
| GO:0019732 | 0.0049 | 284.5088 | 0.0049 | 1 | 4 | antifungal humoral response |
| GO:0032792 | 0.0049 | 284.5088 | 0.0049 | 1 | 4 | negative regulation of CREB transcription factor activity |
| GO:0090467 | 0.0049 | 284.5088 | 0.0049 | 1 | 4 | arginine import |
| GO:2000552 | 0.0049 | 284.5088 | 0.0049 | 1 | 4 | negative regulation of T-helper 2 cell cytokine production |
| GO:0050830 | 0.0051 | 21.0915 | 0.1071 | 2 | 87 | defense response to Gram-positive bacterium |
| GO:0036446 | 0.0061 | 213.3684 | 0.0062 | 1 | 5 | myofibroblast differentiation |
| GO:0060414 | 0.0061 | 213.3684 | 0.0062 | 1 | 5 | aorta smooth muscle tissue morphogenesis |
| GO:1902023 | 0.0061 | 213.3684 | 0.0062 | 1 | 5 | L-arginine transport |
| GO:1904673 | 0.0061 | 213.3684 | 0.0062 | 1 | 5 | negative regulation of somatic stem cell population maintenance |
| GO:2000724 | 0.0061 | 213.3684 | 0.0062 | 1 | 5 | positive regulation of cardiac vascular smooth muscle cell differentiation |
| GO:0050896 | 0.0067 | 3.9248 | 10.1022 | 16 | 8203 | response to stimulus |
| GO:2000117 | 0.0073 | 17.3862 | 0.1293 | 2 | 105 | negative regulation of cysteine-type endopeptidase activity |
| GO:0010269 | 0.0074 | 170.6842 | 0.0074 | 1 | 6 | response to selenium ion |
| GO:0015727 | 0.0074 | 170.6842 | 0.0074 | 1 | 6 | lactate transport |
| GO:0060336 | 0.0074 | 170.6842 | 0.0074 | 1 | 6 | negative regulation of interferon-gamma-mediated signaling pathway |
| GO:0070383 | 0.0074 | 170.6842 | 0.0074 | 1 | 6 | DNA cytosine deamination |
| GO:0002697 | 0.0074 | 8.5502 | 0.4076 | 3 | 331 | regulation of immune effector process |
| GO:0001816 | 0.0077 | 5.9408 | 0.8116 | 4 | 659 | cytokine production |
| GO:0070268 | 0.0084 | 16.1251 | 0.1392 | 2 | 113 | cornification |
| GO:0009253 | 0.0086 | 142.2281 | 0.0086 | 1 | 7 | peptidoglycan catabolic process |
| GO:0009635 | 0.0086 | 142.2281 | 0.0086 | 1 | 7 | response to herbicide |
| GO:0010668 | 0.0086 | 142.2281 | 0.0086 | 1 | 7 | ectodermal cell differentiation |
| GO:0032815 | 0.0086 | 142.2281 | 0.0086 | 1 | 7 | negative regulation of natural killer cell activation |
| GO:0051597 | 0.0086 | 142.2281 | 0.0086 | 1 | 7 | response to methylmercury |
| GO:0043313 | 0.0098 | 121.9023 | 0.0099 | 1 | 8 | regulation of neutrophil degranulation |
| GO:0043696 | 0.0098 | 121.9023 | 0.0099 | 1 | 8 | dedifferentiation |
| GO:0070269 | 0.0098 | 121.9023 | 0.0099 | 1 | 8 | pyroptosis |
| GO:1900239 | 0.0098 | 121.9023 | 0.0099 | 1 | 8 | regulation of phenotypic switching |
| GO:2000035 | 0.0098 | 121.9023 | 0.0099 | 1 | 8 | regulation of stem cell division |
| GOMFID | Pvalue | OddsRatio | ExpCount | Count | Size | Term |
| GO:0060349 | 0 | 29.5348 | 0.1626 | 4 | 88 | bone morphogenesis |
| GO:0045600 | 2e-04 | 33.2428 | 0.1053 | 3 | 57 | positive regulation of fat cell differentiation |
| GO:0045669 | 2e-04 | 32.6364 | 0.1071 | 3 | 58 | positive regulation of osteoblast differentiation |
| GO:0048534 | 7e-04 | 5.5688 | 1.5647 | 7 | 847 | hematopoietic or lymphoid organ development |
| GO:0002063 | 0.001 | 48.1726 | 0.048 | 2 | 26 | chondrocyte development |
| GO:0032680 | 0.001 | 16.8805 | 0.2014 | 3 | 109 | regulation of tumor necrosis factor production |
| GO:0001958 | 0.0011 | 46.2429 | 0.0499 | 2 | 27 | endochondral ossification |
| GO:0051094 | 0.0012 | 4.5567 | 2.2278 | 8 | 1206 | positive regulation of developmental process |
| GO:0071706 | 0.0013 | 15.8279 | 0.2143 | 3 | 116 | tumor necrosis factor superfamily cytokine production |
| GO:0001569 | 0.0015 | 39.8547 | 0.0573 | 2 | 31 | branching involved in blood vessel morphogenesis |
| GO:0008584 | 0.0017 | 14.0709 | 0.2401 | 3 | 130 | male gonad development |
| GO:0060010 | 0.0018 | Inf | 0.0018 | 1 | 1 | Sertoli cell fate commitment |
| GO:0061185 | 0.0018 | Inf | 0.0018 | 1 | 1 | negative regulation of dermatome development |
| GO:0061682 | 0.0018 | Inf | 0.0018 | 1 | 1 | seminal vesicle morphogenesis |
| GO:1901835 | 0.0018 | Inf | 0.0018 | 1 | 1 | positive regulation of deadenylation-independent decapping of nuclear-transcribed mRNA |
| GO:1904246 | 0.0018 | Inf | 0.0018 | 1 | 1 | negative regulation of polynucleotide adenylyltransferase activity |
| GO:0060562 | 0.0022 | 8.2429 | 0.556 | 4 | 301 | epithelial tube morphogenesis |
| GO:0046661 | 0.0028 | 11.8963 | 0.2826 | 3 | 153 | male sex differentiation |
| GO:0045944 | 0.0028 | 4.3455 | 1.9729 | 7 | 1068 | positive regulation of transcription from RNA polymerase II promoter |
| GO:0048701 | 0.003 | 27.4966 | 0.0813 | 2 | 44 | embryonic cranial skeleton morphogenesis |
| GO:0071478 | 0.0032 | 11.2883 | 0.2974 | 3 | 161 | cellular response to radiation |
| GO:0045892 | 0.0034 | 4.1929 | 2.0394 | 7 | 1104 | negative regulation of transcription, DNA-templated |
| GO:0030850 | 0.0034 | 25.6587 | 0.0868 | 2 | 47 | prostate gland development |
| GO:0045321 | 0.0037 | 4.1203 | 2.0727 | 7 | 1122 | leukocyte activation |
| GO:1904582 | 0.0037 | 558.931 | 0.0037 | 1 | 2 | positive regulation of intracellular mRNA localization |
| GO:2000041 | 0.0037 | 558.931 | 0.0037 | 1 | 2 | negative regulation of planar cell polarity pathway involved in axis elongation |
| GO:0060173 | 0.0037 | 10.674 | 0.314 | 3 | 170 | limb development |
| GO:0051254 | 0.0037 | 3.7527 | 2.6601 | 8 | 1440 | positive regulation of RNA metabolic process |
| GO:1902679 | 0.004 | 4.0538 | 2.1041 | 7 | 1139 | negative regulation of RNA biosynthetic process |
| GO:0061138 | 0.004 | 10.3605 | 0.3233 | 3 | 175 | morphogenesis of a branching epithelium |
| GO:0030278 | 0.0041 | 10.2999 | 0.3251 | 3 | 176 | regulation of ossification |
| GO:0008284 | 0.0043 | 4.4898 | 1.5905 | 6 | 861 | positive regulation of cell proliferation |
| GO:0051240 | 0.0044 | 3.6381 | 2.7358 | 8 | 1481 | positive regulation of multicellular organismal process |
| GO:0048729 | 0.0048 | 5.1587 | 1.1268 | 5 | 610 | tissue morphogenesis |
| GO:0030886 | 0.0055 | 279.4483 | 0.0055 | 1 | 3 | negative regulation of myeloid dendritic cell activation |
| GO:0045085 | 0.0055 | 279.4483 | 0.0055 | 1 | 3 | negative regulation of interleukin-2 biosynthetic process |
| GO:0060741 | 0.0055 | 279.4483 | 0.0055 | 1 | 3 | prostate gland stromal morphogenesis |
| GO:0140076 | 0.0055 | 279.4483 | 0.0055 | 1 | 3 | negative regulation of lipoprotein transport |
| GO:1904715 | 0.0055 | 279.4483 | 0.0055 | 1 | 3 | negative regulation of chaperone-mediated autophagy |
| GO:1990834 | 0.0055 | 279.4483 | 0.0055 | 1 | 3 | response to odorant |
| GO:2000297 | 0.0055 | 279.4483 | 0.0055 | 1 | 3 | negative regulation of synapse maturation |
| GO:0045596 | 0.0059 | 4.8975 | 1.1841 | 5 | 641 | negative regulation of cell differentiation |
| GO:0061035 | 0.0062 | 18.6037 | 0.1182 | 2 | 64 | regulation of cartilage development |
| GO:0045137 | 0.0063 | 8.7614 | 0.3805 | 3 | 206 | development of primary sexual characteristics |
| GO:0061458 | 0.0064 | 6.0344 | 0.7518 | 4 | 407 | reproductive system development |
| GO:1904035 | 0.0066 | 18.0201 | 0.1219 | 2 | 66 | regulation of epithelial cell apoptotic process |
| GO:0010557 | 0.0071 | 3.339 | 2.9557 | 8 | 1600 | positive regulation of macromolecule biosynthetic process |
| GO:0002051 | 0.0074 | 186.2874 | 0.0074 | 1 | 4 | osteoblast fate commitment |
| GO:0008588 | 0.0074 | 186.2874 | 0.0074 | 1 | 4 | release of cytoplasmic sequestered NF-kappaB |
| GO:0019805 | 0.0074 | 186.2874 | 0.0074 | 1 | 4 | quinolinate biosynthetic process |
| GO:0042662 | 0.0074 | 186.2874 | 0.0074 | 1 | 4 | negative regulation of mesodermal cell fate specification |
| GO:0090244 | 0.0074 | 186.2874 | 0.0074 | 1 | 4 | Wnt signaling pathway involved in somitogenesis |
| GO:1904637 | 0.0074 | 186.2874 | 0.0074 | 1 | 4 | cellular response to ionomycin |
| GO:1905903 | 0.0074 | 186.2874 | 0.0074 | 1 | 4 | negative regulation of mesoderm formation |
| GO:0048041 | 0.0076 | 16.7091 | 0.1312 | 2 | 71 | focal adhesion assembly |
| GO:0061448 | 0.0077 | 8.1596 | 0.409 | 3 | 229 | connective tissue development |
| GO:0021766 | 0.008 | 16.2364 | 0.1349 | 2 | 73 | hippocampus development |
| GO:0043627 | 0.008 | 16.2364 | 0.1349 | 2 | 73 | response to estrogen |
| GO:0003151 | 0.0082 | 16.0099 | 0.1367 | 2 | 74 | outflow tract morphogenesis |
| GO:0009890 | 0.0085 | 3.224 | 3.0499 | 8 | 1651 | negative regulation of biosynthetic process |
| GO:0007155 | 0.0087 | 3.4674 | 2.4292 | 7 | 1315 | cell adhesion |
| GO:0042110 | 0.0089 | 5.4629 | 0.8276 | 4 | 448 | T cell activation |
| GO:0060591 | 0.0092 | 139.7069 | 0.0092 | 1 | 5 | chondroblast differentiation |
| GO:0061056 | 0.0092 | 139.7069 | 0.0092 | 1 | 5 | sclerotome development |
| GO:1904956 | 0.0092 | 139.7069 | 0.0092 | 1 | 5 | regulation of midbrain dopaminergic neuron differentiation |
| GO:0051173 | 0.0093 | 2.7561 | 5.2186 | 11 | 2825 | positive regulation of nitrogen compound metabolic process |
| GO:0045621 | 0.0095 | 14.7729 | 0.1478 | 2 | 80 | positive regulation of lymphocyte differentiation |
| GO:0034333 | 0.0098 | 14.585 | 0.1496 | 2 | 81 | adherens junction assembly |
| GO:0002521 | 0.0098 | 5.3031 | 0.8516 | 4 | 461 | leukocyte differentiation |
| GOMFID | Pvalue | OddsRatio | ExpCount | Count | Size | Term |
| GO:0008584 | 0.0014 | 15.1984 | 0.2241 | 3 | 130 | male gonad development |
| GO:0060010 | 0.0017 | Inf | 0.0017 | 1 | 1 | Sertoli cell fate commitment |
| GO:0061185 | 0.0017 | Inf | 0.0017 | 1 | 1 | negative regulation of dermatome development |
| GO:0061682 | 0.0017 | Inf | 0.0017 | 1 | 1 | seminal vesicle morphogenesis |
| GO:2000287 | 0.0017 | Inf | 0.0017 | 1 | 1 | positive regulation of myotome development |
| GO:0046661 | 0.0023 | 12.8496 | 0.2638 | 3 | 153 | male sex differentiation |
| GO:0030850 | 0.003 | 27.6359 | 0.081 | 2 | 47 | prostate gland development |
| GO:2000041 | 0.0034 | 600.4074 | 0.0034 | 1 | 2 | negative regulation of planar cell polarity pathway involved in axis elongation |
| GO:0060350 | 0.0035 | 25.3736 | 0.0879 | 2 | 51 | endochondral bone morphogenesis |
| GO:0060348 | 0.0035 | 10.9336 | 0.3086 | 3 | 179 | bone development |
| GO:0051094 | 0.0036 | 4.1738 | 2.0793 | 7 | 1206 | positive regulation of developmental process |
| GO:0043124 | 0.004 | 23.4528 | 0.0948 | 2 | 55 | negative regulation of I-kappaB kinase/NF-kappaB signaling |
| GO:0045600 | 0.0043 | 22.5972 | 0.0983 | 2 | 57 | positive regulation of fat cell differentiation |
| GO:0045669 | 0.0045 | 22.1923 | 0.1 | 2 | 58 | positive regulation of osteoblast differentiation |
| GO:0061458 | 0.0049 | 6.538 | 0.7017 | 4 | 407 | reproductive system development |
| GO:0060741 | 0.0052 | 300.1852 | 0.0052 | 1 | 3 | prostate gland stromal morphogenesis |
| GO:0070458 | 0.0052 | 300.1852 | 0.0052 | 1 | 3 | cellular detoxification of nitrogen compound |
| GO:1904715 | 0.0052 | 300.1852 | 0.0052 | 1 | 3 | negative regulation of chaperone-mediated autophagy |
| GO:1990834 | 0.0052 | 300.1852 | 0.0052 | 1 | 3 | response to odorant |
| GO:0045137 | 0.0052 | 9.4634 | 0.3552 | 3 | 206 | development of primary sexual characteristics |
| GO:0048705 | 0.0054 | 9.3239 | 0.3603 | 3 | 209 | skeletal system morphogenesis |
| GO:0048041 | 0.0066 | 17.9967 | 0.1224 | 2 | 71 | focal adhesion assembly |
| GO:0008588 | 0.0069 | 200.1111 | 0.0069 | 1 | 4 | release of cytoplasmic sequestered NF-kappaB |
| GO:0018916 | 0.0069 | 200.1111 | 0.0069 | 1 | 4 | nitrobenzene metabolic process |
| GO:0042662 | 0.0069 | 200.1111 | 0.0069 | 1 | 4 | negative regulation of mesodermal cell fate specification |
| GO:0090244 | 0.0069 | 200.1111 | 0.0069 | 1 | 4 | Wnt signaling pathway involved in somitogenesis |
| GO:1905903 | 0.0069 | 200.1111 | 0.0069 | 1 | 4 | negative regulation of mesoderm formation |
| GO:0021766 | 0.007 | 17.4875 | 0.1259 | 2 | 73 | hippocampus development |
| GO:0043627 | 0.007 | 17.4875 | 0.1259 | 2 | 73 | response to estrogen |
| GO:0003151 | 0.0072 | 17.2436 | 0.1276 | 2 | 74 | outflow tract morphogenesis |
| GO:0045621 | 0.0083 | 15.9112 | 0.1379 | 2 | 80 | positive regulation of lymphocyte differentiation |
| GO:0034333 | 0.0085 | 15.7089 | 0.1397 | 2 | 81 | adherens junction assembly |
| GO:0060591 | 0.0086 | 150.0741 | 0.0086 | 1 | 5 | chondroblast differentiation |
| GO:0061056 | 0.0086 | 150.0741 | 0.0086 | 1 | 5 | sclerotome development |
| GO:1904956 | 0.0086 | 150.0741 | 0.0086 | 1 | 5 | regulation of midbrain dopaminergic neuron differentiation |
| GO:0045944 | 0.0086 | 3.8906 | 1.8414 | 6 | 1068 | positive regulation of transcription from RNA polymerase II promoter |
| GO:0001843 | 0.0094 | 14.9481 | 0.1466 | 2 | 85 | neural tube closure |
| GO:0007044 | 0.0098 | 14.5946 | 0.15 | 2 | 87 | cell-substrate junction assembly |
| GOMFID | Pvalue | OddsRatio | ExpCount | Count | Size | Term |
| GO:2001236 | 2e-04 | 36.9724 | 0.1094 | 3 | 148 | regulation of extrinsic apoptotic signaling pathway |
| GO:1902042 | 3e-04 | 95.2588 | 0.0266 | 2 | 36 | negative regulation of extrinsic apoptotic signaling pathway via death domain receptors |
| GO:2001234 | 4e-04 | 26.9865 | 0.1485 | 3 | 201 | negative regulation of apoptotic signaling pathway |
| GO:2000351 | 4e-04 | 83.0205 | 0.0303 | 2 | 41 | regulation of endothelial cell apoptotic process |
| GO:0002642 | 7e-04 | Inf | 7e-04 | 1 | 1 | positive regulation of immunoglobulin biosynthetic process |
| GO:0030887 | 7e-04 | Inf | 7e-04 | 1 | 1 | positive regulation of myeloid dendritic cell activation |
| GO:0034021 | 0.0015 | 1475.1818 | 0.0015 | 1 | 2 | response to silicon dioxide |
| GO:0036345 | 0.0015 | 1475.1818 | 0.0015 | 1 | 2 | platelet maturation |
| GO:1904019 | 0.0019 | 36.6818 | 0.0665 | 2 | 90 | epithelial cell apoptotic process |
| GO:0008219 | 0.002 | 6.817 | 1.5384 | 6 | 2082 | cell death |
| GO:0021553 | 0.0022 | 737.5455 | 0.0022 | 1 | 3 | olfactory nerve development |
| GO:0048388 | 0.0022 | 737.5455 | 0.0022 | 1 | 3 | endosomal lumen acidification |
| GO:0061368 | 0.0022 | 737.5455 | 0.0022 | 1 | 3 | behavioral response to formalin induced pain |
| GO:0099566 | 0.0022 | 737.5455 | 0.0022 | 1 | 3 | regulation of postsynaptic cytosolic calcium ion concentration |
| GO:0043069 | 0.0025 | 9.229 | 0.6192 | 4 | 838 | negative regulation of programmed cell death |
| GO:0030644 | 0.003 | 491.6667 | 0.003 | 1 | 4 | cellular chloride ion homeostasis |
| GO:0045918 | 0.003 | 491.6667 | 0.003 | 1 | 4 | negative regulation of cytolysis |
| GO:0046666 | 0.003 | 491.6667 | 0.003 | 1 | 4 | retinal cell programmed cell death |
| GO:2001274 | 0.003 | 491.6667 | 0.003 | 1 | 4 | negative regulation of glucose import in response to insulin stimulus |
| GO:0032747 | 0.0037 | 368.7273 | 0.0037 | 1 | 5 | positive regulation of interleukin-23 production |
| GO:0060385 | 0.0037 | 368.7273 | 0.0037 | 1 | 5 | axonogenesis involved in innervation |
| GO:1902533 | 0.0038 | 8.1596 | 0.6953 | 4 | 941 | positive regulation of intracellular signal transduction |
| GO:0002521 | 0.0041 | 11.4774 | 0.3406 | 3 | 461 | leukocyte differentiation |
| GO:0050906 | 0.0041 | 11.4774 | 0.3406 | 3 | 461 | detection of stimulus involved in sensory perception |
| GO:0051599 | 0.0044 | 294.9636 | 0.0044 | 1 | 6 | response to hydrostatic pressure |
| GO:0097527 | 0.0044 | 294.9636 | 0.0044 | 1 | 6 | necroptotic signaling pathway |
| GO:0050865 | 0.005 | 10.6612 | 0.3658 | 3 | 495 | regulation of cell activation |
| GO:0030223 | 0.0052 | 245.7879 | 0.0052 | 1 | 7 | neutrophil differentiation |
| GO:0001821 | 0.0059 | 210.6623 | 0.0059 | 1 | 8 | histamine secretion |
| GO:0038180 | 0.0059 | 210.6623 | 0.0059 | 1 | 8 | nerve growth factor signaling pathway |
| GO:0042045 | 0.0059 | 210.6623 | 0.0059 | 1 | 8 | epithelial fluid transport |
| GO:0071316 | 0.0059 | 210.6623 | 0.0059 | 1 | 8 | cellular response to nicotine |
| GO:1902715 | 0.0059 | 210.6623 | 0.0059 | 1 | 8 | positive regulation of interferon-gamma secretion |
| GO:0010623 | 0.0061 | 202.7125 | 0.0061 | 1 | 9 | programmed cell death involved in cell development |
| GO:0001766 | 0.0066 | 184.3182 | 0.0067 | 1 | 9 | membrane raft polarization |
| GO:0071803 | 0.0066 | 184.3182 | 0.0067 | 1 | 9 | positive regulation of podosome assembly |
| GO:0097011 | 0.0066 | 184.3182 | 0.0067 | 1 | 9 | cellular response to granulocyte macrophage colony-stimulating factor stimulus |
| GO:0007166 | 0.0068 | 5.1892 | 1.9419 | 6 | 2628 | cell surface receptor signaling pathway |
| GO:0050966 | 0.0074 | 163.8283 | 0.0074 | 1 | 10 | detection of mechanical stimulus involved in sensory perception of pain |
| GO:0051665 | 0.0074 | 163.8283 | 0.0074 | 1 | 10 | membrane raft localization |
| GO:0002376 | 0.0074 | 5.0916 | 1.9729 | 6 | 2670 | immune system process |
| GO:0043523 | 0.0081 | 17.3438 | 0.1382 | 2 | 187 | regulation of neuron apoptotic process |
| GO:0090331 | 0.0081 | 147.4364 | 0.0081 | 1 | 11 | negative regulation of platelet aggregation |
| GO:0007623 | 0.0082 | 17.2495 | 0.1389 | 2 | 188 | circadian rhythm |
| GO:0070374 | 0.0087 | 16.7042 | 0.1433 | 2 | 194 | positive regulation of ERK1 and ERK2 cascade |
| GO:0034116 | 0.0088 | 134.0248 | 0.0089 | 1 | 12 | positive regulation of heterotypic cell-cell adhesion |
| GO:0046649 | 0.0091 | 8.549 | 0.4522 | 3 | 612 | lymphocyte activation |
| GO:0050877 | 0.0093 | 6.228 | 0.8941 | 4 | 1210 | nervous system process |
| GO:0030002 | 0.0096 | 122.8485 | 0.0096 | 1 | 13 | cellular anion homeostasis |
| GO:0048266 | 0.0096 | 122.8485 | 0.0096 | 1 | 13 | behavioral response to pain |
| GO:0060009 | 0.0096 | 122.8485 | 0.0096 | 1 | 13 | Sertoli cell development |
| GO:0097296 | 0.0096 | 122.8485 | 0.0096 | 1 | 13 | activation of cysteine-type endopeptidase activity involved in apoptotic signaling pathway |
| GOMFID | Pvalue | OddsRatio | ExpCount | Count | Size | Term |
| GO:0060349 | 5e-04 | 22.7675 | 0.1517 | 3 | 88 | bone morphogenesis |
| GO:0001958 | 0.001 | 49.8062 | 0.0466 | 2 | 27 | endochondral ossification |
| GO:0048562 | 0.0013 | 9.6588 | 0.481 | 4 | 279 | embryonic organ morphogenesis |
| GO:0021592 | 0.0017 | Inf | 0.0017 | 1 | 1 | fourth ventricle development |
| GO:0021993 | 0.0017 | Inf | 0.0017 | 1 | 1 | initiation of neural tube closure |
| GO:0060010 | 0.0017 | Inf | 0.0017 | 1 | 1 | Sertoli cell fate commitment |
| GO:0031076 | 0.0018 | 35.5538 | 0.0638 | 2 | 37 | embryonic camera-type eye development |
| GO:0016574 | 0.0021 | 32.7409 | 0.069 | 2 | 40 | histone ubiquitination |
| GO:0045321 | 0.0024 | 4.5133 | 1.9345 | 7 | 1122 | leukocyte activation |
| GO:0048701 | 0.0026 | 29.6154 | 0.0759 | 2 | 44 | embryonic cranial skeleton morphogenesis |
| GO:0051572 | 0.0034 | 600.4074 | 0.0034 | 1 | 2 | negative regulation of histone H3-K4 methylation |
| GO:1904815 | 0.0034 | 600.4074 | 0.0034 | 1 | 2 | negative regulation of protein localization to chromosome, telomeric region |
| GO:0008283 | 0.0044 | 3.4464 | 3.3931 | 9 | 1968 | cell proliferation |
| GO:0045669 | 0.0045 | 22.1923 | 0.1 | 2 | 58 | positive regulation of osteoblast differentiation |
| GO:0002351 | 0.0052 | 300.1852 | 0.0052 | 1 | 3 | serotonin production involved in inflammatory response |
| GO:0002554 | 0.0052 | 300.1852 | 0.0052 | 1 | 3 | serotonin secretion by platelet |
| GO:0021678 | 0.0052 | 300.1852 | 0.0052 | 1 | 3 | third ventricle development |
| GO:0033128 | 0.0052 | 300.1852 | 0.0052 | 1 | 3 | negative regulation of histone phosphorylation |
| GO:0071593 | 0.0052 | 300.1852 | 0.0052 | 1 | 3 | lymphocyte aggregation |
| GO:1901837 | 0.0052 | 300.1852 | 0.0052 | 1 | 3 | negative regulation of transcription of nuclear large rRNA transcript from RNA polymerase I promoter |
| GO:1990834 | 0.0052 | 300.1852 | 0.0052 | 1 | 3 | response to odorant |
| GO:0061035 | 0.0054 | 20.0372 | 0.1103 | 2 | 64 | regulation of cartilage development |
| GO:0008589 | 0.0061 | 18.8182 | 0.1172 | 2 | 68 | regulation of smoothened signaling pathway |
| GO:0006366 | 0.0061 | 3.2632 | 3.5586 | 9 | 2064 | transcription from RNA polymerase II promoter |
| GO:0002051 | 0.0069 | 200.1111 | 0.0069 | 1 | 4 | osteoblast fate commitment |
| GO:0016554 | 0.0069 | 200.1111 | 0.0069 | 1 | 4 | cytidine to uridine editing |
| GO:0021555 | 0.0069 | 200.1111 | 0.0069 | 1 | 4 | midbrain-hindbrain boundary morphogenesis |
| GO:0061086 | 0.0069 | 200.1111 | 0.0069 | 1 | 4 | negative regulation of histone H3-K27 methylation |
| GO:0042110 | 0.0069 | 5.9189 | 0.7724 | 4 | 448 | T cell activation |
| GO:0043627 | 0.007 | 17.4875 | 0.1259 | 2 | 73 | response to estrogen |
| GO:0002521 | 0.0076 | 5.7458 | 0.7948 | 4 | 461 | leukocyte differentiation |
| GO:0045621 | 0.0083 | 15.9112 | 0.1379 | 2 | 80 | positive regulation of lymphocyte differentiation |
| GO:0034184 | 0.0086 | 150.0741 | 0.0086 | 1 | 5 | positive regulation of maintenance of mitotic sister chromatid cohesion |
| GO:0060591 | 0.0086 | 150.0741 | 0.0086 | 1 | 5 | chondroblast differentiation |
| GO:0120034 | 0.0092 | 15.1313 | 0.1448 | 2 | 84 | positive regulation of plasma membrane bounded cell projection assembly |
| GO:0048609 | 0.0092 | 4.4138 | 1.3207 | 5 | 766 | multicellular organismal reproductive process |
| GO:0060606 | 0.0096 | 14.7692 | 0.1483 | 2 | 86 | tube closure |
| GOMFID | Pvalue | OddsRatio | ExpCount | Count | Size | Term |
| GO:2000502 | 0 | 1200.7407 | 0.0054 | 2 | 3 | negative regulation of natural killer cell chemotaxis |
| GO:2000402 | 1e-04 | 171.4709 | 0.0161 | 2 | 9 | negative regulation of lymphocyte migration |
| GO:0002689 | 4e-04 | 85.6984 | 0.0286 | 2 | 16 | negative regulation of leukocyte chemotaxis |
| GO:0045954 | 5e-04 | 70.5621 | 0.0339 | 2 | 19 | positive regulation of natural killer cell mediated cytotoxicity |
| GO:0043547 | 6e-04 | 8.5639 | 0.6964 | 5 | 390 | positive regulation of GTPase activity |
| GO:1901623 | 6e-04 | 63.1267 | 0.0375 | 2 | 21 | regulation of lymphocyte chemotaxis |
| GO:0051336 | 7e-04 | 5.0745 | 2.0357 | 8 | 1140 | regulation of hydrolase activity |
| GO:0060326 | 0.0011 | 9.9325 | 0.4661 | 4 | 261 | cell chemotaxis |
| GO:0048247 | 0.0017 | 36.9303 | 0.0616 | 2 | 37 | lymphocyte chemotaxis |
| GO:0002715 | 0.0018 | 36.3143 | 0.0625 | 2 | 35 | regulation of natural killer cell mediated immunity |
| GO:0032078 | 0.0018 | Inf | 0.0018 | 1 | 1 | negative regulation of endodeoxyribonuclease activity |
| GO:1902204 | 0.0018 | Inf | 0.0018 | 1 | 1 | positive regulation of hepatocyte growth factor receptor signaling pathway |
| GO:0071346 | 0.0019 | 13.5379 | 0.25 | 3 | 140 | cellular response to interferon-gamma |
| GO:0045429 | 0.0024 | 30.716 | 0.0732 | 2 | 41 | positive regulation of nitric oxide biosynthetic process |
| GO:0019835 | 0.0025 | 29.9463 | 0.075 | 2 | 42 | cytolysis |
| GO:0031343 | 0.0027 | 29.2141 | 0.0768 | 2 | 43 | positive regulation of cell killing |
| GO:0034260 | 0.0028 | 28.5168 | 0.0786 | 2 | 44 | negative regulation of GTPase activity |
| GO:0045087 | 0.0032 | 4.822 | 1.4964 | 6 | 838 | innate immune response |
| GO:0046373 | 0.0036 | 578.9286 | 0.0036 | 1 | 2 | L-arabinose metabolic process |
| GO:0001910 | 0.004 | 23.4713 | 0.0946 | 2 | 53 | regulation of leukocyte mediated cytotoxicity |
| GO:0032729 | 0.0051 | 20.6296 | 0.1071 | 2 | 60 | positive regulation of interferon-gamma production |
| GO:0002548 | 0.0054 | 19.9395 | 0.1107 | 2 | 62 | monocyte chemotaxis |
| GO:0050900 | 0.0056 | 6.2921 | 0.725 | 4 | 406 | leukocyte migration |
| GO:0031295 | 0.0063 | 18.4 | 0.1196 | 2 | 67 | T cell costimulation |
| GO:0046209 | 0.0069 | 17.585 | 0.125 | 2 | 70 | nitric oxide metabolic process |
| GO:0030101 | 0.0075 | 16.8388 | 0.1304 | 2 | 73 | natural killer cell activation |
| GO:0002708 | 0.0077 | 16.6039 | 0.1321 | 2 | 74 | positive regulation of lymphocyte mediated immunity |
| GO:1903426 | 0.0083 | 15.9368 | 0.1375 | 2 | 77 | regulation of reactive oxygen species biosynthetic process |
| GO:0070098 | 0.0089 | 15.321 | 0.1429 | 2 | 80 | chemokine-mediated signaling pathway |
| GOMFID | Pvalue | OddsRatio | ExpCount | Count | Size | Term |
| GO:0015728 | 7e-04 | Inf | 7e-04 | 1 | 1 | mevalonate transport |
| GO:0051780 | 7e-04 | Inf | 7e-04 | 1 | 1 | behavioral response to nutrient |
| GO:0021553 | 0.002 | 811.35 | 0.002 | 1 | 3 | olfactory nerve development |
| GO:0035879 | 0.002 | 811.35 | 0.002 | 1 | 3 | plasma membrane lactate transport |
| GO:0048388 | 0.002 | 811.35 | 0.002 | 1 | 3 | endosomal lumen acidification |
| GO:0061368 | 0.002 | 811.35 | 0.002 | 1 | 3 | behavioral response to formalin induced pain |
| GO:0030644 | 0.0027 | 540.8667 | 0.0027 | 1 | 4 | cellular chloride ion homeostasis |
| GO:0046666 | 0.0027 | 540.8667 | 0.0027 | 1 | 4 | retinal cell programmed cell death |
| GO:0060385 | 0.0034 | 405.625 | 0.0034 | 1 | 5 | axonogenesis involved in innervation |
| GO:0015727 | 0.0041 | 324.48 | 0.0041 | 1 | 6 | lactate transport |
| GO:0051599 | 0.0041 | 324.48 | 0.0041 | 1 | 6 | response to hydrostatic pressure |
| GO:0097527 | 0.0041 | 324.48 | 0.0041 | 1 | 6 | necroptotic signaling pathway |
| GO:0002376 | 0.0043 | 6.1104 | 1.8085 | 6 | 2670 | immune system process |
| GO:0050954 | 0.0048 | 23.0452 | 0.1063 | 2 | 157 | sensory perception of mechanical stimulus |
| GO:0002291 | 0.0054 | 231.7429 | 0.0054 | 1 | 8 | T cell activation via T cell receptor contact with antigen bound to MHC molecule on antigen presenting cell |
| GO:0038180 | 0.0054 | 231.7429 | 0.0054 | 1 | 8 | nerve growth factor signaling pathway |
| GO:0071316 | 0.0054 | 231.7429 | 0.0054 | 1 | 8 | cellular response to nicotine |
| GO:0010623 | 0.0055 | 225.25 | 0.0055 | 1 | 9 | programmed cell death involved in cell development |
| GO:0045078 | 0.0068 | 180.2222 | 0.0068 | 1 | 10 | positive regulation of interferon-gamma biosynthetic process |
| GO:0050966 | 0.0068 | 180.2222 | 0.0068 | 1 | 10 | detection of mechanical stimulus involved in sensory perception of pain |
| GO:0043523 | 0.0068 | 19.2721 | 0.1267 | 2 | 187 | regulation of neuron apoptotic process |
| GO:0046649 | 0.007 | 9.6182 | 0.4145 | 3 | 612 | lymphocyte activation |
| GO:0030002 | 0.0088 | 135.1417 | 0.0088 | 1 | 13 | cellular anion homeostasis |
| GO:0048266 | 0.0088 | 135.1417 | 0.0088 | 1 | 13 | behavioral response to pain |
| GO:0060009 | 0.0088 | 135.1417 | 0.0088 | 1 | 13 | Sertoli cell development |
| GO:0097296 | 0.0088 | 135.1417 | 0.0088 | 1 | 13 | activation of cysteine-type endopeptidase activity involved in apoptotic signaling pathway |
| GO:2000353 | 0.0094 | 124.7385 | 0.0095 | 1 | 14 | positive regulation of endothelial cell apoptotic process |
| GOMFID | Pvalue | OddsRatio | ExpCount | Count | Size | Term |
| GO:0032078 | 0.001 | Inf | 0.001 | 1 | 1 | negative regulation of endodeoxyribonuclease activity |
| GO:1900758 | 0.001 | Inf | 0.001 | 1 | 1 | negative regulation of D-amino-acid oxidase activity |
| GO:0048247 | 0.0016 | 38.4929 | 0.0607 | 2 | 58 | lymphocyte chemotaxis |
| GO:0002548 | 0.0019 | 35.9178 | 0.0649 | 2 | 62 | monocyte chemotaxis |
| GO:0019075 | 0.0021 | 1013.875 | 0.0021 | 1 | 2 | virus maturation |
| GO:0007032 | 0.0023 | 32.495 | 0.0719 | 2 | 73 | endosome organization |
| GO:0070098 | 0.0031 | 27.5983 | 0.0837 | 2 | 80 | chemokine-mediated signaling pathway |
| GO:0048388 | 0.0031 | 506.9062 | 0.0031 | 1 | 3 | endosomal lumen acidification |
| GO:1900005 | 0.0031 | 506.9062 | 0.0031 | 1 | 3 | positive regulation of serine-type endopeptidase activity |
| GO:1901318 | 0.0031 | 506.9062 | 0.0031 | 1 | 3 | negative regulation of flagellated sperm motility |
| GO:0051341 | 0.0033 | 26.905 | 0.0858 | 2 | 82 | regulation of oxidoreductase activity |
| GO:0042058 | 0.0035 | 25.9277 | 0.089 | 2 | 85 | regulation of epidermal growth factor receptor signaling pathway |
| GO:0030593 | 0.0037 | 25.0186 | 0.0921 | 2 | 88 | neutrophil chemotaxis |
| GO:0071347 | 0.0039 | 24.447 | 0.0942 | 2 | 90 | cellular response to interleukin-1 |
| GO:0030644 | 0.0042 | 337.9167 | 0.0042 | 1 | 4 | cellular chloride ion homeostasis |
| GO:0046666 | 0.0042 | 337.9167 | 0.0042 | 1 | 4 | retinal cell programmed cell death |
| GO:2001237 | 0.0047 | 22.1663 | 0.1036 | 2 | 99 | negative regulation of extrinsic apoptotic signaling pathway |
| GO:1903772 | 0.0052 | 253.4219 | 0.0052 | 1 | 5 | regulation of viral budding via host ESCRT complex |
| GO:0051345 | 0.0055 | 6.7527 | 0.7443 | 4 | 711 | positive regulation of hydrolase activity |
| GO:0097527 | 0.0063 | 202.725 | 0.0063 | 1 | 6 | necroptotic signaling pathway |
| GO:0097530 | 0.0071 | 17.8922 | 0.1277 | 2 | 122 | granulocyte migration |
| GO:0032074 | 0.0073 | 168.9271 | 0.0073 | 1 | 7 | negative regulation of nuclease activity |
| GO:0071346 | 0.0092 | 15.5411 | 0.1466 | 2 | 140 | cellular response to interferon-gamma |
| GO:0090281 | 0.0094 | 126.6797 | 0.0094 | 1 | 9 | negative regulation of calcium ion import |
| GOMFID | Pvalue | OddsRatio | ExpCount | Count | Size | Term |
| GO:0000413 | 0 | 60.2944 | 0.0608 | 3 | 38 | protein peptidyl-prolyl isomerization |
| GO:1904240 | 0.0016 | Inf | 0.0016 | 1 | 1 | negative regulation of VCP-NPL4-UFD1 AAA ATPase complex assembly |
| GO:0038195 | 0.0032 | 648.52 | 0.0032 | 1 | 2 | urokinase plasminogen activator signaling pathway |
| GO:1903070 | 0.0048 | 324.24 | 0.0048 | 1 | 3 | negative regulation of ER-associated ubiquitin-dependent protein catabolic process |
| GO:0006457 | 0.0051 | 9.5708 | 0.3538 | 3 | 221 | protein folding |
| GO:1903061 | 0.0064 | 216.1467 | 0.0064 | 1 | 4 | positive regulation of protein lipidation |
| GO:0042985 | 0.008 | 162.1 | 0.008 | 1 | 5 | negative regulation of amyloid precursor protein biosynthetic process |
| GO:2001268 | 0.008 | 162.1 | 0.008 | 1 | 5 | negative regulation of cysteine-type endopeptidase activity involved in apoptotic signaling pathway |
| GO:1901570 | 0.0083 | 16.002 | 0.1377 | 2 | 86 | fatty acid derivative biosynthetic process |
| GOMFID | Pvalue | OddsRatio | ExpCount | Count | Size | Term |
| GO:0016810 | 9e-04 | 18.4933 | 0.1901 | 3 | 140 | hydrolase activity, acting on carbon-nitrogen (but not peptide) bonds |
| GO:0061135 | 0.0015 | 15.2349 | 0.2294 | 3 | 169 | endopeptidase regulator activity |
| GO:0030414 | 0.0015 | 15.0517 | 0.2322 | 3 | 171 | peptidase inhibitor activity |
| GO:0004869 | 0.0026 | 29.8685 | 0.076 | 2 | 56 | cysteine-type endopeptidase inhibitor activity |
| GO:0004053 | 0.0027 | 770.5714 | 0.0027 | 1 | 2 | arginase activity |
| GO:0004991 | 0.0027 | 770.5714 | 0.0027 | 1 | 2 | parathyroid hormone receptor activity |
| GO:0047844 | 0.0041 | 385.2619 | 0.0041 | 1 | 3 | deoxycytidine deaminase activity |
| GO:0008745 | 0.0054 | 256.8254 | 0.0054 | 1 | 4 | N-acetylmuramoyl-L-alanine amidase activity |
| GO:0004459 | 0.0068 | 192.6071 | 0.0068 | 1 | 5 | L-lactate dehydrogenase activity |
| GO:0016019 | 0.0068 | 192.6071 | 0.0068 | 1 | 5 | peptidoglycan receptor activity |
| GO:0042289 | 0.0081 | 154.0762 | 0.0081 | 1 | 6 | MHC class II protein binding |
| GOMFID | Pvalue | OddsRatio | ExpCount | Count | Size | Term |
| GO:0016810 | 0.0011 | 16.7299 | 0.2073 | 3 | 140 | hydrolase activity, acting on carbon-nitrogen (but not peptide) bonds |
| GO:0061135 | 0.0019 | 13.7823 | 0.2503 | 3 | 169 | endopeptidase regulator activity |
| GO:0030414 | 0.002 | 13.6165 | 0.2533 | 3 | 171 | peptidase inhibitor activity |
| GO:0004053 | 0.003 | 703.4783 | 0.003 | 1 | 2 | arginase activity |
| GO:0004991 | 0.003 | 703.4783 | 0.003 | 1 | 2 | parathyroid hormone receptor activity |
| GO:0004869 | 0.0031 | 27.1498 | 0.0829 | 2 | 56 | cysteine-type endopeptidase inhibitor activity |
| GO:0047844 | 0.0044 | 351.7174 | 0.0044 | 1 | 3 | deoxycytidine deaminase activity |
| GO:0008745 | 0.0059 | 234.4638 | 0.0059 | 1 | 4 | N-acetylmuramoyl-L-alanine amidase activity |
| GO:0004459 | 0.0074 | 175.837 | 0.0074 | 1 | 5 | L-lactate dehydrogenase activity |
| GO:0016019 | 0.0074 | 175.837 | 0.0074 | 1 | 5 | peptidoglycan receptor activity |
| GO:0042289 | 0.0089 | 140.6609 | 0.0089 | 1 | 6 | MHC class II protein binding |
| GOMFID | Pvalue | OddsRatio | ExpCount | Count | Size | Term |
| GO:0003727 | 4e-04 | 24.3003 | 0.1416 | 3 | 74 | single-stranded RNA binding |
| GO:0000334 | 0.0019 | Inf | 0.0019 | 1 | 1 | 3-hydroxyanthranilate 3,4-dioxygenase activity |
| GO:0016504 | 0.0021 | 32.7383 | 0.0689 | 2 | 36 | peptidase activator activity |
| GO:0008134 | 0.0025 | 6.0534 | 0.9622 | 5 | 503 | transcription factor binding |
| GO:0000253 | 0.0076 | 179.6778 | 0.0077 | 1 | 4 | 3-keto sterol reductase activity |
| GO:0044323 | 0.0076 | 179.6778 | 0.0077 | 1 | 4 | retinoic acid-responsive element binding |
| GOMFID | Pvalue | OddsRatio | ExpCount | Count | Size | Term |
| GO:0003727 | 0.0058 | 19.4541 | 0.1142 | 2 | 74 | single-stranded RNA binding |
| GO:0044323 | 0.0062 | 224.6806 | 0.0062 | 1 | 4 | retinoic acid-responsive element binding |
| GO:0008047 | 0.0064 | 6.112 | 0.7606 | 4 | 493 | enzyme activator activity |
| GO:0004111 | 0.0092 | 134.7917 | 0.0093 | 1 | 6 | creatine kinase activity |
| GO:0004308 | 0.0092 | 134.7917 | 0.0093 | 1 | 6 | exo-alpha-sialidase activity |
| GO:0061133 | 0.0092 | 134.7917 | 0.0093 | 1 | 6 | endopeptidase activator activity |
| GOMFID | Pvalue | OddsRatio | ExpCount | Count | Size | Term |
| GO:0005129 | 6e-04 | Inf | 6e-04 | 1 | 1 | granulocyte macrophage colony-stimulating factor receptor binding |
| GO:0004872 | 0.0011 | 9.9131 | 0.9189 | 5 | 1489 | receptor activity |
| GO:0010465 | 0.0012 | 1799.3333 | 0.0012 | 1 | 2 | nerve growth factor receptor activity |
| GO:0004971 | 0.0019 | 899.6111 | 0.0019 | 1 | 3 | AMPA glutamate receptor activity |
| GO:0005166 | 0.0019 | 899.6111 | 0.0019 | 1 | 3 | neurotrophin p75 receptor binding |
| GO:0099583 | 0.0019 | 899.6111 | 0.0019 | 1 | 3 | neurotransmitter receptor activity involved in regulation of postsynaptic cytosolic calcium ion concentration |
| GO:0048406 | 0.0037 | 359.7778 | 0.0037 | 1 | 6 | nerve growth factor binding |
| GO:0004888 | 0.0041 | 8.5534 | 0.7251 | 4 | 1175 | transmembrane signaling receptor activity |
| GO:0005004 | 0.0043 | 299.7963 | 0.0043 | 1 | 7 | GPI-linked ephrin receptor activity |
| GO:0004713 | 0.0049 | 23.2892 | 0.1074 | 2 | 174 | protein tyrosine kinase activity |
| GO:0005125 | 0.0074 | 18.6694 | 0.1333 | 2 | 216 | cytokine activity |
| GO:0005126 | 0.0087 | 17.511 | 0.1455 | 2 | 262 | cytokine receptor binding |
| GO:0042803 | 0.0092 | 8.8753 | 0.4622 | 3 | 749 | protein homodimerization activity |
| GO:0005123 | 0.0098 | 119.8519 | 0.0099 | 1 | 16 | death receptor binding |
| GOMFID | Pvalue | OddsRatio | ExpCount | Count | Size | Term |
| GO:0000979 | 1e-04 | 39.6866 | 0.0898 | 3 | 56 | RNA polymerase II core promoter sequence-specific DNA binding |
| GO:0001047 | 0.0021 | 13.2259 | 0.2583 | 3 | 161 | core promoter binding |
| GO:0001012 | 0.0022 | 6.3243 | 0.9498 | 5 | 592 | RNA polymerase II regulatory region DNA binding |
| GO:0000976 | 0.0038 | 5.5546 | 1.075 | 5 | 670 | transcription regulatory region sequence-specific DNA binding |
| GO:0043565 | 0.0042 | 4.6027 | 1.598 | 6 | 996 | sequence-specific DNA binding |
| GO:0000981 | 0.0056 | 5.0388 | 1.1793 | 5 | 735 | RNA polymerase II transcription factor activity, sequence-specific DNA binding |
| GO:0010385 | 0.0064 | 215.68 | 0.0064 | 1 | 4 | double-stranded methylated DNA binding |
| GO:0044323 | 0.0064 | 215.68 | 0.0064 | 1 | 4 | retinoic acid-responsive element binding |
| GO:0008270 | 0.0067 | 4.8172 | 1.2306 | 5 | 767 | zinc ion binding |
| GO:0000975 | 0.0087 | 4.5059 | 1.3108 | 5 | 817 | regulatory region DNA binding |
| GOMFID | Pvalue | OddsRatio | ExpCount | Count | Size | Term |
| GO:0008502 | 0 | Inf | 0.0042 | 2 | 2 | melatonin receptor activity |
| GO:0008843 | 0.0021 | Inf | 0.0021 | 1 | 1 | endochitinase activity |
| GO:0033798 | 0.0021 | Inf | 0.0021 | 1 | 1 | thyroxine 5-deiodinase activity |
| GO:0015459 | 0.0042 | 22.9077 | 0.0965 | 2 | 46 | potassium channel regulator activity |
| GO:0036461 | 0.0042 | 490 | 0.0042 | 1 | 2 | BLOC-2 complex binding |
| GO:0042284 | 0.0042 | 490 | 0.0042 | 1 | 2 | sphingolipid delta-4 desaturase activity |
| GO:0004800 | 0.0063 | 244.9848 | 0.0063 | 1 | 3 | thyroxine 5'-deiodinase activity |
| GO:0035651 | 0.0063 | 244.9848 | 0.0063 | 1 | 3 | AP-3 adaptor complex binding |
| GO:0035650 | 0.0084 | 163.3131 | 0.0084 | 1 | 4 | AP-1 adaptor complex binding |
| GO:0008236 | 0.0091 | 7.6123 | 0.4322 | 3 | 206 | serine-type peptidase activity |
| GOMFID | Pvalue | OddsRatio | ExpCount | Count | Size | Term |
| GO:0032394 | 0 | Inf | 0.0031 | 2 | 2 | MHC class Ib receptor activity |
| GO:0042288 | 0 | 146.9545 | 0.0278 | 3 | 18 | MHC class I protein binding |
| GO:0048020 | 0.0016 | 37.9389 | 0.0602 | 2 | 39 | CCR chemokine receptor binding |
| GO:0008009 | 0.0025 | 30.4991 | 0.0741 | 2 | 48 | chemokine activity |
| GO:0004252 | 0.0025 | 12.3998 | 0.2761 | 3 | 179 | serine-type endopeptidase activity |
| GO:0005171 | 0.0031 | 674.125 | 0.0031 | 1 | 2 | hepatocyte growth factor receptor binding |
| GO:0046556 | 0.0031 | 674.125 | 0.0031 | 1 | 2 | alpha-L-arabinofuranosidase activity |
| GO:0017171 | 0.0041 | 10.4712 | 0.3255 | 3 | 211 | serine hydrolase activity |
| GO:0004663 | 0.0046 | 337.0417 | 0.0046 | 1 | 3 | Rab geranylgeranyltransferase activity |
| GO:0030246 | 0.0072 | 8.4487 | 0.4011 | 3 | 260 | carbohydrate binding |
| GO:0004046 | 0.0077 | 168.5 | 0.0077 | 1 | 5 | aminoacylase activity |
| GO:0005096 | 0.008 | 8.1272 | 0.4165 | 3 | 270 | GTPase activator activity |
| GO:0008318 | 0.0092 | 134.7917 | 0.0093 | 1 | 6 | protein prenyltransferase activity |
| GO:0016427 | 0.0092 | 134.7917 | 0.0093 | 1 | 6 | tRNA (cytosine) methyltransferase activity |
| GOMFID | Pvalue | OddsRatio | ExpCount | Count | Size | Term |
| GO:0004744 | 0.0016 | Inf | 0.0016 | 1 | 1 | retinal isomerase activity |
| GO:0036487 | 0.0016 | Inf | 0.0016 | 1 | 1 | nitric-oxide synthase inhibitor activity |
| GO:0052884 | 0.0016 | Inf | 0.0016 | 1 | 1 | all-trans-retinyl-palmitate hydrolase, 11-cis retinol forming activity |
| GO:0052885 | 0.0016 | Inf | 0.0016 | 1 | 1 | all-trans-retinyl-ester hydrolase, 11-cis retinol forming activity |
| GO:0046976 | 0.008 | 161.75 | 0.008 | 1 | 5 | histone methyltransferase activity (H3-K27 specific) |
| GOMFID | Pvalue | OddsRatio | ExpCount | Count | Size | Term |
| GO:0004667 | 0.0031 | 674.125 | 0.0031 | 1 | 2 | prostaglandin-D synthase activity |
| GO:0004947 | 0.0031 | 674.125 | 0.0031 | 1 | 2 | bradykinin receptor activity |
| GO:0045029 | 0.0031 | 674.125 | 0.0031 | 1 | 2 | UDP-activated nucleotide receptor activity |
| GO:0071553 | 0.0031 | 674.125 | 0.0031 | 1 | 2 | G-protein coupled pyrimidinergic nucleotide receptor activity |
| GO:0004165 | 0.0046 | 337.0417 | 0.0046 | 1 | 3 | dodecenoyl-CoA delta-isomerase activity |
| GO:0016508 | 0.0046 | 337.0417 | 0.0046 | 1 | 3 | long-chain-enoyl-CoA hydratase activity |
| GO:0035594 | 0.0062 | 224.6806 | 0.0062 | 1 | 4 | ganglioside binding |
| GO:0051425 | 0.0062 | 224.6806 | 0.0062 | 1 | 4 | PTB domain binding |
| GO:0019534 | 0.0077 | 168.5 | 0.0077 | 1 | 5 | toxin transmembrane transporter activity |
| GO:0016427 | 0.0092 | 134.7917 | 0.0093 | 1 | 6 | tRNA (cytosine) methyltransferase activity |
| GOMFID | Pvalue | OddsRatio | ExpCount | Count | Size | Term |
| GO:0032089 | 0.0031 | 674.125 | 0.0031 | 1 | 2 | NACHT domain binding |
| GO:0051425 | 0.0062 | 224.6806 | 0.0062 | 1 | 4 | PTB domain binding |
| GO:0016427 | 0.0092 | 134.7917 | 0.0093 | 1 | 6 | tRNA (cytosine) methyltransferase activity |
| GOMFID | Pvalue | OddsRatio | ExpCount | Count | Size | Term |
| GO:0005509 | 0.0014 | 5.6954 | 1.2626 | 6 | 660 | calcium ion binding |
| GO:0004693 | 0.0015 | 39.7685 | 0.0574 | 2 | 30 | cyclin-dependent protein serine/threonine kinase activity |
| GO:0046523 | 0.0019 | Inf | 0.0019 | 1 | 1 | S-methyl-5-thioribose-1-phosphate isomerase activity |
| GO:0030354 | 0.0038 | 539.1 | 0.0038 | 1 | 2 | melanin-concentrating hormone activity |
| GO:0004980 | 0.0057 | 269.5333 | 0.0057 | 1 | 3 | melanocyte-stimulating hormone receptor activity |
| GOMFID | Pvalue | OddsRatio | ExpCount | Count | Size | Term |
| GO:0008009 | 1e-04 | 41.3615 | 0.0859 | 3 | 48 | chemokine activity |
| GO:0004435 | 0.0011 | 47.8548 | 0.0483 | 2 | 27 | phosphatidylinositol phospholipase C activity |
| GO:0005126 | 0.0012 | 9.8329 | 0.4707 | 4 | 263 | cytokine receptor binding |
| GO:0048020 | 0.0016 | 38.7981 | 0.0588 | 2 | 34 | CCR chemokine receptor binding |
| GO:0003827 | 0.0018 | Inf | 0.0018 | 1 | 1 | alpha-1,3-mannosylglycoprotein 2-beta-N-acetylglucosaminyltransferase activity |
| GO:0030107 | 0.0018 | Inf | 0.0018 | 1 | 1 | HLA-A specific inhibitory MHC class I receptor activity |
| GO:0035717 | 0.0018 | Inf | 0.0018 | 1 | 1 | chemokine (C-C motif) ligand 7 binding |
| GO:0045127 | 0.0018 | Inf | 0.0018 | 1 | 1 | N-acetylglucosamine kinase activity |
| GO:0030109 | 0.0036 | 577.6786 | 0.0036 | 1 | 2 | HLA-B specific inhibitory MHC class I receptor activity |
| GO:0071791 | 0.0036 | 577.6786 | 0.0036 | 1 | 2 | chemokine (C-C motif) ligand 5 binding |
| GO:0099600 | 0.0048 | 3.9284 | 2.1815 | 7 | 1219 | transmembrane receptor activity |
| GO:0001730 | 0.0054 | 288.8214 | 0.0054 | 1 | 3 | 2'-5'-oligoadenylate synthetase activity |
| GO:0004965 | 0.0054 | 288.8214 | 0.0054 | 1 | 3 | G-protein coupled GABA receptor activity |
| GO:0005124 | 0.0054 | 288.8214 | 0.0054 | 1 | 3 | scavenger receptor binding |
| GO:0047374 | 0.0054 | 288.8214 | 0.0054 | 1 | 3 | methylumbelliferyl-acetate deacetylase activity |
| GO:0004871 | 0.0054 | 3.5266 | 2.8365 | 8 | 1585 | signal transducer activity |
| GO:0004872 | 0.0069 | 8.6913 | 0.3964 | 3 | 270 | receptor activity |
| GO:0004698 | 0.0071 | 192.5357 | 0.0072 | 1 | 4 | calcium-dependent protein kinase C activity |
| GO:0004771 | 0.0071 | 192.5357 | 0.0072 | 1 | 4 | sterol esterase activity |
| GO:0004982 | 0.0071 | 192.5357 | 0.0072 | 1 | 4 | N-formyl peptide receptor activity |
| GO:0048018 | 0.0077 | 5.7088 | 0.7964 | 4 | 445 | receptor ligand activity |
| GO:0030883 | 0.0089 | 144.3929 | 0.0089 | 1 | 5 | endogenous lipid antigen binding |
| GO:0030884 | 0.0089 | 144.3929 | 0.0089 | 1 | 5 | exogenous lipid antigen binding |
| GO:0031726 | 0.0089 | 144.3929 | 0.0089 | 1 | 5 | CCR1 chemokine receptor binding |
| GOMFID | Pvalue | OddsRatio | ExpCount | Count | Size | Term |
| GO:0004872 | 0 | 6.2846 | 2.8484 | 12 | 1489 | receptor activity |
| GO:0008009 | 1e-04 | 38.4024 | 0.0918 | 3 | 48 | chemokine activity |
| GO:0004888 | 0.0013 | 4.4729 | 2.2478 | 8 | 1175 | transmembrane signaling receptor activity |
| GO:0030246 | 0.0014 | 9.2118 | 0.4974 | 4 | 260 | carbohydrate binding |
| GO:0005126 | 0.0015 | 9.1034 | 0.5031 | 4 | 263 | cytokine receptor binding |
| GO:0048020 | 0.0018 | 36.0223 | 0.063 | 2 | 34 | CCR chemokine receptor binding |
| GO:0003827 | 0.0019 | Inf | 0.0019 | 1 | 1 | alpha-1,3-mannosylglycoprotein 2-beta-N-acetylglucosaminyltransferase activity |
| GO:0030107 | 0.0019 | Inf | 0.0019 | 1 | 1 | HLA-A specific inhibitory MHC class I receptor activity |
| GO:0035717 | 0.0019 | Inf | 0.0019 | 1 | 1 | chemokine (C-C motif) ligand 7 binding |
| GO:0045127 | 0.0019 | Inf | 0.0019 | 1 | 1 | N-acetylglucosamine kinase activity |
| GO:0004871 | 0.0022 | 3.7893 | 3.0321 | 9 | 1585 | signal transducer activity |
| GO:0030109 | 0.0038 | 539.1 | 0.0038 | 1 | 2 | HLA-B specific inhibitory MHC class I receptor activity |
| GO:0071791 | 0.0038 | 539.1 | 0.0038 | 1 | 2 | chemokine (C-C motif) ligand 5 binding |
| GO:0001730 | 0.0057 | 269.5333 | 0.0057 | 1 | 3 | 2'-5'-oligoadenylate synthetase activity |
| GO:0004965 | 0.0057 | 269.5333 | 0.0057 | 1 | 3 | G-protein coupled GABA receptor activity |
| GO:0005124 | 0.0057 | 269.5333 | 0.0057 | 1 | 3 | scavenger receptor binding |
| GO:0047374 | 0.0057 | 269.5333 | 0.0057 | 1 | 3 | methylumbelliferyl-acetate deacetylase activity |
| GO:0004698 | 0.0076 | 179.6778 | 0.0077 | 1 | 4 | calcium-dependent protein kinase C activity |
| GO:0004771 | 0.0076 | 179.6778 | 0.0077 | 1 | 4 | sterol esterase activity |
| GO:0004982 | 0.0076 | 179.6778 | 0.0077 | 1 | 4 | N-formyl peptide receptor activity |
| GO:0019863 | 0.0095 | 134.75 | 0.0096 | 1 | 5 | IgE binding |
| GO:0030883 | 0.0095 | 134.75 | 0.0096 | 1 | 5 | endogenous lipid antigen binding |
| GO:0030884 | 0.0095 | 134.75 | 0.0096 | 1 | 5 | exogenous lipid antigen binding |
| GO:0031726 | 0.0095 | 134.75 | 0.0096 | 1 | 5 | CCR1 chemokine receptor binding |
| GO:0048018 | 0.0098 | 5.2853 | 0.8513 | 4 | 445 | receptor ligand activity |
| GOMFID | Pvalue | OddsRatio | ExpCount | Count | Size | Term |
| GO:0008009 | 1e-04 | 44.8139 | 0.08 | 3 | 48 | chemokine activity |
| GO:0008061 | 1e-04 | 215.6267 | 0.0133 | 2 | 8 | chitin binding |
| GO:0001664 | 8e-04 | 10.9031 | 0.4299 | 4 | 258 | G-protein coupled receptor binding |
| GO:0048020 | 8e-04 | 53.99 | 0.0432 | 2 | 28 | CCR chemokine receptor binding |
| GO:0005126 | 9e-04 | 10.6893 | 0.4382 | 4 | 263 | cytokine receptor binding |
| GO:0008843 | 0.0017 | Inf | 0.0017 | 1 | 1 | endochitinase activity |
| GO:0036470 | 0.0017 | Inf | 0.0017 | 1 | 1 | tyrosine 3-monooxygenase activator activity |
| GO:0036478 | 0.0017 | Inf | 0.0017 | 1 | 1 | L-dopa decarboxylase activator activity |
| GO:0036524 | 0.0017 | Inf | 0.0017 | 1 | 1 | protein deglycase activity |
| GO:0045340 | 0.0017 | Inf | 0.0017 | 1 | 1 | mercury ion binding |
| GO:0016532 | 0.0033 | 622.1923 | 0.0033 | 1 | 2 | superoxide dismutase copper chaperone activity |
| GO:0031731 | 0.005 | 311.0769 | 0.005 | 1 | 3 | CCR6 chemokine receptor binding |
| GO:0047894 | 0.005 | 311.0769 | 0.005 | 1 | 3 | flavonol 3-sulfotransferase activity |
| GO:1903135 | 0.005 | 311.0769 | 0.005 | 1 | 3 | cupric ion binding |
| GO:0004568 | 0.0064 | 215.6667 | 0.0064 | 1 | 4 | chitinase activity |
| GO:0004583 | 0.0066 | 207.3718 | 0.0067 | 1 | 4 | dolichyl-phosphate-glucose-glycolipid alpha-glucosyltransferase activity |
| GO:0004698 | 0.0066 | 207.3718 | 0.0067 | 1 | 4 | calcium-dependent protein kinase C activity |
| GO:0050294 | 0.0066 | 207.3718 | 0.0067 | 1 | 4 | steroid sulfotransferase activity |
| GO:0016530 | 0.0083 | 155.5192 | 0.0083 | 1 | 5 | metallochaperone activity |
| GO:0031726 | 0.0083 | 155.5192 | 0.0083 | 1 | 5 | CCR1 chemokine receptor binding |
| GO:0032184 | 0.0083 | 155.5192 | 0.0083 | 1 | 5 | SUMO polymer binding |
| GO:0044388 | 0.0083 | 155.5192 | 0.0083 | 1 | 5 | small protein activating enzyme binding |
| GO:1903136 | 0.0083 | 155.5192 | 0.0083 | 1 | 5 | cuprous ion binding |
| GO:0031730 | 0.01 | 124.4077 | 0.01 | 1 | 6 | CCR5 chemokine receptor binding |
| GOMFID | Pvalue | OddsRatio | ExpCount | Count | Size | Term |
| GO:0036470 | 0.0015 | Inf | 0.0015 | 1 | 1 | tyrosine 3-monooxygenase activator activity |
| GO:0036478 | 0.0015 | Inf | 0.0015 | 1 | 1 | L-dopa decarboxylase activator activity |
| GO:0036524 | 0.0015 | Inf | 0.0015 | 1 | 1 | protein deglycase activity |
| GO:0045340 | 0.0015 | Inf | 0.0015 | 1 | 1 | mercury ion binding |
| GO:0016532 | 0.003 | 703.4783 | 0.003 | 1 | 2 | superoxide dismutase copper chaperone activity |
| GO:1903135 | 0.0044 | 351.7174 | 0.0044 | 1 | 3 | cupric ion binding |
| GO:0004583 | 0.0059 | 234.4638 | 0.0059 | 1 | 4 | dolichyl-phosphate-glucose-glycolipid alpha-glucosyltransferase activity |
| GO:0016530 | 0.0074 | 175.837 | 0.0074 | 1 | 5 | metallochaperone activity |
| GO:0044388 | 0.0074 | 175.837 | 0.0074 | 1 | 5 | small protein activating enzyme binding |
| GO:1903136 | 0.0074 | 175.837 | 0.0074 | 1 | 5 | cuprous ion binding |
| GOMFID | Pvalue | OddsRatio | ExpCount | Count | Size | Term |
| GO:0001637 | 1e-04 | 140.6087 | 0.0185 | 2 | 25 | G-protein coupled chemoattractant receptor activity |
| GO:0070095 | 0.0015 | 1472 | 0.0015 | 1 | 2 | fructose-6-phosphate binding |
| GO:0071791 | 0.0015 | 1472 | 0.0015 | 1 | 2 | chemokine (C-C motif) ligand 5 binding |
| GO:0004896 | 0.0017 | 39.7827 | 0.0615 | 2 | 83 | cytokine receptor activity |
| GO:0031781 | 0.003 | 490.6061 | 0.003 | 1 | 4 | type 3 melanocortin receptor binding |
| GO:0031782 | 0.003 | 490.6061 | 0.003 | 1 | 4 | type 4 melanocortin receptor binding |
| GO:0001653 | 0.0036 | 26.5653 | 0.0911 | 2 | 123 | peptide receptor activity |
| GO:0016494 | 0.0052 | 245.2576 | 0.0052 | 1 | 7 | C-X-C chemokine receptor activity |
| GO:0030215 | 0.0074 | 163.4747 | 0.0074 | 1 | 10 | semaphorin receptor binding |
| GO:0016493 | 0.0089 | 133.7355 | 0.0089 | 1 | 12 | C-C chemokine receptor activity |
| GOMFID | Pvalue | OddsRatio | ExpCount | Count | Size | Term |
| GO:0015130 | 7e-04 | Inf | 7e-04 | 1 | 1 | mevalonate transmembrane transporter activity |
| GO:0010465 | 0.0014 | 1619.3 | 0.0014 | 1 | 2 | nerve growth factor receptor activity |
| GO:0045523 | 0.0014 | 1619.3 | 0.0014 | 1 | 2 | interleukin-27 receptor binding |
| GO:0005166 | 0.002 | 809.6 | 0.002 | 1 | 3 | neurotrophin p75 receptor binding |
| GO:0030369 | 0.002 | 809.6 | 0.002 | 1 | 3 | ICAM-3 receptor activity |
| GO:0015129 | 0.0034 | 404.75 | 0.0034 | 1 | 5 | lactate transmembrane transporter activity |
| GO:0048406 | 0.0041 | 323.78 | 0.0041 | 1 | 6 | nerve growth factor binding |
| GO:0005004 | 0.0047 | 269.8 | 0.0048 | 1 | 7 | GPI-linked ephrin receptor activity |
| GO:0004065 | 0.0054 | 231.2429 | 0.0054 | 1 | 8 | arylsulfatase activity |
| GO:0005509 | 0.0087 | 8.8682 | 0.448 | 3 | 660 | calcium ion binding |
| GO:0005125 | 0.009 | 16.594 | 0.1466 | 2 | 216 | cytokine activity |
| GOMFID | Pvalue | OddsRatio | ExpCount | Count | Size | Term |
| GO:0001227 | 4e-04 | 13.5002 | 0.3514 | 4 | 219 | transcriptional repressor activity, RNA polymerase II transcription regulatory region sequence-specific binding |
| GO:0005307 | 0.0016 | Inf | 0.0016 | 1 | 1 | choline:sodium symporter activity |
| GO:0036313 | 0.0032 | 647.12 | 0.0032 | 1 | 2 | phosphatidylinositol 3-kinase catalytic subunit binding |
| GO:0033829 | 0.0048 | 323.54 | 0.0048 | 1 | 3 | O-fucosylpeptide 3-beta-N-acetylglucosaminyltransferase activity |
| GO:0008013 | 0.0062 | 18.6424 | 0.1187 | 2 | 74 | beta-catenin binding |
| GO:0004095 | 0.0064 | 215.68 | 0.0064 | 1 | 4 | carnitine O-palmitoyltransferase activity |
| GO:0033265 | 0.0064 | 215.68 | 0.0064 | 1 | 4 | choline binding |
| GO:0005134 | 0.008 | 161.75 | 0.008 | 1 | 5 | interleukin-2 receptor binding |
| GO:0001158 | 0.0087 | 15.594 | 0.1412 | 2 | 88 | enhancer sequence-specific DNA binding |
| NA. |
| n/a |
| GOMFID | Pvalue | OddsRatio | ExpCount | Count | Size | Term |
| GO:0048020 | 5e-04 | 72.7658 | 0.0337 | 2 | 39 | CCR chemokine receptor binding |
| GO:0008009 | 8e-04 | 58.4964 | 0.0415 | 2 | 48 | chemokine activity |
| GO:0005126 | 0.0013 | 16.7108 | 0.2272 | 3 | 263 | cytokine receptor binding |
| GO:0048018 | 0.006 | 9.7176 | 0.3844 | 3 | 445 | receptor ligand activity |
| GO:0015467 | 0.0086 | 138.3077 | 0.0086 | 1 | 10 | G-protein activated inward rectifier potassium channel activity |
| GO:0039706 | 0.0086 | 138.3077 | 0.0086 | 1 | 10 | co-receptor binding |
| GOMFID | Pvalue | OddsRatio | ExpCount | Count | Size | Term |
| GO:0001965 | 3e-04 | 100.1053 | 0.0246 | 2 | 19 | G-protein alpha-subunit binding |
| GO:0033829 | 0.0039 | 404.55 | 0.0039 | 1 | 3 | O-fucosylpeptide 3-beta-N-acetylglucosaminyltransferase activity |
| GOMFID | Pvalue | OddsRatio | ExpCount | Count | Size | Term |
| GO:0004033 | 3e-04 | 103.6282 | 0.0241 | 2 | 26 | aldo-keto reductase (NADP) activity |
| GO:0018455 | 9e-04 | Inf | 9e-04 | 1 | 1 | alcohol dehydrogenase [NAD(P)+] activity |
| GO:0047042 | 9e-04 | Inf | 9e-04 | 1 | 1 | androsterone dehydrogenase (B-specific) activity |
| GO:0016655 | 0.001 | 51.7372 | 0.0463 | 2 | 50 | oxidoreductase activity, acting on NAD(P)H, quinone or similar compound as acceptor |
| GO:0047006 | 0.0019 | 1156.3571 | 0.0019 | 1 | 2 | 17-alpha,20-alpha-dihydroxypregn-4-en-3-one dehydrogenase activity |
| GO:0018636 | 0.0028 | 578.1429 | 0.0028 | 1 | 3 | phenanthrene 9,10-monooxygenase activity |
| GO:0035662 | 0.0028 | 578.1429 | 0.0028 | 1 | 3 | Toll-like receptor 4 binding |
| GO:0047086 | 0.0028 | 578.1429 | 0.0028 | 1 | 3 | ketosteroid monooxygenase activity |
| GO:0047718 | 0.0028 | 578.1429 | 0.0028 | 1 | 3 | indanol dehydrogenase activity |
| GO:0047844 | 0.0028 | 578.1429 | 0.0028 | 1 | 3 | deoxycytidine deaminase activity |
| GO:0000253 | 0.0037 | 385.4048 | 0.0037 | 1 | 4 | 3-keto sterol reductase activity |
| GO:0004090 | 0.0037 | 385.4048 | 0.0037 | 1 | 4 | carbonyl reductase (NADPH) activity |
| GO:0008745 | 0.0037 | 385.4048 | 0.0037 | 1 | 4 | N-acetylmuramoyl-L-alanine amidase activity |
| GO:0047115 | 0.0037 | 385.4048 | 0.0037 | 1 | 4 | trans-1,2-dihydrobenzene-1,2-diol dehydrogenase activity |
| GO:0008270 | 0.0045 | 7.3523 | 0.71 | 4 | 767 | zinc ion binding |
| GO:0016019 | 0.0046 | 289.0357 | 0.0046 | 1 | 5 | peptidoglycan receptor activity |
| GO:0050544 | 0.0046 | 289.0357 | 0.0046 | 1 | 5 | arachidonic acid binding |
| GO:0016614 | 0.0064 | 19.1544 | 0.1213 | 2 | 131 | oxidoreductase activity, acting on CH-OH group of donors |
| GO:0004032 | 0.0065 | 192.6667 | 0.0065 | 1 | 7 | alditol:NADP+ 1-oxidoreductase activity |
| GO:0016810 | 0.0072 | 17.8952 | 0.1296 | 2 | 140 | hydrolase activity, acting on carbon-nitrogen (but not peptide) bonds |
| GO:0004126 | 0.0074 | 165.1327 | 0.0074 | 1 | 8 | cytidine deaminase activity |
| GO:0032052 | 0.0083 | 144.4821 | 0.0083 | 1 | 9 | bile acid binding |
| GO:0052650 | 0.0083 | 144.4821 | 0.0083 | 1 | 9 | NADP-retinol dehydrogenase activity |
| GO:0070700 | 0.0083 | 144.4821 | 0.0083 | 1 | 9 | BMP receptor binding |
| GOMFID | Pvalue | OddsRatio | ExpCount | Count | Size | Term |
| GO:0003755 | 0 | 55.344 | 0.0657 | 3 | 38 | peptidyl-prolyl cis-trans isomerase activity |
| GO:0030377 | 0.0017 | Inf | 0.0017 | 1 | 1 | urokinase plasminogen activator receptor activity |
| GO:0102339 | 0.0017 | Inf | 0.0017 | 1 | 1 | 3-oxo-arachidoyl-CoA reductase activity |
| GO:0102340 | 0.0017 | Inf | 0.0017 | 1 | 1 | 3-oxo-behenoyl-CoA reductase activity |
| GO:0102341 | 0.0017 | Inf | 0.0017 | 1 | 1 | 3-oxo-lignoceroyl-CoA reductase activity |
| GO:0102342 | 0.0017 | Inf | 0.0017 | 1 | 1 | 3-oxo-cerotoyl-CoA reductase activity |
| GO:0016853 | 0.0018 | 13.8458 | 0.2454 | 3 | 142 | isomerase activity |
| GO:0004666 | 0.0035 | 599.1111 | 0.0035 | 1 | 2 | prostaglandin-endoperoxide synthase activity |
| GO:0016509 | 0.0052 | 299.537 | 0.0052 | 1 | 3 | long-chain-3-hydroxyacyl-CoA dehydrogenase activity |
| GOMFID | Pvalue | OddsRatio | ExpCount | Count | Size | Term |
| GO:0033862 | 0.0024 | Inf | 0.0024 | 1 | 1 | UMP kinase activity |
| GO:0035717 | 0.0024 | Inf | 0.0024 | 1 | 1 | chemokine (C-C motif) ligand 7 binding |
| GO:0047730 | 0.0024 | Inf | 0.0024 | 1 | 1 | carnosine synthase activity |
| GO:0102102 | 0.0024 | Inf | 0.0024 | 1 | 1 | homocarnosine synthase activity |
| GO:0102339 | 0.0024 | Inf | 0.0024 | 1 | 1 | 3-oxo-arachidoyl-CoA reductase activity |
| GO:0102340 | 0.0024 | Inf | 0.0024 | 1 | 1 | 3-oxo-behenoyl-CoA reductase activity |
| GO:0102341 | 0.0024 | Inf | 0.0024 | 1 | 1 | 3-oxo-lignoceroyl-CoA reductase activity |
| GO:0102342 | 0.0024 | Inf | 0.0024 | 1 | 1 | 3-oxo-cerotoyl-CoA reductase activity |
| GO:0004666 | 0.0048 | 425.3947 | 0.0048 | 1 | 2 | prostaglandin-endoperoxide synthase activity |
| GO:0004798 | 0.0048 | 425.3947 | 0.0048 | 1 | 2 | thymidylate kinase activity |
| GO:0047057 | 0.0048 | 425.3947 | 0.0048 | 1 | 2 | vitamin-K-epoxide reductase (warfarin-sensitive) activity |
| GO:0071791 | 0.0048 | 425.3947 | 0.0048 | 1 | 2 | chemokine (C-C motif) ligand 5 binding |
| GO:0004829 | 0.0072 | 212.6842 | 0.0072 | 1 | 3 | threonine-tRNA ligase activity |
| GO:0016509 | 0.0072 | 212.6842 | 0.0072 | 1 | 3 | long-chain-3-hydroxyacyl-CoA dehydrogenase activity |
| GO:0004127 | 0.0096 | 141.7807 | 0.0096 | 1 | 4 | cytidylate kinase activity |
| GO:1905394 | 0.0096 | 141.7807 | 0.0096 | 1 | 4 | retromer complex binding |
| GOMFID | Pvalue | OddsRatio | ExpCount | Count | Size | Term |
| GO:0032394 | 0 | Inf | 0.0052 | 2 | 2 | MHC class Ib receptor activity |
| GO:0042288 | 0.001 | 50.4594 | 0.0467 | 2 | 18 | MHC class I protein binding |
| GO:0031855 | 0.0026 | Inf | 0.0026 | 1 | 1 | oxytocin receptor binding |
| GO:0033897 | 0.0026 | Inf | 0.0026 | 1 | 1 | ribonuclease T2 activity |
| GO:0030246 | 0.0045 | 6.5407 | 0.6739 | 4 | 260 | carbohydrate binding |
| GO:0005185 | 0.0052 | 394.1951 | 0.0052 | 1 | 2 | neurohypophyseal hormone activity |
| GO:0098640 | 0.0052 | 394.1951 | 0.0052 | 1 | 2 | integrin binding involved in cell-matrix adhesion |
| NA. |
| n/a |
| NA. |
| n/a |
| NA. |
| n/a |
| NA. |
| n/a |
| NA. |
| n/a |
| NA. |
| n/a |
| NA. |
| n/a |
| NA. |
| n/a |
| NA. |
| n/a |
| NA. |
| n/a |
| NA. |
| n/a |
| NA. |
| n/a |
| NA. |
| n/a |
| NA. |
| n/a |
| NA. |
| n/a |
| NA. |
| n/a |
| NA. |
| n/a |
| NA. |
| n/a |
| NA. |
| n/a |
| NA. |
| n/a |
| NA. |
| n/a |
| NA. |
| n/a |
| NA. |
| n/a |
| NA. |
| n/a |
| NA. |
| n/a |
| NA. |
| n/a |
| NA. |
| n/a |
| NA. |
| n/a |
| NA. |
| n/a |
| NA. |
| n/a |
| NA. |
| n/a |
| NA. |
| n/a |
| NA. |
| n/a |
| NA. |
| n/a |
| NA. |
| n/a |
| NA. |
| n/a |
| NA. |
| n/a |
| NA. |
| n/a |
| NA. |
| n/a |
| NA. |
| n/a |
| NA. |
| n/a |
| NA. |
| n/a |
| NA. |
| n/a |
| NA. |
| n/a |
| NA. |
| n/a |
| NA. |
| n/a |
| NA. |
| n/a |
| NA. |
| n/a |
| NA. |
| n/a |
| NA. |
| n/a |
| NA. |
| n/a |
| NA. |
| n/a |
| NA. |
| n/a |
| NA. |
| n/a |
| NA. |
| n/a |
| NA. |
| n/a |
| GOMFID | Pvalue | OddsRatio | ExpCount | Count | Size | Term |
| GO:0007156 | 0 | 19.9187 | 1.1052 | 17 | 152 | homophilic cell adhesion via plasma membrane adhesion molecules |
| GO:0016339 | 0 | 69.9314 | 0.2036 | 9 | 28 | calcium-dependent cell-cell adhesion via plasma membrane cell adhesion molecules |
| GO:0007416 | 0 | 15.7071 | 1.0107 | 13 | 139 | synapse assembly |
| GO:0007267 | 0 | 4.3272 | 11.0518 | 36 | 1520 | cell-cell signaling |
| GO:0032502 | 0 | 4.9522 | 9.3955 | 30 | 1640 | developmental process |
| GO:0007268 | 0 | 5.6153 | 4.2535 | 20 | 585 | chemical synaptic transmission |
| GO:0099537 | 0 | 5.5948 | 4.268 | 20 | 587 | trans-synaptic signaling |
| GO:0098609 | 0 | 4.9105 | 5.6713 | 23 | 780 | cell-cell adhesion |
| GO:0032501 | 0 | 2.9234 | 39.0207 | 65 | 5921 | multicellular organismal process |
| GO:0009890 | 0 | 3.2271 | 11.8734 | 31 | 1633 | negative regulation of biosynthetic process |
| GO:1902679 | 0 | 3.6189 | 8.2816 | 25 | 1139 | negative regulation of RNA biosynthetic process |
| GO:0080090 | 0 | 2.4559 | 42.2441 | 68 | 5810 | regulation of primary metabolic process |
| GO:0051171 | 0 | 2.3843 | 41.1753 | 66 | 5663 | regulation of nitrogen compound metabolic process |
| GO:0048562 | 0 | 6.6665 | 1.8606 | 11 | 260 | embryonic organ morphogenesis |
| GO:0009954 | 0 | 27.3741 | 0.2254 | 5 | 31 | proximal/distal pattern formation |
| GO:0045934 | 0 | 3.1203 | 9.9176 | 26 | 1364 | negative regulation of nucleobase-containing compound metabolic process |
| GO:0031323 | 0 | 2.2975 | 43.1021 | 67 | 5928 | regulation of cellular metabolic process |
| GO:0022610 | 0 | 3.0729 | 9.6049 | 25 | 1321 | biological adhesion |
| GO:0090596 | 0 | 10.8084 | 0.7306 | 7 | 104 | sensory organ morphogenesis |
| GO:0000122 | 0 | 3.7389 | 5.5114 | 18 | 758 | negative regulation of transcription from RNA polymerase II promoter |
| GO:0010605 | 0 | 2.5143 | 18.8899 | 38 | 2598 | negative regulation of macromolecule metabolic process |
| GO:0048663 | 0 | 13.8672 | 0.4944 | 6 | 68 | neuron fate commitment |
| GO:0048598 | 0 | 5.8093 | 1.9223 | 10 | 292 | embryonic morphogenesis |
| GO:0034654 | 0 | 2.2035 | 29.6727 | 50 | 4081 | nucleobase-containing compound biosynthetic process |
| GO:0060173 | 0 | 7.16 | 1.2361 | 8 | 170 | limb development |
| GO:0007405 | 0 | 14.5042 | 0.3926 | 5 | 54 | neuroblast proliferation |
| GO:0072272 | 1e-04 | Inf | 0.0145 | 2 | 2 | proximal/distal pattern formation involved in metanephric nephron development |
| GO:0009952 | 1e-04 | 6.7029 | 1.3161 | 8 | 184 | anterior/posterior pattern specification |
| GO:0021521 | 1e-04 | 52.5098 | 0.08 | 3 | 11 | ventral spinal cord interneuron specification |
| GO:0021872 | 1e-04 | 13.1572 | 0.429 | 5 | 59 | forebrain generation of neurons |
| GO:0055015 | 1e-04 | 46.6725 | 0.0873 | 3 | 12 | ventricular cardiac muscle cell development |
| GO:0045944 | 1e-04 | 2.9303 | 7.7726 | 20 | 1069 | positive regulation of transcription from RNA polymerase II promoter |
| GO:0035107 | 1e-04 | 7.2993 | 1.0543 | 7 | 145 | appendage morphogenesis |
| GO:0034645 | 1e-04 | 2.0145 | 35.8166 | 55 | 4926 | cellular macromolecule biosynthetic process |
| GO:0001708 | 1e-04 | 11.113 | 0.5007 | 5 | 70 | cell fate specification |
| GO:0001755 | 1e-04 | 17.0952 | 0.269 | 4 | 37 | neural crest cell migration |
| GO:0008284 | 2e-04 | 3.0523 | 6.2457 | 17 | 859 | positive regulation of cell proliferation |
| GO:0003350 | 2e-04 | 277.7586 | 0.0218 | 2 | 3 | pulmonary myocardium development |
| GO:0055014 | 2e-04 | 277.7586 | 0.0218 | 2 | 3 | atrial cardiac muscle cell development |
| GO:0061010 | 2e-04 | 277.7586 | 0.0218 | 2 | 3 | gall bladder development |
| GO:0061031 | 2e-04 | 277.7586 | 0.0218 | 2 | 3 | endodermal digestive tract morphogenesis |
| GO:0060581 | 2e-04 | 34.9978 | 0.1091 | 3 | 15 | cell fate commitment involved in pattern specification |
| GO:0043009 | 2e-04 | 3.6116 | 3.9772 | 13 | 547 | chordate embryonic development |
| GO:0097659 | 2e-04 | 2.3707 | 14.8517 | 29 | 2252 | nucleic acid-templated transcription |
| GO:0021514 | 2e-04 | 29.9944 | 0.1236 | 3 | 17 | ventral spinal cord interneuron differentiation |
| GO:1904837 | 3e-04 | 14.0974 | 0.3199 | 4 | 44 | beta-catenin-TCF complex assembly |
| GO:0035270 | 3e-04 | 7.1993 | 0.9089 | 6 | 125 | endocrine system development |
| GO:0060485 | 3e-04 | 5.1118 | 1.7014 | 8 | 234 | mesenchyme development |
| GO:0007198 | 3e-04 | 138.8707 | 0.0291 | 2 | 4 | adenylate cyclase-inhibiting serotonin receptor signaling pathway |
| GO:0009730 | 3e-04 | 138.8707 | 0.0291 | 2 | 4 | detection of carbohydrate stimulus |
| GO:0009732 | 3e-04 | 138.8707 | 0.0291 | 2 | 4 | detection of hexose stimulus |
| GO:0072086 | 3e-04 | 138.8707 | 0.0291 | 2 | 4 | specification of loop of Henle identity |
| GO:0030326 | 3e-04 | 7.1388 | 0.9161 | 6 | 126 | embryonic limb morphogenesis |
| GO:0021854 | 4e-04 | 24.6967 | 0.1454 | 3 | 20 | hypothalamus development |
| GO:0043586 | 5e-04 | 23.3232 | 0.1527 | 3 | 21 | tongue development |
| GO:0048731 | 5e-04 | 2.5306 | 11.3626 | 23 | 2249 | system development |
| GO:0048729 | 5e-04 | 3.223 | 4.428 | 13 | 609 | tissue morphogenesis |
| GO:0002568 | 5e-04 | 92.5747 | 0.0364 | 2 | 5 | somatic diversification of T cell receptor genes |
| GO:0033153 | 5e-04 | 92.5747 | 0.0364 | 2 | 5 | T cell receptor V(D)J recombination |
| GO:0021513 | 5e-04 | 22.0943 | 0.16 | 3 | 22 | spinal cord dorsal/ventral patterning |
| GO:0021953 | 6e-04 | 6.3321 | 1.0267 | 6 | 146 | central nervous system neuron differentiation |
| GO:0051241 | 6e-04 | 2.6165 | 7.6708 | 18 | 1055 | negative regulation of multicellular organismal process |
| GO:0042472 | 6e-04 | 7.9656 | 0.6835 | 5 | 94 | inner ear morphogenesis |
| GO:0043583 | 7e-04 | 5.0943 | 1.4833 | 7 | 204 | ear development |
| GO:0055002 | 7e-04 | 6.0245 | 1.0761 | 6 | 148 | striated muscle cell development |
| GO:0010628 | 7e-04 | 2.2288 | 12.7896 | 25 | 1759 | positive regulation of gene expression |
| GO:0014062 | 8e-04 | 69.4267 | 0.0436 | 2 | 6 | regulation of serotonin secretion |
| GO:0007420 | 8e-04 | 3.0224 | 4.7043 | 13 | 647 | brain development |
| GO:0021884 | 9e-04 | 18.2473 | 0.189 | 3 | 26 | forebrain neuron development |
| GO:0007399 | 0.0011 | 3.3344 | 3.6818 | 11 | 662 | nervous system development |
| GO:0014031 | 0.0012 | 9.3865 | 0.4653 | 4 | 64 | mesenchymal cell development |
| GO:0048864 | 0.0012 | 9.3865 | 0.4653 | 4 | 64 | stem cell development |
| GO:0048869 | 0.0012 | 1.8807 | 27.243 | 42 | 3963 | cellular developmental process |
| GO:0001569 | 0.0015 | 14.9842 | 0.2254 | 3 | 31 | branching involved in blood vessel morphogenesis |
| GO:0014033 | 0.0015 | 8.7977 | 0.4944 | 4 | 68 | neural crest cell differentiation |
| GO:0051254 | 0.0016 | 2.2398 | 10.4774 | 21 | 1441 | positive regulation of RNA metabolic process |
| GO:0060537 | 0.0016 | 3.5821 | 2.7048 | 9 | 372 | muscle tissue development |
| GO:1902742 | 0.0016 | 14.4666 | 0.2327 | 3 | 32 | apoptotic process involved in development |
| GO:0060562 | 0.0016 | 3.9263 | 2.1886 | 8 | 301 | epithelial tube morphogenesis |
| GO:0009953 | 0.0018 | 8.3682 | 0.518 | 4 | 73 | dorsal/ventral pattern formation |
| GO:0061004 | 0.0018 | 39.665 | 0.0654 | 2 | 9 | pattern specification involved in kidney development |
| GO:0090304 | 0.0018 | 1.7648 | 35.6712 | 51 | 4906 | nucleic acid metabolic process |
| GO:0001570 | 0.0019 | 8.2781 | 0.5235 | 4 | 72 | vasculogenesis |
| GO:0035050 | 0.0019 | 8.2781 | 0.5235 | 4 | 72 | embryonic heart tube development |
| GO:0048863 | 0.0019 | 4.9799 | 1.2912 | 6 | 183 | stem cell differentiation |
| GO:0016055 | 0.002 | 3.2078 | 3.3592 | 10 | 462 | Wnt signaling pathway |
| GO:1903508 | 0.002 | 2.2314 | 9.9612 | 20 | 1370 | positive regulation of nucleic acid-templated transcription |
| GO:0060359 | 0.002 | 5.9971 | 0.8943 | 5 | 123 | response to ammonium ion |
| GO:0055006 | 0.0021 | 8.0406 | 0.538 | 4 | 74 | cardiac cell development |
| GO:0009987 | 0.0022 | 8.9104 | 56.1087 | 63 | 10004 | cellular process |
| GO:0035137 | 0.0022 | 12.7099 | 0.2618 | 3 | 36 | hindlimb morphogenesis |
| GO:0048536 | 0.0022 | 12.7099 | 0.2618 | 3 | 36 | spleen development |
| GO:0035295 | 0.0024 | 3.1243 | 3.4503 | 10 | 489 | tube development |
| GO:0071901 | 0.0024 | 5.7515 | 0.9307 | 5 | 128 | negative regulation of protein serine/threonine kinase activity |
| GO:0045596 | 0.0024 | 2.7865 | 4.6607 | 12 | 641 | negative regulation of cell differentiation |
| GO:0030855 | 0.0025 | 2.6582 | 5.3078 | 13 | 730 | epithelial cell differentiation |
| GO:2000026 | 0.0026 | 2.044 | 13.1822 | 24 | 1813 | regulation of multicellular organismal development |
| GO:0021903 | 0.0028 | 30.8467 | 0.08 | 2 | 11 | rostrocaudal neural tube patterning |
| GO:0090009 | 0.0028 | 30.8467 | 0.08 | 2 | 11 | primitive streak formation |
| GO:2000774 | 0.0028 | 30.8467 | 0.08 | 2 | 11 | positive regulation of cellular senescence |
| GO:0001764 | 0.003 | 5.4819 | 0.9743 | 5 | 134 | neuron migration |
| GO:0009798 | 0.0031 | 7.1206 | 0.6035 | 4 | 83 | axis specification |
| GO:0010470 | 0.0033 | 11.0341 | 0.2981 | 3 | 41 | regulation of gastrulation |
| GO:0042659 | 0.0033 | 27.7603 | 0.0873 | 2 | 12 | regulation of cell fate specification |
| GO:0033673 | 0.0034 | 3.8447 | 1.9413 | 7 | 267 | negative regulation of kinase activity |
| GO:0040011 | 0.0035 | 2.0471 | 11.9534 | 22 | 1644 | locomotion |
| GO:0003002 | 0.0036 | 10.6284 | 0.3071 | 3 | 49 | regionalization |
| GO:0010467 | 0.0036 | 1.8614 | 22.0627 | 34 | 3433 | gene expression |
| GO:0021520 | 0.0039 | 25.2351 | 0.0945 | 2 | 13 | spinal cord motor neuron cell fate specification |
| GO:0021535 | 0.0039 | 25.2351 | 0.0945 | 2 | 13 | cell migration in hindbrain |
| GO:0048935 | 0.0039 | 25.2351 | 0.0945 | 2 | 13 | peripheral nervous system neuron development |
| GO:0060911 | 0.0039 | 25.2351 | 0.0945 | 2 | 13 | cardiac cell fate commitment |
| GO:0048592 | 0.0039 | 5.1215 | 1.0397 | 5 | 143 | eye morphogenesis |
| GO:0006837 | 0.0045 | 23.1307 | 0.1018 | 2 | 14 | serotonin transport |
| GO:0048853 | 0.0045 | 23.1307 | 0.1018 | 2 | 14 | forebrain morphogenesis |
| GO:0022008 | 0.0046 | 2.3106 | 7.0914 | 15 | 1020 | neurogenesis |
| GO:0007519 | 0.0049 | 4.8385 | 1.0979 | 5 | 151 | skeletal muscle tissue development |
| GO:0007218 | 0.0051 | 6.177 | 0.6907 | 4 | 95 | neuropeptide signaling pathway |
| GO:0002070 | 0.0052 | 21.3501 | 0.1091 | 2 | 15 | epithelial cell maturation |
| GO:0007379 | 0.0052 | 21.3501 | 0.1091 | 2 | 15 | segment specification |
| GO:0009893 | 0.0052 | 1.7475 | 23.0271 | 35 | 3167 | positive regulation of metabolic process |
| GO:0021510 | 0.0053 | 6.1095 | 0.698 | 4 | 96 | spinal cord development |
| GO:0010557 | 0.0055 | 1.9897 | 11.648 | 21 | 1602 | positive regulation of macromolecule biosynthetic process |
| GO:0007411 | 0.0055 | 3.9608 | 1.6069 | 6 | 221 | axon guidance |
| GO:0007517 | 0.0057 | 3.1551 | 2.6975 | 8 | 371 | muscle organ development |
| GO:0001711 | 0.0059 | 19.8239 | 0.1163 | 2 | 16 | endodermal cell fate commitment |
| GO:0060850 | 0.0059 | 19.8239 | 0.1163 | 2 | 16 | regulation of transcription involved in cell fate commitment |
| GO:0051094 | 0.0062 | 2.1143 | 8.7615 | 17 | 1205 | positive regulation of developmental process |
| GO:0021536 | 0.0063 | 8.595 | 0.376 | 3 | 53 | diencephalon development |
| GO:0009889 | 0.0066 | 1.8882 | 16.0815 | 26 | 2698 | regulation of biosynthetic process |
| GO:0031328 | 0.0067 | 1.9237 | 12.6296 | 22 | 1737 | positive regulation of cellular biosynthetic process |
| GO:0042127 | 0.0067 | 2.5553 | 4.6524 | 11 | 708 | regulation of cell proliferation |
| GO:2001141 | 0.0067 | 1.9084 | 14.3968 | 24 | 2336 | regulation of RNA biosynthetic process |
| GO:0006355 | 0.0068 | 1.9058 | 14.4127 | 24 | 2344 | regulation of transcription, DNA-templated |
| GO:0045892 | 0.0071 | 3.3376 | 2.2364 | 7 | 346 | negative regulation of transcription, DNA-templated |
| GO:0007631 | 0.0072 | 5.5619 | 0.7634 | 4 | 105 | feeding behavior |
| GO:0000433 | 0.0073 | Inf | 0.0073 | 1 | 1 | negative regulation of transcription from RNA polymerase II promoter by glucose |
| GO:0003142 | 0.0073 | Inf | 0.0073 | 1 | 1 | cardiogenic plate morphogenesis |
| GO:0003168 | 0.0073 | Inf | 0.0073 | 1 | 1 | Purkinje myocyte differentiation |
| GO:0014739 | 0.0073 | Inf | 0.0073 | 1 | 1 | positive regulation of muscle hyperplasia |
| GO:0021568 | 0.0073 | Inf | 0.0073 | 1 | 1 | rhombomere 2 development |
| GO:0021723 | 0.0073 | Inf | 0.0073 | 1 | 1 | medullary reticular formation development |
| GO:0021763 | 0.0073 | Inf | 0.0073 | 1 | 1 | subthalamic nucleus development |
| GO:0032597 | 0.0073 | Inf | 0.0073 | 1 | 1 | B cell receptor transport into membrane raft |
| GO:0032600 | 0.0073 | Inf | 0.0073 | 1 | 1 | chemokine receptor transport out of membrane raft |
| GO:0032812 | 0.0073 | Inf | 0.0073 | 1 | 1 | positive regulation of epinephrine secretion |
| GO:0032913 | 0.0073 | Inf | 0.0073 | 1 | 1 | negative regulation of transforming growth factor beta3 production |
| GO:0042404 | 0.0073 | Inf | 0.0073 | 1 | 1 | thyroid hormone catabolic process |
| GO:0048894 | 0.0073 | Inf | 0.0073 | 1 | 1 | efferent axon development in a lateral line nerve |
| GO:0060127 | 0.0073 | Inf | 0.0073 | 1 | 1 | prolactin secreting cell differentiation |
| GO:0060578 | 0.0073 | Inf | 0.0073 | 1 | 1 | superior vena cava morphogenesis |
| GO:0060807 | 0.0073 | Inf | 0.0073 | 1 | 1 | regulation of transcription from RNA polymerase II promoter involved in definitive endodermal cell fate specification |
| GO:0060929 | 0.0073 | Inf | 0.0073 | 1 | 1 | atrioventricular node cell fate commitment |
| GO:0061011 | 0.0073 | Inf | 0.0073 | 1 | 1 | hepatic duct development |
| GO:0061153 | 0.0073 | Inf | 0.0073 | 1 | 1 | trachea gland development |
| GO:0061452 | 0.0073 | Inf | 0.0073 | 1 | 1 | retrotrapezoid nucleus neuron differentiation |
| GO:0061682 | 0.0073 | Inf | 0.0073 | 1 | 1 | seminal vesicle morphogenesis |
| GO:1901980 | 0.0073 | Inf | 0.0073 | 1 | 1 | positive regulation of inward rectifier potassium channel activity |
| GO:1903769 | 0.0073 | Inf | 0.0073 | 1 | 1 | negative regulation of cell proliferation in bone marrow |
| GO:2000971 | 0.0073 | Inf | 0.0073 | 1 | 1 | negative regulation of detection of glucose |
| GO:0045653 | 0.0074 | 17.3438 | 0.1309 | 2 | 18 | negative regulation of megakaryocyte differentiation |
| GO:0001706 | 0.0075 | 8.0564 | 0.3999 | 3 | 55 | endoderm formation |
| GO:0050768 | 0.0077 | 3.6827 | 1.7232 | 6 | 237 | negative regulation of neurogenesis |
| GO:0043279 | 0.008 | 5.4005 | 0.7853 | 4 | 108 | response to alkaloid |
| GO:0002089 | 0.0083 | 16.3225 | 0.1381 | 2 | 19 | lens morphogenesis in camera-type eye |
| GO:0048557 | 0.0083 | 16.3225 | 0.1381 | 2 | 19 | embryonic digestive tract morphogenesis |
| GO:0072079 | 0.0083 | 16.3225 | 0.1381 | 2 | 19 | nephron tubule formation |
| GO:0034641 | 0.0083 | 1.5852 | 45.7415 | 59 | 6291 | cellular nitrogen compound metabolic process |
| GO:0055007 | 0.0085 | 5.2979 | 0.7998 | 4 | 110 | cardiac muscle cell differentiation |
| GO:0060429 | 0.0086 | 2.9428 | 2.8996 | 8 | 435 | epithelium development |
| GO:0003407 | 0.0086 | 7.6155 | 0.4217 | 3 | 58 | neural retina development |
| GO:0006928 | 0.0087 | 1.8505 | 13.7203 | 23 | 1887 | movement of cell or subcellular component |
| GO:0048645 | 0.0091 | 7.479 | 0.429 | 3 | 59 | animal organ formation |
| GO:1900120 | 0.0091 | 15.4148 | 0.1454 | 2 | 20 | regulation of receptor binding |
| GO:0044085 | 0.0096 | 1.6937 | 21.3329 | 32 | 2934 | cellular component biogenesis |
| GO:0042063 | 0.0097 | 3.4982 | 1.8105 | 6 | 249 | gliogenesis |
| GOMFID | Pvalue | OddsRatio | ExpCount | Count | Size | Term |
| GO:0007156 | 0 | 19.4984 | 1.1988 | 18 | 152 | homophilic cell adhesion via plasma membrane adhesion molecules |
| GO:0016339 | 0 | 75.7203 | 0.2208 | 10 | 28 | calcium-dependent cell-cell adhesion via plasma membrane cell adhesion molecules |
| GO:0007416 | 0 | 15.6957 | 1.0963 | 14 | 139 | synapse assembly |
| GO:0032502 | 0 | 3.8101 | 26.8178 | 57 | 4033 | developmental process |
| GO:0098609 | 0 | 5.1883 | 6.152 | 26 | 780 | cell-cell adhesion |
| GO:0009952 | 0 | 9.8876 | 1.538 | 13 | 195 | anterior/posterior pattern specification |
| GO:0007268 | 0 | 5.4066 | 4.614 | 21 | 585 | chemical synaptic transmission |
| GO:0099537 | 0 | 5.3868 | 4.6297 | 21 | 587 | trans-synaptic signaling |
| GO:0007267 | 0 | 3.5574 | 11.9884 | 34 | 1520 | cell-cell signaling |
| GO:0048568 | 0 | 6.1055 | 3.2416 | 17 | 411 | embryonic organ development |
| GO:0007275 | 0 | 3.2798 | 15.9993 | 36 | 2774 | multicellular organism development |
| GO:0006355 | 0 | 2.477 | 27.1948 | 51 | 3448 | regulation of transcription, DNA-templated |
| GO:0043009 | 0 | 4.4995 | 4.3143 | 17 | 547 | chordate embryonic development |
| GO:0022008 | 0 | 3.0808 | 11.2549 | 29 | 1427 | neurogenesis |
| GO:2001141 | 0 | 2.4522 | 27.4077 | 51 | 3475 | regulation of RNA biosynthetic process |
| GO:0060322 | 0 | 4.0461 | 5.3948 | 19 | 684 | head development |
| GO:0009887 | 0 | 3.6187 | 7.0831 | 22 | 917 | animal organ morphogenesis |
| GO:0022610 | 0 | 3.059 | 10.4189 | 27 | 1321 | biological adhesion |
| GO:0048598 | 0 | 4.9266 | 3.2181 | 14 | 439 | embryonic morphogenesis |
| GO:0035113 | 0 | 9.0299 | 0.9938 | 8 | 126 | embryonic appendage morphogenesis |
| GO:1903508 | 0 | 2.9376 | 10.8053 | 27 | 1370 | positive regulation of nucleic acid-templated transcription |
| GO:0009890 | 0 | 2.7687 | 12.8797 | 30 | 1633 | negative regulation of biosynthetic process |
| GO:0045944 | 0 | 3.1863 | 8.3581 | 23 | 1068 | positive regulation of transcription from RNA polymerase II promoter |
| GO:0035295 | 0 | 4.0776 | 4.4247 | 16 | 561 | tube development |
| GO:2000113 | 0 | 2.8421 | 11.6098 | 28 | 1472 | negative regulation of cellular macromolecule biosynthetic process |
| GO:0001764 | 0 | 8.4524 | 1.0569 | 8 | 134 | neuron migration |
| GO:0019222 | 0 | 2.1588 | 49.8939 | 74 | 6326 | regulation of metabolic process |
| GO:0048663 | 0 | 12.7226 | 0.5363 | 6 | 68 | neuron fate commitment |
| GO:0021854 | 0 | 32.4294 | 0.1577 | 4 | 20 | hypothalamus development |
| GO:0051254 | 0 | 2.7767 | 11.3653 | 27 | 1441 | positive regulation of RNA metabolic process |
| GO:0001501 | 0 | 4.1571 | 3.7543 | 14 | 476 | skeletal system development |
| GO:0007389 | 0 | 11.7036 | 0.5772 | 6 | 85 | pattern specification process |
| GO:0010629 | 0 | 2.5567 | 14.3546 | 31 | 1820 | negative regulation of gene expression |
| GO:0019219 | 0 | 2.1572 | 31.7535 | 53 | 4026 | regulation of nucleobase-containing compound metabolic process |
| GO:0048704 | 0 | 15.5203 | 0.3707 | 5 | 48 | embryonic skeletal system morphogenesis |
| GO:0060173 | 0 | 7.1102 | 1.243 | 8 | 160 | limb development |
| GO:0010557 | 0 | 2.6122 | 12.5294 | 28 | 1601 | positive regulation of macromolecule biosynthetic process |
| GO:0021879 | 0 | 14.8346 | 0.3865 | 5 | 49 | forebrain neuron differentiation |
| GO:0072272 | 1e-04 | Inf | 0.0158 | 2 | 2 | proximal/distal pattern formation involved in metanephric nephron development |
| GO:0007399 | 1e-04 | 5.7764 | 1.7551 | 9 | 308 | nervous system development |
| GO:0060429 | 1e-04 | 2.7472 | 9.5592 | 23 | 1212 | epithelium development |
| GO:0031328 | 1e-04 | 2.4685 | 13.6999 | 29 | 1737 | positive regulation of cellular biosynthetic process |
| GO:0021521 | 1e-04 | 48.279 | 0.0868 | 3 | 11 | ventral spinal cord interneuron specification |
| GO:0034654 | 1e-04 | 2.0501 | 32.1873 | 52 | 4081 | nucleobase-containing compound biosynthetic process |
| GO:0000122 | 1e-04 | 3.1747 | 5.9784 | 17 | 758 | negative regulation of transcription from RNA polymerase II promoter |
| GO:0009954 | 1e-04 | 19.2043 | 0.2445 | 4 | 31 | proximal/distal pattern formation |
| GO:0007423 | 1e-04 | 3.7812 | 3.7944 | 13 | 492 | sensory organ development |
| GO:0021510 | 1e-04 | 8.7492 | 0.7572 | 6 | 96 | spinal cord development |
| GO:0048935 | 1e-04 | 38.6184 | 0.1025 | 3 | 13 | peripheral nervous system neuron development |
| GO:0051094 | 2e-04 | 2.6446 | 9.4225 | 22 | 1204 | positive regulation of developmental process |
| GO:0140076 | 2e-04 | 255.5556 | 0.0237 | 2 | 3 | negative regulation of lipoprotein transport |
| GO:0060581 | 2e-04 | 32.178 | 0.1183 | 3 | 15 | cell fate commitment involved in pattern specification |
| GO:0010628 | 2e-04 | 2.3244 | 13.8734 | 28 | 1759 | positive regulation of gene expression |
| GO:0021543 | 3e-04 | 6.0301 | 1.2619 | 7 | 160 | pallium development |
| GO:0021983 | 3e-04 | 14.0052 | 0.3234 | 4 | 41 | pituitary gland development |
| GO:0021514 | 3e-04 | 27.5777 | 0.1341 | 3 | 17 | ventral spinal cord interneuron differentiation |
| GO:0007198 | 4e-04 | 127.7698 | 0.0315 | 2 | 4 | adenylate cyclase-inhibiting serotonin receptor signaling pathway |
| GO:0061325 | 4e-04 | 127.7698 | 0.0315 | 2 | 4 | cell proliferation involved in outflow tract morphogenesis |
| GO:0072086 | 4e-04 | 127.7698 | 0.0315 | 2 | 4 | specification of loop of Henle identity |
| GO:0072079 | 4e-04 | 24.1275 | 0.1499 | 3 | 19 | nephron tubule formation |
| GO:0042475 | 5e-04 | 8.4595 | 0.6467 | 5 | 82 | odontogenesis of dentin-containing tooth |
| GO:0048839 | 6e-04 | 5.3263 | 1.4197 | 7 | 180 | inner ear development |
| GO:0043586 | 6e-04 | 21.444 | 0.1656 | 3 | 21 | tongue development |
| GO:0031326 | 6e-04 | 3.8949 | 2.893 | 10 | 480 | regulation of cellular biosynthetic process |
| GO:1903507 | 6e-04 | 2.4818 | 8.9755 | 20 | 1138 | negative regulation of nucleic acid-templated transcription |
| GO:0002568 | 6e-04 | 85.1746 | 0.0394 | 2 | 5 | somatic diversification of T cell receptor genes |
| GO:0033153 | 6e-04 | 85.1746 | 0.0394 | 2 | 5 | T cell receptor V(D)J recombination |
| GO:0030900 | 7e-04 | 4.5403 | 1.9043 | 8 | 256 | forebrain development |
| GO:0021513 | 7e-04 | 20.3141 | 0.1735 | 3 | 22 | spinal cord dorsal/ventral patterning |
| GO:0010556 | 7e-04 | 4.1545 | 2.423 | 9 | 406 | regulation of macromolecule biosynthetic process |
| GO:1901576 | 9e-04 | 1.7755 | 48.1193 | 66 | 6101 | organic substance biosynthetic process |
| GO:0007405 | 9e-04 | 10.3555 | 0.4259 | 4 | 54 | neuroblast proliferation |
| GO:0014062 | 9e-04 | 63.877 | 0.0473 | 2 | 6 | regulation of serotonin secretion |
| GO:0008284 | 0.001 | 2.7275 | 6.0254 | 15 | 785 | positive regulation of cell proliferation |
| GO:0003253 | 0.0013 | 51.0984 | 0.0552 | 2 | 7 | cardiac neural crest cell migration involved in outflow tract morphogenesis |
| GO:0003357 | 0.0013 | 51.0984 | 0.0552 | 2 | 7 | noradrenergic neuron differentiation |
| GO:0035726 | 0.0013 | 51.0984 | 0.0552 | 2 | 7 | common myeloid progenitor cell proliferation |
| GO:0048752 | 0.0013 | 51.0984 | 0.0552 | 2 | 7 | semicircular canal morphogenesis |
| GO:0051253 | 0.0013 | 2.3162 | 9.5592 | 20 | 1212 | negative regulation of RNA metabolic process |
| GO:0003002 | 0.0013 | 6.7096 | 0.8042 | 5 | 114 | regionalization |
| GO:0048468 | 0.0013 | 2.0945 | 14.0335 | 26 | 1829 | cell development |
| GO:0035116 | 0.0014 | 15.433 | 0.2208 | 3 | 28 | embryonic hindlimb morphogenesis |
| GO:0042733 | 0.0015 | 8.7709 | 0.4969 | 4 | 63 | embryonic digit morphogenesis |
| GO:0035137 | 0.0016 | 43.5501 | 0.0617 | 2 | 8 | hindlimb morphogenesis |
| GO:0014031 | 0.0016 | 8.6242 | 0.5048 | 4 | 64 | mesenchymal cell development |
| GO:0048864 | 0.0016 | 8.6242 | 0.5048 | 4 | 64 | stem cell development |
| GO:0030182 | 0.0017 | 2.3591 | 8.4234 | 18 | 1134 | neuron differentiation |
| GO:0051173 | 0.0018 | 1.8637 | 22.3205 | 36 | 2830 | positive regulation of nitrogen compound metabolic process |
| GO:0050795 | 0.0018 | 8.345 | 0.5205 | 4 | 66 | regulation of behavior |
| GO:0001569 | 0.0018 | 13.7769 | 0.2445 | 3 | 31 | branching involved in blood vessel morphogenesis |
| GO:0010667 | 0.0018 | 13.7769 | 0.2445 | 3 | 31 | negative regulation of cardiac muscle cell apoptotic process |
| GO:0007417 | 0.0019 | 2.634 | 5.785 | 14 | 765 | central nervous system development |
| GO:0042471 | 0.002 | 6.0196 | 0.8912 | 5 | 113 | ear morphogenesis |
| GO:0009987 | 0.002 | 9.5443 | 25.4539 | 32 | 4746 | cellular process |
| GO:0035115 | 0.002 | 13.301 | 0.2524 | 3 | 32 | embryonic forelimb morphogenesis |
| GO:0014033 | 0.002 | 8.0832 | 0.5363 | 4 | 68 | neural crest cell differentiation |
| GO:0044271 | 0.002 | 2.9174 | 4.6358 | 12 | 741 | cellular nitrogen compound biosynthetic process |
| GO:0048667 | 0.0021 | 2.9827 | 3.9672 | 11 | 503 | cell morphogenesis involved in neuron differentiation |
| GO:0061004 | 0.0021 | 36.4943 | 0.071 | 2 | 9 | pattern specification involved in kidney development |
| GO:0034249 | 0.0024 | 3.3449 | 2.8788 | 9 | 365 | negative regulation of cellular amide metabolic process |
| GO:0050794 | 0.0025 | 1.7652 | 79.4706 | 95 | 10076 | regulation of cellular process |
| GO:0090304 | 0.0026 | 1.6918 | 38.6942 | 54 | 4906 | nucleic acid metabolic process |
| GO:0034393 | 0.0027 | 31.9306 | 0.0789 | 2 | 10 | positive regulation of smooth muscle cell apoptotic process |
| GO:0035878 | 0.0027 | 31.9306 | 0.0789 | 2 | 10 | nail development |
| GO:0090370 | 0.0027 | 31.9306 | 0.0789 | 2 | 10 | negative regulation of cholesterol efflux |
| GO:0060562 | 0.0027 | 3.5968 | 2.374 | 8 | 301 | epithelial tube morphogenesis |
| GO:0007517 | 0.0027 | 3.2882 | 2.9261 | 9 | 371 | muscle organ development |
| GO:0060537 | 0.0028 | 3.279 | 2.934 | 9 | 372 | muscle tissue development |
| GO:0061564 | 0.0028 | 3.052 | 3.5098 | 10 | 445 | axon development |
| GO:0048661 | 0.0028 | 7.3876 | 0.5836 | 4 | 74 | positive regulation of smooth muscle cell proliferation |
| GO:0021761 | 0.0029 | 7.3114 | 0.5891 | 4 | 77 | limbic system development |
| GO:0010985 | 0.0032 | 28.381 | 0.0868 | 2 | 11 | negative regulation of lipoprotein particle clearance |
| GO:0060033 | 0.0032 | 28.381 | 0.0868 | 2 | 11 | anatomical structure regression |
| GO:0061308 | 0.0032 | 28.381 | 0.0868 | 2 | 11 | cardiac neural crest cell development involved in heart development |
| GO:0030879 | 0.0033 | 5.3242 | 1.0017 | 5 | 127 | mammary gland development |
| GO:0071901 | 0.0034 | 5.2806 | 1.0096 | 5 | 128 | negative regulation of protein serine/threonine kinase activity |
| GO:0048870 | 0.0035 | 2.0674 | 11.176 | 21 | 1417 | cell motility |
| GO:2000026 | 0.0037 | 1.943 | 14.2993 | 25 | 1813 | regulation of multicellular organismal development |
| GO:0001708 | 0.004 | 6.6266 | 0.6467 | 4 | 82 | cell fate specification |
| GO:0001656 | 0.0044 | 6.4601 | 0.6625 | 4 | 84 | metanephros development |
| GO:0035195 | 0.0044 | 3.6532 | 2.0349 | 7 | 258 | gene silencing by miRNA |
| GO:0021520 | 0.0045 | 23.2179 | 0.1025 | 2 | 13 | spinal cord motor neuron cell fate specification |
| GO:0021535 | 0.0045 | 23.2179 | 0.1025 | 2 | 13 | cell migration in hindbrain |
| GO:0031274 | 0.0045 | 23.2179 | 0.1025 | 2 | 13 | positive regulation of pseudopodium assembly |
| GO:0048812 | 0.0047 | 2.6683 | 4.4089 | 11 | 559 | neuron projection morphogenesis |
| GO:0006935 | 0.0048 | 2.6583 | 4.4247 | 11 | 561 | chemotaxis |
| GO:0046632 | 0.005 | 6.2254 | 0.6862 | 4 | 87 | alpha-beta T cell differentiation |
| GO:0048701 | 0.005 | 9.401 | 0.347 | 3 | 44 | embryonic cranial skeleton morphogenesis |
| GO:0016441 | 0.0051 | 3.5525 | 2.0901 | 7 | 265 | posttranscriptional gene silencing |
| GO:0072080 | 0.0052 | 6.1509 | 0.6941 | 4 | 88 | nephron tubule development |
| GO:0001667 | 0.0052 | 3.2059 | 2.6501 | 8 | 336 | ameboidal-type cell migration |
| GO:0006837 | 0.0053 | 21.2817 | 0.1104 | 2 | 14 | serotonin transport |
| GO:0021527 | 0.0053 | 21.2817 | 0.1104 | 2 | 14 | spinal cord association neuron differentiation |
| GO:0048646 | 0.0053 | 2.1971 | 7.8792 | 16 | 999 | anatomical structure formation involved in morphogenesis |
| GO:0010656 | 0.0053 | 9.1766 | 0.3549 | 3 | 45 | negative regulation of muscle cell apoptotic process |
| GO:0010718 | 0.0053 | 9.1766 | 0.3549 | 3 | 45 | positive regulation of epithelial to mesenchymal transition |
| GO:2000677 | 0.0053 | 9.1766 | 0.3549 | 3 | 45 | regulation of transcription regulatory region DNA binding |
| GO:0072132 | 0.0057 | 8.9626 | 0.3628 | 3 | 46 | mesenchyme morphogenesis |
| GO:0003300 | 0.0058 | 5.9377 | 0.7177 | 4 | 91 | cardiac muscle hypertrophy |
| GO:0060021 | 0.0058 | 5.9377 | 0.7177 | 4 | 91 | palate development |
| GO:0048858 | 0.0059 | 2.5852 | 4.543 | 11 | 576 | cell projection morphogenesis |
| GO:0010662 | 0.006 | 8.7584 | 0.3707 | 3 | 47 | regulation of striated muscle cell apoptotic process |
| GO:0007379 | 0.0061 | 19.6435 | 0.1183 | 2 | 15 | segment specification |
| GO:0021542 | 0.0061 | 19.6435 | 0.1183 | 2 | 15 | dentate gyrus development |
| GO:0072148 | 0.0061 | 19.6435 | 0.1183 | 2 | 15 | epithelial cell fate commitment |
| GO:0021545 | 0.0064 | 8.5632 | 0.3786 | 3 | 48 | cranial nerve development |
| GO:0043392 | 0.0064 | 8.5632 | 0.3786 | 3 | 48 | negative regulation of DNA binding |
| GO:0014896 | 0.0068 | 5.6753 | 0.7493 | 4 | 95 | muscle hypertrophy |
| GO:0032374 | 0.0068 | 8.3765 | 0.3865 | 3 | 49 | regulation of cholesterol transport |
| GO:0007519 | 0.0069 | 4.4423 | 1.191 | 5 | 151 | skeletal muscle tissue development |
| GO:0050905 | 0.007 | 5.6133 | 0.7572 | 4 | 96 | neuromuscular process |
| GO:0048519 | 0.0073 | 1.5915 | 38.5917 | 52 | 4893 | negative regulation of biological process |
| GO:0003198 | 0.0078 | 17.0222 | 0.1341 | 2 | 17 | epithelial to mesenchymal transition involved in endocardial cushion formation |
| GO:0031268 | 0.0078 | 17.0222 | 0.1341 | 2 | 17 | pseudopodium organization |
| GO:0071294 | 0.0078 | 17.0222 | 0.1341 | 2 | 17 | cellular response to zinc ion |
| GO:2000269 | 0.0078 | 17.0222 | 0.1341 | 2 | 17 | regulation of fibroblast apoptotic process |
| GO:0031047 | 0.0079 | 3.257 | 2.2715 | 7 | 288 | gene silencing by RNA |
| GO:0002642 | 0.0079 | Inf | 0.0079 | 1 | 1 | positive regulation of immunoglobulin biosynthetic process |
| GO:0002651 | 0.0079 | Inf | 0.0079 | 1 | 1 | positive regulation of tolerance induction to self antigen |
| GO:0007634 | 0.0079 | Inf | 0.0079 | 1 | 1 | optokinetic behavior |
| GO:0009444 | 0.0079 | Inf | 0.0079 | 1 | 1 | pyruvate oxidation |
| GO:0009956 | 0.0079 | Inf | 0.0079 | 1 | 1 | radial pattern formation |
| GO:0014739 | 0.0079 | Inf | 0.0079 | 1 | 1 | positive regulation of muscle hyperplasia |
| GO:0021723 | 0.0079 | Inf | 0.0079 | 1 | 1 | medullary reticular formation development |
| GO:0021763 | 0.0079 | Inf | 0.0079 | 1 | 1 | subthalamic nucleus development |
| GO:0038097 | 0.0079 | Inf | 0.0079 | 1 | 1 | positive regulation of mast cell activation by Fc-epsilon receptor signaling pathway |
| GO:0038115 | 0.0079 | Inf | 0.0079 | 1 | 1 | chemokine (C-C motif) ligand 19 signaling pathway |
| GO:0038116 | 0.0079 | Inf | 0.0079 | 1 | 1 | chemokine (C-C motif) ligand 21 signaling pathway |
| GO:0048894 | 0.0079 | Inf | 0.0079 | 1 | 1 | efferent axon development in a lateral line nerve |
| GO:0060127 | 0.0079 | Inf | 0.0079 | 1 | 1 | prolactin secreting cell differentiation |
| GO:0060578 | 0.0079 | Inf | 0.0079 | 1 | 1 | superior vena cava morphogenesis |
| GO:0061153 | 0.0079 | Inf | 0.0079 | 1 | 1 | trachea gland development |
| GO:0061452 | 0.0079 | Inf | 0.0079 | 1 | 1 | retrotrapezoid nucleus neuron differentiation |
| GO:0061682 | 0.0079 | Inf | 0.0079 | 1 | 1 | seminal vesicle morphogenesis |
| GO:0070473 | 0.0079 | Inf | 0.0079 | 1 | 1 | negative regulation of uterine smooth muscle contraction |
| GO:0072051 | 0.0079 | Inf | 0.0079 | 1 | 1 | juxtaglomerular apparatus development |
| GO:0072227 | 0.0079 | Inf | 0.0079 | 1 | 1 | metanephric macula densa development |
| GO:0097022 | 0.0079 | Inf | 0.0079 | 1 | 1 | lymphocyte migration into lymph node |
| GO:1905317 | 0.0079 | Inf | 0.0079 | 1 | 1 | inferior endocardial cushion morphogenesis |
| GO:2000522 | 0.0079 | Inf | 0.0079 | 1 | 1 | positive regulation of immunological synapse formation |
| GO:2000526 | 0.0079 | Inf | 0.0079 | 1 | 1 | positive regulation of glycoprotein biosynthetic process involved in immunological synapse formation |
| GO:2000763 | 0.0079 | Inf | 0.0079 | 1 | 1 | positive regulation of transcription from RNA polymerase II promoter involved in norepinephrine biosynthetic process |
| GO:2000764 | 0.0079 | Inf | 0.0079 | 1 | 1 | positive regulation of semaphorin-plexin signaling pathway involved in outflow tract morphogenesis |
| GO:2001260 | 0.0079 | Inf | 0.0079 | 1 | 1 | regulation of semaphorin-plexin signaling pathway |
| GO:0006915 | 0.008 | 1.8335 | 14.3861 | 24 | 1824 | apoptotic process |
| GO:0007411 | 0.0082 | 3.6339 | 1.7431 | 6 | 221 | axon guidance |
| GO:0043388 | 0.0084 | 7.7045 | 0.418 | 3 | 53 | positive regulation of DNA binding |
| GO:0043010 | 0.0085 | 3.2104 | 2.303 | 7 | 292 | camera-type eye development |
| GO:0032372 | 0.0087 | 15.9573 | 0.142 | 2 | 18 | negative regulation of sterol transport |
| GO:0046597 | 0.0087 | 15.9573 | 0.142 | 2 | 18 | negative regulation of viral entry into host cell |
| GO:0060004 | 0.0087 | 15.9573 | 0.142 | 2 | 18 | reflex |
| GO:0060438 | 0.0087 | 15.9573 | 0.142 | 2 | 18 | trachea development |
| GO:0050678 | 0.0088 | 3.1877 | 2.3188 | 7 | 294 | regulation of epithelial cell proliferation |
| GO:0002562 | 0.0093 | 7.4072 | 0.4338 | 3 | 55 | somatic diversification of immune receptors via germline recombination within a single locus |
| GO:0007631 | 0.0096 | 5.1102 | 0.8281 | 4 | 105 | feeding behavior |
| GO:0044872 | 0.0097 | 15.0177 | 0.1499 | 2 | 19 | lipoprotein localization |
| GO:0048557 | 0.0097 | 15.0177 | 0.1499 | 2 | 19 | embryonic digestive tract morphogenesis |
| GO:0048514 | 0.0098 | 2.5143 | 4.2196 | 10 | 535 | blood vessel morphogenesis |
| GOMFID | Pvalue | OddsRatio | ExpCount | Count | Size | Term |
| GO:0045944 | 0 | 6.3322 | 11.1979 | 51 | 1069 | positive regulation of transcription from RNA polymerase II promoter |
| GO:0006351 | 0 | 4.0133 | 37.7731 | 90 | 3606 | transcription, DNA-templated |
| GO:0032774 | 0 | 3.9699 | 38.0874 | 90 | 3636 | RNA biosynthetic process |
| GO:1903508 | 0 | 5.0706 | 14.3509 | 53 | 1370 | positive regulation of nucleic acid-templated transcription |
| GO:0051254 | 0 | 4.9243 | 15.0946 | 54 | 1441 | positive regulation of RNA metabolic process |
| GO:0044271 | 0 | 3.6035 | 50.5108 | 102 | 4822 | cellular nitrogen compound biosynthetic process |
| GO:0009790 | 0 | 5.6058 | 9.7418 | 42 | 930 | embryo development |
| GO:0018130 | 0 | 3.4997 | 43.3668 | 92 | 4140 | heterocycle biosynthetic process |
| GO:0019438 | 0 | 3.4916 | 43.4401 | 92 | 4147 | aromatic compound biosynthetic process |
| GO:0010557 | 0 | 4.3638 | 16.7811 | 54 | 1602 | positive regulation of macromolecule biosynthetic process |
| GO:0010628 | 0 | 4.141 | 18.4257 | 56 | 1759 | positive regulation of gene expression |
| GO:0009952 | 0 | 16.552 | 1.2988 | 17 | 128 | anterior/posterior pattern specification |
| GO:0080090 | 0 | 3.3318 | 60.8602 | 110 | 5810 | regulation of primary metabolic process |
| GO:1901362 | 0 | 3.3357 | 44.9066 | 92 | 4287 | organic cyclic compound biosynthetic process |
| GO:0031328 | 0 | 4.088 | 18.1952 | 55 | 1737 | positive regulation of cellular biosynthetic process |
| GO:0060322 | 0 | 5.9265 | 7.165 | 34 | 684 | head development |
| GO:0030900 | 0 | 8.666 | 3.2296 | 23 | 315 | forebrain development |
| GO:2000112 | 0 | 3.9106 | 21.2018 | 55 | 2503 | regulation of cellular macromolecule biosynthetic process |
| GO:0009889 | 0 | 3.7428 | 22.736 | 56 | 2698 | regulation of biosynthetic process |
| GO:2000113 | 0 | 3.6913 | 15.4193 | 45 | 1472 | negative regulation of cellular macromolecule biosynthetic process |
| GO:0035107 | 0 | 11.8578 | 1.5189 | 15 | 145 | appendage morphogenesis |
| GO:0009890 | 0 | 3.487 | 17.1058 | 47 | 1633 | negative regulation of biosynthetic process |
| GO:0022008 | 0 | 4.9355 | 7.1736 | 29 | 754 | neurogenesis |
| GO:0007417 | 0 | 4.7475 | 7.6344 | 30 | 765 | central nervous system development |
| GO:0060173 | 0 | 10.7546 | 1.6573 | 15 | 160 | limb development |
| GO:0090304 | 0 | 2.6899 | 51.3907 | 91 | 4906 | nucleic acid metabolic process |
| GO:0000122 | 0 | 4.5127 | 7.9401 | 30 | 758 | negative regulation of transcription from RNA polymerase II promoter |
| GO:1903507 | 0 | 3.6464 | 11.9206 | 36 | 1138 | negative regulation of nucleic acid-templated transcription |
| GO:0043009 | 0 | 5.1382 | 4.9699 | 22 | 484 | chordate embryonic development |
| GO:0051173 | 0 | 2.686 | 29.6445 | 61 | 2830 | positive regulation of nitrogen compound metabolic process |
| GO:0010629 | 0 | 2.9872 | 19.0646 | 46 | 1820 | negative regulation of gene expression |
| GO:0051253 | 0 | 3.4 | 12.6958 | 36 | 1212 | negative regulation of RNA metabolic process |
| GO:0009653 | 0 | 7.1245 | 2.671 | 16 | 344 | anatomical structure morphogenesis |
| GO:0031323 | 0 | 2.9424 | 29.3147 | 58 | 3367 | regulation of cellular metabolic process |
| GO:0016339 | 0 | 32.7975 | 0.2933 | 7 | 28 | calcium-dependent cell-cell adhesion via plasma membrane cell adhesion molecules |
| GO:0030182 | 0 | 4.0879 | 7.8275 | 27 | 827 | neuron differentiation |
| GO:0007275 | 0 | 3.2762 | 18.7422 | 43 | 2537 | multicellular organism development |
| GO:0060537 | 0 | 5.2537 | 3.8967 | 18 | 372 | muscle tissue development |
| GO:0050789 | 0 | 3.4095 | 46.6158 | 71 | 5807 | regulation of biological process |
| GO:0001764 | 0 | 8.9633 | 1.4037 | 11 | 134 | neuron migration |
| GO:0007416 | 0 | 8.6105 | 1.456 | 11 | 139 | synapse assembly |
| GO:0021983 | 0 | 28.2646 | 0.2797 | 6 | 27 | pituitary gland development |
| GO:0003357 | 0 | 128.9639 | 0.0733 | 4 | 7 | noradrenergic neuron differentiation |
| GO:2000026 | 0 | 2.6472 | 18.9913 | 42 | 1813 | regulation of multicellular organismal development |
| GO:0003002 | 0 | 10.7279 | 0.9623 | 9 | 107 | regionalization |
| GO:0048762 | 0 | 7.0152 | 1.9274 | 12 | 184 | mesenchymal cell differentiation |
| GO:0007156 | 0 | 7.8103 | 1.5922 | 11 | 152 | homophilic cell adhesion via plasma membrane adhesion molecules |
| GO:0021510 | 0 | 10.2626 | 1.0056 | 9 | 96 | spinal cord development |
| GO:0051172 | 0 | 2.421 | 25.224 | 50 | 2408 | negative regulation of nitrogen compound metabolic process |
| GO:0048522 | 0 | 2.3074 | 37.1602 | 64 | 3912 | positive regulation of cellular process |
| GO:0090596 | 0 | 9.8663 | 1.0409 | 9 | 104 | sensory organ morphogenesis |
| GO:0061564 | 0 | 4.3353 | 4.6614 | 18 | 445 | axon development |
| GO:0048562 | 0 | 7.2106 | 1.7147 | 11 | 175 | embryonic organ morphogenesis |
| GO:0048557 | 0 | 34.7294 | 0.199 | 5 | 19 | embryonic digestive tract morphogenesis |
| GO:0043583 | 0 | 6.2765 | 2.1369 | 12 | 204 | ear development |
| GO:0021854 | 0 | 32.4121 | 0.2095 | 5 | 20 | hypothalamus development |
| GO:0048704 | 0 | 11.0951 | 0.8288 | 8 | 80 | embryonic skeletal system morphogenesis |
| GO:0071542 | 0 | 19.5476 | 0.3771 | 6 | 36 | dopaminergic neuron differentiation |
| GO:0007517 | 0 | 4.596 | 3.8863 | 16 | 371 | muscle organ development |
| GO:0048485 | 0 | 30.3845 | 0.22 | 5 | 21 | sympathetic nervous system development |
| GO:0031324 | 0 | 2.3134 | 26.8267 | 51 | 2561 | negative regulation of cellular metabolic process |
| GO:0007519 | 0 | 10.6745 | 0.8576 | 8 | 84 | skeletal muscle tissue development |
| GO:0032502 | 0 | 2.9243 | 17.267 | 36 | 2692 | developmental process |
| GO:0048863 | 0 | 5.4119 | 2.6711 | 13 | 255 | stem cell differentiation |
| GO:0045165 | 0 | 6.4583 | 1.8992 | 11 | 192 | cell fate commitment |
| GO:0021521 | 0 | 55.2565 | 0.1152 | 4 | 11 | ventral spinal cord interneuron specification |
| GO:0007411 | 0 | 5.7598 | 2.315 | 12 | 221 | axon guidance |
| GO:0007267 | 0 | 2.8665 | 11.2036 | 28 | 1115 | cell-cell signaling |
| GO:0001501 | 0 | 4.7937 | 2.9978 | 13 | 297 | skeletal system development |
| GO:0008284 | 0 | 2.9971 | 8.9981 | 24 | 859 | positive regulation of cell proliferation |
| GO:0042127 | 0 | 3.3856 | 6.6702 | 20 | 707 | regulation of cell proliferation |
| GO:0061009 | 0 | 144.2246 | 0.0524 | 3 | 5 | common bile duct development |
| GO:0060581 | 0 | 35.1544 | 0.1571 | 4 | 15 | cell fate commitment involved in pattern specification |
| GO:0009954 | 0 | 18.6865 | 0.3247 | 5 | 31 | proximal/distal pattern formation |
| GO:0048592 | 0 | 6.6434 | 1.4979 | 9 | 143 | eye morphogenesis |
| GO:0048667 | 0 | 3.5604 | 5.269 | 17 | 503 | cell morphogenesis involved in neuron differentiation |
| GO:0061074 | 0 | 96.1437 | 0.0629 | 3 | 6 | regulation of neural retina development |
| GO:0030154 | 0 | 3.6623 | 5.3861 | 17 | 703 | cell differentiation |
| GO:0021514 | 0 | 29.7424 | 0.1781 | 4 | 17 | ventral spinal cord interneuron differentiation |
| GO:0007268 | 0 | 3.2356 | 6.1279 | 18 | 585 | chemical synaptic transmission |
| GO:0099537 | 0 | 3.2238 | 6.1489 | 18 | 587 | trans-synaptic signaling |
| GO:0035137 | 1e-04 | 59.0061 | 0.082 | 3 | 8 | hindlimb morphogenesis |
| GO:0009888 | 1e-04 | 2.8359 | 8.7706 | 22 | 975 | tissue development |
| GO:0042472 | 1e-04 | 7.8841 | 0.9847 | 7 | 94 | inner ear morphogenesis |
| GO:0043586 | 1e-04 | 22.7385 | 0.22 | 4 | 21 | tongue development |
| GO:0035881 | 1e-04 | 57.679 | 0.0838 | 3 | 8 | amacrine cell differentiation |
| GO:0007218 | 1e-04 | 7.794 | 0.9951 | 7 | 95 | neuropeptide signaling pathway |
| GO:0048468 | 1e-04 | 2.684 | 10.1242 | 24 | 1092 | cell development |
| GO:0044260 | 1e-04 | 1.8472 | 86.0423 | 111 | 8214 | cellular macromolecule metabolic process |
| GO:0021513 | 1e-04 | 21.4739 | 0.2305 | 4 | 22 | spinal cord dorsal/ventral patterning |
| GO:0048812 | 1e-04 | 3.181 | 5.8556 | 17 | 559 | neuron projection morphogenesis |
| GO:0051962 | 1e-04 | 3.4433 | 4.7557 | 15 | 454 | positive regulation of nervous system development |
| GO:0045595 | 1e-04 | 2.2267 | 17.3362 | 34 | 1655 | regulation of cell differentiation |
| GO:0043503 | 1e-04 | Inf | 0.021 | 2 | 2 | skeletal muscle fiber adaptation |
| GO:0072272 | 1e-04 | Inf | 0.021 | 2 | 2 | proximal/distal pattern formation involved in metanephric nephron development |
| GO:0060042 | 1e-04 | 11.8389 | 0.4819 | 5 | 46 | retina morphogenesis in camera-type eye |
| GO:0048858 | 1e-04 | 3.0809 | 6.0336 | 17 | 576 | cell projection morphogenesis |
| GO:0045666 | 1e-04 | 3.9494 | 3.2996 | 12 | 315 | positive regulation of neuron differentiation |
| GO:0014032 | 1e-04 | 11.1587 | 0.5076 | 5 | 49 | neural crest cell development |
| GO:0070848 | 2e-04 | 2.9098 | 6.7669 | 18 | 646 | response to growth factor |
| GO:0048870 | 2e-04 | 2.2668 | 14.8432 | 30 | 1417 | cell motility |
| GO:0090009 | 2e-04 | 36.0427 | 0.1152 | 3 | 11 | primitive streak formation |
| GO:0021879 | 2e-04 | 16.4794 | 0.2868 | 4 | 28 | forebrain neuron differentiation |
| GO:0035116 | 2e-04 | 16.0994 | 0.2933 | 4 | 28 | embryonic hindlimb morphogenesis |
| GO:0060441 | 2e-04 | 16.0994 | 0.2933 | 4 | 28 | epithelial tube branching involved in lung morphogenesis |
| GO:0007188 | 2e-04 | 5.4578 | 1.5922 | 8 | 152 | adenylate cyclase-modulating G-protein coupled receptor signaling pathway |
| GO:0001667 | 2e-04 | 3.6885 | 3.5196 | 12 | 336 | ameboidal-type cell migration |
| GO:0009798 | 2e-04 | 7.5936 | 0.8694 | 6 | 83 | axis specification |
| GO:0048513 | 3e-04 | 2.1148 | 19.3979 | 35 | 2258 | animal organ development |
| GO:0009987 | 3e-04 | 11.2697 | 70.0758 | 79 | 9935 | cellular process |
| GO:0021520 | 3e-04 | 28.8305 | 0.1362 | 3 | 13 | spinal cord motor neuron cell fate specification |
| GO:0048935 | 3e-04 | 28.8305 | 0.1362 | 3 | 13 | peripheral nervous system neuron development |
| GO:0010720 | 3e-04 | 3.1812 | 4.7642 | 14 | 460 | positive regulation of cell development |
| GO:0050767 | 3e-04 | 2.8182 | 6.569 | 17 | 645 | regulation of neurogenesis |
| GO:0060349 | 3e-04 | 7.1283 | 0.9218 | 6 | 88 | bone morphogenesis |
| GO:0055001 | 3e-04 | 5.067 | 1.7074 | 8 | 163 | muscle cell development |
| GO:0002877 | 3e-04 | 191.1667 | 0.0314 | 2 | 3 | regulation of acute inflammatory response to non-antigenic stimulus |
| GO:0060741 | 3e-04 | 191.1667 | 0.0314 | 2 | 3 | prostate gland stromal morphogenesis |
| GO:0061010 | 3e-04 | 191.1667 | 0.0314 | 2 | 3 | gall bladder development |
| GO:0061031 | 3e-04 | 191.1667 | 0.0314 | 2 | 3 | endodermal digestive tract morphogenesis |
| GO:0097021 | 3e-04 | 191.1667 | 0.0314 | 2 | 3 | lymphocyte migration into lymphoid organs |
| GO:0140076 | 3e-04 | 191.1667 | 0.0314 | 2 | 3 | negative regulation of lipoprotein transport |
| GO:1905563 | 3e-04 | 191.1667 | 0.0314 | 2 | 3 | negative regulation of vascular endothelial cell proliferation |
| GO:0035115 | 3e-04 | 13.796 | 0.3352 | 4 | 32 | embryonic forelimb morphogenesis |
| GO:0030324 | 4e-04 | 4.9383 | 1.7493 | 8 | 167 | lung development |
| GO:0048565 | 4e-04 | 5.7041 | 1.3303 | 7 | 127 | digestive tract development |
| GO:0051961 | 4e-04 | 4.001 | 2.6921 | 10 | 257 | negative regulation of nervous system development |
| GO:0060021 | 4e-04 | 6.8755 | 0.9532 | 6 | 91 | palate development |
| GO:0051094 | 4e-04 | 2.6684 | 7.3791 | 18 | 751 | positive regulation of developmental process |
| GO:0010468 | 4e-04 | 2.5031 | 10.3617 | 22 | 1521 | regulation of gene expression |
| GO:1903506 | 4e-04 | 2.475 | 10.2848 | 22 | 1431 | regulation of nucleic acid-templated transcription |
| GO:0072148 | 5e-04 | 24.0225 | 0.1571 | 3 | 15 | epithelial cell fate commitment |
| GO:0051171 | 5e-04 | 2.5065 | 10.4974 | 22 | 1509 | regulation of nitrogen compound metabolic process |
| GO:0061138 | 5e-04 | 4.6993 | 1.8331 | 8 | 175 | morphogenesis of a branching epithelium |
| GO:0048665 | 5e-04 | 22.8405 | 0.1628 | 3 | 16 | neuron fate specification |
| GO:0071392 | 5e-04 | 12.0685 | 0.3771 | 4 | 36 | cellular response to estradiol stimulus |
| GO:0098609 | 5e-04 | 2.5295 | 8.1706 | 19 | 780 | cell-cell adhesion |
| GO:0060850 | 6e-04 | 22.1732 | 0.1676 | 3 | 16 | regulation of transcription involved in cell fate commitment |
| GO:0032989 | 6e-04 | 2.3484 | 10.2446 | 22 | 978 | cellular component morphogenesis |
| GO:0060562 | 6e-04 | 4.1282 | 2.3427 | 9 | 228 | epithelial tube morphogenesis |
| GO:0051216 | 6e-04 | 4.5883 | 1.875 | 8 | 179 | cartilage development |
| GO:0007198 | 6e-04 | 95.5774 | 0.0419 | 2 | 4 | adenylate cyclase-inhibiting serotonin receptor signaling pathway |
| GO:0021797 | 6e-04 | 95.5774 | 0.0419 | 2 | 4 | forebrain anterior/posterior pattern specification |
| GO:0048866 | 6e-04 | 95.5774 | 0.0419 | 2 | 4 | stem cell fate specification |
| GO:0061325 | 6e-04 | 95.5774 | 0.0419 | 2 | 4 | cell proliferation involved in outflow tract morphogenesis |
| GO:0072086 | 6e-04 | 95.5774 | 0.0419 | 2 | 4 | specification of loop of Henle identity |
| GO:0035914 | 7e-04 | 7.8187 | 0.7018 | 5 | 67 | skeletal muscle cell differentiation |
| GO:0010721 | 7e-04 | 3.6966 | 2.9016 | 10 | 277 | negative regulation of cell development |
| GO:0048729 | 7e-04 | 2.8041 | 5.7751 | 15 | 563 | tissue morphogenesis |
| GO:0014014 | 8e-04 | 10.7249 | 0.419 | 4 | 40 | negative regulation of gliogenesis |
| GO:0006935 | 8e-04 | 2.7496 | 5.8765 | 15 | 561 | chemotaxis |
| GO:0002089 | 0.001 | 18.0124 | 0.199 | 3 | 19 | lens morphogenesis in camera-type eye |
| GO:0072079 | 0.001 | 18.0124 | 0.199 | 3 | 19 | nephron tubule formation |
| GO:0043010 | 0.001 | 3.8168 | 2.5234 | 9 | 246 | camera-type eye development |
| GO:0021766 | 0.001 | 7.1261 | 0.7647 | 5 | 73 | hippocampus development |
| GO:0009719 | 0.001 | 2.0407 | 15.1155 | 28 | 1443 | response to endogenous stimulus |
| GO:0090287 | 0.0011 | 3.7805 | 2.5454 | 9 | 243 | regulation of cellular response to growth factor stimulus |
| GO:0002568 | 0.0011 | 63.7143 | 0.0524 | 2 | 5 | somatic diversification of T cell receptor genes |
| GO:0021523 | 0.0011 | 63.7143 | 0.0524 | 2 | 5 | somatic motor neuron differentiation |
| GO:0033153 | 0.0011 | 63.7143 | 0.0524 | 2 | 5 | T cell receptor V(D)J recombination |
| GO:0048625 | 0.0011 | 63.7143 | 0.0524 | 2 | 5 | myoblast fate commitment |
| GO:0060729 | 0.0011 | 63.7143 | 0.0524 | 2 | 5 | intestinal epithelial structure maintenance |
| GO:0046883 | 0.0011 | 3.7479 | 2.5664 | 9 | 245 | regulation of hormone secretion |
| GO:0023019 | 0.0011 | 16.9517 | 0.2095 | 3 | 20 | signal transduction involved in regulation of gene expression |
| GO:0010656 | 0.0012 | 9.414 | 0.4714 | 4 | 45 | negative regulation of muscle cell apoptotic process |
| GO:0031018 | 0.0012 | 9.414 | 0.4714 | 4 | 45 | endocrine pancreas development |
| GO:0048732 | 0.0013 | 3.1791 | 3.7027 | 11 | 370 | gland development |
| GO:0002052 | 0.0013 | 16.009 | 0.22 | 3 | 21 | positive regulation of neuroblast proliferation |
| GO:0072132 | 0.0013 | 9.1893 | 0.4819 | 4 | 46 | mesenchyme morphogenesis |
| GO:0042476 | 0.0014 | 5.3045 | 1.2151 | 6 | 116 | odontogenesis |
| GO:0003407 | 0.0015 | 8.9837 | 0.4913 | 4 | 48 | neural retina development |
| GO:0050680 | 0.0015 | 5.2564 | 1.2256 | 6 | 117 | negative regulation of epithelial cell proliferation |
| GO:0010463 | 0.0015 | 8.9751 | 0.4923 | 4 | 47 | mesenchymal cell proliferation |
| GO:2000679 | 0.0015 | 15.1655 | 0.2305 | 3 | 22 | positive regulation of transcription regulatory region DNA binding |
| GO:0048519 | 0.0015 | 1.7102 | 38.284 | 55 | 4029 | negative regulation of biological process |
| GO:0048646 | 0.0015 | 2.9343 | 4.3896 | 12 | 456 | anatomical structure formation involved in morphogenesis |
| GO:0043392 | 0.0016 | 8.7705 | 0.5028 | 4 | 48 | negative regulation of DNA binding |
| GO:0060563 | 0.0016 | 8.7705 | 0.5028 | 4 | 48 | neuroepithelial cell differentiation |
| GO:0014062 | 0.0016 | 47.7827 | 0.0629 | 2 | 6 | regulation of serotonin secretion |
| GO:0045778 | 0.0017 | 6.2896 | 0.859 | 5 | 82 | positive regulation of ossification |
| GO:0035295 | 0.0017 | 3.0552 | 3.847 | 11 | 386 | tube development |
| GO:0048747 | 0.0018 | 8.3882 | 0.5238 | 4 | 50 | muscle fiber development |
| GO:0060487 | 0.0019 | 13.7194 | 0.2514 | 3 | 24 | lung epithelial cell differentiation |
| GO:0060541 | 0.002 | 13.6175 | 0.2521 | 3 | 25 | respiratory system development |
| GO:0021543 | 0.002 | 6.0629 | 0.8885 | 5 | 87 | pallium development |
| GO:0051252 | 0.002 | 2.2145 | 10.7774 | 21 | 1502 | regulation of RNA metabolic process |
| GO:0035136 | 0.0021 | 39.0878 | 0.0717 | 2 | 7 | forelimb morphogenesis |
| GO:1902692 | 0.0021 | 38.8752 | 0.0721 | 2 | 7 | regulation of neuroblast proliferation |
| GO:0045736 | 0.0022 | 13.095 | 0.2619 | 3 | 25 | negative regulation of cyclin-dependent protein serine/threonine kinase activity |
| GO:0060740 | 0.0022 | 13.095 | 0.2619 | 3 | 25 | prostate gland epithelium morphogenesis |
| GO:0003253 | 0.0022 | 38.2238 | 0.0733 | 2 | 7 | cardiac neural crest cell migration involved in outflow tract morphogenesis |
| GO:0021798 | 0.0022 | 38.2238 | 0.0733 | 2 | 7 | forebrain dorsal/ventral pattern formation |
| GO:0060430 | 0.0022 | 38.2238 | 0.0733 | 2 | 7 | lung saccule development |
| GO:2000049 | 0.0022 | 38.2238 | 0.0733 | 2 | 7 | positive regulation of cell-cell adhesion mediated by cadherin |
| GO:0007405 | 0.0023 | 12.8929 | 0.2648 | 3 | 26 | neuroblast proliferation |
| GO:0033993 | 0.0023 | 2.2129 | 9.2495 | 19 | 883 | response to lipid |
| GO:0022603 | 0.0024 | 2.1616 | 9.9827 | 20 | 953 | regulation of anatomical structure morphogenesis |
| GO:0072001 | 0.0024 | 3.3445 | 2.8597 | 9 | 273 | renal system development |
| GO:0002063 | 0.0025 | 12.5249 | 0.2724 | 3 | 26 | chondrocyte development |
| GO:0021846 | 0.0025 | 12.5249 | 0.2724 | 3 | 26 | cell proliferation in forebrain |
| GO:0048857 | 0.0026 | 7.5634 | 0.5761 | 4 | 55 | neural nucleus development |
| GO:0002675 | 0.0027 | 12.0022 | 0.2828 | 3 | 27 | positive regulation of acute inflammatory response |
| GO:0061311 | 0.0027 | 12.0022 | 0.2828 | 3 | 27 | cell surface receptor signaling pathway involved in heart development |
| GO:0048743 | 0.0029 | 31.8512 | 0.0838 | 2 | 8 | positive regulation of skeletal muscle fiber development |
| GO:0071863 | 0.0029 | 31.8512 | 0.0838 | 2 | 8 | regulation of cell proliferation in bone marrow |
| GO:1904684 | 0.0029 | 31.8512 | 0.0838 | 2 | 8 | negative regulation of metalloendopeptidase activity |
| GO:0072073 | 0.003 | 4.5179 | 1.4141 | 6 | 135 | kidney epithelium development |
| GO:0010719 | 0.0031 | 11.5214 | 0.2933 | 3 | 28 | negative regulation of epithelial to mesenchymal transition |
| GO:0051093 | 0.0032 | 2.461 | 6.0806 | 14 | 607 | negative regulation of developmental process |
| GO:0010001 | 0.0033 | 3.8534 | 1.9274 | 7 | 184 | glial cell differentiation |
| GO:0022037 | 0.0034 | 5.3173 | 1.0056 | 5 | 96 | metencephalon development |
| GO:0031128 | 0.0034 | 11.0776 | 0.3038 | 3 | 29 | developmental induction |
| GO:0048645 | 0.0034 | 7.0116 | 0.618 | 4 | 59 | animal organ formation |
| GO:0006357 | 0.0035 | 3.8344 | 1.9579 | 7 | 278 | regulation of transcription from RNA polymerase II promoter |
| GO:0048608 | 0.0036 | 2.7578 | 4.2319 | 11 | 404 | reproductive structure development |
| GO:0023061 | 0.0037 | 2.7506 | 4.2424 | 11 | 405 | signal release |
| GO:0021988 | 0.0037 | 10.6667 | 0.3143 | 3 | 30 | olfactory lobe development |
| GO:0048664 | 0.0037 | 27.2993 | 0.0943 | 2 | 9 | neuron fate determination |
| GO:0061004 | 0.0037 | 27.2993 | 0.0943 | 2 | 9 | pattern specification involved in kidney development |
| GO:2000818 | 0.0037 | 27.2993 | 0.0943 | 2 | 9 | negative regulation of myoblast proliferation |
| GO:0010667 | 0.0041 | 10.2851 | 0.3247 | 3 | 31 | negative regulation of cardiac muscle cell apoptotic process |
| GO:0016331 | 0.0042 | 4.1902 | 1.5189 | 6 | 145 | morphogenesis of embryonic epithelium |
| GO:0001756 | 0.0043 | 6.5346 | 0.6599 | 4 | 63 | somitogenesis |
| GO:0042733 | 0.0043 | 6.5346 | 0.6599 | 4 | 63 | embryonic digit morphogenesis |
| GO:0009914 | 0.0043 | 3.0396 | 3.132 | 9 | 299 | hormone transport |
| GO:0017015 | 0.0044 | 4.9866 | 1.0685 | 5 | 102 | regulation of transforming growth factor beta receptor signaling pathway |
| GO:0019933 | 0.0044 | 4.9866 | 1.0685 | 5 | 102 | cAMP-mediated signaling |
| GO:0060325 | 0.0045 | 9.9298 | 0.3352 | 3 | 32 | face morphogenesis |
| GO:1902742 | 0.0045 | 9.9298 | 0.3352 | 3 | 32 | apoptotic process involved in development |
| GO:0009605 | 0.0045 | 1.7306 | 21.5891 | 34 | 2061 | response to external stimulus |
| GO:0030855 | 0.0045 | 2.2826 | 7.0093 | 15 | 692 | epithelial cell differentiation |
| GO:0007399 | 0.0046 | 3.6434 | 2.0587 | 7 | 296 | nervous system development |
| GO:0003211 | 0.0046 | 23.8854 | 0.1048 | 2 | 10 | cardiac ventricle formation |
| GO:0021877 | 0.0046 | 23.8854 | 0.1048 | 2 | 10 | forebrain neuron fate commitment |
| GO:0034393 | 0.0046 | 23.8854 | 0.1048 | 2 | 10 | positive regulation of smooth muscle cell apoptotic process |
| GO:0035878 | 0.0046 | 23.8854 | 0.1048 | 2 | 10 | nail development |
| GO:0060174 | 0.0046 | 23.8854 | 0.1048 | 2 | 10 | limb bud formation |
| GO:0090370 | 0.0046 | 23.8854 | 0.1048 | 2 | 10 | negative regulation of cholesterol efflux |
| GO:0030509 | 0.0047 | 4.1009 | 1.5503 | 6 | 148 | BMP signaling pathway |
| GO:0030326 | 0.0047 | 9.7042 | 0.3413 | 3 | 34 | embryonic limb morphogenesis |
| GO:0014904 | 0.0049 | 9.5982 | 0.3457 | 3 | 33 | myotube cell development |
| GO:0007631 | 0.0049 | 4.8361 | 1.0999 | 5 | 105 | feeding behavior |
| GO:0001649 | 0.0052 | 3.5304 | 2.095 | 7 | 200 | osteoblast differentiation |
| GO:0071773 | 0.0054 | 21.8217 | 0.1122 | 2 | 11 | cellular response to BMP stimulus |
| GO:0120036 | 0.0054 | 1.8773 | 13.7957 | 24 | 1317 | plasma membrane bounded cell projection organization |
| GO:0010985 | 0.0056 | 21.2302 | 0.1152 | 2 | 11 | negative regulation of lipoprotein particle clearance |
| GO:0021889 | 0.0056 | 21.2302 | 0.1152 | 2 | 11 | olfactory bulb interneuron differentiation |
| GO:0043374 | 0.0056 | 21.2302 | 0.1152 | 2 | 11 | CD8-positive, alpha-beta T cell differentiation |
| GO:0060033 | 0.0056 | 21.2302 | 0.1152 | 2 | 11 | anatomical structure regression |
| GO:0061308 | 0.0056 | 21.2302 | 0.1152 | 2 | 11 | cardiac neural crest cell development involved in heart development |
| GO:2000543 | 0.0056 | 21.2302 | 0.1152 | 2 | 11 | positive regulation of gastrulation |
| GO:2000774 | 0.0056 | 21.2302 | 0.1152 | 2 | 11 | positive regulation of cellular senescence |
| GO:2001053 | 0.0056 | 21.2302 | 0.1152 | 2 | 11 | regulation of mesenchymal cell apoptotic process |
| GO:0042596 | 0.0058 | 8.9972 | 0.3666 | 3 | 35 | fear response |
| GO:0003008 | 0.0058 | 1.7239 | 20.2797 | 32 | 1936 | system process |
| GO:0035195 | 0.0059 | 3.1228 | 2.7026 | 8 | 258 | gene silencing by miRNA |
| GO:0072359 | 0.0062 | 2.0034 | 10.1399 | 19 | 968 | circulatory system development |
| GO:0007422 | 0.0062 | 5.839 | 0.7333 | 4 | 70 | peripheral nervous system development |
| GO:0014003 | 0.0063 | 8.724 | 0.3771 | 3 | 36 | oligodendrocyte development |
| GO:0051146 | 0.0063 | 3.0852 | 2.734 | 8 | 261 | striated muscle cell differentiation |
| GO:0072088 | 0.0065 | 5.7515 | 0.7437 | 4 | 71 | nephron epithelium morphogenesis |
| GO:0010454 | 0.0067 | 19.106 | 0.1257 | 2 | 12 | negative regulation of cell fate commitment |
| GO:0055015 | 0.0067 | 19.106 | 0.1257 | 2 | 12 | ventricular cardiac muscle cell development |
| GO:0060272 | 0.0067 | 19.106 | 0.1257 | 2 | 12 | embryonic skeletal joint morphogenesis |
| GO:0072017 | 0.0067 | 19.106 | 0.1257 | 2 | 12 | distal tubule development |
| GO:0031076 | 0.0068 | 8.4669 | 0.3876 | 3 | 37 | embryonic camera-type eye development |
| GO:0043069 | 0.0069 | 2.0649 | 8.7676 | 17 | 837 | negative regulation of programmed cell death |
| GO:0035050 | 0.0069 | 5.6665 | 0.7542 | 4 | 72 | embryonic heart tube development |
| GO:0016441 | 0.0069 | 3.0364 | 2.7759 | 8 | 265 | posttranscriptional gene silencing |
| GO:0010941 | 0.007 | 1.7725 | 16.4773 | 27 | 1573 | regulation of cell death |
| GO:0072210 | 0.0071 | 8.3242 | 0.3934 | 3 | 38 | metanephric nephron development |
| GO:0071310 | 0.0071 | 1.6425 | 24.7526 | 37 | 2363 | cellular response to organic substance |
| GO:0061333 | 0.0072 | 5.5841 | 0.7647 | 4 | 73 | renal tubule morphogenesis |
| GO:0035315 | 0.0073 | 8.2245 | 0.3981 | 3 | 38 | hair cell differentiation |
| GO:0045844 | 0.0076 | 5.504 | 0.7752 | 4 | 74 | positive regulation of striated muscle tissue development |
| GO:0055006 | 0.0076 | 5.504 | 0.7752 | 4 | 74 | cardiac cell development |
| GO:0001525 | 0.0078 | 2.4673 | 4.7033 | 11 | 449 | angiogenesis |
| GO:0002864 | 0.0079 | 17.368 | 0.1362 | 2 | 13 | regulation of acute inflammatory response to antigenic stimulus |
| GO:0021535 | 0.0079 | 17.368 | 0.1362 | 2 | 13 | cell migration in hindbrain |
| GO:0021978 | 0.0079 | 17.368 | 0.1362 | 2 | 13 | telencephalon regionalization |
| GO:0031274 | 0.0079 | 17.368 | 0.1362 | 2 | 13 | positive regulation of pseudopodium assembly |
| GO:0061029 | 0.0079 | 17.368 | 0.1362 | 2 | 13 | eyelid development in camera-type eye |
| GO:0061548 | 0.0079 | 17.368 | 0.1362 | 2 | 13 | ganglion development |
| GO:0071880 | 0.0079 | 17.368 | 0.1362 | 2 | 13 | adenylate cyclase-activating adrenergic receptor signaling pathway |
| GO:0072080 | 0.008 | 5.4123 | 0.7873 | 4 | 76 | nephron tubule development |
| GO:0003170 | 0.0084 | 7.7789 | 0.419 | 3 | 40 | heart valve development |
| GO:0003206 | 0.0089 | 4.1648 | 1.2675 | 5 | 121 | cardiac chamber morphogenesis |
| GO:0021795 | 0.009 | 7.5737 | 0.4295 | 3 | 41 | cerebral cortex cell migration |
| GO:0007492 | 0.0091 | 5.2051 | 0.8171 | 4 | 78 | endoderm development |
| GO:0016049 | 0.0091 | 2.4107 | 4.8081 | 11 | 459 | cell growth |
| GO:0006837 | 0.0091 | 15.9196 | 0.1467 | 2 | 14 | serotonin transport |
| GO:0007501 | 0.0091 | 15.9196 | 0.1467 | 2 | 14 | mesodermal cell fate specification |
| GO:0021527 | 0.0091 | 15.9196 | 0.1467 | 2 | 14 | spinal cord association neuron differentiation |
| GO:0021984 | 0.0091 | 15.9196 | 0.1467 | 2 | 14 | adenohypophysis development |
| GO:0048853 | 0.0091 | 15.9196 | 0.1467 | 2 | 14 | forebrain morphogenesis |
| GOMFID | Pvalue | OddsRatio | ExpCount | Count | Size | Term |
| GO:0000387 | 3e-04 | 26.3693 | 0.13 | 3 | 37 | spliceosomal snRNP assembly |
| GO:0070475 | 4e-04 | 83.974 | 0.0316 | 2 | 9 | rRNA base methylation |
| GO:1905205 | 9e-04 | 53.4248 | 0.0457 | 2 | 13 | positive regulation of connective tissue replacement |
| GO:0001510 | 0.0013 | 15.1723 | 0.2178 | 3 | 62 | RNA methylation |
| GO:0060044 | 0.0018 | 36.7182 | 0.0632 | 2 | 18 | negative regulation of cardiac muscle cell proliferation |
| GO:0035265 | 0.0021 | 8.0075 | 0.5444 | 4 | 155 | organ growth |
| GO:0000715 | 0.0024 | 30.9148 | 0.0738 | 2 | 21 | nucleotide-excision repair, DNA damage recognition |
| GO:0070098 | 0.0028 | 11.6126 | 0.281 | 3 | 80 | chemokine-mediated signaling pathway |
| GO:0061117 | 0.0029 | 27.9671 | 0.0808 | 2 | 23 | negative regulation of heart growth |
| GO:0055017 | 0.0034 | 10.7691 | 0.3021 | 3 | 86 | cardiac muscle tissue growth |
| GO:0061519 | 0.0035 | Inf | 0.0035 | 1 | 1 | macrophage homeostasis |
| GO:1901506 | 0.0035 | Inf | 0.0035 | 1 | 1 | regulation of acylglycerol transport |
| GO:1905884 | 0.0035 | Inf | 0.0035 | 1 | 1 | negative regulation of triglyceride transport |
| GO:0030593 | 0.0036 | 10.5144 | 0.3091 | 3 | 88 | neutrophil chemotaxis |
| GO:0071108 | 0.0037 | 24.4667 | 0.0913 | 2 | 26 | protein K48-linked deubiquitination |
| GO:0000377 | 0.0042 | 5.122 | 1.0642 | 5 | 303 | RNA splicing, via transesterification reactions with bulged adenosine as nucleophile |
| GO:0022613 | 0.0043 | 4.2662 | 1.5454 | 6 | 440 | ribonucleoprotein complex biogenesis |
| GO:0003298 | 0.0046 | 21.7441 | 0.1019 | 2 | 29 | physiological muscle hypertrophy |
| GO:0061049 | 0.0046 | 21.7441 | 0.1019 | 2 | 29 | cell growth involved in cardiac muscle cell development |
| GO:0030218 | 0.0048 | 9.5024 | 0.3407 | 3 | 97 | erythrocyte differentiation |
| GO:0006397 | 0.0052 | 4.101 | 1.6051 | 6 | 457 | mRNA processing |
| GO:0016049 | 0.0053 | 4.0823 | 1.6121 | 6 | 459 | cell growth |
| GO:0055026 | 0.0056 | 19.5661 | 0.1124 | 2 | 32 | negative regulation of cardiac muscle tissue development |
| GO:0006353 | 0.0061 | 8.6672 | 0.3723 | 3 | 106 | DNA-templated transcription, termination |
| GO:0071826 | 0.0063 | 5.8494 | 0.7376 | 4 | 210 | ribonucleoprotein complex subunit organization |
| GO:1901385 | 0.0063 | 18.3409 | 0.1194 | 2 | 34 | regulation of voltage-gated calcium channel activity |
| GO:0003430 | 0.007 | 288.7679 | 0.007 | 1 | 2 | growth plate cartilage chondrocyte growth |
| GO:0061766 | 0.007 | 288.7679 | 0.007 | 1 | 2 | positive regulation of lung blood pressure |
| GO:1901255 | 0.007 | 288.7679 | 0.007 | 1 | 2 | nucleotide-excision repair involved in interstrand cross-link repair |
| GO:1990108 | 0.007 | 288.7679 | 0.007 | 1 | 2 | protein linear deubiquitination |
| GO:0000154 | 0.0071 | 17.2599 | 0.1264 | 2 | 36 | rRNA modification |
| GO:0097530 | 0.009 | 7.4944 | 0.4285 | 3 | 122 | granulocyte migration |
| GO:0002262 | 0.0094 | 7.3856 | 0.4348 | 3 | 126 | myeloid cell homeostasis |
| GO:0000375 | 0.0098 | 155.6078 | 0.0098 | 1 | 3 | RNA splicing, via transesterification reactions |
| GOMFID | Pvalue | OddsRatio | ExpCount | Count | Size | Term |
| GO:0009593 | 0 | 9.9574 | 0.8873 | 7 | 450 | detection of chemical stimulus |
| GO:0050911 | 1e-04 | 10.0097 | 0.7315 | 6 | 371 | detection of chemical stimulus involved in sensory perception of smell |
| GO:1904628 | 1e-04 | 179.9 | 0.0158 | 2 | 8 | cellular response to phorbol 13-acetate 12-myristate |
| GO:0035195 | 1e-04 | 11.6703 | 0.5087 | 5 | 258 | gene silencing by miRNA |
| GO:0043207 | 1e-04 | 6.3652 | 1.605 | 8 | 814 | response to external biotic stimulus |
| GO:0016441 | 2e-04 | 11.3511 | 0.5225 | 5 | 265 | posttranscriptional gene silencing |
| GO:0031047 | 2e-04 | 10.4136 | 0.5679 | 5 | 288 | gene silencing by RNA |
| GO:0050906 | 2e-04 | 7.9661 | 0.911 | 6 | 462 | detection of stimulus involved in sensory perception |
| GO:0007606 | 3e-04 | 7.8596 | 0.9228 | 6 | 468 | sensory perception of chemical stimulus |
| GO:0050829 | 4e-04 | 22.8493 | 0.1499 | 3 | 76 | defense response to Gram-negative bacterium |
| GO:0045653 | 6e-04 | 67.4208 | 0.0355 | 2 | 18 | negative regulation of megakaryocyte differentiation |
| GO:0050830 | 6e-04 | 20.3301 | 0.1676 | 3 | 85 | defense response to Gram-positive bacterium |
| GO:0034249 | 7e-04 | 8.1466 | 0.7197 | 5 | 365 | negative regulation of cellular amide metabolic process |
| GO:0006959 | 8e-04 | 10.6696 | 0.4298 | 4 | 218 | humoral immune response |
| GO:0006335 | 0.0018 | 35.9267 | 0.0631 | 2 | 32 | DNA replication-dependent nucleosome assembly |
| GO:0000183 | 0.002 | 33.6771 | 0.067 | 2 | 34 | chromatin silencing at rDNA |
| GO:0031497 | 0.0027 | 11.9509 | 0.28 | 3 | 142 | chromatin assembly |
| GO:0034080 | 0.0028 | 28.3491 | 0.0789 | 2 | 40 | CENP-A containing nucleosome assembly |
| GO:0051290 | 0.0034 | 25.6429 | 0.0868 | 2 | 44 | protein heterotetramerization |
| GO:1904837 | 0.0034 | 25.6429 | 0.0868 | 2 | 44 | beta-catenin-TCF complex assembly |
| GO:0006417 | 0.0035 | 5.5609 | 1.0391 | 5 | 527 | regulation of translation |
| GO:0034724 | 0.0045 | 21.9701 | 0.1006 | 2 | 51 | DNA replication-independent nucleosome organization |
| GO:0016233 | 0.0052 | 20.3069 | 0.1084 | 2 | 55 | telomere capping |
| GO:0045087 | 0.0053 | 4.2617 | 1.6524 | 6 | 838 | innate immune response |
| GO:0050918 | 0.0056 | 19.5661 | 0.1124 | 2 | 57 | positive chemotaxis |
| GO:0002548 | 0.0066 | 17.93 | 0.1223 | 2 | 62 | monocyte chemotaxis |
| GO:0032269 | 0.0084 | 3.465 | 2.4016 | 7 | 1218 | negative regulation of cellular protein metabolic process |
| GO:0065004 | 0.0085 | 7.8376 | 0.422 | 3 | 214 | protein-DNA complex assembly |
| GO:0098542 | 0.0088 | 7.7628 | 0.4294 | 3 | 237 | defense response to other organism |
| GO:0006303 | 0.0088 | 15.359 | 0.142 | 2 | 72 | double-strand break repair via nonhomologous end joining |
| GO:0051607 | 0.0095 | 7.5127 | 0.4397 | 3 | 223 | defense response to virus |
| GO:0043044 | 0.0096 | 14.7251 | 0.1479 | 2 | 75 | ATP-dependent chromatin remodeling |
| GO:0007186 | 0.0097 | 3.3627 | 2.4687 | 7 | 1252 | G-protein coupled receptor signaling pathway |
| GOMFID | Pvalue | OddsRatio | ExpCount | Count | Size | Term |
| GO:0007186 | 0 | 5.119 | 3.6045 | 14 | 1216 | G-protein coupled receptor signaling pathway |
| GO:0030593 | 0 | 21.5475 | 0.2711 | 5 | 88 | neutrophil chemotaxis |
| GO:0070488 | 0 | Inf | 0.0062 | 2 | 2 | neutrophil aggregation |
| GO:0050911 | 0 | 8.2991 | 1.143 | 8 | 371 | detection of chemical stimulus involved in sensory perception of smell |
| GO:0097530 | 0 | 15.2536 | 0.3759 | 5 | 122 | granulocyte migration |
| GO:0010469 | 0 | 6.2143 | 1.7284 | 9 | 561 | regulation of receptor activity |
| GO:0009593 | 1e-04 | 6.7817 | 1.3864 | 8 | 450 | detection of chemical stimulus |
| GO:0050906 | 1e-04 | 6.5974 | 1.4234 | 8 | 462 | detection of stimulus involved in sensory perception |
| GO:0007606 | 1e-04 | 6.5089 | 1.4419 | 8 | 468 | sensory perception of chemical stimulus |
| GO:0048241 | 1e-04 | 168.4896 | 0.0185 | 2 | 6 | epinephrine transport |
| GO:0050832 | 2e-04 | 28.6223 | 0.1202 | 3 | 39 | defense response to fungus |
| GO:0006952 | 4e-04 | 3.5026 | 4.5844 | 13 | 1488 | defense response |
| GO:0017014 | 6e-04 | 67.3708 | 0.037 | 2 | 12 | protein nitrosylation |
| GO:0032119 | 6e-04 | 67.3708 | 0.037 | 2 | 12 | sequestering of zinc ion |
| GO:0048247 | 8e-04 | 18.7126 | 0.1787 | 3 | 58 | lymphocyte chemotaxis |
| GO:0042742 | 8e-04 | 7.6042 | 0.7333 | 5 | 238 | defense response to bacterium |
| GO:0002523 | 8e-04 | 56.1354 | 0.0431 | 2 | 14 | leukocyte migration involved in inflammatory response |
| GO:0046888 | 0.001 | 16.8657 | 0.1972 | 3 | 64 | negative regulation of hormone secretion |
| GO:0006935 | 0.0016 | 4.5913 | 1.7284 | 7 | 561 | chemotaxis |
| GO:0046903 | 0.0016 | 3.1155 | 4.6244 | 12 | 1501 | secretion |
| GO:0070098 | 0.0019 | 13.3479 | 0.2465 | 3 | 80 | chemokine-mediated signaling pathway |
| GO:0023052 | 0.0024 | 2.3157 | 18.7103 | 29 | 6073 | signaling |
| GO:0018198 | 0.0029 | 28.0469 | 0.0801 | 2 | 26 | peptidyl-cysteine modification |
| GO:0090276 | 0.003 | 7.3176 | 0.5977 | 4 | 194 | regulation of peptide hormone secretion |
| GO:0010817 | 0.003 | 4.6494 | 1.4388 | 6 | 467 | regulation of hormone levels |
| GO:0043312 | 0.003 | 4.6494 | 1.4388 | 6 | 467 | neutrophil degranulation |
| GO:0019730 | 0.003 | 11.2845 | 0.2896 | 3 | 94 | antimicrobial humoral response |
| GO:0007634 | 0.0031 | Inf | 0.0031 | 1 | 1 | optokinetic behavior |
| GO:0032646 | 0.0031 | Inf | 0.0031 | 1 | 1 | regulation of hepatocyte growth factor production |
| GO:0032812 | 0.0031 | Inf | 0.0031 | 1 | 1 | positive regulation of epinephrine secretion |
| GO:0048178 | 0.0031 | Inf | 0.0031 | 1 | 1 | negative regulation of hepatocyte growth factor biosynthetic process |
| GO:0071881 | 0.0031 | Inf | 0.0031 | 1 | 1 | adenylate cyclase-inhibiting adrenergic receptor signaling pathway |
| GO:0071882 | 0.0031 | Inf | 0.0031 | 1 | 1 | phospholipase C-activating adrenergic receptor signaling pathway |
| GO:1904109 | 0.0031 | Inf | 0.0031 | 1 | 1 | positive regulation of cholesterol import |
| GO:1904325 | 0.0031 | Inf | 0.0031 | 1 | 1 | positive regulation of inhibitory G-protein coupled receptor phosphorylation |
| GO:0006955 | 0.0032 | 2.7431 | 5.6997 | 13 | 1850 | immune response |
| GO:0055069 | 0.0033 | 25.8862 | 0.0863 | 2 | 28 | zinc ion homeostasis |
| GO:0051674 | 0.0033 | 2.9635 | 4.3656 | 11 | 1417 | localization of cell |
| GO:0042119 | 0.0034 | 4.5378 | 1.4727 | 6 | 478 | neutrophil activation |
| GO:0050877 | 0.0034 | 3.115 | 3.7341 | 10 | 1212 | nervous system process |
| GO:0001816 | 0.0039 | 3.8768 | 2.0303 | 7 | 659 | cytokine production |
| GO:0001775 | 0.0047 | 2.9627 | 3.9097 | 10 | 1269 | cell activation |
| GO:0002275 | 0.005 | 4.1643 | 1.599 | 6 | 519 | myeloid cell activation involved in immune response |
| GO:0031424 | 0.0051 | 6.2503 | 0.6963 | 4 | 226 | keratinization |
| GO:0016477 | 0.0051 | 2.9273 | 3.9528 | 10 | 1283 | cell migration |
| GO:0045124 | 0.0052 | 20.3864 | 0.1078 | 2 | 35 | regulation of bone resorption |
| GO:0002444 | 0.0052 | 4.131 | 1.6113 | 6 | 523 | myeloid leukocyte mediated immunity |
| GO:0045055 | 0.0057 | 3.589 | 2.1844 | 7 | 709 | regulated exocytosis |
| GO:0000387 | 0.0058 | 19.219 | 0.114 | 2 | 37 | spliceosomal snRNP assembly |
| GO:0046676 | 0.0058 | 19.219 | 0.114 | 2 | 37 | negative regulation of insulin secretion |
| GO:0007154 | 0.006 | 2.1213 | 18.7781 | 28 | 6095 | cell communication |
| GO:0002792 | 0.0061 | 8.6879 | 0.3728 | 3 | 121 | negative regulation of peptide secretion |
| GO:0021560 | 0.0062 | 330.1633 | 0.0062 | 1 | 2 | abducens nerve development |
| GO:0021599 | 0.0062 | 330.1633 | 0.0062 | 1 | 2 | abducens nerve formation |
| GO:0035606 | 0.0062 | 330.1633 | 0.0062 | 1 | 2 | peptidyl-cysteine S-trans-nitrosylation |
| GO:0044657 | 0.0062 | 330.1633 | 0.0062 | 1 | 2 | pore formation in membrane of other organism during symbiotic interaction |
| GO:0052043 | 0.0062 | 330.1633 | 0.0062 | 1 | 2 | modification by symbiont of host cellular component |
| GO:0052185 | 0.0062 | 330.1633 | 0.0062 | 1 | 2 | modification of structure of other organism involved in symbiotic interaction |
| GO:0052332 | 0.0062 | 330.1633 | 0.0062 | 1 | 2 | modification by organism of membrane in other organism involved in symbiotic interaction |
| GO:0060279 | 0.0062 | 330.1633 | 0.0062 | 1 | 2 | positive regulation of ovulation |
| GO:0060876 | 0.0062 | 330.1633 | 0.0062 | 1 | 2 | semicircular canal formation |
| GO:0071657 | 0.0062 | 330.1633 | 0.0062 | 1 | 2 | positive regulation of granulocyte colony-stimulating factor production |
| GO:0045744 | 0.0064 | 18.1779 | 0.1202 | 2 | 39 | negative regulation of G-protein coupled receptor protein signaling pathway |
| GO:0007292 | 0.0069 | 8.3321 | 0.3882 | 3 | 126 | female gamete generation |
| GO:0051050 | 0.0073 | 3.1339 | 2.8806 | 8 | 935 | positive regulation of transport |
| GO:1902533 | 0.0076 | 3.1125 | 2.8991 | 8 | 941 | positive regulation of intracellular signal transduction |
| GO:0030595 | 0.008 | 7.8982 | 0.4098 | 3 | 141 | leukocyte chemotaxis |
| GO:0023061 | 0.008 | 4.3831 | 1.2478 | 5 | 405 | signal release |
| GO:0048599 | 0.0085 | 15.6357 | 0.1386 | 2 | 45 | oocyte development |
| GO:0035821 | 0.0092 | 7.4741 | 0.4313 | 3 | 140 | modification of morphology or physiology of other organism |
| GO:0071346 | 0.0092 | 7.4741 | 0.4313 | 3 | 140 | cellular response to interferon-gamma |
| GO:0050433 | 0.0092 | 14.9389 | 0.1448 | 2 | 47 | regulation of catecholamine secretion |
| GO:0021524 | 0.0092 | 165.0714 | 0.0092 | 1 | 3 | visceral motor neuron differentiation |
| GO:0046882 | 0.0092 | 165.0714 | 0.0092 | 1 | 3 | negative regulation of follicle-stimulating hormone secretion |
| GO:0048936 | 0.0092 | 165.0714 | 0.0092 | 1 | 3 | peripheral nervous system neuron axonogenesis |
| GO:0060913 | 0.0092 | 165.0714 | 0.0092 | 1 | 3 | cardiac cell fate determination |
| GO:0070093 | 0.0092 | 165.0714 | 0.0092 | 1 | 3 | negative regulation of glucagon secretion |
| GO:0032103 | 0.0096 | 5.1822 | 0.8349 | 4 | 271 | positive regulation of response to external stimulus |
| GOMFID | Pvalue | OddsRatio | ExpCount | Count | Size | Term |
| GO:0065007 | 0 | 6.8841 | 34.7742 | 47 | 11287 | biological regulation |
| GO:0048568 | 0 | 7.4565 | 1.2663 | 8 | 411 | embryonic organ development |
| GO:0048598 | 3e-04 | 5.4415 | 1.7153 | 8 | 568 | embryonic morphogenesis |
| GO:0050794 | 4e-04 | 3.9887 | 22.6334 | 33 | 8509 | regulation of cellular process |
| GO:2000113 | 4e-04 | 3.5448 | 4.5351 | 13 | 1472 | negative regulation of cellular macromolecule biosynthetic process |
| GO:0000122 | 5e-04 | 4.5221 | 2.3353 | 9 | 758 | negative regulation of transcription from RNA polymerase II promoter |
| GO:0072498 | 0.001 | 51.8141 | 0.0462 | 2 | 15 | embryonic skeletal joint development |
| GO:0009890 | 0.001 | 3.1576 | 5.0311 | 13 | 1633 | negative regulation of biosynthetic process |
| GO:0080090 | 0.0011 | 2.4839 | 17.9001 | 29 | 5810 | regulation of primary metabolic process |
| GO:0032502 | 0.0012 | 2.4738 | 17.9463 | 29 | 5825 | developmental process |
| GO:0007186 | 0.0012 | 3.3951 | 3.8573 | 11 | 1252 | G-protein coupled receptor signaling pathway |
| GO:0007389 | 0.0015 | 5.3381 | 1.2601 | 6 | 409 | pattern specification process |
| GO:0048557 | 0.0015 | 39.6127 | 0.0585 | 2 | 19 | embryonic digestive tract morphogenesis |
| GO:0006357 | 0.0017 | 6.5043 | 0.8812 | 5 | 360 | regulation of transcription from RNA polymerase II promoter |
| GO:0000079 | 0.0019 | 13.3479 | 0.2465 | 3 | 80 | regulation of cyclin-dependent protein serine/threonine kinase activity |
| GO:1903507 | 0.0022 | 3.3358 | 3.5061 | 10 | 1138 | negative regulation of nucleic acid-templated transcription |
| GO:2001141 | 0.0022 | 2.4552 | 10.7061 | 20 | 3475 | regulation of RNA biosynthetic process |
| GO:0021549 | 0.0024 | 12.2302 | 0.268 | 3 | 87 | cerebellum development |
| GO:0009887 | 0.0024 | 3.5032 | 2.9669 | 9 | 963 | animal organ morphogenesis |
| GO:0009952 | 0.0027 | 7.5598 | 0.5798 | 4 | 192 | anterior/posterior pattern specification |
| GO:0010629 | 0.0028 | 2.7945 | 5.6072 | 13 | 1820 | negative regulation of gene expression |
| GO:0048704 | 0.0028 | 11.5396 | 0.2834 | 3 | 92 | embryonic skeletal system morphogenesis |
| GO:0061011 | 0.0031 | Inf | 0.0031 | 1 | 1 | hepatic duct development |
| GO:1903769 | 0.0031 | Inf | 0.0031 | 1 | 1 | negative regulation of cell proliferation in bone marrow |
| GO:0021761 | 0.0033 | 10.9224 | 0.2988 | 3 | 97 | limbic system development |
| GO:0051253 | 0.0034 | 3.115 | 3.7341 | 10 | 1212 | negative regulation of RNA metabolic process |
| GO:0060429 | 0.0034 | 3.115 | 3.7341 | 10 | 1212 | epithelium development |
| GO:0006351 | 0.0035 | 2.3411 | 11.1097 | 20 | 3606 | transcription, DNA-templated |
| GO:0030154 | 0.0035 | 2.3118 | 11.9539 | 21 | 3880 | cell differentiation |
| GO:0035239 | 0.0037 | 5.3035 | 1.0383 | 5 | 337 | tube morphogenesis |
| GO:0006308 | 0.0038 | 24.0342 | 0.0924 | 2 | 30 | DNA catabolic process |
| GO:0035115 | 0.0043 | 22.4292 | 0.0986 | 2 | 32 | embryonic forelimb morphogenesis |
| GO:0051172 | 0.0047 | 2.469 | 7.4188 | 15 | 2408 | negative regulation of nitrogen compound metabolic process |
| GO:0045944 | 0.0049 | 3.1309 | 3.2935 | 9 | 1069 | positive regulation of transcription from RNA polymerase II promoter |
| GO:0032467 | 0.0049 | 21.0247 | 0.1048 | 2 | 34 | positive regulation of cytokinesis |
| GO:0002384 | 0.0062 | 330.1633 | 0.0062 | 1 | 2 | hepatic immune response |
| GO:0003326 | 0.0062 | 330.1633 | 0.0062 | 1 | 2 | pancreatic A cell fate commitment |
| GO:0003329 | 0.0062 | 330.1633 | 0.0062 | 1 | 2 | pancreatic PP cell fate commitment |
| GO:0003335 | 0.0062 | 330.1633 | 0.0062 | 1 | 2 | corneocyte development |
| GO:0021722 | 0.0062 | 330.1633 | 0.0062 | 1 | 2 | superior olivary nucleus maturation |
| GO:0060730 | 0.0062 | 330.1633 | 0.0062 | 1 | 2 | regulation of intestinal epithelial structure maintenance |
| GO:0061017 | 0.0062 | 330.1633 | 0.0062 | 1 | 2 | hepatoblast differentiation |
| GO:0072272 | 0.0062 | 330.1633 | 0.0062 | 1 | 2 | proximal/distal pattern formation involved in metanephric nephron development |
| GO:0110023 | 0.0062 | 330.1633 | 0.0062 | 1 | 2 | negative regulation of cardiac muscle myoblast proliferation |
| GO:2000824 | 0.0062 | 330.1633 | 0.0062 | 1 | 2 | negative regulation of androgen receptor activity |
| GO:0032501 | 0.0062 | 2.243 | 18.2647 | 27 | 6567 | multicellular organismal process |
| GO:0048731 | 0.0063 | 2.2087 | 12.6095 | 21 | 4328 | system development |
| GO:0043009 | 0.0064 | 3.9417 | 1.6853 | 6 | 547 | chordate embryonic development |
| GO:0060255 | 0.0067 | 2.0984 | 17.9648 | 27 | 5831 | regulation of macromolecule metabolic process |
| GO:0042127 | 0.0072 | 2.6507 | 4.8278 | 11 | 1567 | regulation of cell proliferation |
| GO:0031324 | 0.0084 | 2.2949 | 7.8902 | 15 | 2561 | negative regulation of cellular metabolic process |
| GO:0031018 | 0.0085 | 15.6357 | 0.1386 | 2 | 45 | endocrine pancreas development |
| GO:0030902 | 0.0086 | 7.6429 | 0.4221 | 3 | 137 | hindbrain development |
| GO:0007157 | 0.0092 | 14.9389 | 0.1448 | 2 | 47 | heterophilic cell-cell adhesion via plasma membrane cell adhesion molecules |
| GO:0010621 | 0.0092 | 165.0714 | 0.0092 | 1 | 3 | negative regulation of transcription by transcription factor localization |
| GO:0030538 | 0.0092 | 165.0714 | 0.0092 | 1 | 3 | embryonic genitalia morphogenesis |
| GO:0035054 | 0.0092 | 165.0714 | 0.0092 | 1 | 3 | embryonic heart tube anterior/posterior pattern specification |
| GO:0036023 | 0.0092 | 165.0714 | 0.0092 | 1 | 3 | embryonic skeletal limb joint morphogenesis |
| GO:0044336 | 0.0092 | 165.0714 | 0.0092 | 1 | 3 | canonical Wnt signaling pathway involved in negative regulation of apoptotic process |
| GO:0048619 | 0.0092 | 165.0714 | 0.0092 | 1 | 3 | embryonic hindgut morphogenesis |
| GO:0061010 | 0.0092 | 165.0714 | 0.0092 | 1 | 3 | gall bladder development |
| GO:0009059 | 0.0092 | 2.0454 | 15.574 | 24 | 5055 | macromolecule biosynthetic process |
| GO:0050770 | 0.0097 | 7.3126 | 0.4406 | 3 | 143 | regulation of axonogenesis |
| GOMFID | Pvalue | OddsRatio | ExpCount | Count | Size | Term |
| GO:0006614 | 0 | 37.4495 | 0.1325 | 4 | 86 | SRP-dependent cotranslational protein targeting to membrane |
| GO:0072599 | 0 | 32.2987 | 0.1525 | 4 | 99 | establishment of protein localization to endoplasmic reticulum |
| GO:0050911 | 0 | 13.7035 | 0.5715 | 6 | 371 | detection of chemical stimulus involved in sensory perception of smell |
| GO:0000184 | 0 | 28.1258 | 0.1741 | 4 | 113 | nuclear-transcribed mRNA catabolic process, nonsense-mediated decay |
| GO:0009593 | 0 | 11.2091 | 0.6932 | 6 | 450 | detection of chemical stimulus |
| GO:0050906 | 1e-04 | 10.9058 | 0.7117 | 6 | 462 | detection of stimulus involved in sensory perception |
| GO:0007606 | 1e-04 | 10.7601 | 0.7209 | 6 | 468 | sensory perception of chemical stimulus |
| GO:0006612 | 1e-04 | 20.386 | 0.2372 | 4 | 154 | protein targeting to membrane |
| GO:0019083 | 1e-04 | 18.2914 | 0.2634 | 4 | 171 | viral transcription |
| GO:0006413 | 1e-04 | 17.8591 | 0.2696 | 4 | 175 | translational initiation |
| GO:0031424 | 4e-04 | 13.7126 | 0.3481 | 4 | 226 | keratinization |
| GO:0006364 | 5e-04 | 12.6165 | 0.3774 | 4 | 245 | rRNA processing |
| GO:0043043 | 0.0011 | 6.1127 | 1.2354 | 6 | 802 | peptide biosynthetic process |
| GO:0006402 | 0.0015 | 9.3652 | 0.5037 | 4 | 327 | mRNA catabolic process |
| GO:1901194 | 0.0015 | Inf | 0.0015 | 1 | 1 | negative regulation of formation of translation preinitiation complex |
| GO:0009913 | 0.0019 | 8.7558 | 0.5376 | 4 | 349 | epidermal cell differentiation |
| GO:0019835 | 0.0019 | 35.1391 | 0.0647 | 2 | 42 | cytolysis |
| GO:0060354 | 0.0031 | 675.125 | 0.0031 | 1 | 2 | negative regulation of cell adhesion molecule production |
| GO:0043588 | 0.0033 | 7.4493 | 0.6285 | 4 | 408 | skin development |
| GO:0022613 | 0.0043 | 6.8886 | 0.6778 | 4 | 440 | ribonucleoprotein complex biogenesis |
| GO:0061044 | 0.0046 | 337.5417 | 0.0046 | 1 | 3 | negative regulation of vascular wound healing |
| GO:0043603 | 0.0055 | 4.3616 | 1.6945 | 6 | 1100 | cellular amide metabolic process |
| GO:0034655 | 0.0058 | 6.2937 | 0.7394 | 4 | 480 | nucleobase-containing compound catabolic process |
| GO:0006952 | 0.0059 | 3.866 | 2.2922 | 7 | 1488 | defense response |
| GO:0090298 | 0.0061 | 225.0139 | 0.0062 | 1 | 4 | negative regulation of mitochondrial DNA replication |
| GO:1904688 | 0.0061 | 225.0139 | 0.0062 | 1 | 4 | regulation of cytoplasmic translational initiation |
| GO:0072657 | 0.0068 | 6.0197 | 0.7718 | 4 | 501 | protein localization to membrane |
| GO:0045590 | 0.0077 | 168.75 | 0.0077 | 1 | 5 | negative regulation of regulatory T cell differentiation |
| GO:0061760 | 0.0077 | 168.75 | 0.0077 | 1 | 5 | antifungal innate immune response |
| GO:1902565 | 0.0077 | 168.75 | 0.0077 | 1 | 5 | positive regulation of neutrophil activation |
| GO:1903847 | 0.0077 | 168.75 | 0.0077 | 1 | 5 | regulation of aorta morphogenesis |
| GO:0050877 | 0.0088 | 3.9272 | 1.867 | 6 | 1212 | nervous system process |
| GO:2000766 | 0.0092 | 134.9917 | 0.0092 | 1 | 6 | negative regulation of cytoplasmic translation |
| GO:0034660 | 0.0094 | 5.4521 | 0.8488 | 4 | 551 | ncRNA metabolic process |
| GOMFID | Pvalue | OddsRatio | ExpCount | Count | Size | Term |
| GO:0043312 | 0 | 19.6054 | 0.6331 | 8 | 467 | neutrophil degranulation |
| GO:0042119 | 0 | 19.1331 | 0.648 | 8 | 478 | neutrophil activation |
| GO:0002275 | 0 | 17.5521 | 0.7036 | 8 | 519 | myeloid cell activation involved in immune response |
| GO:0002444 | 0 | 17.4114 | 0.709 | 8 | 523 | myeloid leukocyte mediated immunity |
| GO:0043207 | 0 | 13.2459 | 1.1035 | 9 | 814 | response to external biotic stimulus |
| GO:0031640 | 0 | 69.0385 | 0.0759 | 4 | 56 | killing of cells of other organism |
| GO:0035821 | 0 | 35.0153 | 0.1898 | 5 | 140 | modification of morphology or physiology of other organism |
| GO:0002263 | 0 | 13.611 | 0.8961 | 8 | 661 | cell activation involved in immune response |
| GO:0070488 | 0 | Inf | 0.0027 | 2 | 2 | neutrophil aggregation |
| GO:0045055 | 0 | 12.6399 | 0.9611 | 8 | 709 | regulated exocytosis |
| GO:0019730 | 0 | 75.5578 | 0.0505 | 3 | 43 | antimicrobial humoral response |
| GO:0061844 | 0 | 53.1546 | 0.0691 | 3 | 51 | antimicrobial humoral immune response mediated by antimicrobial peptide |
| GO:0045321 | 1e-04 | 7.7271 | 1.5237 | 8 | 1124 | leukocyte activation |
| GO:0017014 | 1e-04 | 161.97 | 0.0163 | 2 | 12 | protein nitrosylation |
| GO:0032119 | 1e-04 | 161.97 | 0.0163 | 2 | 12 | sequestering of zinc ion |
| GO:0051873 | 1e-04 | 161.97 | 0.0163 | 2 | 12 | killing by host of symbiont cells |
| GO:0002523 | 2e-04 | 134.9583 | 0.019 | 2 | 14 | leukocyte migration involved in inflammatory response |
| GO:0050830 | 2e-04 | 31.0494 | 0.1152 | 3 | 85 | defense response to Gram-positive bacterium |
| GO:0051818 | 3e-04 | 101.1937 | 0.0244 | 2 | 18 | disruption of cells of other organism involved in symbiotic interaction |
| GO:0032940 | 3e-04 | 6.2083 | 1.8626 | 8 | 1374 | secretion by cell |
| GO:0016192 | 3e-04 | 5.6504 | 2.4103 | 9 | 1778 | vesicle-mediated transport |
| GO:0044116 | 3e-04 | 95.2353 | 0.0258 | 2 | 19 | growth of symbiont involved in interaction with host |
| GO:0006952 | 5e-04 | 5.6861 | 2.0171 | 8 | 1488 | defense response |
| GO:0018198 | 6e-04 | 67.4292 | 0.0352 | 2 | 26 | peptidyl-cysteine modification |
| GO:0055069 | 6e-04 | 62.2346 | 0.038 | 2 | 28 | zinc ion homeostasis |
| GO:0042742 | 7e-04 | 19.9688 | 0.1801 | 3 | 153 | defense response to bacterium |
| GO:0050832 | 0.0011 | 47.2836 | 0.0492 | 2 | 38 | defense response to fungus |
| GO:0009913 | 0.0011 | 10.2171 | 0.4731 | 4 | 349 | epidermal cell differentiation |
| GO:0019547 | 0.0014 | Inf | 0.0014 | 1 | 1 | arginine catabolic process to ornithine |
| GO:0044140 | 0.0014 | Inf | 0.0014 | 1 | 1 | negative regulation of growth of symbiont on or near host surface |
| GO:0070965 | 0.0014 | Inf | 0.0014 | 1 | 1 | positive regulation of neutrophil mediated killing of fungus |
| GO:1900150 | 0.0014 | Inf | 0.0014 | 1 | 1 | regulation of defense response to fungus |
| GO:0050911 | 0.0014 | 9.5913 | 0.5029 | 4 | 371 | detection of chemical stimulus involved in sensory perception of smell |
| GO:0019835 | 0.0015 | 40.4175 | 0.0569 | 2 | 42 | cytolysis |
| GO:0031343 | 0.0015 | 39.4293 | 0.0583 | 2 | 43 | positive regulation of cell killing |
| GO:0002221 | 0.0016 | 14.895 | 0.2345 | 3 | 173 | pattern recognition receptor signaling pathway |
| GO:0045088 | 0.0019 | 8.7817 | 0.5477 | 4 | 404 | regulation of innate immune response |
| GO:0051704 | 0.002 | 4.2031 | 3.1192 | 9 | 2301 | multi-organism process |
| GO:0010043 | 0.002 | 34.383 | 0.0664 | 2 | 49 | response to zinc ion |
| GO:0043588 | 0.002 | 8.6925 | 0.5531 | 4 | 408 | skin development |
| GO:2001244 | 0.0024 | 31.0673 | 0.0732 | 2 | 54 | positive regulation of intrinsic apoptotic signaling pathway |
| GO:0050896 | 0.0025 | 4.4082 | 11.1227 | 18 | 8205 | response to stimulus |
| GO:0010963 | 0.0027 | 771.7143 | 0.0027 | 1 | 2 | regulation of L-arginine import |
| GO:0035606 | 0.0027 | 771.7143 | 0.0027 | 1 | 2 | peptidyl-cysteine S-trans-nitrosylation |
| GO:0070949 | 0.0027 | 771.7143 | 0.0027 | 1 | 2 | regulation of neutrophil mediated killing of symbiont cell |
| GO:0070960 | 0.0027 | 771.7143 | 0.0027 | 1 | 2 | positive regulation of neutrophil mediated cytotoxicity |
| GO:0009593 | 0.0029 | 7.853 | 0.61 | 4 | 450 | detection of chemical stimulus |
| GO:0050906 | 0.0032 | 7.6414 | 0.6263 | 4 | 462 | detection of stimulus involved in sensory perception |
| GO:0007606 | 0.0033 | 7.5398 | 0.6344 | 4 | 468 | sensory perception of chemical stimulus |
| GO:0051851 | 0.0034 | 26.0403 | 0.0868 | 2 | 64 | modification by host of symbiont morphology or physiology |
| GO:0031424 | 0.0034 | 11.3174 | 0.3064 | 3 | 226 | keratinization |
| GO:0032827 | 0.0041 | 385.8333 | 0.0041 | 1 | 3 | negative regulation of natural killer cell differentiation involved in immune response |
| GO:0051714 | 0.0041 | 385.8333 | 0.0041 | 1 | 3 | positive regulation of cytolysis in other organism |
| GO:0032602 | 0.0047 | 21.8014 | 0.103 | 2 | 76 | chemokine production |
| GO:0006919 | 0.0051 | 20.9481 | 0.1071 | 2 | 79 | activation of cysteine-type endopeptidase activity involved in apoptotic process |
| GO:0007186 | 0.0053 | 4.5027 | 1.6972 | 6 | 1252 | G-protein coupled receptor signaling pathway |
| GO:0090467 | 0.0054 | 257.2063 | 0.0054 | 1 | 4 | arginine import |
| GO:2000552 | 0.0054 | 257.2063 | 0.0054 | 1 | 4 | negative regulation of T-helper 2 cell cytokine production |
| GO:0030593 | 0.0063 | 18.7453 | 0.1193 | 2 | 88 | neutrophil chemotaxis |
| GO:0002218 | 0.0064 | 8.9166 | 0.3863 | 3 | 285 | activation of innate immune response |
| GO:1902023 | 0.0068 | 192.8929 | 0.0068 | 1 | 5 | L-arginine transport |
| GO:0046916 | 0.0071 | 17.5163 | 0.1274 | 2 | 94 | cellular transition metal ion homeostasis |
| GO:0010269 | 0.0081 | 154.3048 | 0.0081 | 1 | 6 | response to selenium ion |
| GO:0060336 | 0.0081 | 154.3048 | 0.0081 | 1 | 6 | negative regulation of interferon-gamma-mediated signaling pathway |
| GO:0071947 | 0.0081 | 154.3048 | 0.0081 | 1 | 6 | protein deubiquitination involved in ubiquitin-dependent protein catabolic process |
| GO:0032496 | 0.0082 | 8.1505 | 0.4216 | 3 | 311 | response to lipopolysaccharide |
| GO:0009253 | 0.0095 | 128.5794 | 0.0095 | 1 | 7 | peptidoglycan catabolic process |
| GO:0009635 | 0.0095 | 128.5794 | 0.0095 | 1 | 7 | response to herbicide |
| GO:0032815 | 0.0095 | 128.5794 | 0.0095 | 1 | 7 | negative regulation of natural killer cell activation |
| GO:0051597 | 0.0095 | 128.5794 | 0.0095 | 1 | 7 | response to methylmercury |
| GO:0050729 | 0.0096 | 14.9065 | 0.1491 | 2 | 110 | positive regulation of inflammatory response |
| GOMFID | Pvalue | OddsRatio | ExpCount | Count | Size | Term |
| GO:0050911 | 0 | 16.2419 | 0.8458 | 10 | 371 | detection of chemical stimulus involved in sensory perception of smell |
| GO:0009593 | 0 | 13.2593 | 1.0259 | 10 | 450 | detection of chemical stimulus |
| GO:0050906 | 0 | 12.8974 | 1.0533 | 10 | 462 | detection of stimulus involved in sensory perception |
| GO:0007606 | 0 | 12.7236 | 1.067 | 10 | 468 | sensory perception of chemical stimulus |
| GO:0007186 | 0 | 5.7879 | 2.8544 | 12 | 1252 | G-protein coupled receptor signaling pathway |
| GO:0070475 | 2e-04 | 132.1224 | 0.0205 | 2 | 9 | rRNA base methylation |
| GO:0050877 | 3e-04 | 4.6188 | 2.7632 | 10 | 1212 | nervous system process |
| GO:0030593 | 0.001 | 16.7201 | 0.2006 | 3 | 88 | neutrophil chemotaxis |
| GO:0046105 | 0.0023 | Inf | 0.0023 | 1 | 1 | thymidine biosynthetic process |
| GO:0046120 | 0.0023 | Inf | 0.0023 | 1 | 1 | deoxyribonucleoside biosynthetic process |
| GO:0097530 | 0.0027 | 11.9177 | 0.2781 | 3 | 122 | granulocyte migration |
| GO:0000154 | 0.003 | 27.1563 | 0.0821 | 2 | 36 | rRNA modification |
| GO:1903959 | 0.0032 | 26.3788 | 0.0844 | 2 | 37 | regulation of anion transmembrane transport |
| GO:0050832 | 0.0036 | 24.9498 | 0.0889 | 2 | 39 | defense response to fungus |
| GO:0035821 | 0.0039 | 10.3403 | 0.3192 | 3 | 140 | modification of morphology or physiology of other organism |
| GO:0035606 | 0.0046 | 449.75 | 0.0046 | 1 | 2 | peptidyl-cysteine S-trans-nitrosylation |
| GO:0070488 | 0.0046 | 449.75 | 0.0046 | 1 | 2 | neutrophil aggregation |
| GO:0051452 | 0.0058 | 19.219 | 0.114 | 2 | 50 | intracellular pH reduction |
| GO:0048247 | 0.0077 | 16.4653 | 0.1322 | 2 | 58 | lymphocyte chemotaxis |
| GO:0001510 | 0.0088 | 15.3638 | 0.1414 | 2 | 62 | RNA methylation |
| GO:0002548 | 0.0088 | 15.3638 | 0.1414 | 2 | 62 | monocyte chemotaxis |
| GO:0046125 | 0.0091 | 149.8981 | 0.0091 | 1 | 4 | pyrimidine deoxyribonucleoside metabolic process |
| GOMFID | Pvalue | OddsRatio | ExpCount | Count | Size | Term |
| GO:0004082 | 2e-04 | 173.043 | 0.0235 | 2 | 4 | bisphosphoglycerate mutase activity |
| GO:0046538 | 2e-04 | 173.043 | 0.0235 | 2 | 4 | 2,3-bisphosphoglycerate-dependent phosphoglycerate mutase activity |
| GO:1903231 | 5e-04 | 8.38 | 0.6513 | 5 | 111 | mRNA binding involved in posttranscriptional gene silencing |
| GO:0004252 | 6e-04 | 6.2779 | 1.0386 | 6 | 177 | serine-type endopeptidase activity |
| GO:0017171 | 0.0014 | 5.2777 | 1.2264 | 6 | 209 | serine hydrolase activity |
| GO:0050786 | 0.0018 | 38.4373 | 0.0645 | 2 | 11 | RAGE receptor binding |
| GO:0008201 | 0.0024 | 5.7887 | 0.9271 | 5 | 158 | heparin binding |
| GO:0004595 | 0.0059 | Inf | 0.0059 | 1 | 1 | pantetheine-phosphate adenylyltransferase activity |
| GO:0008493 | 0.0059 | Inf | 0.0059 | 1 | 1 | tetracycline transporter activity |
| GO:0031249 | 0.0059 | Inf | 0.0059 | 1 | 1 | denatured protein binding |
| GO:0031751 | 0.0059 | Inf | 0.0059 | 1 | 1 | D4 dopamine receptor binding |
| GO:0070191 | 0.0059 | Inf | 0.0059 | 1 | 1 | methionine-R-sulfoxide reductase activity |
| GO:0001848 | 0.0067 | 18.1958 | 0.1232 | 2 | 21 | complement binding |
| GO:0070011 | 0.0071 | 2.8349 | 3.4151 | 9 | 582 | peptidase activity, acting on L-amino acid peptides |
| GO:0004190 | 0.008 | 16.4608 | 0.135 | 2 | 23 | aspartic-type endopeptidase activity |
| GO:0001106 | 0.0094 | 15.0276 | 0.1467 | 2 | 25 | RNA polymerase II transcription corepressor activity |
| GO:0016866 | 0.0094 | 15.0276 | 0.1467 | 2 | 25 | intramolecular transferase activity |
| GOMFID | Pvalue | OddsRatio | ExpCount | Count | Size | Term |
| GO:0004082 | 2e-04 | 171.1915 | 0.0237 | 2 | 4 | bisphosphoglycerate mutase activity |
| GO:0046538 | 2e-04 | 171.1915 | 0.0237 | 2 | 4 | 2,3-bisphosphoglycerate-dependent phosphoglycerate mutase activity |
| GO:1903231 | 5e-04 | 8.2874 | 0.6582 | 5 | 111 | mRNA binding involved in posttranscriptional gene silencing |
| GO:0050786 | 0.0018 | 38.026 | 0.0652 | 2 | 11 | RAGE receptor binding |
| GO:0016787 | 0.0057 | 1.9331 | 14.1776 | 24 | 2391 | hydrolase activity |
| GO:0004595 | 0.0059 | Inf | 0.0059 | 1 | 1 | pantetheine-phosphate adenylyltransferase activity |
| GO:0008493 | 0.0059 | Inf | 0.0059 | 1 | 1 | tetracycline transporter activity |
| GO:0031249 | 0.0059 | Inf | 0.0059 | 1 | 1 | denatured protein binding |
| GO:0070191 | 0.0059 | Inf | 0.0059 | 1 | 1 | methionine-R-sulfoxide reductase activity |
| GO:0001848 | 0.0068 | 18.0011 | 0.1245 | 2 | 21 | complement binding |
| GO:0005539 | 0.0081 | 4.2798 | 1.2393 | 5 | 209 | glycosaminoglycan binding |
| GO:0004190 | 0.0081 | 16.2847 | 0.1364 | 2 | 23 | aspartic-type endopeptidase activity |
| GO:0001106 | 0.0096 | 14.8668 | 0.1482 | 2 | 25 | RNA polymerase II transcription corepressor activity |
| GO:0016866 | 0.0096 | 14.8668 | 0.1482 | 2 | 25 | intramolecular transferase activity |
| GOMFID | Pvalue | OddsRatio | ExpCount | Count | Size | Term |
| GO:0005515 | 5e-04 | 1.6566 | 156.3715 | 180 | 10773 | protein binding |
| GO:0003682 | 0.0039 | 2.307 | 6.8657 | 15 | 473 | chromatin binding |
| GO:0003708 | 0.0042 | 27.382 | 0.1016 | 2 | 7 | retinoic acid receptor activity |
| GO:0043565 | 0.0054 | 1.8371 | 14.4571 | 25 | 996 | sequence-specific DNA binding |
| GO:0000975 | 0.0081 | 1.8688 | 11.8589 | 21 | 817 | regulatory region DNA binding |
| GO:0016018 | 0.0087 | 17.1105 | 0.1452 | 2 | 10 | cyclosporin A binding |
| GO:0000976 | 0.0091 | 1.9469 | 9.7251 | 18 | 670 | transcription regulatory region sequence-specific DNA binding |
| GO:0099106 | 0.01 | 4.0588 | 1.3064 | 5 | 90 | ion channel regulator activity |
| GOMFID | Pvalue | OddsRatio | ExpCount | Count | Size | Term |
| GO:0005515 | 3e-04 | 1.7979 | 126.3494 | 149 | 10269 | protein binding |
| GO:1990837 | 8e-04 | 2.3813 | 9.0395 | 20 | 707 | sequence-specific double-stranded DNA binding |
| GO:0140110 | 0.0017 | 1.8516 | 19.4086 | 33 | 1518 | transcription regulator activity |
| GO:0003677 | 0.0018 | 1.698 | 30.0208 | 46 | 2348 | DNA binding |
| GO:0044212 | 0.0018 | 2.1598 | 10.4203 | 21 | 815 | transcription regulatory region DNA binding |
| GO:0001067 | 0.0019 | 2.1513 | 10.4587 | 21 | 818 | regulatory region nucleic acid binding |
| GO:0000981 | 0.0029 | 2.1549 | 9.3975 | 19 | 735 | RNA polymerase II transcription factor activity, sequence-specific DNA binding |
| GO:0098531 | 0.003 | 7.3044 | 0.6009 | 4 | 47 | transcription factor activity, direct ligand regulated sequence-specific DNA binding |
| GO:0003708 | 0.0033 | 31.1766 | 0.0895 | 2 | 7 | retinoic acid receptor activity |
| GO:0008134 | 0.0055 | 2.2936 | 6.444 | 14 | 504 | transcription factor binding |
| GO:0099106 | 0.0059 | 4.6296 | 1.1507 | 5 | 90 | ion channel regulator activity |
| GO:0003707 | 0.006 | 5.9225 | 0.7288 | 4 | 57 | steroid hormone receptor activity |
| GO:0005125 | 0.0067 | 3.0489 | 2.7617 | 8 | 216 | cytokine activity |
| GO:0005126 | 0.0068 | 2.8148 | 3.3626 | 9 | 263 | cytokine receptor binding |
| GO:0003682 | 0.008 | 2.2613 | 6.0476 | 13 | 473 | chromatin binding |
| GO:0017080 | 0.0085 | 7.8201 | 0.4219 | 3 | 33 | sodium channel regulator activity |
| GO:0000977 | 0.0091 | 2.0897 | 7.5563 | 15 | 591 | RNA polymerase II regulatory region sequence-specific DNA binding |
| GO:0004861 | 0.0099 | 15.5834 | 0.1534 | 2 | 12 | cyclin-dependent protein serine/threonine kinase inhibitor activity |
| GO:0043422 | 0.0099 | 15.5834 | 0.1534 | 2 | 12 | protein kinase B binding |
| GOMFID | Pvalue | OddsRatio | ExpCount | Count | Size | Term |
| GO:0004930 | 1e-04 | 10.7934 | 0.8232 | 6 | 784 | G-protein coupled receptor activity |
| GO:0004984 | 5e-04 | 13.2517 | 0.3896 | 4 | 371 | olfactory receptor activity |
| GO:0099600 | 0.0011 | 6.7092 | 1.2831 | 6 | 1222 | transmembrane receptor activity |
| GO:0038023 | 0.0014 | 6.3735 | 1.3451 | 6 | 1281 | signaling receptor activity |
| GO:0071791 | 0.0021 | 1010.75 | 0.0021 | 1 | 2 | chemokine (C-C motif) ligand 5 binding |
| GO:0005549 | 0.0034 | 26.4889 | 0.0872 | 2 | 83 | odorant binding |
| GO:0060089 | 0.0036 | 5.2203 | 1.6128 | 6 | 1536 | molecular transducer activity |
| GO:0031728 | 0.0042 | 336.875 | 0.0042 | 1 | 4 | CCR3 chemokine receptor binding |
| GO:0005198 | 0.0046 | 7.1307 | 0.7067 | 4 | 673 | structural molecule activity |
| GO:0001849 | 0.0084 | 144.3393 | 0.0084 | 1 | 8 | complement component C1q binding |
| GO:0046790 | 0.0084 | 144.3393 | 0.0084 | 1 | 8 | virion binding |
| GOMFID | Pvalue | OddsRatio | ExpCount | Count | Size | Term |
| GO:0032394 | 0 | Inf | 0.0037 | 2 | 2 | MHC class Ib receptor activity |
| GO:0099600 | 0 | 6.1667 | 2.2644 | 10 | 1222 | transmembrane receptor activity |
| GO:0038023 | 1e-04 | 5.8572 | 2.3737 | 10 | 1281 | signaling receptor activity |
| GO:0060089 | 3e-04 | 4.7949 | 2.8462 | 10 | 1536 | molecular transducer activity |
| GO:0004930 | 4e-04 | 6.3242 | 1.3992 | 7 | 781 | G-protein coupled receptor activity |
| GO:0042288 | 5e-04 | 72.0714 | 0.0334 | 2 | 18 | MHC class I protein binding |
| GO:0004984 | 5e-04 | 8.6306 | 0.6875 | 5 | 371 | olfactory receptor activity |
| GO:1903231 | 0.0011 | 16.5144 | 0.2057 | 3 | 111 | mRNA binding involved in posttranscriptional gene silencing |
| GO:0005133 | 0.0019 | Inf | 0.0019 | 1 | 1 | interferon-gamma receptor binding |
| GO:0008009 | 0.0036 | 25.0217 | 0.0889 | 2 | 48 | chemokine activity |
| GO:0071791 | 0.0037 | 557.2069 | 0.0037 | 1 | 2 | chemokine (C-C motif) ligand 5 binding |
| GO:0004869 | 0.0048 | 21.3042 | 0.1038 | 2 | 56 | cysteine-type endopeptidase inhibitor activity |
| GO:0016503 | 0.0055 | 278.5862 | 0.0056 | 1 | 3 | pheromone receptor activity |
| GO:0004522 | 0.0074 | 185.7126 | 0.0074 | 1 | 4 | ribonuclease A activity |
| GO:0004698 | 0.0074 | 185.7126 | 0.0074 | 1 | 4 | calcium-dependent protein kinase C activity |
| GO:0048018 | 0.0088 | 5.4837 | 0.8246 | 4 | 445 | receptor ligand activity |
| GO:0031726 | 0.0092 | 139.2759 | 0.0093 | 1 | 5 | CCR1 chemokine receptor binding |
| GOMFID | Pvalue | OddsRatio | ExpCount | Count | Size | Term |
| GO:0003723 | 0 | 4.3203 | 5.6087 | 18 | 1651 | RNA binding |
| GO:1903231 | 5e-04 | 11.7486 | 0.3771 | 4 | 111 | mRNA binding involved in posttranscriptional gene silencing |
| GO:0008009 | 6e-04 | 20.6282 | 0.1631 | 3 | 48 | chemokine activity |
| GO:0000254 | 0.0034 | Inf | 0.0034 | 1 | 1 | C-4 methylsterol oxidase activity |
| GO:0005520 | 0.004 | 23.3803 | 0.0951 | 2 | 28 | insulin-like growth factor binding |
| GO:0030354 | 0.0068 | 298.7778 | 0.0068 | 1 | 2 | melanin-concentrating hormone activity |
| GO:1990188 | 0.0068 | 298.7778 | 0.0068 | 1 | 2 | euchromatin binding |
| GO:0048020 | 0.0077 | 16.4182 | 0.1325 | 2 | 39 | CCR chemokine receptor binding |
| GOMFID | Pvalue | OddsRatio | ExpCount | Count | Size | Term |
| GO:0004984 | 0 | 7.7253 | 1.2145 | 8 | 371 | olfactory receptor activity |
| GO:0005549 | 0.0025 | 12.0427 | 0.2717 | 3 | 83 | odorant binding |
| GO:0004343 | 0.0033 | Inf | 0.0033 | 1 | 1 | glucosamine 6-phosphate N-acetyltransferase activity |
| GO:0005142 | 0.0033 | Inf | 0.0033 | 1 | 1 | interleukin-11 receptor binding |
| GO:0004930 | 0.0037 | 3.5191 | 2.5665 | 8 | 784 | G-protein coupled receptor activity |
| GO:0042056 | 0.004 | 23.3987 | 0.0949 | 2 | 29 | chemoattractant activity |
| GO:0004782 | 0.0065 | 310.3077 | 0.0065 | 1 | 2 | sulfinoalanine decarboxylase activity |
| GO:0000993 | 0.0069 | 17.5392 | 0.1244 | 2 | 38 | RNA polymerase II core binding |
| GO:0004663 | 0.0098 | 155.1442 | 0.0098 | 1 | 3 | Rab geranylgeranyltransferase activity |
| GO:0030395 | 0.0098 | 155.1442 | 0.0098 | 1 | 3 | lactose binding |
| GOMFID | Pvalue | OddsRatio | ExpCount | Count | Size | Term |
| GO:0004984 | 0 | 11.2896 | 0.6645 | 6 | 371 | olfactory receptor activity |
| GO:1903231 | 0.001 | 17.1506 | 0.1988 | 3 | 111 | mRNA binding involved in posttranscriptional gene silencing |
| GO:0042056 | 0.0012 | 44.2634 | 0.0519 | 2 | 29 | chemoattractant activity |
| GO:0004930 | 0.0023 | 5.158 | 1.4043 | 6 | 784 | G-protein coupled receptor activity |
| GO:0031731 | 0.0054 | 288.5536 | 0.0054 | 1 | 3 | CCR6 chemokine receptor binding |
| GO:0005549 | 0.0096 | 14.7051 | 0.1487 | 2 | 83 | odorant binding |
| GOMFID | Pvalue | OddsRatio | ExpCount | Count | Size | Term |
| GO:0004984 | 0 | 9.4003 | 1.0312 | 8 | 371 | olfactory receptor activity |
| GO:0035662 | 0 | 750.8837 | 0.0083 | 2 | 3 | Toll-like receptor 4 binding |
| GO:0050544 | 1e-04 | 250.2636 | 0.0139 | 2 | 5 | arachidonic acid binding |
| GO:0099600 | 1e-04 | 4.4884 | 3.3965 | 12 | 1222 | transmembrane receptor activity |
| GO:0004930 | 1e-04 | 5.5894 | 1.9631 | 9 | 737 | G-protein coupled receptor activity |
| GO:0038023 | 1e-04 | 4.2628 | 3.5605 | 12 | 1281 | signaling receptor activity |
| GO:0060089 | 2e-04 | 3.9003 | 4.2693 | 13 | 1536 | molecular transducer activity |
| GO:0008009 | 3e-04 | 25.5556 | 0.1334 | 3 | 48 | chemokine activity |
| GO:0005179 | 3e-04 | 13.5992 | 0.3308 | 4 | 119 | hormone activity |
| GO:0036041 | 4e-04 | 83.3902 | 0.0306 | 2 | 11 | long-chain fatty acid binding |
| GO:0050786 | 4e-04 | 83.3902 | 0.0306 | 2 | 11 | RAGE receptor binding |
| GO:1901567 | 0.0018 | 35.7121 | 0.0639 | 2 | 23 | fatty acid derivative binding |
| GO:0046789 | 0.0028 | Inf | 0.0028 | 1 | 1 | host cell surface receptor binding |
| GO:0042277 | 0.005 | 6.3315 | 0.6921 | 4 | 249 | peptide binding |
| GO:0048020 | 0.0052 | 20.2489 | 0.1084 | 2 | 39 | CCR chemokine receptor binding |
| GO:0031696 | 0.0056 | 366.9091 | 0.0056 | 1 | 2 | alpha-2C adrenergic receptor binding |
| GO:0001664 | 0.0056 | 6.1037 | 0.7171 | 4 | 258 | G-protein coupled receptor binding |
| GO:0005126 | 0.006 | 5.984 | 0.731 | 4 | 263 | cytokine receptor binding |
| GO:0015631 | 0.0075 | 5.6094 | 0.7783 | 4 | 280 | tubulin binding |
| GO:0008227 | 0.0075 | 16.6408 | 0.1306 | 2 | 47 | G-protein coupled amine receptor activity |
| GO:0004938 | 0.0083 | 183.4432 | 0.0083 | 1 | 3 | alpha2-adrenergic receptor activity |
| GO:0004980 | 0.0083 | 183.4432 | 0.0083 | 1 | 3 | melanocyte-stimulating hormone receptor activity |
| GO:0031692 | 0.0083 | 183.4432 | 0.0083 | 1 | 3 | alpha-1B adrenergic receptor binding |
| GO:0032795 | 0.0083 | 183.4432 | 0.0083 | 1 | 3 | heterotrimeric G-protein binding |
| GO:0048018 | 0.0093 | 5.2738 | 0.8317 | 4 | 326 | receptor ligand activity |
| GOMFID | Pvalue | OddsRatio | ExpCount | Count | Size | Term |
| GO:0005515 | 1e-04 | 2.0231 | 103.1387 | 124 | 10773 | protein binding |
| GO:0019956 | 0.0012 | 16.6371 | 0.2106 | 3 | 22 | chemokine binding |
| GO:0001637 | 0.0017 | 14.3657 | 0.2393 | 3 | 25 | G-protein coupled chemoattractant receptor activity |
| GO:0016004 | 0.0047 | 23.2767 | 0.1053 | 2 | 11 | phospholipase activator activity |
| GO:0005125 | 0.0048 | 3.5815 | 2.0679 | 7 | 216 | cytokine activity |
| GO:0016493 | 0.0056 | 20.9477 | 0.1149 | 2 | 12 | C-C chemokine receptor activity |
| GO:0048020 | 0.0061 | 8.7714 | 0.3734 | 3 | 39 | CCR chemokine receptor binding |
| GO:0004659 | 0.0077 | 17.4542 | 0.134 | 2 | 14 | prenyltransferase activity |
| GO:0004896 | 0.0083 | 5.3503 | 0.7946 | 4 | 83 | cytokine receptor activity |
| GO:0000254 | 0.0096 | Inf | 0.0096 | 1 | 1 | C-4 methylsterol oxidase activity |
| GO:0001133 | 0.0096 | Inf | 0.0096 | 1 | 1 | RNA polymerase II transcription factor activity, sequence-specific transcription regulatory region DNA binding |
| GO:0003827 | 0.0096 | Inf | 0.0096 | 1 | 1 | alpha-1,3-mannosylglycoprotein 2-beta-N-acetylglucosaminyltransferase activity |
| GO:0004733 | 0.0096 | Inf | 0.0096 | 1 | 1 | pyridoxamine-phosphate oxidase activity |
| GO:0004941 | 0.0096 | Inf | 0.0096 | 1 | 1 | beta2-adrenergic receptor activity |
| GO:0005141 | 0.0096 | Inf | 0.0096 | 1 | 1 | interleukin-10 receptor binding |
| GO:0008811 | 0.0096 | Inf | 0.0096 | 1 | 1 | chloramphenicol O-acetyltransferase activity |
| GO:0016495 | 0.0096 | Inf | 0.0096 | 1 | 1 | C-X3-C chemokine receptor activity |
| GO:0019969 | 0.0096 | Inf | 0.0096 | 1 | 1 | interleukin-10 binding |
| GO:0035717 | 0.0096 | Inf | 0.0096 | 1 | 1 | chemokine (C-C motif) ligand 7 binding |
| GO:0097260 | 0.0096 | Inf | 0.0096 | 1 | 1 | eoxin A4 synthase activity |
| GOMFID | Pvalue | OddsRatio | ExpCount | Count | Size | Term |
| GO:0031727 | 0 | 174.4239 | 0.0435 | 3 | 5 | CCR2 chemokine receptor binding |
| GO:0042379 | 2e-04 | 10.6912 | 0.5225 | 5 | 60 | chemokine receptor binding |
| GO:0004896 | 8e-04 | 7.5278 | 0.7229 | 5 | 83 | cytokine receptor activity |
| GO:0019956 | 9e-04 | 18.341 | 0.1916 | 3 | 22 | chemokine binding |
| GO:0001637 | 0.0013 | 15.837 | 0.2177 | 3 | 25 | G-protein coupled chemoattractant receptor activity |
| GO:0005515 | 0.0019 | 1.7923 | 93.8229 | 110 | 10773 | protein binding |
| GO:0016004 | 0.0039 | 25.6435 | 0.0958 | 2 | 11 | phospholipase activator activity |
| GO:0016493 | 0.0047 | 23.0777 | 0.1045 | 2 | 12 | C-C chemokine receptor activity |
| GO:0008308 | 0.0083 | 16.48 | 0.1393 | 2 | 16 | voltage-gated anion channel activity |
| GO:0023026 | 0.0083 | 16.48 | 0.1393 | 2 | 16 | MHC class II protein complex binding |
| GO:0001133 | 0.0087 | Inf | 0.0087 | 1 | 1 | RNA polymerase II transcription factor activity, sequence-specific transcription regulatory region DNA binding |
| GO:0003827 | 0.0087 | Inf | 0.0087 | 1 | 1 | alpha-1,3-mannosylglycoprotein 2-beta-N-acetylglucosaminyltransferase activity |
| GO:0004941 | 0.0087 | Inf | 0.0087 | 1 | 1 | beta2-adrenergic receptor activity |
| GO:0005141 | 0.0087 | Inf | 0.0087 | 1 | 1 | interleukin-10 receptor binding |
| GO:0008811 | 0.0087 | Inf | 0.0087 | 1 | 1 | chloramphenicol O-acetyltransferase activity |
| GO:0016495 | 0.0087 | Inf | 0.0087 | 1 | 1 | C-X3-C chemokine receptor activity |
| GO:0019969 | 0.0087 | Inf | 0.0087 | 1 | 1 | interleukin-10 binding |
| GO:0035717 | 0.0087 | Inf | 0.0087 | 1 | 1 | chemokine (C-C motif) ligand 7 binding |
| GO:0097260 | 0.0087 | Inf | 0.0087 | 1 | 1 | eoxin A4 synthase activity |
| GOMFID | Pvalue | OddsRatio | ExpCount | Count | Size | Term |
| GO:0004984 | 1e-04 | 5.189 | 2.154 | 10 | 371 | olfactory receptor activity |
| GO:0004930 | 6e-04 | 3.1901 | 4.5519 | 13 | 784 | G-protein coupled receptor activity |
| GO:0016004 | 0.0018 | 38.8575 | 0.0639 | 2 | 11 | phospholipase activator activity |
| GO:0005200 | 0.003 | 7.1816 | 0.598 | 4 | 103 | structural constituent of cytoskeleton |
| GO:0055102 | 0.0038 | 24.972 | 0.0929 | 2 | 16 | lipase inhibitor activity |
| GO:0004506 | 0.0058 | Inf | 0.0058 | 1 | 1 | squalene monooxygenase activity |
| GO:0005141 | 0.0058 | Inf | 0.0058 | 1 | 1 | interleukin-10 receptor binding |
| GO:0018455 | 0.0058 | Inf | 0.0058 | 1 | 1 | alcohol dehydrogenase [NAD(P)+] activity |
| GO:0035717 | 0.0058 | Inf | 0.0058 | 1 | 1 | chemokine (C-C motif) ligand 7 binding |
| GO:0047800 | 0.0058 | Inf | 0.0058 | 1 | 1 | cysteamine dioxygenase activity |
| GO:0004033 | 0.0092 | 15.1919 | 0.1452 | 2 | 25 | aldo-keto reductase (NADP) activity |
| GOMFID | Pvalue | OddsRatio | ExpCount | Count | Size | Term |
| GO:0004984 | 1e-04 | 5.15 | 1.9478 | 9 | 371 | olfactory receptor activity |
| GO:0005509 | 7e-04 | 3.5401 | 3.4651 | 11 | 660 | calcium ion binding |
| GO:0016004 | 0.0015 | 43.095 | 0.0578 | 2 | 11 | phospholipase activator activity |
| GO:0004930 | 0.0026 | 2.9484 | 4.1161 | 11 | 784 | G-protein coupled receptor activity |
| GO:0055102 | 0.0031 | 27.6954 | 0.084 | 2 | 16 | lipase inhibitor activity |
| GO:0005141 | 0.0053 | Inf | 0.0053 | 1 | 1 | interleukin-10 receptor binding |
| GO:0018455 | 0.0053 | Inf | 0.0053 | 1 | 1 | alcohol dehydrogenase [NAD(P)+] activity |
| GO:0019772 | 0.0053 | Inf | 0.0053 | 1 | 1 | low-affinity IgG receptor activity |
| GO:0035717 | 0.0053 | Inf | 0.0053 | 1 | 1 | chemokine (C-C motif) ligand 7 binding |
| GO:0019956 | 0.0059 | 19.3795 | 0.1155 | 2 | 22 | chemokine binding |
| GO:0019865 | 0.0064 | 18.4555 | 0.1208 | 2 | 23 | immunoglobulin binding |
| GO:0005549 | 0.0095 | 7.3285 | 0.4358 | 3 | 83 | odorant binding |
| GOMFID | Pvalue | OddsRatio | ExpCount | Count | Size | Term |
| GO:0004984 | 0 | 9.2432 | 1.5812 | 12 | 371 | olfactory receptor activity |
| GO:0003735 | 0 | 14.7578 | 0.6393 | 8 | 150 | structural constituent of ribosome |
| GO:0048020 | 0 | 28.2831 | 0.1662 | 4 | 39 | CCR chemokine receptor binding |
| GO:0004930 | 0 | 4.6218 | 3.3413 | 13 | 784 | G-protein coupled receptor activity |
| GO:0099600 | 5e-04 | 3.1424 | 5.208 | 14 | 1222 | transmembrane receptor activity |
| GO:0038023 | 9e-04 | 2.9842 | 5.4595 | 14 | 1281 | signaling receptor activity |
| GO:0008009 | 0.0011 | 16.2384 | 0.2046 | 3 | 48 | chemokine activity |
| GO:0060089 | 0.0018 | 2.6664 | 6.5463 | 15 | 1536 | molecular transducer activity |
| GO:0003746 | 0.0021 | 34.3433 | 0.0682 | 2 | 16 | translation elongation factor activity |
| GO:0048018 | 0.0028 | 4.0426 | 1.8965 | 7 | 445 | receptor ligand activity |
| GO:0003723 | 0.0035 | 2.4594 | 7.0364 | 15 | 1651 | RNA binding |
| GO:0005163 | 0.0043 | Inf | 0.0043 | 1 | 1 | nerve growth factor receptor binding |
| GO:0008493 | 0.0043 | Inf | 0.0043 | 1 | 1 | tetracycline transporter activity |
| GO:0005126 | 0.0048 | 4.9182 | 1.0964 | 5 | 261 | cytokine receptor binding |
| GO:0001664 | 0.0048 | 4.9 | 1.0996 | 5 | 258 | G-protein coupled receptor binding |
| GO:0005549 | 0.0053 | 9.1142 | 0.3537 | 3 | 83 | odorant binding |
| GO:0005146 | 0.0085 | 237.0588 | 0.0085 | 1 | 2 | leukemia inhibitory factor receptor binding |
| GOMFID | Pvalue | OddsRatio | ExpCount | Count | Size | Term |
| GO:0004984 | 0 | 11.6868 | 1.4208 | 13 | 371 | olfactory receptor activity |
| GO:0004930 | 0 | 5.8174 | 3.0023 | 14 | 784 | G-protein coupled receptor activity |
| GO:0003735 | 0 | 11.8929 | 0.5744 | 6 | 150 | structural constituent of ribosome |
| GO:0099600 | 0 | 3.9453 | 4.6797 | 15 | 1222 | transmembrane receptor activity |
| GO:0038023 | 1e-04 | 3.7466 | 4.9056 | 15 | 1281 | signaling receptor activity |
| GO:0004866 | 4e-04 | 8.8663 | 0.6242 | 5 | 163 | endopeptidase inhibitor activity |
| GO:0060089 | 5e-04 | 3.065 | 5.8821 | 15 | 1536 | molecular transducer activity |
| GO:0061134 | 0.0011 | 6.9508 | 0.7889 | 5 | 206 | peptidase regulator activity |
| GO:0004857 | 0.0032 | 4.5256 | 1.4514 | 6 | 379 | enzyme inhibitor activity |
| GO:0005163 | 0.0038 | Inf | 0.0038 | 1 | 1 | nerve growth factor receptor binding |
| GO:0008493 | 0.0038 | Inf | 0.0038 | 1 | 1 | tetracycline transporter activity |
| GO:0048018 | 0.007 | 3.8291 | 1.7041 | 6 | 445 | receptor ligand activity |
| GO:0001567 | 0.0076 | 264.377 | 0.0077 | 1 | 2 | cholesterol 25-hydroxylase activity |
| GO:0005146 | 0.0076 | 264.377 | 0.0077 | 1 | 2 | leukemia inhibitory factor receptor binding |
| GO:0019767 | 0.0076 | 264.377 | 0.0077 | 1 | 2 | IgE receptor activity |
| GO:0045550 | 0.0076 | 264.377 | 0.0077 | 1 | 2 | geranylgeranyl reductase activity |
| GO:0071791 | 0.0076 | 264.377 | 0.0077 | 1 | 2 | chemokine (C-C motif) ligand 5 binding |
| GOMFID | Pvalue | OddsRatio | ExpCount | Count | Size | Term |
| GO:0003735 | 0 | 36.8871 | 0.3799 | 10 | 150 | structural constituent of ribosome |
| GO:0016493 | 0 | 141.5789 | 0.0304 | 3 | 12 | C-C chemokine receptor activity |
| GO:0001637 | 0 | 57.872 | 0.0633 | 3 | 25 | G-protein coupled chemoattractant receptor activity |
| GO:0004896 | 1e-04 | 21.9911 | 0.2102 | 4 | 83 | cytokine receptor activity |
| GO:0004869 | 4e-04 | 23.9762 | 0.1418 | 3 | 56 | cysteine-type endopeptidase inhibitor activity |
| GO:0019843 | 4e-04 | 23.9762 | 0.1418 | 3 | 56 | rRNA binding |
| GO:0004930 | 7e-04 | 4.8026 | 1.9854 | 8 | 784 | G-protein coupled receptor activity |
| GO:0019969 | 0.0025 | Inf | 0.0025 | 1 | 1 | interleukin-10 binding |
| GO:1903231 | 0.0028 | 11.7259 | 0.2811 | 3 | 111 | mRNA binding involved in posttranscriptional gene silencing |
| GO:0099600 | 0.003 | 3.4631 | 3.0946 | 9 | 1222 | transmembrane receptor activity |
| GO:0001653 | 0.0037 | 10.5454 | 0.3115 | 3 | 123 | peptide receptor activity |
| GO:0070888 | 0.0039 | 23.6103 | 0.0937 | 2 | 37 | E-box binding |
| GO:0060089 | 0.0042 | 3.0912 | 3.8898 | 10 | 1536 | molecular transducer activity |
| GO:0002020 | 0.0042 | 10.0395 | 0.3267 | 3 | 129 | protease binding |
| GO:0005146 | 0.0051 | 403.7 | 0.0051 | 1 | 2 | leukemia inhibitory factor receptor binding |
| GO:0004871 | 0.0052 | 2.9808 | 4.019 | 10 | 1587 | signal transducer activity |
| GO:0003729 | 0.0089 | 7.6387 | 0.4278 | 3 | 181 | mRNA binding |
| GO:0061135 | 0.0089 | 7.6013 | 0.428 | 3 | 169 | endopeptidase regulator activity |
| GO:0030414 | 0.0092 | 7.5099 | 0.433 | 3 | 171 | peptidase inhibitor activity |
| GO:0003676 | 0.0096 | 2.262 | 9.7954 | 17 | 3868 | nucleic acid binding |
| GOMFID | Pvalue | OddsRatio | ExpCount | Count | Size | Term |
| GO:0004984 | 0 | 14.4301 | 0.55 | 6 | 371 | olfactory receptor activity |
| GO:0003735 | 1e-04 | 21.9452 | 0.2224 | 4 | 150 | structural constituent of ribosome |
| GO:0004930 | 8e-04 | 6.593 | 1.1622 | 6 | 784 | G-protein coupled receptor activity |
| GO:0003729 | 8e-04 | 11.0264 | 0.4329 | 4 | 292 | mRNA binding |
| GO:0019843 | 0.0031 | 27.1246 | 0.083 | 2 | 56 | rRNA binding |
| GO:0004522 | 0.0059 | 234.2464 | 0.0059 | 1 | 4 | ribonuclease A activity |
| GO:0099600 | 0.0075 | 4.0981 | 1.8115 | 6 | 1222 | transmembrane receptor activity |
| GO:0038023 | 0.0094 | 3.8931 | 1.8989 | 6 | 1281 | signaling receptor activity |
| GOMFID | Pvalue | OddsRatio | ExpCount | Count | Size | Term |
| GO:0050786 | 0 | 378.8203 | 0.0129 | 3 | 11 | RAGE receptor binding |
| GO:0035662 | 0 | 1902.3529 | 0.0035 | 2 | 3 | Toll-like receptor 4 binding |
| GO:0050544 | 0 | 634.0392 | 0.0059 | 2 | 5 | arachidonic acid binding |
| GO:0036041 | 1e-04 | 211.268 | 0.0129 | 2 | 11 | long-chain fatty acid binding |
| GO:0004930 | 2e-04 | 9.1317 | 0.9201 | 6 | 784 | G-protein coupled receptor activity |
| GO:1901567 | 3e-04 | 90.4762 | 0.027 | 2 | 23 | fatty acid derivative binding |
| GO:0038023 | 4e-04 | 6.821 | 1.5033 | 7 | 1281 | signaling receptor activity |
| GO:0004984 | 8e-04 | 11.4834 | 0.4354 | 4 | 371 | olfactory receptor activity |
| GO:0046914 | 8e-04 | 6.9208 | 1.1935 | 6 | 1017 | transition metal ion binding |
| GO:0043177 | 0.0011 | 17.2381 | 0.2077 | 3 | 177 | organic acid binding |
| GO:0060089 | 0.0012 | 5.5861 | 1.8026 | 7 | 1536 | molecular transducer activity |
| GO:0033293 | 0.0021 | 33.855 | 0.0681 | 2 | 58 | monocarboxylic acid binding |
| GO:0099600 | 0.0021 | 5.6762 | 1.4341 | 6 | 1222 | transmembrane receptor activity |
| GO:0004053 | 0.0023 | 898.3333 | 0.0023 | 1 | 2 | arginase activity |
| GO:0005549 | 0.0042 | 23.3696 | 0.0974 | 2 | 83 | odorant binding |
| GO:0008745 | 0.0047 | 299.4074 | 0.0047 | 1 | 4 | N-acetylmuramoyl-L-alanine amidase activity |
| GO:0016019 | 0.0059 | 224.5417 | 0.0059 | 1 | 5 | peptidoglycan receptor activity |
| GO:0004966 | 0.0082 | 149.6759 | 0.0082 | 1 | 7 | galanin receptor activity |
| GOMFID | Pvalue | OddsRatio | ExpCount | Count | Size | Term |
| GO:0004984 | 0 | 19.0244 | 0.7562 | 10 | 371 | olfactory receptor activity |
| GO:0004930 | 0 | 8.6412 | 1.598 | 10 | 784 | G-protein coupled receptor activity |
| GO:0005549 | 0 | 28.0716 | 0.1692 | 4 | 83 | odorant binding |
| GO:0099600 | 1e-04 | 5.3612 | 2.4908 | 10 | 1222 | transmembrane receptor activity |
| GO:0038023 | 2e-04 | 5.0922 | 2.6111 | 10 | 1281 | signaling receptor activity |
| GO:0008308 | 5e-04 | 74.3917 | 0.0326 | 2 | 16 | voltage-gated anion channel activity |
| GO:0060089 | 7e-04 | 4.1686 | 3.1308 | 10 | 1536 | molecular transducer activity |
| GO:0048020 | 0.0028 | 28.1081 | 0.0795 | 2 | 39 | CCR chemokine receptor binding |
| GO:0004146 | 0.0041 | 504.875 | 0.0041 | 1 | 2 | dihydrofolate reductase activity |
| GO:0038100 | 0.0041 | 504.875 | 0.0041 | 1 | 2 | nodal binding |
| GO:0008009 | 0.0043 | 22.5961 | 0.0978 | 2 | 48 | chemokine activity |
| GO:0008173 | 0.006 | 18.888 | 0.1162 | 2 | 57 | RNA methyltransferase activity |
| GO:0035662 | 0.0061 | 252.4219 | 0.0061 | 1 | 3 | Toll-like receptor 4 binding |
| GOMFID | Pvalue | OddsRatio | ExpCount | Count | Size | Term |
| GO:0048020 | 1e-04 | 34.4274 | 0.1012 | 3 | 39 | CCR chemokine receptor binding |
| GO:0008009 | 3e-04 | 27.5265 | 0.1245 | 3 | 48 | chemokine activity |
| GO:0008308 | 8e-04 | 57.6214 | 0.0415 | 2 | 16 | voltage-gated anion channel activity |
| GO:0005130 | 0.0026 | Inf | 0.0026 | 1 | 1 | granulocyte colony-stimulating factor receptor binding |
| GO:0051879 | 0.0027 | 28.7857 | 0.0778 | 2 | 30 | Hsp90 protein binding |
| GO:0005126 | 0.0042 | 6.6583 | 0.6635 | 4 | 262 | cytokine receptor binding |
| GO:0048018 | 0.0056 | 4.8243 | 1.1544 | 5 | 445 | receptor ligand activity |
| GO:0070653 | 0.0078 | 196.9024 | 0.0078 | 1 | 3 | high-density lipoprotein particle receptor binding |
| GOMFID | Pvalue | OddsRatio | ExpCount | Count | Size | Term |
| GO:0043295 | 0.0013 | 45.8718 | 0.0544 | 2 | 11 | glutathione binding |
| GO:0008191 | 0.0021 | 34.3974 | 0.0692 | 2 | 14 | metalloendopeptidase inhibitor activity |
| GO:1903231 | 0.0022 | 7.8716 | 0.5485 | 4 | 111 | mRNA binding involved in posttranscriptional gene silencing |
| GO:0005125 | 0.0043 | 5.0234 | 1.0673 | 5 | 216 | cytokine activity |
| GO:0008893 | 0.0049 | Inf | 0.0049 | 1 | 1 | guanosine-3',5'-bis(diphosphate) 3'-diphosphatase activity |
| GO:0015054 | 0.0049 | Inf | 0.0049 | 1 | 1 | gastrin receptor activity |
| GO:0031741 | 0.0049 | Inf | 0.0049 | 1 | 1 | type B gastrin/cholecystokinin receptor binding |
| GO:0031851 | 0.0049 | Inf | 0.0049 | 1 | 1 | kappa-type opioid receptor binding |
| GO:0050337 | 0.0049 | Inf | 0.0049 | 1 | 1 | thiosulfate-thiol sulfurtransferase activity |
| GO:0004364 | 0.0073 | 17.1859 | 0.1285 | 2 | 26 | glutathione transferase activity |
| GO:0030545 | 0.0087 | 3.2262 | 2.3323 | 7 | 472 | receptor regulator activity |
| GO:0004951 | 0.0099 | 203.9114 | 0.0099 | 1 | 2 | cholecystokinin receptor activity |
| GO:0030549 | 0.0099 | 203.9114 | 0.0099 | 1 | 2 | acetylcholine receptor activator activity |
| NA. |
| n/a |
| NA. |
| n/a |
| NA. |
| n/a |
| NA. |
| n/a |
| NA. |
| n/a |
| NA. |
| n/a |
| NA. |
| n/a |
| NA. |
| n/a |
| NA. |
| n/a |
| NA. |
| n/a |
| NA. |
| n/a |
| NA. |
| n/a |
| NA. |
| n/a |
| NA. |
| n/a |
| NA. |
| n/a |
| NA. |
| n/a |
| NA. |
| n/a |
| NA. |
| n/a |
| NA. |
| n/a |
| NA. |
| n/a |
| NA. |
| n/a |
| NA. |
| n/a |
| NA. |
| n/a |
| NA. |
| n/a |
| NA. |
| n/a |
| NA. |
| n/a |
| NA. |
| n/a |
| NA. |
| n/a |
| NA. |
| n/a |
| NA. |
| n/a |
| NA. |
| n/a |
| NA. |
| n/a |
| NA. |
| n/a |
| NA. |
| n/a |
| NA. |
| n/a |
| NA. |
| n/a |
| NA. |
| n/a |
| NA. |
| n/a |
| NA. |
| n/a |
| NA. |
| n/a |
| NA. |
| n/a |
| NA. |
| n/a |
| NA. |
| n/a |
| NA. |
| n/a |
| NA. |
| n/a |
| NA. |
| n/a |
| NA. |
| n/a |
| NA. |
| n/a |
| NA. |
| n/a |
| NA. |
| n/a |
| NA. |
| n/a |
| NA. |
| n/a |
| NA. |
| n/a |
| NA. |
| n/a |
| NA. |
| n/a |
| NA. |
| n/a |
| GOMFID | Pvalue | OddsRatio | ExpCount | Count | Size | Term |
| GO:2000402 | 3e-04 | 31.4311 | 0.1425 | 3 | 9 | negative regulation of lymphocyte migration |
| GO:0036006 | 4e-04 | 26.9393 | 0.1583 | 3 | 10 | cellular response to macrophage colony-stimulating factor stimulus |
| GO:0007079 | 7e-04 | 125.2706 | 0.0475 | 2 | 3 | mitotic chromosome movement towards spindle pole |
| GO:2000502 | 7e-04 | 125.2706 | 0.0475 | 2 | 3 | negative regulation of natural killer cell chemotaxis |
| GO:0048523 | 8e-04 | 1.5355 | 70.5444 | 94 | 4455 | negative regulation of cellular process |
| GO:0030488 | 0.0011 | 10.0857 | 0.4592 | 4 | 29 | tRNA methylation |
| GO:0002689 | 0.0019 | 14.5003 | 0.2534 | 3 | 16 | negative regulation of leukocyte chemotaxis |
| GO:0051489 | 0.0033 | 7.1995 | 0.6176 | 4 | 39 | regulation of filopodium assembly |
| GO:0008063 | 0.0036 | 31.3118 | 0.095 | 2 | 6 | Toll signaling pathway |
| GO:0070383 | 0.0036 | 31.3118 | 0.095 | 2 | 6 | DNA cytosine deamination |
| GO:0043901 | 0.0042 | 3.322 | 2.5494 | 8 | 161 | negative regulation of multi-organism process |
| GO:1901687 | 0.0042 | 10.4692 | 0.3325 | 3 | 21 | glutathione derivative biosynthetic process |
| GO:0045869 | 0.005 | 25.0478 | 0.1108 | 2 | 7 | negative regulation of single stranded viral RNA replication via double stranded DNA intermediate |
| GO:0050870 | 0.0051 | 2.9517 | 3.2145 | 9 | 203 | positive regulation of T cell activation |
| GO:0039694 | 0.0055 | 9.4211 | 0.3642 | 3 | 23 | viral RNA genome replication |
| GO:0046580 | 0.0059 | 5.997 | 0.7284 | 4 | 46 | negative regulation of Ras protein signal transduction |
| GO:0017148 | 0.0062 | 2.3305 | 5.8589 | 13 | 370 | negative regulation of translation |
| GO:0000060 | 0.0064 | 5.8572 | 0.7442 | 4 | 47 | protein import into nucleus, translocation |
| GO:0030330 | 0.0068 | 3.7943 | 1.6785 | 6 | 106 | DNA damage response, signal transduction by p53 class mediator |
| GO:0002696 | 0.0068 | 2.5061 | 4.6079 | 11 | 291 | positive regulation of leukocyte activation |
| GO:0097435 | 0.0069 | 2.0479 | 8.725 | 17 | 551 | supramolecular fiber organization |
| GO:0030155 | 0.0075 | 1.9474 | 10.261 | 19 | 648 | regulation of cell adhesion |
| GO:1903671 | 0.0078 | 8.1907 | 0.4117 | 3 | 26 | negative regulation of sprouting angiogenesis |
| GO:0071822 | 0.0082 | 1.5884 | 25.51 | 38 | 1611 | protein complex subunit organization |
| GO:0009972 | 0.0084 | 17.8891 | 0.1425 | 2 | 9 | cytidine deamination |
| GO:0046087 | 0.0084 | 17.8891 | 0.1425 | 2 | 9 | cytidine metabolic process |
| GO:2000171 | 0.0087 | 7.8489 | 0.4275 | 3 | 27 | negative regulation of dendrite development |
| GO:0019058 | 0.0095 | 2.3847 | 4.8296 | 11 | 305 | viral life cycle |
| GO:0043623 | 0.0096 | 1.9714 | 9.0417 | 17 | 571 | cellular protein complex assembly |
| GO:0110053 | 0.0098 | 2.6473 | 3.5628 | 9 | 225 | regulation of actin filament organization |
| GO:0016458 | 0.0099 | 2.1922 | 6.2073 | 13 | 392 | gene silencing |
| GOMFID | Pvalue | OddsRatio | ExpCount | Count | Size | Term |
| GO:1900239 | 2e-04 | 38.6468 | 0.1237 | 3 | 8 | regulation of phenotypic switching |
| GO:0048625 | 0.0023 | 42.7738 | 0.0773 | 2 | 5 | myoblast fate commitment |
| GO:0051489 | 0.003 | 7.3772 | 0.6031 | 4 | 39 | regulation of filopodium assembly |
| GO:0008063 | 0.0034 | 32.0783 | 0.0928 | 2 | 6 | Toll signaling pathway |
| GO:0070383 | 0.0034 | 32.0783 | 0.0928 | 2 | 6 | DNA cytosine deamination |
| GO:0090677 | 0.0034 | 32.0783 | 0.0928 | 2 | 6 | reversible differentiation |
| GO:0007159 | 0.0037 | 2.49 | 5.5056 | 13 | 356 | leukocyte cell-cell adhesion |
| GO:0050870 | 0.0044 | 3.026 | 3.1394 | 9 | 203 | positive regulation of T cell activation |
| GO:0045869 | 0.0048 | 25.661 | 0.1083 | 2 | 7 | negative regulation of single stranded viral RNA replication via double stranded DNA intermediate |
| GO:0090647 | 0.0048 | 25.661 | 0.1083 | 2 | 7 | modulation of age-related behavioral decline |
| GO:0008347 | 0.0051 | 6.2953 | 0.6959 | 4 | 45 | glial cell migration |
| GO:0039694 | 0.0051 | 9.6526 | 0.3557 | 3 | 23 | viral RNA genome replication |
| GO:2000300 | 0.0051 | 9.6526 | 0.3557 | 3 | 23 | regulation of synaptic vesicle exocytosis |
| GO:0001505 | 0.0052 | 3.1944 | 2.6445 | 8 | 171 | regulation of neurotransmitter levels |
| GO:0006342 | 0.0055 | 3.9686 | 1.6084 | 6 | 104 | chromatin silencing |
| GO:0002696 | 0.0058 | 2.5698 | 4.5004 | 11 | 291 | positive regulation of leukocyte activation |
| GO:0007215 | 0.0058 | 4.6866 | 1.1444 | 5 | 74 | glutamate receptor signaling pathway |
| GO:0030155 | 0.0058 | 1.9986 | 10.0214 | 19 | 648 | regulation of cell adhesion |
| GO:0032071 | 0.0063 | 21.3829 | 0.1237 | 2 | 8 | regulation of endodeoxyribonuclease activity |
| GO:0044351 | 0.0063 | 21.3829 | 0.1237 | 2 | 8 | macropinocytosis |
| GO:0010629 | 0.0063 | 1.584 | 28.4714 | 42 | 1841 | negative regulation of gene expression |
| GO:0050804 | 0.007 | 2.4971 | 4.6241 | 11 | 299 | modulation of chemical synaptic transmission |
| GO:1903671 | 0.0073 | 8.392 | 0.4021 | 3 | 26 | negative regulation of sprouting angiogenesis |
| GO:0001960 | 0.0074 | 5.6092 | 0.7733 | 4 | 50 | negative regulation of cytokine-mediated signaling pathway |
| GO:0007196 | 0.008 | 18.327 | 0.1392 | 2 | 9 | adenylate cyclase-inhibiting G-protein coupled glutamate receptor signaling pathway |
| GO:0009972 | 0.008 | 18.327 | 0.1392 | 2 | 9 | cytidine deamination |
| GO:0010692 | 0.008 | 18.327 | 0.1392 | 2 | 9 | regulation of alkaline phosphatase activity |
| GO:0046087 | 0.008 | 18.327 | 0.1392 | 2 | 9 | cytidine metabolic process |
| GO:2000402 | 0.008 | 18.327 | 0.1392 | 2 | 9 | negative regulation of lymphocyte migration |
| GO:0006606 | 0.0086 | 2.5485 | 4.1137 | 10 | 266 | protein import into nucleus |
| GO:0030307 | 0.0088 | 3.177 | 2.3198 | 7 | 150 | positive regulation of cell growth |
| GO:0046824 | 0.0089 | 3.5656 | 1.7785 | 6 | 115 | positive regulation of nucleocytoplasmic transport |
| GO:0036006 | 0.0099 | 16.0351 | 0.1547 | 2 | 10 | cellular response to macrophage colony-stimulating factor stimulus |
| GOMFID | Pvalue | OddsRatio | ExpCount | Count | Size | Term |
| GO:0007156 | 0 | 6.2569 | 1.9574 | 11 | 152 | homophilic cell adhesion via plasma membrane adhesion molecules |
| GO:0001569 | 0 | 15.0782 | 0.3992 | 5 | 31 | branching involved in blood vessel morphogenesis |
| GO:0007399 | 1e-04 | 1.9818 | 27.5962 | 48 | 2143 | nervous system development |
| GO:0006355 | 1e-04 | 1.8064 | 44.3497 | 68 | 3444 | regulation of transcription, DNA-templated |
| GO:2001141 | 1e-04 | 1.7882 | 44.6974 | 68 | 3471 | regulation of RNA biosynthetic process |
| GO:0048762 | 1e-04 | 4.5502 | 2.3823 | 10 | 185 | mesenchymal cell differentiation |
| GO:0060562 | 1e-04 | 3.6233 | 3.8761 | 13 | 301 | epithelial tube morphogenesis |
| GO:0022610 | 2e-04 | 2.1447 | 17.011 | 33 | 1321 | biological adhesion |
| GO:0048701 | 2e-04 | 10.044 | 0.5666 | 5 | 44 | embryonic cranial skeleton morphogenesis |
| GO:0035413 | 3e-04 | 29.1499 | 0.1417 | 3 | 11 | positive regulation of catenin import into nucleus |
| GO:0060033 | 3e-04 | 29.1499 | 0.1417 | 3 | 11 | anatomical structure regression |
| GO:0001558 | 3e-04 | 3.1501 | 4.7775 | 14 | 371 | regulation of cell growth |
| GO:0061138 | 4e-04 | 4.298 | 2.2535 | 9 | 175 | morphogenesis of a branching epithelium |
| GO:0003274 | 5e-04 | 154.7826 | 0.0386 | 2 | 3 | endocardial cushion fusion |
| GO:0003214 | 7e-04 | 21.1959 | 0.1803 | 3 | 14 | cardiac left ventricle morphogenesis |
| GO:0042487 | 7e-04 | 21.1959 | 0.1803 | 3 | 14 | regulation of odontogenesis of dentin-containing tooth |
| GO:0060317 | 7e-04 | 11.1449 | 0.4121 | 4 | 32 | cardiac epithelial to mesenchymal transition |
| GO:0045600 | 8e-04 | 7.5269 | 0.734 | 5 | 57 | positive regulation of fat cell differentiation |
| GO:0061448 | 9e-04 | 3.5762 | 2.9876 | 10 | 232 | connective tissue development |
| GO:0021872 | 0.001 | 7.2472 | 0.7598 | 5 | 59 | forebrain generation of neurons |
| GO:0048706 | 0.001 | 4.8354 | 1.5582 | 7 | 121 | embryonic skeletal system development |
| GO:0006933 | 0.001 | 77.3865 | 0.0515 | 2 | 4 | negative regulation of cell adhesion involved in substrate-bound cell migration |
| GO:0021555 | 0.001 | 77.3865 | 0.0515 | 2 | 4 | midbrain-hindbrain boundary morphogenesis |
| GO:0035295 | 0.001 | 2.519 | 7.2242 | 17 | 561 | tube development |
| GO:0072132 | 0.0011 | 9.8405 | 0.4594 | 4 | 36 | mesenchyme morphogenesis |
| GO:0098609 | 0.0011 | 2.2461 | 10.0444 | 21 | 780 | cell-cell adhesion |
| GO:0043010 | 0.0015 | 3.1119 | 3.7602 | 11 | 292 | camera-type eye development |
| GO:1902262 | 0.0016 | 51.5878 | 0.0644 | 2 | 5 | apoptotic process involved in blood vessel morphogenesis |
| GO:1905007 | 0.0016 | 51.5878 | 0.0644 | 2 | 5 | positive regulation of epithelial to mesenchymal transition involved in endocardial cushion formation |
| GO:0060173 | 0.0016 | 3.8963 | 2.1892 | 8 | 170 | limb development |
| GO:0048863 | 0.0017 | 3.2628 | 3.258 | 10 | 253 | stem cell differentiation |
| GO:0019219 | 0.0017 | 1.5728 | 51.7671 | 71 | 4020 | regulation of nucleobase-containing compound metabolic process |
| GO:0032656 | 0.002 | 13.7099 | 0.2575 | 3 | 20 | regulation of interleukin-13 production |
| GO:0051094 | 0.0021 | 1.9471 | 14.9659 | 27 | 1177 | positive regulation of developmental process |
| GO:0060348 | 0.0023 | 3.6892 | 2.3051 | 8 | 179 | bone development |
| GO:0043586 | 0.0024 | 12.9474 | 0.2704 | 3 | 21 | tongue development |
| GO:0030098 | 0.0027 | 2.8627 | 4.0693 | 11 | 316 | lymphocyte differentiation |
| GO:0003272 | 0.0027 | 12.2652 | 0.2833 | 3 | 22 | endocardial cushion formation |
| GO:0032330 | 0.0029 | 7.4235 | 0.5924 | 4 | 46 | regulation of chondrocyte differentiation |
| GO:0046580 | 0.0029 | 7.4235 | 0.5924 | 4 | 46 | negative regulation of Ras protein signal transduction |
| GO:0070076 | 0.0031 | 11.6512 | 0.2962 | 3 | 23 | histone lysine demethylation |
| GO:1903507 | 0.0031 | 1.9049 | 14.6545 | 26 | 1138 | negative regulation of nucleic acid-templated transcription |
| GO:0003002 | 0.0033 | 2.7881 | 4.1723 | 11 | 324 | regionalization |
| GO:0048562 | 0.0034 | 2.9426 | 3.5928 | 10 | 279 | embryonic organ morphogenesis |
| GO:0040007 | 0.0034 | 2.0025 | 11.7313 | 22 | 911 | growth |
| GO:0032673 | 0.0035 | 11.0957 | 0.3091 | 3 | 24 | regulation of interleukin-4 production |
| GO:0051253 | 0.0037 | 1.8573 | 15.6074 | 27 | 1212 | negative regulation of RNA metabolic process |
| GO:0021953 | 0.0039 | 3.7269 | 1.9906 | 7 | 156 | central nervous system neuron differentiation |
| GO:0003148 | 0.0039 | 10.5907 | 0.3219 | 3 | 25 | outflow tract septum morphogenesis |
| GO:0061037 | 0.0039 | 10.5907 | 0.3219 | 3 | 25 | negative regulation of cartilage development |
| GO:0034654 | 0.0039 | 1.5099 | 52.5011 | 70 | 4077 | nucleobase-containing compound biosynthetic process |
| GO:0060350 | 0.0042 | 6.6317 | 0.6567 | 4 | 51 | endochondral bone morphogenesis |
| GO:0000122 | 0.0043 | 2.0679 | 9.7611 | 19 | 758 | negative regulation of transcription from RNA polymerase II promoter |
| GO:0010717 | 0.0043 | 5.0097 | 1.0688 | 5 | 83 | regulation of epithelial to mesenchymal transition |
| GO:0021859 | 0.0044 | 25.789 | 0.103 | 2 | 8 | pyramidal neuron differentiation |
| GO:0032909 | 0.0044 | 25.789 | 0.103 | 2 | 8 | regulation of transforming growth factor beta2 production |
| GO:0045630 | 0.0044 | 25.789 | 0.103 | 2 | 8 | positive regulation of T-helper 2 cell differentiation |
| GO:0060534 | 0.0044 | 25.789 | 0.103 | 2 | 8 | trachea cartilage development |
| GO:0002063 | 0.0044 | 10.1296 | 0.3348 | 3 | 26 | chondrocyte development |
| GO:0021884 | 0.0044 | 10.1296 | 0.3348 | 3 | 26 | forebrain neuron development |
| GO:0045165 | 0.0048 | 2.9842 | 3.1807 | 9 | 247 | cell fate commitment |
| GO:0090596 | 0.0048 | 2.9842 | 3.1807 | 9 | 247 | sensory organ morphogenesis |
| GO:0006482 | 0.0049 | 9.7069 | 0.3477 | 3 | 27 | protein demethylation |
| GO:0007405 | 0.0051 | 6.2326 | 0.6954 | 4 | 54 | neuroblast proliferation |
| GO:0009792 | 0.0052 | 2.2338 | 7.0954 | 15 | 551 | embryo development ending in birth or egg hatching |
| GO:0030851 | 0.0054 | 9.3181 | 0.3606 | 3 | 28 | granulocyte differentiation |
| GO:1902230 | 0.0054 | 9.3181 | 0.3606 | 3 | 28 | negative regulation of intrinsic apoptotic signaling pathway in response to DNA damage |
| GO:0045944 | 0.0056 | 1.8592 | 13.7659 | 24 | 1069 | positive regulation of transcription from RNA polymerase II promoter |
| GO:0003149 | 0.0056 | 22.1035 | 0.1159 | 2 | 9 | membranous septum morphogenesis |
| GO:0010692 | 0.0056 | 22.1035 | 0.1159 | 2 | 9 | regulation of alkaline phosphatase activity |
| GO:0046549 | 0.0056 | 22.1035 | 0.1159 | 2 | 9 | retinal cone cell development |
| GO:0001773 | 0.006 | 8.9591 | 0.3734 | 3 | 29 | myeloid dendritic cell activation |
| GO:0061036 | 0.006 | 8.9591 | 0.3734 | 3 | 29 | positive regulation of cartilage development |
| GO:1902893 | 0.006 | 8.9591 | 0.3734 | 3 | 29 | regulation of pri-miRNA transcription from RNA polymerase II promoter |
| GO:2000516 | 0.006 | 8.9591 | 0.3734 | 3 | 29 | positive regulation of CD4-positive, alpha-beta T cell activation |
| GO:1902107 | 0.006 | 3.8839 | 1.6354 | 6 | 127 | positive regulation of leukocyte differentiation |
| GO:0045669 | 0.0066 | 5.7695 | 0.7469 | 4 | 58 | positive regulation of osteoblast differentiation |
| GO:0008584 | 0.0068 | 3.7892 | 1.6741 | 6 | 130 | male gonad development |
| GO:0046085 | 0.0069 | 19.3394 | 0.1288 | 2 | 10 | adenosine metabolic process |
| GO:0048340 | 0.0069 | 19.3394 | 0.1288 | 2 | 10 | paraxial mesoderm morphogenesis |
| GO:0051573 | 0.0069 | 19.3394 | 0.1288 | 2 | 10 | negative regulation of histone H3-K9 methylation |
| GO:0014032 | 0.0074 | 5.5627 | 0.7726 | 4 | 60 | neural crest cell development |
| GO:0030278 | 0.0078 | 3.2505 | 2.2664 | 7 | 176 | regulation of ossification |
| GO:1902742 | 0.0079 | 8.0308 | 0.4121 | 3 | 32 | apoptotic process involved in development |
| GO:0016477 | 0.0079 | 1.741 | 16.5474 | 27 | 1285 | cell migration |
| GO:0090288 | 0.0081 | 3.6412 | 1.7384 | 6 | 135 | negative regulation of cellular response to growth factor stimulus |
| GO:1904591 | 0.0084 | 4.2437 | 1.2491 | 5 | 97 | positive regulation of protein import |
| GO:0009889 | 0.0084 | 1.4445 | 55.9651 | 72 | 4346 | regulation of biosynthetic process |
| GO:0021521 | 0.0084 | 17.1895 | 0.1417 | 2 | 11 | ventral spinal cord interneuron specification |
| GO:0021670 | 0.0084 | 17.1895 | 0.1417 | 2 | 11 | lateral ventricle development |
| GO:0021903 | 0.0084 | 17.1895 | 0.1417 | 2 | 11 | rostrocaudal neural tube patterning |
| GO:0060439 | 0.0084 | 17.1895 | 0.1417 | 2 | 11 | trachea morphogenesis |
| GO:0001756 | 0.0088 | 5.2789 | 0.8113 | 4 | 63 | somitogenesis |
| GO:0072091 | 0.0088 | 5.2789 | 0.8113 | 4 | 63 | regulation of stem cell proliferation |
| GO:0010810 | 0.0091 | 3.1561 | 2.3308 | 7 | 181 | regulation of cell-substrate adhesion |
| GO:0031057 | 0.0094 | 7.5117 | 0.4378 | 3 | 34 | negative regulation of histone modification |
| GOMFID | Pvalue | OddsRatio | ExpCount | Count | Size | Term |
| GO:0051094 | 0 | 2.7976 | 16.4961 | 40 | 1206 | positive regulation of developmental process |
| GO:0060562 | 0 | 4.2849 | 4.1172 | 16 | 301 | epithelial tube morphogenesis |
| GO:0009792 | 0 | 3.2187 | 7.5368 | 22 | 551 | embryo development ending in birth or egg hatching |
| GO:0003002 | 0 | 7.3251 | 1.3772 | 9 | 105 | regionalization |
| GO:2001141 | 0 | 1.8562 | 47.4776 | 74 | 3471 | regulation of RNA biosynthetic process |
| GO:0048736 | 0 | 5.1965 | 2.3253 | 11 | 170 | appendage development |
| GO:0045944 | 0 | 2.4315 | 14.6222 | 32 | 1069 | positive regulation of transcription from RNA polymerase II promoter |
| GO:0006355 | 0 | 1.8366 | 47.1083 | 73 | 3444 | regulation of transcription, DNA-templated |
| GO:0014033 | 0 | 8.5116 | 0.9301 | 7 | 68 | neural crest cell differentiation |
| GO:0000122 | 0 | 2.6445 | 10.3682 | 25 | 758 | negative regulation of transcription from RNA polymerase II promoter |
| GO:0007156 | 0 | 5.2704 | 2.0791 | 10 | 152 | homophilic cell adhesion via plasma membrane adhesion molecules |
| GO:0001569 | 1e-04 | 14.1634 | 0.424 | 5 | 31 | branching involved in blood vessel morphogenesis |
| GO:1903507 | 1e-04 | 2.2693 | 15.566 | 32 | 1138 | negative regulation of nucleic acid-templated transcription |
| GO:0051240 | 1e-04 | 2.0845 | 20.2577 | 38 | 1481 | positive regulation of multicellular organismal process |
| GO:0051253 | 1e-04 | 2.1961 | 16.5782 | 33 | 1212 | negative regulation of RNA metabolic process |
| GO:0035108 | 2e-04 | 4.9312 | 1.9834 | 9 | 145 | limb morphogenesis |
| GO:0001709 | 2e-04 | 10.5155 | 0.5471 | 5 | 40 | cell fate determination |
| GO:0007275 | 2e-04 | 1.6845 | 59.286 | 83 | 4587 | multicellular organism development |
| GO:0014031 | 2e-04 | 7.6389 | 0.8754 | 6 | 64 | mesenchymal cell development |
| GO:0048864 | 2e-04 | 7.6389 | 0.8754 | 6 | 64 | stem cell development |
| GO:0003206 | 3e-04 | 5.212 | 1.6688 | 8 | 122 | cardiac chamber morphogenesis |
| GO:0021915 | 3e-04 | 4.5906 | 2.1201 | 9 | 155 | neural tube development |
| GO:0007218 | 3e-04 | 5.8901 | 1.2994 | 7 | 95 | neuropeptide signaling pathway |
| GO:0019219 | 3e-04 | 1.658 | 54.9871 | 78 | 4020 | regulation of nucleobase-containing compound metabolic process |
| GO:0021517 | 4e-04 | 13.507 | 0.3512 | 4 | 26 | ventral spinal cord development |
| GO:0007267 | 4e-04 | 1.9574 | 20.8048 | 37 | 1521 | cell-cell signaling |
| GO:0001764 | 5e-04 | 4.7121 | 1.8329 | 8 | 134 | neuron migration |
| GO:0034654 | 5e-04 | 1.6266 | 55.7667 | 78 | 4077 | nucleobase-containing compound biosynthetic process |
| GO:0021524 | 6e-04 | 145.5182 | 0.041 | 2 | 3 | visceral motor neuron differentiation |
| GO:0048936 | 6e-04 | 145.5182 | 0.041 | 2 | 3 | peripheral nervous system neuron axonogenesis |
| GO:0090596 | 6e-04 | 3.4841 | 3.3786 | 11 | 247 | sensory organ morphogenesis |
| GO:0048729 | 6e-04 | 2.5418 | 7.5971 | 18 | 564 | tissue morphogenesis |
| GO:0061138 | 7e-04 | 4.0324 | 2.3937 | 9 | 175 | morphogenesis of a branching epithelium |
| GO:0035148 | 7e-04 | 4.4621 | 1.9287 | 8 | 141 | tube formation |
| GO:0051960 | 7e-04 | 2.2793 | 10.3819 | 22 | 759 | regulation of nervous system development |
| GO:0032736 | 8e-04 | 19.9215 | 0.1915 | 3 | 14 | positive regulation of interleukin-13 production |
| GO:0042487 | 8e-04 | 19.9215 | 0.1915 | 3 | 14 | regulation of odontogenesis of dentin-containing tooth |
| GO:0007405 | 8e-04 | 7.5045 | 0.7386 | 5 | 54 | neuroblast proliferation |
| GO:0048513 | 9e-04 | 1.6385 | 44.2769 | 64 | 3237 | animal organ development |
| GO:0009952 | 9e-04 | 3.8569 | 2.4958 | 9 | 184 | anterior/posterior pattern specification |
| GO:0009890 | 0.001 | 1.8405 | 22.6104 | 38 | 1653 | negative regulation of biosynthetic process |
| GO:1903508 | 0.001 | 1.9159 | 18.7394 | 33 | 1370 | positive regulation of nucleic acid-templated transcription |
| GO:0060581 | 0.001 | 18.2603 | 0.2052 | 3 | 15 | cell fate commitment involved in pattern specification |
| GO:0021515 | 0.0011 | 9.9002 | 0.4593 | 4 | 34 | cell differentiation in spinal cord |
| GO:0021555 | 0.0011 | 72.7545 | 0.0547 | 2 | 4 | midbrain-hindbrain boundary morphogenesis |
| GO:0022008 | 0.0011 | 1.9864 | 15.8355 | 29 | 1189 | neurogenesis |
| GO:0045669 | 0.0012 | 6.9364 | 0.7933 | 5 | 58 | positive regulation of osteoblast differentiation |
| GO:0051254 | 0.0012 | 1.8768 | 19.7105 | 34 | 1441 | positive regulation of RNA metabolic process |
| GO:0021514 | 0.0015 | 15.6497 | 0.2325 | 3 | 17 | ventral spinal cord interneuron differentiation |
| GO:0001755 | 0.0016 | 8.8824 | 0.5061 | 4 | 37 | neural crest cell migration |
| GO:0040007 | 0.0016 | 2.0663 | 12.461 | 24 | 911 | growth |
| GO:0035113 | 0.0017 | 4.3472 | 1.7235 | 7 | 126 | embryonic appendage morphogenesis |
| GO:0002568 | 0.0018 | 48.5 | 0.0684 | 2 | 5 | somatic diversification of T cell receptor genes |
| GO:0033153 | 0.0018 | 48.5 | 0.0684 | 2 | 5 | T cell receptor V(D)J recombination |
| GO:0045636 | 0.0018 | 48.5 | 0.0684 | 2 | 5 | positive regulation of melanocyte differentiation |
| GO:1902107 | 0.0018 | 4.3107 | 1.7372 | 7 | 127 | positive regulation of leukocyte differentiation |
| GO:0001558 | 0.0018 | 2.7191 | 5.0747 | 13 | 371 | regulation of cell growth |
| GO:0008584 | 0.0021 | 4.2048 | 1.7782 | 7 | 130 | male gonad development |
| GO:0003215 | 0.0021 | 13.6918 | 0.2599 | 3 | 19 | cardiac right ventricle morphogenesis |
| GO:0032753 | 0.0021 | 13.6918 | 0.2599 | 3 | 19 | positive regulation of interleukin-4 production |
| GO:0048557 | 0.0021 | 13.6918 | 0.2599 | 3 | 19 | embryonic digestive tract morphogenesis |
| GO:2000113 | 0.0021 | 1.8034 | 20.4218 | 34 | 1493 | negative regulation of cellular macromolecule biosynthetic process |
| GO:0021953 | 0.0022 | 4.8152 | 1.3369 | 6 | 101 | central nervous system neuron differentiation |
| GO:0030534 | 0.0026 | 4.0392 | 1.8466 | 7 | 135 | adult behavior |
| GO:0032502 | 0.0027 | 1.8495 | 19.4347 | 32 | 1637 | developmental process |
| GO:0003180 | 0.0027 | 36.3727 | 0.0821 | 2 | 6 | aortic valve morphogenesis |
| GO:0033603 | 0.0027 | 36.3727 | 0.0821 | 2 | 6 | positive regulation of dopamine secretion |
| GO:0043586 | 0.0028 | 12.1689 | 0.2872 | 3 | 21 | tongue development |
| GO:0048485 | 0.0028 | 12.1689 | 0.2872 | 3 | 21 | sympathetic nervous system development |
| GO:0048701 | 0.003 | 7.3248 | 0.6018 | 4 | 44 | embryonic cranial skeleton morphogenesis |
| GO:0007399 | 0.0031 | 2.3101 | 7.4004 | 16 | 604 | nervous system development |
| GO:0048665 | 0.0031 | 11.6275 | 0.2984 | 3 | 22 | neuron fate specification |
| GO:0045596 | 0.0032 | 2.179 | 8.7678 | 18 | 641 | negative regulation of cell differentiation |
| GO:0021513 | 0.0032 | 11.5278 | 0.3009 | 3 | 22 | spinal cord dorsal/ventral patterning |
| GO:0043627 | 0.0032 | 5.4012 | 0.9985 | 5 | 73 | response to estrogen |
| GO:0051241 | 0.0034 | 1.9148 | 13.9603 | 25 | 1033 | negative regulation of multicellular organismal process |
| GO:0030900 | 0.0035 | 2.6254 | 4.8285 | 12 | 353 | forebrain development |
| GO:0021879 | 0.0035 | 11.0868 | 0.3108 | 3 | 23 | forebrain neuron differentiation |
| GO:0072132 | 0.0035 | 6.9751 | 0.6292 | 4 | 46 | mesenchyme morphogenesis |
| GO:0045664 | 0.0036 | 2.2594 | 7.4957 | 16 | 548 | regulation of neuron differentiation |
| GO:0010226 | 0.0037 | 10.9507 | 0.3146 | 3 | 23 | response to lithium ion |
| GO:0042832 | 0.0037 | 10.9507 | 0.3146 | 3 | 23 | defense response to protozoan |
| GO:0003357 | 0.0037 | 29.0964 | 0.0957 | 2 | 7 | noradrenergic neuron differentiation |
| GO:0048704 | 0.0039 | 6.7647 | 0.6465 | 4 | 48 | embryonic skeletal system morphogenesis |
| GO:0003148 | 0.0047 | 9.9539 | 0.342 | 3 | 25 | outflow tract septum morphogenesis |
| GO:0045992 | 0.0047 | 9.9539 | 0.342 | 3 | 25 | negative regulation of embryonic development |
| GO:0021859 | 0.0049 | 24.2455 | 0.1094 | 2 | 8 | pyramidal neuron differentiation |
| GO:0045630 | 0.0049 | 24.2455 | 0.1094 | 2 | 8 | positive regulation of T-helper 2 cell differentiation |
| GO:0060534 | 0.0049 | 24.2455 | 0.1094 | 2 | 8 | trachea cartilage development |
| GO:0071863 | 0.0049 | 24.2455 | 0.1094 | 2 | 8 | regulation of cell proliferation in bone marrow |
| GO:0007519 | 0.0049 | 3.5619 | 2.0791 | 7 | 152 | skeletal muscle tissue development |
| GO:0060541 | 0.005 | 3.215 | 2.6262 | 8 | 192 | respiratory system development |
| GO:0010628 | 0.005 | 1.6625 | 24.0192 | 37 | 1756 | positive regulation of gene expression |
| GO:0046661 | 0.0051 | 3.5372 | 2.0928 | 7 | 153 | male sex differentiation |
| GO:0042093 | 0.0052 | 6.2311 | 0.6976 | 4 | 51 | T-helper cell differentiation |
| GO:0021884 | 0.0052 | 9.5205 | 0.3556 | 3 | 26 | forebrain neuron development |
| GO:0061053 | 0.0053 | 4.7672 | 1.1216 | 5 | 82 | somite development |
| GO:0060537 | 0.0054 | 2.4768 | 5.102 | 12 | 373 | muscle tissue development |
| GO:0050768 | 0.0054 | 2.9244 | 3.2418 | 9 | 237 | negative regulation of neurogenesis |
| GO:0003231 | 0.0059 | 3.9073 | 1.6277 | 6 | 119 | cardiac ventricle development |
| GO:0001838 | 0.0061 | 8.9136 | 0.3765 | 3 | 28 | embryonic epithelial tube formation |
| GO:0014807 | 0.0063 | 20.7805 | 0.1231 | 2 | 9 | regulation of somitogenesis |
| GO:0046549 | 0.0063 | 20.7805 | 0.1231 | 2 | 9 | retinal cone cell development |
| GO:0048087 | 0.0063 | 20.7805 | 0.1231 | 2 | 9 | positive regulation of developmental pigmentation |
| GO:0050932 | 0.0063 | 20.7805 | 0.1231 | 2 | 9 | regulation of pigment cell differentiation |
| GO:0071773 | 0.0063 | 3.3963 | 2.1749 | 7 | 159 | cellular response to BMP stimulus |
| GO:0002293 | 0.0063 | 5.8561 | 0.7386 | 4 | 54 | alpha-beta T cell differentiation involved in immune response |
| GO:0010557 | 0.0064 | 1.6667 | 21.8991 | 34 | 1601 | positive regulation of macromolecule biosynthetic process |
| GO:0048706 | 0.0065 | 8.6938 | 0.3846 | 3 | 29 | embryonic skeletal system development |
| GO:0043010 | 0.007 | 2.6305 | 3.9941 | 10 | 292 | camera-type eye development |
| GO:0048869 | 0.0071 | 1.4582 | 53.6401 | 70 | 4002 | cellular developmental process |
| GO:0045137 | 0.0075 | 2.985 | 2.8177 | 8 | 206 | development of primary sexual characteristics |
| GO:0045600 | 0.0076 | 5.5236 | 0.7797 | 4 | 57 | positive regulation of fat cell differentiation |
| GO:0048935 | 0.0077 | 18.3475 | 0.1356 | 2 | 10 | peripheral nervous system neuron development |
| GO:0042415 | 0.0078 | 18.1818 | 0.1368 | 2 | 10 | norepinephrine metabolic process |
| GO:0002828 | 0.0078 | 8.1081 | 0.4104 | 3 | 30 | regulation of type 2 immune response |
| GO:0032689 | 0.0078 | 8.1081 | 0.4104 | 3 | 30 | negative regulation of interferon-gamma production |
| GO:0040036 | 0.0078 | 8.1081 | 0.4104 | 3 | 30 | regulation of fibroblast growth factor receptor signaling pathway |
| GO:0071353 | 0.0078 | 8.1081 | 0.4104 | 3 | 30 | cellular response to interleukin-4 |
| GO:0048562 | 0.0085 | 3.2004 | 2.3006 | 7 | 175 | embryonic organ morphogenesis |
| GO:0009954 | 0.0086 | 7.818 | 0.424 | 3 | 31 | proximal/distal pattern formation |
| GO:0032735 | 0.0086 | 7.818 | 0.424 | 3 | 31 | positive regulation of interleukin-12 production |
| GO:0014020 | 0.0086 | 4.2166 | 1.2584 | 5 | 92 | primary neural tube formation |
| GO:0035282 | 0.0086 | 4.2166 | 1.2584 | 5 | 92 | segmentation |
| GO:0035115 | 0.0093 | 7.5479 | 0.4377 | 3 | 32 | embryonic forelimb morphogenesis |
| GO:0021521 | 0.0094 | 16.1606 | 0.1505 | 2 | 11 | ventral spinal cord interneuron specification |
| GO:0021670 | 0.0094 | 16.1606 | 0.1505 | 2 | 11 | lateral ventricle development |
| GO:0021903 | 0.0094 | 16.1606 | 0.1505 | 2 | 11 | rostrocaudal neural tube patterning |
| GO:0032754 | 0.0094 | 16.1606 | 0.1505 | 2 | 11 | positive regulation of interleukin-5 production |
| GO:0060033 | 0.0094 | 16.1606 | 0.1505 | 2 | 11 | anatomical structure regression |
| GO:2000774 | 0.0094 | 16.1606 | 0.1505 | 2 | 11 | positive regulation of cellular senescence |
| GO:0048608 | 0.0099 | 2.2764 | 5.5261 | 12 | 404 | reproductive structure development |
| GOMFID | Pvalue | OddsRatio | ExpCount | Count | Size | Term |
| GO:0009593 | 0 | 12.3527 | 1.4109 | 13 | 449 | detection of chemical stimulus |
| GO:0050906 | 0 | 12.0126 | 1.4486 | 13 | 461 | detection of stimulus involved in sensory perception |
| GO:0007606 | 0 | 11.8494 | 1.4675 | 13 | 467 | sensory perception of chemical stimulus |
| GO:0050911 | 0 | 12.1184 | 1.1627 | 11 | 370 | detection of chemical stimulus involved in sensory perception of smell |
| GO:0050877 | 0 | 5.2245 | 3.8022 | 15 | 1210 | nervous system process |
| GO:0007186 | 0 | 5.033 | 3.9342 | 15 | 1252 | G-protein coupled receptor signaling pathway |
| GO:0006688 | 0 | 50.4969 | 0.0723 | 3 | 23 | glycosphingolipid biosynthetic process |
| GO:0019835 | 3e-04 | 25.8654 | 0.132 | 3 | 42 | cytolysis |
| GO:0006968 | 6e-04 | 19.7647 | 0.1697 | 3 | 54 | cellular defense response |
| GO:0010623 | 7e-04 | 59.9926 | 0.0409 | 2 | 13 | programmed cell death involved in cell development |
| GO:0006955 | 8e-04 | 3.1473 | 5.5509 | 14 | 1837 | immune response |
| GO:0002418 | 9e-04 | 54.9898 | 0.044 | 2 | 14 | immune response to tumor cell |
| GO:0052695 | 0.0013 | 43.9837 | 0.0534 | 2 | 17 | cellular glucuronidation |
| GO:0006874 | 0.0014 | 5.3979 | 1.2444 | 6 | 396 | cellular calcium ion homeostasis |
| GO:0055065 | 0.0018 | 4.4537 | 1.7754 | 7 | 565 | metal ion homeostasis |
| GO:0070098 | 0.002 | 13.0698 | 0.2514 | 3 | 80 | chemokine-mediated signaling pathway |
| GO:0006063 | 0.0021 | 32.9776 | 0.0691 | 2 | 22 | uronic acid metabolic process |
| GO:0045321 | 0.0023 | 3.3047 | 3.5257 | 10 | 1122 | leukocyte activation |
| GO:0072507 | 0.0024 | 4.8487 | 1.3795 | 6 | 439 | divalent inorganic cation homeostasis |
| GO:0002355 | 0.0031 | Inf | 0.0031 | 1 | 1 | detection of tumor cell |
| GO:0002642 | 0.0031 | Inf | 0.0031 | 1 | 1 | positive regulation of immunoglobulin biosynthetic process |
| GO:0030887 | 0.0031 | Inf | 0.0031 | 1 | 1 | positive regulation of myeloid dendritic cell activation |
| GO:0032078 | 0.0031 | Inf | 0.0031 | 1 | 1 | negative regulation of endodeoxyribonuclease activity |
| GO:1900758 | 0.0031 | Inf | 0.0031 | 1 | 1 | negative regulation of D-amino-acid oxidase activity |
| GO:1904155 | 0.0031 | Inf | 0.0031 | 1 | 1 | DN2 thymocyte differentiation |
| GO:1904156 | 0.0031 | Inf | 0.0031 | 1 | 1 | DN3 thymocyte differentiation |
| GO:0048265 | 0.0037 | 24.4172 | 0.0911 | 2 | 29 | response to pain |
| GO:0042113 | 0.0048 | 6.3794 | 0.6819 | 4 | 217 | B cell activation |
| GO:0050715 | 0.0052 | 9.2144 | 0.3519 | 3 | 112 | positive regulation of cytokine secretion |
| GO:1902042 | 0.0057 | 19.3818 | 0.1131 | 2 | 36 | negative regulation of extrinsic apoptotic signaling pathway via death domain receptors |
| GO:0006664 | 0.0058 | 8.8861 | 0.3645 | 3 | 116 | glycolipid metabolic process |
| GO:0002023 | 0.0063 | 323.56 | 0.0063 | 1 | 2 | reduction of food intake in response to dietary excess |
| GO:0034021 | 0.0063 | 323.56 | 0.0063 | 1 | 2 | response to silicon dioxide |
| GO:0035378 | 0.0063 | 323.56 | 0.0063 | 1 | 2 | carbon dioxide transmembrane transport |
| GO:0036345 | 0.0063 | 323.56 | 0.0063 | 1 | 2 | platelet maturation |
| GO:0043006 | 0.0063 | 323.56 | 0.0063 | 1 | 2 | activation of phospholipase A2 activity by calcium-mediated signaling |
| GO:2000016 | 0.0063 | 323.56 | 0.0063 | 1 | 2 | negative regulation of determination of dorsal identity |
| GO:0055082 | 0.0068 | 3.4662 | 2.253 | 7 | 717 | cellular chemical homeostasis |
| GO:0050801 | 0.007 | 3.4459 | 2.2656 | 7 | 721 | ion homeostasis |
| GO:2000351 | 0.0073 | 16.8917 | 0.1288 | 2 | 41 | regulation of endothelial cell apoptotic process |
| GO:0002793 | 0.0076 | 5.5581 | 0.7793 | 4 | 248 | positive regulation of peptide secretion |
| GO:0031343 | 0.0081 | 16.0657 | 0.1351 | 2 | 43 | positive regulation of cell killing |
| GO:0060443 | 0.0084 | 15.6822 | 0.1383 | 2 | 44 | mammary gland morphogenesis |
| GO:0030003 | 0.0093 | 3.6314 | 1.8194 | 6 | 579 | cellular cation homeostasis |
| GO:0021553 | 0.0094 | 161.77 | 0.0094 | 1 | 3 | olfactory nerve development |
| GO:0048388 | 0.0094 | 161.77 | 0.0094 | 1 | 3 | endosomal lumen acidification |
| GO:0060648 | 0.0094 | 161.77 | 0.0094 | 1 | 3 | mammary gland bud morphogenesis |
| GO:0060763 | 0.0094 | 161.77 | 0.0094 | 1 | 3 | mammary duct terminal end bud growth |
| GO:0061368 | 0.0094 | 161.77 | 0.0094 | 1 | 3 | behavioral response to formalin induced pain |
| GO:0099566 | 0.0094 | 161.77 | 0.0094 | 1 | 3 | regulation of postsynaptic cytosolic calcium ion concentration |
| GO:1990743 | 0.0094 | 161.77 | 0.0094 | 1 | 3 | protein sialylation |
| GO:0046467 | 0.0095 | 7.3727 | 0.4368 | 3 | 139 | membrane lipid biosynthetic process |
| GO:0002682 | 0.0095 | 2.647 | 4.3207 | 10 | 1375 | regulation of immune system process |
| GO:0070231 | 0.0096 | 14.634 | 0.1477 | 2 | 47 | T cell apoptotic process |
| GO:0072678 | 0.0096 | 14.634 | 0.1477 | 2 | 47 | T cell migration |
| GOMFID | Pvalue | OddsRatio | ExpCount | Count | Size | Term |
| GO:0007156 | 0 | 6.5586 | 1.8731 | 11 | 152 | homophilic cell adhesion via plasma membrane adhesion molecules |
| GO:0007399 | 0 | 3.1428 | 8.2336 | 23 | 717 | nervous system development |
| GO:0048736 | 0 | 5.8095 | 2.0949 | 11 | 170 | appendage development |
| GO:0007389 | 0 | 3.7059 | 5.04 | 17 | 409 | pattern specification process |
| GO:0048568 | 1e-04 | 3.4419 | 5.0647 | 16 | 411 | embryonic organ development |
| GO:0000122 | 1e-04 | 2.7041 | 9.3407 | 23 | 758 | negative regulation of transcription from RNA polymerase II promoter |
| GO:0035108 | 1e-04 | 5.5069 | 1.7868 | 9 | 145 | limb morphogenesis |
| GO:0045944 | 1e-04 | 2.344 | 13.1731 | 28 | 1069 | positive regulation of transcription from RNA polymerase II promoter |
| GO:0021884 | 3e-04 | 14.8497 | 0.3204 | 4 | 26 | forebrain neuron development |
| GO:0048704 | 3e-04 | 9.7084 | 0.5812 | 5 | 48 | embryonic skeletal system morphogenesis |
| GO:0001501 | 3e-04 | 2.9433 | 5.8657 | 16 | 476 | skeletal system development |
| GO:0009887 | 3e-04 | 2.2959 | 11.8792 | 25 | 964 | animal organ morphogenesis |
| GO:0022610 | 4e-04 | 2.096 | 16.2785 | 31 | 1321 | biological adhesion |
| GO:0051253 | 4e-04 | 2.1284 | 14.9353 | 29 | 1212 | negative regulation of RNA metabolic process |
| GO:0043009 | 4e-04 | 2.7168 | 6.7406 | 17 | 547 | chordate embryonic development |
| GO:0140076 | 4e-04 | 161.9091 | 0.037 | 2 | 3 | negative regulation of lipoprotein transport |
| GO:0048935 | 5e-04 | 24.3959 | 0.1602 | 3 | 13 | peripheral nervous system neuron development |
| GO:0051094 | 5e-04 | 3.3457 | 3.8606 | 12 | 335 | positive regulation of developmental process |
| GO:0001953 | 5e-04 | 12.096 | 0.382 | 4 | 31 | negative regulation of cell-matrix adhesion |
| GO:0098609 | 6e-04 | 2.3604 | 9.6118 | 21 | 780 | cell-cell adhesion |
| GO:0045669 | 7e-04 | 7.7296 | 0.7147 | 5 | 58 | positive regulation of osteoblast differentiation |
| GO:1903507 | 8e-04 | 2.0958 | 14.0234 | 27 | 1138 | negative regulation of nucleic acid-templated transcription |
| GO:0021872 | 8e-04 | 7.5859 | 0.727 | 5 | 59 | forebrain generation of neurons |
| GO:0014032 | 9e-04 | 7.4476 | 0.7394 | 5 | 60 | neural crest cell development |
| GO:0021555 | 9e-04 | 80.9495 | 0.0493 | 2 | 4 | midbrain-hindbrain boundary morphogenesis |
| GO:0035113 | 0.001 | 4.8494 | 1.5527 | 7 | 126 | embryonic appendage morphogenesis |
| GO:0072175 | 0.001 | 4.7687 | 1.5773 | 7 | 128 | epithelial tube formation |
| GO:0048863 | 0.0012 | 3.4193 | 3.1177 | 10 | 253 | stem cell differentiation |
| GO:0051240 | 0.0012 | 1.9167 | 18.2502 | 32 | 1481 | positive regulation of multicellular organismal process |
| GO:0006355 | 0.0012 | 1.6406 | 42.4399 | 61 | 3444 | regulation of transcription, DNA-templated |
| GO:0045636 | 0.0015 | 53.963 | 0.0616 | 2 | 5 | positive regulation of melanocyte differentiation |
| GO:2001141 | 0.0015 | 1.6241 | 42.7726 | 61 | 3471 | regulation of RNA biosynthetic process |
| GO:0035024 | 0.0015 | 15.2418 | 0.2341 | 3 | 19 | negative regulation of Rho protein signal transduction |
| GO:1903305 | 0.0018 | 5.028 | 1.2816 | 6 | 104 | regulation of regulated secretory pathway |
| GO:0009952 | 0.0019 | 3.7907 | 2.2463 | 8 | 184 | anterior/posterior pattern specification |
| GO:0019219 | 0.002 | 1.5744 | 49.5379 | 68 | 4020 | regulation of nucleobase-containing compound metabolic process |
| GO:0048701 | 0.0021 | 8.1582 | 0.5422 | 4 | 44 | embryonic cranial skeleton morphogenesis |
| GO:0043586 | 0.0021 | 13.5465 | 0.2588 | 3 | 21 | tongue development |
| GO:0048762 | 0.0021 | 3.7319 | 2.2797 | 8 | 185 | mesenchymal cell differentiation |
| GO:0016331 | 0.0021 | 4.1768 | 1.7868 | 7 | 145 | morphogenesis of embryonic epithelium |
| GO:0022008 | 0.0026 | 1.8499 | 17.5724 | 30 | 1426 | neurogenesis |
| GO:0003357 | 0.003 | 32.3737 | 0.0863 | 2 | 7 | noradrenergic neuron differentiation |
| GO:0021953 | 0.0031 | 3.9047 | 1.9041 | 7 | 156 | central nervous system neuron differentiation |
| GO:0035239 | 0.0031 | 2.8036 | 4.1528 | 11 | 337 | tube morphogenesis |
| GO:0002703 | 0.0033 | 3.8397 | 1.9347 | 7 | 157 | regulation of leukocyte mediated immunity |
| GO:0060561 | 0.0035 | 11.0808 | 0.3081 | 3 | 25 | apoptotic process involved in morphogenesis |
| GO:0045165 | 0.0036 | 3.1266 | 3.0437 | 9 | 247 | cell fate commitment |
| GO:0006672 | 0.004 | 5.1122 | 1.0474 | 5 | 85 | ceramide metabolic process |
| GO:0021859 | 0.004 | 26.9764 | 0.0986 | 2 | 8 | pyramidal neuron differentiation |
| GO:0010557 | 0.0042 | 1.7556 | 19.7289 | 32 | 1601 | positive regulation of macromolecule biosynthetic process |
| GO:0030851 | 0.0048 | 9.7492 | 0.345 | 3 | 28 | granulocyte differentiation |
| GO:0043304 | 0.0048 | 9.7492 | 0.345 | 3 | 28 | regulation of mast cell degranulation |
| GO:0002699 | 0.0048 | 3.5749 | 2.0702 | 7 | 168 | positive regulation of immune effector process |
| GO:0010628 | 0.0051 | 1.7018 | 21.6389 | 34 | 1756 | positive regulation of gene expression |
| GO:2000113 | 0.0051 | 1.7571 | 18.398 | 30 | 1493 | negative regulation of cellular macromolecule biosynthetic process |
| GO:0048087 | 0.0051 | 23.1212 | 0.1109 | 2 | 9 | positive regulation of developmental pigmentation |
| GO:0050932 | 0.0051 | 23.1212 | 0.1109 | 2 | 9 | regulation of pigment cell differentiation |
| GO:0090370 | 0.0051 | 23.1212 | 0.1109 | 2 | 9 | negative regulation of cholesterol efflux |
| GO:2000109 | 0.0051 | 23.1212 | 0.1109 | 2 | 9 | regulation of macrophage apoptotic process |
| GO:1903508 | 0.0055 | 1.7817 | 16.8823 | 28 | 1370 | positive regulation of nucleic acid-templated transcription |
| GO:0002221 | 0.0057 | 3.4661 | 2.1319 | 7 | 173 | pattern recognition receptor signaling pathway |
| GO:0051254 | 0.0058 | 1.7557 | 17.7572 | 29 | 1441 | positive regulation of RNA metabolic process |
| GO:1901616 | 0.006 | 5.9276 | 0.727 | 4 | 59 | organic hydroxy compound catabolic process |
| GO:0030278 | 0.0062 | 3.404 | 2.1688 | 7 | 176 | regulation of ossification |
| GO:0003211 | 0.0064 | 20.2298 | 0.1232 | 2 | 10 | cardiac ventricle formation |
| GO:1902563 | 0.0064 | 20.2298 | 0.1232 | 2 | 10 | regulation of neutrophil activation |
| GO:0009954 | 0.0064 | 8.703 | 0.382 | 3 | 31 | proximal/distal pattern formation |
| GO:0009890 | 0.0067 | 1.6931 | 20.3697 | 32 | 1653 | negative regulation of biosynthetic process |
| GO:0021510 | 0.0067 | 4.4911 | 1.183 | 5 | 96 | spinal cord development |
| GO:0010810 | 0.0072 | 3.3051 | 2.2304 | 7 | 181 | regulation of cell-substrate adhesion |
| GO:0034654 | 0.0073 | 1.4759 | 50.2403 | 66 | 4077 | nucleobase-containing compound biosynthetic process |
| GO:0022603 | 0.0074 | 1.8919 | 11.793 | 21 | 957 | regulation of anatomical structure morphogenesis |
| GO:0042733 | 0.0076 | 5.5244 | 0.7763 | 4 | 63 | embryonic digit morphogenesis |
| GO:0080134 | 0.0076 | 1.7493 | 16.5126 | 27 | 1340 | regulation of response to stress |
| GO:0010985 | 0.0077 | 17.9809 | 0.1356 | 2 | 11 | negative regulation of lipoprotein particle clearance |
| GO:0021521 | 0.0077 | 17.9809 | 0.1356 | 2 | 11 | ventral spinal cord interneuron specification |
| GO:0021670 | 0.0077 | 17.9809 | 0.1356 | 2 | 11 | lateral ventricle development |
| GO:0021903 | 0.0077 | 17.9809 | 0.1356 | 2 | 11 | rostrocaudal neural tube patterning |
| GO:0031987 | 0.0077 | 17.9809 | 0.1356 | 2 | 11 | locomotion involved in locomotory behavior |
| GO:0060033 | 0.0077 | 17.9809 | 0.1356 | 2 | 11 | anatomical structure regression |
| GO:0001841 | 0.0079 | 4.3009 | 1.2323 | 5 | 100 | neural tube formation |
| GO:0007275 | 0.0079 | 1.4836 | 50.7398 | 66 | 4460 | multicellular organism development |
| GO:0003341 | 0.008 | 5.432 | 0.7887 | 4 | 64 | cilium movement |
| GO:0061035 | 0.008 | 5.432 | 0.7887 | 4 | 64 | regulation of cartilage development |
| GO:0061448 | 0.0082 | 2.9401 | 2.8589 | 8 | 232 | connective tissue development |
| GO:0031057 | 0.0083 | 7.8593 | 0.419 | 3 | 34 | negative regulation of histone modification |
| GO:0017015 | 0.0086 | 4.2117 | 1.2569 | 5 | 102 | regulation of transforming growth factor beta receptor signaling pathway |
| GO:0032502 | 0.009 | 1.7643 | 16.9884 | 27 | 1637 | developmental process |
| GO:0048869 | 0.0091 | 1.4785 | 45.351 | 60 | 3795 | cellular developmental process |
| GO:0017121 | 0.0092 | 16.1818 | 0.1479 | 2 | 12 | phospholipid scrambling |
| GO:0042659 | 0.0092 | 16.1818 | 0.1479 | 2 | 12 | regulation of cell fate specification |
| GO:0045628 | 0.0092 | 16.1818 | 0.1479 | 2 | 12 | regulation of T-helper 2 cell differentiation |
| GO:0045597 | 0.0096 | 1.9421 | 9.8031 | 18 | 813 | positive regulation of cell differentiation |
| GO:0033003 | 0.0098 | 7.3821 | 0.4436 | 3 | 36 | regulation of mast cell activation |
| GOMFID | Pvalue | OddsRatio | ExpCount | Count | Size | Term |
| GO:0007156 | 0 | 8.8047 | 2.1353 | 16 | 152 | homophilic cell adhesion via plasma membrane adhesion molecules |
| GO:0007399 | 0 | 5.6755 | 3.4259 | 17 | 288 | nervous system development |
| GO:0021510 | 0 | 11.3911 | 1.0411 | 10 | 75 | spinal cord development |
| GO:0045944 | 0 | 2.717 | 15.0174 | 36 | 1069 | positive regulation of transcription from RNA polymerase II promoter |
| GO:0022008 | 0 | 2.8044 | 13.7816 | 34 | 1019 | neurogenesis |
| GO:0000122 | 0 | 3.0531 | 10.6484 | 29 | 758 | negative regulation of transcription from RNA polymerase II promoter |
| GO:0035107 | 0 | 6.6287 | 2.037 | 12 | 145 | appendage morphogenesis |
| GO:0060581 | 0 | 35.8565 | 0.2107 | 5 | 15 | cell fate commitment involved in pattern specification |
| GO:0060173 | 0 | 6.0038 | 2.2293 | 12 | 160 | limb development |
| GO:0021514 | 0 | 29.8767 | 0.2388 | 5 | 17 | ventral spinal cord interneuron differentiation |
| GO:0030182 | 0 | 2.8802 | 11.2918 | 29 | 841 | neuron differentiation |
| GO:0001764 | 0 | 6.5441 | 1.8824 | 11 | 134 | neuron migration |
| GO:0009790 | 0 | 2.7536 | 11.7245 | 29 | 849 | embryo development |
| GO:0003151 | 0 | 8.7802 | 1.0396 | 8 | 74 | outflow tract morphogenesis |
| GO:0009952 | 0 | 5.1824 | 2.5526 | 12 | 184 | anterior/posterior pattern specification |
| GO:0021513 | 0 | 21.0828 | 0.3091 | 5 | 22 | spinal cord dorsal/ventral patterning |
| GO:0007411 | 0 | 4.6138 | 3.0906 | 13 | 220 | axon guidance |
| GO:0007267 | 0 | 2.2173 | 21.3671 | 42 | 1521 | cell-cell signaling |
| GO:0048870 | 0 | 2.258 | 19.9201 | 40 | 1418 | cell motility |
| GO:0001709 | 0 | 12.6932 | 0.5619 | 6 | 40 | cell fate determination |
| GO:0048935 | 0 | 31.7321 | 0.1826 | 4 | 13 | peripheral nervous system neuron development |
| GO:0006355 | 0 | 1.8381 | 48.3815 | 75 | 3444 | regulation of transcription, DNA-templated |
| GO:2001141 | 0 | 1.8196 | 48.7608 | 75 | 3471 | regulation of RNA biosynthetic process |
| GO:0003214 | 0 | 28.5571 | 0.1967 | 4 | 14 | cardiac left ventricle morphogenesis |
| GO:0022610 | 0 | 2.2205 | 18.5575 | 37 | 1321 | biological adhesion |
| GO:0007218 | 1e-04 | 6.652 | 1.3346 | 8 | 95 | neuropeptide signaling pathway |
| GO:0021522 | 1e-04 | 13.7772 | 0.4355 | 5 | 31 | spinal cord motor neuron differentiation |
| GO:0045597 | 1e-04 | 3.4445 | 4.7279 | 15 | 359 | positive regulation of cell differentiation |
| GO:1903508 | 1e-04 | 2.1318 | 19.2458 | 37 | 1370 | positive regulation of nucleic acid-templated transcription |
| GO:0003357 | 1e-04 | 53.3267 | 0.0983 | 3 | 7 | noradrenergic neuron differentiation |
| GO:0060322 | 1e-04 | 2.608 | 9.5948 | 23 | 683 | head development |
| GO:0019219 | 1e-04 | 1.7206 | 56.4732 | 82 | 4020 | regulation of nucleobase-containing compound metabolic process |
| GO:1903507 | 1e-04 | 2.1989 | 15.9867 | 32 | 1138 | negative regulation of nucleic acid-templated transcription |
| GO:0030900 | 1e-04 | 3.2636 | 4.959 | 15 | 353 | forebrain development |
| GO:0048729 | 1e-04 | 2.6547 | 8.5693 | 21 | 610 | tissue morphogenesis |
| GO:0061564 | 2e-04 | 2.9388 | 6.2373 | 17 | 444 | axon development |
| GO:0072272 | 2e-04 | Inf | 0.0281 | 2 | 2 | proximal/distal pattern formation involved in metanephric nephron development |
| GO:0007268 | 2e-04 | 2.6271 | 8.2181 | 20 | 585 | chemical synaptic transmission |
| GO:0051254 | 2e-04 | 2.0142 | 20.2433 | 37 | 1441 | positive regulation of RNA metabolic process |
| GO:0099537 | 2e-04 | 2.6175 | 8.2462 | 20 | 587 | trans-synaptic signaling |
| GO:0072091 | 3e-04 | 7.5605 | 0.885 | 6 | 63 | regulation of stem cell proliferation |
| GO:0021879 | 3e-04 | 15.3444 | 0.3165 | 4 | 23 | forebrain neuron differentiation |
| GO:0048667 | 3e-04 | 2.7482 | 7.0521 | 18 | 502 | cell morphogenesis involved in neuron differentiation |
| GO:0003231 | 3e-04 | 5.2059 | 1.6717 | 8 | 119 | cardiac ventricle development |
| GO:0009887 | 3e-04 | 2.5229 | 9.0182 | 21 | 685 | animal organ morphogenesis |
| GO:0007275 | 3e-04 | 1.8818 | 30.4442 | 49 | 2532 | multicellular organism development |
| GO:0001667 | 3e-04 | 3.1857 | 4.7201 | 14 | 336 | ameboidal-type cell migration |
| GO:0007519 | 3e-04 | 4.5576 | 2.1353 | 9 | 152 | skeletal muscle tissue development |
| GO:0003211 | 3e-04 | 30.4667 | 0.1405 | 3 | 10 | cardiac ventricle formation |
| GO:0035640 | 3e-04 | 14.2696 | 0.3372 | 4 | 24 | exploration behavior |
| GO:0048812 | 3e-04 | 2.608 | 7.8388 | 19 | 558 | neuron projection morphogenesis |
| GO:0010720 | 4e-04 | 2.7718 | 6.5885 | 17 | 469 | positive regulation of cell development |
| GO:2000026 | 4e-04 | 1.8665 | 25.4972 | 43 | 1815 | regulation of multicellular organismal development |
| GO:0051253 | 4e-04 | 2.0508 | 17.0262 | 32 | 1212 | negative regulation of RNA metabolic process |
| GO:0021903 | 4e-04 | 26.6567 | 0.1545 | 3 | 11 | rostrocaudal neural tube patterning |
| GO:0001501 | 4e-04 | 2.7283 | 6.6869 | 17 | 476 | skeletal system development |
| GO:0034654 | 5e-04 | 1.6235 | 57.2739 | 80 | 4077 | nucleobase-containing compound biosynthetic process |
| GO:0048858 | 5e-04 | 2.5255 | 8.0776 | 19 | 575 | cell projection morphogenesis |
| GO:0048704 | 5e-04 | 8.4523 | 0.6643 | 5 | 48 | embryonic skeletal system morphogenesis |
| GO:0050768 | 5e-04 | 3.5385 | 3.3294 | 11 | 237 | negative regulation of neurogenesis |
| GO:0010454 | 5e-04 | 23.6933 | 0.1686 | 3 | 12 | negative regulation of cell fate commitment |
| GO:0021912 | 6e-04 | 141.6018 | 0.0421 | 2 | 3 | regulation of transcription from RNA polymerase II promoter involved in spinal cord motor neuron fate specification |
| GO:0032989 | 6e-04 | 2.1259 | 13.739 | 27 | 978 | cellular component morphogenesis |
| GO:0048863 | 6e-04 | 3.4611 | 3.3995 | 11 | 244 | stem cell differentiation |
| GO:0098609 | 6e-04 | 2.2595 | 10.9575 | 23 | 780 | cell-cell adhesion |
| GO:0048869 | 7e-04 | 1.7187 | 38.0814 | 57 | 2996 | cellular developmental process |
| GO:0010811 | 7e-04 | 5.1403 | 1.475 | 7 | 105 | positive regulation of cell-substrate adhesion |
| GO:2000177 | 7e-04 | 6.0643 | 1.0817 | 6 | 77 | regulation of neural precursor cell proliferation |
| GO:0010628 | 8e-04 | 1.8265 | 24.6684 | 41 | 1756 | positive regulation of gene expression |
| GO:0060537 | 8e-04 | 2.8506 | 5.2399 | 14 | 373 | muscle tissue development |
| GO:0009954 | 9e-04 | 10.5655 | 0.4355 | 4 | 31 | proximal/distal pattern formation |
| GO:0010557 | 9e-04 | 1.8476 | 22.4909 | 38 | 1601 | positive regulation of macromolecule biosynthetic process |
| GO:0007626 | 9e-04 | 4.8846 | 1.5461 | 7 | 112 | locomotory behavior |
| GO:0048592 | 9e-04 | 4.2739 | 2.0089 | 8 | 143 | eye morphogenesis |
| GO:0007423 | 0.001 | 2.5187 | 7.2067 | 17 | 513 | sensory organ development |
| GO:0008038 | 0.001 | 10.1875 | 0.4495 | 4 | 32 | neuron recognition |
| GO:0035115 | 0.001 | 10.1875 | 0.4495 | 4 | 32 | embryonic forelimb morphogenesis |
| GO:0043009 | 0.001 | 2.7826 | 5.3649 | 14 | 392 | chordate embryonic development |
| GO:0048562 | 0.001 | 3.79 | 2.5377 | 9 | 187 | embryonic organ morphogenesis |
| GO:0008284 | 0.0011 | 2.1316 | 12.0954 | 24 | 861 | positive regulation of cell proliferation |
| GO:0007379 | 0.0011 | 17.7667 | 0.2107 | 3 | 15 | segment specification |
| GO:0021913 | 0.0012 | 70.7965 | 0.0562 | 2 | 4 | regulation of transcription from RNA polymerase II promoter involved in ventral spinal cord interneuron specification |
| GO:0034287 | 0.0012 | 70.7965 | 0.0562 | 2 | 4 | detection of monosaccharide stimulus |
| GO:0042662 | 0.0012 | 70.7965 | 0.0562 | 2 | 4 | negative regulation of mesodermal cell fate specification |
| GO:0051594 | 0.0012 | 70.7965 | 0.0562 | 2 | 4 | detection of glucose |
| GO:0060214 | 0.0012 | 70.7965 | 0.0562 | 2 | 4 | endocardium formation |
| GO:0072086 | 0.0012 | 70.7965 | 0.0562 | 2 | 4 | specification of loop of Henle identity |
| GO:1905903 | 0.0012 | 70.7965 | 0.0562 | 2 | 4 | negative regulation of mesoderm formation |
| GO:0035295 | 0.0012 | 3.7099 | 2.5905 | 9 | 192 | tube development |
| GO:0048762 | 0.0012 | 3.6954 | 2.5989 | 9 | 185 | mesenchymal cell differentiation |
| GO:0045669 | 0.0013 | 6.7472 | 0.8148 | 5 | 58 | positive regulation of osteoblast differentiation |
| GO:0014032 | 0.0015 | 6.501 | 0.8429 | 5 | 60 | neural crest cell development |
| GO:0014003 | 0.0016 | 8.9118 | 0.5057 | 4 | 36 | oligodendrocyte development |
| GO:0021915 | 0.0016 | 3.9221 | 2.1774 | 8 | 155 | neural tube development |
| GO:1990830 | 0.0016 | 5.1837 | 1.2503 | 6 | 89 | cellular response to leukemia inhibitory factor |
| GO:0009890 | 0.0016 | 1.7817 | 23.2214 | 38 | 1653 | negative regulation of biosynthetic process |
| GO:0060219 | 0.0016 | 15.2267 | 0.2388 | 3 | 17 | camera-type eye photoreceptor cell differentiation |
| GO:0060021 | 0.0018 | 5.061 | 1.2784 | 6 | 91 | palate development |
| GO:2000113 | 0.0018 | 1.809 | 20.9738 | 35 | 1493 | negative regulation of cellular macromolecule biosynthetic process |
| GO:0016199 | 0.0019 | 47.1947 | 0.0702 | 2 | 5 | axon midline choice point recognition |
| GO:0021778 | 0.0019 | 47.1947 | 0.0702 | 2 | 5 | oligodendrocyte cell fate specification |
| GO:0045636 | 0.0019 | 47.1947 | 0.0702 | 2 | 5 | positive regulation of melanocyte differentiation |
| GO:0021543 | 0.0019 | 3.7919 | 2.2477 | 8 | 160 | pallium development |
| GO:0030326 | 0.0019 | 4.9685 | 1.2999 | 6 | 94 | embryonic limb morphogenesis |
| GO:0051962 | 0.002 | 2.4966 | 6.3778 | 15 | 454 | positive regulation of nervous system development |
| GO:0031328 | 0.0021 | 1.7394 | 24.3874 | 39 | 1736 | positive regulation of cellular biosynthetic process |
| GO:0021884 | 0.0022 | 13.4369 | 0.2647 | 3 | 19 | forebrain neuron development |
| GO:0002089 | 0.0022 | 13.3217 | 0.2669 | 3 | 19 | lens morphogenesis in camera-type eye |
| GO:0007517 | 0.0024 | 2.6272 | 5.2399 | 13 | 373 | muscle organ development |
| GO:0006935 | 0.0025 | 2.2894 | 7.881 | 17 | 561 | chemotaxis |
| GO:0046883 | 0.0025 | 3.0777 | 3.4418 | 10 | 245 | regulation of hormone secretion |
| GO:0060411 | 0.0025 | 5.7645 | 0.9412 | 5 | 67 | cardiac septum morphogenesis |
| GO:0030324 | 0.0025 | 3.6233 | 2.346 | 8 | 167 | lung development |
| GO:0045446 | 0.0026 | 4.6739 | 1.3767 | 6 | 98 | endothelial cell differentiation |
| GO:0023019 | 0.0026 | 12.5373 | 0.281 | 3 | 20 | signal transduction involved in regulation of gene expression |
| GO:0060039 | 0.0026 | 12.5373 | 0.281 | 3 | 20 | pericardium development |
| GO:0021902 | 0.0028 | 35.3938 | 0.0843 | 2 | 6 | commitment of neuronal cell to specific neuron type in forebrain |
| GO:0030240 | 0.0028 | 35.3938 | 0.0843 | 2 | 6 | skeletal muscle thin filament assembly |
| GO:0032229 | 0.0028 | 35.3938 | 0.0843 | 2 | 6 | negative regulation of synaptic transmission, GABAergic |
| GO:0033603 | 0.0028 | 35.3938 | 0.0843 | 2 | 6 | positive regulation of dopamine secretion |
| GO:0035239 | 0.003 | 2.6798 | 4.7342 | 12 | 337 | tube morphogenesis |
| GO:0002052 | 0.003 | 11.84 | 0.295 | 3 | 21 | positive regulation of neuroblast proliferation |
| GO:0007617 | 0.003 | 11.84 | 0.295 | 3 | 21 | mating behavior |
| GO:0021516 | 0.003 | 11.84 | 0.295 | 3 | 21 | dorsal spinal cord development |
| GO:0048485 | 0.003 | 11.84 | 0.295 | 3 | 21 | sympathetic nervous system development |
| GO:0008306 | 0.003 | 5.4974 | 0.9834 | 5 | 70 | associative learning |
| GO:0048646 | 0.0032 | 1.9209 | 13.9004 | 25 | 998 | anatomical structure formation involved in morphogenesis |
| GO:0048665 | 0.0033 | 11.4141 | 0.3038 | 3 | 22 | neuron fate specification |
| GO:0050793 | 0.0033 | 2.3641 | 6.7634 | 15 | 527 | regulation of developmental process |
| GO:0048701 | 0.0033 | 7.1259 | 0.6181 | 4 | 44 | embryonic cranial skeleton morphogenesis |
| GO:0032502 | 0.0034 | 1.9383 | 14.9857 | 26 | 1368 | developmental process |
| GO:0031018 | 0.0036 | 6.9517 | 0.6322 | 4 | 45 | endocrine pancreas development |
| GO:0007631 | 0.0036 | 4.3415 | 1.475 | 6 | 105 | feeding behavior |
| GO:0003206 | 0.0037 | 6.9098 | 0.635 | 4 | 46 | cardiac chamber morphogenesis |
| GO:0021521 | 0.0039 | 28.5625 | 0.0975 | 2 | 7 | ventral spinal cord interneuron specification |
| GO:0021860 | 0.0039 | 28.3133 | 0.0983 | 2 | 7 | pyramidal neuron development |
| GO:0003002 | 0.004 | 4.255 | 1.5015 | 6 | 114 | regionalization |
| GO:0043279 | 0.0042 | 4.213 | 1.5172 | 6 | 108 | response to alkaloid |
| GO:0040012 | 0.0042 | 1.9597 | 11.9268 | 22 | 849 | regulation of locomotion |
| GO:0002067 | 0.0042 | 6.6275 | 0.6603 | 4 | 47 | glandular epithelial cell differentiation |
| GO:0001655 | 0.0043 | 2.6805 | 4.3268 | 11 | 308 | urogenital system development |
| GO:0008344 | 0.0043 | 5.0309 | 1.0677 | 5 | 76 | adult locomotory behavior |
| GO:0001708 | 0.0044 | 6.5258 | 0.6686 | 4 | 49 | cell fate specification |
| GO:0016331 | 0.0044 | 3.6412 | 2.037 | 7 | 145 | morphogenesis of embryonic epithelium |
| GO:0048596 | 0.005 | 9.6848 | 0.3512 | 3 | 25 | embryonic camera-type eye morphogenesis |
| GO:0045666 | 0.0051 | 2.6176 | 4.4251 | 11 | 315 | positive regulation of neuron differentiation |
| GO:0033860 | 0.0052 | 23.5929 | 0.1124 | 2 | 8 | regulation of NAD(P)H oxidase activity |
| GO:0045924 | 0.0052 | 23.5929 | 0.1124 | 2 | 8 | regulation of female receptivity |
| GO:0061303 | 0.0052 | 23.5929 | 0.1124 | 2 | 8 | cornea development in camera-type eye |
| GO:2000035 | 0.0052 | 23.5929 | 0.1124 | 2 | 8 | regulation of stem cell division |
| GO:0061178 | 0.0053 | 6.1941 | 0.7024 | 4 | 50 | regulation of insulin secretion involved in cellular response to glucose stimulus |
| GO:0048732 | 0.0055 | 2.3706 | 5.7738 | 13 | 411 | gland development |
| GO:0002063 | 0.0056 | 9.2632 | 0.3652 | 3 | 26 | chondrocyte development |
| GO:0002011 | 0.0057 | 6.0619 | 0.7165 | 4 | 51 | morphogenesis of an epithelial sheet |
| GO:0061053 | 0.0059 | 4.6372 | 1.1519 | 5 | 82 | somite development |
| GO:0051240 | 0.0061 | 1.8434 | 13.8661 | 24 | 1027 | positive regulation of multicellular organismal process |
| GO:0061311 | 0.0062 | 8.8767 | 0.3793 | 3 | 27 | cell surface receptor signaling pathway involved in heart development |
| GO:0019098 | 0.0065 | 20.4702 | 0.1249 | 2 | 9 | reproductive behavior |
| GO:0030198 | 0.0065 | 2.5244 | 4.5797 | 11 | 326 | extracellular matrix organization |
| GO:0003266 | 0.0066 | 20.2212 | 0.1264 | 2 | 9 | regulation of secondary heart field cardioblast proliferation |
| GO:0007614 | 0.0066 | 20.2212 | 0.1264 | 2 | 9 | short-term memory |
| GO:0046549 | 0.0066 | 20.2212 | 0.1264 | 2 | 9 | retinal cone cell development |
| GO:0046877 | 0.0066 | 20.2212 | 0.1264 | 2 | 9 | regulation of saliva secretion |
| GO:0048087 | 0.0066 | 20.2212 | 0.1264 | 2 | 9 | positive regulation of developmental pigmentation |
| GO:0048865 | 0.0066 | 20.2212 | 0.1264 | 2 | 9 | stem cell fate commitment |
| GO:0050932 | 0.0066 | 20.2212 | 0.1264 | 2 | 9 | regulation of pigment cell differentiation |
| GO:0061004 | 0.0066 | 20.2212 | 0.1264 | 2 | 9 | pattern specification involved in kidney development |
| GO:1905770 | 0.0066 | 20.2212 | 0.1264 | 2 | 9 | regulation of mesodermal cell differentiation |
| GO:0000904 | 0.0066 | 3.806 | 1.669 | 6 | 125 | cell morphogenesis involved in differentiation |
| GO:0007417 | 0.0067 | 1.9744 | 10.181 | 19 | 764 | central nervous system development |
| GO:0045927 | 0.0068 | 2.8181 | 3.3575 | 9 | 239 | positive regulation of growth |
| GO:0071805 | 0.0072 | 3.0102 | 2.7956 | 8 | 199 | potassium ion transmembrane transport |
| GO:0010719 | 0.0076 | 8.1928 | 0.4074 | 3 | 29 | negative regulation of epithelial to mesenchymal transition |
| GO:0046530 | 0.0079 | 5.4773 | 0.7867 | 4 | 56 | photoreceptor cell differentiation |
| GO:0003263 | 0.0082 | 17.6925 | 0.1405 | 2 | 10 | cardioblast proliferation |
| GO:0035878 | 0.0082 | 17.6925 | 0.1405 | 2 | 10 | nail development |
| GO:0042415 | 0.0082 | 17.6925 | 0.1405 | 2 | 10 | norepinephrine metabolic process |
| GO:0048845 | 0.0082 | 17.6925 | 0.1405 | 2 | 10 | venous blood vessel morphogenesis |
| GO:0042063 | 0.0088 | 2.699 | 3.498 | 9 | 249 | gliogenesis |
| GO:0051241 | 0.0089 | 1.7787 | 14.2908 | 24 | 1029 | negative regulation of multicellular organismal process |
| GO:0045596 | 0.0092 | 2.0324 | 8.2781 | 16 | 601 | negative regulation of cell differentiation |
| GO:0001569 | 0.0092 | 7.6067 | 0.4355 | 3 | 31 | branching involved in blood vessel morphogenesis |
| GO:0003209 | 0.0092 | 7.6067 | 0.4355 | 3 | 31 | cardiac atrium morphogenesis |
| GO:0072175 | 0.0094 | 3.5179 | 1.7982 | 6 | 128 | epithelial tube formation |
| GO:0051270 | 0.0097 | 1.8358 | 12.0673 | 21 | 859 | regulation of cellular component movement |
| GO:0009914 | 0.0099 | 2.494 | 4.2004 | 10 | 299 | hormone transport |
| GO:0003157 | 0.0099 | 15.7257 | 0.1545 | 2 | 11 | endocardium development |
| GO:0009886 | 0.0099 | 15.7257 | 0.1545 | 2 | 11 | post-embryonic animal morphogenesis |
| GOMFID | Pvalue | OddsRatio | ExpCount | Count | Size | Term |
| GO:0007156 | 9e-04 | 4.8955 | 1.5359 | 7 | 152 | homophilic cell adhesion via plasma membrane adhesion molecules |
| GO:0061844 | 0.0017 | 8.5207 | 0.5153 | 4 | 51 | antimicrobial humoral immune response mediated by antimicrobial peptide |
| GO:0098660 | 0.0023 | 2.3194 | 7.8817 | 17 | 780 | inorganic ion transmembrane transport |
| GO:0006376 | 0.0025 | 12.455 | 0.2728 | 3 | 27 | mRNA splice site selection |
| GO:0016339 | 0.0028 | 11.956 | 0.2829 | 3 | 28 | calcium-dependent cell-cell adhesion via plasma membrane cell adhesion molecules |
| GO:0006813 | 0.0028 | 3.5623 | 2.3847 | 8 | 236 | potassium ion transport |
| GO:0050684 | 0.0046 | 4.9217 | 1.0812 | 5 | 107 | regulation of mRNA processing |
| GO:0006812 | 0.005 | 2.0129 | 10.6807 | 20 | 1057 | cation transport |
| GO:0019731 | 0.0066 | 8.5347 | 0.384 | 3 | 38 | antibacterial humoral response |
| GO:0050832 | 0.0071 | 8.2971 | 0.3941 | 3 | 39 | defense response to fungus |
| GO:0070986 | 0.0074 | 18.0191 | 0.1314 | 2 | 13 | left/right axis specification |
| GO:0043269 | 0.008 | 2.2702 | 6.0628 | 13 | 600 | regulation of ion transport |
| GO:0051852 | 0.0085 | 16.5165 | 0.1415 | 2 | 14 | disruption by host of symbiont cells |
| GO:0007269 | 0.01 | 4.0429 | 1.3035 | 5 | 129 | neurotransmitter secretion |
| GOMFID | Pvalue | OddsRatio | ExpCount | Count | Size | Term |
| GO:0002263 | 0 | 5.2382 | 7.4011 | 32 | 660 | cell activation involved in immune response |
| GO:0045087 | 0 | 3.8773 | 9.3972 | 31 | 838 | innate immune response |
| GO:0050900 | 0 | 5.3065 | 4.5528 | 21 | 406 | leukocyte migration |
| GO:0002285 | 0 | 8.6781 | 1.7269 | 13 | 154 | lymphocyte activation involved in immune response |
| GO:0045321 | 0 | 4.1829 | 6.9465 | 25 | 664 | leukocyte activation |
| GO:0002275 | 0 | 4.3023 | 5.82 | 22 | 519 | myeloid cell activation involved in immune response |
| GO:0002444 | 0 | 3.9342 | 5.7034 | 20 | 514 | myeloid leukocyte mediated immunity |
| GO:0090026 | 0 | 34.8435 | 0.2018 | 5 | 18 | positive regulation of monocyte chemotaxis |
| GO:0032940 | 0 | 2.6134 | 15.419 | 35 | 1375 | secretion by cell |
| GO:0002684 | 0 | 5.168 | 2.7951 | 13 | 262 | positive regulation of immune system process |
| GO:0043312 | 0 | 3.8131 | 5.2368 | 18 | 467 | neutrophil degranulation |
| GO:0042119 | 0 | 3.7276 | 5.349 | 18 | 477 | neutrophil activation |
| GO:0007166 | 0 | 2.1654 | 28.7248 | 52 | 2600 | cell surface receptor signaling pathway |
| GO:0060326 | 0 | 4.9007 | 2.9268 | 13 | 261 | cell chemotaxis |
| GO:0002322 | 0 | 134.4637 | 0.0561 | 3 | 5 | B cell proliferation involved in immune response |
| GO:0050670 | 0 | 5.4561 | 2.2203 | 11 | 198 | regulation of lymphocyte proliferation |
| GO:0045055 | 0 | 3.0791 | 7.9394 | 22 | 708 | regulated exocytosis |
| GO:0071222 | 0 | 6.0005 | 1.8391 | 10 | 164 | cellular response to lipopolysaccharide |
| GO:0032946 | 0 | 6.7355 | 1.4802 | 9 | 132 | positive regulation of mononuclear cell proliferation |
| GO:0042330 | 0 | 3.3348 | 6.2909 | 19 | 561 | taxis |
| GO:0070663 | 0 | 5.1494 | 2.3437 | 11 | 209 | regulation of leukocyte proliferation |
| GO:0022610 | 0 | 2.4427 | 14.8134 | 32 | 1321 | biological adhesion |
| GO:1903039 | 0 | 5.0462 | 2.3885 | 11 | 213 | positive regulation of leukocyte cell-cell adhesion |
| GO:0070098 | 0 | 8.7534 | 0.8971 | 7 | 80 | chemokine-mediated signaling pathway |
| GO:0050867 | 0 | 4.1946 | 3.3866 | 13 | 302 | positive regulation of cell activation |
| GO:0051251 | 0 | 4.4972 | 2.9156 | 12 | 260 | positive regulation of lymphocyte activation |
| GO:0046651 | 0 | 10.846 | 0.6293 | 6 | 59 | lymphocyte proliferation |
| GO:0050863 | 0 | 4.1077 | 3.4539 | 13 | 308 | regulation of T cell activation |
| GO:0030593 | 1e-04 | 7.8849 | 0.9868 | 7 | 88 | neutrophil chemotaxis |
| GO:0071216 | 1e-04 | 5.0967 | 2.1418 | 10 | 191 | cellular response to biotic stimulus |
| GO:0097530 | 1e-04 | 6.4263 | 1.3681 | 8 | 122 | granulocyte migration |
| GO:0070661 | 1e-04 | 9.5697 | 0.7045 | 6 | 66 | leukocyte proliferation |
| GO:0043615 | 1e-04 | 53.7754 | 0.0897 | 3 | 8 | astrocyte cell migration |
| GO:0071675 | 1e-04 | 12.5643 | 0.4598 | 5 | 41 | regulation of mononuclear cell migration |
| GO:0045785 | 1e-04 | 3.5907 | 4.2388 | 14 | 378 | positive regulation of cell adhesion |
| GO:2000458 | 1e-04 | Inf | 0.0224 | 2 | 2 | regulation of astrocyte chemotaxis |
| GO:0035589 | 2e-04 | 38.4062 | 0.1121 | 3 | 10 | G-protein coupled purinergic nucleotide receptor signaling pathway |
| GO:0071346 | 2e-04 | 5.5437 | 1.5699 | 8 | 140 | cellular response to interferon-gamma |
| GO:0022407 | 2e-04 | 3.3109 | 4.5752 | 14 | 408 | regulation of cell-cell adhesion |
| GO:0002521 | 2e-04 | 3.1421 | 5.1696 | 15 | 461 | leukocyte differentiation |
| GO:0030183 | 3e-04 | 6.1323 | 1.2447 | 7 | 111 | B cell differentiation |
| GO:0050792 | 3e-04 | 4.6382 | 2.097 | 9 | 187 | regulation of viral process |
| GO:0032729 | 3e-04 | 9.7234 | 0.577 | 5 | 52 | positive regulation of interferon-gamma production |
| GO:0046631 | 3e-04 | 6.0158 | 1.2672 | 7 | 113 | alpha-beta T cell activation |
| GO:0051707 | 3e-04 | 2.5092 | 9.128 | 21 | 814 | response to other organism |
| GO:0001817 | 4e-04 | 3.1415 | 4.8156 | 14 | 445 | regulation of cytokine production |
| GO:0007194 | 5e-04 | 11.9985 | 0.3813 | 4 | 34 | negative regulation of adenylate cyclase activity |
| GO:0002292 | 6e-04 | 8.2142 | 0.6728 | 5 | 60 | T cell differentiation involved in immune response |
| GO:0002313 | 6e-04 | 22.3966 | 0.1682 | 3 | 15 | mature B cell differentiation involved in immune response |
| GO:0002440 | 6e-04 | 4.5945 | 1.8727 | 8 | 167 | production of molecular mediator of immune response |
| GO:0002694 | 6e-04 | 3.4915 | 3.3819 | 11 | 309 | regulation of leukocyte activation |
| GO:0002819 | 7e-04 | 5.1789 | 1.4578 | 7 | 130 | regulation of adaptive immune response |
| GO:0006959 | 8e-04 | 3.9235 | 2.4558 | 9 | 219 | humoral immune response |
| GO:0006955 | 0.001 | 4.2796 | 2.019 | 8 | 244 | immune response |
| GO:0050715 | 0.0011 | 5.6101 | 1.154 | 6 | 104 | positive regulation of cytokine secretion |
| GO:0042107 | 0.0012 | 5.4921 | 1.1774 | 6 | 105 | cytokine metabolic process |
| GO:0046641 | 0.0012 | 16.7933 | 0.2131 | 3 | 19 | positive regulation of alpha-beta T cell proliferation |
| GO:0002237 | 0.0012 | 3.2025 | 3.6669 | 11 | 327 | response to molecule of bacterial origin |
| GO:0043308 | 0.0012 | 59.4259 | 0.0561 | 2 | 5 | eosinophil degranulation |
| GO:1901078 | 0.0012 | 59.4259 | 0.0561 | 2 | 5 | negative regulation of relaxation of muscle |
| GO:0002688 | 0.0012 | 5.4368 | 1.1887 | 6 | 106 | regulation of leukocyte chemotaxis |
| GO:0006954 | 0.0013 | 2.621 | 6.1379 | 15 | 559 | inflammatory response |
| GO:0002548 | 0.0013 | 9.2457 | 0.4804 | 4 | 44 | monocyte chemotaxis |
| GO:1903901 | 0.0014 | 6.6384 | 0.8186 | 5 | 73 | negative regulation of viral life cycle |
| GO:0070374 | 0.0016 | 3.9209 | 2.1755 | 8 | 194 | positive regulation of ERK1 and ERK2 cascade |
| GO:0006950 | 0.0016 | 1.6485 | 40.4258 | 58 | 3605 | response to stress |
| GO:0023052 | 0.0016 | 1.574 | 68.1014 | 88 | 6073 | signaling |
| GO:0010818 | 0.0016 | 14.9255 | 0.2355 | 3 | 21 | T cell chemotaxis |
| GO:0042102 | 0.0016 | 6.3697 | 0.8502 | 5 | 77 | positive regulation of T cell proliferation |
| GO:0002824 | 0.0016 | 6.3567 | 0.8522 | 5 | 76 | positive regulation of adaptive immune response based on somatic recombination of immune receptors built from immunoglobulin superfamily domains |
| GO:0045058 | 0.0017 | 8.5639 | 0.5158 | 4 | 46 | T cell selection |
| GO:0007154 | 0.0018 | 1.5649 | 68.3481 | 88 | 6095 | cell communication |
| GO:0043307 | 0.0018 | 44.5667 | 0.0673 | 2 | 6 | eosinophil activation |
| GO:0070383 | 0.0018 | 44.5667 | 0.0673 | 2 | 6 | DNA cytosine deamination |
| GO:0002703 | 0.002 | 4.2395 | 1.7606 | 7 | 157 | regulation of leukocyte mediated immunity |
| GO:0030803 | 0.002 | 8.1736 | 0.5383 | 4 | 48 | negative regulation of cyclic nucleotide biosynthetic process |
| GO:0032663 | 0.0022 | 7.9915 | 0.5495 | 4 | 49 | regulation of interleukin-2 production |
| GO:0002250 | 0.0022 | 4.8028 | 1.3354 | 6 | 125 | adaptive immune response |
| GO:0043901 | 0.0023 | 4.1283 | 1.8054 | 7 | 161 | negative regulation of multi-organism process |
| GO:0030815 | 0.0024 | 7.8173 | 0.5607 | 4 | 50 | negative regulation of cAMP metabolic process |
| GO:0016192 | 0.0024 | 1.8189 | 19.9045 | 33 | 1775 | vesicle-mediated transport |
| GO:0071310 | 0.0025 | 1.718 | 26.5094 | 41 | 2364 | cellular response to organic substance |
| GO:0035627 | 0.0025 | 35.6511 | 0.0785 | 2 | 7 | ceramide transport |
| GO:0045869 | 0.0025 | 35.6511 | 0.0785 | 2 | 7 | negative regulation of single stranded viral RNA replication via double stranded DNA intermediate |
| GO:0048007 | 0.0025 | 35.6511 | 0.0785 | 2 | 7 | antigen processing and presentation, exogenous lipid antigen via MHC class Ib |
| GO:1900372 | 0.0025 | 7.6505 | 0.5719 | 4 | 51 | negative regulation of purine nucleotide biosynthetic process |
| GO:0002449 | 0.0027 | 3.5887 | 2.3661 | 8 | 211 | lymphocyte mediated immunity |
| GO:0002407 | 0.0027 | 12.2087 | 0.2803 | 3 | 25 | dendritic cell chemotaxis |
| GO:0045730 | 0.003 | 11.6772 | 0.2916 | 3 | 26 | respiratory burst |
| GO:0048534 | 0.0031 | 2.1426 | 9.4981 | 19 | 847 | hematopoietic or lymphoid organ development |
| GO:0050921 | 0.0032 | 4.4503 | 1.4354 | 6 | 128 | positive regulation of chemotaxis |
| GO:0006909 | 0.0033 | 3.4509 | 2.4558 | 8 | 219 | phagocytosis |
| GO:0002887 | 0.0033 | 29.7074 | 0.0897 | 2 | 8 | negative regulation of myeloid leukocyte mediated immunity |
| GO:0031666 | 0.0033 | 29.7074 | 0.0897 | 2 | 8 | positive regulation of lipopolysaccharide-mediated signaling pathway |
| GO:1902715 | 0.0033 | 29.7074 | 0.0897 | 2 | 8 | positive regulation of interferon-gamma secretion |
| GO:0071347 | 0.0034 | 5.3051 | 1.0092 | 5 | 90 | cellular response to interleukin-1 |
| GO:0006171 | 0.0035 | 4.3779 | 1.4578 | 6 | 130 | cAMP biosynthetic process |
| GO:0050778 | 0.0036 | 2.2687 | 7.5132 | 16 | 670 | positive regulation of immune response |
| GO:0035587 | 0.0037 | 10.7417 | 0.314 | 3 | 28 | purinergic receptor signaling pathway |
| GO:1901137 | 0.004 | 2.187 | 8.287 | 17 | 739 | carbohydrate derivative biosynthetic process |
| GO:0002460 | 0.004 | 4.2443 | 1.5011 | 6 | 137 | adaptive immune response based on somatic recombination of immune receptors built from immunoglobulin superfamily domains |
| GO:0032365 | 0.0041 | 10.3279 | 0.3252 | 3 | 29 | intracellular lipid transport |
| GO:2000403 | 0.0041 | 10.3279 | 0.3252 | 3 | 29 | positive regulation of lymphocyte migration |
| GO:0031279 | 0.0041 | 5.0654 | 1.0541 | 5 | 94 | regulation of cyclase activity |
| GO:0009972 | 0.0043 | 25.4619 | 0.1009 | 2 | 9 | cytidine deamination |
| GO:0032621 | 0.0043 | 25.4619 | 0.1009 | 2 | 9 | interleukin-18 production |
| GO:0043301 | 0.0043 | 25.4619 | 0.1009 | 2 | 9 | negative regulation of leukocyte degranulation |
| GO:0046087 | 0.0043 | 25.4619 | 0.1009 | 2 | 9 | cytidine metabolic process |
| GO:0051339 | 0.0043 | 5.0088 | 1.0653 | 5 | 95 | regulation of lyase activity |
| GO:0048870 | 0.0045 | 1.8355 | 15.9012 | 27 | 1418 | cell motility |
| GO:0042116 | 0.0049 | 6.3044 | 0.684 | 4 | 61 | macrophage activation |
| GO:0031347 | 0.0053 | 2.175 | 7.816 | 16 | 697 | regulation of defense response |
| GO:0002475 | 0.0053 | 22.2778 | 0.1121 | 2 | 10 | antigen processing and presentation via MHC class Ib |
| GO:2000551 | 0.0053 | 22.2778 | 0.1121 | 2 | 10 | regulation of T-helper 2 cell cytokine production |
| GO:0034612 | 0.0054 | 2.9296 | 3.2408 | 9 | 289 | response to tumor necrosis factor |
| GO:0032101 | 0.0054 | 2.1683 | 7.8384 | 16 | 699 | regulation of response to external stimulus |
| GO:0032760 | 0.0054 | 6.0899 | 0.7065 | 4 | 63 | positive regulation of tumor necrosis factor production |
| GO:0002369 | 0.0059 | 8.9486 | 0.3701 | 3 | 33 | T cell cytokine production |
| GO:0072529 | 0.0059 | 8.9486 | 0.3701 | 3 | 33 | pyrimidine-containing compound catabolic process |
| GO:0016553 | 0.0064 | 19.8012 | 0.1234 | 2 | 11 | base conversion or substitution editing |
| GO:0032754 | 0.0064 | 19.8012 | 0.1234 | 2 | 11 | positive regulation of interleukin-5 production |
| GO:0044546 | 0.0064 | 19.8012 | 0.1234 | 2 | 11 | NLRP3 inflammasome complex assembly |
| GO:0046133 | 0.0064 | 19.8012 | 0.1234 | 2 | 11 | pyrimidine ribonucleoside catabolic process |
| GO:0046348 | 0.0064 | 19.8012 | 0.1234 | 2 | 11 | amino sugar catabolic process |
| GO:0072672 | 0.0064 | 19.8012 | 0.1234 | 2 | 11 | neutrophil extravasation |
| GO:0002695 | 0.0067 | 3.7917 | 1.6709 | 6 | 149 | negative regulation of leukocyte activation |
| GO:0031295 | 0.0068 | 5.7018 | 0.7513 | 4 | 67 | T cell costimulation |
| GO:0002793 | 0.007 | 3.0284 | 2.781 | 8 | 248 | positive regulation of peptide secretion |
| GO:0009187 | 0.0072 | 3.3033 | 2.2315 | 7 | 199 | cyclic nucleotide metabolic process |
| GO:0045086 | 0.0077 | 17.82 | 0.1346 | 2 | 12 | positive regulation of interleukin-2 biosynthetic process |
| GO:0048247 | 0.0078 | 8.0194 | 0.4086 | 3 | 37 | lymphocyte chemotaxis |
| GO:0050729 | 0.008 | 4.2892 | 1.2335 | 5 | 110 | positive regulation of inflammatory response |
| GO:0042092 | 0.0081 | 7.8939 | 0.4149 | 3 | 37 | type 2 immune response |
| GO:0061028 | 0.0081 | 7.8939 | 0.4149 | 3 | 37 | establishment of endothelial barrier |
| GO:1903555 | 0.0086 | 4.2085 | 1.2559 | 5 | 112 | regulation of tumor necrosis factor superfamily cytokine production |
| GO:0006047 | 0.009 | 16.199 | 0.1458 | 2 | 13 | UDP-N-acetylglucosamine metabolic process |
| GO:0010623 | 0.009 | 16.199 | 0.1458 | 2 | 13 | programmed cell death involved in cell development |
| GO:0030335 | 0.009 | 2.4113 | 4.7995 | 11 | 428 | positive regulation of cell migration |
| GO:0045980 | 0.0091 | 5.204 | 0.8186 | 4 | 73 | negative regulation of nucleotide metabolic process |
| GO:0051716 | 0.0093 | 1.4521 | 71.2815 | 87 | 6647 | cellular response to stimulus |
| GO:0045807 | 0.0096 | 4.093 | 1.2896 | 5 | 115 | positive regulation of endocytosis |
| GO:0048584 | 0.0099 | 1.777 | 14.5197 | 24 | 1361 | positive regulation of response to stimulus |
| GOMFID | Pvalue | OddsRatio | ExpCount | Count | Size | Term |
| GO:0002263 | 0 | 4.9961 | 7.1978 | 30 | 660 | cell activation involved in immune response |
| GO:0045087 | 0 | 3.8505 | 9.139 | 30 | 838 | innate immune response |
| GO:0045321 | 0 | 4.0979 | 6.7781 | 24 | 664 | leukocyte activation |
| GO:0002285 | 0 | 8.149 | 1.6795 | 12 | 154 | lymphocyte activation involved in immune response |
| GO:0090026 | 0 | 35.8676 | 0.1963 | 5 | 18 | positive regulation of monocyte chemotaxis |
| GO:0002275 | 0 | 3.8822 | 5.4708 | 19 | 507 | myeloid cell activation involved in immune response |
| GO:0002322 | 0 | 138.3707 | 0.0545 | 3 | 5 | B cell proliferation involved in immune response |
| GO:0071222 | 0 | 6.1821 | 1.7885 | 10 | 164 | cellular response to lipopolysaccharide |
| GO:0007166 | 0 | 2.1166 | 28.6603 | 51 | 2628 | cell surface receptor signaling pathway |
| GO:0002684 | 0 | 4.9135 | 2.6941 | 12 | 262 | positive regulation of immune system process |
| GO:0097529 | 0 | 12.1113 | 0.5699 | 6 | 54 | myeloid leukocyte migration |
| GO:1903039 | 0 | 5.1998 | 2.3229 | 11 | 213 | positive regulation of leukocyte cell-cell adhesion |
| GO:0070098 | 0 | 9.0137 | 0.8725 | 7 | 80 | chemokine-mediated signaling pathway |
| GO:0046651 | 0 | 11.1182 | 0.6146 | 6 | 59 | lymphocyte proliferation |
| GO:0022610 | 0 | 2.4299 | 14.4065 | 31 | 1321 | biological adhesion |
| GO:0002444 | 0 | 3.3664 | 5.5449 | 17 | 514 | myeloid leukocyte mediated immunity |
| GO:0071216 | 0 | 5.2509 | 2.083 | 10 | 191 | cellular response to biotic stimulus |
| GO:0070661 | 1e-04 | 9.8099 | 0.688 | 6 | 66 | leukocyte proliferation |
| GO:0050670 | 1e-04 | 5.0532 | 2.1593 | 10 | 198 | regulation of lymphocyte proliferation |
| GO:0042119 | 1e-04 | 3.3612 | 5.202 | 16 | 477 | neutrophil activation |
| GO:0045785 | 1e-04 | 3.702 | 4.1224 | 14 | 378 | positive regulation of cell adhesion |
| GO:0071675 | 1e-04 | 12.9336 | 0.4471 | 5 | 41 | regulation of mononuclear cell migration |
| GO:0032940 | 1e-04 | 2.3238 | 14.9954 | 31 | 1375 | secretion by cell |
| GO:0032946 | 1e-04 | 6.0809 | 1.4396 | 8 | 132 | positive regulation of mononuclear cell proliferation |
| GO:0070663 | 1e-04 | 4.7706 | 2.2793 | 10 | 209 | regulation of leukocyte proliferation |
| GO:0050867 | 1e-04 | 3.9531 | 3.2935 | 12 | 302 | positive regulation of cell activation |
| GO:0034097 | 1e-04 | 2.5248 | 10.5022 | 24 | 963 | response to cytokine |
| GO:0051251 | 1e-04 | 4.2058 | 2.8355 | 11 | 260 | positive regulation of lymphocyte activation |
| GO:0022407 | 2e-04 | 3.4136 | 4.4495 | 14 | 408 | regulation of cell-cell adhesion |
| GO:0030098 | 2e-04 | 3.7677 | 3.4462 | 12 | 316 | lymphocyte differentiation |
| GO:0043312 | 2e-04 | 3.1959 | 5.093 | 15 | 467 | neutrophil degranulation |
| GO:0032729 | 2e-04 | 10.0125 | 0.561 | 5 | 52 | positive regulation of interferon-gamma production |
| GO:0001817 | 3e-04 | 2.9704 | 5.8483 | 16 | 547 | regulation of cytokine production |
| GO:0045055 | 3e-04 | 2.6815 | 7.7213 | 19 | 708 | regulated exocytosis |
| GO:0097530 | 4e-04 | 5.7067 | 1.3305 | 7 | 122 | granulocyte migration |
| GO:0030593 | 4e-04 | 6.834 | 0.9597 | 6 | 88 | neutrophil chemotaxis |
| GO:0007194 | 5e-04 | 12.3491 | 0.3708 | 4 | 34 | negative regulation of adenylate cyclase activity |
| GO:0002440 | 5e-04 | 4.7319 | 1.8213 | 8 | 167 | production of molecular mediator of immune response |
| GO:0002819 | 6e-04 | 5.3329 | 1.4177 | 7 | 130 | regulation of adaptive immune response |
| GO:0051707 | 6e-04 | 2.4481 | 8.8773 | 20 | 814 | response to other organism |
| GO:0071346 | 9e-04 | 4.9288 | 1.5268 | 7 | 140 | cellular response to interferon-gamma |
| GO:0023052 | 9e-04 | 1.6257 | 66.2305 | 87 | 6073 | signaling |
| GO:0050863 | 9e-04 | 3.8779 | 2.4846 | 9 | 232 | regulation of T cell activation |
| GO:0006955 | 9e-04 | 4.3207 | 2.0016 | 8 | 246 | immune response |
| GO:0050715 | 9e-04 | 5.7779 | 1.1219 | 6 | 104 | positive regulation of cytokine secretion |
| GO:0002237 | 9e-04 | 3.3 | 3.5662 | 11 | 327 | response to molecule of bacterial origin |
| GO:0006954 | 0.001 | 2.7054 | 5.9645 | 15 | 559 | inflammatory response |
| GO:0007154 | 0.001 | 1.6162 | 66.4704 | 87 | 6095 | cell communication |
| GO:0042107 | 0.001 | 5.6544 | 1.1451 | 6 | 105 | cytokine metabolic process |
| GO:0050778 | 0.0011 | 2.5057 | 7.3068 | 17 | 670 | positive regulation of immune response |
| GO:0002688 | 0.0011 | 5.5975 | 1.156 | 6 | 106 | regulation of leukocyte chemotaxis |
| GO:0002335 | 0.0011 | 17.2812 | 0.2072 | 3 | 19 | mature B cell differentiation |
| GO:0046641 | 0.0011 | 17.2812 | 0.2072 | 3 | 19 | positive regulation of alpha-beta T cell proliferation |
| GO:0043308 | 0.0012 | 61.1429 | 0.0545 | 2 | 5 | eosinophil degranulation |
| GO:1901078 | 0.0012 | 61.1429 | 0.0545 | 2 | 5 | negative regulation of relaxation of muscle |
| GO:1903901 | 0.0012 | 6.8335 | 0.7961 | 5 | 73 | negative regulation of viral life cycle |
| GO:0002683 | 0.0014 | 3.6273 | 2.6478 | 9 | 249 | negative regulation of immune system process |
| GO:0042102 | 0.0014 | 6.5602 | 0.8265 | 5 | 77 | positive regulation of T cell proliferation |
| GO:0002824 | 0.0014 | 6.5436 | 0.8288 | 5 | 76 | positive regulation of adaptive immune response based on somatic recombination of immune receptors built from immunoglobulin superfamily domains |
| GO:0045058 | 0.0016 | 8.8142 | 0.5017 | 4 | 46 | T cell selection |
| GO:0031347 | 0.0016 | 2.402 | 7.6013 | 17 | 697 | regulation of defense response |
| GO:0002520 | 0.0017 | 2.2259 | 9.6952 | 20 | 889 | immune system development |
| GO:0072678 | 0.0017 | 8.6087 | 0.5126 | 4 | 47 | T cell migration |
| GO:0040011 | 0.0017 | 1.9008 | 17.929 | 31 | 1644 | locomotion |
| GO:0043307 | 0.0017 | 45.8543 | 0.0654 | 2 | 6 | eosinophil activation |
| GO:0070383 | 0.0017 | 45.8543 | 0.0654 | 2 | 6 | DNA cytosine deamination |
| GO:0002694 | 0.0018 | 3.2429 | 3.2858 | 10 | 309 | regulation of leukocyte activation |
| GO:0030803 | 0.0018 | 8.4125 | 0.5235 | 4 | 48 | negative regulation of cyclic nucleotide biosynthetic process |
| GO:0043901 | 0.0019 | 4.2511 | 1.7558 | 7 | 161 | negative regulation of multi-organism process |
| GO:0032663 | 0.002 | 8.225 | 0.5344 | 4 | 49 | regulation of interleukin-2 production |
| GO:0030815 | 0.0021 | 8.0457 | 0.5453 | 4 | 50 | negative regulation of cAMP metabolic process |
| GO:1900372 | 0.0023 | 7.8741 | 0.5562 | 4 | 51 | negative regulation of purine nucleotide biosynthetic process |
| GO:0006935 | 0.0023 | 2.7804 | 4.5984 | 12 | 433 | chemotaxis |
| GO:0035627 | 0.0024 | 36.6811 | 0.0763 | 2 | 7 | ceramide transport |
| GO:0045869 | 0.0024 | 36.6811 | 0.0763 | 2 | 7 | negative regulation of single stranded viral RNA replication via double stranded DNA intermediate |
| GO:0048007 | 0.0024 | 36.6811 | 0.0763 | 2 | 7 | antigen processing and presentation, exogenous lipid antigen via MHC class Ib |
| GO:0042113 | 0.0027 | 3.5886 | 2.3665 | 8 | 217 | B cell activation |
| GO:0045730 | 0.0028 | 12.0165 | 0.2835 | 3 | 26 | respiratory burst |
| GO:0050921 | 0.0028 | 4.5818 | 1.3959 | 6 | 128 | positive regulation of chemotaxis |
| GO:0006909 | 0.0028 | 3.5541 | 2.3884 | 8 | 219 | phagocytosis |
| GO:0006959 | 0.0028 | 3.5541 | 2.3884 | 8 | 219 | humoral immune response |
| GO:0048583 | 0.0029 | 1.6729 | 31.9906 | 47 | 3086 | regulation of response to stimulus |
| GO:0006171 | 0.003 | 4.5074 | 1.4177 | 6 | 130 | cAMP biosynthetic process |
| GO:0030097 | 0.0031 | 2.193 | 8.79 | 18 | 806 | hemopoiesis |
| GO:0002887 | 0.0032 | 30.5657 | 0.0872 | 2 | 8 | negative regulation of myeloid leukocyte mediated immunity |
| GO:0031666 | 0.0032 | 30.5657 | 0.0872 | 2 | 8 | positive regulation of lipopolysaccharide-mediated signaling pathway |
| GO:0043615 | 0.0032 | 30.5657 | 0.0872 | 2 | 8 | astrocyte cell migration |
| GO:1902715 | 0.0032 | 30.5657 | 0.0872 | 2 | 8 | positive regulation of interferon-gamma secretion |
| GO:0042110 | 0.0033 | 4.4277 | 1.442 | 6 | 140 | T cell activation |
| GO:0002697 | 0.0035 | 2.9347 | 3.6098 | 10 | 331 | regulation of immune effector process |
| GO:0031279 | 0.0037 | 5.2143 | 1.0251 | 5 | 94 | regulation of cyclase activity |
| GO:0048247 | 0.0037 | 6.8504 | 0.6325 | 4 | 58 | lymphocyte chemotaxis |
| GO:2000403 | 0.0038 | 10.628 | 0.3163 | 3 | 29 | positive regulation of lymphocyte migration |
| GO:0006950 | 0.0038 | 1.5878 | 39.3152 | 55 | 3605 | response to stress |
| GO:0051339 | 0.0038 | 5.156 | 1.036 | 5 | 95 | regulation of lyase activity |
| GO:0009972 | 0.004 | 26.1976 | 0.0982 | 2 | 9 | cytidine deamination |
| GO:0032621 | 0.004 | 26.1976 | 0.0982 | 2 | 9 | interleukin-18 production |
| GO:0043301 | 0.004 | 26.1976 | 0.0982 | 2 | 9 | negative regulation of leukocyte degranulation |
| GO:0046087 | 0.004 | 26.1976 | 0.0982 | 2 | 9 | cytidine metabolic process |
| GO:0030595 | 0.0041 | 6.6316 | 0.6511 | 4 | 62 | leukocyte chemotaxis |
| GO:0002292 | 0.0041 | 6.6049 | 0.6543 | 4 | 60 | T cell differentiation involved in immune response |
| GO:0032101 | 0.0042 | 2.2364 | 7.6231 | 16 | 699 | regulation of response to external stimulus |
| GO:0050792 | 0.0045 | 3.6311 | 2.0394 | 7 | 187 | regulation of viral process |
| GO:0051241 | 0.0047 | 1.9844 | 11.3575 | 21 | 1053 | negative regulation of multicellular organismal process |
| GO:0032760 | 0.0049 | 6.2679 | 0.6871 | 4 | 63 | positive regulation of tumor necrosis factor production |
| GO:0002475 | 0.005 | 22.9214 | 0.1091 | 2 | 10 | antigen processing and presentation via MHC class Ib |
| GO:0035589 | 0.005 | 22.9214 | 0.1091 | 2 | 10 | G-protein coupled purinergic nucleotide receptor signaling pathway |
| GO:2000551 | 0.005 | 22.9214 | 0.1091 | 2 | 10 | regulation of T-helper 2 cell cytokine production |
| GO:0016192 | 0.0055 | 1.7421 | 19.3577 | 31 | 1775 | vesicle-mediated transport |
| GO:0002369 | 0.0055 | 9.2086 | 0.3599 | 3 | 33 | T cell cytokine production |
| GO:0002695 | 0.0059 | 3.9038 | 1.625 | 6 | 149 | negative regulation of leukocyte activation |
| GO:0002793 | 0.0059 | 3.1189 | 2.7046 | 8 | 248 | positive regulation of peptide secretion |
| GO:0016553 | 0.0061 | 20.3733 | 0.12 | 2 | 11 | base conversion or substitution editing |
| GO:0032754 | 0.0061 | 20.3733 | 0.12 | 2 | 11 | positive regulation of interleukin-5 production |
| GO:0044546 | 0.0061 | 20.3733 | 0.12 | 2 | 11 | NLRP3 inflammasome complex assembly |
| GO:0046133 | 0.0061 | 20.3733 | 0.12 | 2 | 11 | pyrimidine ribonucleoside catabolic process |
| GO:0046348 | 0.0061 | 20.3733 | 0.12 | 2 | 11 | amino sugar catabolic process |
| GO:0072672 | 0.0061 | 20.3733 | 0.12 | 2 | 11 | neutrophil extravasation |
| GO:0031295 | 0.0061 | 5.8684 | 0.7307 | 4 | 67 | T cell costimulation |
| GO:0032637 | 0.0061 | 5.8684 | 0.7307 | 4 | 67 | interleukin-8 production |
| GO:0009187 | 0.0062 | 3.4016 | 2.1702 | 7 | 199 | cyclic nucleotide metabolic process |
| GO:0050729 | 0.0071 | 4.4153 | 1.1996 | 5 | 110 | positive regulation of inflammatory response |
| GO:0002281 | 0.0073 | 18.3349 | 0.1309 | 2 | 12 | macrophage activation involved in immune response |
| GO:0045086 | 0.0073 | 18.3349 | 0.1309 | 2 | 12 | positive regulation of interleukin-2 biosynthetic process |
| GO:1900029 | 0.0073 | 18.3349 | 0.1309 | 2 | 12 | positive regulation of ruffle assembly |
| GO:0030335 | 0.0074 | 2.4847 | 4.6677 | 11 | 428 | positive regulation of cell migration |
| GO:0002429 | 0.0081 | 2.7386 | 3.4571 | 9 | 317 | immune response-activating cell surface receptor signaling pathway |
| GO:0071310 | 0.0081 | 1.6134 | 25.7811 | 38 | 2364 | cellular response to organic substance |
| GO:0002460 | 0.0081 | 4.2629 | 1.2401 | 5 | 117 | adaptive immune response based on somatic recombination of immune receptors built from immunoglobulin superfamily domains |
| GO:0045980 | 0.0083 | 5.3561 | 0.7961 | 4 | 73 | negative regulation of nucleotide metabolic process |
| GO:0006047 | 0.0085 | 16.667 | 0.1418 | 2 | 13 | UDP-N-acetylglucosamine metabolic process |
| GO:0010623 | 0.0085 | 16.667 | 0.1418 | 2 | 13 | programmed cell death involved in cell development |
| GO:0045807 | 0.0085 | 4.2133 | 1.2542 | 5 | 115 | positive regulation of endocytosis |
| GO:0042592 | 0.0087 | 1.7202 | 17.5473 | 28 | 1609 | homeostatic process |
| GO:0050896 | 0.009 | 1.7932 | 19.9925 | 30 | 2547 | response to stimulus |
| GO:0071674 | 0.0093 | 7.4645 | 0.4356 | 3 | 41 | mononuclear cell migration |
| GO:0042088 | 0.0094 | 7.4632 | 0.4362 | 3 | 40 | T-helper 1 type immune response |
| GO:0002706 | 0.0095 | 4.1006 | 1.2869 | 5 | 118 | regulation of lymphocyte mediated immunity |
| GO:0046634 | 0.0095 | 5.132 | 0.8288 | 4 | 76 | regulation of alpha-beta T cell activation |
| GO:0002250 | 0.0098 | 4.0686 | 1.2963 | 5 | 125 | adaptive immune response |
| GO:0002693 | 0.0099 | 15.2771 | 0.1527 | 2 | 14 | positive regulation of cellular extravasation |
| GO:0002829 | 0.0099 | 15.2771 | 0.1527 | 2 | 14 | negative regulation of type 2 immune response |
| GOMFID | Pvalue | OddsRatio | ExpCount | Count | Size | Term |
| GO:0061368 | 0 | 530.0328 | 0.0116 | 2 | 3 | behavioral response to formalin induced pain |
| GO:0002376 | 1e-04 | 2.9369 | 10.3641 | 23 | 2670 | immune system process |
| GO:0046649 | 1e-04 | 4.8784 | 2.3756 | 10 | 612 | lymphocyte activation |
| GO:0006959 | 2e-04 | 7.8844 | 0.8501 | 6 | 219 | humoral immune response |
| GO:0070098 | 3e-04 | 14.3541 | 0.3105 | 4 | 80 | chemokine-mediated signaling pathway |
| GO:0050906 | 4e-04 | 5.0456 | 1.7895 | 8 | 461 | detection of stimulus involved in sensory perception |
| GO:0071316 | 4e-04 | 88.3115 | 0.0311 | 2 | 8 | cellular response to nicotine |
| GO:0006952 | 5e-04 | 3.1104 | 5.7876 | 15 | 1491 | defense response |
| GO:0002286 | 5e-04 | 12.2476 | 0.361 | 4 | 93 | T cell activation involved in immune response |
| GO:0071345 | 5e-04 | 3.7559 | 3.3887 | 11 | 873 | cellular response to cytokine stimulus |
| GO:0050911 | 6e-04 | 5.4421 | 1.4362 | 7 | 370 | detection of chemical stimulus involved in sensory perception of smell |
| GO:0001775 | 0.001 | 3.092 | 4.9181 | 13 | 1267 | cell activation |
| GO:0051707 | 0.0011 | 3.6053 | 3.1597 | 10 | 814 | response to other organism |
| GO:0048266 | 0.0011 | 48.155 | 0.0505 | 2 | 13 | behavioral response to pain |
| GO:0009607 | 0.0016 | 3.4085 | 3.3305 | 10 | 858 | response to biotic stimulus |
| GO:0032729 | 0.0016 | 14.1316 | 0.2329 | 3 | 60 | positive regulation of interferon-gamma production |
| GO:0009593 | 0.0017 | 4.4471 | 1.7429 | 7 | 449 | detection of chemical stimulus |
| GO:0007635 | 0.0019 | 35.3049 | 0.066 | 2 | 17 | chemosensory behavior |
| GO:0002521 | 0.002 | 4.3263 | 1.7895 | 7 | 461 | leukocyte differentiation |
| GO:0050877 | 0.0021 | 2.94 | 4.6969 | 12 | 1210 | nervous system process |
| GO:0007606 | 0.0021 | 4.2682 | 1.8128 | 7 | 467 | sensory perception of chemical stimulus |
| GO:0042742 | 0.0024 | 5.8193 | 0.9355 | 5 | 241 | defense response to bacterium |
| GO:0007186 | 0.0028 | 2.8324 | 4.8599 | 12 | 1252 | G-protein coupled receptor signaling pathway |
| GO:0016050 | 0.0031 | 4.57 | 1.4362 | 6 | 370 | vesicle organization |
| GO:0045672 | 0.0036 | 25.2084 | 0.0893 | 2 | 23 | positive regulation of osteoclast differentiation |
| GO:0002719 | 0.0039 | 24.0611 | 0.0932 | 2 | 24 | negative regulation of cytokine production involved in immune response |
| GO:0036314 | 0.0039 | 24.0611 | 0.0932 | 2 | 24 | response to sterol |
| GO:0002737 | 0.0039 | Inf | 0.0039 | 1 | 1 | negative regulation of plasmacytoid dendritic cell cytokine production |
| GO:0015728 | 0.0039 | Inf | 0.0039 | 1 | 1 | mevalonate transport |
| GO:0051780 | 0.0039 | Inf | 0.0039 | 1 | 1 | behavioral response to nutrient |
| GO:0061048 | 0.0039 | Inf | 0.0039 | 1 | 1 | negative regulation of branching involved in lung morphogenesis |
| GO:1901625 | 0.0039 | Inf | 0.0039 | 1 | 1 | cellular response to ergosterol |
| GO:2000011 | 0.0039 | Inf | 0.0039 | 1 | 1 | regulation of adaxial/abaxial pattern formation |
| GO:0071514 | 0.0045 | 22.0533 | 0.1009 | 2 | 26 | genetic imprinting |
| GO:0048534 | 0.0052 | 3.0487 | 3.2878 | 9 | 847 | hematopoietic or lymphoid organ development |
| GO:0043244 | 0.0055 | 9.0326 | 0.3571 | 3 | 92 | regulation of protein complex disassembly |
| GO:0090279 | 0.0072 | 17.0661 | 0.1281 | 2 | 33 | regulation of calcium ion import |
| GO:0030595 | 0.0074 | 5.5531 | 0.7725 | 4 | 199 | leukocyte chemotaxis |
| GO:0002698 | 0.0077 | 7.9535 | 0.4037 | 3 | 104 | negative regulation of immune effector process |
| GO:0002644 | 0.0077 | 260.7419 | 0.0078 | 1 | 2 | negative regulation of tolerance induction |
| GO:0002876 | 0.0077 | 260.7419 | 0.0078 | 1 | 2 | positive regulation of chronic inflammatory response to antigenic stimulus |
| GO:0019075 | 0.0077 | 260.7419 | 0.0078 | 1 | 2 | virus maturation |
| GO:0038155 | 0.0077 | 260.7419 | 0.0078 | 1 | 2 | interleukin-23-mediated signaling pathway |
| GO:0040030 | 0.0077 | 260.7419 | 0.0078 | 1 | 2 | regulation of molecular function, epigenetic |
| GO:0045994 | 0.0077 | 260.7419 | 0.0078 | 1 | 2 | positive regulation of translational initiation by iron |
| GO:0046373 | 0.0077 | 260.7419 | 0.0078 | 1 | 2 | L-arabinose metabolic process |
| GO:0060125 | 0.0077 | 260.7419 | 0.0078 | 1 | 2 | negative regulation of growth hormone secretion |
| GO:1901253 | 0.0077 | 260.7419 | 0.0078 | 1 | 2 | negative regulation of intracellular transport of viral material |
| GO:1901671 | 0.0077 | 260.7419 | 0.0078 | 1 | 2 | positive regulation of superoxide dismutase activity |
| GO:1904999 | 0.0077 | 260.7419 | 0.0078 | 1 | 2 | positive regulation of leukocyte adhesion to arterial endothelial cell |
| GO:2000334 | 0.0077 | 260.7419 | 0.0078 | 1 | 2 | positive regulation of blood microparticle formation |
| GO:0002700 | 0.0092 | 7.4347 | 0.4309 | 3 | 111 | regulation of production of molecular mediator of immune response |
| GO:0030183 | 0.0092 | 7.4347 | 0.4309 | 3 | 111 | B cell differentiation |
| GO:0007166 | 0.0094 | 2.0777 | 10.2011 | 18 | 2628 | cell surface receptor signaling pathway |
| GO:1903039 | 0.0094 | 5.1765 | 0.8268 | 4 | 213 | positive regulation of leukocyte cell-cell adhesion |
| GOMFID | Pvalue | OddsRatio | ExpCount | Count | Size | Term |
| GO:0050911 | 0 | 7.4393 | 1.573 | 10 | 370 | detection of chemical stimulus involved in sensory perception of smell |
| GO:0050906 | 0 | 6.6215 | 1.9599 | 11 | 461 | detection of stimulus involved in sensory perception |
| GO:0009593 | 0 | 6.07 | 1.9089 | 10 | 449 | detection of chemical stimulus |
| GO:0007606 | 0 | 5.8243 | 1.9854 | 10 | 467 | sensory perception of chemical stimulus |
| GO:0002407 | 2e-04 | 33.345 | 0.1063 | 3 | 25 | dendritic cell chemotaxis |
| GO:0007186 | 2e-04 | 3.3513 | 5.3227 | 15 | 1252 | G-protein coupled receptor signaling pathway |
| GO:0097527 | 3e-04 | 120.5746 | 0.0255 | 2 | 6 | necroptotic signaling pathway |
| GO:0006959 | 3e-04 | 7.1308 | 0.9311 | 6 | 219 | humoral immune response |
| GO:0070098 | 4e-04 | 13.0243 | 0.3401 | 4 | 80 | chemokine-mediated signaling pathway |
| GO:0002376 | 4e-04 | 2.5527 | 11.3512 | 23 | 2670 | immune system process |
| GO:0050877 | 5e-04 | 3.185 | 5.1442 | 14 | 1210 | nervous system process |
| GO:0071316 | 5e-04 | 80.3731 | 0.034 | 2 | 8 | cellular response to nicotine |
| GO:0072676 | 6e-04 | 11.5027 | 0.3826 | 4 | 90 | lymphocyte migration |
| GO:0072577 | 0.0011 | 16.2788 | 0.2041 | 3 | 48 | endothelial cell apoptotic process |
| GO:0034116 | 0.0011 | 48.2119 | 0.051 | 2 | 12 | positive regulation of heterotypic cell-cell adhesion |
| GO:0010623 | 0.0013 | 43.8263 | 0.0553 | 2 | 13 | programmed cell death involved in cell development |
| GO:0070374 | 0.0014 | 6.6022 | 0.8248 | 5 | 194 | positive regulation of ERK1 and ERK2 cascade |
| GO:0046325 | 0.0016 | 40.1716 | 0.0595 | 2 | 14 | negative regulation of glucose import |
| GO:0055074 | 0.0017 | 4.4487 | 1.7303 | 7 | 407 | calcium ion homeostasis |
| GO:0051480 | 0.0018 | 5.0697 | 1.2924 | 6 | 304 | regulation of cytosolic calcium ion concentration |
| GO:0072503 | 0.002 | 4.2944 | 1.7898 | 7 | 421 | cellular divalent inorganic cation homeostasis |
| GO:0023052 | 0.0021 | 2.0568 | 25.8187 | 38 | 6073 | signaling |
| GO:0043242 | 0.0021 | 12.8421 | 0.2551 | 3 | 60 | negative regulation of protein complex disassembly |
| GO:0007154 | 0.0023 | 2.0448 | 25.9122 | 38 | 6095 | cell communication |
| GO:0010469 | 0.0025 | 3.7015 | 2.385 | 8 | 561 | regulation of receptor activity |
| GO:1901879 | 0.0029 | 11.4325 | 0.2848 | 3 | 67 | regulation of protein depolymerization |
| GO:0002544 | 0.0036 | 25.3606 | 0.0893 | 2 | 21 | chronic inflammatory response |
| GO:0010818 | 0.0036 | 25.3606 | 0.0893 | 2 | 21 | T cell chemotaxis |
| GO:0071345 | 0.0037 | 3.0045 | 3.7115 | 10 | 873 | cellular response to cytokine stimulus |
| GO:0007032 | 0.0041 | 10.0174 | 0.3231 | 3 | 76 | endosome organization |
| GO:0002642 | 0.0043 | Inf | 0.0043 | 1 | 1 | positive regulation of immunoglobulin biosynthetic process |
| GO:0015728 | 0.0043 | Inf | 0.0043 | 1 | 1 | mevalonate transport |
| GO:0036145 | 0.0043 | Inf | 0.0043 | 1 | 1 | dendritic cell homeostasis |
| GO:0043143 | 0.0043 | Inf | 0.0043 | 1 | 1 | regulation of translation by machinery localization |
| GO:0051780 | 0.0043 | Inf | 0.0043 | 1 | 1 | behavioral response to nutrient |
| GO:0061048 | 0.0043 | Inf | 0.0043 | 1 | 1 | negative regulation of branching involved in lung morphogenesis |
| GO:1902204 | 0.0043 | Inf | 0.0043 | 1 | 1 | positive regulation of hepatocyte growth factor receptor signaling pathway |
| GO:1904155 | 0.0043 | Inf | 0.0043 | 1 | 1 | DN2 thymocyte differentiation |
| GO:1904156 | 0.0043 | Inf | 0.0043 | 1 | 1 | DN3 thymocyte differentiation |
| GO:2000011 | 0.0043 | Inf | 0.0043 | 1 | 1 | regulation of adaxial/abaxial pattern formation |
| GO:0046649 | 0.0043 | 3.3779 | 2.6018 | 8 | 612 | lymphocyte activation |
| GO:0008625 | 0.0046 | 9.6202 | 0.3359 | 3 | 79 | extrinsic apoptotic signaling pathway via death domain receptors |
| GO:0060326 | 0.005 | 4.8538 | 1.1096 | 5 | 261 | cell chemotaxis |
| GO:0006875 | 0.0052 | 3.5882 | 2.1257 | 7 | 500 | cellular metal ion homeostasis |
| GO:0071514 | 0.0054 | 20.0709 | 0.1105 | 2 | 26 | genetic imprinting |
| GO:0051716 | 0.0057 | 1.8997 | 29.071 | 40 | 6838 | cellular response to stimulus |
| GO:0002377 | 0.0062 | 8.5968 | 0.3741 | 3 | 88 | immunoglobulin production |
| GO:0042100 | 0.0064 | 8.4963 | 0.3784 | 3 | 89 | B cell proliferation |
| GO:0002286 | 0.0073 | 8.1167 | 0.3954 | 3 | 93 | T cell activation involved in immune response |
| GO:0002644 | 0.0085 | 237.6471 | 0.0085 | 1 | 2 | negative regulation of tolerance induction |
| GO:0002876 | 0.0085 | 237.6471 | 0.0085 | 1 | 2 | positive regulation of chronic inflammatory response to antigenic stimulus |
| GO:0019075 | 0.0085 | 237.6471 | 0.0085 | 1 | 2 | virus maturation |
| GO:0036345 | 0.0085 | 237.6471 | 0.0085 | 1 | 2 | platelet maturation |
| GO:0040030 | 0.0085 | 237.6471 | 0.0085 | 1 | 2 | regulation of molecular function, epigenetic |
| GO:0045994 | 0.0085 | 237.6471 | 0.0085 | 1 | 2 | positive regulation of translational initiation by iron |
| GO:0046373 | 0.0085 | 237.6471 | 0.0085 | 1 | 2 | L-arabinose metabolic process |
| GO:1901671 | 0.0085 | 237.6471 | 0.0085 | 1 | 2 | positive regulation of superoxide dismutase activity |
| GO:1904999 | 0.0085 | 237.6471 | 0.0085 | 1 | 2 | positive regulation of leukocyte adhesion to arterial endothelial cell |
| GO:2000334 | 0.0085 | 237.6471 | 0.0085 | 1 | 2 | positive regulation of blood microparticle formation |
| GO:2000458 | 0.0085 | 237.6471 | 0.0085 | 1 | 2 | regulation of astrocyte chemotaxis |
| GO:2001237 | 0.0086 | 7.6065 | 0.4209 | 3 | 99 | negative regulation of extrinsic apoptotic signaling pathway |
| GO:1903514 | 0.0086 | 15.532 | 0.1403 | 2 | 33 | release of sequestered calcium ion into cytosol by endoplasmic reticulum |
| GO:0006952 | 0.0093 | 2.3062 | 6.3388 | 13 | 1491 | defense response |
| GOMFID | Pvalue | OddsRatio | ExpCount | Count | Size | Term |
| GO:0007218 | 1e-04 | 6.9339 | 1.1121 | 7 | 95 | neuropeptide signaling pathway |
| GO:0048935 | 4e-04 | 25.7166 | 0.1522 | 3 | 13 | peripheral nervous system neuron development |
| GO:0043553 | 8e-04 | 85.3085 | 0.0468 | 2 | 4 | negative regulation of phosphatidylinositol 3-kinase activity |
| GO:0032502 | 0.0011 | 1.5842 | 68.1565 | 89 | 5822 | developmental process |
| GO:0045636 | 0.0013 | 56.8688 | 0.0585 | 2 | 5 | positive regulation of melanocyte differentiation |
| GO:0060012 | 0.0013 | 56.8688 | 0.0585 | 2 | 5 | synaptic transmission, glycinergic |
| GO:0060437 | 0.0013 | 56.8688 | 0.0585 | 2 | 5 | lung growth |
| GO:0010529 | 0.0013 | 16.0668 | 0.2224 | 3 | 19 | negative regulation of transposition |
| GO:0048557 | 0.0013 | 16.0668 | 0.2224 | 3 | 19 | embryonic digestive tract morphogenesis |
| GO:0099537 | 0.0015 | 2.4911 | 6.8718 | 16 | 587 | trans-synaptic signaling |
| GO:0007626 | 0.0017 | 3.873 | 2.2009 | 8 | 188 | locomotory behavior |
| GO:0007275 | 0.0024 | 1.5783 | 51.1577 | 69 | 4547 | multicellular organism development |
| GO:0042110 | 0.0024 | 2.6348 | 5.2446 | 13 | 448 | T cell activation |
| GO:0061053 | 0.0027 | 5.603 | 0.96 | 5 | 82 | somite development |
| GO:0001838 | 0.0029 | 4.5555 | 1.4048 | 6 | 120 | embryonic epithelial tube formation |
| GO:0007399 | 0.0031 | 1.7107 | 25.0875 | 39 | 2143 | nervous system development |
| GO:0007389 | 0.0032 | 2.6564 | 4.788 | 12 | 409 | pattern specification process |
| GO:0048568 | 0.0034 | 2.6427 | 4.8115 | 12 | 411 | embryonic organ development |
| GO:0001501 | 0.0041 | 2.471 | 5.5724 | 13 | 476 | skeletal system development |
| GO:0035282 | 0.0045 | 4.9559 | 1.077 | 5 | 92 | segmentation |
| GO:0048704 | 0.0045 | 4.9559 | 1.077 | 5 | 92 | embryonic skeletal system morphogenesis |
| GO:0014807 | 0.0046 | 24.3663 | 0.1054 | 2 | 9 | regulation of somitogenesis |
| GO:0048087 | 0.0046 | 24.3663 | 0.1054 | 2 | 9 | positive regulation of developmental pigmentation |
| GO:0050932 | 0.0046 | 24.3663 | 0.1054 | 2 | 9 | regulation of pigment cell differentiation |
| GO:0040036 | 0.0051 | 9.5146 | 0.3512 | 3 | 30 | regulation of fibroblast growth factor receptor signaling pathway |
| GO:0070286 | 0.0051 | 9.5146 | 0.3512 | 3 | 30 | axonemal dynein complex assembly |
| GO:0043009 | 0.0051 | 2.3143 | 6.4036 | 14 | 547 | chordate embryonic development |
| GO:0030198 | 0.0051 | 2.7644 | 3.8164 | 10 | 326 | extracellular matrix organization |
| GO:0009954 | 0.0056 | 9.1742 | 0.3629 | 3 | 31 | proximal/distal pattern formation |
| GO:0003211 | 0.0058 | 21.3191 | 0.1171 | 2 | 10 | cardiac ventricle formation |
| GO:0006821 | 0.0061 | 4.5848 | 1.159 | 5 | 99 | chloride transport |
| GO:0035148 | 0.0063 | 3.8418 | 1.6506 | 6 | 141 | tube formation |
| GO:0035107 | 0.0072 | 3.7303 | 1.6975 | 6 | 145 | appendage morphogenesis |
| GO:0048598 | 0.0075 | 2.207 | 6.6962 | 14 | 572 | embryonic morphogenesis |
| GO:0007268 | 0.0077 | 2.1993 | 6.7205 | 14 | 580 | chemical synaptic transmission |
| GO:0009952 | 0.0082 | 3.2253 | 2.2828 | 7 | 195 | anterior/posterior pattern specification |
| GO:0060536 | 0.0083 | 17.0532 | 0.1405 | 2 | 12 | cartilage morphogenesis |
| GO:0035137 | 0.0085 | 7.7817 | 0.4214 | 3 | 36 | hindlimb morphogenesis |
| GO:0040019 | 0.0085 | 7.7817 | 0.4214 | 3 | 36 | positive regulation of embryonic development |
| GO:0007156 | 0.009 | 3.5499 | 1.7794 | 6 | 152 | homophilic cell adhesion via plasma membrane adhesion molecules |
| GO:0007519 | 0.009 | 3.5499 | 1.7794 | 6 | 152 | skeletal muscle tissue development |
| GO:0031274 | 0.0098 | 15.5019 | 0.1522 | 2 | 13 | positive regulation of pseudopodium assembly |
| GO:1905205 | 0.0098 | 15.5019 | 0.1522 | 2 | 13 | positive regulation of connective tissue replacement |
| GOMFID | Pvalue | OddsRatio | ExpCount | Count | Size | Term |
| GO:0016199 | 0 | 136.7812 | 0.0551 | 3 | 5 | axon midline choice point recognition |
| GO:0008038 | 0 | 17.0541 | 0.3529 | 5 | 32 | neuron recognition |
| GO:0099537 | 1e-04 | 3.042 | 6.474 | 18 | 587 | trans-synaptic signaling |
| GO:0050925 | 1e-04 | Inf | 0.0221 | 2 | 2 | negative regulation of negative chemotaxis |
| GO:0072272 | 1e-04 | Inf | 0.0221 | 2 | 2 | proximal/distal pattern formation involved in metanephric nephron development |
| GO:0019098 | 3e-04 | 14.0879 | 0.3309 | 4 | 30 | reproductive behavior |
| GO:0007417 | 5e-04 | 2.4098 | 9.4849 | 21 | 860 | central nervous system development |
| GO:0007379 | 5e-04 | 22.7827 | 0.1654 | 3 | 15 | segment specification |
| GO:0006933 | 7e-04 | 90.6723 | 0.0441 | 2 | 4 | negative regulation of cell adhesion involved in substrate-bound cell migration |
| GO:0007621 | 7e-04 | 90.6723 | 0.0441 | 2 | 4 | negative regulation of female receptivity |
| GO:0033600 | 7e-04 | 90.6723 | 0.0441 | 2 | 4 | negative regulation of mammary gland epithelial cell proliferation |
| GO:0072086 | 7e-04 | 90.6723 | 0.0441 | 2 | 4 | specification of loop of Henle identity |
| GO:2000648 | 8e-04 | 10.7677 | 0.4191 | 4 | 38 | positive regulation of stem cell proliferation |
| GO:0072488 | 8e-04 | 19.5256 | 0.1875 | 3 | 17 | ammonium transmembrane transport |
| GO:0072079 | 0.0011 | 17.0827 | 0.2096 | 3 | 19 | nephron tubule formation |
| GO:0071502 | 0.0012 | 60.4444 | 0.0551 | 2 | 5 | cellular response to temperature stimulus |
| GO:1903232 | 0.0012 | 60.4444 | 0.0551 | 2 | 5 | melanosome assembly |
| GO:0048812 | 0.0013 | 2.6122 | 6.1542 | 15 | 558 | neuron projection morphogenesis |
| GO:0045597 | 0.0015 | 2.2467 | 9.6062 | 20 | 871 | positive regulation of cell differentiation |
| GO:0009712 | 0.0016 | 8.7124 | 0.5073 | 4 | 46 | catechol-containing compound metabolic process |
| GO:0021891 | 0.0018 | 45.3305 | 0.0662 | 2 | 6 | olfactory bulb interneuron development |
| GO:0032229 | 0.0018 | 45.3305 | 0.0662 | 2 | 6 | negative regulation of synaptic transmission, GABAergic |
| GO:0048858 | 0.0018 | 2.5301 | 6.3417 | 15 | 575 | cell projection morphogenesis |
| GO:1903530 | 0.0021 | 2.4147 | 7.0916 | 16 | 643 | regulation of secretion by cell |
| GO:0021879 | 0.0021 | 8.13 | 0.5404 | 4 | 49 | forebrain neuron differentiation |
| GO:0035385 | 0.0024 | 36.2621 | 0.0772 | 2 | 7 | Roundabout signaling pathway |
| GO:0048539 | 0.0024 | 36.2621 | 0.0772 | 2 | 7 | bone marrow development |
| GO:0007267 | 0.0025 | 1.8866 | 16.775 | 29 | 1521 | cell-cell signaling |
| GO:0007155 | 0.0026 | 1.9461 | 14.5031 | 26 | 1315 | cell adhesion |
| GO:0036065 | 0.0028 | 11.8785 | 0.2868 | 3 | 26 | fucosylation |
| GO:0007411 | 0.0031 | 3.4953 | 2.4264 | 8 | 220 | axon guidance |
| GO:0006836 | 0.0031 | 3.8945 | 1.908 | 7 | 173 | neurotransmitter transport |
| GO:0048791 | 0.0032 | 11.3828 | 0.2978 | 3 | 27 | calcium ion-regulated exocytosis of neurotransmitter |
| GO:0007268 | 0.0032 | 2.6592 | 4.7951 | 12 | 446 | chemical synaptic transmission |
| GO:0021859 | 0.0032 | 30.2166 | 0.0882 | 2 | 8 | pyramidal neuron differentiation |
| GO:0048667 | 0.0038 | 2.4923 | 5.5365 | 13 | 502 | cell morphogenesis involved in neuron differentiation |
| GO:0060180 | 0.0041 | 25.8983 | 0.0993 | 2 | 9 | female mating behavior |
| GO:0061004 | 0.0041 | 25.8983 | 0.0993 | 2 | 9 | pattern specification involved in kidney development |
| GO:0006811 | 0.0043 | 1.8243 | 16.6427 | 28 | 1509 | ion transport |
| GO:0051960 | 0.0044 | 2.1651 | 8.371 | 17 | 759 | regulation of nervous system development |
| GO:0099531 | 0.0044 | 4.1509 | 1.533 | 6 | 139 | presynaptic process involved in chemical synaptic transmission |
| GO:0050769 | 0.0046 | 2.6572 | 4.3785 | 11 | 397 | positive regulation of neurogenesis |
| GO:0061025 | 0.0047 | 3.2467 | 2.6028 | 8 | 236 | membrane fusion |
| GO:0035646 | 0.0051 | 22.6596 | 0.1103 | 2 | 10 | endosome to melanosome transport |
| GO:0042415 | 0.0051 | 22.6596 | 0.1103 | 2 | 10 | norepinephrine metabolic process |
| GO:0048757 | 0.0051 | 22.6596 | 0.1103 | 2 | 10 | pigment granule maturation |
| GO:0048864 | 0.0054 | 6.0918 | 0.7059 | 4 | 64 | stem cell development |
| GO:0021954 | 0.0057 | 5.9916 | 0.7169 | 4 | 65 | central nervous system neuron development |
| GO:0009886 | 0.0062 | 20.1406 | 0.1213 | 2 | 11 | post-embryonic animal morphogenesis |
| GO:0043476 | 0.0062 | 20.1406 | 0.1213 | 2 | 11 | pigment accumulation |
| GO:0050713 | 0.0062 | 20.1406 | 0.1213 | 2 | 11 | negative regulation of interleukin-1 beta secretion |
| GO:0032879 | 0.0063 | 1.6173 | 27.9253 | 41 | 2532 | regulation of localization |
| GO:0071805 | 0.0066 | 3.3616 | 2.1948 | 7 | 199 | potassium ion transmembrane transport |
| GO:0006906 | 0.0068 | 3.7782 | 1.6764 | 6 | 152 | vesicle fusion |
| GO:0007156 | 0.0068 | 3.7782 | 1.6764 | 6 | 152 | homophilic cell adhesion via plasma membrane adhesion molecules |
| GO:0060284 | 0.007 | 2.0573 | 8.7791 | 17 | 796 | regulation of cell development |
| GO:0030182 | 0.0071 | 1.8513 | 13.312 | 23 | 1207 | neuron differentiation |
| GO:0099504 | 0.0072 | 4.4062 | 1.2022 | 5 | 109 | synaptic vesicle cycle |
| GO:0014003 | 0.0072 | 8.2738 | 0.397 | 3 | 36 | oligodendrocyte development |
| GO:0002031 | 0.0074 | 18.1254 | 0.1323 | 2 | 12 | G-protein coupled receptor internalization |
| GO:0046903 | 0.0076 | 1.7567 | 16.5545 | 27 | 1501 | secretion |
| GO:0015695 | 0.0078 | 8.0299 | 0.4081 | 3 | 37 | organic cation transport |
| GO:0050772 | 0.0078 | 5.453 | 0.7831 | 4 | 71 | positive regulation of axonogenesis |
| GO:0015844 | 0.0082 | 5.3724 | 0.7941 | 4 | 72 | monoamine transport |
| GO:0007618 | 0.0084 | 7.8 | 0.4191 | 3 | 38 | mating |
| GO:0051952 | 0.0095 | 5.1445 | 0.8272 | 4 | 75 | regulation of amine transport |
| GO:0045598 | 0.0096 | 4.0894 | 1.2904 | 5 | 117 | regulation of fat cell differentiation |
| GO:0015872 | 0.0097 | 7.3775 | 0.4412 | 3 | 40 | dopamine transport |
| GOMFID | Pvalue | OddsRatio | ExpCount | Count | Size | Term |
| GO:0050777 | 4e-04 | 5.657 | 1.3407 | 7 | 128 | negative regulation of immune response |
| GO:0043570 | 6e-04 | 95.5833 | 0.0419 | 2 | 4 | maintenance of DNA repeat elements |
| GO:0002698 | 8e-04 | 5.9589 | 1.0893 | 6 | 104 | negative regulation of immune effector process |
| GO:1904837 | 0.001 | 10.1598 | 0.4399 | 4 | 42 | beta-catenin-TCF complex assembly |
| GO:0010718 | 0.0012 | 9.4146 | 0.4713 | 4 | 45 | positive regulation of epithelial to mesenchymal transition |
| GO:0042373 | 0.0016 | 47.7857 | 0.0628 | 2 | 6 | vitamin K metabolic process |
| GO:0045590 | 0.0016 | 47.7857 | 0.0628 | 2 | 6 | negative regulation of regulatory T cell differentiation |
| GO:0045123 | 0.0018 | 8.3887 | 0.5237 | 4 | 50 | cellular extravasation |
| GO:1901570 | 0.0021 | 5.9779 | 0.9008 | 5 | 86 | fatty acid derivative biosynthetic process |
| GO:0032667 | 0.0029 | 31.8532 | 0.0838 | 2 | 8 | regulation of interleukin-23 production |
| GO:0043114 | 0.0037 | 10.6673 | 0.3142 | 3 | 30 | regulation of vascular permeability |
| GO:1901750 | 0.0037 | 27.301 | 0.0943 | 2 | 9 | leukotriene D4 biosynthetic process |
| GO:0006751 | 0.0046 | 23.8869 | 0.1047 | 2 | 10 | glutathione catabolic process |
| GO:0072537 | 0.0046 | 23.8869 | 0.1047 | 2 | 10 | fibroblast activation |
| GO:0006690 | 0.0047 | 4.8855 | 1.0893 | 5 | 104 | icosanoid metabolic process |
| GO:0002695 | 0.0048 | 4.0722 | 1.5607 | 6 | 149 | negative regulation of leukocyte activation |
| GO:0003413 | 0.0056 | 21.2315 | 0.1152 | 2 | 11 | chondrocyte differentiation involved in endochondral bone morphogenesis |
| GO:0032700 | 0.0056 | 21.2315 | 0.1152 | 2 | 11 | negative regulation of interleukin-17 production |
| GO:0042398 | 0.0078 | 7.996 | 0.4085 | 3 | 39 | cellular modified amino acid biosynthetic process |
| GO:0032736 | 0.0091 | 15.9206 | 0.1466 | 2 | 14 | positive regulation of interleukin-13 production |
| GO:0060312 | 0.0091 | 15.9206 | 0.1466 | 2 | 14 | regulation of blood vessel remodeling |
| GOMFID | Pvalue | OddsRatio | ExpCount | Count | Size | Term |
| GO:0019864 | 0.0028 | 31.1085 | 0.0809 | 2 | 10 | IgG binding |
| GO:0031406 | 0.0031 | 4.4866 | 1.424 | 6 | 176 | carboxylic acid binding |
| GO:0050786 | 0.0034 | 27.6503 | 0.089 | 2 | 11 | RAGE receptor binding |
| GO:0002020 | 0.004 | 5.0998 | 1.0437 | 5 | 129 | protease binding |
| GO:0004152 | 0.0081 | Inf | 0.0081 | 1 | 1 | dihydroorotate dehydrogenase activity |
| GO:0004336 | 0.0081 | Inf | 0.0081 | 1 | 1 | galactosylceramidase activity |
| GO:0005130 | 0.0081 | Inf | 0.0081 | 1 | 1 | granulocyte colony-stimulating factor receptor binding |
| GO:0005353 | 0.0081 | Inf | 0.0081 | 1 | 1 | fructose transmembrane transporter activity |
| GO:0008120 | 0.0081 | Inf | 0.0081 | 1 | 1 | ceramide glucosyltransferase activity |
| GO:0030272 | 0.0081 | Inf | 0.0081 | 1 | 1 | 5-formyltetrahydrofolate cyclo-ligase activity |
| GO:0030294 | 0.0081 | Inf | 0.0081 | 1 | 1 | receptor signaling protein tyrosine kinase inhibitor activity |
| GO:0031962 | 0.0081 | Inf | 0.0081 | 1 | 1 | mineralocorticoid receptor binding |
| GO:0036470 | 0.0081 | Inf | 0.0081 | 1 | 1 | tyrosine 3-monooxygenase activator activity |
| GO:0036478 | 0.0081 | Inf | 0.0081 | 1 | 1 | L-dopa decarboxylase activator activity |
| GO:0036524 | 0.0081 | Inf | 0.0081 | 1 | 1 | protein deglycase activity |
| GO:0045340 | 0.0081 | Inf | 0.0081 | 1 | 1 | mercury ion binding |
| GO:0055103 | 0.0081 | Inf | 0.0081 | 1 | 1 | ligase regulator activity |
| GO:0070012 | 0.0081 | Inf | 0.0081 | 1 | 1 | oligopeptidase activity |
| GO:0102769 | 0.0081 | Inf | 0.0081 | 1 | 1 | dihydroceramide glucosyltransferase activity |
| GO:1990175 | 0.0081 | Inf | 0.0081 | 1 | 1 | EH domain binding |
| GO:1990698 | 0.0081 | Inf | 0.0081 | 1 | 1 | palmitoleoyltransferase activity |
| GOMFID | Pvalue | OddsRatio | ExpCount | Count | Size | Term |
| GO:0031406 | 5e-04 | 5.4408 | 1.3914 | 7 | 176 | carboxylic acid binding |
| GO:0005504 | 0.0012 | 16.039 | 0.2135 | 3 | 27 | fatty acid binding |
| GO:0050786 | 0.0033 | 28.3139 | 0.087 | 2 | 11 | RAGE receptor binding |
| GO:0002020 | 0.0036 | 5.2252 | 1.0198 | 5 | 129 | protease binding |
| GO:0005215 | 0.0039 | 2.0821 | 10.5303 | 20 | 1332 | transporter activity |
| GO:0004152 | 0.0079 | Inf | 0.0079 | 1 | 1 | dihydroorotate dehydrogenase activity |
| GO:0004336 | 0.0079 | Inf | 0.0079 | 1 | 1 | galactosylceramidase activity |
| GO:0005130 | 0.0079 | Inf | 0.0079 | 1 | 1 | granulocyte colony-stimulating factor receptor binding |
| GO:0005353 | 0.0079 | Inf | 0.0079 | 1 | 1 | fructose transmembrane transporter activity |
| GO:0008120 | 0.0079 | Inf | 0.0079 | 1 | 1 | ceramide glucosyltransferase activity |
| GO:0030272 | 0.0079 | Inf | 0.0079 | 1 | 1 | 5-formyltetrahydrofolate cyclo-ligase activity |
| GO:0030294 | 0.0079 | Inf | 0.0079 | 1 | 1 | receptor signaling protein tyrosine kinase inhibitor activity |
| GO:0036470 | 0.0079 | Inf | 0.0079 | 1 | 1 | tyrosine 3-monooxygenase activator activity |
| GO:0036478 | 0.0079 | Inf | 0.0079 | 1 | 1 | L-dopa decarboxylase activator activity |
| GO:0036524 | 0.0079 | Inf | 0.0079 | 1 | 1 | protein deglycase activity |
| GO:0039552 | 0.0079 | Inf | 0.0079 | 1 | 1 | RIG-I binding |
| GO:0045340 | 0.0079 | Inf | 0.0079 | 1 | 1 | mercury ion binding |
| GO:0055103 | 0.0079 | Inf | 0.0079 | 1 | 1 | ligase regulator activity |
| GO:0102769 | 0.0079 | Inf | 0.0079 | 1 | 1 | dihydroceramide glucosyltransferase activity |
| GO:1990175 | 0.0079 | Inf | 0.0079 | 1 | 1 | EH domain binding |
| GO:1990698 | 0.0079 | Inf | 0.0079 | 1 | 1 | palmitoleoyltransferase activity |
| GO:0004869 | 0.0099 | 7.2498 | 0.4427 | 3 | 56 | cysteine-type endopeptidase inhibitor activity |
| GOMFID | Pvalue | OddsRatio | ExpCount | Count | Size | Term |
| GO:0042288 | 0.0027 | 12.5346 | 0.2857 | 3 | 18 | MHC class I protein binding |
| GO:0016427 | 0.0036 | 31.2353 | 0.0952 | 2 | 6 | tRNA (cytosine) methyltransferase activity |
| GO:0004601 | 0.0036 | 6.982 | 0.6349 | 4 | 40 | peroxidase activity |
| GO:0046332 | 0.0051 | 4.844 | 1.1111 | 5 | 70 | SMAD binding |
| GO:0004126 | 0.0066 | 20.8209 | 0.127 | 2 | 8 | cytidine deaminase activity |
| GO:0004364 | 0.0078 | 8.1707 | 0.4127 | 3 | 26 | glutathione transferase activity |
| GO:0003691 | 0.0084 | 17.8454 | 0.1429 | 2 | 9 | double-stranded telomeric DNA binding |
| GO:0003924 | 0.01 | 2.4893 | 4.2063 | 10 | 265 | GTPase activity |
| GOMFID | Pvalue | OddsRatio | ExpCount | Count | Size | Term |
| GO:0005547 | 0.0018 | 8.6238 | 0.525 | 4 | 34 | phosphatidylinositol-3,4,5-trisphosphate binding |
| GO:0016427 | 0.0034 | 32.131 | 0.0926 | 2 | 6 | tRNA (cytosine) methyltransferase activity |
| GO:0043325 | 0.0051 | 9.6686 | 0.3551 | 3 | 23 | phosphatidylinositol-3,4-bisphosphate binding |
| GO:0008013 | 0.0057 | 4.6945 | 1.1426 | 5 | 74 | beta-catenin binding |
| GO:0004126 | 0.0063 | 21.418 | 0.1235 | 2 | 8 | cytidine deaminase activity |
| GO:0008066 | 0.0073 | 8.4059 | 0.4015 | 3 | 26 | glutamate receptor activity |
| GO:0003691 | 0.008 | 18.3571 | 0.139 | 2 | 9 | double-stranded telomeric DNA binding |
| GO:0070016 | 0.0098 | 16.0615 | 0.1544 | 2 | 10 | armadillo repeat domain binding |
| GOMFID | Pvalue | OddsRatio | ExpCount | Count | Size | Term |
| GO:0048020 | 0 | 23.3707 | 0.2553 | 5 | 39 | CCR chemokine receptor binding |
| GO:0008009 | 0 | 18.4688 | 0.3142 | 5 | 48 | chemokine activity |
| GO:0032394 | 0 | Inf | 0.0131 | 2 | 2 | MHC class Ib receptor activity |
| GO:0030246 | 1e-04 | 5.8531 | 1.7022 | 9 | 260 | carbohydrate binding |
| GO:0042288 | 2e-04 | 31.2039 | 0.1178 | 3 | 18 | MHC class I protein binding |
| GO:0016427 | 6e-04 | 77.3125 | 0.0393 | 2 | 6 | tRNA (cytosine) methyltransferase activity |
| GO:0001055 | 0.0022 | 34.3504 | 0.072 | 2 | 11 | RNA polymerase II activity |
| GO:0016705 | 0.0031 | 5.4421 | 0.982 | 5 | 150 | oxidoreductase activity, acting on paired donors, with incorporation or reduction of molecular oxygen |
| GO:0004497 | 0.0031 | 7.1288 | 0.6023 | 4 | 92 | monooxygenase activity |
| GO:0008173 | 0.0062 | 8.6467 | 0.3732 | 3 | 57 | RNA methyltransferase activity |
| GO:0004034 | 0.0065 | Inf | 0.0065 | 1 | 1 | aldose 1-epimerase activity |
| GO:0005133 | 0.0065 | Inf | 0.0065 | 1 | 1 | interferon-gamma receptor binding |
| GO:0035375 | 0.0065 | Inf | 0.0065 | 1 | 1 | zymogen binding |
| GO:0035757 | 0.0065 | Inf | 0.0065 | 1 | 1 | chemokine (C-C motif) ligand 19 binding |
| GO:0035758 | 0.0065 | Inf | 0.0065 | 1 | 1 | chemokine (C-C motif) ligand 21 binding |
| GO:0038117 | 0.0065 | Inf | 0.0065 | 1 | 1 | C-C motif chemokine 19 receptor activity |
| GO:0038121 | 0.0065 | Inf | 0.0065 | 1 | 1 | C-C motif chemokine 21 receptor activity |
| GO:0047042 | 0.0065 | Inf | 0.0065 | 1 | 1 | androsterone dehydrogenase (B-specific) activity |
| GO:0050528 | 0.0065 | Inf | 0.0065 | 1 | 1 | acyloxyacyl hydrolase activity |
| GO:0102116 | 0.0065 | Inf | 0.0065 | 1 | 1 | laurate hydroxylase activity |
| GO:0103002 | 0.0065 | Inf | 0.0065 | 1 | 1 | 16-hydroxypalmitate dehydrogenase activity |
| GO:0001664 | 0.007 | 3.7698 | 1.6891 | 6 | 258 | G-protein coupled receptor binding |
| GO:0019956 | 0.009 | 15.4471 | 0.144 | 2 | 22 | chemokine binding |
| GOMFID | Pvalue | OddsRatio | ExpCount | Count | Size | Term |
| GO:0016494 | 0.0018 | 42.7573 | 0.0657 | 2 | 7 | C-X-C chemokine receptor activity |
| GO:0005102 | 0.0021 | 2.0203 | 13.6031 | 25 | 1449 | receptor binding |
| GO:0016840 | 0.003 | 30.5371 | 0.0845 | 2 | 9 | carbon-nitrogen lyase activity |
| GO:0004888 | 0.0032 | 2.0677 | 11.0308 | 21 | 1175 | transmembrane signaling receptor activity |
| GO:0004871 | 0.0034 | 1.9166 | 14.8799 | 26 | 1585 | signal transducer activity |
| GO:0048020 | 0.0058 | 8.9502 | 0.3661 | 3 | 39 | CCR chemokine receptor binding |
| GO:0008528 | 0.0059 | 4.6288 | 1.1453 | 5 | 122 | G-protein coupled peptide receptor activity |
| GO:0019842 | 0.0074 | 4.3655 | 1.211 | 5 | 129 | vitamin binding |
| GO:0001716 | 0.0094 | Inf | 0.0094 | 1 | 1 | L-amino-acid oxidase activity |
| GO:0004397 | 0.0094 | Inf | 0.0094 | 1 | 1 | histidine ammonia-lyase activity |
| GO:0004979 | 0.0094 | Inf | 0.0094 | 1 | 1 | beta-endorphin receptor activity |
| GO:0005142 | 0.0094 | Inf | 0.0094 | 1 | 1 | interleukin-11 receptor binding |
| GO:0008555 | 0.0094 | Inf | 0.0094 | 1 | 1 | chloride-transporting ATPase activity |
| GO:0016517 | 0.0094 | Inf | 0.0094 | 1 | 1 | interleukin-12 receptor activity |
| GO:0019969 | 0.0094 | Inf | 0.0094 | 1 | 1 | interleukin-10 binding |
| GO:0031768 | 0.0094 | Inf | 0.0094 | 1 | 1 | ghrelin receptor binding |
| GO:0038047 | 0.0094 | Inf | 0.0094 | 1 | 1 | morphine receptor activity |
| GO:0042007 | 0.0094 | Inf | 0.0094 | 1 | 1 | interleukin-18 binding |
| GO:0047042 | 0.0094 | Inf | 0.0094 | 1 | 1 | androsterone dehydrogenase (B-specific) activity |
| GO:0050459 | 0.0094 | Inf | 0.0094 | 1 | 1 | ethanolamine-phosphate phospho-lyase activity |
| GO:0097260 | 0.0094 | Inf | 0.0094 | 1 | 1 | eoxin A4 synthase activity |
| GOMFID | Pvalue | OddsRatio | ExpCount | Count | Size | Term |
| GO:0019966 | 0.002 | 37.6112 | 0.0689 | 2 | 9 | interleukin-1 binding |
| GO:0004984 | 0.0076 | 2.992 | 2.8337 | 8 | 370 | olfactory receptor activity |
| GO:0001631 | 0.0077 | Inf | 0.0077 | 1 | 1 | cysteinyl leukotriene receptor activity |
| GO:0001716 | 0.0077 | Inf | 0.0077 | 1 | 1 | L-amino-acid oxidase activity |
| GO:0004489 | 0.0077 | Inf | 0.0077 | 1 | 1 | methylenetetrahydrofolate reductase (NAD(P)H) activity |
| GO:0004588 | 0.0077 | Inf | 0.0077 | 1 | 1 | orotate phosphoribosyltransferase activity |
| GO:0004590 | 0.0077 | Inf | 0.0077 | 1 | 1 | orotidine-5'-phosphate decarboxylase activity |
| GO:0052591 | 0.0077 | Inf | 0.0077 | 1 | 1 | sn-glycerol-3-phosphate:ubiquinone-8 oxidoreductase activity |
| GO:0004869 | 0.009 | 7.4913 | 0.4289 | 3 | 56 | cysteine-type endopeptidase inhibitor activity |
| GO:0061135 | 0.0097 | 4.0743 | 1.2943 | 5 | 169 | endopeptidase regulator activity |
| GOMFID | Pvalue | OddsRatio | ExpCount | Count | Size | Term |
| GO:0022803 | 1e-04 | 3.6287 | 4.5317 | 15 | 442 | passive transmembrane transporter activity |
| GO:0022836 | 1e-04 | 4.0983 | 3.1886 | 12 | 311 | gated channel activity |
| GO:0022838 | 1e-04 | 3.6164 | 4.2241 | 14 | 412 | substrate-specific channel activity |
| GO:0005244 | 1e-04 | 5.1035 | 1.9172 | 9 | 187 | voltage-gated ion channel activity |
| GO:0005261 | 3e-04 | 3.8238 | 3.1065 | 11 | 303 | cation channel activity |
| GO:0005249 | 3e-04 | 7.0324 | 0.933 | 6 | 91 | voltage-gated potassium channel activity |
| GO:0022890 | 0.001 | 2.7963 | 5.3826 | 14 | 525 | inorganic cation transmembrane transporter activity |
| GO:0015079 | 0.0011 | 4.6909 | 1.5994 | 7 | 156 | potassium ion transmembrane transporter activity |
| GO:0005509 | 0.0012 | 2.5517 | 6.7565 | 16 | 659 | calcium ion binding |
| GO:0015075 | 0.0021 | 2.2845 | 8.4892 | 18 | 828 | ion transmembrane transporter activity |
| GO:1904680 | 0.0026 | 12.2707 | 0.2768 | 3 | 27 | peptide transmembrane transporter activity |
| GO:0015450 | 0.0028 | 32.5589 | 0.082 | 2 | 8 | P-P-bond-hydrolysis-driven protein transmembrane transporter activity |
| GO:0022892 | 0.0037 | 2.0364 | 11.1241 | 21 | 1085 | substrate-specific transporter activity |
| GO:0005283 | 0.0064 | 19.5305 | 0.123 | 2 | 12 | sodium:amino acid symporter activity |
| GO:0005245 | 0.0069 | 8.4084 | 0.3896 | 3 | 38 | voltage-gated calcium channel activity |
| GO:0008528 | 0.0084 | 4.2225 | 1.2508 | 5 | 122 | G-protein coupled peptide receptor activity |
| GO:0004659 | 0.0088 | 16.2734 | 0.1435 | 2 | 14 | prenyltransferase activity |
| GO:0004953 | 0.0088 | 16.2734 | 0.1435 | 2 | 14 | icosanoid receptor activity |
| GO:0003700 | 0.0094 | 1.8576 | 12.0981 | 21 | 1180 | DNA binding transcription factor activity |
| GOMFID | Pvalue | OddsRatio | ExpCount | Count | Size | Term |
| GO:0030246 | 0 | 5.4048 | 2.8905 | 14 | 260 | carbohydrate binding |
| GO:0048020 | 0 | 16.6959 | 0.4336 | 6 | 39 | CCR chemokine receptor binding |
| GO:0005126 | 0 | 4.4849 | 2.9238 | 12 | 263 | cytokine receptor binding |
| GO:0045028 | 2e-04 | 38.7506 | 0.1112 | 3 | 10 | G-protein coupled purinergic nucleotide receptor activity |
| GO:0071723 | 2e-04 | 38.7506 | 0.1112 | 3 | 10 | lipopeptide binding |
| GO:0016502 | 8e-04 | 19.3668 | 0.189 | 3 | 17 | nucleotide receptor activity |
| GO:0019863 | 0.0012 | 59.9551 | 0.0556 | 2 | 5 | IgE binding |
| GO:0030883 | 0.0012 | 59.9551 | 0.0556 | 2 | 5 | endogenous lipid antigen binding |
| GO:0030884 | 0.0012 | 59.9551 | 0.0556 | 2 | 5 | exogenous lipid antigen binding |
| GO:0035586 | 0.0016 | 15.0593 | 0.2335 | 3 | 21 | purinergic receptor activity |
| GO:0008009 | 0.002 | 8.2474 | 0.5336 | 4 | 48 | chemokine activity |
| GO:0004872 | 0.002 | 1.9141 | 16.5536 | 29 | 1489 | receptor activity |
| GO:0001664 | 0.0024 | 3.3316 | 2.8683 | 9 | 258 | G-protein coupled receptor binding |
| GO:0042608 | 0.0025 | 35.9685 | 0.0778 | 2 | 7 | T cell receptor binding |
| GO:0001637 | 0.0026 | 12.3182 | 0.2779 | 3 | 25 | G-protein coupled chemoattractant receptor activity |
| GO:0004126 | 0.0033 | 29.9719 | 0.0889 | 2 | 8 | cytidine deaminase activity |
| GO:0030881 | 0.0042 | 25.6886 | 0.1001 | 2 | 9 | beta-2-microglobulin binding |
| GO:0052650 | 0.0042 | 25.6886 | 0.1001 | 2 | 9 | NADP-retinol dehydrogenase activity |
| GO:0097001 | 0.0052 | 22.4761 | 0.1112 | 2 | 10 | ceramide binding |
| GO:0005068 | 0.0063 | 19.9775 | 0.1223 | 2 | 11 | transmembrane receptor protein tyrosine kinase adaptor activity |
| GO:0016493 | 0.0075 | 17.9787 | 0.1334 | 2 | 12 | C-C chemokine receptor activity |
| GOMFID | Pvalue | OddsRatio | ExpCount | Count | Size | Term |
| GO:0030246 | 0 | 5.7549 | 2.7299 | 14 | 260 | carbohydrate binding |
| GO:0048020 | 1e-04 | 14.2487 | 0.4095 | 5 | 39 | CCR chemokine receptor binding |
| GO:0005126 | 1e-04 | 4.3291 | 2.7614 | 11 | 263 | cytokine receptor binding |
| GO:0071723 | 1e-04 | 41.0967 | 0.105 | 3 | 10 | lipopeptide binding |
| GO:0019863 | 0.0011 | 63.5635 | 0.0525 | 2 | 5 | IgE binding |
| GO:0030883 | 0.0011 | 63.5635 | 0.0525 | 2 | 5 | endogenous lipid antigen binding |
| GO:0030884 | 0.0011 | 63.5635 | 0.0525 | 2 | 5 | exogenous lipid antigen binding |
| GO:0004872 | 0.0015 | 3.6128 | 2.669 | 9 | 270 | receptor activity |
| GO:0008528 | 0.0018 | 5.0163 | 1.281 | 6 | 122 | G-protein coupled peptide receptor activity |
| GO:0042608 | 0.0022 | 38.1333 | 0.0735 | 2 | 7 | T cell receptor binding |
| GO:0004126 | 0.0029 | 31.7758 | 0.084 | 2 | 8 | cytidine deaminase activity |
| GO:0030881 | 0.0038 | 27.2347 | 0.0945 | 2 | 9 | beta-2-microglobulin binding |
| GO:0052650 | 0.0038 | 27.2347 | 0.0945 | 2 | 9 | NADP-retinol dehydrogenase activity |
| GO:0045028 | 0.0047 | 23.8289 | 0.105 | 2 | 10 | G-protein coupled purinergic nucleotide receptor activity |
| GO:0097001 | 0.0047 | 23.8289 | 0.105 | 2 | 10 | ceramide binding |
| GO:0005068 | 0.0057 | 21.1799 | 0.1155 | 2 | 11 | transmembrane receptor protein tyrosine kinase adaptor activity |
| GO:0001664 | 0.006 | 3.1153 | 2.7089 | 8 | 258 | G-protein coupled receptor binding |
| GO:0016493 | 0.0068 | 19.0607 | 0.126 | 2 | 12 | C-C chemokine receptor activity |
| GO:0004950 | 0.0078 | 17.5246 | 0.135 | 2 | 13 | chemokine receptor activity |
| GO:0005125 | 0.0079 | 3.249 | 2.2679 | 7 | 216 | cytokine activity |
| GO:0099600 | 0.0088 | 1.8409 | 12.7991 | 22 | 1219 | transmembrane receptor activity |
| GO:0015144 | 0.0097 | 7.3616 | 0.441 | 3 | 42 | carbohydrate transmembrane transporter activity |
| GOMFID | Pvalue | OddsRatio | ExpCount | Count | Size | Term |
| GO:0048020 | 0 | 20.7948 | 0.3517 | 6 | 39 | CCR chemokine receptor binding |
| GO:0008061 | 0 | 67.3007 | 0.0721 | 3 | 8 | chitin binding |
| GO:0008009 | 1e-04 | 13.1964 | 0.4328 | 5 | 48 | chemokine activity |
| GO:0032394 | 1e-04 | Inf | 0.018 | 2 | 2 | MHC class Ib receptor activity |
| GO:0001664 | 6e-04 | 4.1674 | 2.3265 | 9 | 258 | G-protein coupled receptor binding |
| GO:0016004 | 0.0042 | 24.7469 | 0.0992 | 2 | 11 | phospholipase activator activity |
| GO:0005549 | 0.0067 | 5.693 | 0.7484 | 4 | 83 | odorant binding |
| GO:0008308 | 0.0089 | 15.9038 | 0.1443 | 2 | 16 | voltage-gated anion channel activity |
| GO:0008808 | 0.009 | Inf | 0.009 | 1 | 1 | cardiolipin synthase activity |
| GO:0008843 | 0.009 | Inf | 0.009 | 1 | 1 | endochitinase activity |
| GO:0031764 | 0.009 | Inf | 0.009 | 1 | 1 | type 1 galanin receptor binding |
| GO:0031765 | 0.009 | Inf | 0.009 | 1 | 1 | type 2 galanin receptor binding |
| GO:0031766 | 0.009 | Inf | 0.009 | 1 | 1 | type 3 galanin receptor binding |
| GO:0036470 | 0.009 | Inf | 0.009 | 1 | 1 | tyrosine 3-monooxygenase activator activity |
| GO:0036478 | 0.009 | Inf | 0.009 | 1 | 1 | L-dopa decarboxylase activator activity |
| GO:0036524 | 0.009 | Inf | 0.009 | 1 | 1 | protein deglycase activity |
| GO:0043337 | 0.009 | Inf | 0.009 | 1 | 1 | CDP-diacylglycerol-phosphatidylglycerol phosphatidyltransferase activity |
| GO:0045340 | 0.009 | Inf | 0.009 | 1 | 1 | mercury ion binding |
| GO:0005126 | 0.0099 | 3.106 | 2.3716 | 7 | 263 | cytokine receptor binding |
| GOMFID | Pvalue | OddsRatio | ExpCount | Count | Size | Term |
| GO:0048020 | 0 | 24.4966 | 0.3011 | 6 | 39 | CCR chemokine receptor binding |
| GO:0008061 | 0 | 78.9885 | 0.0618 | 3 | 8 | chitin binding |
| GO:0008009 | 0 | 15.5262 | 0.3706 | 5 | 48 | chemokine activity |
| GO:0032394 | 1e-04 | Inf | 0.0154 | 2 | 2 | MHC class Ib receptor activity |
| GO:0016004 | 0.0031 | 29.0099 | 0.0849 | 2 | 11 | phospholipase activator activity |
| GO:0001664 | 0.0039 | 3.7378 | 1.9918 | 7 | 258 | G-protein coupled receptor binding |
| GO:0005126 | 0.0043 | 3.6636 | 2.0304 | 7 | 263 | cytokine receptor binding |
| GO:0008017 | 0.0053 | 3.9998 | 1.5904 | 6 | 206 | microtubule binding |
| GO:0008445 | 0.0077 | Inf | 0.0077 | 1 | 1 | D-aspartate oxidase activity |
| GO:0008843 | 0.0077 | Inf | 0.0077 | 1 | 1 | endochitinase activity |
| GO:0036470 | 0.0077 | Inf | 0.0077 | 1 | 1 | tyrosine 3-monooxygenase activator activity |
| GO:0036478 | 0.0077 | Inf | 0.0077 | 1 | 1 | L-dopa decarboxylase activator activity |
| GO:0036524 | 0.0077 | Inf | 0.0077 | 1 | 1 | protein deglycase activity |
| GO:0045340 | 0.0077 | Inf | 0.0077 | 1 | 1 | mercury ion binding |
| GO:0047127 | 0.0077 | Inf | 0.0077 | 1 | 1 | thiomorpholine-carboxylate dehydrogenase activity |
| GO:0016638 | 0.0083 | 16.311 | 0.139 | 2 | 18 | oxidoreductase activity, acting on the CH-NH2 group of donors |
| GO:0042288 | 0.0083 | 16.311 | 0.139 | 2 | 18 | MHC class I protein binding |
| GOMFID | Pvalue | OddsRatio | ExpCount | Count | Size | Term |
| GO:0005125 | 2e-04 | 7.8409 | 0.8538 | 6 | 216 | cytokine activity |
| GO:0060089 | 2e-04 | 3.2103 | 6.0597 | 16 | 1533 | molecular transducer activity |
| GO:0099600 | 2e-04 | 3.4674 | 4.8185 | 14 | 1219 | transmembrane receptor activity |
| GO:0038023 | 4e-04 | 3.2896 | 5.0556 | 14 | 1279 | signaling receptor activity |
| GO:0005126 | 5e-04 | 6.6952 | 0.9958 | 6 | 260 | cytokine receptor binding |
| GO:0004984 | 6e-04 | 5.3331 | 1.4625 | 7 | 370 | olfactory receptor activity |
| GO:0004930 | 0.0035 | 3.2459 | 3.0951 | 9 | 783 | G-protein coupled receptor activity |
| GO:0015130 | 0.004 | Inf | 0.004 | 1 | 1 | mevalonate transmembrane transporter activity |
| GO:0030380 | 0.004 | Inf | 0.004 | 1 | 1 | interleukin-17E receptor binding |
| GO:0004950 | 0.0044 | 22.5863 | 0.0988 | 2 | 25 | chemokine receptor activity |
| GO:0001069 | 0.0079 | 255.9683 | 0.0079 | 1 | 2 | regulatory region RNA binding |
| GO:0010465 | 0.0079 | 255.9683 | 0.0079 | 1 | 2 | nerve growth factor receptor activity |
| GO:0042019 | 0.0079 | 255.9683 | 0.0079 | 1 | 2 | interleukin-23 binding |
| GO:0042020 | 0.0079 | 255.9683 | 0.0079 | 1 | 2 | interleukin-23 receptor activity |
| GO:0045523 | 0.0079 | 255.9683 | 0.0079 | 1 | 2 | interleukin-27 receptor binding |
| GO:0046556 | 0.0079 | 255.9683 | 0.0079 | 1 | 2 | alpha-L-arabinofuranosidase activity |
| GO:0070095 | 0.0079 | 255.9683 | 0.0079 | 1 | 2 | fructose-6-phosphate binding |
| GO:0071791 | 0.0079 | 255.9683 | 0.0079 | 1 | 2 | chemokine (C-C motif) ligand 5 binding |
| GOMFID | Pvalue | OddsRatio | ExpCount | Count | Size | Term |
| GO:0004984 | 0 | 7.4209 | 1.5768 | 10 | 370 | olfactory receptor activity |
| GO:0005125 | 0 | 10.034 | 0.9205 | 8 | 216 | cytokine activity |
| GO:0099600 | 0 | 4.058 | 5.1949 | 17 | 1219 | transmembrane receptor activity |
| GO:0038023 | 0 | 3.8495 | 5.4506 | 17 | 1279 | signaling receptor activity |
| GO:0004930 | 0 | 4.6284 | 3.3369 | 13 | 783 | G-protein coupled receptor activity |
| GO:0060089 | 2e-04 | 3.1498 | 6.5331 | 17 | 1533 | molecular transducer activity |
| GO:0005126 | 7e-04 | 6.1444 | 1.0761 | 6 | 260 | cytokine receptor binding |
| GO:0030545 | 9e-04 | 4.4257 | 2.0115 | 8 | 472 | receptor regulator activity |
| GO:0016493 | 0.0011 | 48.0955 | 0.0511 | 2 | 12 | C-C chemokine receptor activity |
| GO:0019956 | 0.0039 | 24.0328 | 0.0938 | 2 | 22 | chemokine binding |
| GO:0015130 | 0.0043 | Inf | 0.0043 | 1 | 1 | mevalonate transmembrane transporter activity |
| GO:0030380 | 0.0043 | Inf | 0.0043 | 1 | 1 | interleukin-17E receptor binding |
| GO:0043843 | 0.0043 | Inf | 0.0043 | 1 | 1 | ADP-specific glucokinase activity |
| GO:0001637 | 0.005 | 20.8942 | 0.1065 | 2 | 25 | G-protein coupled chemoattractant receptor activity |
| GO:0004896 | 0.0053 | 9.1148 | 0.3537 | 3 | 83 | cytokine receptor activity |
| GO:0005164 | 0.0067 | 17.7944 | 0.1236 | 2 | 29 | tumor necrosis factor receptor binding |
| GO:0004775 | 0.0085 | 237.0735 | 0.0085 | 1 | 2 | succinate-CoA ligase (ADP-forming) activity |
| GO:0004776 | 0.0085 | 237.0735 | 0.0085 | 1 | 2 | succinate-CoA ligase (GDP-forming) activity |
| GO:0005171 | 0.0085 | 237.0735 | 0.0085 | 1 | 2 | hepatocyte growth factor receptor binding |
| GO:0010465 | 0.0085 | 237.0735 | 0.0085 | 1 | 2 | nerve growth factor receptor activity |
| GO:0045523 | 0.0085 | 237.0735 | 0.0085 | 1 | 2 | interleukin-27 receptor binding |
| GO:0046556 | 0.0085 | 237.0735 | 0.0085 | 1 | 2 | alpha-L-arabinofuranosidase activity |
| GO:0070095 | 0.0085 | 237.0735 | 0.0085 | 1 | 2 | fructose-6-phosphate binding |
| GO:0071791 | 0.0085 | 237.0735 | 0.0085 | 1 | 2 | chemokine (C-C motif) ligand 5 binding |
| GOMFID | Pvalue | OddsRatio | ExpCount | Count | Size | Term |
| GO:0048248 | 1e-04 | 224.1389 | 0.0154 | 2 | 5 | CXCR3 chemokine receptor binding |
| GO:0005129 | 0.0031 | Inf | 0.0031 | 1 | 1 | granulocyte macrophage colony-stimulating factor receptor binding |
| GO:0030380 | 0.0031 | Inf | 0.0031 | 1 | 1 | interleukin-17E receptor binding |
| GO:0030332 | 0.0041 | 23.1494 | 0.0957 | 2 | 31 | cyclin binding |
| GO:0017099 | 0.0062 | 329.3878 | 0.0062 | 1 | 2 | very-long-chain-acyl-CoA dehydrogenase activity |
| GO:0043028 | 0.0068 | 17.6568 | 0.1235 | 2 | 40 | cysteine-type endopeptidase regulator activity involved in apoptotic process |
| GO:0030369 | 0.0092 | 164.6837 | 0.0093 | 1 | 3 | ICAM-3 receptor activity |
| GO:0008009 | 0.0096 | 14.5788 | 0.1482 | 2 | 48 | chemokine activity |
| GOMFID | Pvalue | OddsRatio | ExpCount | Count | Size | Term |
| GO:0008009 | 0 | 26.5917 | 0.1749 | 4 | 48 | chemokine activity |
| GO:0048020 | 4e-04 | 23.9524 | 0.1421 | 3 | 39 | CCR chemokine receptor binding |
| GO:0048018 | 0.0011 | 4.8234 | 1.6216 | 7 | 445 | receptor ligand activity |
| GO:0005201 | 0.0023 | 12.4713 | 0.2624 | 3 | 72 | extracellular matrix structural constituent |
| GO:0005126 | 0.0024 | 5.8274 | 0.9386 | 5 | 262 | cytokine receptor binding |
| GO:0070330 | 0.0029 | 28.2667 | 0.0802 | 2 | 22 | aromatase activity |
| GO:0005133 | 0.0036 | Inf | 0.0036 | 1 | 1 | interferon-gamma receptor binding |
| GO:0008389 | 0.0073 | 278.1207 | 0.0073 | 1 | 2 | coumarin 7-hydroxylase activity |
| GOMFID | Pvalue | OddsRatio | ExpCount | Count | Size | Term |
| GO:0008502 | 1e-04 | Inf | 0.0214 | 2 | 2 | melatonin receptor activity |
| GO:0036461 | 1e-04 | Inf | 0.0214 | 2 | 2 | BLOC-2 complex binding |
| GO:0008519 | 2e-04 | 15.7732 | 0.2992 | 4 | 28 | ammonium transmembrane transporter activity |
| GO:0035651 | 3e-04 | 187.3333 | 0.0321 | 2 | 3 | AP-3 adaptor complex binding |
| GO:0035650 | 7e-04 | 93.6608 | 0.0427 | 2 | 4 | AP-1 adaptor complex binding |
| GO:0016812 | 0.0017 | 46.8246 | 0.0641 | 2 | 6 | hydrolase activity, acting on carbon-nitrogen (but not peptide) bonds, in cyclic amides |
| GO:0005509 | 0.0019 | 2.4368 | 7.0414 | 16 | 659 | calcium ion binding |
| GO:0008046 | 0.0023 | 37.4573 | 0.0748 | 2 | 7 | axon guidance receptor activity |
| GO:0004871 | 0.0028 | 1.8718 | 16.9356 | 29 | 1585 | signal transducer activity |
| GO:0004872 | 0.0045 | 1.8412 | 15.9099 | 27 | 1489 | receptor activity |
| GO:0051378 | 0.0048 | 23.4064 | 0.1068 | 2 | 10 | serotonin binding |
| GO:0089720 | 0.0048 | 23.4064 | 0.1068 | 2 | 10 | caspase binding |
| GO:0015081 | 0.0055 | 3.9606 | 1.6027 | 6 | 150 | sodium ion transmembrane transporter activity |
| GO:0008376 | 0.0056 | 9.1008 | 0.3633 | 3 | 34 | acetylgalactosaminyltransferase activity |
| GO:0004888 | 0.0059 | 1.9155 | 12.3411 | 22 | 1168 | transmembrane signaling receptor activity |
| GO:0022836 | 0.0063 | 2.8558 | 3.323 | 9 | 311 | gated channel activity |
| GO:0004222 | 0.0073 | 4.3844 | 1.2074 | 5 | 113 | metalloendopeptidase activity |
| GO:0019905 | 0.0097 | 5.0996 | 0.8334 | 4 | 78 | syntaxin binding |
| GOMFID | Pvalue | OddsRatio | ExpCount | Count | Size | Term |
| GO:0016409 | 4e-04 | 24.3864 | 0.1401 | 3 | 36 | palmitoyltransferase activity |
| GO:0008106 | 0.0017 | 37.7377 | 0.0623 | 2 | 16 | alcohol dehydrogenase (NADP+) activity |
| GO:0001760 | 0.0039 | Inf | 0.0039 | 1 | 1 | aminocarboxymuconate-semialdehyde decarboxylase activity |
| GO:0018455 | 0.0039 | Inf | 0.0039 | 1 | 1 | alcohol dehydrogenase [NAD(P)+] activity |
| GO:0047042 | 0.0039 | Inf | 0.0039 | 1 | 1 | androsterone dehydrogenase (B-specific) activity |
| GO:1990698 | 0.0039 | Inf | 0.0039 | 1 | 1 | palmitoleoyltransferase activity |
| GO:0015020 | 0.0073 | 17.0249 | 0.1284 | 2 | 33 | glucuronosyltransferase activity |
| GO:0004053 | 0.0078 | 260.1129 | 0.0078 | 1 | 2 | arginase activity |
| GO:0032089 | 0.0078 | 260.1129 | 0.0078 | 1 | 2 | NACHT domain binding |
| GO:0047006 | 0.0078 | 260.1129 | 0.0078 | 1 | 2 | 17-alpha,20-alpha-dihydroxypregn-4-en-3-one dehydrogenase activity |
| GO:0048101 | 0.0078 | 260.1129 | 0.0078 | 1 | 2 | calcium- and calmodulin-regulated 3',5'-cyclic-GMP phosphodiesterase activity |
| GOMFID | Pvalue | OddsRatio | ExpCount | Count | Size | Term |
| GO:0003755 | 0.0025 | 12.1669 | 0.2723 | 3 | 38 | peptidyl-prolyl cis-trans isomerase activity |
| GO:0004476 | 0.0072 | Inf | 0.0072 | 1 | 1 | mannose-6-phosphate isomerase activity |
| GO:0005459 | 0.0072 | Inf | 0.0072 | 1 | 1 | UDP-galactose transmembrane transporter activity |
| GO:0030377 | 0.0072 | Inf | 0.0072 | 1 | 1 | urokinase plasminogen activator receptor activity |
| GO:0042922 | 0.0072 | Inf | 0.0072 | 1 | 1 | neuromedin U receptor binding |
| GO:0047915 | 0.0072 | Inf | 0.0072 | 1 | 1 | ganglioside galactosyltransferase activity |
| GO:0102339 | 0.0072 | Inf | 0.0072 | 1 | 1 | 3-oxo-arachidoyl-CoA reductase activity |
| GO:0102340 | 0.0072 | Inf | 0.0072 | 1 | 1 | 3-oxo-behenoyl-CoA reductase activity |
| GO:0102341 | 0.0072 | Inf | 0.0072 | 1 | 1 | 3-oxo-lignoceroyl-CoA reductase activity |
| GO:0102342 | 0.0072 | Inf | 0.0072 | 1 | 1 | 3-oxo-cerotoyl-CoA reductase activity |
| GO:0015197 | 0.0076 | 5.4845 | 0.7738 | 4 | 108 | peptide transporter activity |
| GOMFID | Pvalue | OddsRatio | ExpCount | Count | Size | Term |
| GO:0102953 | 0.001 | 66.775 | 0.05 | 2 | 5 | hypoglycin A gamma-glutamyl transpeptidase activity |
| GO:0036374 | 0.002 | 40.06 | 0.07 | 2 | 7 | glutathione hydrolase activity |
| GO:0015643 | 0.0042 | 25.0328 | 0.1001 | 2 | 10 | toxic substance binding |
| GO:0015271 | 0.0052 | 22.25 | 0.1101 | 2 | 11 | outward rectifier potassium channel activity |
| GO:0004896 | 0.0096 | 5.1114 | 0.8305 | 4 | 83 | cytokine receptor activity |
| GOMFID | Pvalue | OddsRatio | ExpCount | Count | Size | Term |
| GO:0032394 | 2e-04 | Inf | 0.0273 | 2 | 2 | MHC class Ib receptor activity |
| GO:0031720 | 6e-04 | 145.8356 | 0.0409 | 2 | 3 | haptoglobin binding |
| GO:0035663 | 6e-04 | 145.8356 | 0.0409 | 2 | 3 | Toll-like receptor 2 binding |
| GO:0031014 | 0.0011 | 72.9132 | 0.0546 | 2 | 4 | troponin T binding |
| GO:0015057 | 0.0018 | 48.6058 | 0.0682 | 2 | 5 | thrombin-activated receptor activity |
| GO:0004565 | 0.0027 | 36.4521 | 0.0819 | 2 | 6 | beta-galactosidase activity |
| GO:0019825 | 0.0032 | 7.1615 | 0.6142 | 4 | 45 | oxygen binding |
| GO:0098634 | 0.0037 | 29.1598 | 0.0955 | 2 | 7 | cell-matrix adhesion mediator activity |
| GO:0015386 | 0.0063 | 20.8258 | 0.1228 | 2 | 9 | potassium:proton antiporter activity |
| GO:0005072 | 0.0078 | 18.2215 | 0.1365 | 2 | 10 | transforming growth factor beta receptor, cytoplasmic mediator activity |
| GO:0071723 | 0.0078 | 18.2215 | 0.1365 | 2 | 10 | lipopeptide binding |
| GO:0015385 | 0.0094 | 16.1958 | 0.1501 | 2 | 11 | sodium:proton antiporter activity |
| GO:0043295 | 0.0094 | 16.1958 | 0.1501 | 2 | 11 | glutathione binding |
| NA. |
| n/a |
| NA. |
| n/a |
| NA. |
| n/a |
| NA. |
| n/a |
| NA. |
| n/a |
| NA. |
| n/a |
| NA. |
| n/a |
| NA. |
| n/a |
| NA. |
| n/a |
| NA. |
| n/a |
| NA. |
| n/a |
| NA. |
| n/a |
| NA. |
| n/a |
| NA. |
| n/a |
| NA. |
| n/a |
| NA. |
| n/a |
| NA. |
| n/a |
| NA. |
| n/a |
| NA. |
| n/a |
| NA. |
| n/a |
| NA. |
| n/a |
| NA. |
| n/a |
| NA. |
| n/a |
| NA. |
| n/a |
| NA. |
| n/a |
| NA. |
| n/a |
| NA. |
| n/a |
| NA. |
| n/a |
| NA. |
| n/a |
| NA. |
| n/a |
| NA. |
| n/a |
| NA. |
| n/a |
| NA. |
| n/a |
| NA. |
| n/a |
| NA. |
| n/a |
| NA. |
| n/a |
| NA. |
| n/a |
| NA. |
| n/a |
| NA. |
| n/a |
| NA. |
| n/a |
| NA. |
| n/a |
| NA. |
| n/a |
| NA. |
| n/a |
| NA. |
| n/a |
| NA. |
| n/a |
| NA. |
| n/a |
| NA. |
| n/a |
| NA. |
| n/a |
| NA. |
| n/a |
| NA. |
| n/a |
| NA. |
| n/a |
| NA. |
| n/a |
| NA. |
| n/a |
| NA. |
| n/a |
| NA. |
| n/a |
| NA. |
| n/a |
| GOMFID | Pvalue | OddsRatio | ExpCount | Count | Size | Term |
| GO:2000402 | 3e-04 | 31.3255 | 0.143 | 3 | 9 | negative regulation of lymphocyte migration |
| GO:0036006 | 4e-04 | 26.8487 | 0.1589 | 3 | 10 | cellular response to macrophage colony-stimulating factor stimulus |
| GO:0007079 | 7e-04 | 124.8516 | 0.0477 | 2 | 3 | mitotic chromosome movement towards spindle pole |
| GO:2000502 | 7e-04 | 124.8516 | 0.0477 | 2 | 3 | negative regulation of natural killer cell chemotaxis |
| GO:0048523 | 9e-04 | 1.5283 | 70.7435 | 94 | 4453 | negative regulation of cellular process |
| GO:0030488 | 0.0011 | 10.0517 | 0.4607 | 4 | 29 | tRNA methylation |
| GO:0002689 | 0.0019 | 14.4516 | 0.2542 | 3 | 16 | negative regulation of leukocyte chemotaxis |
| GO:0051489 | 0.0033 | 7.1753 | 0.6196 | 4 | 39 | regulation of filopodium assembly |
| GO:0008063 | 0.0036 | 31.207 | 0.0953 | 2 | 6 | Toll signaling pathway |
| GO:0070383 | 0.0036 | 31.207 | 0.0953 | 2 | 6 | DNA cytosine deamination |
| GO:0043901 | 0.0042 | 3.3106 | 2.5578 | 8 | 161 | negative regulation of multi-organism process |
| GO:1901687 | 0.0043 | 10.434 | 0.3336 | 3 | 21 | glutathione derivative biosynthetic process |
| GO:0045869 | 0.005 | 24.9641 | 0.1112 | 2 | 7 | negative regulation of single stranded viral RNA replication via double stranded DNA intermediate |
| GO:0050870 | 0.0052 | 2.9415 | 3.225 | 9 | 203 | positive regulation of T cell activation |
| GO:0039694 | 0.0055 | 9.3894 | 0.3654 | 3 | 23 | viral RNA genome replication |
| GO:0032956 | 0.0059 | 2.5626 | 4.5118 | 11 | 284 | regulation of actin cytoskeleton organization |
| GO:0046580 | 0.006 | 5.9768 | 0.7308 | 4 | 46 | negative regulation of Ras protein signal transduction |
| GO:0017148 | 0.0061 | 2.3357 | 5.8463 | 13 | 368 | negative regulation of translation |
| GO:0000060 | 0.0065 | 5.8374 | 0.7467 | 4 | 47 | protein import into nucleus, translocation |
| GO:0030330 | 0.0069 | 3.7814 | 1.684 | 6 | 106 | DNA damage response, signal transduction by p53 class mediator |
| GO:0002696 | 0.007 | 2.4974 | 4.623 | 11 | 291 | positive regulation of leukocyte activation |
| GO:0097435 | 0.0071 | 2.0406 | 8.7536 | 17 | 551 | supramolecular fiber organization |
| GO:0030155 | 0.0077 | 1.9404 | 10.2946 | 19 | 648 | regulation of cell adhesion |
| GO:1903671 | 0.0079 | 8.1632 | 0.4131 | 3 | 26 | negative regulation of sprouting angiogenesis |
| GO:0009972 | 0.0084 | 17.8292 | 0.143 | 2 | 9 | cytidine deamination |
| GO:0046087 | 0.0084 | 17.8292 | 0.143 | 2 | 9 | cytidine metabolic process |
| GO:0071822 | 0.0086 | 1.5822 | 25.5935 | 38 | 1611 | protein complex subunit organization |
| GO:2000171 | 0.0087 | 7.8225 | 0.4289 | 3 | 27 | negative regulation of dendrite development |
| GO:0016458 | 0.0097 | 2.1963 | 6.1958 | 13 | 390 | gene silencing |
| GO:0019058 | 0.0098 | 2.3764 | 4.8454 | 11 | 305 | viral life cycle |
| GO:0043623 | 0.0099 | 1.9644 | 9.0713 | 17 | 571 | cellular protein complex assembly |
| GOMFID | Pvalue | OddsRatio | ExpCount | Count | Size | Term |
| GO:1900239 | 2e-04 | 38.5133 | 0.1241 | 3 | 8 | regulation of phenotypic switching |
| GO:0048625 | 0.0023 | 42.6267 | 0.0776 | 2 | 5 | myoblast fate commitment |
| GO:0051489 | 0.003 | 7.3516 | 0.6052 | 4 | 39 | regulation of filopodium assembly |
| GO:0008063 | 0.0035 | 31.968 | 0.0931 | 2 | 6 | Toll signaling pathway |
| GO:0070383 | 0.0035 | 31.968 | 0.0931 | 2 | 6 | DNA cytosine deamination |
| GO:0090677 | 0.0035 | 31.968 | 0.0931 | 2 | 6 | reversible differentiation |
| GO:0007159 | 0.0038 | 2.481 | 5.5241 | 13 | 356 | leukocyte cell-cell adhesion |
| GO:0010629 | 0.0039 | 1.6258 | 28.5362 | 43 | 1839 | negative regulation of gene expression |
| GO:0050870 | 0.0045 | 3.0153 | 3.15 | 9 | 203 | positive regulation of T cell activation |
| GO:0045869 | 0.0048 | 25.5728 | 0.1086 | 2 | 7 | negative regulation of single stranded viral RNA replication via double stranded DNA intermediate |
| GO:0090647 | 0.0048 | 25.5728 | 0.1086 | 2 | 7 | modulation of age-related behavioral decline |
| GO:0008347 | 0.0051 | 6.2734 | 0.6983 | 4 | 45 | glial cell migration |
| GO:0039694 | 0.0052 | 9.6193 | 0.3569 | 3 | 23 | viral RNA genome replication |
| GO:2000300 | 0.0052 | 9.6193 | 0.3569 | 3 | 23 | regulation of synaptic vesicle exocytosis |
| GO:0001505 | 0.0055 | 3.1635 | 2.669 | 8 | 172 | regulation of neurotransmitter levels |
| GO:0006342 | 0.0056 | 3.9547 | 1.6138 | 6 | 104 | chromatin silencing |
| GO:0007215 | 0.0058 | 4.6702 | 1.1483 | 5 | 74 | glutamate receptor signaling pathway |
| GO:0002696 | 0.0059 | 2.5606 | 4.5155 | 11 | 291 | positive regulation of leukocyte activation |
| GO:0030155 | 0.006 | 1.9912 | 10.0552 | 19 | 648 | regulation of cell adhesion |
| GO:0032071 | 0.0063 | 21.3093 | 0.1241 | 2 | 8 | regulation of endodeoxyribonuclease activity |
| GO:0044351 | 0.0063 | 21.3093 | 0.1241 | 2 | 8 | macropinocytosis |
| GO:0050804 | 0.0072 | 2.4882 | 4.6397 | 11 | 299 | modulation of chemical synaptic transmission |
| GO:1903671 | 0.0074 | 8.363 | 0.4034 | 3 | 26 | negative regulation of sprouting angiogenesis |
| GO:0001960 | 0.0075 | 5.5898 | 0.7759 | 4 | 50 | negative regulation of cytokine-mediated signaling pathway |
| GO:0048523 | 0.0075 | 1.4036 | 69.0983 | 87 | 4453 | negative regulation of cellular process |
| GO:0007196 | 0.008 | 18.264 | 0.1397 | 2 | 9 | adenylate cyclase-inhibiting G-protein coupled glutamate receptor signaling pathway |
| GO:0009972 | 0.008 | 18.264 | 0.1397 | 2 | 9 | cytidine deamination |
| GO:0010692 | 0.008 | 18.264 | 0.1397 | 2 | 9 | regulation of alkaline phosphatase activity |
| GO:0046087 | 0.008 | 18.264 | 0.1397 | 2 | 9 | cytidine metabolic process |
| GO:2000402 | 0.008 | 18.264 | 0.1397 | 2 | 9 | negative regulation of lymphocyte migration |
| GO:2000113 | 0.0088 | 1.6098 | 23.1362 | 35 | 1491 | negative regulation of cellular macromolecule biosynthetic process |
| GO:0006606 | 0.0088 | 2.5394 | 4.1276 | 10 | 266 | protein import into nucleus |
| GO:0030307 | 0.009 | 3.1658 | 2.3276 | 7 | 150 | positive regulation of cell growth |
| GO:0046824 | 0.0091 | 3.5531 | 1.7845 | 6 | 115 | positive regulation of nucleocytoplasmic transport |
| GO:0040029 | 0.0093 | 2.1385 | 6.8586 | 14 | 442 | regulation of gene expression, epigenetic |
| GO:0036006 | 0.0099 | 15.98 | 0.1552 | 2 | 10 | cellular response to macrophage colony-stimulating factor stimulus |
| GOMFID | Pvalue | OddsRatio | ExpCount | Count | Size | Term |
| GO:0006355 | 0 | 1.916 | 44.5474 | 71 | 3445 | regulation of transcription, DNA-templated |
| GO:2001141 | 0 | 1.8967 | 44.8966 | 71 | 3472 | regulation of RNA biosynthetic process |
| GO:0048762 | 0 | 5.0371 | 2.3922 | 11 | 185 | mesenchymal cell differentiation |
| GO:0060562 | 0 | 3.9181 | 3.8922 | 14 | 301 | epithelial tube morphogenesis |
| GO:0001569 | 0 | 15.0131 | 0.4009 | 5 | 31 | branching involved in blood vessel morphogenesis |
| GO:0007399 | 1e-04 | 1.9708 | 27.7112 | 48 | 2143 | nervous system development |
| GO:0035295 | 1e-04 | 2.8426 | 7.2543 | 19 | 561 | tube development |
| GO:0007156 | 2e-04 | 4.9745 | 1.9655 | 9 | 152 | homophilic cell adhesion via plasma membrane adhesion molecules |
| GO:0048706 | 2e-04 | 5.5786 | 1.5647 | 8 | 121 | embryonic skeletal system development |
| GO:0061448 | 2e-04 | 3.9541 | 3 | 11 | 232 | connective tissue development |
| GO:0048701 | 2e-04 | 10.0006 | 0.569 | 5 | 44 | embryonic cranial skeleton morphogenesis |
| GO:0003002 | 3e-04 | 3.3354 | 4.1897 | 13 | 324 | regionalization |
| GO:0021521 | 3e-04 | 29.0254 | 0.1422 | 3 | 11 | ventral spinal cord interneuron specification |
| GO:0021903 | 3e-04 | 29.0254 | 0.1422 | 3 | 11 | rostrocaudal neural tube patterning |
| GO:0035413 | 3e-04 | 29.0254 | 0.1422 | 3 | 11 | positive regulation of catenin import into nucleus |
| GO:0060033 | 3e-04 | 29.0254 | 0.1422 | 3 | 11 | anatomical structure regression |
| GO:0001558 | 3e-04 | 3.1359 | 4.7974 | 14 | 371 | regulation of cell growth |
| GO:0060173 | 4e-04 | 4.4134 | 2.1983 | 9 | 170 | limb development |
| GO:0019219 | 4e-04 | 1.6657 | 51.9957 | 74 | 4021 | regulation of nucleobase-containing compound metabolic process |
| GO:0043010 | 4e-04 | 3.4091 | 3.7759 | 12 | 292 | camera-type eye development |
| GO:0061138 | 5e-04 | 4.2791 | 2.2629 | 9 | 175 | morphogenesis of a branching epithelium |
| GO:0048863 | 5e-04 | 3.6062 | 3.2716 | 11 | 253 | stem cell differentiation |
| GO:0051094 | 5e-04 | 2.1083 | 15.0292 | 29 | 1177 | positive regulation of developmental process |
| GO:0003274 | 5e-04 | 154.125 | 0.0388 | 2 | 3 | endocardial cushion fusion |
| GO:0003214 | 7e-04 | 21.1054 | 0.181 | 3 | 14 | cardiac left ventricle morphogenesis |
| GO:0042487 | 7e-04 | 21.1054 | 0.181 | 3 | 14 | regulation of odontogenesis of dentin-containing tooth |
| GO:0010717 | 7e-04 | 6.0936 | 1.0733 | 6 | 83 | regulation of epithelial to mesenchymal transition |
| GO:0060317 | 7e-04 | 11.0971 | 0.4138 | 4 | 32 | cardiac epithelial to mesenchymal transition |
| GO:1903507 | 8e-04 | 2.0679 | 14.7155 | 28 | 1138 | negative regulation of nucleic acid-templated transcription |
| GO:0045600 | 8e-04 | 7.4944 | 0.7371 | 5 | 57 | positive regulation of fat cell differentiation |
| GO:0009792 | 8e-04 | 2.5561 | 7.125 | 17 | 551 | embryo development ending in birth or egg hatching |
| GO:0000122 | 8e-04 | 2.3056 | 9.8017 | 21 | 758 | negative regulation of transcription from RNA polymerase II promoter |
| GO:0022610 | 9e-04 | 1.9789 | 17.0819 | 31 | 1321 | biological adhesion |
| GO:0060581 | 9e-04 | 19.3454 | 0.194 | 3 | 15 | cell fate commitment involved in pattern specification |
| GO:0051253 | 9e-04 | 2.0108 | 15.6724 | 29 | 1212 | negative regulation of RNA metabolic process |
| GO:0006933 | 0.001 | 77.0577 | 0.0517 | 2 | 4 | negative regulation of cell adhesion involved in substrate-bound cell migration |
| GO:0021555 | 0.001 | 77.0577 | 0.0517 | 2 | 4 | midbrain-hindbrain boundary morphogenesis |
| GO:0014032 | 0.0011 | 7.0843 | 0.7759 | 5 | 60 | neural crest cell development |
| GO:0034654 | 0.0011 | 1.5988 | 52.7586 | 73 | 4080 | nucleobase-containing compound biosynthetic process |
| GO:0072132 | 0.0011 | 9.7978 | 0.4614 | 4 | 36 | mesenchyme morphogenesis |
| GO:0021514 | 0.0013 | 16.5797 | 0.2198 | 3 | 17 | ventral spinal cord interneuron differentiation |
| GO:0072091 | 0.0013 | 6.7166 | 0.8147 | 5 | 63 | regulation of stem cell proliferation |
| GO:0045944 | 0.0014 | 2.0325 | 13.8103 | 26 | 1068 | positive regulation of transcription from RNA polymerase II promoter |
| GO:0090596 | 0.0014 | 3.3319 | 3.194 | 10 | 247 | sensory organ morphogenesis |
| GO:0061351 | 0.0016 | 4.4232 | 1.694 | 7 | 131 | neural precursor cell proliferation |
| GO:1902262 | 0.0016 | 51.3686 | 0.0647 | 2 | 5 | apoptotic process involved in blood vessel morphogenesis |
| GO:1905007 | 0.0016 | 51.3686 | 0.0647 | 2 | 5 | positive regulation of epithelial to mesenchymal transition involved in endocardial cushion formation |
| GO:0032656 | 0.0021 | 13.6513 | 0.2586 | 3 | 20 | regulation of interleukin-13 production |
| GO:0016477 | 0.0023 | 1.8846 | 16.6164 | 29 | 1285 | cell migration |
| GO:0060348 | 0.0023 | 3.673 | 2.3147 | 8 | 179 | bone development |
| GO:0002052 | 0.0024 | 12.8921 | 0.2716 | 3 | 21 | positive regulation of neuroblast proliferation |
| GO:0043586 | 0.0024 | 12.8921 | 0.2716 | 3 | 21 | tongue development |
| GO:0009889 | 0.0025 | 1.5301 | 56.1853 | 75 | 4345 | regulation of biosynthetic process |
| GO:0003272 | 0.0027 | 12.2128 | 0.2845 | 3 | 22 | endocardial cushion formation |
| GO:0021513 | 0.0027 | 12.2128 | 0.2845 | 3 | 22 | spinal cord dorsal/ventral patterning |
| GO:0030098 | 0.0028 | 2.8499 | 4.0862 | 11 | 316 | lymphocyte differentiation |
| GO:0035107 | 0.0028 | 3.971 | 1.875 | 7 | 145 | appendage morphogenesis |
| GO:0032330 | 0.0029 | 7.3916 | 0.5948 | 4 | 46 | regulation of chondrocyte differentiation |
| GO:0046580 | 0.0029 | 7.3916 | 0.5948 | 4 | 46 | negative regulation of Ras protein signal transduction |
| GO:0021879 | 0.003 | 11.7551 | 0.2936 | 3 | 23 | forebrain neuron differentiation |
| GO:0070076 | 0.0031 | 11.6014 | 0.2974 | 3 | 23 | histone lysine demethylation |
| GO:0032673 | 0.0035 | 11.0483 | 0.3103 | 3 | 24 | regulation of interleukin-4 production |
| GO:0040007 | 0.0036 | 1.993 | 11.7802 | 22 | 911 | growth |
| GO:0003148 | 0.004 | 10.5455 | 0.3233 | 3 | 25 | outflow tract septum morphogenesis |
| GO:0061037 | 0.004 | 10.5455 | 0.3233 | 3 | 25 | negative regulation of cartilage development |
| GO:0060350 | 0.0042 | 6.6032 | 0.6595 | 4 | 51 | endochondral bone morphogenesis |
| GO:0048562 | 0.0043 | 3.036 | 3.1294 | 9 | 245 | embryonic organ morphogenesis |
| GO:0021859 | 0.0044 | 25.6795 | 0.1034 | 2 | 8 | pyramidal neuron differentiation |
| GO:0032909 | 0.0044 | 25.6795 | 0.1034 | 2 | 8 | regulation of transforming growth factor beta2 production |
| GO:0045630 | 0.0044 | 25.6795 | 0.1034 | 2 | 8 | positive regulation of T-helper 2 cell differentiation |
| GO:0060534 | 0.0044 | 25.6795 | 0.1034 | 2 | 8 | trachea cartilage development |
| GO:0002063 | 0.0045 | 10.0863 | 0.3362 | 3 | 26 | chondrocyte development |
| GO:0021884 | 0.0045 | 10.0863 | 0.3362 | 3 | 26 | forebrain neuron development |
| GO:0001843 | 0.0049 | 4.8628 | 1.0991 | 5 | 85 | neural tube closure |
| GO:0006482 | 0.005 | 9.6655 | 0.3491 | 3 | 27 | protein demethylation |
| GO:0051674 | 0.005 | 1.7568 | 18.3491 | 30 | 1419 | localization of cell |
| GO:0030851 | 0.0055 | 9.2783 | 0.3621 | 3 | 28 | granulocyte differentiation |
| GO:1902230 | 0.0055 | 9.2783 | 0.3621 | 3 | 28 | negative regulation of intrinsic apoptotic signaling pathway in response to DNA damage |
| GO:0003149 | 0.0056 | 22.0096 | 0.1164 | 2 | 9 | membranous septum morphogenesis |
| GO:0010692 | 0.0056 | 22.0096 | 0.1164 | 2 | 9 | regulation of alkaline phosphatase activity |
| GO:0046549 | 0.0056 | 22.0096 | 0.1164 | 2 | 9 | retinal cone cell development |
| GO:0048705 | 0.0059 | 3.1189 | 2.7026 | 8 | 209 | skeletal system morphogenesis |
| GO:0030326 | 0.0059 | 3.8995 | 1.6293 | 6 | 126 | embryonic limb morphogenesis |
| GO:0001773 | 0.0061 | 8.9208 | 0.375 | 3 | 29 | myeloid dendritic cell activation |
| GO:0061036 | 0.0061 | 8.9208 | 0.375 | 3 | 29 | positive regulation of cartilage development |
| GO:1902893 | 0.0061 | 8.9208 | 0.375 | 3 | 29 | regulation of pri-miRNA transcription from RNA polymerase II promoter |
| GO:2000516 | 0.0061 | 8.9208 | 0.375 | 3 | 29 | positive regulation of CD4-positive, alpha-beta T cell activation |
| GO:0098609 | 0.0061 | 1.9959 | 10.0862 | 19 | 780 | cell-cell adhesion |
| GO:1902107 | 0.0062 | 3.867 | 1.6422 | 6 | 127 | positive regulation of leukocyte differentiation |
| GO:0060021 | 0.0065 | 4.5218 | 1.1767 | 5 | 91 | palate development |
| GO:0045669 | 0.0067 | 5.7447 | 0.75 | 4 | 58 | positive regulation of osteoblast differentiation |
| GO:0008584 | 0.0069 | 3.7728 | 1.681 | 6 | 130 | male gonad development |
| GO:0046085 | 0.007 | 19.2572 | 0.1293 | 2 | 10 | adenosine metabolic process |
| GO:0048340 | 0.007 | 19.2572 | 0.1293 | 2 | 10 | paraxial mesoderm morphogenesis |
| GO:0051573 | 0.007 | 19.2572 | 0.1293 | 2 | 10 | negative regulation of histone H3-K9 methylation |
| GO:0097659 | 0.0074 | 1.5832 | 29.9096 | 43 | 2482 | nucleic acid-templated transcription |
| GO:0060255 | 0.0076 | 1.4215 | 75.5431 | 93 | 5842 | regulation of macromolecule metabolic process |
| GO:0030278 | 0.008 | 3.2363 | 2.2759 | 7 | 176 | regulation of ossification |
| GO:1902742 | 0.008 | 7.9965 | 0.4138 | 3 | 32 | apoptotic process involved in development |
| GO:0090288 | 0.0082 | 3.6254 | 1.7457 | 6 | 135 | negative regulation of cellular response to growth factor stimulus |
| GO:0021670 | 0.0085 | 17.1165 | 0.1422 | 2 | 11 | lateral ventricle development |
| GO:0060439 | 0.0085 | 17.1165 | 0.1422 | 2 | 11 | trachea morphogenesis |
| GO:1904591 | 0.0085 | 4.2253 | 1.2543 | 5 | 97 | positive regulation of protein import |
| GO:0007435 | 0.0087 | 7.7295 | 0.4267 | 3 | 33 | salivary gland morphogenesis |
| GO:0001756 | 0.0089 | 5.2562 | 0.8147 | 4 | 63 | somitogenesis |
| GO:0010810 | 0.0093 | 3.1423 | 2.3405 | 7 | 181 | regulation of cell-substrate adhesion |
| GO:0031057 | 0.0095 | 7.4797 | 0.4397 | 3 | 34 | negative regulation of histone modification |
| GO:0048048 | 0.0095 | 7.4797 | 0.4397 | 3 | 34 | embryonic eye morphogenesis |
| GO:0010558 | 0.0096 | 1.6532 | 20.056 | 31 | 1551 | negative regulation of macromolecule biosynthetic process |
| GO:0001841 | 0.0096 | 4.0911 | 1.2931 | 5 | 100 | neural tube formation |
| GOMFID | Pvalue | OddsRatio | ExpCount | Count | Size | Term |
| GO:0051094 | 0 | 2.6698 | 16.2632 | 38 | 1206 | positive regulation of developmental process |
| GO:0048568 | 0 | 3.7876 | 5.5424 | 19 | 411 | embryonic organ development |
| GO:0060562 | 0 | 4.3518 | 4.0591 | 16 | 301 | epithelial tube morphogenesis |
| GO:0009792 | 0 | 3.1 | 7.4304 | 21 | 551 | embryo development ending in birth or egg hatching |
| GO:0048736 | 0 | 5.2758 | 2.2925 | 11 | 170 | appendage development |
| GO:0009887 | 0 | 2.825 | 9.3699 | 24 | 717 | animal organ morphogenesis |
| GO:0007156 | 0 | 5.3504 | 2.0498 | 10 | 152 | homophilic cell adhesion via plasma membrane adhesion molecules |
| GO:0045944 | 0 | 2.3826 | 14.4022 | 31 | 1068 | positive regulation of transcription from RNA polymerase II promoter |
| GO:0021510 | 0 | 6.8647 | 1.2946 | 8 | 96 | spinal cord development |
| GO:2001141 | 0 | 1.8182 | 46.8207 | 72 | 3472 | regulation of RNA biosynthetic process |
| GO:0001569 | 1e-04 | 14.3737 | 0.418 | 5 | 31 | branching involved in blood vessel morphogenesis |
| GO:0006355 | 1e-04 | 1.7982 | 46.4566 | 71 | 3445 | regulation of transcription, DNA-templated |
| GO:0048729 | 1e-04 | 2.7788 | 8.226 | 21 | 610 | tissue morphogenesis |
| GO:0035108 | 2e-04 | 5.0058 | 1.9554 | 9 | 145 | limb morphogenesis |
| GO:0000122 | 2e-04 | 2.4405 | 10.2218 | 23 | 758 | negative regulation of transcription from RNA polymerase II promoter |
| GO:0021915 | 3e-04 | 4.66 | 2.0902 | 9 | 155 | neural tube development |
| GO:0030182 | 3e-04 | 2.1168 | 16.0414 | 31 | 1200 | neuron differentiation |
| GO:1903507 | 3e-04 | 2.1364 | 15.3462 | 30 | 1138 | negative regulation of nucleic acid-templated transcription |
| GO:0051240 | 4e-04 | 1.9844 | 19.9716 | 36 | 1481 | positive regulation of multicellular organismal process |
| GO:0051253 | 4e-04 | 2.072 | 16.3441 | 31 | 1212 | negative regulation of RNA metabolic process |
| GO:0003002 | 4e-04 | 5.6129 | 1.3567 | 7 | 105 | regionalization |
| GO:0021879 | 5e-04 | 8.484 | 0.6608 | 5 | 49 | forebrain neuron differentiation |
| GO:0019219 | 6e-04 | 1.6269 | 54.2241 | 76 | 4021 | regulation of nucleobase-containing compound metabolic process |
| GO:0061138 | 6e-04 | 4.0934 | 2.3599 | 9 | 175 | morphogenesis of a branching epithelium |
| GO:0048935 | 6e-04 | 22.2375 | 0.1753 | 3 | 13 | peripheral nervous system neuron development |
| GO:0035148 | 7e-04 | 4.5292 | 1.9014 | 8 | 141 | tube formation |
| GO:0032736 | 8e-04 | 20.2146 | 0.1888 | 3 | 14 | positive regulation of interleukin-13 production |
| GO:0042487 | 8e-04 | 20.2146 | 0.1888 | 3 | 14 | regulation of odontogenesis of dentin-containing tooth |
| GO:0009952 | 8e-04 | 3.9157 | 2.4603 | 9 | 184 | anterior/posterior pattern specification |
| GO:0034654 | 9e-04 | 1.5951 | 55.0197 | 76 | 4080 | nucleobase-containing compound biosynthetic process |
| GO:0060581 | 0.001 | 18.5289 | 0.2023 | 3 | 15 | cell fate commitment involved in pattern specification |
| GO:0021555 | 0.0011 | 73.8203 | 0.0539 | 2 | 4 | midbrain-hindbrain boundary morphogenesis |
| GO:0045669 | 0.0011 | 7.0393 | 0.7821 | 5 | 58 | positive regulation of osteoblast differentiation |
| GO:0007267 | 0.0012 | 1.8592 | 20.5245 | 35 | 1522 | cell-cell signaling |
| GO:0014032 | 0.0013 | 6.7825 | 0.8091 | 5 | 60 | neural crest cell development |
| GO:0021514 | 0.0014 | 15.88 | 0.2292 | 3 | 17 | ventral spinal cord interneuron differentiation |
| GO:1903508 | 0.0015 | 1.8794 | 18.4613 | 32 | 1369 | positive regulation of nucleic acid-templated transcription |
| GO:0035113 | 0.0016 | 4.4123 | 1.6991 | 7 | 126 | embryonic appendage morphogenesis |
| GO:0001558 | 0.0016 | 2.761 | 5.003 | 13 | 371 | regulation of cell growth |
| GO:1902107 | 0.0017 | 4.3753 | 1.7126 | 7 | 127 | positive regulation of leukocyte differentiation |
| GO:0002568 | 0.0018 | 49.2104 | 0.0674 | 2 | 5 | somatic diversification of T cell receptor genes |
| GO:0033153 | 0.0018 | 49.2104 | 0.0674 | 2 | 5 | T cell receptor V(D)J recombination |
| GO:0045636 | 0.0018 | 49.2104 | 0.0674 | 2 | 5 | positive regulation of melanocyte differentiation |
| GO:0051254 | 0.0018 | 1.8428 | 19.4187 | 33 | 1440 | positive regulation of RNA metabolic process |
| GO:0007218 | 0.0018 | 5.0426 | 1.2811 | 6 | 95 | neuropeptide signaling pathway |
| GO:0008584 | 0.0019 | 4.2678 | 1.7531 | 7 | 130 | male gonad development |
| GO:0090596 | 0.002 | 3.1866 | 3.3308 | 10 | 247 | sensory organ morphogenesis |
| GO:0032753 | 0.002 | 13.8932 | 0.2562 | 3 | 19 | positive regulation of interleukin-4 production |
| GO:0048557 | 0.002 | 13.8932 | 0.2562 | 3 | 19 | embryonic digestive tract morphogenesis |
| GO:0048598 | 0.002 | 2.5821 | 5.7616 | 14 | 442 | embryonic morphogenesis |
| GO:2000026 | 0.0022 | 1.7378 | 24.4757 | 39 | 1815 | regulation of multicellular organismal development |
| GO:0001764 | 0.0023 | 4.1323 | 1.807 | 7 | 134 | neuron migration |
| GO:0007399 | 0.0023 | 2.3215 | 7.8521 | 17 | 643 | nervous system development |
| GO:0048863 | 0.0023 | 3.1067 | 3.4118 | 10 | 253 | stem cell differentiation |
| GO:0009890 | 0.0026 | 1.7548 | 22.2641 | 36 | 1651 | negative regulation of biosynthetic process |
| GO:0003180 | 0.0026 | 36.9055 | 0.0809 | 2 | 6 | aortic valve morphogenesis |
| GO:0043586 | 0.0027 | 12.348 | 0.2832 | 3 | 21 | tongue development |
| GO:0048485 | 0.0027 | 12.348 | 0.2832 | 3 | 21 | sympathetic nervous system development |
| GO:0040007 | 0.0028 | 1.9998 | 12.285 | 23 | 911 | growth |
| GO:0048701 | 0.0029 | 7.433 | 0.5933 | 4 | 44 | embryonic cranial skeleton morphogenesis |
| GO:0003208 | 0.0029 | 5.5635 | 0.9709 | 5 | 72 | cardiac ventricle morphogenesis |
| GO:0021513 | 0.0031 | 11.6974 | 0.2967 | 3 | 22 | spinal cord dorsal/ventral patterning |
| GO:0003151 | 0.0032 | 5.4016 | 0.9979 | 5 | 74 | outflow tract morphogenesis |
| GO:0010226 | 0.0035 | 11.1118 | 0.3102 | 3 | 23 | response to lithium ion |
| GO:0042832 | 0.0035 | 11.1118 | 0.3102 | 3 | 23 | defense response to protozoan |
| GO:0003357 | 0.0036 | 29.5226 | 0.0944 | 2 | 7 | noradrenergic neuron differentiation |
| GO:0048762 | 0.0037 | 3.3939 | 2.4948 | 8 | 185 | mesenchymal cell differentiation |
| GO:0048704 | 0.0037 | 6.8664 | 0.6372 | 4 | 48 | embryonic skeletal system morphogenesis |
| GO:0007275 | 0.0037 | 1.6123 | 35.8061 | 51 | 2945 | multicellular organism development |
| GO:0022008 | 0.0043 | 2.0696 | 9.7711 | 19 | 753 | neurogenesis |
| GO:0045992 | 0.0045 | 10.1004 | 0.3371 | 3 | 25 | negative regulation of embryonic development |
| GO:0032502 | 0.0045 | 1.7922 | 19.2844 | 31 | 1637 | developmental process |
| GO:0060541 | 0.0046 | 3.2633 | 2.5892 | 8 | 192 | respiratory system development |
| GO:0007519 | 0.0046 | 3.6152 | 2.0498 | 7 | 152 | skeletal muscle tissue development |
| GO:0046661 | 0.0047 | 3.5902 | 2.0632 | 7 | 153 | male sex differentiation |
| GO:0045630 | 0.0048 | 24.6006 | 0.1079 | 2 | 8 | positive regulation of T-helper 2 cell differentiation |
| GO:0060534 | 0.0048 | 24.6006 | 0.1079 | 2 | 8 | trachea cartilage development |
| GO:0071863 | 0.0048 | 24.6006 | 0.1079 | 2 | 8 | regulation of cell proliferation in bone marrow |
| GO:0042093 | 0.0049 | 6.3232 | 0.6877 | 4 | 51 | T-helper cell differentiation |
| GO:0001708 | 0.005 | 4.838 | 1.1058 | 5 | 82 | cell fate specification |
| GO:0061053 | 0.005 | 4.838 | 1.1058 | 5 | 82 | somite development |
| GO:0003205 | 0.0053 | 3.5173 | 2.1037 | 7 | 156 | cardiac chamber development |
| GO:2000113 | 0.0057 | 1.7079 | 20.1065 | 32 | 1491 | negative regulation of cellular macromolecule biosynthetic process |
| GO:0071773 | 0.0058 | 3.4472 | 2.1442 | 7 | 159 | cellular response to BMP stimulus |
| GO:0001838 | 0.0059 | 9.0478 | 0.3711 | 3 | 28 | embryonic epithelial tube formation |
| GO:0002293 | 0.006 | 5.9427 | 0.7282 | 4 | 54 | alpha-beta T cell differentiation involved in immune response |
| GO:0007405 | 0.006 | 5.9427 | 0.7282 | 4 | 54 | neuroblast proliferation |
| GO:0014807 | 0.0061 | 21.0849 | 0.1214 | 2 | 9 | regulation of somitogenesis |
| GO:0046549 | 0.0061 | 21.0849 | 0.1214 | 2 | 9 | retinal cone cell development |
| GO:0048087 | 0.0061 | 21.0849 | 0.1214 | 2 | 9 | positive regulation of developmental pigmentation |
| GO:0050932 | 0.0061 | 21.0849 | 0.1214 | 2 | 9 | regulation of pigment cell differentiation |
| GO:0048706 | 0.0063 | 8.8264 | 0.3789 | 3 | 29 | embryonic skeletal system development |
| GO:0043010 | 0.0064 | 2.6704 | 3.9377 | 10 | 292 | camera-type eye development |
| GO:0045595 | 0.0067 | 1.6622 | 21.9794 | 34 | 1644 | regulation of cell differentiation |
| GO:0010628 | 0.0069 | 1.6367 | 23.6666 | 36 | 1755 | positive regulation of gene expression |
| GO:0045137 | 0.0069 | 3.0299 | 2.778 | 8 | 206 | development of primary sexual characteristics |
| GO:0045600 | 0.0073 | 5.6053 | 0.7687 | 4 | 57 | positive regulation of fat cell differentiation |
| GO:0002828 | 0.0075 | 8.2274 | 0.4046 | 3 | 30 | regulation of type 2 immune response |
| GO:0032689 | 0.0075 | 8.2274 | 0.4046 | 3 | 30 | negative regulation of interferon-gamma production |
| GO:0040036 | 0.0075 | 8.2274 | 0.4046 | 3 | 30 | regulation of fibroblast growth factor receptor signaling pathway |
| GO:0071353 | 0.0075 | 8.2274 | 0.4046 | 3 | 30 | cellular response to interleukin-4 |
| GO:0014020 | 0.0081 | 4.2792 | 1.2406 | 5 | 92 | primary neural tube formation |
| GO:0035282 | 0.0081 | 4.2792 | 1.2406 | 5 | 92 | segmentation |
| GO:0009954 | 0.0082 | 7.933 | 0.418 | 3 | 31 | proximal/distal pattern formation |
| GO:0021522 | 0.0082 | 7.933 | 0.418 | 3 | 31 | spinal cord motor neuron differentiation |
| GO:0048608 | 0.0089 | 2.3113 | 5.448 | 12 | 404 | reproductive structure development |
| GO:0010557 | 0.0089 | 1.6365 | 21.5764 | 33 | 1600 | positive regulation of macromolecule biosynthetic process |
| GO:0035115 | 0.009 | 7.659 | 0.4315 | 3 | 32 | embryonic forelimb morphogenesis |
| GO:0021521 | 0.0092 | 16.3973 | 0.1483 | 2 | 11 | ventral spinal cord interneuron specification |
| GO:0021670 | 0.0092 | 16.3973 | 0.1483 | 2 | 11 | lateral ventricle development |
| GO:0021903 | 0.0092 | 16.3973 | 0.1483 | 2 | 11 | rostrocaudal neural tube patterning |
| GO:0032754 | 0.0092 | 16.3973 | 0.1483 | 2 | 11 | positive regulation of interleukin-5 production |
| GO:0042415 | 0.0092 | 16.3973 | 0.1483 | 2 | 11 | norepinephrine metabolic process |
| GO:0060033 | 0.0092 | 16.3973 | 0.1483 | 2 | 11 | anatomical structure regression |
| GO:2000774 | 0.0092 | 16.3973 | 0.1483 | 2 | 11 | positive regulation of cellular senescence |
| GO:0048869 | 0.0094 | 1.4418 | 52.4603 | 68 | 3961 | cellular developmental process |
| GO:0001662 | 0.0098 | 7.4032 | 0.445 | 3 | 33 | behavioral fear response |
| GO:0050767 | 0.0098 | 1.9712 | 9.0756 | 17 | 673 | regulation of neurogenesis |
| GOMFID | Pvalue | OddsRatio | ExpCount | Count | Size | Term |
| GO:0009593 | 0 | 13.3419 | 1.4377 | 14 | 449 | detection of chemical stimulus |
| GO:0050906 | 0 | 12.9739 | 1.4761 | 14 | 461 | detection of stimulus involved in sensory perception |
| GO:0007606 | 0 | 12.7971 | 1.4953 | 14 | 467 | sensory perception of chemical stimulus |
| GO:0050911 | 0 | 13.2654 | 1.1847 | 12 | 370 | detection of chemical stimulus involved in sensory perception of smell |
| GO:0050877 | 0 | 5.5812 | 3.8744 | 16 | 1210 | nervous system process |
| GO:0007186 | 0 | 4.8999 | 4.0089 | 15 | 1252 | G-protein coupled receptor signaling pathway |
| GO:0006688 | 1e-04 | 49.4939 | 0.0736 | 3 | 23 | glycosphingolipid biosynthetic process |
| GO:0019835 | 3e-04 | 25.3516 | 0.1345 | 3 | 42 | cytolysis |
| GO:0010623 | 8e-04 | 58.8255 | 0.0416 | 2 | 13 | programmed cell death involved in cell development |
| GO:0002418 | 9e-04 | 53.92 | 0.0448 | 2 | 14 | immune response to tumor cell |
| GO:0006955 | 0.001 | 3.0618 | 5.6607 | 14 | 1837 | immune response |
| GO:0052695 | 0.0013 | 43.128 | 0.0544 | 2 | 17 | cellular glucuronidation |
| GO:0030101 | 0.0016 | 14.0974 | 0.2337 | 3 | 73 | natural killer cell activation |
| GO:0006063 | 0.0022 | 32.336 | 0.0704 | 2 | 22 | uronic acid metabolic process |
| GO:0045321 | 0.0026 | 3.228 | 3.5926 | 10 | 1122 | leukocyte activation |
| GO:0002355 | 0.0032 | Inf | 0.0032 | 1 | 1 | detection of tumor cell |
| GO:0002642 | 0.0032 | Inf | 0.0032 | 1 | 1 | positive regulation of immunoglobulin biosynthetic process |
| GO:0030887 | 0.0032 | Inf | 0.0032 | 1 | 1 | positive regulation of myeloid dendritic cell activation |
| GO:0032078 | 0.0032 | Inf | 0.0032 | 1 | 1 | negative regulation of endodeoxyribonuclease activity |
| GO:1900758 | 0.0032 | Inf | 0.0032 | 1 | 1 | negative regulation of D-amino-acid oxidase activity |
| GO:0048265 | 0.0039 | 23.9422 | 0.0929 | 2 | 29 | response to pain |
| GO:0042113 | 0.0051 | 6.25 | 0.6948 | 4 | 217 | B cell activation |
| GO:0050715 | 0.0055 | 9.0315 | 0.3586 | 3 | 112 | positive regulation of cytokine secretion |
| GO:0009607 | 0.0056 | 3.2809 | 2.7473 | 8 | 858 | response to biotic stimulus |
| GO:1902042 | 0.0059 | 19.0047 | 0.1153 | 2 | 36 | negative regulation of extrinsic apoptotic signaling pathway via death domain receptors |
| GO:0006664 | 0.0061 | 8.7096 | 0.3714 | 3 | 116 | glycolipid metabolic process |
| GO:0002023 | 0.0064 | 317.3922 | 0.0064 | 1 | 2 | reduction of food intake in response to dietary excess |
| GO:0034021 | 0.0064 | 317.3922 | 0.0064 | 1 | 2 | response to silicon dioxide |
| GO:0035378 | 0.0064 | 317.3922 | 0.0064 | 1 | 2 | carbon dioxide transmembrane transport |
| GO:0036345 | 0.0064 | 317.3922 | 0.0064 | 1 | 2 | platelet maturation |
| GO:0043006 | 0.0064 | 317.3922 | 0.0064 | 1 | 2 | activation of phospholipase A2 activity by calcium-mediated signaling |
| GO:2000016 | 0.0064 | 317.3922 | 0.0064 | 1 | 2 | negative regulation of determination of dorsal identity |
| GO:2000351 | 0.0076 | 16.5631 | 0.1313 | 2 | 41 | regulation of endothelial cell apoptotic process |
| GO:0002793 | 0.0081 | 5.4454 | 0.7941 | 4 | 248 | positive regulation of peptide secretion |
| GO:0031343 | 0.0083 | 15.7532 | 0.1377 | 2 | 43 | positive regulation of cell killing |
| GO:0006874 | 0.0085 | 4.298 | 1.268 | 5 | 396 | cellular calcium ion homeostasis |
| GO:0060443 | 0.0087 | 15.3771 | 0.1409 | 2 | 44 | mammary gland morphogenesis |
| GO:0010469 | 0.0088 | 3.674 | 1.7963 | 6 | 561 | regulation of receptor activity |
| GO:0055065 | 0.009 | 3.6468 | 1.8091 | 6 | 565 | metal ion homeostasis |
| GO:0021553 | 0.0096 | 158.6863 | 0.0096 | 1 | 3 | olfactory nerve development |
| GO:0048388 | 0.0096 | 158.6863 | 0.0096 | 1 | 3 | endosomal lumen acidification |
| GO:0060648 | 0.0096 | 158.6863 | 0.0096 | 1 | 3 | mammary gland bud morphogenesis |
| GO:0060763 | 0.0096 | 158.6863 | 0.0096 | 1 | 3 | mammary duct terminal end bud growth |
| GO:0061368 | 0.0096 | 158.6863 | 0.0096 | 1 | 3 | behavioral response to formalin induced pain |
| GO:0099566 | 0.0096 | 158.6863 | 0.0096 | 1 | 3 | regulation of postsynaptic cytosolic calcium ion concentration |
| GO:1990743 | 0.0096 | 158.6863 | 0.0096 | 1 | 3 | protein sialylation |
| GO:0070231 | 0.0099 | 14.3493 | 0.1505 | 2 | 47 | T cell apoptotic process |
| GO:0046467 | 0.01 | 7.2263 | 0.4451 | 3 | 139 | membrane lipid biosynthetic process |
| GOMFID | Pvalue | OddsRatio | ExpCount | Count | Size | Term |
| GO:0007156 | 0 | 6.5627 | 1.8719 | 11 | 152 | homophilic cell adhesion via plasma membrane adhesion molecules |
| GO:0007399 | 0 | 3.145 | 8.228 | 23 | 717 | nervous system development |
| GO:0048736 | 0 | 5.8132 | 2.0936 | 11 | 170 | appendage development |
| GO:0007389 | 0 | 3.7083 | 5.0369 | 17 | 409 | pattern specification process |
| GO:0048568 | 1e-04 | 3.4441 | 5.0616 | 16 | 411 | embryonic organ development |
| GO:0000122 | 1e-04 | 2.7058 | 9.335 | 23 | 758 | negative regulation of transcription from RNA polymerase II promoter |
| GO:0035108 | 1e-04 | 5.5103 | 1.7857 | 9 | 145 | limb morphogenesis |
| GO:0045944 | 1e-04 | 2.3479 | 13.1527 | 28 | 1068 | positive regulation of transcription from RNA polymerase II promoter |
| GO:0021884 | 3e-04 | 14.859 | 0.3202 | 4 | 26 | forebrain neuron development |
| GO:0048704 | 3e-04 | 9.7145 | 0.5809 | 5 | 48 | embryonic skeletal system morphogenesis |
| GO:0001501 | 3e-04 | 2.9452 | 5.8621 | 16 | 476 | skeletal system development |
| GO:0009887 | 3e-04 | 2.2974 | 11.8719 | 25 | 964 | animal organ morphogenesis |
| GO:0022610 | 4e-04 | 2.0974 | 16.2685 | 31 | 1321 | biological adhesion |
| GO:0051253 | 4e-04 | 2.1298 | 14.9261 | 29 | 1212 | negative regulation of RNA metabolic process |
| GO:0043009 | 4e-04 | 2.7185 | 6.7365 | 17 | 547 | chordate embryonic development |
| GO:0140076 | 4e-04 | 162.0101 | 0.0369 | 2 | 3 | negative regulation of lipoprotein transport |
| GO:0048935 | 5e-04 | 24.4112 | 0.1601 | 3 | 13 | peripheral nervous system neuron development |
| GO:0051094 | 5e-04 | 3.3479 | 3.8581 | 12 | 335 | positive regulation of developmental process |
| GO:0001953 | 5e-04 | 12.1036 | 0.3818 | 4 | 31 | negative regulation of cell-matrix adhesion |
| GO:0098609 | 6e-04 | 2.362 | 9.6059 | 21 | 780 | cell-cell adhesion |
| GO:0045669 | 7e-04 | 7.7344 | 0.7143 | 5 | 58 | positive regulation of osteoblast differentiation |
| GO:1903507 | 8e-04 | 2.0972 | 14.0148 | 27 | 1138 | negative regulation of nucleic acid-templated transcription |
| GO:0021872 | 8e-04 | 7.5907 | 0.7266 | 5 | 59 | forebrain generation of neurons |
| GO:0014032 | 8e-04 | 7.4522 | 0.7389 | 5 | 60 | neural crest cell development |
| GO:0021555 | 9e-04 | 81 | 0.0493 | 2 | 4 | midbrain-hindbrain boundary morphogenesis |
| GO:0035113 | 9e-04 | 4.8525 | 1.5517 | 7 | 126 | embryonic appendage morphogenesis |
| GO:0072175 | 0.001 | 4.7717 | 1.5764 | 7 | 128 | epithelial tube formation |
| GO:0048863 | 0.0012 | 3.4215 | 3.1158 | 10 | 253 | stem cell differentiation |
| GO:0051240 | 0.0012 | 1.918 | 18.2389 | 32 | 1481 | positive regulation of multicellular organismal process |
| GO:0006355 | 0.0012 | 1.6413 | 42.4261 | 61 | 3445 | regulation of transcription, DNA-templated |
| GO:0045636 | 0.0015 | 53.9966 | 0.0616 | 2 | 5 | positive regulation of melanocyte differentiation |
| GO:2001141 | 0.0015 | 1.6248 | 42.7586 | 61 | 3472 | regulation of RNA biosynthetic process |
| GO:0035024 | 0.0015 | 15.2513 | 0.234 | 3 | 19 | negative regulation of Rho protein signal transduction |
| GO:1903305 | 0.0018 | 5.0311 | 1.2808 | 6 | 104 | regulation of regulated secretory pathway |
| GO:0009952 | 0.0019 | 3.7931 | 2.2449 | 8 | 184 | anterior/posterior pattern specification |
| GO:0019219 | 0.002 | 1.5752 | 49.5197 | 68 | 4021 | regulation of nucleobase-containing compound metabolic process |
| GO:0048701 | 0.0021 | 8.1633 | 0.5419 | 4 | 44 | embryonic cranial skeleton morphogenesis |
| GO:0043586 | 0.0021 | 13.555 | 0.2586 | 3 | 21 | tongue development |
| GO:0048762 | 0.0021 | 3.7342 | 2.2783 | 8 | 185 | mesenchymal cell differentiation |
| GO:0016331 | 0.0021 | 4.1794 | 1.7857 | 7 | 145 | morphogenesis of embryonic epithelium |
| GO:0022008 | 0.0026 | 1.8512 | 17.5616 | 30 | 1426 | neurogenesis |
| GO:0003357 | 0.003 | 32.3939 | 0.0862 | 2 | 7 | noradrenergic neuron differentiation |
| GO:0021953 | 0.0031 | 3.9072 | 1.9029 | 7 | 156 | central nervous system neuron differentiation |
| GO:0035239 | 0.0031 | 2.8054 | 4.1502 | 11 | 337 | tube morphogenesis |
| GO:0002703 | 0.0033 | 3.8421 | 1.9335 | 7 | 157 | regulation of leukocyte mediated immunity |
| GO:0060561 | 0.0035 | 11.0877 | 0.3079 | 3 | 25 | apoptotic process involved in morphogenesis |
| GO:0045165 | 0.0036 | 3.1286 | 3.0419 | 9 | 247 | cell fate commitment |
| GO:0006672 | 0.004 | 5.1154 | 1.0468 | 5 | 85 | ceramide metabolic process |
| GO:0021859 | 0.004 | 26.9933 | 0.0985 | 2 | 8 | pyramidal neuron differentiation |
| GO:0010557 | 0.0041 | 1.758 | 19.7044 | 32 | 1600 | positive regulation of macromolecule biosynthetic process |
| GO:0030851 | 0.0048 | 9.7553 | 0.3448 | 3 | 28 | granulocyte differentiation |
| GO:0043304 | 0.0048 | 9.7553 | 0.3448 | 3 | 28 | regulation of mast cell degranulation |
| GO:0002699 | 0.0048 | 3.5772 | 2.069 | 7 | 168 | positive regulation of immune effector process |
| GO:2000113 | 0.005 | 1.761 | 18.3621 | 30 | 1491 | negative regulation of cellular macromolecule biosynthetic process |
| GO:0010628 | 0.005 | 1.7041 | 21.6133 | 34 | 1755 | positive regulation of gene expression |
| GO:0048087 | 0.0051 | 23.1356 | 0.1108 | 2 | 9 | positive regulation of developmental pigmentation |
| GO:0050932 | 0.0051 | 23.1356 | 0.1108 | 2 | 9 | regulation of pigment cell differentiation |
| GO:0090370 | 0.0051 | 23.1356 | 0.1108 | 2 | 9 | negative regulation of cholesterol efflux |
| GO:2000109 | 0.0051 | 23.1356 | 0.1108 | 2 | 9 | regulation of macrophage apoptotic process |
| GO:1903508 | 0.0054 | 1.7844 | 16.8596 | 28 | 1369 | positive regulation of nucleic acid-templated transcription |
| GO:0002221 | 0.0057 | 3.4683 | 2.1305 | 7 | 173 | pattern recognition receptor signaling pathway |
| GO:0051254 | 0.0057 | 1.7583 | 17.734 | 29 | 1440 | positive regulation of RNA metabolic process |
| GO:0030278 | 0.0062 | 3.4061 | 2.1675 | 7 | 176 | regulation of ossification |
| GO:1901616 | 0.0064 | 5.8251 | 0.7389 | 4 | 60 | organic hydroxy compound catabolic process |
| GO:0003211 | 0.0064 | 20.2424 | 0.1232 | 2 | 10 | cardiac ventricle formation |
| GO:1902563 | 0.0064 | 20.2424 | 0.1232 | 2 | 10 | regulation of neutrophil activation |
| GO:0009954 | 0.0064 | 8.7085 | 0.3818 | 3 | 31 | proximal/distal pattern formation |
| GO:0009890 | 0.0065 | 1.6966 | 20.3325 | 32 | 1651 | negative regulation of biosynthetic process |
| GO:0021510 | 0.0067 | 4.4939 | 1.1823 | 5 | 96 | spinal cord development |
| GO:0010810 | 0.0072 | 3.3072 | 2.2291 | 7 | 181 | regulation of cell-substrate adhesion |
| GO:0034654 | 0.0073 | 1.4756 | 50.2463 | 66 | 4080 | nucleobase-containing compound biosynthetic process |
| GO:0022603 | 0.0074 | 1.8931 | 11.7857 | 21 | 957 | regulation of anatomical structure morphogenesis |
| GO:0042733 | 0.0075 | 5.5278 | 0.7759 | 4 | 63 | embryonic digit morphogenesis |
| GO:0080134 | 0.0076 | 1.7505 | 16.5025 | 27 | 1340 | regulation of response to stress |
| GO:0010985 | 0.0077 | 17.9921 | 0.1355 | 2 | 11 | negative regulation of lipoprotein particle clearance |
| GO:0021521 | 0.0077 | 17.9921 | 0.1355 | 2 | 11 | ventral spinal cord interneuron specification |
| GO:0021670 | 0.0077 | 17.9921 | 0.1355 | 2 | 11 | lateral ventricle development |
| GO:0021903 | 0.0077 | 17.9921 | 0.1355 | 2 | 11 | rostrocaudal neural tube patterning |
| GO:0031987 | 0.0077 | 17.9921 | 0.1355 | 2 | 11 | locomotion involved in locomotory behavior |
| GO:0060033 | 0.0077 | 17.9921 | 0.1355 | 2 | 11 | anatomical structure regression |
| GO:0007275 | 0.0078 | 1.4849 | 50.7076 | 66 | 4460 | multicellular organism development |
| GO:0001841 | 0.0079 | 4.3036 | 1.2315 | 5 | 100 | neural tube formation |
| GO:0061035 | 0.008 | 5.4354 | 0.7882 | 4 | 64 | regulation of cartilage development |
| GO:0061448 | 0.0082 | 2.942 | 2.8571 | 8 | 232 | connective tissue development |
| GO:0031057 | 0.0083 | 7.8643 | 0.4187 | 3 | 34 | negative regulation of histone modification |
| GO:0003341 | 0.0084 | 5.3459 | 0.8005 | 4 | 65 | cilium movement |
| GO:0017015 | 0.0086 | 4.2144 | 1.2562 | 5 | 102 | regulation of transforming growth factor beta receptor signaling pathway |
| GO:0032502 | 0.0089 | 1.7658 | 16.9757 | 27 | 1637 | developmental process |
| GO:0048869 | 0.0091 | 1.4792 | 45.3346 | 60 | 3796 | cellular developmental process |
| GO:0017121 | 0.0092 | 16.1919 | 0.1478 | 2 | 12 | phospholipid scrambling |
| GO:0042659 | 0.0092 | 16.1919 | 0.1478 | 2 | 12 | regulation of cell fate specification |
| GO:0045628 | 0.0092 | 16.1919 | 0.1478 | 2 | 12 | regulation of T-helper 2 cell differentiation |
| GO:0045597 | 0.0095 | 1.9433 | 9.797 | 18 | 813 | positive regulation of cell differentiation |
| GO:0033003 | 0.0097 | 7.3867 | 0.4433 | 3 | 36 | regulation of mast cell activation |
| GOMFID | Pvalue | OddsRatio | ExpCount | Count | Size | Term |
| GO:0007156 | 0 | 8.3185 | 2.0966 | 15 | 152 | homophilic cell adhesion via plasma membrane adhesion molecules |
| GO:0021510 | 0 | 11.6172 | 1.0219 | 10 | 75 | spinal cord development |
| GO:0045944 | 0 | 2.7803 | 14.731 | 36 | 1068 | positive regulation of transcription from RNA polymerase II promoter |
| GO:0045597 | 0 | 3.0773 | 11.0028 | 30 | 813 | positive regulation of cell differentiation |
| GO:0035107 | 0 | 6.7597 | 2 | 12 | 145 | appendage morphogenesis |
| GO:0060581 | 0 | 36.5434 | 0.2069 | 5 | 15 | cell fate commitment involved in pattern specification |
| GO:0000122 | 0 | 2.9914 | 10.4552 | 28 | 758 | negative regulation of transcription from RNA polymerase II promoter |
| GO:0060173 | 0 | 6.1236 | 2.1885 | 12 | 160 | limb development |
| GO:0021514 | 0 | 30.449 | 0.2345 | 5 | 17 | ventral spinal cord interneuron differentiation |
| GO:0007399 | 0 | 3.468 | 7.1489 | 22 | 604 | nervous system development |
| GO:0007389 | 0 | 3.9809 | 4.9981 | 18 | 375 | pattern specification process |
| GO:0022008 | 0 | 2.8686 | 11.3649 | 29 | 865 | neurogenesis |
| GO:0030182 | 0 | 3.1988 | 7.9926 | 23 | 613 | neuron differentiation |
| GO:0003151 | 0 | 8.9506 | 1.0207 | 8 | 74 | outflow tract morphogenesis |
| GO:0009952 | 0 | 5.2863 | 2.5056 | 12 | 184 | anterior/posterior pattern specification |
| GO:0021513 | 0 | 21.4867 | 0.3034 | 5 | 22 | spinal cord dorsal/ventral patterning |
| GO:0009790 | 0 | 2.6995 | 11.5071 | 28 | 849 | embryo development |
| GO:0001764 | 0 | 5.9888 | 1.8483 | 10 | 134 | neuron migration |
| GO:0048935 | 0 | 32.3374 | 0.1793 | 4 | 13 | peripheral nervous system neuron development |
| GO:0006355 | 0 | 1.8505 | 47.5172 | 74 | 3445 | regulation of transcription, DNA-templated |
| GO:2001141 | 0 | 1.8319 | 47.8897 | 74 | 3472 | regulation of RNA biosynthetic process |
| GO:0003214 | 0 | 29.1018 | 0.1931 | 4 | 14 | cardiac left ventricle morphogenesis |
| GO:0007218 | 1e-04 | 6.7812 | 1.3103 | 8 | 95 | neuropeptide signaling pathway |
| GO:0007267 | 1e-04 | 2.132 | 20.9931 | 40 | 1522 | cell-cell signaling |
| GO:0048870 | 1e-04 | 2.1651 | 19.5724 | 38 | 1419 | cell motility |
| GO:0007411 | 1e-04 | 4.3019 | 3.0345 | 12 | 220 | axon guidance |
| GO:1903508 | 1e-04 | 2.1812 | 18.8828 | 37 | 1369 | positive regulation of nucleic acid-templated transcription |
| GO:0021522 | 1e-04 | 14.0411 | 0.4276 | 5 | 31 | spinal cord motor neuron differentiation |
| GO:0022610 | 1e-04 | 2.1952 | 18.2207 | 36 | 1321 | biological adhesion |
| GO:0019219 | 1e-04 | 1.7361 | 55.4621 | 81 | 4021 | regulation of nucleobase-containing compound metabolic process |
| GO:0003357 | 1e-04 | 54.3394 | 0.0966 | 3 | 7 | noradrenergic neuron differentiation |
| GO:0060284 | 1e-04 | 2.484 | 10.9793 | 25 | 796 | regulation of cell development |
| GO:0048729 | 1e-04 | 2.7095 | 8.4138 | 21 | 610 | tissue morphogenesis |
| GO:0051240 | 1e-04 | 2.0633 | 20.4276 | 38 | 1481 | positive regulation of multicellular organismal process |
| GO:0051254 | 2e-04 | 2.0608 | 19.8621 | 37 | 1440 | positive regulation of RNA metabolic process |
| GO:0072089 | 2e-04 | 5.6667 | 1.5448 | 8 | 112 | stem cell proliferation |
| GO:0007268 | 2e-04 | 2.6762 | 8.0828 | 20 | 586 | chemical synaptic transmission |
| GO:0072272 | 2e-04 | Inf | 0.0276 | 2 | 2 | proximal/distal pattern formation involved in metanephric nephron development |
| GO:0099537 | 2e-04 | 2.6664 | 8.1103 | 20 | 588 | trans-synaptic signaling |
| GO:0060322 | 2e-04 | 2.53 | 9.4207 | 22 | 683 | head development |
| GO:1903507 | 2e-04 | 2.1632 | 15.6966 | 31 | 1138 | negative regulation of nucleic acid-templated transcription |
| GO:0001709 | 2e-04 | 10.4247 | 0.5517 | 5 | 40 | cell fate determination |
| GO:0009887 | 2e-04 | 2.5658 | 8.8838 | 21 | 685 | animal organ morphogenesis |
| GO:0021879 | 2e-04 | 15.5702 | 0.3121 | 4 | 23 | forebrain neuron differentiation |
| GO:0003231 | 2e-04 | 5.307 | 1.6414 | 8 | 119 | cardiac ventricle development |
| GO:0001667 | 2e-04 | 3.2493 | 4.6345 | 14 | 336 | ameboidal-type cell migration |
| GO:0007519 | 3e-04 | 4.6465 | 2.0966 | 9 | 152 | skeletal muscle tissue development |
| GO:0003211 | 3e-04 | 31.0452 | 0.1379 | 3 | 10 | cardiac ventricle formation |
| GO:0035640 | 3e-04 | 14.5418 | 0.331 | 4 | 24 | exploration behavior |
| GO:0001501 | 3e-04 | 2.7835 | 6.5655 | 17 | 476 | skeletal system development |
| GO:0051960 | 3e-04 | 2.3756 | 10.469 | 23 | 759 | regulation of nervous system development |
| GO:0021903 | 4e-04 | 27.1629 | 0.1517 | 3 | 11 | rostrocaudal neural tube patterning |
| GO:0030900 | 4e-04 | 3.083 | 4.869 | 14 | 353 | forebrain development |
| GO:0021884 | 4e-04 | 13.2182 | 0.3586 | 4 | 26 | forebrain neuron development |
| GO:0034654 | 4e-04 | 1.6361 | 56.2759 | 79 | 4080 | nucleobase-containing compound biosynthetic process |
| GO:0048869 | 4e-04 | 1.7586 | 37.4773 | 57 | 2997 | cellular developmental process |
| GO:0061564 | 5e-04 | 2.8016 | 6.1241 | 16 | 444 | axon development |
| GO:0007275 | 5e-04 | 1.723 | 44.7093 | 65 | 3729 | multicellular organism development |
| GO:0048704 | 5e-04 | 8.6171 | 0.652 | 5 | 48 | embryonic skeletal system morphogenesis |
| GO:0010628 | 5e-04 | 1.8695 | 24.2069 | 41 | 1755 | positive regulation of gene expression |
| GO:0010454 | 5e-04 | 24.1433 | 0.1655 | 3 | 12 | negative regulation of cell fate commitment |
| GO:0048863 | 6e-04 | 3.5298 | 3.3373 | 11 | 244 | stem cell differentiation |
| GO:0021912 | 6e-04 | 144.2793 | 0.0414 | 2 | 3 | regulation of transcription from RNA polymerase II promoter involved in spinal cord motor neuron fate specification |
| GO:0010557 | 6e-04 | 1.8905 | 22.069 | 38 | 1600 | positive regulation of macromolecule biosynthetic process |
| GO:0048667 | 6e-04 | 2.6299 | 6.9241 | 17 | 502 | cell morphogenesis involved in neuron differentiation |
| GO:0051253 | 6e-04 | 2.0176 | 16.7172 | 31 | 1212 | negative regulation of RNA metabolic process |
| GO:0010811 | 6e-04 | 5.2396 | 1.4483 | 7 | 105 | positive regulation of cell-substrate adhesion |
| GO:0060537 | 7e-04 | 2.9075 | 5.1448 | 14 | 373 | muscle tissue development |
| GO:0048812 | 8e-04 | 2.5042 | 7.6966 | 18 | 558 | neuron projection morphogenesis |
| GO:0009954 | 8e-04 | 10.767 | 0.4276 | 4 | 31 | proximal/distal pattern formation |
| GO:0007626 | 8e-04 | 4.9811 | 1.5174 | 7 | 112 | locomotory behavior |
| GO:0048592 | 8e-04 | 4.3569 | 1.9724 | 8 | 143 | eye morphogenesis |
| GO:0043009 | 9e-04 | 2.8403 | 5.264 | 14 | 392 | chordate embryonic development |
| GO:0051093 | 9e-04 | 2.1653 | 11.931 | 24 | 865 | negative regulation of developmental process |
| GO:0035115 | 9e-04 | 10.3818 | 0.4414 | 4 | 32 | embryonic forelimb morphogenesis |
| GO:0032989 | 0.001 | 2.0778 | 13.4897 | 26 | 978 | cellular component morphogenesis |
| GO:0007379 | 0.001 | 18.1041 | 0.2069 | 3 | 15 | segment specification |
| GO:0035295 | 0.0011 | 3.7871 | 2.5405 | 9 | 192 | tube development |
| GO:0048858 | 0.0011 | 2.4251 | 7.931 | 18 | 575 | cell projection morphogenesis |
| GO:0048762 | 0.0011 | 3.7674 | 2.5517 | 9 | 185 | mesenchymal cell differentiation |
| GO:0021913 | 0.0011 | 72.1351 | 0.0552 | 2 | 4 | regulation of transcription from RNA polymerase II promoter involved in ventral spinal cord interneuron specification |
| GO:0034287 | 0.0011 | 72.1351 | 0.0552 | 2 | 4 | detection of monosaccharide stimulus |
| GO:0042662 | 0.0011 | 72.1351 | 0.0552 | 2 | 4 | negative regulation of mesodermal cell fate specification |
| GO:0051594 | 0.0011 | 72.1351 | 0.0552 | 2 | 4 | detection of glucose |
| GO:0060214 | 0.0011 | 72.1351 | 0.0552 | 2 | 4 | endocardium formation |
| GO:0072086 | 0.0011 | 72.1351 | 0.0552 | 2 | 4 | specification of loop of Henle identity |
| GO:1905903 | 0.0011 | 72.1351 | 0.0552 | 2 | 4 | negative regulation of mesoderm formation |
| GO:0098609 | 0.0012 | 2.1923 | 10.7586 | 22 | 780 | cell-cell adhesion |
| GO:0045669 | 0.0012 | 6.8765 | 0.8 | 5 | 58 | positive regulation of osteoblast differentiation |
| GO:0021915 | 0.0014 | 3.9982 | 2.1379 | 8 | 155 | neural tube development |
| GO:0014032 | 0.0014 | 6.6256 | 0.8276 | 5 | 60 | neural crest cell development |
| GO:0050793 | 0.0014 | 1.879 | 19.213 | 33 | 1477 | regulation of developmental process |
| GO:1990830 | 0.0014 | 5.2834 | 1.2276 | 6 | 89 | cellular response to leukemia inhibitory factor |
| GO:0031328 | 0.0015 | 1.78 | 23.931 | 39 | 1735 | positive regulation of cellular biosynthetic process |
| GO:0014003 | 0.0015 | 9.0818 | 0.4966 | 4 | 36 | oligodendrocyte development |
| GO:0060219 | 0.0015 | 15.5158 | 0.2345 | 3 | 17 | camera-type eye photoreceptor cell differentiation |
| GO:0045664 | 0.0016 | 2.3949 | 7.5586 | 17 | 548 | regulation of neuron differentiation |
| GO:0060021 | 0.0016 | 5.1584 | 1.2552 | 6 | 91 | palate development |
| GO:0050768 | 0.0017 | 3.2502 | 3.269 | 10 | 237 | negative regulation of neurogenesis |
| GO:0030326 | 0.0018 | 5.0658 | 1.2759 | 6 | 94 | embryonic limb morphogenesis |
| GO:0021778 | 0.0018 | 48.0871 | 0.069 | 2 | 5 | oligodendrocyte cell fate specification |
| GO:0045636 | 0.0018 | 48.0871 | 0.069 | 2 | 5 | positive regulation of melanocyte differentiation |
| GO:0007423 | 0.0021 | 2.402 | 7.0759 | 16 | 513 | sensory organ development |
| GO:0009890 | 0.0021 | 1.7655 | 22.7724 | 37 | 1651 | negative regulation of biosynthetic process |
| GO:0007517 | 0.0021 | 2.6794 | 5.1448 | 13 | 373 | muscle organ development |
| GO:0002089 | 0.0021 | 13.5747 | 0.2621 | 3 | 19 | lens morphogenesis in camera-type eye |
| GO:0046883 | 0.0022 | 3.138 | 3.3793 | 10 | 245 | regulation of hormone secretion |
| GO:0030324 | 0.0022 | 3.6937 | 2.3034 | 8 | 167 | lung development |
| GO:0060411 | 0.0023 | 5.8749 | 0.9241 | 5 | 67 | cardiac septum morphogenesis |
| GO:0045446 | 0.0024 | 4.7639 | 1.3517 | 6 | 98 | endothelial cell differentiation |
| GO:2000113 | 0.0024 | 1.7881 | 20.5655 | 34 | 1491 | negative regulation of cellular macromolecule biosynthetic process |
| GO:0023019 | 0.0025 | 12.7754 | 0.2759 | 3 | 20 | signal transduction involved in regulation of gene expression |
| GO:0060039 | 0.0025 | 12.7754 | 0.2759 | 3 | 20 | pericardium development |
| GO:0048646 | 0.0025 | 1.9617 | 13.646 | 25 | 998 | anatomical structure formation involved in morphogenesis |
| GO:0035239 | 0.0026 | 2.7328 | 4.6483 | 12 | 337 | tube morphogenesis |
| GO:0021902 | 0.0027 | 36.0631 | 0.0828 | 2 | 6 | commitment of neuronal cell to specific neuron type in forebrain |
| GO:0030240 | 0.0027 | 36.0631 | 0.0828 | 2 | 6 | skeletal muscle thin filament assembly |
| GO:0032229 | 0.0027 | 36.0631 | 0.0828 | 2 | 6 | negative regulation of synaptic transmission, GABAergic |
| GO:0033603 | 0.0027 | 36.0631 | 0.0828 | 2 | 6 | positive regulation of dopamine secretion |
| GO:0008306 | 0.0028 | 5.6027 | 0.9655 | 5 | 70 | associative learning |
| GO:0007617 | 0.0029 | 12.0649 | 0.2897 | 3 | 21 | mating behavior |
| GO:0021516 | 0.0029 | 12.0649 | 0.2897 | 3 | 21 | dorsal spinal cord development |
| GO:0048485 | 0.0029 | 12.0649 | 0.2897 | 3 | 21 | sympathetic nervous system development |
| GO:0048701 | 0.0031 | 7.2618 | 0.6069 | 4 | 44 | embryonic cranial skeleton morphogenesis |
| GO:0048665 | 0.0031 | 11.6347 | 0.2982 | 3 | 22 | neuron fate specification |
| GO:0007631 | 0.0033 | 4.4251 | 1.4483 | 6 | 105 | feeding behavior |
| GO:0031018 | 0.0034 | 7.0843 | 0.6207 | 4 | 45 | endocrine pancreas development |
| GO:0003206 | 0.0034 | 7.0445 | 0.6232 | 4 | 46 | cardiac chamber morphogenesis |
| GO:0050769 | 0.0035 | 2.5081 | 5.4759 | 13 | 397 | positive regulation of neurogenesis |
| GO:0048562 | 0.0036 | 3.4014 | 2.4898 | 8 | 187 | embryonic organ morphogenesis |
| GO:0021521 | 0.0037 | 29.1073 | 0.0957 | 2 | 7 | ventral spinal cord interneuron specification |
| GO:0001655 | 0.0037 | 2.7333 | 4.2483 | 11 | 308 | urogenital system development |
| GO:0043279 | 0.0038 | 4.2941 | 1.4897 | 6 | 108 | response to alkaloid |
| GO:0002067 | 0.004 | 6.7539 | 0.6483 | 4 | 47 | glandular epithelial cell differentiation |
| GO:2000179 | 0.004 | 6.7539 | 0.6483 | 4 | 47 | positive regulation of neural precursor cell proliferation |
| GO:0008344 | 0.004 | 5.1273 | 1.0483 | 5 | 76 | adult locomotory behavior |
| GO:0016331 | 0.004 | 3.7115 | 2 | 7 | 145 | morphogenesis of embryonic epithelium |
| GO:0001708 | 0.0041 | 6.6541 | 0.6561 | 4 | 49 | cell fate specification |
| GO:0048732 | 0.0047 | 2.4177 | 5.669 | 13 | 411 | gland development |
| GO:0048596 | 0.0048 | 9.8688 | 0.3448 | 3 | 25 | embryonic camera-type eye morphogenesis |
| GO:0032502 | 0.0049 | 1.9013 | 14.6261 | 25 | 1368 | developmental process |
| GO:0061178 | 0.0049 | 6.3123 | 0.6897 | 4 | 50 | regulation of insulin secretion involved in cellular response to glucose stimulus |
| GO:0021859 | 0.005 | 24.039 | 0.1103 | 2 | 8 | pyramidal neuron differentiation |
| GO:0033860 | 0.005 | 24.039 | 0.1103 | 2 | 8 | regulation of NAD(P)H oxidase activity |
| GO:0045924 | 0.005 | 24.039 | 0.1103 | 2 | 8 | regulation of female receptivity |
| GO:0061303 | 0.005 | 24.039 | 0.1103 | 2 | 8 | cornea development in camera-type eye |
| GO:2000035 | 0.005 | 24.039 | 0.1103 | 2 | 8 | regulation of stem cell division |
| GO:0002011 | 0.0053 | 6.1776 | 0.7034 | 4 | 51 | morphogenesis of an epithelial sheet |
| GO:0002063 | 0.0053 | 9.4391 | 0.3586 | 3 | 26 | chondrocyte development |
| GO:0061053 | 0.0055 | 4.726 | 1.131 | 5 | 82 | somite development |
| GO:0030198 | 0.0057 | 2.5741 | 4.4966 | 11 | 326 | extracellular matrix organization |
| GO:0061311 | 0.0059 | 9.0452 | 0.3724 | 3 | 27 | cell surface receptor signaling pathway involved in heart development |
| GO:0045927 | 0.006 | 2.8731 | 3.2966 | 9 | 239 | positive regulation of growth |
| GO:0000904 | 0.0062 | 3.866 | 1.6441 | 6 | 125 | cell morphogenesis involved in differentiation |
| GO:0019098 | 0.0062 | 20.8624 | 0.1226 | 2 | 9 | reproductive behavior |
| GO:0003266 | 0.0064 | 20.6036 | 0.1241 | 2 | 9 | regulation of secondary heart field cardioblast proliferation |
| GO:0007614 | 0.0064 | 20.6036 | 0.1241 | 2 | 9 | short-term memory |
| GO:0046549 | 0.0064 | 20.6036 | 0.1241 | 2 | 9 | retinal cone cell development |
| GO:0046877 | 0.0064 | 20.6036 | 0.1241 | 2 | 9 | regulation of saliva secretion |
| GO:0048087 | 0.0064 | 20.6036 | 0.1241 | 2 | 9 | positive regulation of developmental pigmentation |
| GO:0048865 | 0.0064 | 20.6036 | 0.1241 | 2 | 9 | stem cell fate commitment |
| GO:0050932 | 0.0064 | 20.6036 | 0.1241 | 2 | 9 | regulation of pigment cell differentiation |
| GO:0061004 | 0.0064 | 20.6036 | 0.1241 | 2 | 9 | pattern specification involved in kidney development |
| GO:1905770 | 0.0064 | 20.6036 | 0.1241 | 2 | 9 | regulation of mesodermal cell differentiation |
| GO:1902692 | 0.0066 | 8.6829 | 0.3862 | 3 | 28 | regulation of neuroblast proliferation |
| GO:0071805 | 0.0067 | 3.0525 | 2.7586 | 8 | 200 | potassium ion transmembrane transport |
| GO:0021543 | 0.0068 | 3.3445 | 2.2069 | 7 | 160 | pallium development |
| GO:0040012 | 0.007 | 1.8976 | 11.7103 | 21 | 849 | regulation of locomotion |
| GO:0010719 | 0.0073 | 8.3484 | 0.4 | 3 | 29 | negative regulation of epithelial to mesenchymal transition |
| GO:0046530 | 0.0074 | 5.5818 | 0.7724 | 4 | 56 | photoreceptor cell differentiation |
| GO:0003263 | 0.0079 | 18.027 | 0.1379 | 2 | 10 | cardioblast proliferation |
| GO:0035878 | 0.0079 | 18.027 | 0.1379 | 2 | 10 | nail development |
| GO:0048845 | 0.0079 | 18.027 | 0.1379 | 2 | 10 | venous blood vessel morphogenesis |
| GO:0072175 | 0.0087 | 3.5857 | 1.7655 | 6 | 128 | epithelial tube formation |
| GO:0009914 | 0.0087 | 2.5429 | 4.1241 | 10 | 299 | hormone transport |
| GO:0001569 | 0.0088 | 7.7511 | 0.4276 | 3 | 31 | branching involved in blood vessel morphogenesis |
| GO:0003209 | 0.0088 | 7.7511 | 0.4276 | 3 | 31 | cardiac atrium morphogenesis |
| GO:0090130 | 0.0093 | 2.6725 | 3.531 | 9 | 256 | tissue migration |
| GO:0051705 | 0.0094 | 5.1818 | 0.8276 | 4 | 60 | multi-organism behavior |
| GO:0008038 | 0.0096 | 7.4834 | 0.4414 | 3 | 32 | neuron recognition |
| GO:0043278 | 0.0096 | 7.4834 | 0.4414 | 3 | 32 | response to morphine |
| GO:0003157 | 0.0096 | 16.023 | 0.1517 | 2 | 11 | endocardium development |
| GO:0009886 | 0.0096 | 16.023 | 0.1517 | 2 | 11 | post-embryonic animal morphogenesis |
| GO:0042415 | 0.0096 | 16.023 | 0.1517 | 2 | 11 | norepinephrine metabolic process |
| GO:0050890 | 0.0097 | 2.6507 | 3.5586 | 9 | 258 | cognition |
| GOMFID | Pvalue | OddsRatio | ExpCount | Count | Size | Term |
| GO:0007156 | 9e-04 | 4.8673 | 1.5443 | 7 | 152 | homophilic cell adhesion via plasma membrane adhesion molecules |
| GO:0061844 | 0.0018 | 8.4726 | 0.5182 | 4 | 51 | antimicrobial humoral immune response mediated by antimicrobial peptide |
| GO:0006376 | 0.0025 | 12.385 | 0.2743 | 3 | 27 | mRNA splice site selection |
| GO:0098660 | 0.0026 | 2.2988 | 7.9452 | 17 | 782 | inorganic ion transmembrane transport |
| GO:0016339 | 0.0028 | 11.8889 | 0.2845 | 3 | 28 | calcium-dependent cell-cell adhesion via plasma membrane cell adhesion molecules |
| GO:0006813 | 0.0029 | 3.5259 | 2.4079 | 8 | 237 | potassium ion transport |
| GO:0050684 | 0.0047 | 4.8937 | 1.0871 | 5 | 107 | regulation of mRNA processing |
| GO:0006812 | 0.0054 | 1.9961 | 10.7595 | 20 | 1059 | cation transport |
| GO:0019731 | 0.0067 | 8.4868 | 0.3861 | 3 | 38 | antibacterial humoral response |
| GO:0050832 | 0.0072 | 8.2505 | 0.3962 | 3 | 39 | defense response to fungus |
| GO:0070986 | 0.0074 | 17.9186 | 0.1321 | 2 | 13 | left/right axis specification |
| GO:0043269 | 0.0083 | 2.2566 | 6.0961 | 13 | 600 | regulation of ion transport |
| GO:0006836 | 0.0085 | 3.5946 | 1.7577 | 6 | 173 | neurotransmitter transport |
| GO:0051852 | 0.0086 | 16.4243 | 0.1422 | 2 | 14 | disruption by host of symbiont cells |
| GOMFID | Pvalue | OddsRatio | ExpCount | Count | Size | Term |
| GO:0002263 | 0 | 5.4879 | 7.3559 | 33 | 660 | cell activation involved in immune response |
| GO:0045087 | 0 | 4.0643 | 9.3398 | 32 | 838 | innate immune response |
| GO:0002285 | 0 | 9.5323 | 1.7164 | 14 | 154 | lymphocyte activation involved in immune response |
| GO:0050900 | 0 | 5.3434 | 4.525 | 21 | 406 | leukocyte migration |
| GO:0045321 | 0 | 4.2469 | 6.8579 | 25 | 664 | leukocyte activation |
| GO:0002275 | 0 | 4.3325 | 5.7844 | 22 | 519 | myeloid cell activation involved in immune response |
| GO:0002444 | 0 | 3.9618 | 5.6682 | 20 | 514 | myeloid leukocyte mediated immunity |
| GO:0090026 | 0 | 35.0656 | 0.2006 | 5 | 18 | positive regulation of monocyte chemotaxis |
| GO:0071222 | 0 | 6.7269 | 1.8278 | 11 | 164 | cellular response to lipopolysaccharide |
| GO:0007166 | 0 | 2.2452 | 28.5468 | 53 | 2600 | cell surface receptor signaling pathway |
| GO:1903039 | 0 | 5.602 | 2.374 | 12 | 213 | positive regulation of leukocyte cell-cell adhesion |
| GO:0043312 | 0 | 3.8392 | 5.2049 | 18 | 467 | neutrophil degranulation |
| GO:0032940 | 0 | 2.5932 | 15.0545 | 34 | 1365 | secretion by cell |
| GO:0042119 | 0 | 3.7532 | 5.3163 | 18 | 477 | neutrophil activation |
| GO:0051251 | 0 | 4.9536 | 2.8978 | 13 | 260 | positive regulation of lymphocyte activation |
| GO:0060326 | 0 | 4.9333 | 2.9089 | 13 | 261 | cell chemotaxis |
| GO:0050867 | 0 | 4.5907 | 3.3659 | 14 | 302 | positive regulation of cell activation |
| GO:0022610 | 0 | 2.5571 | 14.723 | 33 | 1321 | biological adhesion |
| GO:0050863 | 0 | 4.4953 | 3.4328 | 14 | 308 | regulation of T cell activation |
| GO:0071216 | 0 | 5.7081 | 2.1288 | 11 | 191 | cellular response to biotic stimulus |
| GO:0002322 | 0 | 135.3118 | 0.0557 | 3 | 5 | B cell proliferation involved in immune response |
| GO:0045055 | 0 | 3.1007 | 7.8909 | 22 | 708 | regulated exocytosis |
| GO:0042330 | 0 | 3.3577 | 6.2525 | 19 | 561 | taxis |
| GO:0032946 | 0 | 6.7794 | 1.4712 | 9 | 132 | positive regulation of mononuclear cell proliferation |
| GO:0045785 | 0 | 3.9072 | 4.2129 | 15 | 378 | positive regulation of cell adhesion |
| GO:0070098 | 0 | 8.8098 | 0.8916 | 7 | 80 | chemokine-mediated signaling pathway |
| GO:0046651 | 0 | 10.9874 | 0.6216 | 6 | 59 | lymphocyte proliferation |
| GO:0046631 | 0 | 7.0263 | 1.2594 | 8 | 113 | alpha-beta T cell activation |
| GO:0002684 | 0 | 4.7799 | 2.5212 | 11 | 242 | positive regulation of immune system process |
| GO:0022407 | 1e-04 | 3.602 | 4.5473 | 15 | 408 | regulation of cell-cell adhesion |
| GO:0030593 | 1e-04 | 7.9357 | 0.9808 | 7 | 88 | neutrophil chemotaxis |
| GO:0002521 | 1e-04 | 3.4024 | 5.138 | 16 | 461 | leukocyte differentiation |
| GO:0097530 | 1e-04 | 6.4679 | 1.3597 | 8 | 122 | granulocyte migration |
| GO:0070661 | 1e-04 | 9.6945 | 0.6958 | 6 | 66 | leukocyte proliferation |
| GO:0043615 | 1e-04 | 54.1146 | 0.0892 | 3 | 8 | astrocyte cell migration |
| GO:0071675 | 1e-04 | 12.6444 | 0.457 | 5 | 41 | regulation of mononuclear cell migration |
| GO:0002440 | 1e-04 | 5.266 | 1.8613 | 9 | 167 | production of molecular mediator of immune response |
| GO:0050670 | 1e-04 | 6.0111 | 1.4554 | 8 | 133 | regulation of lymphocyte proliferation |
| GO:0051707 | 1e-04 | 2.6672 | 9.0723 | 22 | 814 | response to other organism |
| GO:0042107 | 1e-04 | Inf | 0.0218 | 2 | 2 | cytokine metabolic process |
| GO:2000458 | 1e-04 | Inf | 0.0223 | 2 | 2 | regulation of astrocyte chemotaxis |
| GO:0070663 | 2e-04 | 5.6884 | 1.5324 | 8 | 140 | regulation of leukocyte proliferation |
| GO:0035589 | 2e-04 | 38.6485 | 0.1115 | 3 | 10 | G-protein coupled purinergic nucleotide receptor signaling pathway |
| GO:0071346 | 2e-04 | 5.5796 | 1.5603 | 8 | 140 | cellular response to interferon-gamma |
| GO:0030183 | 2e-04 | 6.1718 | 1.2371 | 7 | 111 | B cell differentiation |
| GO:0050792 | 3e-04 | 4.6684 | 2.0842 | 9 | 187 | regulation of viral process |
| GO:0032729 | 3e-04 | 9.786 | 0.5734 | 5 | 52 | positive regulation of interferon-gamma production |
| GO:0002237 | 3e-04 | 3.5489 | 3.6445 | 12 | 327 | response to molecule of bacterial origin |
| GO:0007194 | 5e-04 | 12.0746 | 0.3789 | 4 | 34 | negative regulation of adenylate cyclase activity |
| GO:0002292 | 5e-04 | 8.2665 | 0.6687 | 5 | 60 | T cell differentiation involved in immune response |
| GO:0002694 | 6e-04 | 3.5371 | 3.3414 | 11 | 309 | regulation of leukocyte activation |
| GO:0002313 | 6e-04 | 22.5379 | 0.1672 | 3 | 15 | mature B cell differentiation involved in immune response |
| GO:0023052 | 8e-04 | 1.6288 | 67.6855 | 89 | 6073 | signaling |
| GO:0006950 | 8e-04 | 1.7078 | 40.1566 | 59 | 3603 | response to stress |
| GO:0006959 | 8e-04 | 3.9491 | 2.4408 | 9 | 219 | humoral immune response |
| GO:0002710 | 8e-04 | 19.3158 | 0.1895 | 3 | 17 | negative regulation of T cell mediated immunity |
| GO:0006955 | 9e-04 | 4.3604 | 1.9843 | 8 | 244 | immune response |
| GO:0007154 | 9e-04 | 1.6197 | 67.9196 | 89 | 6094 | cell communication |
| GO:0050715 | 0.001 | 5.6465 | 1.1469 | 6 | 104 | positive regulation of cytokine secretion |
| GO:0016192 | 0.0011 | 1.9009 | 19.7941 | 34 | 1776 | vesicle-mediated transport |
| GO:0046641 | 0.0012 | 16.8992 | 0.2118 | 3 | 19 | positive regulation of alpha-beta T cell proliferation |
| GO:0002688 | 0.0012 | 5.4717 | 1.1814 | 6 | 106 | regulation of leukocyte chemotaxis |
| GO:0002309 | 0.0012 | 59.7989 | 0.0557 | 2 | 5 | T cell proliferation involved in immune response |
| GO:0043308 | 0.0012 | 59.7989 | 0.0557 | 2 | 5 | eosinophil degranulation |
| GO:1901078 | 0.0012 | 59.7989 | 0.0557 | 2 | 5 | negative regulation of relaxation of muscle |
| GO:0071310 | 0.0012 | 1.7885 | 26.3364 | 42 | 2363 | cellular response to organic substance |
| GO:0006954 | 0.0012 | 2.6392 | 6.0994 | 15 | 559 | inflammatory response |
| GO:0048534 | 0.0012 | 2.288 | 9.4401 | 20 | 847 | hematopoietic or lymphoid organ development |
| GO:0002548 | 0.0013 | 9.3058 | 0.4774 | 4 | 44 | monocyte chemotaxis |
| GO:1903901 | 0.0013 | 6.6807 | 0.8136 | 5 | 73 | negative regulation of viral life cycle |
| GO:0002374 | 0.0013 | 15.9042 | 0.2229 | 3 | 20 | cytokine secretion involved in immune response |
| GO:0050778 | 0.0014 | 2.4456 | 7.4674 | 17 | 670 | positive regulation of immune response |
| GO:0002695 | 0.0014 | 4.5094 | 1.6607 | 7 | 149 | negative regulation of leukocyte activation |
| GO:0070374 | 0.0015 | 3.9463 | 2.1622 | 8 | 194 | positive regulation of ERK1 and ERK2 cascade |
| GO:0010818 | 0.0016 | 15.0197 | 0.2341 | 3 | 21 | T cell chemotaxis |
| GO:0042102 | 0.0016 | 6.411 | 0.845 | 5 | 77 | positive regulation of T cell proliferation |
| GO:0002824 | 0.0016 | 6.3972 | 0.847 | 5 | 76 | positive regulation of adaptive immune response based on somatic recombination of immune receptors built from immunoglobulin superfamily domains |
| GO:1903555 | 0.0016 | 5.16 | 1.2483 | 6 | 112 | regulation of tumor necrosis factor superfamily cytokine production |
| GO:0045058 | 0.0017 | 8.6182 | 0.5127 | 4 | 46 | T cell selection |
| GO:0002460 | 0.0017 | 5.0721 | 1.2683 | 6 | 117 | adaptive immune response based on somatic recombination of immune receptors built from immunoglobulin superfamily domains |
| GO:0043307 | 0.0018 | 44.8464 | 0.0669 | 2 | 6 | eosinophil activation |
| GO:0070383 | 0.0018 | 44.8464 | 0.0669 | 2 | 6 | DNA cytosine deamination |
| GO:0030803 | 0.002 | 8.2255 | 0.535 | 4 | 48 | negative regulation of cyclic nucleotide biosynthetic process |
| GO:0031347 | 0.0021 | 2.3444 | 7.7683 | 17 | 697 | regulation of defense response |
| GO:0002706 | 0.0021 | 4.8817 | 1.3151 | 6 | 118 | regulation of lymphocyte mediated immunity |
| GO:0002250 | 0.0021 | 4.8654 | 1.3189 | 6 | 125 | adaptive immune response |
| GO:0032101 | 0.0021 | 2.3372 | 7.7906 | 17 | 699 | regulation of response to external stimulus |
| GO:0032663 | 0.0021 | 8.0422 | 0.5461 | 4 | 49 | regulation of interleukin-2 production |
| GO:0043901 | 0.0022 | 4.1549 | 1.7944 | 7 | 161 | negative regulation of multi-organism process |
| GO:0030815 | 0.0023 | 7.8669 | 0.5573 | 4 | 50 | negative regulation of cAMP metabolic process |
| GO:0002230 | 0.0023 | 12.8716 | 0.2675 | 3 | 24 | positive regulation of defense response to virus by host |
| GO:0002831 | 0.0025 | 4.7122 | 1.3597 | 6 | 122 | regulation of response to biotic stimulus |
| GO:1900372 | 0.0025 | 7.699 | 0.5684 | 4 | 51 | negative regulation of purine nucleotide biosynthetic process |
| GO:0035627 | 0.0025 | 35.8749 | 0.078 | 2 | 7 | ceramide transport |
| GO:0045869 | 0.0025 | 35.8749 | 0.078 | 2 | 7 | negative regulation of single stranded viral RNA replication via double stranded DNA intermediate |
| GO:0048007 | 0.0025 | 35.8749 | 0.078 | 2 | 7 | antigen processing and presentation, exogenous lipid antigen via MHC class Ib |
| GO:0002407 | 0.0026 | 12.2858 | 0.2786 | 3 | 25 | dendritic cell chemotaxis |
| GO:0002699 | 0.0028 | 3.9725 | 1.8724 | 7 | 168 | positive regulation of immune effector process |
| GO:0045730 | 0.0029 | 11.7509 | 0.2898 | 3 | 26 | respiratory burst |
| GO:0050921 | 0.0031 | 4.4788 | 1.4266 | 6 | 128 | positive regulation of chemotaxis |
| GO:0006909 | 0.0032 | 3.4732 | 2.4408 | 8 | 219 | phagocytosis |
| GO:0002819 | 0.0033 | 5.3559 | 0.9998 | 5 | 91 | regulation of adaptive immune response |
| GO:0002887 | 0.0033 | 29.8939 | 0.0892 | 2 | 8 | negative regulation of myeloid leukocyte mediated immunity |
| GO:0031666 | 0.0033 | 29.8939 | 0.0892 | 2 | 8 | positive regulation of lipopolysaccharide-mediated signaling pathway |
| GO:1902715 | 0.0033 | 29.8939 | 0.0892 | 2 | 8 | positive regulation of interferon-gamma secretion |
| GO:2001185 | 0.0033 | 29.8939 | 0.0892 | 2 | 8 | regulation of CD8-positive, alpha-beta T cell activation |
| GO:0071347 | 0.0033 | 5.3389 | 1.0031 | 5 | 90 | cellular response to interleukin-1 |
| GO:0006171 | 0.0034 | 4.406 | 1.4489 | 6 | 130 | cAMP biosynthetic process |
| GO:0035587 | 0.0036 | 10.8094 | 0.3121 | 3 | 28 | purinergic receptor signaling pathway |
| GO:1901137 | 0.0038 | 2.1988 | 8.2475 | 17 | 740 | carbohydrate derivative biosynthetic process |
| GO:0031279 | 0.004 | 5.0977 | 1.0477 | 5 | 94 | regulation of cyclase activity |
| GO:0032365 | 0.004 | 10.393 | 0.3232 | 3 | 29 | intracellular lipid transport |
| GO:2000403 | 0.004 | 10.393 | 0.3232 | 3 | 29 | positive regulation of lymphocyte migration |
| GO:0048870 | 0.0042 | 1.8473 | 15.8152 | 27 | 1419 | cell motility |
| GO:0051339 | 0.0042 | 5.0407 | 1.0588 | 5 | 95 | regulation of lyase activity |
| GO:0009972 | 0.0042 | 25.6217 | 0.1003 | 2 | 9 | cytidine deamination |
| GO:0032621 | 0.0042 | 25.6217 | 0.1003 | 2 | 9 | interleukin-18 production |
| GO:0043301 | 0.0042 | 25.6217 | 0.1003 | 2 | 9 | negative regulation of leukocyte degranulation |
| GO:0046087 | 0.0042 | 25.6217 | 0.1003 | 2 | 9 | cytidine metabolic process |
| GO:0033993 | 0.0044 | 2.0702 | 9.8079 | 19 | 880 | response to lipid |
| GO:0042116 | 0.0048 | 6.3443 | 0.6799 | 4 | 61 | macrophage activation |
| GO:0001818 | 0.0049 | 3.2252 | 2.6192 | 8 | 235 | negative regulation of cytokine production |
| GO:0034612 | 0.0052 | 2.9487 | 3.221 | 9 | 289 | response to tumor necrosis factor |
| GO:0001820 | 0.0052 | 22.4176 | 0.1115 | 2 | 10 | serotonin secretion |
| GO:0002475 | 0.0052 | 22.4176 | 0.1115 | 2 | 10 | antigen processing and presentation via MHC class Ib |
| GO:2000551 | 0.0052 | 22.4176 | 0.1115 | 2 | 10 | regulation of T-helper 2 cell cytokine production |
| GO:0007162 | 0.0053 | 3.1825 | 2.6526 | 8 | 238 | negative regulation of cell adhesion |
| GO:0032760 | 0.0053 | 6.1285 | 0.7022 | 4 | 63 | positive regulation of tumor necrosis factor production |
| GO:0002718 | 0.0056 | 6.026 | 0.7133 | 4 | 64 | regulation of cytokine production involved in immune response |
| GO:0001817 | 0.0058 | 3.1364 | 2.6932 | 8 | 258 | regulation of cytokine production |
| GO:0002369 | 0.0058 | 9.0051 | 0.3678 | 3 | 33 | T cell cytokine production |
| GO:0072529 | 0.0058 | 9.0051 | 0.3678 | 3 | 33 | pyrimidine-containing compound catabolic process |
| GO:0042089 | 0.0059 | 4.6269 | 1.148 | 5 | 103 | cytokine biosynthetic process |
| GO:0050672 | 0.006 | 5.9268 | 0.7244 | 4 | 65 | negative regulation of lymphocyte proliferation |
| GO:0051716 | 0.0062 | 1.489 | 70.4087 | 87 | 6647 | cellular response to stimulus |
| GO:0016553 | 0.0064 | 19.9255 | 0.1226 | 2 | 11 | base conversion or substitution editing |
| GO:0032754 | 0.0064 | 19.9255 | 0.1226 | 2 | 11 | positive regulation of interleukin-5 production |
| GO:0044546 | 0.0064 | 19.9255 | 0.1226 | 2 | 11 | NLRP3 inflammasome complex assembly |
| GO:0046133 | 0.0064 | 19.9255 | 0.1226 | 2 | 11 | pyrimidine ribonucleoside catabolic process |
| GO:0046348 | 0.0064 | 19.9255 | 0.1226 | 2 | 11 | amino sugar catabolic process |
| GO:0072672 | 0.0064 | 19.9255 | 0.1226 | 2 | 11 | neutrophil extravasation |
| GO:0031295 | 0.0066 | 5.738 | 0.7467 | 4 | 67 | T cell costimulation |
| GO:0002793 | 0.0067 | 3.048 | 2.764 | 8 | 248 | positive regulation of peptide secretion |
| GO:0009187 | 0.007 | 3.3246 | 2.2179 | 7 | 199 | cyclic nucleotide metabolic process |
| GO:0002704 | 0.0072 | 8.2748 | 0.397 | 3 | 36 | negative regulation of leukocyte mediated immunity |
| GO:0070664 | 0.0073 | 5.5607 | 0.769 | 4 | 69 | negative regulation of leukocyte proliferation |
| GO:0045086 | 0.0076 | 17.9318 | 0.1337 | 2 | 12 | positive regulation of interleukin-2 biosynthetic process |
| GO:0048247 | 0.0077 | 8.0708 | 0.4061 | 3 | 37 | lymphocyte chemotaxis |
| GO:0050729 | 0.0078 | 4.3166 | 1.226 | 5 | 110 | positive regulation of inflammatory response |
| GO:0042092 | 0.008 | 7.9437 | 0.4124 | 3 | 37 | type 2 immune response |
| GO:0061028 | 0.008 | 7.9437 | 0.4124 | 3 | 37 | establishment of endothelial barrier |
| GO:0098657 | 0.0083 | 2.1183 | 7.4897 | 15 | 672 | import into cell |
| GO:0048584 | 0.0084 | 1.8054 | 14.325 | 24 | 1360 | positive regulation of response to stimulus |
| GO:0030335 | 0.0086 | 2.4272 | 4.7702 | 11 | 428 | positive regulation of cell migration |
| GO:0043900 | 0.0088 | 3.1787 | 2.3158 | 7 | 214 | regulation of multi-organism process |
| GO:0006047 | 0.0089 | 16.3007 | 0.1449 | 2 | 13 | UDP-N-acetylglucosamine metabolic process |
| GO:0010623 | 0.0089 | 16.3007 | 0.1449 | 2 | 13 | programmed cell death involved in cell development |
| GO:0045072 | 0.0089 | 16.3007 | 0.1449 | 2 | 13 | regulation of interferon-gamma biosynthetic process |
| GO:0045980 | 0.0089 | 5.237 | 0.8136 | 4 | 73 | negative regulation of nucleotide metabolic process |
| GO:0002820 | 0.0093 | 7.5014 | 0.4347 | 3 | 39 | negative regulation of adaptive immune response |
| GO:0045807 | 0.0093 | 4.1191 | 1.2817 | 5 | 115 | positive regulation of endocytosis |
| GO:0042221 | 0.0094 | 1.4793 | 46.4537 | 61 | 4168 | response to chemical |
| GO:0032653 | 0.0099 | 7.2982 | 0.4458 | 3 | 40 | regulation of interleukin-10 production |
| GO:0042088 | 0.0099 | 7.2982 | 0.4458 | 3 | 40 | T-helper 1 type immune response |
| GOMFID | Pvalue | OddsRatio | ExpCount | Count | Size | Term |
| GO:0002263 | 0 | 5.2463 | 7.1527 | 31 | 660 | cell activation involved in immune response |
| GO:0045087 | 0 | 4.0419 | 9.0818 | 31 | 838 | innate immune response |
| GO:0002285 | 0 | 9.0066 | 1.669 | 13 | 154 | lymphocyte activation involved in immune response |
| GO:0045321 | 0 | 4.1619 | 6.6896 | 24 | 664 | leukocyte activation |
| GO:0090026 | 0 | 36.1021 | 0.1951 | 5 | 18 | positive regulation of monocyte chemotaxis |
| GO:0071222 | 0 | 6.9329 | 1.7773 | 11 | 164 | cellular response to lipopolysaccharide |
| GO:0002275 | 0 | 3.91 | 5.4362 | 19 | 507 | myeloid cell activation involved in immune response |
| GO:1903039 | 0 | 5.7747 | 2.3084 | 12 | 213 | positive regulation of leukocyte cell-cell adhesion |
| GO:0007166 | 0 | 2.1958 | 28.4808 | 52 | 2628 | cell surface receptor signaling pathway |
| GO:0050863 | 0 | 4.6355 | 3.3379 | 14 | 308 | regulation of T cell activation |
| GO:0071216 | 0 | 5.883 | 2.07 | 11 | 191 | cellular response to biotic stimulus |
| GO:0002322 | 0 | 139.2659 | 0.0542 | 3 | 5 | B cell proliferation involved in immune response |
| GO:0022610 | 0 | 2.5472 | 14.3163 | 32 | 1321 | biological adhesion |
| GO:0045785 | 0 | 4.0298 | 4.0966 | 15 | 378 | positive regulation of cell adhesion |
| GO:0097529 | 0 | 12.194 | 0.5662 | 6 | 54 | myeloid leukocyte migration |
| GO:0070098 | 0 | 9.0733 | 0.867 | 7 | 80 | chemokine-mediated signaling pathway |
| GO:0050867 | 0 | 4.3534 | 3.2729 | 13 | 302 | positive regulation of cell activation |
| GO:0051251 | 0 | 4.6664 | 2.8177 | 12 | 260 | positive regulation of lymphocyte activation |
| GO:0046651 | 0 | 11.2666 | 0.6068 | 6 | 59 | lymphocyte proliferation |
| GO:0002444 | 0 | 3.3902 | 5.5099 | 17 | 514 | myeloid leukocyte mediated immunity |
| GO:0022407 | 0 | 3.7151 | 4.4217 | 15 | 408 | regulation of cell-cell adhesion |
| GO:0070661 | 1e-04 | 9.9409 | 0.6793 | 6 | 66 | leukocyte proliferation |
| GO:0042119 | 1e-04 | 3.3846 | 5.1695 | 16 | 477 | neutrophil activation |
| GO:0071675 | 1e-04 | 13.0182 | 0.4443 | 5 | 41 | regulation of mononuclear cell migration |
| GO:0002440 | 1e-04 | 5.4254 | 1.8099 | 9 | 167 | production of molecular mediator of immune response |
| GO:0032946 | 1e-04 | 6.1214 | 1.4305 | 8 | 132 | positive regulation of mononuclear cell proliferation |
| GO:0042107 | 1e-04 | Inf | 0.0212 | 2 | 2 | cytokine metabolic process |
| GO:0034097 | 1e-04 | 2.5433 | 10.4365 | 24 | 963 | response to cytokine |
| GO:0002684 | 2e-04 | 4.4763 | 2.4278 | 10 | 242 | positive regulation of immune system process |
| GO:0030098 | 2e-04 | 3.7933 | 3.4246 | 12 | 316 | lymphocyte differentiation |
| GO:0043312 | 2e-04 | 3.218 | 5.0611 | 15 | 467 | neutrophil degranulation |
| GO:0051707 | 2e-04 | 2.609 | 8.8217 | 21 | 814 | response to other organism |
| GO:0046631 | 2e-04 | 6.2357 | 1.2246 | 7 | 113 | alpha-beta T cell activation |
| GO:0032729 | 2e-04 | 10.0787 | 0.5574 | 5 | 52 | positive regulation of interferon-gamma production |
| GO:0002237 | 2e-04 | 3.6583 | 3.5438 | 12 | 327 | response to molecule of bacterial origin |
| GO:0045055 | 3e-04 | 2.7005 | 7.6729 | 19 | 708 | regulated exocytosis |
| GO:0050778 | 4e-04 | 2.6929 | 7.2611 | 18 | 670 | positive regulation of immune response |
| GO:0097530 | 4e-04 | 5.7444 | 1.3222 | 7 | 122 | granulocyte migration |
| GO:0030593 | 4e-04 | 6.8789 | 0.9537 | 6 | 88 | neutrophil chemotaxis |
| GO:0007194 | 5e-04 | 12.4295 | 0.3685 | 4 | 34 | negative regulation of adenylate cyclase activity |
| GO:0050670 | 6e-04 | 5.3458 | 1.4143 | 7 | 133 | regulation of lymphocyte proliferation |
| GO:0031347 | 6e-04 | 2.5813 | 7.5537 | 18 | 697 | regulation of defense response |
| GO:0002520 | 6e-04 | 2.3719 | 9.6345 | 21 | 889 | immune system development |
| GO:0023052 | 7e-04 | 1.6458 | 65.8158 | 87 | 6073 | signaling |
| GO:0070663 | 7e-04 | 5.0609 | 1.4891 | 7 | 140 | regulation of leukocyte proliferation |
| GO:0002710 | 8e-04 | 19.8803 | 0.1842 | 3 | 17 | negative regulation of T cell mediated immunity |
| GO:0007154 | 8e-04 | 1.6366 | 66.0433 | 87 | 6094 | cell communication |
| GO:0071346 | 8e-04 | 4.9614 | 1.5172 | 7 | 140 | cellular response to interferon-gamma |
| GO:0050715 | 9e-04 | 5.8163 | 1.1148 | 6 | 104 | positive regulation of cytokine secretion |
| GO:0006954 | 9e-04 | 2.7247 | 5.9262 | 15 | 559 | inflammatory response |
| GO:0002688 | 0.001 | 5.6344 | 1.1488 | 6 | 106 | regulation of leukocyte chemotaxis |
| GO:0002335 | 0.0011 | 17.3931 | 0.2059 | 3 | 19 | mature B cell differentiation |
| GO:0046641 | 0.0011 | 17.3931 | 0.2059 | 3 | 19 | positive regulation of alpha-beta T cell proliferation |
| GO:0002309 | 0.0011 | 61.5364 | 0.0542 | 2 | 5 | T cell proliferation involved in immune response |
| GO:0043308 | 0.0011 | 61.5364 | 0.0542 | 2 | 5 | eosinophil degranulation |
| GO:1901078 | 0.0011 | 61.5364 | 0.0542 | 2 | 5 | negative regulation of relaxation of muscle |
| GO:1903901 | 0.0012 | 6.8782 | 0.7911 | 5 | 73 | negative regulation of viral life cycle |
| GO:0002695 | 0.0012 | 4.6443 | 1.6148 | 7 | 149 | negative regulation of leukocyte activation |
| GO:0030097 | 0.0012 | 2.3492 | 8.735 | 19 | 806 | hemopoiesis |
| GO:0002374 | 0.0012 | 16.3689 | 0.2167 | 3 | 20 | cytokine secretion involved in immune response |
| GO:0002683 | 0.0013 | 3.6755 | 2.6152 | 9 | 249 | negative regulation of immune system process |
| GO:0042102 | 0.0014 | 6.6038 | 0.8212 | 5 | 77 | positive regulation of T cell proliferation |
| GO:0002824 | 0.0014 | 6.5864 | 0.8236 | 5 | 76 | positive regulation of adaptive immune response based on somatic recombination of immune receptors built from immunoglobulin superfamily domains |
| GO:0002460 | 0.0015 | 5.2284 | 1.232 | 6 | 117 | adaptive immune response based on somatic recombination of immune receptors built from immunoglobulin superfamily domains |
| GO:0045058 | 0.0015 | 8.8715 | 0.4985 | 4 | 46 | T cell selection |
| GO:0032940 | 0.0015 | 2.3014 | 8.9439 | 19 | 863 | secretion by cell |
| GO:0040011 | 0.0016 | 1.9141 | 17.8276 | 31 | 1645 | locomotion |
| GO:0032101 | 0.0016 | 2.4115 | 7.5754 | 17 | 699 | regulation of response to external stimulus |
| GO:0002694 | 0.0016 | 3.2862 | 3.2454 | 10 | 309 | regulation of leukocyte activation |
| GO:0072678 | 0.0017 | 8.6647 | 0.5094 | 4 | 47 | T cell migration |
| GO:0043307 | 0.0017 | 46.1494 | 0.065 | 2 | 6 | eosinophil activation |
| GO:0070383 | 0.0017 | 46.1494 | 0.065 | 2 | 6 | DNA cytosine deamination |
| GO:0030803 | 0.0018 | 8.4672 | 0.5202 | 4 | 48 | negative regulation of cyclic nucleotide biosynthetic process |
| GO:0002706 | 0.0018 | 5.0269 | 1.2788 | 6 | 118 | regulation of lymphocyte mediated immunity |
| GO:0043901 | 0.0019 | 4.2792 | 1.7448 | 7 | 161 | negative regulation of multi-organism process |
| GO:0032663 | 0.0019 | 8.2786 | 0.531 | 4 | 49 | regulation of interleukin-2 production |
| GO:0051241 | 0.002 | 2.11 | 11.2856 | 22 | 1053 | negative regulation of multicellular organismal process |
| GO:0048583 | 0.002 | 1.709 | 31.5052 | 47 | 3078 | regulation of response to stimulus |
| GO:0030815 | 0.0021 | 8.0981 | 0.5419 | 4 | 50 | negative regulation of cAMP metabolic process |
| GO:0002831 | 0.0021 | 4.8523 | 1.3222 | 6 | 122 | regulation of response to biotic stimulus |
| GO:0002230 | 0.0021 | 13.2477 | 0.2601 | 3 | 24 | positive regulation of defense response to virus by host |
| GO:0006935 | 0.0022 | 2.8 | 4.5686 | 12 | 433 | chemotaxis |
| GO:1900372 | 0.0022 | 7.9253 | 0.5527 | 4 | 51 | negative regulation of purine nucleotide biosynthetic process |
| GO:0045638 | 0.0023 | 5.8421 | 0.9212 | 5 | 85 | negative regulation of myeloid cell differentiation |
| GO:0045869 | 0.0024 | 36.9172 | 0.0759 | 2 | 7 | negative regulation of single stranded viral RNA replication via double stranded DNA intermediate |
| GO:0048007 | 0.0024 | 36.9172 | 0.0759 | 2 | 7 | antigen processing and presentation, exogenous lipid antigen via MHC class Ib |
| GO:0002699 | 0.0024 | 4.0913 | 1.8207 | 7 | 168 | positive regulation of immune effector process |
| GO:0042113 | 0.0026 | 3.6124 | 2.3517 | 8 | 217 | B cell activation |
| GO:0016192 | 0.0027 | 1.8247 | 19.2473 | 32 | 1776 | vesicle-mediated transport |
| GO:0006909 | 0.0027 | 3.5777 | 2.3734 | 8 | 219 | phagocytosis |
| GO:0006959 | 0.0027 | 3.5777 | 2.3734 | 8 | 219 | humoral immune response |
| GO:0045730 | 0.0027 | 12.0942 | 0.2818 | 3 | 26 | respiratory burst |
| GO:0050921 | 0.0027 | 4.612 | 1.3872 | 6 | 128 | positive regulation of chemotaxis |
| GO:0002819 | 0.0029 | 5.517 | 0.9717 | 5 | 91 | regulation of adaptive immune response |
| GO:0006171 | 0.0029 | 4.537 | 1.4089 | 6 | 130 | cAMP biosynthetic process |
| GO:0002887 | 0.0031 | 30.7625 | 0.0867 | 2 | 8 | negative regulation of myeloid leukocyte mediated immunity |
| GO:0031666 | 0.0031 | 30.7625 | 0.0867 | 2 | 8 | positive regulation of lipopolysaccharide-mediated signaling pathway |
| GO:0043615 | 0.0031 | 30.7625 | 0.0867 | 2 | 8 | astrocyte cell migration |
| GO:1902715 | 0.0031 | 30.7625 | 0.0867 | 2 | 8 | positive regulation of interferon-gamma secretion |
| GO:2001185 | 0.0031 | 30.7625 | 0.0867 | 2 | 8 | regulation of CD8-positive, alpha-beta T cell activation |
| GO:0006950 | 0.0032 | 1.6035 | 39.0473 | 55 | 3603 | response to stress |
| GO:0031279 | 0.0036 | 5.2484 | 1.0187 | 5 | 94 | regulation of cyclase activity |
| GO:0048247 | 0.0036 | 6.8949 | 0.6286 | 4 | 58 | lymphocyte chemotaxis |
| GO:0006955 | 0.0036 | 3.8019 | 1.9667 | 7 | 246 | immune response |
| GO:2000403 | 0.0037 | 10.6968 | 0.3143 | 3 | 29 | positive regulation of lymphocyte migration |
| GO:0051339 | 0.0037 | 5.1897 | 1.0296 | 5 | 95 | regulation of lyase activity |
| GO:0030595 | 0.004 | 6.6766 | 0.6468 | 4 | 62 | leukocyte chemotaxis |
| GO:0009972 | 0.004 | 26.3662 | 0.0975 | 2 | 9 | cytidine deamination |
| GO:0032621 | 0.004 | 26.3662 | 0.0975 | 2 | 9 | interleukin-18 production |
| GO:0043301 | 0.004 | 26.3662 | 0.0975 | 2 | 9 | negative regulation of leukocyte degranulation |
| GO:0046087 | 0.004 | 26.3662 | 0.0975 | 2 | 9 | cytidine metabolic process |
| GO:0002292 | 0.0041 | 6.6478 | 0.6502 | 4 | 60 | T cell differentiation involved in immune response |
| GO:0071310 | 0.0042 | 1.683 | 25.6089 | 39 | 2363 | cellular response to organic substance |
| GO:0050792 | 0.0043 | 3.6551 | 2.0266 | 7 | 187 | regulation of viral process |
| GO:0007162 | 0.0045 | 3.2783 | 2.5793 | 8 | 238 | negative regulation of cell adhesion |
| GO:0032760 | 0.0048 | 6.3086 | 0.6828 | 4 | 63 | positive regulation of tumor necrosis factor production |
| GO:0001820 | 0.005 | 23.069 | 0.1084 | 2 | 10 | serotonin secretion |
| GO:0002475 | 0.005 | 23.069 | 0.1084 | 2 | 10 | antigen processing and presentation via MHC class Ib |
| GO:0035589 | 0.005 | 23.069 | 0.1084 | 2 | 10 | G-protein coupled purinergic nucleotide receptor signaling pathway |
| GO:2000551 | 0.005 | 23.069 | 0.1084 | 2 | 10 | regulation of T-helper 2 cell cytokine production |
| GO:0002718 | 0.0051 | 6.2031 | 0.6936 | 4 | 64 | regulation of cytokine production involved in immune response |
| GO:0042089 | 0.0053 | 4.7637 | 1.1163 | 5 | 103 | cytokine biosynthetic process |
| GO:0002369 | 0.0054 | 9.2682 | 0.3576 | 3 | 33 | T cell cytokine production |
| GO:0050672 | 0.0054 | 6.101 | 0.7044 | 4 | 65 | negative regulation of lymphocyte proliferation |
| GO:0002793 | 0.0057 | 3.1397 | 2.6877 | 8 | 248 | positive regulation of peptide secretion |
| GO:0031295 | 0.006 | 5.9066 | 0.7261 | 4 | 67 | T cell costimulation |
| GO:0032637 | 0.006 | 5.9066 | 0.7261 | 4 | 67 | interleukin-8 production |
| GO:0016553 | 0.006 | 20.5045 | 0.1192 | 2 | 11 | base conversion or substitution editing |
| GO:0032754 | 0.006 | 20.5045 | 0.1192 | 2 | 11 | positive regulation of interleukin-5 production |
| GO:0044546 | 0.006 | 20.5045 | 0.1192 | 2 | 11 | NLRP3 inflammasome complex assembly |
| GO:0046133 | 0.006 | 20.5045 | 0.1192 | 2 | 11 | pyrimidine ribonucleoside catabolic process |
| GO:0046348 | 0.006 | 20.5045 | 0.1192 | 2 | 11 | amino sugar catabolic process |
| GO:0072672 | 0.006 | 20.5045 | 0.1192 | 2 | 11 | neutrophil extravasation |
| GO:0009187 | 0.006 | 3.4241 | 2.1567 | 7 | 199 | cyclic nucleotide metabolic process |
| GO:0001817 | 0.0064 | 2.6791 | 3.943 | 10 | 383 | regulation of cytokine production |
| GO:0098657 | 0.0065 | 2.1848 | 7.2828 | 15 | 672 | import into cell |
| GO:0070664 | 0.0067 | 5.7242 | 0.7478 | 4 | 69 | negative regulation of leukocyte proliferation |
| GO:0002704 | 0.0067 | 8.5194 | 0.3859 | 3 | 36 | negative regulation of leukocyte mediated immunity |
| GO:0050729 | 0.0069 | 4.4442 | 1.1921 | 5 | 110 | positive regulation of inflammatory response |
| GO:0030335 | 0.0071 | 2.5015 | 4.6384 | 11 | 428 | positive regulation of cell migration |
| GO:0002281 | 0.0072 | 18.4529 | 0.13 | 2 | 12 | macrophage activation involved in immune response |
| GO:0045086 | 0.0072 | 18.4529 | 0.13 | 2 | 12 | positive regulation of interleukin-2 biosynthetic process |
| GO:1900029 | 0.0072 | 18.4529 | 0.13 | 2 | 12 | positive regulation of ruffle assembly |
| GO:0033993 | 0.0072 | 2.0091 | 9.5369 | 18 | 880 | response to lipid |
| GO:0050896 | 0.0074 | 1.8288 | 19.7448 | 30 | 2549 | response to stimulus |
| GO:1903555 | 0.0075 | 4.3606 | 1.2138 | 5 | 112 | regulation of tumor necrosis factor superfamily cytokine production |
| GO:0002764 | 0.0076 | 2.3705 | 5.3429 | 12 | 493 | immune response-regulating signaling pathway |
| GO:0002429 | 0.0078 | 2.7569 | 3.4355 | 9 | 317 | immune response-activating cell surface receptor signaling pathway |
| GO:0045980 | 0.0081 | 5.391 | 0.7911 | 4 | 73 | negative regulation of nucleotide metabolic process |
| GO:0045807 | 0.0083 | 4.2408 | 1.2463 | 5 | 115 | positive regulation of endocytosis |
| GO:0006047 | 0.0084 | 16.7743 | 0.1409 | 2 | 13 | UDP-N-acetylglucosamine metabolic process |
| GO:0010623 | 0.0084 | 16.7743 | 0.1409 | 2 | 13 | programmed cell death involved in cell development |
| GO:0045072 | 0.0084 | 16.7743 | 0.1409 | 2 | 13 | regulation of interferon-gamma biosynthetic process |
| GO:0002820 | 0.0086 | 7.7206 | 0.4227 | 3 | 39 | negative regulation of adaptive immune response |
| GO:0009306 | 0.0091 | 2.311 | 5.4729 | 12 | 505 | protein secretion |
| GO:0071674 | 0.0092 | 7.5141 | 0.4328 | 3 | 41 | mononuclear cell migration |
| GO:0032653 | 0.0092 | 7.5115 | 0.4335 | 3 | 40 | regulation of interleukin-10 production |
| GO:0042088 | 0.0092 | 7.5115 | 0.4335 | 3 | 40 | T-helper 1 type immune response |
| GO:0002250 | 0.0093 | 4.1229 | 1.2799 | 5 | 125 | adaptive immune response |
| GO:0051240 | 0.0095 | 1.7404 | 16.0502 | 26 | 1481 | positive regulation of multicellular organismal process |
| GO:0002693 | 0.0098 | 15.3755 | 0.1517 | 2 | 14 | positive regulation of cellular extravasation |
| GO:0002829 | 0.0098 | 15.3755 | 0.1517 | 2 | 14 | negative regulation of type 2 immune response |
| GOMFID | Pvalue | OddsRatio | ExpCount | Count | Size | Term |
| GO:0007218 | 1e-04 | 6.9768 | 1.1056 | 7 | 95 | neuropeptide signaling pathway |
| GO:0048935 | 4e-04 | 25.8726 | 0.1513 | 3 | 13 | peripheral nervous system neuron development |
| GO:0043553 | 8e-04 | 85.8235 | 0.0466 | 2 | 4 | negative regulation of phosphatidylinositol 3-kinase activity |
| GO:0032502 | 9e-04 | 1.6013 | 67.7677 | 89 | 5823 | developmental process |
| GO:0010529 | 0.0013 | 16.1643 | 0.2211 | 3 | 19 | negative regulation of transposition |
| GO:0048557 | 0.0013 | 16.1643 | 0.2211 | 3 | 19 | embryonic digestive tract morphogenesis |
| GO:0045636 | 0.0013 | 57.2121 | 0.0582 | 2 | 5 | positive regulation of melanocyte differentiation |
| GO:0060012 | 0.0013 | 57.2121 | 0.0582 | 2 | 5 | synaptic transmission, glycinergic |
| GO:0060437 | 0.0013 | 57.2121 | 0.0582 | 2 | 5 | lung growth |
| GO:0007626 | 0.0016 | 3.8971 | 2.1879 | 8 | 188 | locomotory behavior |
| GO:0007275 | 0.002 | 1.5945 | 50.8382 | 69 | 4547 | multicellular organism development |
| GO:0042110 | 0.0023 | 2.6516 | 5.2138 | 13 | 448 | T cell activation |
| GO:0061053 | 0.0027 | 5.6374 | 0.9543 | 5 | 82 | somite development |
| GO:0007399 | 0.0028 | 1.7235 | 24.9401 | 39 | 2143 | nervous system development |
| GO:0001838 | 0.0028 | 4.5835 | 1.3966 | 6 | 120 | embryonic epithelial tube formation |
| GO:0007389 | 0.0031 | 2.6733 | 4.7599 | 12 | 409 | pattern specification process |
| GO:0048568 | 0.0032 | 2.6595 | 4.7832 | 12 | 411 | embryonic organ development |
| GO:0098916 | 0.0036 | 2.3371 | 6.8198 | 15 | 586 | anterograde trans-synaptic signaling |
| GO:0099536 | 0.0037 | 2.3286 | 6.8431 | 15 | 588 | synaptic signaling |
| GO:0001501 | 0.0039 | 2.4868 | 5.5397 | 13 | 476 | skeletal system development |
| GO:0035282 | 0.0044 | 4.9863 | 1.0707 | 5 | 92 | segmentation |
| GO:0048704 | 0.0044 | 4.9863 | 1.0707 | 5 | 92 | embryonic skeletal system morphogenesis |
| GO:0014807 | 0.0046 | 24.5134 | 0.1047 | 2 | 9 | regulation of somitogenesis |
| GO:0048087 | 0.0046 | 24.5134 | 0.1047 | 2 | 9 | positive regulation of developmental pigmentation |
| GO:0050932 | 0.0046 | 24.5134 | 0.1047 | 2 | 9 | regulation of pigment cell differentiation |
| GO:0043009 | 0.0049 | 2.3292 | 6.3659 | 14 | 547 | chordate embryonic development |
| GO:0030198 | 0.0049 | 2.7818 | 3.794 | 10 | 326 | extracellular matrix organization |
| GO:0040036 | 0.005 | 9.5723 | 0.3491 | 3 | 30 | regulation of fibroblast growth factor receptor signaling pathway |
| GO:0070286 | 0.005 | 9.5723 | 0.3491 | 3 | 30 | axonemal dynein complex assembly |
| GO:0009954 | 0.0055 | 9.2298 | 0.3608 | 3 | 31 | proximal/distal pattern formation |
| GO:0003211 | 0.0057 | 21.4479 | 0.1164 | 2 | 10 | cardiac ventricle formation |
| GO:0035148 | 0.0062 | 3.8655 | 1.6409 | 6 | 141 | tube formation |
| GO:0006821 | 0.0063 | 4.5641 | 1.1638 | 5 | 100 | chloride transport |
| GO:0035107 | 0.007 | 3.7533 | 1.6875 | 6 | 145 | appendage morphogenesis |
| GO:0048598 | 0.0071 | 2.2212 | 6.6569 | 14 | 572 | embryonic morphogenesis |
| GO:0009952 | 0.0079 | 3.2453 | 2.2694 | 7 | 195 | anterior/posterior pattern specification |
| GO:0060536 | 0.0082 | 17.1561 | 0.1397 | 2 | 12 | cartilage morphogenesis |
| GO:0035137 | 0.0084 | 7.8289 | 0.419 | 3 | 36 | hindlimb morphogenesis |
| GO:0040019 | 0.0084 | 7.8289 | 0.419 | 3 | 36 | positive regulation of embryonic development |
| GO:0007156 | 0.0088 | 3.5717 | 1.769 | 6 | 152 | homophilic cell adhesion via plasma membrane adhesion molecules |
| GO:0007519 | 0.0088 | 3.5717 | 1.769 | 6 | 152 | skeletal muscle tissue development |
| GO:0031274 | 0.0097 | 15.5955 | 0.1513 | 2 | 13 | positive regulation of pseudopodium assembly |
| GO:1905205 | 0.0097 | 15.5955 | 0.1513 | 2 | 13 | positive regulation of connective tissue replacement |
| GOMFID | Pvalue | OddsRatio | ExpCount | Count | Size | Term |
| GO:0099537 | 1e-04 | 3.0771 | 6.4086 | 18 | 588 | trans-synaptic signaling |
| GO:0050925 | 1e-04 | Inf | 0.0218 | 2 | 2 | negative regulation of negative chemotaxis |
| GO:0072272 | 1e-04 | Inf | 0.0218 | 2 | 2 | proximal/distal pattern formation involved in metanephric nephron development |
| GO:0019098 | 3e-04 | 14.2614 | 0.327 | 4 | 30 | reproductive behavior |
| GO:0008038 | 4e-04 | 13.2411 | 0.3488 | 4 | 32 | neuron recognition |
| GO:0007379 | 5e-04 | 23.0618 | 0.1635 | 3 | 15 | segment specification |
| GO:0006933 | 7e-04 | 91.7771 | 0.0436 | 2 | 4 | negative regulation of cell adhesion involved in substrate-bound cell migration |
| GO:0007621 | 7e-04 | 91.7771 | 0.0436 | 2 | 4 | negative regulation of female receptivity |
| GO:0033600 | 7e-04 | 91.7771 | 0.0436 | 2 | 4 | negative regulation of mammary gland epithelial cell proliferation |
| GO:0072086 | 7e-04 | 91.7771 | 0.0436 | 2 | 4 | specification of loop of Henle identity |
| GO:0072488 | 8e-04 | 19.7648 | 0.1853 | 3 | 17 | ammonium transmembrane transport |
| GO:0072079 | 0.0011 | 17.292 | 0.2071 | 3 | 19 | nephron tubule formation |
| GO:0016199 | 0.0012 | 61.181 | 0.0545 | 2 | 5 | axon midline choice point recognition |
| GO:0071502 | 0.0012 | 61.181 | 0.0545 | 2 | 5 | cellular response to temperature stimulus |
| GO:1903232 | 0.0012 | 61.181 | 0.0545 | 2 | 5 | melanosome assembly |
| GO:0009712 | 0.0017 | 8.6141 | 0.5123 | 4 | 47 | catechol-containing compound metabolic process |
| GO:0021891 | 0.0017 | 45.8829 | 0.0654 | 2 | 6 | olfactory bulb interneuron development |
| GO:0032229 | 0.0017 | 45.8829 | 0.0654 | 2 | 6 | negative regulation of synaptic transmission, GABAergic |
| GO:1903530 | 0.0018 | 2.4466 | 7.0081 | 16 | 643 | regulation of secretion by cell |
| GO:0007267 | 0.0021 | 1.9122 | 16.5883 | 29 | 1522 | cell-cell signaling |
| GO:0021953 | 0.0022 | 4.1717 | 1.7874 | 7 | 164 | central nervous system neuron differentiation |
| GO:0007155 | 0.0022 | 1.9735 | 14.3322 | 26 | 1315 | cell adhesion |
| GO:0035385 | 0.0024 | 36.704 | 0.0763 | 2 | 7 | Roundabout signaling pathway |
| GO:0048539 | 0.0024 | 36.704 | 0.0763 | 2 | 7 | bone marrow development |
| GO:0006836 | 0.0029 | 3.9433 | 1.8855 | 7 | 173 | neurotransmitter transport |
| GO:0007268 | 0.003 | 2.6884 | 4.7473 | 12 | 447 | chemical synaptic transmission |
| GO:0048791 | 0.0031 | 11.5223 | 0.2943 | 3 | 27 | calcium ion-regulated exocytosis of neurotransmitter |
| GO:0045597 | 0.0031 | 2.1469 | 9.493 | 19 | 871 | positive regulation of cell differentiation |
| GO:0048812 | 0.0032 | 2.4502 | 6.0817 | 14 | 558 | neuron projection morphogenesis |
| GO:0006811 | 0.0037 | 1.8475 | 16.4684 | 28 | 1511 | ion transport |
| GO:0060180 | 0.004 | 26.2139 | 0.0981 | 2 | 9 | female mating behavior |
| GO:0061004 | 0.004 | 26.2139 | 0.0981 | 2 | 9 | pattern specification involved in kidney development |
| GO:0051962 | 0.0042 | 2.5703 | 4.9482 | 12 | 454 | positive regulation of nervous system development |
| GO:0099531 | 0.0042 | 4.2026 | 1.515 | 6 | 139 | presynaptic process involved in chemical synaptic transmission |
| GO:0048858 | 0.0042 | 2.3734 | 6.2669 | 14 | 575 | cell projection morphogenesis |
| GO:0035646 | 0.005 | 22.9357 | 0.109 | 2 | 10 | endosome to melanosome transport |
| GO:0048757 | 0.005 | 22.9357 | 0.109 | 2 | 10 | pigment granule maturation |
| GO:0048864 | 0.0052 | 6.1669 | 0.6975 | 4 | 64 | stem cell development |
| GO:0009886 | 0.0061 | 20.386 | 0.1199 | 2 | 11 | post-embryonic animal morphogenesis |
| GO:0042415 | 0.0061 | 20.386 | 0.1199 | 2 | 11 | norepinephrine metabolic process |
| GO:0043476 | 0.0061 | 20.386 | 0.1199 | 2 | 11 | pigment accumulation |
| GO:0050713 | 0.0061 | 20.386 | 0.1199 | 2 | 11 | negative regulation of interleukin-1 beta secretion |
| GO:0071805 | 0.0064 | 3.3859 | 2.1798 | 7 | 200 | potassium ion transmembrane transport |
| GO:0007156 | 0.0064 | 3.8253 | 1.6567 | 6 | 152 | homophilic cell adhesion via plasma membrane adhesion molecules |
| GO:0046903 | 0.0065 | 1.7816 | 16.3594 | 27 | 1501 | secretion |
| GO:0099504 | 0.0068 | 4.4608 | 1.188 | 5 | 109 | synaptic vesicle cycle |
| GO:0050767 | 0.0069 | 2.1678 | 7.335 | 15 | 673 | regulation of neurogenesis |
| GO:0014003 | 0.007 | 8.3751 | 0.3924 | 3 | 36 | oligodendrocyte development |
| GO:0002031 | 0.0073 | 18.3463 | 0.1308 | 2 | 12 | G-protein coupled receptor internalization |
| GO:0050772 | 0.0075 | 5.5201 | 0.7738 | 4 | 71 | positive regulation of axonogenesis |
| GO:0015695 | 0.0075 | 8.1283 | 0.4033 | 3 | 37 | organic cation transport |
| GO:0015844 | 0.0079 | 5.4386 | 0.7847 | 4 | 72 | monoamine transport |
| GO:0007618 | 0.0081 | 7.8956 | 0.4142 | 3 | 38 | mating |
| GO:2000648 | 0.0081 | 7.8956 | 0.4142 | 3 | 38 | positive regulation of stem cell proliferation |
| GO:0032879 | 0.0086 | 1.59 | 27.5963 | 40 | 2532 | regulation of localization |
| GO:0048667 | 0.009 | 2.3114 | 5.4713 | 12 | 502 | cell morphogenesis involved in neuron differentiation |
| GO:0051952 | 0.0091 | 5.2078 | 0.8174 | 4 | 75 | regulation of amine transport |
| GO:0045598 | 0.0091 | 4.1401 | 1.2752 | 5 | 117 | regulation of fat cell differentiation |
| GO:0015872 | 0.0094 | 7.4678 | 0.436 | 3 | 40 | dopamine transport |
| GO:0030198 | 0.0096 | 2.661 | 3.5531 | 9 | 326 | extracellular matrix organization |
| GO:0050707 | 0.0097 | 3.4875 | 1.8092 | 6 | 166 | regulation of cytokine secretion |
| GO:0048489 | 0.0098 | 4.067 | 1.297 | 5 | 119 | synaptic vesicle transport |
| GO:0036066 | 0.0099 | 15.2867 | 0.1526 | 2 | 14 | protein O-linked fucosylation |
| GO:0042711 | 0.0099 | 15.2867 | 0.1526 | 2 | 14 | maternal behavior |
| GOMFID | Pvalue | OddsRatio | ExpCount | Count | Size | Term |
| GO:0050777 | 4e-04 | 5.6605 | 1.3399 | 7 | 128 | negative regulation of immune response |
| GO:0043570 | 6e-04 | 95.6429 | 0.0419 | 2 | 4 | maintenance of DNA repeat elements |
| GO:0002698 | 8e-04 | 5.9627 | 1.0887 | 6 | 104 | negative regulation of immune effector process |
| GO:1904837 | 0.001 | 10.1661 | 0.4397 | 4 | 42 | beta-catenin-TCF complex assembly |
| GO:0010718 | 0.0012 | 9.4205 | 0.4711 | 4 | 45 | positive regulation of epithelial to mesenchymal transition |
| GO:0042373 | 0.0016 | 47.8155 | 0.0628 | 2 | 6 | vitamin K metabolic process |
| GO:0045590 | 0.0016 | 47.8155 | 0.0628 | 2 | 6 | negative regulation of regulatory T cell differentiation |
| GO:0045123 | 0.0018 | 8.3939 | 0.5234 | 4 | 50 | cellular extravasation |
| GO:1901570 | 0.0021 | 5.9817 | 0.9002 | 5 | 86 | fatty acid derivative biosynthetic process |
| GO:0032667 | 0.0029 | 31.873 | 0.0837 | 2 | 8 | regulation of interleukin-23 production |
| GO:0043114 | 0.0037 | 10.674 | 0.314 | 3 | 30 | regulation of vascular permeability |
| GO:1901750 | 0.0037 | 27.318 | 0.0942 | 2 | 9 | leukotriene D4 biosynthetic process |
| GO:0006751 | 0.0046 | 23.9018 | 0.1047 | 2 | 10 | glutathione catabolic process |
| GO:0072537 | 0.0046 | 23.9018 | 0.1047 | 2 | 10 | fibroblast activation |
| GO:0002695 | 0.0048 | 4.0748 | 1.5597 | 6 | 149 | negative regulation of leukocyte activation |
| GO:0006690 | 0.0049 | 4.8394 | 1.0991 | 5 | 105 | icosanoid metabolic process |
| GO:0003413 | 0.0056 | 21.2447 | 0.1151 | 2 | 11 | chondrocyte differentiation involved in endochondral bone morphogenesis |
| GO:0032700 | 0.0056 | 21.2447 | 0.1151 | 2 | 11 | negative regulation of interleukin-17 production |
| GO:0042398 | 0.0078 | 8.001 | 0.4083 | 3 | 39 | cellular modified amino acid biosynthetic process |
| GO:0032736 | 0.0091 | 15.9306 | 0.1466 | 2 | 14 | positive regulation of interleukin-13 production |
| GO:0060312 | 0.0091 | 15.9306 | 0.1466 | 2 | 14 | regulation of blood vessel remodeling |
| GOMFID | Pvalue | OddsRatio | ExpCount | Count | Size | Term |
| GO:0019864 | 0.0027 | 31.6299 | 0.0796 | 2 | 10 | IgG binding |
| GO:0031406 | 0.0029 | 4.5372 | 1.409 | 6 | 177 | carboxylic acid binding |
| GO:0050786 | 0.0033 | 28.1137 | 0.0876 | 2 | 11 | RAGE receptor binding |
| GO:0002020 | 0.0037 | 5.1873 | 1.0269 | 5 | 129 | protease binding |
| GO:0004152 | 0.008 | Inf | 0.008 | 1 | 1 | dihydroorotate dehydrogenase activity |
| GO:0004336 | 0.008 | Inf | 0.008 | 1 | 1 | galactosylceramidase activity |
| GO:0005130 | 0.008 | Inf | 0.008 | 1 | 1 | granulocyte colony-stimulating factor receptor binding |
| GO:0005353 | 0.008 | Inf | 0.008 | 1 | 1 | fructose transmembrane transporter activity |
| GO:0008120 | 0.008 | Inf | 0.008 | 1 | 1 | ceramide glucosyltransferase activity |
| GO:0030272 | 0.008 | Inf | 0.008 | 1 | 1 | 5-formyltetrahydrofolate cyclo-ligase activity |
| GO:0030294 | 0.008 | Inf | 0.008 | 1 | 1 | receptor signaling protein tyrosine kinase inhibitor activity |
| GO:0031962 | 0.008 | Inf | 0.008 | 1 | 1 | mineralocorticoid receptor binding |
| GO:0036470 | 0.008 | Inf | 0.008 | 1 | 1 | tyrosine 3-monooxygenase activator activity |
| GO:0036478 | 0.008 | Inf | 0.008 | 1 | 1 | L-dopa decarboxylase activator activity |
| GO:0036524 | 0.008 | Inf | 0.008 | 1 | 1 | protein deglycase activity |
| GO:0045340 | 0.008 | Inf | 0.008 | 1 | 1 | mercury ion binding |
| GO:0055103 | 0.008 | Inf | 0.008 | 1 | 1 | ligase regulator activity |
| GO:0102769 | 0.008 | Inf | 0.008 | 1 | 1 | dihydroceramide glucosyltransferase activity |
| GO:1990175 | 0.008 | Inf | 0.008 | 1 | 1 | EH domain binding |
| GO:1990698 | 0.008 | Inf | 0.008 | 1 | 1 | palmitoleoyltransferase activity |
| GOMFID | Pvalue | OddsRatio | ExpCount | Count | Size | Term |
| GO:0031406 | 5e-04 | 5.4586 | 1.3872 | 7 | 177 | carboxylic acid binding |
| GO:0005504 | 0.0012 | 16.1835 | 0.2116 | 3 | 27 | fatty acid binding |
| GO:0050786 | 0.0032 | 28.5671 | 0.0862 | 2 | 11 | RAGE receptor binding |
| GO:0002020 | 0.0035 | 5.273 | 1.011 | 5 | 129 | protease binding |
| GO:0004152 | 0.0078 | Inf | 0.0078 | 1 | 1 | dihydroorotate dehydrogenase activity |
| GO:0004336 | 0.0078 | Inf | 0.0078 | 1 | 1 | galactosylceramidase activity |
| GO:0005130 | 0.0078 | Inf | 0.0078 | 1 | 1 | granulocyte colony-stimulating factor receptor binding |
| GO:0005353 | 0.0078 | Inf | 0.0078 | 1 | 1 | fructose transmembrane transporter activity |
| GO:0008120 | 0.0078 | Inf | 0.0078 | 1 | 1 | ceramide glucosyltransferase activity |
| GO:0030272 | 0.0078 | Inf | 0.0078 | 1 | 1 | 5-formyltetrahydrofolate cyclo-ligase activity |
| GO:0030294 | 0.0078 | Inf | 0.0078 | 1 | 1 | receptor signaling protein tyrosine kinase inhibitor activity |
| GO:0036470 | 0.0078 | Inf | 0.0078 | 1 | 1 | tyrosine 3-monooxygenase activator activity |
| GO:0036478 | 0.0078 | Inf | 0.0078 | 1 | 1 | L-dopa decarboxylase activator activity |
| GO:0036524 | 0.0078 | Inf | 0.0078 | 1 | 1 | protein deglycase activity |
| GO:0039552 | 0.0078 | Inf | 0.0078 | 1 | 1 | RIG-I binding |
| GO:0045340 | 0.0078 | Inf | 0.0078 | 1 | 1 | mercury ion binding |
| GO:0055103 | 0.0078 | Inf | 0.0078 | 1 | 1 | ligase regulator activity |
| GO:0102769 | 0.0078 | Inf | 0.0078 | 1 | 1 | dihydroceramide glucosyltransferase activity |
| GO:1990175 | 0.0078 | Inf | 0.0078 | 1 | 1 | EH domain binding |
| GO:1990698 | 0.0078 | Inf | 0.0078 | 1 | 1 | palmitoleoyltransferase activity |
| GO:0005215 | 0.0079 | 1.9734 | 10.4625 | 19 | 1335 | transporter activity |
| GO:0004869 | 0.0096 | 7.3151 | 0.4389 | 3 | 56 | cysteine-type endopeptidase inhibitor activity |
| GOMFID | Pvalue | OddsRatio | ExpCount | Count | Size | Term |
| GO:0042288 | 0.0027 | 12.4957 | 0.2866 | 3 | 18 | MHC class I protein binding |
| GO:0016427 | 0.0036 | 31.1387 | 0.0955 | 2 | 6 | tRNA (cytosine) methyltransferase activity |
| GO:0004601 | 0.0037 | 6.9602 | 0.6368 | 4 | 40 | peroxidase activity |
| GO:0046332 | 0.0051 | 4.8288 | 1.1145 | 5 | 70 | SMAD binding |
| GO:0004126 | 0.0066 | 20.7565 | 0.1274 | 2 | 8 | cytidine deaminase activity |
| GO:0004364 | 0.0079 | 8.1453 | 0.4139 | 3 | 26 | glutathione transferase activity |
| GO:0003691 | 0.0084 | 17.7902 | 0.1433 | 2 | 9 | double-stranded telomeric DNA binding |
| GOMFID | Pvalue | OddsRatio | ExpCount | Count | Size | Term |
| GO:0005547 | 0.0018 | 8.596 | 0.5266 | 4 | 34 | phosphatidylinositol-3,4,5-trisphosphate binding |
| GO:0046976 | 0.0023 | 42.7068 | 0.0774 | 2 | 5 | histone methyltransferase activity (H3-K27 specific) |
| GO:0016427 | 0.0034 | 32.0281 | 0.0929 | 2 | 6 | tRNA (cytosine) methyltransferase activity |
| GO:0043325 | 0.0052 | 9.6375 | 0.3562 | 3 | 23 | phosphatidylinositol-3,4-bisphosphate binding |
| GO:0008013 | 0.0058 | 4.6792 | 1.1462 | 5 | 74 | beta-catenin binding |
| GO:0004126 | 0.0063 | 21.3494 | 0.1239 | 2 | 8 | cytidine deaminase activity |
| GO:0008066 | 0.0073 | 8.3789 | 0.4027 | 3 | 26 | glutamate receptor activity |
| GO:0003691 | 0.008 | 18.2983 | 0.1394 | 2 | 9 | double-stranded telomeric DNA binding |
| GO:0070016 | 0.0099 | 16.01 | 0.1549 | 2 | 10 | armadillo repeat domain binding |
| GOMFID | Pvalue | OddsRatio | ExpCount | Count | Size | Term |
| GO:0004984 | 0 | 13.9344 | 1.1416 | 12 | 370 | olfactory receptor activity |
| GO:0060089 | 0 | 5.4356 | 4.73 | 18 | 1533 | molecular transducer activity |
| GO:0099600 | 0 | 5.8489 | 3.7612 | 16 | 1219 | transmembrane receptor activity |
| GO:0004930 | 0 | 7.0202 | 2.4159 | 13 | 783 | G-protein coupled receptor activity |
| GO:0038023 | 0 | 5.5487 | 3.9463 | 16 | 1279 | signaling receptor activity |
| GO:0003828 | 1e-04 | 168.2396 | 0.0185 | 2 | 6 | alpha-N-acetylneuraminate alpha-2,8-sialyltransferase activity |
| GO:0005126 | 0.0011 | 7.0295 | 0.7923 | 5 | 262 | cytokine receptor binding |
| GO:0016757 | 0.0014 | 6.6625 | 0.8331 | 5 | 270 | transferase activity, transferring glycosyl groups |
| GO:0005125 | 0.0015 | 8.8387 | 0.4991 | 4 | 168 | cytokine activity |
| GO:0005129 | 0.0031 | Inf | 0.0031 | 1 | 1 | granulocyte macrophage colony-stimulating factor receptor binding |
| GO:0042924 | 0.0031 | Inf | 0.0031 | 1 | 1 | neuromedin U binding |
| GO:0030545 | 0.0032 | 4.591 | 1.4563 | 6 | 472 | receptor regulator activity |
| GO:0015020 | 0.0046 | 21.672 | 0.1018 | 2 | 33 | glucuronosyltransferase activity |
| GO:0001607 | 0.0062 | 329.6735 | 0.0062 | 1 | 2 | neuromedin U receptor activity |
| GO:0010465 | 0.0062 | 329.6735 | 0.0062 | 1 | 2 | nerve growth factor receptor activity |
| GO:0035379 | 0.0062 | 329.6735 | 0.0062 | 1 | 2 | carbon dioxide transmembrane transporter activity |
| GO:0047275 | 0.0062 | 329.6735 | 0.0062 | 1 | 2 | glucosaminylgalactosylglucosylceramide beta-galactosyltransferase activity |
| GO:0004971 | 0.0092 | 164.8265 | 0.0093 | 1 | 3 | AMPA glutamate receptor activity |
| GO:0005166 | 0.0092 | 164.8265 | 0.0093 | 1 | 3 | neurotrophin p75 receptor binding |
| GO:0099583 | 0.0092 | 164.8265 | 0.0093 | 1 | 3 | neurotransmitter receptor activity involved in regulation of postsynaptic cytosolic calcium ion concentration |
| GO:0008009 | 0.0096 | 14.5915 | 0.1481 | 2 | 48 | chemokine activity |
| GOMFID | Pvalue | OddsRatio | ExpCount | Count | Size | Term |
| GO:0048020 | 0 | 23.6265 | 0.2527 | 5 | 39 | CCR chemokine receptor binding |
| GO:0008009 | 0 | 18.6709 | 0.311 | 5 | 48 | chemokine activity |
| GO:0032394 | 0 | Inf | 0.013 | 2 | 2 | MHC class Ib receptor activity |
| GO:0030246 | 0 | 5.9197 | 1.6847 | 9 | 260 | carbohydrate binding |
| GO:0042288 | 2e-04 | 31.5392 | 0.1166 | 3 | 18 | MHC class I protein binding |
| GO:0016427 | 6e-04 | 78.1359 | 0.0389 | 2 | 6 | tRNA (cytosine) methyltransferase activity |
| GO:0001055 | 0.0022 | 34.7163 | 0.0713 | 2 | 11 | RNA polymerase II activity |
| GO:0016705 | 0.0031 | 5.4262 | 0.9849 | 5 | 152 | oxidoreductase activity, acting on paired donors, with incorporation or reduction of molecular oxygen |
| GO:0004497 | 0.0032 | 7.0451 | 0.6091 | 4 | 94 | monooxygenase activity |
| GO:0008173 | 0.006 | 8.7397 | 0.3693 | 3 | 57 | RNA methyltransferase activity |
| GO:0004034 | 0.0065 | Inf | 0.0065 | 1 | 1 | aldose 1-epimerase activity |
| GO:0005133 | 0.0065 | Inf | 0.0065 | 1 | 1 | interferon-gamma receptor binding |
| GO:0035375 | 0.0065 | Inf | 0.0065 | 1 | 1 | zymogen binding |
| GO:0035757 | 0.0065 | Inf | 0.0065 | 1 | 1 | chemokine (C-C motif) ligand 19 binding |
| GO:0035758 | 0.0065 | Inf | 0.0065 | 1 | 1 | chemokine (C-C motif) ligand 21 binding |
| GO:0038117 | 0.0065 | Inf | 0.0065 | 1 | 1 | C-C motif chemokine 19 receptor activity |
| GO:0038121 | 0.0065 | Inf | 0.0065 | 1 | 1 | C-C motif chemokine 21 receptor activity |
| GO:0047042 | 0.0065 | Inf | 0.0065 | 1 | 1 | androsterone dehydrogenase (B-specific) activity |
| GO:0050528 | 0.0065 | Inf | 0.0065 | 1 | 1 | acyloxyacyl hydrolase activity |
| GO:0102116 | 0.0065 | Inf | 0.0065 | 1 | 1 | laurate hydroxylase activity |
| GO:0103002 | 0.0065 | Inf | 0.0065 | 1 | 1 | 16-hydroxypalmitate dehydrogenase activity |
| GO:0001664 | 0.0067 | 3.8114 | 1.6717 | 6 | 258 | G-protein coupled receptor binding |
| GOMFID | Pvalue | OddsRatio | ExpCount | Count | Size | Term |
| GO:0016494 | 0.0018 | 43.0846 | 0.0652 | 2 | 7 | C-X-C chemokine receptor activity |
| GO:0005102 | 0.0019 | 2.04 | 13.4926 | 25 | 1448 | receptor binding |
| GO:0004888 | 0.003 | 2.0857 | 10.9488 | 21 | 1175 | transmembrane signaling receptor activity |
| GO:0016840 | 0.003 | 30.7709 | 0.0839 | 2 | 9 | carbon-nitrogen lyase activity |
| GO:0004871 | 0.0031 | 1.9339 | 14.7692 | 26 | 1585 | signal transducer activity |
| GO:0048020 | 0.0057 | 9.0191 | 0.3634 | 3 | 39 | CCR chemokine receptor binding |
| GO:0008528 | 0.0057 | 4.6649 | 1.1368 | 5 | 122 | G-protein coupled peptide receptor activity |
| GO:0019842 | 0.0074 | 4.3641 | 1.2114 | 5 | 130 | vitamin binding |
| GO:0001716 | 0.0093 | Inf | 0.0093 | 1 | 1 | L-amino-acid oxidase activity |
| GO:0004397 | 0.0093 | Inf | 0.0093 | 1 | 1 | histidine ammonia-lyase activity |
| GO:0004979 | 0.0093 | Inf | 0.0093 | 1 | 1 | beta-endorphin receptor activity |
| GO:0005142 | 0.0093 | Inf | 0.0093 | 1 | 1 | interleukin-11 receptor binding |
| GO:0008555 | 0.0093 | Inf | 0.0093 | 1 | 1 | chloride-transporting ATPase activity |
| GO:0016517 | 0.0093 | Inf | 0.0093 | 1 | 1 | interleukin-12 receptor activity |
| GO:0019969 | 0.0093 | Inf | 0.0093 | 1 | 1 | interleukin-10 binding |
| GO:0031768 | 0.0093 | Inf | 0.0093 | 1 | 1 | ghrelin receptor binding |
| GO:0038047 | 0.0093 | Inf | 0.0093 | 1 | 1 | morphine receptor activity |
| GO:0042007 | 0.0093 | Inf | 0.0093 | 1 | 1 | interleukin-18 binding |
| GO:0047042 | 0.0093 | Inf | 0.0093 | 1 | 1 | androsterone dehydrogenase (B-specific) activity |
| GO:0050459 | 0.0093 | Inf | 0.0093 | 1 | 1 | ethanolamine-phosphate phospho-lyase activity |
| GO:0097260 | 0.0093 | Inf | 0.0093 | 1 | 1 | eoxin A4 synthase activity |
| GOMFID | Pvalue | OddsRatio | ExpCount | Count | Size | Term |
| GO:0019966 | 0.002 | 37.644 | 0.0689 | 2 | 9 | interleukin-1 binding |
| GO:0004984 | 0.0076 | 2.9947 | 2.8312 | 8 | 370 | olfactory receptor activity |
| GO:0001631 | 0.0077 | Inf | 0.0077 | 1 | 1 | cysteinyl leukotriene receptor activity |
| GO:0001716 | 0.0077 | Inf | 0.0077 | 1 | 1 | L-amino-acid oxidase activity |
| GO:0004489 | 0.0077 | Inf | 0.0077 | 1 | 1 | methylenetetrahydrofolate reductase (NAD(P)H) activity |
| GO:0004588 | 0.0077 | Inf | 0.0077 | 1 | 1 | orotate phosphoribosyltransferase activity |
| GO:0004590 | 0.0077 | Inf | 0.0077 | 1 | 1 | orotidine-5'-phosphate decarboxylase activity |
| GO:0052591 | 0.0077 | Inf | 0.0077 | 1 | 1 | sn-glycerol-3-phosphate:ubiquinone-8 oxidoreductase activity |
| GO:0004869 | 0.009 | 7.4979 | 0.4285 | 3 | 56 | cysteine-type endopeptidase inhibitor activity |
| GO:0061135 | 0.0097 | 4.0779 | 1.2932 | 5 | 169 | endopeptidase regulator activity |
| GOMFID | Pvalue | OddsRatio | ExpCount | Count | Size | Term |
| GO:0022803 | 1e-04 | 3.5841 | 4.5823 | 15 | 442 | passive transmembrane transporter activity |
| GO:0022836 | 1e-04 | 4.0489 | 3.2242 | 12 | 311 | gated channel activity |
| GO:0022838 | 1e-04 | 3.5722 | 4.2713 | 14 | 412 | substrate-specific channel activity |
| GO:0005244 | 1e-04 | 5.0431 | 1.9387 | 9 | 187 | voltage-gated ion channel activity |
| GO:0005261 | 3e-04 | 3.7779 | 3.1413 | 11 | 303 | cation channel activity |
| GO:0005249 | 4e-04 | 6.9508 | 0.9434 | 6 | 91 | voltage-gated potassium channel activity |
| GO:0022890 | 0.0012 | 2.751 | 5.4635 | 14 | 527 | inorganic cation transmembrane transporter activity |
| GO:0015079 | 0.0013 | 4.6049 | 1.6276 | 7 | 157 | potassium ion transmembrane transporter activity |
| GO:0005509 | 0.0014 | 2.516 | 6.8423 | 16 | 660 | calcium ion binding |
| GO:0015075 | 0.0025 | 2.25 | 8.6048 | 18 | 830 | ion transmembrane transporter activity |
| GO:1904680 | 0.0027 | 12.1311 | 0.2799 | 3 | 27 | peptide transmembrane transporter activity |
| GO:0015450 | 0.0029 | 32.1908 | 0.0829 | 2 | 8 | P-P-bond-hydrolysis-driven protein transmembrane transporter activity |
| GO:0022892 | 0.0043 | 2.0063 | 11.2691 | 21 | 1087 | substrate-specific transporter activity |
| GO:0005283 | 0.0066 | 19.3096 | 0.1244 | 2 | 12 | sodium:amino acid symporter activity |
| GO:0005245 | 0.0071 | 8.3127 | 0.394 | 3 | 38 | voltage-gated calcium channel activity |
| GO:0008528 | 0.0088 | 4.1739 | 1.2648 | 5 | 122 | G-protein coupled peptide receptor activity |
| GO:0004659 | 0.009 | 16.0894 | 0.1451 | 2 | 14 | prenyltransferase activity |
| GO:0004953 | 0.009 | 16.0894 | 0.1451 | 2 | 14 | icosanoid receptor activity |
| GOMFID | Pvalue | OddsRatio | ExpCount | Count | Size | Term |
| GO:0030246 | 0 | 5.4763 | 2.8559 | 14 | 260 | carbohydrate binding |
| GO:0048020 | 0 | 16.907 | 0.4284 | 6 | 39 | CCR chemokine receptor binding |
| GO:0005126 | 0 | 4.5436 | 2.8889 | 12 | 263 | cytokine receptor binding |
| GO:0045028 | 1e-04 | 39.2327 | 0.1098 | 3 | 10 | G-protein coupled purinergic nucleotide receptor activity |
| GO:0071723 | 1e-04 | 39.2327 | 0.1098 | 3 | 10 | lipopeptide binding |
| GO:0016502 | 8e-04 | 19.6078 | 0.1867 | 3 | 17 | nucleotide receptor activity |
| GO:0004872 | 8e-04 | 2.024 | 16.3556 | 30 | 1489 | receptor activity |
| GO:0019863 | 0.0012 | 60.697 | 0.0549 | 2 | 5 | IgE binding |
| GO:0030883 | 0.0012 | 60.697 | 0.0549 | 2 | 5 | endogenous lipid antigen binding |
| GO:0030884 | 0.0012 | 60.697 | 0.0549 | 2 | 5 | exogenous lipid antigen binding |
| GO:0035586 | 0.0015 | 15.2467 | 0.2307 | 3 | 21 | purinergic receptor activity |
| GO:0008009 | 0.0019 | 8.3506 | 0.5272 | 4 | 48 | chemokine activity |
| GO:0001664 | 0.0022 | 3.3745 | 2.8339 | 9 | 258 | G-protein coupled receptor binding |
| GO:0042608 | 0.0024 | 36.4136 | 0.0769 | 2 | 7 | T cell receptor binding |
| GO:0001637 | 0.0025 | 12.4714 | 0.2746 | 3 | 25 | G-protein coupled chemoattractant receptor activity |
| GO:0004126 | 0.0032 | 30.3428 | 0.0879 | 2 | 8 | cytidine deaminase activity |
| GO:0030881 | 0.0041 | 26.0065 | 0.0989 | 2 | 9 | beta-2-microglobulin binding |
| GO:0052650 | 0.0041 | 26.0065 | 0.0989 | 2 | 9 | NADP-retinol dehydrogenase activity |
| GO:0097001 | 0.0051 | 22.7543 | 0.1098 | 2 | 10 | ceramide binding |
| GO:0005068 | 0.0062 | 20.2247 | 0.1208 | 2 | 11 | transmembrane receptor protein tyrosine kinase adaptor activity |
| GO:0016493 | 0.0074 | 18.2011 | 0.1318 | 2 | 12 | C-C chemokine receptor activity |
| GOMFID | Pvalue | OddsRatio | ExpCount | Count | Size | Term |
| GO:0030246 | 0 | 5.7975 | 2.7115 | 14 | 260 | carbohydrate binding |
| GO:0048020 | 1e-04 | 14.349 | 0.4067 | 5 | 39 | CCR chemokine receptor binding |
| GO:0004872 | 1e-04 | 2.3372 | 15.5286 | 32 | 1489 | receptor activity |
| GO:0005126 | 1e-04 | 4.3607 | 2.7428 | 11 | 263 | cytokine receptor binding |
| GO:0071723 | 1e-04 | 41.383 | 0.1043 | 3 | 10 | lipopeptide binding |
| GO:0019863 | 0.0011 | 64.004 | 0.0521 | 2 | 5 | IgE binding |
| GO:0030883 | 0.0011 | 64.004 | 0.0521 | 2 | 5 | endogenous lipid antigen binding |
| GO:0030884 | 0.0011 | 64.004 | 0.0521 | 2 | 5 | exogenous lipid antigen binding |
| GO:0008528 | 0.0018 | 5.0518 | 1.2723 | 6 | 122 | G-protein coupled peptide receptor activity |
| GO:0042608 | 0.0022 | 38.3976 | 0.073 | 2 | 7 | T cell receptor binding |
| GO:0004126 | 0.0029 | 31.996 | 0.0834 | 2 | 8 | cytidine deaminase activity |
| GO:0030881 | 0.0037 | 27.4234 | 0.0939 | 2 | 9 | beta-2-microglobulin binding |
| GO:0052650 | 0.0037 | 27.4234 | 0.0939 | 2 | 9 | NADP-retinol dehydrogenase activity |
| GO:0045028 | 0.0046 | 23.994 | 0.1043 | 2 | 10 | G-protein coupled purinergic nucleotide receptor activity |
| GO:0004888 | 0.0054 | 1.9318 | 12.2539 | 22 | 1175 | transmembrane signaling receptor activity |
| GO:0005068 | 0.0056 | 21.3267 | 0.1147 | 2 | 11 | transmembrane receptor protein tyrosine kinase adaptor activity |
| GO:0001664 | 0.0057 | 3.1376 | 2.6907 | 8 | 258 | G-protein coupled receptor binding |
| GO:0016493 | 0.0067 | 19.1928 | 0.1251 | 2 | 12 | C-C chemokine receptor activity |
| GO:0005125 | 0.0076 | 3.2722 | 2.2526 | 7 | 216 | cytokine activity |
| GO:0004950 | 0.0077 | 17.6474 | 0.1341 | 2 | 13 | chemokine receptor activity |
| GO:0015144 | 0.0095 | 7.4129 | 0.438 | 3 | 42 | carbohydrate transmembrane transporter activity |
| GOMFID | Pvalue | OddsRatio | ExpCount | Count | Size | Term |
| GO:0048020 | 0 | 20.813 | 0.3514 | 6 | 39 | CCR chemokine receptor binding |
| GO:0008061 | 0 | 67.3594 | 0.0721 | 3 | 8 | chitin binding |
| GO:0008009 | 1e-04 | 13.208 | 0.4325 | 5 | 48 | chemokine activity |
| GO:0032394 | 1e-04 | Inf | 0.018 | 2 | 2 | MHC class Ib receptor activity |
| GO:0001664 | 6e-04 | 4.1711 | 2.3245 | 9 | 258 | G-protein coupled receptor binding |
| GO:0016004 | 0.0042 | 24.7685 | 0.0991 | 2 | 11 | phospholipase activator activity |
| GO:0005549 | 0.0067 | 5.698 | 0.7478 | 4 | 83 | odorant binding |
| GO:0008308 | 0.0089 | 15.9177 | 0.1442 | 2 | 16 | voltage-gated anion channel activity |
| GO:0008808 | 0.009 | Inf | 0.009 | 1 | 1 | cardiolipin synthase activity |
| GO:0008843 | 0.009 | Inf | 0.009 | 1 | 1 | endochitinase activity |
| GO:0031764 | 0.009 | Inf | 0.009 | 1 | 1 | type 1 galanin receptor binding |
| GO:0031765 | 0.009 | Inf | 0.009 | 1 | 1 | type 2 galanin receptor binding |
| GO:0031766 | 0.009 | Inf | 0.009 | 1 | 1 | type 3 galanin receptor binding |
| GO:0036470 | 0.009 | Inf | 0.009 | 1 | 1 | tyrosine 3-monooxygenase activator activity |
| GO:0036478 | 0.009 | Inf | 0.009 | 1 | 1 | L-dopa decarboxylase activator activity |
| GO:0036524 | 0.009 | Inf | 0.009 | 1 | 1 | protein deglycase activity |
| GO:0043337 | 0.009 | Inf | 0.009 | 1 | 1 | CDP-diacylglycerol-phosphatidylglycerol phosphatidyltransferase activity |
| GO:0045340 | 0.009 | Inf | 0.009 | 1 | 1 | mercury ion binding |
| GO:0005126 | 0.0098 | 3.1087 | 2.3695 | 7 | 263 | cytokine receptor binding |
| GOMFID | Pvalue | OddsRatio | ExpCount | Count | Size | Term |
| GO:0048020 | 0 | 24.7273 | 0.2984 | 6 | 39 | CCR chemokine receptor binding |
| GO:0008061 | 0 | 79.7157 | 0.0612 | 3 | 8 | chitin binding |
| GO:0008009 | 0 | 15.6713 | 0.3673 | 5 | 48 | chemokine activity |
| GO:0032394 | 1e-04 | Inf | 0.0153 | 2 | 2 | MHC class Ib receptor activity |
| GO:0016004 | 0.0031 | 29.275 | 0.0842 | 2 | 11 | phospholipase activator activity |
| GO:0001664 | 0.0037 | 3.7733 | 1.9742 | 7 | 258 | G-protein coupled receptor binding |
| GO:0005126 | 0.0041 | 3.6984 | 2.0125 | 7 | 263 | cytokine receptor binding |
| GO:0008017 | 0.0051 | 4.0375 | 1.5763 | 6 | 206 | microtubule binding |
| GO:0008445 | 0.0077 | Inf | 0.0077 | 1 | 1 | D-aspartate oxidase activity |
| GO:0008843 | 0.0077 | Inf | 0.0077 | 1 | 1 | endochitinase activity |
| GO:0036470 | 0.0077 | Inf | 0.0077 | 1 | 1 | tyrosine 3-monooxygenase activator activity |
| GO:0036478 | 0.0077 | Inf | 0.0077 | 1 | 1 | L-dopa decarboxylase activator activity |
| GO:0036524 | 0.0077 | Inf | 0.0077 | 1 | 1 | protein deglycase activity |
| GO:0045340 | 0.0077 | Inf | 0.0077 | 1 | 1 | mercury ion binding |
| GO:0047127 | 0.0077 | Inf | 0.0077 | 1 | 1 | thiomorpholine-carboxylate dehydrogenase activity |
| GO:0016638 | 0.0082 | 16.46 | 0.1377 | 2 | 18 | oxidoreductase activity, acting on the CH-NH2 group of donors |
| GO:0042288 | 0.0082 | 16.46 | 0.1377 | 2 | 18 | MHC class I protein binding |
| GOMFID | Pvalue | OddsRatio | ExpCount | Count | Size | Term |
| GO:0004872 | 1e-04 | 3.5292 | 5.9725 | 17 | 1489 | receptor activity |
| GO:0004871 | 1e-04 | 3.2914 | 6.3576 | 17 | 1585 | signal transducer activity |
| GO:0005125 | 2e-04 | 7.7143 | 0.8664 | 6 | 216 | cytokine activity |
| GO:0005126 | 5e-04 | 6.5831 | 1.011 | 6 | 260 | cytokine receptor binding |
| GO:0004984 | 7e-04 | 5.2455 | 1.4841 | 7 | 370 | olfactory receptor activity |
| GO:0004888 | 0.0029 | 4.657 | 1.4234 | 6 | 392 | transmembrane signaling receptor activity |
| GO:0004930 | 0.0039 | 3.1906 | 3.1407 | 9 | 783 | G-protein coupled receptor activity |
| GO:0015130 | 0.004 | Inf | 0.004 | 1 | 1 | mevalonate transmembrane transporter activity |
| GO:0030107 | 0.004 | Inf | 0.004 | 1 | 1 | HLA-A specific inhibitory MHC class I receptor activity |
| GO:0030380 | 0.004 | Inf | 0.004 | 1 | 1 | interleukin-17E receptor binding |
| GO:0004950 | 0.0045 | 22.2457 | 0.1003 | 2 | 25 | chemokine receptor activity |
| GO:0001069 | 0.008 | 252.1719 | 0.008 | 1 | 2 | regulatory region RNA binding |
| GO:0010465 | 0.008 | 252.1719 | 0.008 | 1 | 2 | nerve growth factor receptor activity |
| GO:0030109 | 0.008 | 252.1719 | 0.008 | 1 | 2 | HLA-B specific inhibitory MHC class I receptor activity |
| GO:0042019 | 0.008 | 252.1719 | 0.008 | 1 | 2 | interleukin-23 binding |
| GO:0042020 | 0.008 | 252.1719 | 0.008 | 1 | 2 | interleukin-23 receptor activity |
| GO:0045523 | 0.008 | 252.1719 | 0.008 | 1 | 2 | interleukin-27 receptor binding |
| GO:0046556 | 0.008 | 252.1719 | 0.008 | 1 | 2 | alpha-L-arabinofuranosidase activity |
| GO:0070095 | 0.008 | 252.1719 | 0.008 | 1 | 2 | fructose-6-phosphate binding |
| GO:0071791 | 0.008 | 252.1719 | 0.008 | 1 | 2 | chemokine (C-C motif) ligand 5 binding |
| GOMFID | Pvalue | OddsRatio | ExpCount | Count | Size | Term |
| GO:0004984 | 0 | 7.556 | 1.5526 | 10 | 370 | olfactory receptor activity |
| GO:0005125 | 0 | 10.2109 | 0.9064 | 8 | 216 | cytokine activity |
| GO:0099600 | 0 | 4.1417 | 5.1152 | 17 | 1219 | transmembrane receptor activity |
| GO:0038023 | 0 | 3.9289 | 5.367 | 17 | 1279 | signaling receptor activity |
| GO:0004930 | 1e-04 | 4.2707 | 3.2857 | 12 | 783 | G-protein coupled receptor activity |
| GO:0060089 | 1e-04 | 3.2148 | 6.4328 | 17 | 1533 | molecular transducer activity |
| GO:0005126 | 7e-04 | 6.2528 | 1.0591 | 6 | 260 | cytokine receptor binding |
| GO:0030545 | 8e-04 | 4.5037 | 1.9806 | 8 | 472 | receptor regulator activity |
| GO:0015130 | 0.0042 | Inf | 0.0042 | 1 | 1 | mevalonate transmembrane transporter activity |
| GO:0030107 | 0.0042 | Inf | 0.0042 | 1 | 1 | HLA-A specific inhibitory MHC class I receptor activity |
| GO:0030380 | 0.0042 | Inf | 0.0042 | 1 | 1 | interleukin-17E receptor binding |
| GO:0043843 | 0.0042 | Inf | 0.0042 | 1 | 1 | ADP-specific glucokinase activity |
| GO:0005164 | 0.0065 | 18.0808 | 0.1217 | 2 | 29 | tumor necrosis factor receptor binding |
| GO:0004775 | 0.0084 | 240.8358 | 0.0084 | 1 | 2 | succinate-CoA ligase (ADP-forming) activity |
| GO:0004776 | 0.0084 | 240.8358 | 0.0084 | 1 | 2 | succinate-CoA ligase (GDP-forming) activity |
| GO:0005171 | 0.0084 | 240.8358 | 0.0084 | 1 | 2 | hepatocyte growth factor receptor binding |
| GO:0010465 | 0.0084 | 240.8358 | 0.0084 | 1 | 2 | nerve growth factor receptor activity |
| GO:0030109 | 0.0084 | 240.8358 | 0.0084 | 1 | 2 | HLA-B specific inhibitory MHC class I receptor activity |
| GO:0045523 | 0.0084 | 240.8358 | 0.0084 | 1 | 2 | interleukin-27 receptor binding |
| GO:0046556 | 0.0084 | 240.8358 | 0.0084 | 1 | 2 | alpha-L-arabinofuranosidase activity |
| GO:0070095 | 0.0084 | 240.8358 | 0.0084 | 1 | 2 | fructose-6-phosphate binding |
| GO:0071791 | 0.0084 | 240.8358 | 0.0084 | 1 | 2 | chemokine (C-C motif) ligand 5 binding |
| GOMFID | Pvalue | OddsRatio | ExpCount | Count | Size | Term |
| GO:0048248 | 1e-04 | 219.7415 | 0.0157 | 2 | 5 | CXCR3 chemokine receptor binding |
| GO:0005129 | 0.0031 | Inf | 0.0031 | 1 | 1 | granulocyte macrophage colony-stimulating factor receptor binding |
| GO:0030380 | 0.0031 | Inf | 0.0031 | 1 | 1 | interleukin-17E receptor binding |
| GO:0030332 | 0.0043 | 22.6953 | 0.0976 | 2 | 31 | cyclin binding |
| GO:0017099 | 0.0063 | 323.06 | 0.0063 | 1 | 2 | very-long-chain-acyl-CoA dehydrogenase activity |
| GO:0043028 | 0.007 | 17.3104 | 0.1259 | 2 | 40 | cysteine-type endopeptidase regulator activity involved in apoptotic process |
| GO:0030369 | 0.0094 | 161.52 | 0.0094 | 1 | 3 | ICAM-3 receptor activity |
| GO:0008009 | 0.01 | 14.2928 | 0.1511 | 2 | 48 | chemokine activity |
| GOMFID | Pvalue | OddsRatio | ExpCount | Count | Size | Term |
| GO:0008009 | 0 | 26.6149 | 0.1748 | 4 | 48 | chemokine activity |
| GO:0048020 | 4e-04 | 23.9732 | 0.142 | 3 | 39 | CCR chemokine receptor binding |
| GO:0048018 | 0.0011 | 4.8277 | 1.6202 | 7 | 445 | receptor ligand activity |
| GO:0005126 | 0.0024 | 5.8325 | 0.9378 | 5 | 262 | cytokine receptor binding |
| GO:0070330 | 0.0031 | 26.9424 | 0.0837 | 2 | 23 | aromatase activity |
| GO:0005133 | 0.0036 | Inf | 0.0036 | 1 | 1 | interferon-gamma receptor binding |
| GO:0030107 | 0.0036 | Inf | 0.0036 | 1 | 1 | HLA-A specific inhibitory MHC class I receptor activity |
| GO:0042169 | 0.0057 | 19.5003 | 0.1129 | 2 | 31 | SH2 domain binding |
| GO:0008389 | 0.0073 | 278.3621 | 0.0073 | 1 | 2 | coumarin 7-hydroxylase activity |
| GO:0030109 | 0.0073 | 278.3621 | 0.0073 | 1 | 2 | HLA-B specific inhibitory MHC class I receptor activity |
| GOMFID | Pvalue | OddsRatio | ExpCount | Count | Size | Term |
| GO:0008502 | 1e-04 | Inf | 0.0211 | 2 | 2 | melatonin receptor activity |
| GO:0036461 | 1e-04 | Inf | 0.0211 | 2 | 2 | BLOC-2 complex binding |
| GO:0008519 | 2e-04 | 15.978 | 0.2955 | 4 | 28 | ammonium transmembrane transporter activity |
| GO:0035651 | 3e-04 | 189.7396 | 0.0317 | 2 | 3 | AP-3 adaptor complex binding |
| GO:0035650 | 7e-04 | 94.8639 | 0.0422 | 2 | 4 | AP-1 adaptor complex binding |
| GO:0016812 | 0.0016 | 47.426 | 0.0633 | 2 | 6 | hydrolase activity, acting on carbon-nitrogen (but not peptide) bonds, in cyclic amides |
| GO:0005509 | 0.0017 | 2.4668 | 6.9645 | 16 | 660 | calcium ion binding |
| GO:0008046 | 0.0022 | 37.9385 | 0.0739 | 2 | 7 | axon guidance receptor activity |
| GO:0004871 | 0.0023 | 1.9002 | 16.7254 | 29 | 1585 | signal transducer activity |
| GO:0004872 | 0.0037 | 1.8688 | 15.7124 | 27 | 1489 | receptor activity |
| GO:0051378 | 0.0047 | 23.7071 | 0.1055 | 2 | 10 | serotonin binding |
| GO:0089720 | 0.0047 | 23.7071 | 0.1055 | 2 | 10 | caspase binding |
| GO:0004888 | 0.005 | 1.9436 | 12.1862 | 22 | 1168 | transmembrane signaling receptor activity |
| GO:0015081 | 0.0052 | 4.0126 | 1.5828 | 6 | 150 | sodium ion transmembrane transporter activity |
| GO:0008376 | 0.0054 | 9.2183 | 0.3588 | 3 | 34 | acetylgalactosaminyltransferase activity |
| GO:0022836 | 0.0058 | 2.894 | 3.2818 | 9 | 311 | gated channel activity |
| GO:0004222 | 0.0069 | 4.4417 | 1.1924 | 5 | 113 | metalloendopeptidase activity |
| GO:0019905 | 0.0093 | 5.1659 | 0.8231 | 4 | 78 | syntaxin binding |
| GOMFID | Pvalue | OddsRatio | ExpCount | Count | Size | Term |
| GO:0016409 | 4e-04 | 24.4076 | 0.14 | 3 | 36 | palmitoyltransferase activity |
| GO:0008106 | 0.0017 | 37.7705 | 0.0622 | 2 | 16 | alcohol dehydrogenase (NADP+) activity |
| GO:0001760 | 0.0039 | Inf | 0.0039 | 1 | 1 | aminocarboxymuconate-semialdehyde decarboxylase activity |
| GO:0018455 | 0.0039 | Inf | 0.0039 | 1 | 1 | alcohol dehydrogenase [NAD(P)+] activity |
| GO:0047042 | 0.0039 | Inf | 0.0039 | 1 | 1 | androsterone dehydrogenase (B-specific) activity |
| GO:1990698 | 0.0039 | Inf | 0.0039 | 1 | 1 | palmitoleoyltransferase activity |
| GO:0015020 | 0.0073 | 17.0397 | 0.1283 | 2 | 33 | glucuronosyltransferase activity |
| GO:0004053 | 0.0078 | 260.3387 | 0.0078 | 1 | 2 | arginase activity |
| GO:0032089 | 0.0078 | 260.3387 | 0.0078 | 1 | 2 | NACHT domain binding |
| GO:0047006 | 0.0078 | 260.3387 | 0.0078 | 1 | 2 | 17-alpha,20-alpha-dihydroxypregn-4-en-3-one dehydrogenase activity |
| GO:0048101 | 0.0078 | 260.3387 | 0.0078 | 1 | 2 | calcium- and calmodulin-regulated 3',5'-cyclic-GMP phosphodiesterase activity |
| GOMFID | Pvalue | OddsRatio | ExpCount | Count | Size | Term |
| GO:0003755 | 0.0026 | 11.9642 | 0.2767 | 3 | 38 | peptidyl-prolyl cis-trans isomerase activity |
| GO:0004476 | 0.0073 | Inf | 0.0073 | 1 | 1 | mannose-6-phosphate isomerase activity |
| GO:0005459 | 0.0073 | Inf | 0.0073 | 1 | 1 | UDP-galactose transmembrane transporter activity |
| GO:0030377 | 0.0073 | Inf | 0.0073 | 1 | 1 | urokinase plasminogen activator receptor activity |
| GO:0042922 | 0.0073 | Inf | 0.0073 | 1 | 1 | neuromedin U receptor binding |
| GO:0047915 | 0.0073 | Inf | 0.0073 | 1 | 1 | ganglioside galactosyltransferase activity |
| GO:0102339 | 0.0073 | Inf | 0.0073 | 1 | 1 | 3-oxo-arachidoyl-CoA reductase activity |
| GO:0102340 | 0.0073 | Inf | 0.0073 | 1 | 1 | 3-oxo-behenoyl-CoA reductase activity |
| GO:0102341 | 0.0073 | Inf | 0.0073 | 1 | 1 | 3-oxo-lignoceroyl-CoA reductase activity |
| GO:0102342 | 0.0073 | Inf | 0.0073 | 1 | 1 | 3-oxo-cerotoyl-CoA reductase activity |
| GO:0015197 | 0.008 | 5.3924 | 0.7864 | 4 | 108 | peptide transporter activity |
| GOMFID | Pvalue | OddsRatio | ExpCount | Count | Size | Term |
| GO:0102953 | 0.001 | 66.4141 | 0.0503 | 2 | 5 | hypoglycin A gamma-glutamyl transpeptidase activity |
| GO:0036374 | 0.002 | 39.8435 | 0.0704 | 2 | 7 | glutathione hydrolase activity |
| GO:0015643 | 0.0043 | 24.8975 | 0.1006 | 2 | 10 | toxic substance binding |
| GO:0015271 | 0.0052 | 22.1297 | 0.1106 | 2 | 11 | outward rectifier potassium channel activity |
| GO:0004896 | 0.0098 | 5.0834 | 0.8349 | 4 | 83 | cytokine receptor activity |
| GOMFID | Pvalue | OddsRatio | ExpCount | Count | Size | Term |
| GO:0032394 | 2e-04 | Inf | 0.0267 | 2 | 2 | MHC class Ib receptor activity |
| GO:0031720 | 5e-04 | 149.4206 | 0.04 | 2 | 3 | haptoglobin binding |
| GO:0035663 | 5e-04 | 149.4206 | 0.04 | 2 | 3 | Toll-like receptor 2 binding |
| GO:0031014 | 0.001 | 74.7056 | 0.0533 | 2 | 4 | troponin T binding |
| GO:0015057 | 0.0017 | 49.8006 | 0.0666 | 2 | 5 | thrombin-activated receptor activity |
| GO:0004565 | 0.0026 | 37.3481 | 0.08 | 2 | 6 | beta-galactosidase activity |
| GO:0019825 | 0.003 | 7.3392 | 0.5998 | 4 | 45 | oxygen binding |
| GO:0098634 | 0.0036 | 29.8766 | 0.0933 | 2 | 7 | cell-matrix adhesion mediator activity |
| GO:0015386 | 0.006 | 21.3378 | 0.12 | 2 | 9 | potassium:proton antiporter activity |
| GO:0005072 | 0.0074 | 18.6694 | 0.1333 | 2 | 10 | transforming growth factor beta receptor, cytoplasmic mediator activity |
| GO:0071723 | 0.0074 | 18.6694 | 0.1333 | 2 | 10 | lipopeptide binding |
| GO:0015385 | 0.009 | 16.594 | 0.1466 | 2 | 11 | sodium:proton antiporter activity |
| GO:0043295 | 0.009 | 16.594 | 0.1466 | 2 | 11 | glutathione binding |
| NA. |
| n/a |
| NA. |
| n/a |
| NA. |
| n/a |
| NA. |
| n/a |
| NA. |
| n/a |
| NA. |
| n/a |
| NA. |
| n/a |
| NA. |
| n/a |
| NA. |
| n/a |
| NA. |
| n/a |
| NA. |
| n/a |
| NA. |
| n/a |
| NA. |
| n/a |
| NA. |
| n/a |
| NA. |
| n/a |
| NA. |
| n/a |
| NA. |
| n/a |
| NA. |
| n/a |
| NA. |
| n/a |
| NA. |
| n/a |
| NA. |
| n/a |
| NA. |
| n/a |
| NA. |
| n/a |
| NA. |
| n/a |
| NA. |
| n/a |
| NA. |
| n/a |
| NA. |
| n/a |
| NA. |
| n/a |
| NA. |
| n/a |
| NA. |
| n/a |
| NA. |
| n/a |
| NA. |
| n/a |
| NA. |
| n/a |
| NA. |
| n/a |
| NA. |
| n/a |
| NA. |
| n/a |
| NA. |
| n/a |
| NA. |
| n/a |
| NA. |
| n/a |
| NA. |
| n/a |
| NA. |
| n/a |
| NA. |
| n/a |
| NA. |
| n/a |
| NA. |
| n/a |
| NA. |
| n/a |
| NA. |
| n/a |
| NA. |
| n/a |
| NA. |
| n/a |
| NA. |
| n/a |
| NA. |
| n/a |
| NA. |
| n/a |
| NA. |
| n/a |
| NA. |
| n/a |
| NA. |
| n/a |
| NA. |
| n/a |
| NA. |
| n/a |
| GOMFID | Pvalue | OddsRatio | ExpCount | Count | Size | Term |
| GO:0007156 | 0 | 12.2305 | 2.379 | 23 | 152 | homophilic cell adhesion via plasma membrane adhesion molecules |
| GO:0006355 | 0 | 2.9397 | 53.9646 | 111 | 3448 | regulation of transcription, DNA-templated |
| GO:2001141 | 0 | 2.9099 | 54.3872 | 111 | 3475 | regulation of RNA biosynthetic process |
| GO:0007275 | 0 | 3.2343 | 42.773 | 92 | 3146 | multicellular organism development |
| GO:0045944 | 0 | 3.8823 | 16.7309 | 53 | 1069 | positive regulation of transcription from RNA polymerase II promoter |
| GO:0019219 | 0 | 2.6361 | 63.0109 | 117 | 4026 | regulation of nucleobase-containing compound metabolic process |
| GO:0032502 | 0 | 3.8506 | 20.0475 | 55 | 1605 | developmental process |
| GO:0034654 | 0 | 2.5052 | 63.8717 | 115 | 4081 | nucleobase-containing compound biosynthetic process |
| GO:0016339 | 0 | 36.332 | 0.4382 | 10 | 28 | calcium-dependent cell-cell adhesion via plasma membrane cell adhesion molecules |
| GO:2000113 | 0 | 3.0473 | 23.0383 | 58 | 1472 | negative regulation of cellular macromolecule biosynthetic process |
| GO:0051254 | 0 | 3.0504 | 22.5531 | 57 | 1441 | positive regulation of RNA metabolic process |
| GO:1903508 | 0 | 3.0812 | 21.4419 | 55 | 1370 | positive regulation of nucleic acid-templated transcription |
| GO:0009890 | 0 | 2.8958 | 25.5581 | 61 | 1633 | negative regulation of biosynthetic process |
| GO:0010628 | 0 | 2.7169 | 27.5301 | 62 | 1759 | positive regulation of gene expression |
| GO:0007267 | 0 | 3.253 | 15.9422 | 44 | 1056 | cell-cell signaling |
| GO:0009952 | 0 | 7.0253 | 2.9665 | 18 | 191 | anterior/posterior pattern specification |
| GO:0060173 | 0 | 7.4177 | 2.6607 | 17 | 170 | limb development |
| GO:0010629 | 0 | 2.6114 | 28.4848 | 62 | 1820 | negative regulation of gene expression |
| GO:1903507 | 0 | 3.0141 | 17.8108 | 46 | 1138 | negative regulation of nucleic acid-templated transcription |
| GO:0007399 | 0 | 3.0148 | 18.7478 | 47 | 1395 | nervous system development |
| GO:0007416 | 0 | 8.0228 | 2.1755 | 15 | 139 | synapse assembly |
| GO:0010557 | 0 | 2.6397 | 25.0729 | 56 | 1602 | positive regulation of macromolecule biosynthetic process |
| GO:0031328 | 0 | 2.5779 | 27.1858 | 59 | 1737 | positive regulation of cellular biosynthetic process |
| GO:0035107 | 0 | 7.6497 | 2.2694 | 15 | 145 | appendage morphogenesis |
| GO:0000122 | 0 | 3.3714 | 11.8635 | 35 | 758 | negative regulation of transcription from RNA polymerase II promoter |
| GO:0051253 | 0 | 2.8088 | 18.969 | 46 | 1212 | negative regulation of RNA metabolic process |
| GO:0090304 | 0 | 1.9948 | 76.7838 | 117 | 4906 | nucleic acid metabolic process |
| GO:0009953 | 0 | 9.4209 | 1.367 | 11 | 88 | dorsal/ventral pattern formation |
| GO:0043009 | 0 | 3.5351 | 8.5611 | 27 | 547 | chordate embryonic development |
| GO:0098609 | 0 | 3.044 | 12.2078 | 33 | 780 | cell-cell adhesion |
| GO:0031324 | 0 | 2.5703 | 19.8295 | 44 | 1334 | negative regulation of cellular metabolic process |
| GO:0007420 | 0 | 3.2028 | 10.1262 | 29 | 647 | brain development |
| GO:0009954 | 0 | 18.8355 | 0.4852 | 7 | 31 | proximal/distal pattern formation |
| GO:0048562 | 0 | 5.9433 | 2.6481 | 14 | 175 | embryonic organ morphogenesis |
| GO:1901576 | 0 | 1.8729 | 95.4867 | 134 | 6101 | organic substance biosynthetic process |
| GO:0034641 | 0 | 1.8687 | 98.4604 | 137 | 6291 | cellular nitrogen compound metabolic process |
| GO:0051172 | 0 | 2.1897 | 30.9077 | 58 | 2043 | negative regulation of nitrogen compound metabolic process |
| GO:0051173 | 0 | 2.0106 | 44.2923 | 75 | 2830 | positive regulation of nitrogen compound metabolic process |
| GO:0021511 | 0 | 21.4476 | 0.3756 | 6 | 24 | spinal cord patterning |
| GO:2000026 | 0 | 2.231 | 25.6212 | 50 | 1676 | regulation of multicellular organismal development |
| GO:0021983 | 0 | 13.2873 | 0.6417 | 7 | 41 | pituitary gland development |
| GO:0007492 | 0 | 8.4681 | 1.2208 | 9 | 78 | endoderm development |
| GO:0021530 | 0 | Inf | 0.047 | 3 | 3 | spinal cord oligodendrocyte cell fate specification |
| GO:0060562 | 0 | 3.9631 | 4.7109 | 17 | 301 | epithelial tube morphogenesis |
| GO:0007268 | 0 | 3.0051 | 9.1558 | 25 | 585 | chemical synaptic transmission |
| GO:0031018 | 0 | 11.8857 | 0.7043 | 7 | 45 | endocrine pancreas development |
| GO:0099537 | 0 | 2.994 | 9.1871 | 25 | 587 | trans-synaptic signaling |
| GO:0006725 | 0 | 1.7614 | 89.7741 | 124 | 5736 | cellular aromatic compound metabolic process |
| GO:0046483 | 0 | 1.7506 | 89.2107 | 123 | 5700 | heterocycle metabolic process |
| GO:0021879 | 0 | 23.3255 | 0.2921 | 5 | 19 | forebrain neuron differentiation |
| GO:0090596 | 0 | 4.2589 | 3.8658 | 15 | 247 | sensory organ morphogenesis |
| GO:0001764 | 0 | 5.834 | 2.0972 | 11 | 134 | neuron migration |
| GO:0060429 | 0 | 2.3652 | 17.4277 | 37 | 1140 | epithelium development |
| GO:1901360 | 0 | 1.7176 | 93.0608 | 126 | 5946 | organic cyclic compound metabolic process |
| GO:0048536 | 0 | 12.8589 | 0.5634 | 6 | 36 | spleen development |
| GO:0007519 | 0 | 5.1201 | 2.3633 | 11 | 151 | skeletal muscle tissue development |
| GO:0045595 | 0 | 2.0603 | 25.5729 | 47 | 1646 | regulation of cell differentiation |
| GO:0010721 | 0 | 3.764 | 4.3353 | 15 | 277 | negative regulation of cell development |
| GO:0051962 | 0 | 3.0606 | 7.1056 | 20 | 454 | positive regulation of nervous system development |
| GO:0021779 | 0 | 95.4562 | 0.0783 | 3 | 5 | oligodendrocyte cell fate commitment |
| GO:0021780 | 0 | 95.4562 | 0.0783 | 3 | 5 | glial cell fate specification |
| GO:0048935 | 0 | 28.384 | 0.2035 | 4 | 13 | peripheral nervous system neuron development |
| GO:0051961 | 1e-04 | 3.7765 | 4.0223 | 14 | 257 | negative regulation of nervous system development |
| GO:0003211 | 1e-04 | 64.1365 | 0.0932 | 3 | 6 | cardiac ventricle formation |
| GO:0021537 | 1e-04 | 3.8989 | 3.6154 | 13 | 231 | telencephalon development |
| GO:0048665 | 1e-04 | 21.7923 | 0.2448 | 4 | 16 | neuron fate specification |
| GO:0030326 | 1e-04 | 9.4025 | 0.7341 | 6 | 48 | embryonic limb morphogenesis |
| GO:0043583 | 1e-04 | 4.0762 | 3.1928 | 12 | 204 | ear development |
| GO:0061138 | 1e-04 | 4.3642 | 2.7389 | 11 | 175 | morphogenesis of a branching epithelium |
| GO:0048565 | 1e-04 | 5.3397 | 1.8487 | 9 | 119 | digestive tract development |
| GO:0003209 | 1e-04 | 12.3177 | 0.4852 | 5 | 31 | cardiac atrium morphogenesis |
| GO:0008284 | 1e-04 | 2.3442 | 12.9988 | 28 | 843 | positive regulation of cell proliferation |
| GO:0034645 | 1e-04 | 1.7885 | 45.9771 | 69 | 3464 | cellular macromolecule biosynthetic process |
| GO:0035050 | 1e-04 | 6.9368 | 1.1269 | 7 | 72 | embryonic heart tube development |
| GO:0007405 | 1e-04 | 11.5629 | 0.511 | 5 | 33 | neuroblast proliferation |
| GO:0045665 | 2e-04 | 4.1348 | 2.8798 | 11 | 184 | negative regulation of neuron differentiation |
| GO:0048762 | 2e-04 | 4.1348 | 2.8798 | 11 | 184 | mesenchymal cell differentiation |
| GO:0048557 | 2e-04 | 17.024 | 0.2974 | 4 | 19 | embryonic digestive tract morphogenesis |
| GO:0048645 | 2e-04 | 10.7886 | 0.5421 | 5 | 35 | animal organ formation |
| GO:0035195 | 2e-04 | 3.4633 | 4.038 | 13 | 258 | gene silencing by miRNA |
| GO:0014003 | 2e-04 | 10.3278 | 0.5634 | 5 | 36 | oligodendrocyte development |
| GO:0071392 | 2e-04 | 10.3278 | 0.5634 | 5 | 36 | cellular response to estradiol stimulus |
| GO:0021854 | 2e-04 | 15.959 | 0.313 | 4 | 20 | hypothalamus development |
| GO:0048729 | 2e-04 | 2.6152 | 8.2312 | 20 | 534 | tissue morphogenesis |
| GO:0003326 | 2e-04 | Inf | 0.0313 | 2 | 2 | pancreatic A cell fate commitment |
| GO:0003329 | 2e-04 | Inf | 0.0313 | 2 | 2 | pancreatic PP cell fate commitment |
| GO:0021550 | 2e-04 | Inf | 0.0313 | 2 | 2 | medulla oblongata development |
| GO:0043503 | 2e-04 | Inf | 0.0313 | 2 | 2 | skeletal muscle fiber adaptation |
| GO:0072272 | 2e-04 | Inf | 0.0313 | 2 | 2 | proximal/distal pattern formation involved in metanephric nephron development |
| GO:0055001 | 3e-04 | 4.2382 | 2.5511 | 10 | 163 | muscle cell development |
| GO:0043586 | 3e-04 | 15.0193 | 0.3287 | 4 | 21 | tongue development |
| GO:0016441 | 3e-04 | 3.3656 | 4.1475 | 13 | 265 | posttranscriptional gene silencing |
| GO:0010720 | 3e-04 | 2.7022 | 7.1463 | 18 | 460 | positive regulation of cell development |
| GO:0060537 | 3e-04 | 3.5297 | 3.6524 | 12 | 238 | muscle tissue development |
| GO:0048598 | 4e-04 | 3.4732 | 3.71 | 12 | 259 | embryonic morphogenesis |
| GO:0045666 | 5e-04 | 3.0376 | 4.9301 | 14 | 315 | positive regulation of neuron differentiation |
| GO:0048483 | 5e-04 | 8.6497 | 0.6573 | 5 | 42 | autonomic nervous system development |
| GO:0003002 | 5e-04 | 8.4857 | 0.6619 | 5 | 48 | regionalization |
| GO:0050767 | 5e-04 | 2.4467 | 8.7602 | 20 | 572 | regulation of neurogenesis |
| GO:0048869 | 6e-04 | 1.6159 | 54.1933 | 76 | 3799 | cellular developmental process |
| GO:0031047 | 6e-04 | 3.0796 | 4.5075 | 13 | 288 | gene silencing by RNA |
| GO:0001501 | 7e-04 | 3.049 | 4.5521 | 13 | 297 | skeletal system development |
| GO:0021517 | 7e-04 | 21.7787 | 0.183 | 3 | 12 | ventral spinal cord development |
| GO:0003350 | 7e-04 | 126.7778 | 0.047 | 2 | 3 | pulmonary myocardium development |
| GO:0003358 | 7e-04 | 126.7778 | 0.047 | 2 | 3 | noradrenergic neuron development |
| GO:0014016 | 7e-04 | 126.7778 | 0.047 | 2 | 3 | neuroblast differentiation |
| GO:0021912 | 7e-04 | 126.7778 | 0.047 | 2 | 3 | regulation of transcription from RNA polymerase II promoter involved in spinal cord motor neuron fate specification |
| GO:0048619 | 7e-04 | 126.7778 | 0.047 | 2 | 3 | embryonic hindgut morphogenesis |
| GO:0055014 | 7e-04 | 126.7778 | 0.047 | 2 | 3 | atrial cardiac muscle cell development |
| GO:0060166 | 7e-04 | 126.7778 | 0.047 | 2 | 3 | olfactory pit development |
| GO:0060741 | 7e-04 | 126.7778 | 0.047 | 2 | 3 | prostate gland stromal morphogenesis |
| GO:0060913 | 7e-04 | 126.7778 | 0.047 | 2 | 3 | cardiac cell fate determination |
| GO:0061010 | 7e-04 | 126.7778 | 0.047 | 2 | 3 | gall bladder development |
| GO:0061031 | 7e-04 | 126.7778 | 0.047 | 2 | 3 | endodermal digestive tract morphogenesis |
| GO:0007218 | 7e-04 | 5.1164 | 1.4868 | 7 | 95 | neuropeptide signaling pathway |
| GO:0035987 | 7e-04 | 7.8039 | 0.7199 | 5 | 46 | endodermal cell differentiation |
| GO:0001704 | 7e-04 | 4.446 | 1.9407 | 8 | 124 | formation of primary germ layer |
| GO:0010454 | 8e-04 | 21.2032 | 0.1878 | 3 | 12 | negative regulation of cell fate commitment |
| GO:0055015 | 8e-04 | 21.2032 | 0.1878 | 3 | 12 | ventricular cardiac muscle cell development |
| GO:0060272 | 8e-04 | 21.2032 | 0.1878 | 3 | 12 | embryonic skeletal joint morphogenesis |
| GO:0022610 | 8e-04 | 1.8878 | 20.675 | 36 | 1321 | biological adhesion |
| GO:0007422 | 8e-04 | 6.0147 | 1.0956 | 6 | 70 | peripheral nervous system development |
| GO:0001667 | 9e-04 | 2.8357 | 5.2587 | 14 | 336 | ameboidal-type cell migration |
| GO:0060441 | 9e-04 | 10.634 | 0.4382 | 4 | 28 | epithelial tube branching involved in lung morphogenesis |
| GO:0060541 | 9e-04 | 3.5563 | 3.005 | 10 | 192 | respiratory system development |
| GO:0001570 | 9e-04 | 5.8317 | 1.1269 | 6 | 72 | vasculogenesis |
| GO:0014013 | 0.001 | 4.788 | 1.5808 | 7 | 101 | regulation of gliogenesis |
| GO:0055006 | 0.0011 | 5.6595 | 1.1582 | 6 | 74 | cardiac cell development |
| GO:0097659 | 0.0011 | 1.9096 | 19.7775 | 34 | 1586 | nucleic acid-templated transcription |
| GO:0009887 | 0.0012 | 2.3969 | 8.0217 | 18 | 567 | animal organ morphogenesis |
| GO:2000177 | 0.0013 | 5.4194 | 1.2051 | 6 | 77 | regulation of neural precursor cell proliferation |
| GO:0060579 | 0.0014 | 64.379 | 0.0617 | 2 | 4 | ventral spinal cord interneuron fate commitment |
| GO:0003357 | 0.0014 | 63.888 | 0.0621 | 2 | 4 | noradrenergic neuron differentiation |
| GO:0048634 | 0.0014 | 3.9947 | 2.1442 | 8 | 137 | regulation of muscle organ development |
| GO:0003219 | 0.0014 | 63.3849 | 0.0626 | 2 | 4 | cardiac right ventricle formation |
| GO:0003308 | 0.0014 | 63.3849 | 0.0626 | 2 | 4 | negative regulation of Wnt signaling pathway involved in heart development |
| GO:0007198 | 0.0014 | 63.3849 | 0.0626 | 2 | 4 | adenylate cyclase-inhibiting serotonin receptor signaling pathway |
| GO:0021797 | 0.0014 | 63.3849 | 0.0626 | 2 | 4 | forebrain anterior/posterior pattern specification |
| GO:0021913 | 0.0014 | 63.3849 | 0.0626 | 2 | 4 | regulation of transcription from RNA polymerase II promoter involved in ventral spinal cord interneuron specification |
| GO:0034287 | 0.0014 | 63.3849 | 0.0626 | 2 | 4 | detection of monosaccharide stimulus |
| GO:0042662 | 0.0014 | 63.3849 | 0.0626 | 2 | 4 | negative regulation of mesodermal cell fate specification |
| GO:0042663 | 0.0014 | 63.3849 | 0.0626 | 2 | 4 | regulation of endodermal cell fate specification |
| GO:0051594 | 0.0014 | 63.3849 | 0.0626 | 2 | 4 | detection of glucose |
| GO:0060920 | 0.0014 | 63.3849 | 0.0626 | 2 | 4 | cardiac pacemaker cell differentiation |
| GO:0061325 | 0.0014 | 63.3849 | 0.0626 | 2 | 4 | cell proliferation involved in outflow tract morphogenesis |
| GO:0070253 | 0.0014 | 63.3849 | 0.0626 | 2 | 4 | somatostatin secretion |
| GO:0072086 | 0.0014 | 63.3849 | 0.0626 | 2 | 4 | specification of loop of Henle identity |
| GO:1905903 | 0.0014 | 63.3849 | 0.0626 | 2 | 4 | negative regulation of mesoderm formation |
| GO:0060325 | 0.0015 | 9.1126 | 0.5008 | 4 | 32 | face morphogenesis |
| GO:1902742 | 0.0015 | 9.1126 | 0.5008 | 4 | 32 | apoptotic process involved in development |
| GO:0002070 | 0.0015 | 15.8994 | 0.2348 | 3 | 15 | epithelial cell maturation |
| GO:0042127 | 0.0016 | 2.2318 | 9.5864 | 20 | 668 | regulation of cell proliferation |
| GO:0051101 | 0.0016 | 4.4102 | 1.706 | 7 | 109 | regulation of DNA binding |
| GO:0001568 | 0.0016 | 2.2132 | 9.6097 | 20 | 614 | blood vessel development |
| GO:0051348 | 0.0018 | 2.6195 | 5.6657 | 14 | 362 | negative regulation of transferase activity |
| GO:0051093 | 0.0018 | 2.2501 | 8.9876 | 19 | 603 | negative regulation of developmental process |
| GO:0002065 | 0.0018 | 6.2319 | 0.8807 | 5 | 57 | columnar/cuboidal epithelial cell differentiation |
| GO:0034249 | 0.0019 | 2.5966 | 5.7126 | 14 | 365 | negative regulation of cellular amide metabolic process |
| GO:0006469 | 0.0019 | 2.9932 | 3.8971 | 11 | 249 | negative regulation of protein kinase activity |
| GO:0035239 | 0.0019 | 8.4008 | 0.5357 | 4 | 36 | tube morphogenesis |
| GO:0001947 | 0.0019 | 6.1488 | 0.8921 | 5 | 57 | heart looping |
| GO:0007368 | 0.002 | 4.2427 | 1.7686 | 7 | 113 | determination of left/right symmetry |
| GO:0045165 | 0.002 | 3.7606 | 2.2667 | 8 | 155 | cell fate commitment |
| GO:0001656 | 0.002 | 4.9308 | 1.3147 | 6 | 84 | metanephros development |
| GO:0007409 | 0.0021 | 2.4755 | 6.4169 | 15 | 410 | axonogenesis |
| GO:0045687 | 0.0021 | 8.2292 | 0.5478 | 4 | 35 | positive regulation of glial cell differentiation |
| GO:0080090 | 0.0022 | 1.8692 | 20.0285 | 33 | 1784 | regulation of primary metabolic process |
| GO:0010556 | 0.0022 | 2.8187 | 4.5876 | 12 | 406 | regulation of macromolecule biosynthetic process |
| GO:0048545 | 0.0022 | 2.6593 | 5.1752 | 13 | 335 | response to steroid hormone |
| GO:0071542 | 0.0023 | 7.9715 | 0.5634 | 4 | 36 | dopaminergic neuron differentiation |
| GO:0001714 | 0.0023 | 42.5867 | 0.0777 | 2 | 5 | endodermal cell fate specification |
| GO:0002568 | 0.0024 | 42.254 | 0.0783 | 2 | 5 | somatic diversification of T cell receptor genes |
| GO:0014060 | 0.0024 | 42.254 | 0.0783 | 2 | 5 | regulation of epinephrine secretion |
| GO:0033153 | 0.0024 | 42.254 | 0.0783 | 2 | 5 | T cell receptor V(D)J recombination |
| GO:0048625 | 0.0024 | 42.254 | 0.0783 | 2 | 5 | myoblast fate commitment |
| GO:0061009 | 0.0024 | 42.254 | 0.0783 | 2 | 5 | common bile duct development |
| GO:0014032 | 0.0024 | 5.8123 | 0.9391 | 5 | 60 | neural crest cell development |
| GO:0021522 | 0.0025 | 12.9158 | 0.2775 | 3 | 18 | spinal cord motor neuron differentiation |
| GO:0001759 | 0.0026 | 12.7171 | 0.2817 | 3 | 18 | organ induction |
| GO:0198738 | 0.0027 | 2.33 | 7.2621 | 16 | 464 | cell-cell signaling by wnt |
| GO:0097485 | 0.0028 | 3.0328 | 3.4902 | 10 | 223 | neuron projection guidance |
| GO:0031326 | 0.0028 | 2.6154 | 5.3616 | 13 | 480 | regulation of cellular biosynthetic process |
| GO:0021536 | 0.0028 | 12.3301 | 0.2878 | 3 | 19 | diencephalon development |
| GO:0045777 | 0.0028 | 7.5016 | 0.5947 | 4 | 38 | positive regulation of blood pressure |
| GO:0042733 | 0.003 | 5.5107 | 0.986 | 5 | 63 | embryonic digit morphogenesis |
| GO:0072091 | 0.003 | 5.5107 | 0.986 | 5 | 63 | regulation of stem cell proliferation |
| GO:0001710 | 0.003 | 11.9216 | 0.2974 | 3 | 19 | mesodermal cell fate commitment |
| GO:0042474 | 0.003 | 11.9216 | 0.2974 | 3 | 19 | middle ear morphogenesis |
| GO:0072358 | 0.0031 | 2.0853 | 10.1575 | 20 | 649 | cardiovascular system development |
| GO:0035136 | 0.0031 | 7.2869 | 0.6104 | 4 | 39 | forelimb morphogenesis |
| GO:0009799 | 0.0032 | 3.8745 | 1.9251 | 7 | 123 | specification of symmetry |
| GO:0007517 | 0.0033 | 2.9551 | 3.5772 | 10 | 234 | muscle organ development |
| GO:0021515 | 0.0033 | 11.5241 | 0.305 | 3 | 20 | cell differentiation in spinal cord |
| GO:0003278 | 0.0035 | 31.6885 | 0.0939 | 2 | 6 | apoptotic process involved in heart morphogenesis |
| GO:0014062 | 0.0035 | 31.6885 | 0.0939 | 2 | 6 | regulation of serotonin secretion |
| GO:0021902 | 0.0035 | 31.6885 | 0.0939 | 2 | 6 | commitment of neuronal cell to specific neuron type in forebrain |
| GO:0048241 | 0.0035 | 31.6885 | 0.0939 | 2 | 6 | epinephrine transport |
| GO:0048541 | 0.0035 | 31.6885 | 0.0939 | 2 | 6 | Peyer's patch development |
| GO:0061074 | 0.0035 | 31.6885 | 0.0939 | 2 | 6 | regulation of neural retina development |
| GO:0023019 | 0.0035 | 11.2196 | 0.313 | 3 | 20 | signal transduction involved in regulation of gene expression |
| GO:0042472 | 0.0036 | 4.3678 | 1.4712 | 6 | 94 | inner ear morphogenesis |
| GO:0010470 | 0.0038 | 6.8921 | 0.6417 | 4 | 41 | regulation of gastrulation |
| GO:0072001 | 0.0039 | 2.7148 | 4.2727 | 11 | 273 | renal system development |
| GO:0010001 | 0.004 | 3.7164 | 2.0012 | 7 | 130 | glial cell differentiation |
| GO:0065007 | 0.004 | 1.4881 | 176.6528 | 196 | 11287 | biological regulation |
| GO:0002052 | 0.0041 | 10.5956 | 0.3287 | 3 | 21 | positive regulation of neuroblast proliferation |
| GO:0031290 | 0.0041 | 10.5956 | 0.3287 | 3 | 21 | retinal ganglion cell axon guidance |
| GO:0045446 | 0.0042 | 4.223 | 1.5181 | 6 | 97 | endothelial cell differentiation |
| GO:0048699 | 0.0044 | 2.1585 | 8.3413 | 17 | 587 | generation of neurons |
| GO:0043433 | 0.0044 | 3.6524 | 2.0346 | 7 | 130 | negative regulation of DNA binding transcription factor activity |
| GO:0051602 | 0.0045 | 6.5378 | 0.673 | 4 | 43 | response to electrical stimulus |
| GO:2000679 | 0.0047 | 10.0373 | 0.3443 | 3 | 22 | positive regulation of transcription regulatory region DNA binding |
| GO:0021521 | 0.0048 | 25.5488 | 0.1087 | 2 | 7 | ventral spinal cord interneuron specification |
| GO:0048863 | 0.0048 | 2.7898 | 3.7763 | 10 | 244 | stem cell differentiation |
| GO:0003253 | 0.0049 | 25.3492 | 0.1096 | 2 | 7 | cardiac neural crest cell migration involved in outflow tract morphogenesis |
| GO:0021798 | 0.0049 | 25.3492 | 0.1096 | 2 | 7 | forebrain dorsal/ventral pattern formation |
| GO:0051971 | 0.0049 | 25.3492 | 0.1096 | 2 | 7 | positive regulation of transmission of nerve impulse |
| GO:0060430 | 0.0049 | 25.3492 | 0.1096 | 2 | 7 | lung saccule development |
| GO:0070091 | 0.0049 | 25.3492 | 0.1096 | 2 | 7 | glucagon secretion |
| GO:0071864 | 0.0049 | 25.3492 | 0.1096 | 2 | 7 | positive regulation of cell proliferation in bone marrow |
| GO:2000049 | 0.0049 | 25.3492 | 0.1096 | 2 | 7 | positive regulation of cell-cell adhesion mediated by cadherin |
| GO:1904837 | 0.0049 | 6.374 | 0.6886 | 4 | 44 | beta-catenin-TCF complex assembly |
| GO:0032269 | 0.005 | 1.7319 | 19.0629 | 31 | 1218 | negative regulation of cellular protein metabolic process |
| GO:1901861 | 0.0052 | 3.5365 | 2.0972 | 7 | 134 | regulation of muscle tissue development |
| GO:0010656 | 0.0053 | 6.2181 | 0.7043 | 4 | 45 | negative regulation of muscle cell apoptotic process |
| GO:0045686 | 0.0053 | 9.5349 | 0.36 | 3 | 23 | negative regulation of glial cell differentiation |
| GO:0015844 | 0.0054 | 4.7677 | 1.1269 | 5 | 72 | monoamine transport |
| GO:0043500 | 0.0056 | 3.9603 | 1.6121 | 6 | 103 | muscle adaptation |
| GO:0021766 | 0.0057 | 4.6973 | 1.1425 | 5 | 73 | hippocampus development |
| GO:0032570 | 0.0057 | 6.0697 | 0.7199 | 4 | 46 | response to progesterone |
| GO:0060070 | 0.0058 | 2.5654 | 4.5075 | 11 | 288 | canonical Wnt signaling pathway |
| GO:0046879 | 0.006 | 2.556 | 4.5231 | 11 | 289 | hormone secretion |
| GO:0030878 | 0.006 | 9.0803 | 0.3756 | 3 | 24 | thyroid gland development |
| GO:0060487 | 0.006 | 9.0803 | 0.3756 | 3 | 24 | lung epithelial cell differentiation |
| GO:0060914 | 0.006 | 9.0803 | 0.3756 | 3 | 24 | heart formation |
| GO:0045844 | 0.006 | 4.629 | 1.1582 | 5 | 74 | positive regulation of striated muscle tissue development |
| GO:0035137 | 0.0063 | 21.344 | 0.1239 | 2 | 8 | hindlimb morphogenesis |
| GO:0048332 | 0.0064 | 4.5625 | 1.1738 | 5 | 75 | mesoderm morphogenesis |
| GO:0035881 | 0.0064 | 21.123 | 0.1252 | 2 | 8 | amacrine cell differentiation |
| GO:0042756 | 0.0064 | 21.123 | 0.1252 | 2 | 8 | drinking behavior |
| GO:0048743 | 0.0064 | 21.123 | 0.1252 | 2 | 8 | positive regulation of skeletal muscle fiber development |
| GO:0061525 | 0.0064 | 21.123 | 0.1252 | 2 | 8 | hindgut development |
| GO:0060563 | 0.0066 | 5.7931 | 0.7512 | 4 | 48 | neuroepithelial cell differentiation |
| GO:0048519 | 0.0067 | 1.4593 | 55.3903 | 72 | 3934 | negative regulation of biological process |
| GO:0045736 | 0.0068 | 8.667 | 0.3913 | 3 | 25 | negative regulation of cyclin-dependent protein serine/threonine kinase activity |
| GO:0060740 | 0.0068 | 8.667 | 0.3913 | 3 | 25 | prostate gland epithelium morphogenesis |
| GO:0002520 | 0.0068 | 1.8183 | 13.945 | 24 | 891 | immune system development |
| GO:0060485 | 0.0069 | 5.7326 | 0.7572 | 4 | 50 | mesenchyme development |
| GO:0010817 | 0.0069 | 2.1554 | 7.309 | 15 | 467 | regulation of hormone levels |
| GO:0043279 | 0.007 | 3.7649 | 1.6903 | 6 | 108 | response to alkaloid |
| GO:0010171 | 0.0072 | 5.664 | 0.7669 | 4 | 49 | body morphogenesis |
| GO:0050432 | 0.0072 | 5.664 | 0.7669 | 4 | 49 | catecholamine secretion |
| GO:0051216 | 0.0073 | 3.0056 | 2.8015 | 8 | 179 | cartilage development |
| GO:0048663 | 0.0075 | 8.2922 | 0.4053 | 3 | 27 | neuron fate commitment |
| GO:0021884 | 0.0075 | 8.2896 | 0.4069 | 3 | 26 | forebrain neuron development |
| GO:0048522 | 0.0076 | 1.4433 | 56.5038 | 73 | 3912 | positive regulation of cellular process |
| GO:0048747 | 0.0077 | 5.5405 | 0.7825 | 4 | 50 | muscle fiber development |
| GO:0048589 | 0.008 | 2.0155 | 8.8585 | 17 | 566 | developmental growth |
| GO:0048704 | 0.008 | 4.3065 | 1.2382 | 5 | 80 | embryonic skeletal system morphogenesis |
| GO:0048870 | 0.0081 | 1.6306 | 22.1775 | 34 | 1417 | cell motility |
| GO:0021892 | 0.0082 | 18.1043 | 0.1409 | 2 | 9 | cerebral cortex GABAergic interneuron differentiation |
| GO:0048664 | 0.0082 | 18.1043 | 0.1409 | 2 | 9 | neuron fate determination |
| GO:0048865 | 0.0082 | 18.1043 | 0.1409 | 2 | 9 | stem cell fate commitment |
| GO:0061004 | 0.0082 | 18.1043 | 0.1409 | 2 | 9 | pattern specification involved in kidney development |
| GO:0061549 | 0.0082 | 18.1043 | 0.1409 | 2 | 9 | sympathetic ganglion development |
| GO:0070472 | 0.0082 | 18.1043 | 0.1409 | 2 | 9 | regulation of uterine smooth muscle contraction |
| GO:1905770 | 0.0082 | 18.1043 | 0.1409 | 2 | 9 | regulation of mesodermal cell differentiation |
| GO:2000288 | 0.0082 | 18.1043 | 0.1409 | 2 | 9 | positive regulation of myoblast proliferation |
| GO:2000818 | 0.0082 | 18.1043 | 0.1409 | 2 | 9 | negative regulation of myoblast proliferation |
| GO:0051146 | 0.0082 | 2.5674 | 4.0849 | 10 | 261 | striated muscle cell differentiation |
| GO:0035883 | 0.0084 | 7.9437 | 0.4226 | 3 | 27 | enteroendocrine cell differentiation |
| GO:0035886 | 0.0084 | 7.9437 | 0.4226 | 3 | 27 | vascular smooth muscle cell differentiation |
| GO:0061311 | 0.0084 | 7.9437 | 0.4226 | 3 | 27 | cell surface receptor signaling pathway involved in heart development |
| GO:0009987 | 0.0086 | 2.3144 | 100.1195 | 109 | 8345 | cellular process |
| GO:0015850 | 0.0089 | 2.6927 | 3.5058 | 9 | 224 | organic hydroxy compound transport |
| GO:0006417 | 0.009 | 2.0344 | 8.2481 | 16 | 527 | regulation of translation |
| GO:0042475 | 0.0093 | 4.1459 | 1.2834 | 5 | 82 | odontogenesis of dentin-containing tooth |
| GO:0045778 | 0.0093 | 4.1459 | 1.2834 | 5 | 82 | positive regulation of ossification |
| GO:0010719 | 0.0093 | 7.6255 | 0.4382 | 3 | 28 | negative regulation of epithelial to mesenchymal transition |
| GO:0035116 | 0.0093 | 7.6255 | 0.4382 | 3 | 28 | embryonic hindlimb morphogenesis |
| GO:0071363 | 0.0094 | 1.9377 | 9.7506 | 18 | 623 | cellular response to growth factor stimulus |
| GO:0009798 | 0.0097 | 4.0925 | 1.299 | 5 | 83 | axis specification |
| GO:0015837 | 0.0097 | 4.0925 | 1.299 | 5 | 83 | amine transport |
| GO:0009991 | 0.0098 | 2.124 | 6.9021 | 14 | 441 | response to extracellular stimulus |
| GO:0007623 | 0.0099 | 2.8377 | 2.958 | 8 | 189 | circadian rhythm |
| GO:0021520 | 0.01 | 15.966 | 0.1553 | 2 | 10 | spinal cord motor neuron cell fate specification |
| GOMFID | Pvalue | OddsRatio | ExpCount | Count | Size | Term |
| GO:0045944 | 0 | 5.2431 | 18.5753 | 73 | 1069 | positive regulation of transcription from RNA polymerase II promoter |
| GO:0007275 | 0 | 4.2401 | 40.5445 | 102 | 2902 | multicellular organism development |
| GO:0051254 | 0 | 4.3223 | 25.0393 | 81 | 1441 | positive regulation of RNA metabolic process |
| GO:1903508 | 0 | 4.337 | 23.8055 | 78 | 1370 | positive regulation of nucleic acid-templated transcription |
| GO:0034654 | 0 | 3.1373 | 70.9127 | 143 | 4081 | nucleobase-containing compound biosynthetic process |
| GO:0010557 | 0 | 3.6857 | 27.8368 | 79 | 1602 | positive regulation of macromolecule biosynthetic process |
| GO:0031328 | 0 | 3.5406 | 30.1826 | 82 | 1737 | positive regulation of cellular biosynthetic process |
| GO:0010628 | 0 | 3.4888 | 30.5649 | 82 | 1759 | positive regulation of gene expression |
| GO:0034645 | 0 | 2.7766 | 85.5957 | 153 | 4926 | cellular macromolecule biosynthetic process |
| GO:0032502 | 0 | 4.7254 | 18.8751 | 59 | 1557 | developmental process |
| GO:0007156 | 0 | 11.4964 | 2.6412 | 24 | 152 | homophilic cell adhesion via plasma membrane adhesion molecules |
| GO:0009952 | 0 | 13.0507 | 2.1621 | 22 | 128 | anterior/posterior pattern specification |
| GO:2001141 | 0 | 3.2311 | 34.6762 | 82 | 2336 | regulation of RNA biosynthetic process |
| GO:0006355 | 0 | 3.2266 | 34.7144 | 82 | 2344 | regulation of transcription, DNA-templated |
| GO:1902679 | 0 | 3.5608 | 19.7916 | 58 | 1139 | negative regulation of RNA biosynthetic process |
| GO:0009890 | 0 | 3.0989 | 28.3755 | 71 | 1633 | negative regulation of biosynthetic process |
| GO:0009889 | 0 | 2.9784 | 39.0023 | 84 | 2698 | regulation of biosynthetic process |
| GO:0000122 | 0 | 4.0568 | 13.1712 | 45 | 758 | negative regulation of transcription from RNA polymerase II promoter |
| GO:0019219 | 0 | 2.905 | 39.7554 | 85 | 2662 | regulation of nucleobase-containing compound metabolic process |
| GO:0016339 | 0 | 38.0356 | 0.4865 | 11 | 28 | calcium-dependent cell-cell adhesion via plasma membrane cell adhesion molecules |
| GO:0051173 | 0 | 2.5351 | 49.1749 | 97 | 2830 | positive regulation of nitrogen compound metabolic process |
| GO:0007416 | 0 | 9.5283 | 2.4153 | 19 | 139 | synapse assembly |
| GO:0006725 | 0 | 2.2669 | 99.6705 | 155 | 5736 | cellular aromatic compound metabolic process |
| GO:0045934 | 0 | 3.0349 | 23.7013 | 60 | 1364 | negative regulation of nucleobase-containing compound metabolic process |
| GO:1901360 | 0 | 2.2364 | 103.3195 | 158 | 5946 | organic cyclic compound metabolic process |
| GO:0034641 | 0 | 2.2275 | 109.3143 | 164 | 6291 | cellular nitrogen compound metabolic process |
| GO:0046483 | 0 | 2.2237 | 99.0449 | 153 | 5700 | heterocycle metabolic process |
| GO:1901576 | 0 | 2.2088 | 106.0128 | 160 | 6101 | organic substance biosynthetic process |
| GO:0007267 | 0 | 3.3759 | 16.0503 | 46 | 956 | cell-cell signaling |
| GO:0060255 | 0 | 2.5932 | 47.1988 | 88 | 3233 | regulation of macromolecule metabolic process |
| GO:0022008 | 0 | 3.5345 | 12.1175 | 37 | 754 | neurogenesis |
| GO:0007517 | 0 | 4.593 | 6.4466 | 26 | 371 | muscle organ development |
| GO:0048869 | 0 | 2.184 | 60.3733 | 102 | 3799 | cellular developmental process |
| GO:0048562 | 0 | 6.757 | 2.8977 | 17 | 175 | embryonic organ morphogenesis |
| GO:0007399 | 0 | 3.9355 | 8.5588 | 29 | 643 | nervous system development |
| GO:0060537 | 0 | 4.3732 | 6.464 | 25 | 372 | muscle tissue development |
| GO:0010605 | 0 | 2.2276 | 45.1436 | 83 | 2598 | negative regulation of macromolecule metabolic process |
| GO:0098609 | 0 | 3.1914 | 13.5535 | 38 | 780 | cell-cell adhesion |
| GO:0097659 | 0 | 2.4853 | 30.9157 | 62 | 2252 | nucleic acid-templated transcription |
| GO:0003357 | 0 | 143.9079 | 0.1216 | 5 | 7 | noradrenergic neuron differentiation |
| GO:0007420 | 0 | 3.6822 | 8.5561 | 28 | 508 | brain development |
| GO:0009954 | 0 | 20.2145 | 0.5387 | 8 | 31 | proximal/distal pattern formation |
| GO:0021522 | 0 | 20.2145 | 0.5387 | 8 | 31 | spinal cord motor neuron differentiation |
| GO:0048665 | 0 | 27.4231 | 0.3771 | 7 | 22 | neuron fate specification |
| GO:0021510 | 0 | 10.1746 | 1.291 | 11 | 75 | spinal cord development |
| GO:0043009 | 0 | 3.7419 | 7.7839 | 26 | 462 | chordate embryonic development |
| GO:0021879 | 0 | 13.1102 | 0.8514 | 9 | 49 | forebrain neuron differentiation |
| GO:0001656 | 0 | 8.8265 | 1.4596 | 11 | 84 | metanephros development |
| GO:0072001 | 0 | 4.4634 | 4.7437 | 19 | 273 | renal system development |
| GO:2000026 | 0 | 2.308 | 27.4123 | 55 | 1629 | regulation of multicellular organismal development |
| GO:0048522 | 0 | 1.9502 | 62.8669 | 98 | 3912 | positive regulation of cellular process |
| GO:0048762 | 0 | 5.245 | 3.1972 | 15 | 184 | mesenchymal cell differentiation |
| GO:0090596 | 0 | 4.5975 | 4.1085 | 17 | 238 | sensory organ morphogenesis |
| GO:0030855 | 0 | 2.9136 | 11.8159 | 31 | 688 | epithelial cell differentiation |
| GO:0003211 | 0 | 115.529 | 0.1035 | 4 | 6 | cardiac ventricle formation |
| GO:0051962 | 0 | 3.3568 | 7.8888 | 24 | 454 | positive regulation of nervous system development |
| GO:0001764 | 0 | 5.765 | 2.3284 | 12 | 134 | neuron migration |
| GO:0010467 | 0 | 1.9926 | 47.4466 | 76 | 3433 | gene expression |
| GO:0060581 | 0 | 28.7671 | 0.2606 | 5 | 15 | cell fate commitment involved in pattern specification |
| GO:0035050 | 0 | 8.3119 | 1.2511 | 9 | 72 | embryonic heart tube development |
| GO:0050789 | 0 | 1.8511 | 185.9264 | 220 | 10700 | regulation of biological process |
| GO:0048729 | 0 | 3.2427 | 7.4398 | 22 | 446 | tissue morphogenesis |
| GO:0010721 | 0 | 3.8705 | 4.8132 | 17 | 277 | negative regulation of cell development |
| GO:0021514 | 0 | 23.9696 | 0.2954 | 5 | 17 | ventral spinal cord interneuron differentiation |
| GO:0007492 | 0 | 7.5862 | 1.3554 | 9 | 78 | endoderm development |
| GO:0001704 | 0 | 5.6877 | 2.1547 | 11 | 124 | formation of primary germ layer |
| GO:0051961 | 0 | 3.92 | 4.4657 | 16 | 257 | negative regulation of nervous system development |
| GO:0031018 | 0 | 10.6567 | 0.7819 | 7 | 45 | endocrine pancreas development |
| GO:0007268 | 0 | 2.7958 | 10.1651 | 26 | 585 | chemical synaptic transmission |
| GO:0008284 | 0 | 2.467 | 14.706 | 33 | 852 | positive regulation of cell proliferation |
| GO:0099537 | 0 | 2.7855 | 10.1999 | 26 | 587 | trans-synaptic signaling |
| GO:0007519 | 0 | 7.1332 | 1.4293 | 9 | 84 | skeletal muscle tissue development |
| GO:0043583 | 0 | 4.3322 | 3.5448 | 14 | 204 | ear development |
| GO:0048557 | 0 | 20.5428 | 0.3301 | 5 | 19 | embryonic digestive tract morphogenesis |
| GO:0021854 | 0 | 19.1721 | 0.3475 | 5 | 20 | hypothalamus development |
| GO:0072080 | 0 | 6.6218 | 1.5291 | 9 | 88 | nephron tubule development |
| GO:0072073 | 0 | 5.1795 | 2.3458 | 11 | 135 | kidney epithelium development |
| GO:0001763 | 0 | 5.1563 | 2.3542 | 11 | 138 | morphogenesis of a branching structure |
| GO:0048485 | 0 | 17.9727 | 0.3649 | 5 | 21 | sympathetic nervous system development |
| GO:0021513 | 0 | 16.9144 | 0.3823 | 5 | 22 | spinal cord dorsal/ventral patterning |
| GO:0048536 | 0 | 11.5341 | 0.6255 | 6 | 36 | spleen development |
| GO:0071392 | 0 | 11.5341 | 0.6255 | 6 | 36 | cellular response to estradiol stimulus |
| GO:0071542 | 0 | 11.5341 | 0.6255 | 6 | 36 | dopaminergic neuron differentiation |
| GO:0048565 | 0 | 5.3795 | 2.0541 | 10 | 119 | digestive tract development |
| GO:0050767 | 0 | 2.6813 | 9.7178 | 24 | 572 | regulation of neurogenesis |
| GO:0048332 | 0 | 6.9201 | 1.3032 | 8 | 75 | mesoderm morphogenesis |
| GO:0030878 | 0 | 15.1321 | 0.417 | 5 | 24 | thyroid gland development |
| GO:0060914 | 0 | 15.1321 | 0.417 | 5 | 24 | heart formation |
| GO:0048935 | 1e-04 | 25.4804 | 0.2259 | 4 | 13 | peripheral nervous system neuron development |
| GO:0014032 | 1e-04 | 7.6335 | 1.0426 | 7 | 60 | neural crest cell development |
| GO:0021983 | 1e-04 | 13.2001 | 0.4646 | 5 | 27 | pituitary gland development |
| GO:0045665 | 1e-04 | 4.0762 | 3.1972 | 12 | 184 | negative regulation of neuron differentiation |
| GO:0009798 | 1e-04 | 6.1789 | 1.4422 | 8 | 83 | axis specification |
| GO:0003278 | 1e-04 | 57.147 | 0.1043 | 3 | 6 | apoptotic process involved in heart morphogenesis |
| GO:0021542 | 1e-04 | 20.845 | 0.2606 | 4 | 15 | dentate gyrus development |
| GO:0001756 | 1e-04 | 7.2232 | 1.0947 | 7 | 63 | somitogenesis |
| GO:0016070 | 1e-04 | 1.8226 | 40.5697 | 63 | 2985 | RNA metabolic process |
| GO:0021543 | 1e-04 | 4.3037 | 2.7802 | 11 | 160 | pallium development |
| GO:0072006 | 1e-04 | 4.6914 | 2.3284 | 10 | 134 | nephron development |
| GO:0051101 | 1e-04 | 5.2243 | 1.894 | 9 | 109 | regulation of DNA binding |
| GO:0045666 | 1e-04 | 3.1479 | 5.4735 | 16 | 315 | positive regulation of neuron differentiation |
| GO:0060993 | 1e-04 | 5.8645 | 1.5117 | 8 | 87 | kidney morphogenesis |
| GO:0010720 | 2e-04 | 2.71 | 7.9403 | 20 | 460 | positive regulation of cell development |
| GO:0048863 | 2e-04 | 3.4044 | 4.431 | 14 | 255 | stem cell differentiation |
| GO:0035914 | 2e-04 | 6.7399 | 1.1642 | 7 | 67 | skeletal muscle cell differentiation |
| GO:0003209 | 2e-04 | 11.0532 | 0.5387 | 5 | 31 | cardiac atrium morphogenesis |
| GO:0022610 | 2e-04 | 1.9494 | 22.9541 | 41 | 1321 | biological adhesion |
| GO:0003151 | 2e-04 | 6.464 | 1.208 | 7 | 70 | outflow tract morphogenesis |
| GO:0001649 | 2e-04 | 3.7255 | 3.4753 | 12 | 200 | osteoblast differentiation |
| GO:0035115 | 2e-04 | 10.6431 | 0.556 | 5 | 32 | embryonic forelimb morphogenesis |
| GO:0060325 | 2e-04 | 10.6431 | 0.556 | 5 | 32 | face morphogenesis |
| GO:1902742 | 2e-04 | 10.6431 | 0.556 | 5 | 32 | apoptotic process involved in development |
| GO:0003231 | 2e-04 | 4.7902 | 2.0504 | 9 | 118 | cardiac ventricle development |
| GO:0060688 | 2e-04 | 7.8572 | 0.8688 | 6 | 50 | regulation of morphogenesis of a branching structure |
| GO:0060485 | 2e-04 | 10.4753 | 0.56 | 5 | 34 | mesenchyme development |
| GO:0048870 | 2e-04 | 1.9082 | 24.6222 | 43 | 1417 | cell motility |
| GO:0001759 | 2e-04 | 16.3751 | 0.3128 | 4 | 18 | organ induction |
| GO:0072088 | 2e-04 | 6.3171 | 1.2337 | 7 | 71 | nephron epithelium morphogenesis |
| GO:0042472 | 2e-04 | 5.3848 | 1.6334 | 8 | 94 | inner ear morphogenesis |
| GO:0030326 | 2e-04 | 10.2651 | 0.571 | 5 | 34 | embryonic limb morphogenesis |
| GO:0007218 | 2e-04 | 5.3226 | 1.6507 | 8 | 95 | neuropeptide signaling pathway |
| GO:0060322 | 3e-04 | 10.0492 | 0.577 | 5 | 37 | head development |
| GO:0030182 | 3e-04 | 5.2524 | 1.6648 | 8 | 110 | neuron differentiation |
| GO:0061333 | 3e-04 | 6.1249 | 1.2685 | 7 | 73 | renal tubule morphogenesis |
| GO:0042756 | 3e-04 | 34.2839 | 0.139 | 3 | 8 | drinking behavior |
| GO:0001667 | 3e-04 | 2.9374 | 5.8384 | 16 | 336 | ameboidal-type cell migration |
| GO:0001710 | 3e-04 | 15.2825 | 0.3301 | 4 | 19 | mesodermal cell fate commitment |
| GO:0042474 | 3e-04 | 15.2825 | 0.3301 | 4 | 19 | middle ear morphogenesis |
| GO:0048645 | 3e-04 | 9.7414 | 0.5983 | 5 | 35 | animal organ formation |
| GO:0003326 | 3e-04 | Inf | 0.0348 | 2 | 2 | pancreatic A cell fate commitment |
| GO:0003329 | 3e-04 | Inf | 0.0348 | 2 | 2 | pancreatic PP cell fate commitment |
| GO:0043503 | 3e-04 | Inf | 0.0348 | 2 | 2 | skeletal muscle fiber adaptation |
| GO:0072272 | 3e-04 | Inf | 0.0348 | 2 | 2 | proximal/distal pattern formation involved in metanephric nephron development |
| GO:0003002 | 3e-04 | 9.6088 | 0.5971 | 5 | 40 | regionalization |
| GO:0051241 | 3e-04 | 2.2186 | 13.1273 | 27 | 794 | negative regulation of multicellular organismal process |
| GO:0021761 | 3e-04 | 5.8748 | 1.3159 | 7 | 77 | limbic system development |
| GO:0023019 | 3e-04 | 14.3264 | 0.3475 | 4 | 20 | signal transduction involved in regulation of gene expression |
| GO:0014003 | 4e-04 | 9.2675 | 0.6255 | 5 | 36 | oligodendrocyte development |
| GO:0048704 | 4e-04 | 9.217 | 0.6268 | 5 | 37 | embryonic skeletal system morphogenesis |
| GO:0014013 | 4e-04 | 4.9773 | 1.755 | 8 | 101 | regulation of gliogenesis |
| GO:2000177 | 4e-04 | 5.7735 | 1.338 | 7 | 77 | regulation of neural precursor cell proliferation |
| GO:0048545 | 4e-04 | 2.7463 | 6.6204 | 17 | 381 | response to steroid hormone |
| GO:0001714 | 4e-04 | 28.5681 | 0.1564 | 3 | 9 | endodermal cell fate specification |
| GO:0043433 | 4e-04 | 4.3119 | 2.2589 | 9 | 130 | negative regulation of DNA binding transcription factor activity |
| GO:0001947 | 5e-04 | 6.7758 | 0.9904 | 6 | 57 | heart looping |
| GO:0045777 | 5e-04 | 8.7047 | 0.6603 | 5 | 38 | positive regulation of blood pressure |
| GO:0198738 | 5e-04 | 2.5167 | 8.0626 | 19 | 464 | cell-cell signaling by wnt |
| GO:0060541 | 5e-04 | 3.5356 | 3.3362 | 11 | 192 | respiratory system development |
| GO:0045778 | 6e-04 | 5.3869 | 1.4249 | 7 | 82 | positive regulation of ossification |
| GO:0050678 | 7e-04 | 2.9229 | 5.1086 | 14 | 294 | regulation of epithelial cell proliferation |
| GO:0061217 | 7e-04 | 11.4583 | 0.417 | 4 | 24 | regulation of mesonephros development |
| GO:0090009 | 8e-04 | 21.4234 | 0.1911 | 3 | 11 | primitive streak formation |
| GO:2000543 | 8e-04 | 21.4234 | 0.1911 | 3 | 11 | positive regulation of gastrulation |
| GO:0042733 | 8e-04 | 6.0603 | 1.0947 | 6 | 63 | embryonic digit morphogenesis |
| GO:0072091 | 8e-04 | 6.0603 | 1.0947 | 6 | 63 | regulation of stem cell proliferation |
| GO:0007368 | 8e-04 | 4.4051 | 1.9635 | 8 | 113 | determination of left/right symmetry |
| GO:0048513 | 8e-04 | 1.7727 | 28.9563 | 46 | 2101 | animal organ development |
| GO:0051602 | 9e-04 | 7.557 | 0.7472 | 5 | 43 | response to electrical stimulus |
| GO:0051094 | 9e-04 | 2.1591 | 11.908 | 24 | 739 | positive regulation of developmental process |
| GO:0002125 | 9e-04 | 113.9 | 0.0521 | 2 | 3 | maternal aggressive behavior |
| GO:0003350 | 9e-04 | 113.9 | 0.0521 | 2 | 3 | pulmonary myocardium development |
| GO:0021530 | 9e-04 | 113.9 | 0.0521 | 2 | 3 | spinal cord oligodendrocyte cell fate specification |
| GO:0021912 | 9e-04 | 113.9 | 0.0521 | 2 | 3 | regulation of transcription from RNA polymerase II promoter involved in spinal cord motor neuron fate specification |
| GO:0035993 | 9e-04 | 113.9 | 0.0521 | 2 | 3 | deltoid tuberosity development |
| GO:0048619 | 9e-04 | 113.9 | 0.0521 | 2 | 3 | embryonic hindgut morphogenesis |
| GO:0055014 | 9e-04 | 113.9 | 0.0521 | 2 | 3 | atrial cardiac muscle cell development |
| GO:0060741 | 9e-04 | 113.9 | 0.0521 | 2 | 3 | prostate gland stromal morphogenesis |
| GO:0060913 | 9e-04 | 113.9 | 0.0521 | 2 | 3 | cardiac cell fate determination |
| GO:0061010 | 9e-04 | 113.9 | 0.0521 | 2 | 3 | gall bladder development |
| GO:0061031 | 9e-04 | 113.9 | 0.0521 | 2 | 3 | endodermal digestive tract morphogenesis |
| GO:0097021 | 9e-04 | 113.9 | 0.0521 | 2 | 3 | lymphocyte migration into lymphoid organs |
| GO:2000768 | 9e-04 | 113.9 | 0.0521 | 2 | 3 | positive regulation of nephron tubule epithelial cell differentiation |
| GO:0048589 | 9e-04 | 2.2738 | 9.835 | 21 | 566 | developmental growth |
| GO:0048701 | 0.001 | 7.3628 | 0.7646 | 5 | 44 | embryonic cranial skeleton morphogenesis |
| GO:0021846 | 0.001 | 10.4153 | 0.4518 | 4 | 26 | cell proliferation in forebrain |
| GO:0043586 | 0.001 | 19.1709 | 0.2072 | 3 | 12 | tongue development |
| GO:0010454 | 0.001 | 19.0418 | 0.2085 | 3 | 12 | negative regulation of cell fate commitment |
| GO:0035815 | 0.001 | 19.0418 | 0.2085 | 3 | 12 | positive regulation of renal sodium excretion |
| GO:0055015 | 0.001 | 19.0418 | 0.2085 | 3 | 12 | ventricular cardiac muscle cell development |
| GO:0060272 | 0.001 | 19.0418 | 0.2085 | 3 | 12 | embryonic skeletal joint morphogenesis |
| GO:0009953 | 0.001 | 5.7075 | 1.1542 | 6 | 68 | dorsal/ventral pattern formation |
| GO:0061311 | 0.0011 | 9.9618 | 0.4692 | 4 | 27 | cell surface receptor signaling pathway involved in heart development |
| GO:0009719 | 0.0012 | 1.765 | 25.074 | 41 | 1443 | response to endogenous stimulus |
| GO:0021537 | 0.0012 | 5.4803 | 1.1974 | 6 | 71 | telencephalon development |
| GO:0072164 | 0.0013 | 4.6403 | 1.6334 | 7 | 94 | mesonephric tubule development |
| GO:0048663 | 0.0013 | 9.5609 | 0.4836 | 4 | 29 | neuron fate commitment |
| GO:0061548 | 0.0013 | 17.1366 | 0.2259 | 3 | 13 | ganglion development |
| GO:0035116 | 0.0013 | 9.5462 | 0.4865 | 4 | 28 | embryonic hindlimb morphogenesis |
| GO:0060441 | 0.0013 | 9.5462 | 0.4865 | 4 | 28 | epithelial tube branching involved in lung morphogenesis |
| GO:0009799 | 0.0014 | 4.0195 | 2.1373 | 8 | 123 | specification of symmetry |
| GO:0022037 | 0.0014 | 4.5355 | 1.6681 | 7 | 96 | metencephalon development |
| GO:0021545 | 0.0014 | 6.6762 | 0.8341 | 5 | 48 | cranial nerve development |
| GO:0001501 | 0.0015 | 2.9301 | 4.35 | 12 | 267 | skeletal system development |
| GO:0010171 | 0.0016 | 6.524 | 0.8514 | 5 | 49 | body morphogenesis |
| GO:0021871 | 0.0016 | 15.7401 | 0.2408 | 3 | 14 | forebrain regionalization |
| GO:0021984 | 0.0016 | 15.5777 | 0.2433 | 3 | 14 | adenohypophysis development |
| GO:0060429 | 0.0018 | 2.6208 | 5.6749 | 14 | 370 | epithelium development |
| GO:0003219 | 0.0018 | 56.9464 | 0.0695 | 2 | 4 | cardiac right ventricle formation |
| GO:0003308 | 0.0018 | 56.9464 | 0.0695 | 2 | 4 | negative regulation of Wnt signaling pathway involved in heart development |
| GO:0007198 | 0.0018 | 56.9464 | 0.0695 | 2 | 4 | adenylate cyclase-inhibiting serotonin receptor signaling pathway |
| GO:0021797 | 0.0018 | 56.9464 | 0.0695 | 2 | 4 | forebrain anterior/posterior pattern specification |
| GO:0021913 | 0.0018 | 56.9464 | 0.0695 | 2 | 4 | regulation of transcription from RNA polymerase II promoter involved in ventral spinal cord interneuron specification |
| GO:0034287 | 0.0018 | 56.9464 | 0.0695 | 2 | 4 | detection of monosaccharide stimulus |
| GO:0042662 | 0.0018 | 56.9464 | 0.0695 | 2 | 4 | negative regulation of mesodermal cell fate specification |
| GO:0051594 | 0.0018 | 56.9464 | 0.0695 | 2 | 4 | detection of glucose |
| GO:0060920 | 0.0018 | 56.9464 | 0.0695 | 2 | 4 | cardiac pacemaker cell differentiation |
| GO:0061055 | 0.0018 | 56.9464 | 0.0695 | 2 | 4 | myotome development |
| GO:0061325 | 0.0018 | 56.9464 | 0.0695 | 2 | 4 | cell proliferation involved in outflow tract morphogenesis |
| GO:0070253 | 0.0018 | 56.9464 | 0.0695 | 2 | 4 | somatostatin secretion |
| GO:0072086 | 0.0018 | 56.9464 | 0.0695 | 2 | 4 | specification of loop of Henle identity |
| GO:0090191 | 0.0018 | 56.9464 | 0.0695 | 2 | 4 | negative regulation of branching involved in ureteric bud morphogenesis |
| GO:1905903 | 0.0018 | 56.9464 | 0.0695 | 2 | 4 | negative regulation of mesoderm formation |
| GO:0097485 | 0.0018 | 3.0127 | 3.8749 | 11 | 223 | neuron projection guidance |
| GO:0048598 | 0.0019 | 3.464 | 2.7655 | 9 | 181 | embryonic morphogenesis |
| GO:0001569 | 0.0019 | 8.4839 | 0.5387 | 4 | 31 | branching involved in blood vessel morphogenesis |
| GO:0048608 | 0.0019 | 2.4121 | 7.02 | 16 | 404 | reproductive structure development |
| GO:0003215 | 0.002 | 14.38 | 0.2589 | 3 | 15 | cardiac right ventricle morphogenesis |
| GO:0017015 | 0.002 | 4.2474 | 1.7724 | 7 | 102 | regulation of transforming growth factor beta receptor signaling pathway |
| GO:0002070 | 0.002 | 14.2787 | 0.2606 | 3 | 15 | epithelial cell maturation |
| GO:0070848 | 0.0021 | 2.0778 | 11.2251 | 22 | 646 | response to growth factor |
| GO:0035108 | 0.0021 | 13.8821 | 0.2643 | 3 | 16 | limb morphogenesis |
| GO:0061448 | 0.0022 | 2.9502 | 3.9517 | 11 | 229 | connective tissue development |
| GO:0080090 | 0.0022 | 1.8692 | 20.0285 | 33 | 1784 | regulation of primary metabolic process |
| GO:0060415 | 0.0022 | 4.861 | 1.338 | 6 | 77 | muscle tissue morphogenesis |
| GO:0007409 | 0.0023 | 2.3744 | 7.1243 | 16 | 410 | axonogenesis |
| GO:0045596 | 0.0023 | 2.5366 | 5.84 | 14 | 354 | negative regulation of cell differentiation |
| GO:0007405 | 0.0024 | 7.9749 | 0.5681 | 4 | 33 | neuroblast proliferation |
| GO:0043066 | 0.0024 | 1.9306 | 14.3007 | 26 | 823 | negative regulation of apoptotic process |
| GO:0006590 | 0.0025 | 13.1795 | 0.278 | 3 | 16 | thyroid hormone generation |
| GO:0001568 | 0.0025 | 2.0833 | 10.669 | 21 | 614 | blood vessel development |
| GO:0060562 | 0.0025 | 3.6261 | 2.3505 | 8 | 142 | epithelial tube morphogenesis |
| GO:0042476 | 0.0026 | 7.7652 | 0.5812 | 4 | 34 | odontogenesis |
| GO:0035239 | 0.0026 | 7.6959 | 0.5831 | 4 | 36 | tube morphogenesis |
| GO:0045892 | 0.0027 | 2.597 | 5.3004 | 13 | 346 | negative regulation of transcription, DNA-templated |
| GO:0060548 | 0.0027 | 1.8672 | 15.9341 | 28 | 917 | negative regulation of cell death |
| GO:0002568 | 0.0029 | 37.9619 | 0.0869 | 2 | 5 | somatic diversification of T cell receptor genes |
| GO:0014060 | 0.0029 | 37.9619 | 0.0869 | 2 | 5 | regulation of epinephrine secretion |
| GO:0021779 | 0.0029 | 37.9619 | 0.0869 | 2 | 5 | oligodendrocyte cell fate commitment |
| GO:0021780 | 0.0029 | 37.9619 | 0.0869 | 2 | 5 | glial cell fate specification |
| GO:0033153 | 0.0029 | 37.9619 | 0.0869 | 2 | 5 | T cell receptor V(D)J recombination |
| GO:0048625 | 0.0029 | 37.9619 | 0.0869 | 2 | 5 | myoblast fate commitment |
| GO:0060023 | 0.0029 | 37.9619 | 0.0869 | 2 | 5 | soft palate development |
| GO:0061009 | 0.0029 | 37.9619 | 0.0869 | 2 | 5 | common bile duct development |
| GO:0061056 | 0.0029 | 37.9619 | 0.0869 | 2 | 5 | sclerotome development |
| GO:0060021 | 0.0029 | 4.5709 | 1.4155 | 6 | 82 | palate development |
| GO:0048486 | 0.0029 | 12.2373 | 0.2954 | 3 | 17 | parasympathetic nervous system development |
| GO:0010717 | 0.003 | 4.5398 | 1.4249 | 6 | 82 | regulation of epithelial to mesenchymal transition |
| GO:0042475 | 0.003 | 4.5398 | 1.4249 | 6 | 82 | odontogenesis of dentin-containing tooth |
| GO:0045687 | 0.0031 | 7.3873 | 0.6082 | 4 | 35 | positive regulation of glial cell differentiation |
| GO:2000826 | 0.0031 | 7.3873 | 0.6082 | 4 | 35 | regulation of heart morphogenesis |
| GO:0007178 | 0.0033 | 2.5292 | 5.4214 | 13 | 312 | transmembrane receptor protein serine/threonine kinase signaling pathway |
| GO:0014009 | 0.0034 | 7.156 | 0.6255 | 4 | 36 | glial cell proliferation |
| GO:0048754 | 0.0034 | 4.4267 | 1.4571 | 6 | 86 | branching morphogenesis of an epithelial tube |
| GO:0010817 | 0.0034 | 2.2092 | 8.1147 | 17 | 467 | regulation of hormone levels |
| GO:0021536 | 0.0037 | 11.0737 | 0.3195 | 3 | 19 | diencephalon development |
| GO:0060412 | 0.0038 | 6.9387 | 0.6429 | 4 | 37 | ventricular septum morphogenesis |
| GO:0051705 | 0.0038 | 5.2156 | 1.0426 | 5 | 60 | multi-organism behavior |
| GO:0060675 | 0.0038 | 5.2156 | 1.0426 | 5 | 60 | ureteric bud morphogenesis |
| GO:0016331 | 0.0039 | 3.3694 | 2.5196 | 8 | 145 | morphogenesis of embryonic epithelium |
| GO:0002089 | 0.0041 | 10.7063 | 0.3301 | 3 | 19 | lens morphogenesis in camera-type eye |
| GO:0060602 | 0.0041 | 10.7063 | 0.3301 | 3 | 19 | branch elongation of an epithelium |
| GO:0072079 | 0.0041 | 10.7063 | 0.3301 | 3 | 19 | nephron tubule formation |
| GO:2000678 | 0.0041 | 10.7063 | 0.3301 | 3 | 19 | negative regulation of transcription regulatory region DNA binding |
| GO:0042127 | 0.0042 | 2.1138 | 9.0115 | 18 | 577 | regulation of cell proliferation |
| GO:0060349 | 0.0043 | 4.206 | 1.5291 | 6 | 88 | bone morphogenesis |
| GO:0014062 | 0.0043 | 28.4696 | 0.1043 | 2 | 6 | regulation of serotonin secretion |
| GO:0042713 | 0.0043 | 28.4696 | 0.1043 | 2 | 6 | sperm ejaculation |
| GO:0048241 | 0.0043 | 28.4696 | 0.1043 | 2 | 6 | epinephrine transport |
| GO:0048541 | 0.0043 | 28.4696 | 0.1043 | 2 | 6 | Peyer's patch development |
| GO:0060022 | 0.0043 | 28.4696 | 0.1043 | 2 | 6 | hard palate development |
| GO:0061074 | 0.0043 | 28.4696 | 0.1043 | 2 | 6 | regulation of neural retina development |
| GO:0045995 | 0.0043 | 3.6648 | 2.033 | 7 | 117 | regulation of embryonic development |
| GO:0055002 | 0.0044 | 3.2966 | 2.5717 | 8 | 148 | striated muscle cell development |
| GO:0003206 | 0.0044 | 4.1742 | 1.5391 | 6 | 90 | cardiac chamber morphogenesis |
| GO:0021532 | 0.0046 | 6.5414 | 0.6777 | 4 | 39 | neural tube patterning |
| GO:1905114 | 0.0046 | 2.0455 | 9.7829 | 19 | 563 | cell surface receptor signaling pathway involved in cell-cell signaling |
| GO:0007548 | 0.0047 | 2.6453 | 4.3788 | 11 | 252 | sex differentiation |
| GO:0043367 | 0.0047 | 4.9449 | 1.0947 | 5 | 63 | CD4-positive, alpha-beta T cell differentiation |
| GO:0043576 | 0.0048 | 10.0759 | 0.3475 | 3 | 20 | regulation of respiratory gaseous exchange |
| GO:0072358 | 0.0048 | 1.9627 | 11.2772 | 21 | 649 | cardiovascular system development |
| GO:0003170 | 0.005 | 6.3593 | 0.6951 | 4 | 40 | heart valve development |
| GO:0045165 | 0.005 | 3.2169 | 2.6289 | 8 | 162 | cell fate commitment |
| GO:0030902 | 0.0051 | 6.3114 | 0.6989 | 4 | 41 | hindbrain development |
| GO:0021954 | 0.0054 | 4.7795 | 1.1295 | 5 | 65 | central nervous system neuron development |
| GO:0048844 | 0.0054 | 4.7795 | 1.1295 | 5 | 65 | artery morphogenesis |
| GO:0002052 | 0.0055 | 9.5155 | 0.3649 | 3 | 21 | positive regulation of neuroblast proliferation |
| GO:0007617 | 0.0055 | 9.5155 | 0.3649 | 3 | 21 | mating behavior |
| GO:0021516 | 0.0055 | 9.5155 | 0.3649 | 3 | 21 | dorsal spinal cord development |
| GO:0031290 | 0.0055 | 9.5155 | 0.3649 | 3 | 21 | retinal ganglion cell axon guidance |
| GO:0048666 | 0.0056 | 3.9653 | 1.6139 | 6 | 98 | neuron development |
| GO:0007623 | 0.0059 | 2.8877 | 3.2841 | 9 | 189 | circadian rhythm |
| GO:0021521 | 0.0059 | 22.9353 | 0.1208 | 2 | 7 | ventral spinal cord interneuron specification |
| GO:0002062 | 0.0059 | 3.9177 | 1.6334 | 6 | 94 | chondrocyte differentiation |
| GO:0035850 | 0.0059 | 6.0239 | 0.7298 | 4 | 42 | epithelial cell differentiation involved in kidney development |
| GO:0003253 | 0.006 | 22.7743 | 0.1216 | 2 | 7 | cardiac neural crest cell migration involved in outflow tract morphogenesis |
| GO:0021796 | 0.006 | 22.7743 | 0.1216 | 2 | 7 | cerebral cortex regionalization |
| GO:0021798 | 0.006 | 22.7743 | 0.1216 | 2 | 7 | forebrain dorsal/ventral pattern formation |
| GO:0048341 | 0.006 | 22.7743 | 0.1216 | 2 | 7 | paraxial mesoderm formation |
| GO:0051971 | 0.006 | 22.7743 | 0.1216 | 2 | 7 | positive regulation of transmission of nerve impulse |
| GO:0060430 | 0.006 | 22.7743 | 0.1216 | 2 | 7 | lung saccule development |
| GO:0070091 | 0.006 | 22.7743 | 0.1216 | 2 | 7 | glucagon secretion |
| GO:0071864 | 0.006 | 22.7743 | 0.1216 | 2 | 7 | positive regulation of cell proliferation in bone marrow |
| GO:2000049 | 0.006 | 22.7743 | 0.1216 | 2 | 7 | positive regulation of cell-cell adhesion mediated by cadherin |
| GO:2000679 | 0.0063 | 9.0141 | 0.3823 | 3 | 22 | positive regulation of transcription regulatory region DNA binding |
| GO:0001654 | 0.0064 | 2.323 | 5.8732 | 13 | 338 | eye development |
| GO:0031175 | 0.0065 | 1.7991 | 14.6482 | 25 | 843 | neuron projection development |
| GO:0007631 | 0.0066 | 3.8283 | 1.6684 | 6 | 97 | feeding behavior |
| GO:0071773 | 0.0067 | 3.0543 | 2.7628 | 8 | 159 | cellular response to BMP stimulus |
| GO:0060173 | 0.0067 | 8.7148 | 0.391 | 3 | 24 | limb development |
| GO:0002520 | 0.0068 | 1.7708 | 15.4823 | 26 | 891 | immune system development |
| GO:0048705 | 0.0069 | 5.7504 | 0.7587 | 4 | 46 | skeletal system morphogenesis |
| GO:0000904 | 0.0069 | 1.9258 | 10.9123 | 20 | 628 | cell morphogenesis involved in differentiation |
| GO:0003279 | 0.0069 | 3.7879 | 1.6855 | 6 | 97 | cardiac septum development |
| GO:0031644 | 0.0069 | 4.4796 | 1.199 | 5 | 69 | regulation of neurological system process |
| GO:0048523 | 0.0069 | 1.4744 | 47.1266 | 63 | 3055 | negative regulation of cellular process |
| GO:0010001 | 0.0071 | 3.3251 | 2.2263 | 7 | 130 | glial cell differentiation |
| GO:0044062 | 0.0071 | 8.5629 | 0.3997 | 3 | 23 | regulation of excretion |
| GO:0045686 | 0.0071 | 8.5629 | 0.3997 | 3 | 23 | negative regulation of glial cell differentiation |
| GO:0033673 | 0.0072 | 2.4879 | 4.6395 | 11 | 267 | negative regulation of kinase activity |
| GO:0007422 | 0.0074 | 4.4104 | 1.2163 | 5 | 70 | peripheral nervous system development |
| GO:0048538 | 0.0076 | 5.582 | 0.7819 | 4 | 45 | thymus development |
| GO:0035137 | 0.0077 | 19.2234 | 0.1373 | 2 | 8 | hindlimb morphogenesis |
| GO:0035881 | 0.0079 | 18.9774 | 0.139 | 2 | 8 | amacrine cell differentiation |
| GO:0045924 | 0.0079 | 18.9774 | 0.139 | 2 | 8 | regulation of female receptivity |
| GO:0048743 | 0.0079 | 18.9774 | 0.139 | 2 | 8 | positive regulation of skeletal muscle fiber development |
| GO:0061525 | 0.0079 | 18.9774 | 0.139 | 2 | 8 | hindgut development |
| GO:1990403 | 0.0079 | 18.9774 | 0.139 | 2 | 8 | embryonic brain development |
| GO:0035987 | 0.0082 | 5.4488 | 0.7993 | 4 | 46 | endodermal cell differentiation |
| GO:0072132 | 0.0082 | 5.4488 | 0.7993 | 4 | 46 | mesenchyme morphogenesis |
| GO:0016202 | 0.0083 | 3.2219 | 2.2937 | 7 | 132 | regulation of striated muscle tissue development |
| GO:0001570 | 0.0083 | 4.2782 | 1.2511 | 5 | 72 | vasculogenesis |
| GO:0015844 | 0.0083 | 4.2782 | 1.2511 | 5 | 72 | monoamine transport |
| GO:0042692 | 0.0085 | 2.1633 | 6.7768 | 14 | 390 | muscle cell differentiation |
| GO:0002067 | 0.0089 | 5.3217 | 0.8167 | 4 | 47 | glandular epithelial cell differentiation |
| GO:0010463 | 0.0089 | 5.3217 | 0.8167 | 4 | 47 | mesenchymal cell proliferation |
| GO:0035295 | 0.0089 | 3.1739 | 2.3237 | 7 | 147 | tube development |
| GO:0050880 | 0.009 | 3.1708 | 2.3284 | 7 | 134 | regulation of blood vessel size |
| GO:0045736 | 0.009 | 7.7835 | 0.4344 | 3 | 25 | negative regulation of cyclin-dependent protein serine/threonine kinase activity |
| GO:0060037 | 0.009 | 7.7835 | 0.4344 | 3 | 25 | pharyngeal system development |
| GO:0060740 | 0.009 | 7.7835 | 0.4344 | 3 | 25 | prostate gland epithelium morphogenesis |
| GO:0060828 | 0.0092 | 2.5234 | 4.1529 | 10 | 239 | regulation of canonical Wnt signaling pathway |
| GO:0055006 | 0.0093 | 4.1537 | 1.2858 | 5 | 74 | cardiac cell development |
| GO:0042330 | 0.0094 | 1.9342 | 9.7481 | 18 | 561 | taxis |
| GO:0060070 | 0.0095 | 5.1983 | 0.8335 | 4 | 49 | canonical Wnt signaling pathway |
| GO:0055010 | 0.0095 | 5.2005 | 0.8341 | 4 | 48 | ventricular cardiac muscle tissue morphogenesis |
| GO:0060563 | 0.0095 | 5.2005 | 0.8341 | 4 | 48 | neuroepithelial cell differentiation |
| GO:0051952 | 0.0098 | 4.0941 | 1.3032 | 5 | 75 | regulation of amine transport |
| GO:0003139 | 0.01 | 16.2653 | 0.1564 | 2 | 9 | secondary heart field specification |
| GO:0003266 | 0.01 | 16.2653 | 0.1564 | 2 | 9 | regulation of secondary heart field cardioblast proliferation |
| GO:0030917 | 0.01 | 16.2653 | 0.1564 | 2 | 9 | midbrain-hindbrain boundary development |
| GO:0033327 | 0.01 | 16.2653 | 0.1564 | 2 | 9 | Leydig cell differentiation |
| GO:0043084 | 0.01 | 16.2653 | 0.1564 | 2 | 9 | penile erection |
| GO:0043587 | 0.01 | 16.2653 | 0.1564 | 2 | 9 | tongue morphogenesis |
| GO:0043950 | 0.01 | 16.2653 | 0.1564 | 2 | 9 | positive regulation of cAMP-mediated signaling |
| GO:0048664 | 0.01 | 16.2653 | 0.1564 | 2 | 9 | neuron fate determination |
| GO:0061004 | 0.01 | 16.2653 | 0.1564 | 2 | 9 | pattern specification involved in kidney development |
| GO:0070472 | 0.01 | 16.2653 | 0.1564 | 2 | 9 | regulation of uterine smooth muscle contraction |
| GO:1905770 | 0.01 | 16.2653 | 0.1564 | 2 | 9 | regulation of mesodermal cell differentiation |
| GO:2000818 | 0.01 | 16.2653 | 0.1564 | 2 | 9 | negative regulation of myoblast proliferation |
| GOMFID | Pvalue | OddsRatio | ExpCount | Count | Size | Term |
| GO:0009593 | 0 | 12.1335 | 1.9964 | 18 | 450 | detection of chemical stimulus |
| GO:0050906 | 0 | 11.7965 | 2.0497 | 18 | 462 | detection of stimulus involved in sensory perception |
| GO:0007606 | 0 | 11.6348 | 2.0763 | 18 | 468 | sensory perception of chemical stimulus |
| GO:0050911 | 0 | 12.7179 | 1.6459 | 16 | 371 | detection of chemical stimulus involved in sensory perception of smell |
| GO:0009913 | 0 | 9.3887 | 1.5483 | 12 | 349 | epidermal cell differentiation |
| GO:0050877 | 0 | 4.8287 | 5.377 | 20 | 1212 | nervous system process |
| GO:0043588 | 0 | 7.9601 | 1.8101 | 12 | 408 | skin development |
| GO:0007186 | 0 | 4.2591 | 5.3165 | 18 | 1231 | G-protein coupled receptor signaling pathway |
| GO:0031424 | 0 | 14.4175 | 0.4768 | 6 | 113 | keratinization |
| GO:0042742 | 0 | 8.656 | 1.0559 | 8 | 238 | defense response to bacterium |
| GO:0043207 | 1e-04 | 4.2241 | 3.6113 | 13 | 814 | response to external biotic stimulus |
| GO:0018149 | 1e-04 | 17.5414 | 0.2573 | 4 | 58 | peptide cross-linking |
| GO:0015908 | 6e-04 | 11.3919 | 0.386 | 4 | 87 | fatty acid transport |
| GO:0019730 | 8e-04 | 18.2602 | 0.1834 | 3 | 43 | antimicrobial humoral response |
| GO:0048245 | 0.001 | 51.2635 | 0.0488 | 2 | 11 | eosinophil chemotaxis |
| GO:0052548 | 0.0015 | 4.5571 | 1.6859 | 7 | 380 | regulation of endopeptidase activity |
| GO:0061844 | 0.0015 | 14.5915 | 0.2263 | 3 | 51 | antimicrobial humoral immune response mediated by antimicrobial peptide |
| GO:0070268 | 0.0016 | 8.6606 | 0.5013 | 4 | 113 | cornification |
| GO:0070374 | 0.0017 | 6.305 | 0.8607 | 5 | 194 | positive regulation of ERK1 and ERK2 cascade |
| GO:0032501 | 0.0018 | 2.1771 | 26.1513 | 38 | 6750 | multicellular organismal process |
| GO:0048247 | 0.0022 | 12.7289 | 0.2573 | 3 | 58 | lymphocyte chemotaxis |
| GO:0060429 | 0.0024 | 2.7488 | 5.377 | 13 | 1212 | epithelium development |
| GO:0002548 | 0.0026 | 11.8629 | 0.2751 | 3 | 62 | monocyte chemotaxis |
| GO:0098664 | 0.0039 | 24.2677 | 0.0932 | 2 | 21 | G-protein coupled serotonin receptor signaling pathway |
| GO:0002395 | 0.0044 | Inf | 0.0044 | 1 | 1 | immune response in nasopharyngeal-associated lymphoid tissue |
| GO:0015913 | 0.0044 | Inf | 0.0044 | 1 | 1 | short-chain fatty acid import |
| GO:0050828 | 0.0044 | Inf | 0.0044 | 1 | 1 | regulation of liquid surface tension |
| GO:0006952 | 0.0053 | 2.4045 | 6.6015 | 14 | 1488 | defense response |
| GO:0070098 | 0.0054 | 9.0796 | 0.3549 | 3 | 80 | chemokine-mediated signaling pathway |
| GO:1903514 | 0.0088 | 15.359 | 0.142 | 2 | 32 | release of sequestered calcium ion into cytosol by endoplasmic reticulum |
| GO:0006714 | 0.0089 | 227.5493 | 0.0089 | 1 | 2 | sesquiterpenoid metabolic process |
| GO:0016488 | 0.0089 | 227.5493 | 0.0089 | 1 | 2 | farnesol catabolic process |
| GO:0042710 | 0.0089 | 227.5493 | 0.0089 | 1 | 2 | biofilm formation |
| GO:0044867 | 0.0089 | 227.5493 | 0.0089 | 1 | 2 | modulation by host of viral catalytic activity |
| GO:0044869 | 0.0089 | 227.5493 | 0.0089 | 1 | 2 | negative regulation by host of viral exo-alpha-sialidase activity |
| GO:0044871 | 0.0089 | 227.5493 | 0.0089 | 1 | 2 | negative regulation by host of viral glycoprotein metabolic process |
| GO:0070075 | 0.0089 | 227.5493 | 0.0089 | 1 | 2 | tear secretion |
| GO:1900190 | 0.0089 | 227.5493 | 0.0089 | 1 | 2 | regulation of single-species biofilm formation |
| GO:1900229 | 0.0089 | 227.5493 | 0.0089 | 1 | 2 | negative regulation of single-species biofilm formation in or on host organism |
| GOMFID | Pvalue | OddsRatio | ExpCount | Count | Size | Term |
| GO:0007389 | 0 | 15.5005 | 3.4167 | 38 | 202 | pattern specification process |
| GO:0009952 | 0 | 18.768 | 2.3598 | 31 | 132 | anterior/posterior pattern specification |
| GO:0045944 | 0 | 5.2216 | 19.4316 | 76 | 1069 | positive regulation of transcription from RNA polymerase II promoter |
| GO:1903508 | 0 | 4.6143 | 24.903 | 85 | 1370 | positive regulation of nucleic acid-templated transcription |
| GO:0051254 | 0 | 4.4273 | 26.1935 | 86 | 1441 | positive regulation of RNA metabolic process |
| GO:0006355 | 0 | 3.3523 | 62.6755 | 138 | 3448 | regulation of transcription, DNA-templated |
| GO:2001141 | 0 | 3.3181 | 63.1662 | 138 | 3475 | regulation of RNA biosynthetic process |
| GO:0010557 | 0 | 3.9809 | 29.1201 | 87 | 1602 | positive regulation of macromolecule biosynthetic process |
| GO:0010628 | 0 | 3.7524 | 31.9739 | 90 | 1759 | positive regulation of gene expression |
| GO:0031328 | 0 | 3.7452 | 31.574 | 89 | 1737 | positive regulation of cellular biosynthetic process |
| GO:0009790 | 0 | 5.1007 | 14.3809 | 58 | 813 | embryo development |
| GO:0019219 | 0 | 2.9607 | 73.182 | 144 | 4026 | regulation of nucleobase-containing compound metabolic process |
| GO:0007156 | 0 | 12.1263 | 2.763 | 26 | 152 | homophilic cell adhesion via plasma membrane adhesion molecules |
| GO:0034654 | 0 | 2.8263 | 74.1817 | 142 | 4081 | nucleobase-containing compound biosynthetic process |
| GO:0051173 | 0 | 2.8033 | 51.4419 | 108 | 2830 | positive regulation of nitrogen compound metabolic process |
| GO:0060322 | 0 | 4.4291 | 12.4333 | 46 | 684 | head development |
| GO:0035107 | 0 | 9.7719 | 2.6357 | 21 | 145 | appendage morphogenesis |
| GO:0060173 | 0 | 8.8392 | 3.0156 | 22 | 167 | limb development |
| GO:0007275 | 0 | 3.1827 | 32.7936 | 74 | 2477 | multicellular organism development |
| GO:0016339 | 0 | 36.2649 | 0.509 | 11 | 28 | calcium-dependent cell-cell adhesion via plasma membrane cell adhesion molecules |
| GO:0032502 | 0 | 3.0947 | 37.7721 | 79 | 2972 | developmental process |
| GO:0090596 | 0 | 6.5532 | 4.4898 | 25 | 247 | sensory organ morphogenesis |
| GO:0007416 | 0 | 9.072 | 2.5266 | 19 | 139 | synapse assembly |
| GO:0048562 | 0 | 7.9418 | 2.9845 | 20 | 175 | embryonic organ morphogenesis |
| GO:0000122 | 0 | 3.632 | 13.7784 | 43 | 758 | negative regulation of transcription from RNA polymerase II promoter |
| GO:0009890 | 0 | 2.7504 | 29.6836 | 68 | 1633 | negative regulation of biosynthetic process |
| GO:0007267 | 0 | 3.1557 | 19.4742 | 52 | 1108 | cell-cell signaling |
| GO:0090304 | 0 | 2.1761 | 89.178 | 142 | 4906 | nucleic acid metabolic process |
| GO:0098609 | 0 | 3.5185 | 14.1783 | 43 | 780 | cell-cell adhesion |
| GO:0009653 | 0 | 5.4365 | 5.388 | 25 | 364 | anatomical structure morphogenesis |
| GO:1901576 | 0 | 2.108 | 110.8999 | 164 | 6101 | organic substance biosynthetic process |
| GO:2000113 | 0 | 2.741 | 26.757 | 62 | 1472 | negative regulation of cellular macromolecule biosynthetic process |
| GO:1903507 | 0 | 2.9257 | 20.6858 | 52 | 1138 | negative regulation of nucleic acid-templated transcription |
| GO:0048704 | 0 | 17.0221 | 0.8541 | 11 | 48 | embryonic skeletal system morphogenesis |
| GO:0043583 | 0 | 6.2253 | 3.7082 | 20 | 204 | ear development |
| GO:0045165 | 0 | 6.1148 | 3.7655 | 20 | 214 | cell fate commitment |
| GO:0034641 | 0 | 2.0321 | 114.3536 | 165 | 6291 | cellular nitrogen compound metabolic process |
| GO:0048513 | 0 | 2.3077 | 47.6225 | 88 | 2833 | animal organ development |
| GO:0008284 | 0 | 3.1613 | 15.6143 | 43 | 859 | positive regulation of cell proliferation |
| GO:0009954 | 0 | 22.7603 | 0.5635 | 9 | 31 | proximal/distal pattern formation |
| GO:0001764 | 0 | 7.6865 | 2.4358 | 16 | 134 | neuron migration |
| GO:0010629 | 0 | 2.4249 | 33.0828 | 68 | 1820 | negative regulation of gene expression |
| GO:0051253 | 0 | 2.7254 | 22.0309 | 52 | 1212 | negative regulation of RNA metabolic process |
| GO:0048762 | 0 | 6.1725 | 3.3446 | 18 | 184 | mesenchymal cell differentiation |
| GO:0007268 | 0 | 3.5098 | 10.6337 | 33 | 585 | chemical synaptic transmission |
| GO:0099537 | 0 | 3.4967 | 10.6701 | 33 | 587 | trans-synaptic signaling |
| GO:0071542 | 0 | 18.5396 | 0.6544 | 9 | 36 | dopaminergic neuron differentiation |
| GO:0007399 | 0 | 3.1698 | 13.5778 | 37 | 954 | nervous system development |
| GO:0006725 | 0 | 1.9164 | 104.2652 | 150 | 5736 | cellular aromatic compound metabolic process |
| GO:0034645 | 0 | 2.1598 | 54.6565 | 92 | 3464 | cellular macromolecule biosynthetic process |
| GO:0046483 | 0 | 1.9089 | 103.6108 | 149 | 5700 | heterocycle metabolic process |
| GO:0031324 | 0 | 2.126 | 46.5522 | 83 | 2561 | negative regulation of cellular metabolic process |
| GO:0051172 | 0 | 2.1365 | 43.771 | 79 | 2408 | negative regulation of nitrogen compound metabolic process |
| GO:0048646 | 0 | 2.8121 | 16.0688 | 40 | 910 | anatomical structure formation involved in morphogenesis |
| GO:1901360 | 0 | 1.8347 | 108.0824 | 151 | 5946 | organic cyclic compound metabolic process |
| GO:0048699 | 0 | 3.2413 | 10.0223 | 29 | 602 | generation of neurons |
| GO:0035116 | 0 | 18.4178 | 0.509 | 7 | 28 | embryonic hindlimb morphogenesis |
| GO:0065007 | 0 | 2.0211 | 205.1676 | 242 | 11287 | biological regulation |
| GO:0048522 | 0 | 2.035 | 49.0014 | 81 | 3102 | positive regulation of cellular process |
| GO:2000543 | 0 | 45.7701 | 0.2 | 5 | 11 | positive regulation of gastrulation |
| GO:0035295 | 0 | 3.6188 | 6.718 | 22 | 388 | tube development |
| GO:0071363 | 0 | 2.9287 | 11.3245 | 30 | 623 | cellular response to growth factor stimulus |
| GO:0035115 | 0 | 15.4671 | 0.5817 | 7 | 32 | embryonic forelimb morphogenesis |
| GO:0060562 | 0 | 6.167 | 2.1939 | 12 | 124 | epithelial tube morphogenesis |
| GO:0060021 | 0 | 7.8093 | 1.4762 | 10 | 82 | palate development |
| GO:0045596 | 0 | 2.8391 | 11.6517 | 30 | 641 | negative regulation of cell differentiation |
| GO:0061564 | 0 | 3.2633 | 8.0889 | 24 | 445 | axon development |
| GO:0021520 | 0 | 34.3233 | 0.2363 | 5 | 13 | spinal cord motor neuron cell fate specification |
| GO:0007417 | 0 | 2.8351 | 11.7143 | 30 | 697 | central nervous system development |
| GO:0003357 | 0 | 72.9943 | 0.1272 | 4 | 7 | noradrenergic neuron differentiation |
| GO:0042472 | 0 | 7.2746 | 1.5714 | 10 | 87 | inner ear morphogenesis |
| GO:0061448 | 0 | 4.263 | 4.1352 | 16 | 229 | connective tissue development |
| GO:0072080 | 0 | 7.1327 | 1.5996 | 10 | 88 | nephron tubule development |
| GO:0060548 | 0 | 2.4533 | 16.6686 | 37 | 917 | negative regulation of cell death |
| GO:0030154 | 0 | 2.718 | 12.9609 | 31 | 889 | cell differentiation |
| GO:0060581 | 0 | 27.4552 | 0.2727 | 5 | 15 | cell fate commitment involved in pattern specification |
| GO:0051094 | 0 | 3.9969 | 4.6856 | 17 | 279 | positive regulation of developmental process |
| GO:0048706 | 0 | 16.6969 | 0.4635 | 6 | 27 | embryonic skeletal system development |
| GO:0048667 | 0 | 2.994 | 9.1432 | 25 | 503 | cell morphogenesis involved in neuron differentiation |
| GO:0071772 | 0 | 4.985 | 2.8902 | 13 | 159 | response to BMP |
| GO:0021983 | 0 | 15.8861 | 0.4862 | 6 | 27 | pituitary gland development |
| GO:0021514 | 0 | 22.8764 | 0.309 | 5 | 17 | ventral spinal cord interneuron differentiation |
| GO:0048519 | 0 | 1.783 | 64.1394 | 95 | 3770 | negative regulation of biological process |
| GO:0007517 | 0 | 4.7382 | 3.0258 | 13 | 172 | muscle organ development |
| GO:0048812 | 0 | 2.7928 | 10.1611 | 26 | 559 | neuron projection morphogenesis |
| GO:0003206 | 0 | 5.5718 | 2.1995 | 11 | 121 | cardiac chamber morphogenesis |
| GO:0048701 | 0 | 10.4428 | 0.7998 | 7 | 44 | embryonic cranial skeleton morphogenesis |
| GO:0022610 | 0 | 2.124 | 24.0123 | 46 | 1321 | biological adhesion |
| GO:0042475 | 0 | 6.8373 | 1.4905 | 9 | 82 | odontogenesis of dentin-containing tooth |
| GO:0042474 | 0 | 19.6059 | 0.3454 | 5 | 19 | middle ear morphogenesis |
| GO:0048468 | 0 | 2.1262 | 23.5953 | 45 | 1378 | cell development |
| GO:0061138 | 0 | 4.4881 | 3.181 | 13 | 175 | morphogenesis of a branching epithelium |
| GO:0048858 | 0 | 2.7035 | 10.4701 | 26 | 576 | cell projection morphogenesis |
| GO:0021854 | 0 | 18.2977 | 0.3635 | 5 | 20 | hypothalamus development |
| GO:0023019 | 0 | 18.2977 | 0.3635 | 5 | 20 | signal transduction involved in regulation of gene expression |
| GO:0071495 | 0 | 2.1142 | 22.4127 | 43 | 1233 | cellular response to endogenous stimulus |
| GO:0051962 | 0 | 2.8918 | 8.2525 | 22 | 454 | positive regulation of nervous system development |
| GO:0048485 | 0 | 17.153 | 0.3817 | 5 | 21 | sympathetic nervous system development |
| GO:0021521 | 0 | 31.2754 | 0.2 | 4 | 11 | ventral spinal cord interneuron specification |
| GO:0021513 | 0 | 16.143 | 0.3999 | 5 | 22 | spinal cord dorsal/ventral patterning |
| GO:0007368 | 0 | 5.3929 | 2.054 | 10 | 113 | determination of left/right symmetry |
| GO:0072001 | 0 | 3.4982 | 4.9624 | 16 | 273 | renal system development |
| GO:0072088 | 0 | 7.0222 | 1.2906 | 8 | 71 | nephron epithelium morphogenesis |
| GO:0035050 | 0 | 6.912 | 1.3088 | 8 | 72 | embryonic heart tube development |
| GO:0048729 | 0 | 2.6648 | 9.762 | 24 | 554 | tissue morphogenesis |
| GO:0001654 | 0 | 3.1707 | 6.1439 | 18 | 338 | eye development |
| GO:0060412 | 0 | 10.6505 | 0.6726 | 6 | 37 | ventricular septum morphogenesis |
| GO:0061333 | 1e-04 | 6.8053 | 1.3269 | 8 | 73 | renal tubule morphogenesis |
| GO:0045995 | 1e-04 | 5.19 | 2.1267 | 10 | 117 | regulation of embryonic development |
| GO:0022603 | 1e-04 | 2.2019 | 17.323 | 35 | 953 | regulation of anatomical structure morphogenesis |
| GO:0048565 | 1e-04 | 5.1282 | 2.1495 | 10 | 119 | digestive tract development |
| GO:0030878 | 1e-04 | 14.4419 | 0.4363 | 5 | 24 | thyroid gland development |
| GO:0042481 | 1e-04 | 14.4419 | 0.4363 | 5 | 24 | regulation of odontogenesis |
| GO:0021879 | 1e-04 | 24.8764 | 0.2312 | 4 | 13 | forebrain neuron differentiation |
| GO:0048935 | 1e-04 | 24.3223 | 0.2363 | 4 | 13 | peripheral nervous system neuron development |
| GO:0045666 | 1e-04 | 3.2086 | 5.7259 | 17 | 315 | positive regulation of neuron differentiation |
| GO:0003279 | 1e-04 | 5.6665 | 1.7632 | 9 | 97 | cardiac septum development |
| GO:0001947 | 1e-04 | 7.7214 | 1.0361 | 7 | 57 | heart looping |
| GO:0009799 | 1e-04 | 4.9126 | 2.2358 | 10 | 123 | specification of symmetry |
| GO:0021517 | 1e-04 | 13.284 | 0.4651 | 5 | 26 | ventral spinal cord development |
| GO:0006935 | 1e-04 | 2.5392 | 10.1975 | 24 | 561 | chemotaxis |
| GO:0008285 | 1e-04 | 2.3842 | 12.2333 | 27 | 673 | negative regulation of cell proliferation |
| GO:0021602 | 1e-04 | 12.4702 | 0.4908 | 5 | 27 | cranial nerve morphogenesis |
| GO:0001501 | 1e-04 | 3.069 | 5.9725 | 17 | 355 | skeletal system development |
| GO:0048241 | 1e-04 | 54.5582 | 0.1091 | 3 | 6 | epinephrine transport |
| GO:0060022 | 1e-04 | 54.5582 | 0.1091 | 3 | 6 | hard palate development |
| GO:1903844 | 1e-04 | 5.2466 | 1.8904 | 9 | 104 | regulation of cellular response to transforming growth factor beta stimulus |
| GO:0010717 | 1e-04 | 5.9742 | 1.4905 | 8 | 82 | regulation of epithelial to mesenchymal transition |
| GO:0007519 | 1e-04 | 5.9176 | 1.502 | 8 | 84 | skeletal muscle tissue development |
| GO:0010720 | 1e-04 | 2.6554 | 8.507 | 21 | 468 | positive regulation of cell development |
| GO:0072091 | 1e-04 | 6.8915 | 1.1452 | 7 | 63 | regulation of stem cell proliferation |
| GO:2000026 | 1e-04 | 1.9247 | 25.7407 | 45 | 1513 | regulation of multicellular organismal development |
| GO:0048665 | 1e-04 | 18.6761 | 0.2842 | 4 | 16 | neuron fate specification |
| GO:0010656 | 2e-04 | 8.4615 | 0.818 | 6 | 45 | negative regulation of muscle cell apoptotic process |
| GO:0003203 | 2e-04 | 11.4296 | 0.5271 | 5 | 29 | endocardial cushion morphogenesis |
| GO:0060850 | 2e-04 | 18.2383 | 0.2908 | 4 | 16 | regulation of transcription involved in cell fate commitment |
| GO:0051101 | 2e-04 | 4.9827 | 1.9813 | 9 | 109 | regulation of DNA binding |
| GO:0060993 | 2e-04 | 5.5943 | 1.5814 | 8 | 87 | kidney morphogenesis |
| GO:0060349 | 2e-04 | 5.524 | 1.5996 | 8 | 88 | bone morphogenesis |
| GO:0009953 | 2e-04 | 6.474 | 1.2087 | 7 | 68 | dorsal/ventral pattern formation |
| GO:0048486 | 2e-04 | 16.8343 | 0.309 | 4 | 17 | parasympathetic nervous system development |
| GO:0032989 | 2e-04 | 2.0686 | 17.7774 | 34 | 978 | cellular component morphogenesis |
| GO:0001569 | 2e-04 | 10.5491 | 0.5635 | 5 | 31 | branching involved in blood vessel morphogenesis |
| GO:0010667 | 2e-04 | 10.5491 | 0.5635 | 5 | 31 | negative regulation of cardiac muscle cell apoptotic process |
| GO:0060325 | 3e-04 | 10.1577 | 0.5817 | 5 | 32 | face morphogenesis |
| GO:0035137 | 3e-04 | 33.4905 | 0.1422 | 3 | 8 | hindlimb morphogenesis |
| GO:0003231 | 3e-04 | 4.5687 | 2.1449 | 9 | 118 | cardiac ventricle development |
| GO:0048870 | 3e-04 | 1.8591 | 25.7573 | 44 | 1417 | cell motility |
| GO:0060425 | 3e-04 | 7.3306 | 0.927 | 6 | 51 | lung morphogenesis |
| GO:0061303 | 3e-04 | 32.7308 | 0.1454 | 3 | 8 | cornea development in camera-type eye |
| GO:0003326 | 3e-04 | Inf | 0.0364 | 2 | 2 | pancreatic A cell fate commitment |
| GO:0003329 | 3e-04 | Inf | 0.0364 | 2 | 2 | pancreatic PP cell fate commitment |
| GO:0021623 | 3e-04 | Inf | 0.0364 | 2 | 2 | oculomotor nerve formation |
| GO:0043503 | 3e-04 | Inf | 0.0364 | 2 | 2 | skeletal muscle fiber adaptation |
| GO:0072272 | 3e-04 | Inf | 0.0364 | 2 | 2 | proximal/distal pattern formation involved in metanephric nephron development |
| GO:2001055 | 3e-04 | Inf | 0.0364 | 2 | 2 | positive regulation of mesenchymal cell apoptotic process |
| GO:2001111 | 3e-04 | Inf | 0.0364 | 2 | 2 | positive regulation of lens epithelial cell proliferation |
| GO:0021895 | 3e-04 | 14.5879 | 0.3454 | 4 | 19 | cerebral cortex neuron differentiation |
| GO:0048557 | 3e-04 | 14.5879 | 0.3454 | 4 | 19 | embryonic digestive tract morphogenesis |
| GO:0072079 | 3e-04 | 14.5879 | 0.3454 | 4 | 19 | nephron tubule formation |
| GO:2000678 | 3e-04 | 14.5879 | 0.3454 | 4 | 19 | negative regulation of transcription regulatory region DNA binding |
| GO:0030900 | 4e-04 | 3.2828 | 4.2465 | 13 | 249 | forebrain development |
| GO:0050905 | 4e-04 | 5.0193 | 1.745 | 8 | 96 | neuromuscular process |
| GO:0007498 | 4e-04 | 4.4455 | 2.1995 | 9 | 121 | mesoderm development |
| GO:0001568 | 4e-04 | 2.3032 | 11.1609 | 24 | 614 | blood vessel development |
| GO:0007631 | 4e-04 | 4.9955 | 1.7521 | 8 | 97 | feeding behavior |
| GO:0060429 | 4e-04 | 2.843 | 6.0356 | 16 | 370 | epithelium development |
| GO:0051241 | 4e-04 | 1.9683 | 19.1771 | 35 | 1055 | negative regulation of multicellular organismal process |
| GO:0051240 | 4e-04 | 2.0544 | 16.2998 | 31 | 959 | positive regulation of multicellular organismal process |
| GO:0014003 | 5e-04 | 8.8448 | 0.6544 | 5 | 36 | oligodendrocyte development |
| GO:0048536 | 5e-04 | 8.8448 | 0.6544 | 5 | 36 | spleen development |
| GO:0071392 | 5e-04 | 8.8448 | 0.6544 | 5 | 36 | cellular response to estradiol stimulus |
| GO:0030917 | 5e-04 | 27.274 | 0.1636 | 3 | 9 | midbrain-hindbrain boundary development |
| GO:0048664 | 5e-04 | 27.274 | 0.1636 | 3 | 9 | neuron fate determination |
| GO:0061004 | 5e-04 | 27.274 | 0.1636 | 3 | 9 | pattern specification involved in kidney development |
| GO:2000177 | 5e-04 | 5.5083 | 1.3997 | 7 | 77 | regulation of neural precursor cell proliferation |
| GO:0043586 | 5e-04 | 12.87 | 0.3817 | 4 | 21 | tongue development |
| GO:0043068 | 5e-04 | 2.2876 | 10.7428 | 23 | 591 | positive regulation of programmed cell death |
| GO:0007492 | 5e-04 | 5.4304 | 1.4178 | 7 | 78 | endoderm development |
| GO:0021877 | 6e-04 | 23.3762 | 0.1818 | 3 | 10 | forebrain neuron fate commitment |
| GO:0021515 | 7e-04 | 11.7821 | 0.4089 | 4 | 23 | cell differentiation in spinal cord |
| GO:0021532 | 7e-04 | 8.0629 | 0.7089 | 5 | 39 | neural tube patterning |
| GO:0045686 | 7e-04 | 11.5138 | 0.4181 | 4 | 23 | negative regulation of glial cell differentiation |
| GO:0042733 | 7e-04 | 6.1475 | 1.0834 | 6 | 60 | embryonic digit morphogenesis |
| GO:0048593 | 7e-04 | 4.4585 | 1.945 | 8 | 107 | camera-type eye morphogenesis |
| GO:0014032 | 8e-04 | 6.1053 | 1.0906 | 6 | 60 | neural crest cell development |
| GO:0030509 | 8e-04 | 6.0898 | 1.0921 | 6 | 61 | BMP signaling pathway |
| GO:1901861 | 8e-04 | 3.9799 | 2.4358 | 9 | 134 | regulation of muscle tissue development |
| GO:0009798 | 8e-04 | 5.0715 | 1.5087 | 7 | 83 | axis specification |
| GO:0072358 | 8e-04 | 2.1692 | 11.7971 | 24 | 649 | cardiovascular system development |
| GO:0048863 | 8e-04 | 2.9892 | 4.6352 | 13 | 255 | stem cell differentiation |
| GO:0072171 | 8e-04 | 5.994 | 1.1088 | 6 | 61 | mesonephric tubule morphogenesis |
| GO:0090009 | 9e-04 | 20.4529 | 0.2 | 3 | 11 | primitive streak formation |
| GO:0031326 | 9e-04 | 2.7443 | 5.9402 | 15 | 480 | regulation of cellular biosynthetic process |
| GO:0048634 | 9e-04 | 3.8859 | 2.4903 | 9 | 137 | regulation of muscle organ development |
| GO:0010033 | 0.001 | 1.5584 | 53.3505 | 75 | 2935 | response to organic substance |
| GO:0030901 | 0.001 | 4.878 | 1.5633 | 7 | 86 | midbrain development |
| GO:0003350 | 0.001 | 108.7577 | 0.0545 | 2 | 3 | pulmonary myocardium development |
| GO:0035880 | 0.001 | 108.7577 | 0.0545 | 2 | 3 | embryonic nail plate morphogenesis |
| GO:0035993 | 0.001 | 108.7577 | 0.0545 | 2 | 3 | deltoid tuberosity development |
| GO:0036023 | 0.001 | 108.7577 | 0.0545 | 2 | 3 | embryonic skeletal limb joint morphogenesis |
| GO:0048619 | 0.001 | 108.7577 | 0.0545 | 2 | 3 | embryonic hindgut morphogenesis |
| GO:0055014 | 0.001 | 108.7577 | 0.0545 | 2 | 3 | atrial cardiac muscle cell development |
| GO:0060741 | 0.001 | 108.7577 | 0.0545 | 2 | 3 | prostate gland stromal morphogenesis |
| GO:0061031 | 0.001 | 108.7577 | 0.0545 | 2 | 3 | endodermal digestive tract morphogenesis |
| GO:0090427 | 0.001 | 108.7577 | 0.0545 | 2 | 3 | activation of meiosis |
| GO:0140076 | 0.001 | 108.7577 | 0.0545 | 2 | 3 | negative regulation of lipoprotein transport |
| GO:1902869 | 0.001 | 108.7577 | 0.0545 | 2 | 3 | regulation of amacrine cell differentiation |
| GO:0001756 | 0.001 | 5.7829 | 1.1452 | 6 | 63 | somitogenesis |
| GO:0003148 | 0.001 | 10.416 | 0.4544 | 4 | 25 | outflow tract septum morphogenesis |
| GO:0060037 | 0.001 | 10.416 | 0.4544 | 4 | 25 | pharyngeal system development |
| GO:1900745 | 0.001 | 10.416 | 0.4544 | 4 | 25 | positive regulation of p38MAPK cascade |
| GO:0003198 | 0.0011 | 18.3011 | 0.2167 | 3 | 12 | epithelial to mesenchymal transition involved in endocardial cushion formation |
| GO:0048844 | 0.0012 | 5.5862 | 1.1815 | 6 | 65 | artery morphogenesis |
| GO:0055015 | 0.0012 | 18.1792 | 0.2181 | 3 | 12 | ventricular cardiac muscle cell development |
| GO:0060536 | 0.0012 | 18.1792 | 0.2181 | 3 | 12 | cartilage morphogenesis |
| GO:0021884 | 0.0012 | 9.9419 | 0.4726 | 4 | 26 | forebrain neuron development |
| GO:0043067 | 0.0012 | 1.9844 | 15.0976 | 28 | 868 | regulation of programmed cell death |
| GO:0060420 | 0.0012 | 5.4927 | 1.1997 | 6 | 66 | regulation of heart growth |
| GO:0035914 | 0.0014 | 5.4023 | 1.2179 | 6 | 67 | skeletal muscle cell differentiation |
| GO:0050768 | 0.0014 | 2.9605 | 4.308 | 12 | 237 | negative regulation of neurogenesis |
| GO:0061029 | 0.0015 | 16.3603 | 0.2363 | 3 | 13 | eyelid development in camera-type eye |
| GO:0071880 | 0.0015 | 16.3603 | 0.2363 | 3 | 13 | adenylate cyclase-activating adrenergic receptor signaling pathway |
| GO:0007167 | 0.0015 | 1.8837 | 17.5593 | 31 | 966 | enzyme linked receptor protein signaling pathway |
| GO:0055002 | 0.0016 | 3.5759 | 2.6902 | 9 | 148 | striated muscle cell development |
| GO:0010463 | 0.0016 | 6.5238 | 0.8543 | 5 | 47 | mesenchymal cell proliferation |
| GO:0010662 | 0.0016 | 6.5238 | 0.8543 | 5 | 47 | regulation of striated muscle cell apoptotic process |
| GO:0050433 | 0.0016 | 6.5238 | 0.8543 | 5 | 47 | regulation of catecholamine secretion |
| GO:0060043 | 0.0016 | 6.5238 | 0.8543 | 5 | 47 | regulation of cardiac muscle cell proliferation |
| GO:0050767 | 0.0016 | 2.4629 | 6.8869 | 16 | 388 | regulation of neurogenesis |
| GO:0007411 | 0.0016 | 3.2777 | 3.2488 | 10 | 182 | axon guidance |
| GO:0002062 | 0.0017 | 6.4437 | 0.8631 | 5 | 48 | chondrocyte differentiation |
| GO:0080090 | 0.0017 | 1.8453 | 22.0752 | 36 | 1784 | regulation of primary metabolic process |
| GO:0007218 | 0.0017 | 4.3767 | 1.7268 | 7 | 95 | neuropeptide signaling pathway |
| GO:0030855 | 0.0017 | 2.1136 | 11.0472 | 22 | 625 | epithelial cell differentiation |
| GO:0060563 | 0.0017 | 6.3717 | 0.8725 | 5 | 48 | neuroepithelial cell differentiation |
| GO:0010092 | 0.0018 | 8.7472 | 0.5271 | 4 | 29 | specification of animal organ identity |
| GO:0021772 | 0.0018 | 8.7472 | 0.5271 | 4 | 29 | olfactory bulb development |
| GO:0022037 | 0.0018 | 4.3272 | 1.745 | 7 | 96 | metencephalon development |
| GO:0021527 | 0.0019 | 14.872 | 0.2545 | 3 | 14 | spinal cord association neuron differentiation |
| GO:0021984 | 0.0019 | 14.872 | 0.2545 | 3 | 14 | adenohypophysis development |
| GO:0007188 | 0.0019 | 3.475 | 2.763 | 9 | 152 | adenylate cyclase-modulating G-protein coupled receptor signaling pathway |
| GO:0010171 | 0.0019 | 6.2265 | 0.8907 | 5 | 49 | body morphogenesis |
| GO:0050794 | 0.0019 | 1.638 | 68.9863 | 87 | 5305 | regulation of cellular process |
| GO:0003219 | 0.0019 | 54.3754 | 0.0727 | 2 | 4 | cardiac right ventricle formation |
| GO:0007198 | 0.0019 | 54.3754 | 0.0727 | 2 | 4 | adenylate cyclase-inhibiting serotonin receptor signaling pathway |
| GO:0021557 | 0.0019 | 54.3754 | 0.0727 | 2 | 4 | oculomotor nerve development |
| GO:0021764 | 0.0019 | 54.3754 | 0.0727 | 2 | 4 | amygdala development |
| GO:0032811 | 0.0019 | 54.3754 | 0.0727 | 2 | 4 | negative regulation of epinephrine secretion |
| GO:0035625 | 0.0019 | 54.3754 | 0.0727 | 2 | 4 | epidermal growth factor-activated receptor transactivation by G-protein coupled receptor signaling pathway |
| GO:0061325 | 0.0019 | 54.3754 | 0.0727 | 2 | 4 | cell proliferation involved in outflow tract morphogenesis |
| GO:0070253 | 0.0019 | 54.3754 | 0.0727 | 2 | 4 | somatostatin secretion |
| GO:0072086 | 0.0019 | 54.3754 | 0.0727 | 2 | 4 | specification of loop of Henle identity |
| GO:2000563 | 0.0019 | 54.3754 | 0.0727 | 2 | 4 | positive regulation of CD4-positive, alpha-beta T cell proliferation |
| GO:0015844 | 0.002 | 4.9915 | 1.3088 | 6 | 72 | monoamine transport |
| GO:0001707 | 0.0021 | 4.9167 | 1.3269 | 6 | 73 | mesoderm formation |
| GO:0035265 | 0.0021 | 3.4029 | 2.8175 | 9 | 155 | organ growth |
| GO:0071383 | 0.0021 | 2.7964 | 4.5443 | 12 | 250 | cellular response to steroid hormone stimulus |
| GO:0097746 | 0.0021 | 3.7361 | 2.2903 | 8 | 126 | regulation of blood vessel diameter |
| GO:0048608 | 0.0022 | 2.4637 | 6.4375 | 15 | 358 | reproductive structure development |
| GO:0055006 | 0.0023 | 4.8441 | 1.3451 | 6 | 74 | cardiac cell development |
| GO:0007379 | 0.0023 | 13.6318 | 0.2727 | 3 | 15 | segment specification |
| GO:0021542 | 0.0023 | 13.6318 | 0.2727 | 3 | 15 | dentate gyrus development |
| GO:0072498 | 0.0023 | 13.6318 | 0.2727 | 3 | 15 | embryonic skeletal joint development |
| GO:0072175 | 0.0024 | 3.6734 | 2.3267 | 8 | 128 | epithelial tube formation |
| GO:0043009 | 0.0024 | 2.5269 | 5.8601 | 14 | 356 | chordate embryonic development |
| GO:0071559 | 0.0024 | 2.9001 | 4.0172 | 11 | 221 | response to transforming growth factor beta |
| GO:0014013 | 0.0024 | 4.0957 | 1.8359 | 7 | 101 | regulation of gliogenesis |
| GO:0043066 | 0.0026 | 2.0423 | 11.4094 | 22 | 652 | negative regulation of apoptotic process |
| GO:0043500 | 0.0027 | 4.0099 | 1.8723 | 7 | 103 | muscle adaptation |
| GO:0060541 | 0.0027 | 3.0368 | 3.49 | 10 | 192 | respiratory system development |
| GO:0030326 | 0.0028 | 7.6178 | 0.5921 | 4 | 34 | embryonic limb morphogenesis |
| GO:0003222 | 0.0028 | 12.5825 | 0.2908 | 3 | 16 | ventricular trabecula myocardium morphogenesis |
| GO:0014706 | 0.0028 | 3.026 | 3.5009 | 10 | 201 | striated muscle tissue development |
| GO:0043524 | 0.0029 | 3.554 | 2.3994 | 8 | 132 | negative regulation of neuron apoptotic process |
| GO:0021953 | 0.003 | 4.5584 | 1.4186 | 6 | 83 | central nervous system neuron differentiation |
| GO:0045761 | 0.0031 | 4.5109 | 1.436 | 6 | 79 | regulation of adenylate cyclase activity |
| GO:0002568 | 0.0032 | 36.248 | 0.0909 | 2 | 5 | somatic diversification of T cell receptor genes |
| GO:0015870 | 0.0032 | 36.248 | 0.0909 | 2 | 5 | acetylcholine transport |
| GO:0021523 | 0.0032 | 36.248 | 0.0909 | 2 | 5 | somatic motor neuron differentiation |
| GO:0033153 | 0.0032 | 36.248 | 0.0909 | 2 | 5 | T cell receptor V(D)J recombination |
| GO:0043415 | 0.0032 | 36.248 | 0.0909 | 2 | 5 | positive regulation of skeletal muscle tissue regeneration |
| GO:0048625 | 0.0032 | 36.248 | 0.0909 | 2 | 5 | myoblast fate commitment |
| GO:0060023 | 0.0032 | 36.248 | 0.0909 | 2 | 5 | soft palate development |
| GO:0061056 | 0.0032 | 36.248 | 0.0909 | 2 | 5 | sclerotome development |
| GO:0070172 | 0.0032 | 36.248 | 0.0909 | 2 | 5 | positive regulation of tooth mineralization |
| GO:0070487 | 0.0032 | 36.248 | 0.0909 | 2 | 5 | monocyte aggregation |
| GO:0071376 | 0.0032 | 36.248 | 0.0909 | 2 | 5 | cellular response to corticotropin-releasing hormone stimulus |
| GO:1905007 | 0.0032 | 36.248 | 0.0909 | 2 | 5 | positive regulation of epithelial to mesenchymal transition involved in endocardial cushion formation |
| GO:0001658 | 0.0032 | 5.4772 | 0.9998 | 5 | 55 | branching involved in ureteric bud morphogenesis |
| GO:0048857 | 0.0032 | 5.4772 | 0.9998 | 5 | 55 | neural nucleus development |
| GO:0072132 | 0.0032 | 11.8686 | 0.3043 | 3 | 17 | mesenchyme morphogenesis |
| GO:0030534 | 0.0033 | 3.4694 | 2.4539 | 8 | 135 | adult behavior |
| GO:0035150 | 0.0033 | 3.4694 | 2.4539 | 8 | 135 | regulation of tube size |
| GO:0021871 | 0.0033 | 11.7599 | 0.3071 | 3 | 17 | forebrain regionalization |
| GO:0071294 | 0.0033 | 11.683 | 0.309 | 3 | 17 | cellular response to zinc ion |
| GO:0016331 | 0.0035 | 3.4378 | 2.4746 | 8 | 137 | morphogenesis of embryonic epithelium |
| GO:0061351 | 0.0035 | 5.3541 | 1.0197 | 5 | 57 | neural precursor cell proliferation |
| GO:0001667 | 0.0035 | 2.4156 | 6.1076 | 14 | 336 | ameboidal-type cell migration |
| GO:0002065 | 0.0035 | 5.3438 | 1.0216 | 5 | 57 | columnar/cuboidal epithelial cell differentiation |
| GO:0042596 | 0.0036 | 7.0515 | 0.6362 | 4 | 35 | fear response |
| GO:0007369 | 0.0037 | 3.117 | 3.0577 | 9 | 171 | gastrulation |
| GO:0045778 | 0.0038 | 4.332 | 1.4905 | 6 | 82 | positive regulation of ossification |
| GO:0055024 | 0.0038 | 4.332 | 1.4905 | 6 | 82 | regulation of cardiac muscle tissue development |
| GO:0021766 | 0.0038 | 5.2163 | 1.0445 | 5 | 58 | hippocampus development |
| GO:0097659 | 0.004 | 1.7374 | 21.3418 | 34 | 1586 | nucleic acid-templated transcription |
| GO:0048644 | 0.004 | 4.2755 | 1.5087 | 6 | 83 | muscle organ morphogenesis |
| GO:0021536 | 0.0042 | 10.5927 | 0.3336 | 3 | 19 | diencephalon development |
| GO:0003407 | 0.0043 | 6.6848 | 0.6666 | 4 | 37 | neural retina development |
| GO:0040008 | 0.0044 | 1.9758 | 11.1972 | 21 | 616 | regulation of growth |
| GO:0021545 | 0.0044 | 10.3837 | 0.3401 | 3 | 19 | cranial nerve development |
| GO:0010556 | 0.0045 | 2.5597 | 5.0076 | 12 | 406 | regulation of macromolecule biosynthetic process |
| GO:0030510 | 0.0045 | 4.1667 | 1.5451 | 6 | 85 | regulation of BMP signaling pathway |
| GO:0021543 | 0.0045 | 4.1619 | 1.5455 | 6 | 87 | pallium development |
| GO:0072087 | 0.0046 | 10.2213 | 0.3454 | 3 | 19 | renal vesicle development |
| GO:0003211 | 0.0046 | 27.3677 | 0.1084 | 2 | 6 | cardiac ventricle formation |
| GO:0003278 | 0.0047 | 27.1843 | 0.1091 | 2 | 6 | apoptotic process involved in heart morphogenesis |
| GO:0014062 | 0.0047 | 27.1843 | 0.1091 | 2 | 6 | regulation of serotonin secretion |
| GO:0021546 | 0.0047 | 27.1843 | 0.1091 | 2 | 6 | rhombomere development |
| GO:0061312 | 0.0047 | 27.1843 | 0.1091 | 2 | 6 | BMP signaling pathway involved in heart development |
| GO:0072210 | 0.0047 | 6.4726 | 0.6861 | 4 | 38 | metanephric nephron development |
| GO:0045597 | 0.0047 | 2.2538 | 7.006 | 15 | 403 | positive regulation of cell differentiation |
| GO:0055017 | 0.0048 | 4.1144 | 1.5633 | 6 | 86 | cardiac muscle tissue growth |
| GO:0045444 | 0.0048 | 2.7886 | 3.7809 | 10 | 208 | fat cell differentiation |
| GO:0046632 | 0.0051 | 4.0633 | 1.5814 | 6 | 87 | alpha-beta T cell differentiation |
| GO:0072073 | 0.0051 | 6.3394 | 0.6986 | 4 | 39 | kidney epithelium development |
| GO:0022612 | 0.0053 | 3.5288 | 2.1086 | 7 | 116 | gland morphogenesis |
| GO:0032924 | 0.0053 | 6.2441 | 0.7089 | 4 | 39 | activin receptor signaling pathway |
| GO:0043576 | 0.0054 | 9.6195 | 0.3635 | 3 | 20 | regulation of respiratory gaseous exchange |
| GO:0040011 | 0.0054 | 2.7428 | 3.8467 | 10 | 227 | locomotion |
| GO:0045787 | 0.0056 | 2.2782 | 6.453 | 14 | 355 | positive regulation of cell cycle |
| GO:0055008 | 0.0061 | 4.6391 | 1.1633 | 5 | 64 | cardiac muscle tissue morphogenesis |
| GO:0002052 | 0.0062 | 9.0845 | 0.3817 | 3 | 21 | positive regulation of neuroblast proliferation |
| GO:0010842 | 0.0062 | 9.0845 | 0.3817 | 3 | 21 | retina layer formation |
| GO:0015874 | 0.0062 | 9.0845 | 0.3817 | 3 | 21 | norepinephrine transport |
| GO:0031290 | 0.0062 | 9.0845 | 0.3817 | 3 | 21 | retinal ganglion cell axon guidance |
| GO:0051043 | 0.0062 | 9.0845 | 0.3817 | 3 | 21 | regulation of membrane protein ectodomain proteolysis |
| GO:2000291 | 0.0062 | 9.0845 | 0.3817 | 3 | 21 | regulation of myoblast proliferation |
| GO:0035136 | 0.0062 | 22.2434 | 0.1245 | 2 | 7 | forelimb morphogenesis |
| GO:0021795 | 0.0064 | 5.9058 | 0.7453 | 4 | 41 | cerebral cortex cell migration |
| GO:0003253 | 0.0065 | 21.7461 | 0.1272 | 2 | 7 | cardiac neural crest cell migration involved in outflow tract morphogenesis |
| GO:0010700 | 0.0065 | 21.7461 | 0.1272 | 2 | 7 | negative regulation of norepinephrine secretion |
| GO:0021798 | 0.0065 | 21.7461 | 0.1272 | 2 | 7 | forebrain dorsal/ventral pattern formation |
| GO:0035726 | 0.0065 | 21.7461 | 0.1272 | 2 | 7 | common myeloid progenitor cell proliferation |
| GO:0048752 | 0.0065 | 21.7461 | 0.1272 | 2 | 7 | semicircular canal morphogenesis |
| GO:0060017 | 0.0065 | 21.7461 | 0.1272 | 2 | 7 | parathyroid gland development |
| GO:0060430 | 0.0065 | 21.7461 | 0.1272 | 2 | 7 | lung saccule development |
| GO:0060684 | 0.0065 | 21.7461 | 0.1272 | 2 | 7 | epithelial-mesenchymal cell signaling |
| GO:0072161 | 0.0065 | 21.7461 | 0.1272 | 2 | 7 | mesenchymal cell differentiation involved in kidney development |
| GO:0072177 | 0.0065 | 21.7461 | 0.1272 | 2 | 7 | mesonephric duct development |
| GO:1902866 | 0.0065 | 21.7461 | 0.1272 | 2 | 7 | regulation of retina development in camera-type eye |
| GO:2000049 | 0.0065 | 21.7461 | 0.1272 | 2 | 7 | positive regulation of cell-cell adhesion mediated by cadherin |
| GO:2000271 | 0.0065 | 21.7461 | 0.1272 | 2 | 7 | positive regulation of fibroblast apoptotic process |
| GO:0002088 | 0.0069 | 4.4864 | 1.1997 | 5 | 66 | lens development in camera-type eye |
| GO:0050795 | 0.0069 | 4.4864 | 1.1997 | 5 | 66 | regulation of behavior |
| GO:0001657 | 0.007 | 3.7816 | 1.6905 | 6 | 93 | ureteric bud development |
| GO:0008045 | 0.0071 | 8.6058 | 0.3999 | 3 | 22 | motor neuron axon guidance |
| GO:0051953 | 0.0071 | 8.6058 | 0.3999 | 3 | 22 | negative regulation of amine transport |
| GO:2000679 | 0.0071 | 8.6058 | 0.3999 | 3 | 22 | positive regulation of transcription regulatory region DNA binding |
| GO:0070887 | 0.0072 | 1.4327 | 52.1326 | 69 | 2868 | cellular response to chemical stimulus |
| GO:0072163 | 0.0073 | 3.7384 | 1.7087 | 6 | 94 | mesonephric epithelium development |
| GO:0023061 | 0.0074 | 2.1352 | 7.3618 | 15 | 405 | signal release |
| GO:0009888 | 0.0076 | 2.2762 | 6.0115 | 13 | 398 | tissue development |
| GO:0050678 | 0.0077 | 2.3535 | 5.3441 | 12 | 294 | regulation of epithelial cell proliferation |
| GO:0003018 | 0.0078 | 2.9732 | 2.8357 | 8 | 156 | vascular process in circulatory system |
| GO:0014855 | 0.0079 | 4.3435 | 1.2361 | 5 | 68 | striated muscle cell proliferation |
| GO:0009755 | 0.008 | 2.5775 | 4.0717 | 10 | 224 | hormone-mediated signaling pathway |
| GO:0043410 | 0.0081 | 2.0076 | 8.8705 | 17 | 488 | positive regulation of MAPK cascade |
| GO:0090100 | 0.0085 | 3.6145 | 1.7632 | 6 | 97 | positive regulation of transmembrane receptor protein serine/threonine kinase signaling pathway |
| GO:0030879 | 0.0086 | 3.2031 | 2.3085 | 7 | 127 | mammary gland development |
| GO:0002072 | 0.0086 | 18.1206 | 0.1454 | 2 | 8 | optic cup morphogenesis involved in camera-type eye development |
| GO:0042756 | 0.0086 | 18.1206 | 0.1454 | 2 | 8 | drinking behavior |
| GO:0048793 | 0.0086 | 18.1206 | 0.1454 | 2 | 8 | pronephros development |
| GO:0061525 | 0.0086 | 18.1206 | 0.1454 | 2 | 8 | hindgut development |
| GO:0072610 | 0.0086 | 18.1206 | 0.1454 | 2 | 8 | interleukin-12 secretion |
| GO:0048545 | 0.0088 | 3.185 | 2.3201 | 7 | 131 | response to steroid hormone |
| GO:0030512 | 0.0089 | 4.2093 | 1.2724 | 5 | 70 | negative regulation of transforming growth factor beta receptor signaling pathway |
| GO:0031018 | 0.0089 | 5.3283 | 0.818 | 4 | 45 | endocrine pancreas development |
| GO:0048538 | 0.0089 | 5.3283 | 0.818 | 4 | 45 | thymus development |
| GO:0071901 | 0.0089 | 3.1764 | 2.3267 | 7 | 128 | negative regulation of protein serine/threonine kinase activity |
| GO:0003151 | 0.009 | 5.3033 | 0.8206 | 4 | 46 | outflow tract morphogenesis |
| GO:0060914 | 0.0091 | 7.7852 | 0.4363 | 3 | 24 | heart formation |
| GO:0072202 | 0.0091 | 7.7852 | 0.4363 | 3 | 24 | cell differentiation involved in metanephros development |
| GO:0090276 | 0.0092 | 2.6789 | 3.5264 | 9 | 194 | regulation of peptide hormone secretion |
| GO:0030818 | 0.0096 | 5.2011 | 0.8362 | 4 | 46 | negative regulation of cAMP biosynthetic process |
| GO:0032330 | 0.0096 | 5.2011 | 0.8362 | 4 | 46 | regulation of chondrocyte differentiation |
| GO:0048806 | 0.0096 | 5.2011 | 0.8362 | 4 | 46 | genitalia development |
| GO:0043433 | 0.0097 | 3.1244 | 2.3631 | 7 | 130 | negative regulation of DNA binding transcription factor activity |
| GO:0035710 | 0.01 | 4.0831 | 1.3088 | 5 | 72 | CD4-positive, alpha-beta T cell activation |
| GO:1900543 | 0.01 | 4.0831 | 1.3088 | 5 | 72 | negative regulation of purine nucleotide metabolic process |
| GOMFID | Pvalue | OddsRatio | ExpCount | Count | Size | Term |
| GO:0045944 | 0 | 6.3718 | 22.264 | 99 | 1069 | positive regulation of transcription from RNA polymerase II promoter |
| GO:0009889 | 0 | 4.178 | 90.2014 | 201 | 4331 | regulation of biosynthetic process |
| GO:1903508 | 0 | 5.3648 | 28.5329 | 107 | 1370 | positive regulation of nucleic acid-templated transcription |
| GO:0051254 | 0 | 5.2026 | 30.0116 | 109 | 1441 | positive regulation of RNA metabolic process |
| GO:0010557 | 0 | 4.6561 | 33.3647 | 110 | 1602 | positive regulation of macromolecule biosynthetic process |
| GO:0010628 | 0 | 4.4074 | 36.6345 | 114 | 1759 | positive regulation of gene expression |
| GO:0009790 | 0 | 6.0927 | 16.4497 | 75 | 813 | embryo development |
| GO:0031328 | 0 | 4.3507 | 36.1764 | 112 | 1737 | positive regulation of cellular biosynthetic process |
| GO:0034654 | 0 | 3.5015 | 84.9946 | 180 | 4081 | nucleobase-containing compound biosynthetic process |
| GO:0009952 | 0 | 21.7253 | 1.8593 | 27 | 94 | anterior/posterior pattern specification |
| GO:0000122 | 0 | 5.1148 | 15.7868 | 64 | 758 | negative regulation of transcription from RNA polymerase II promoter |
| GO:0060322 | 0 | 5.2805 | 14.2456 | 60 | 684 | head development |
| GO:1902679 | 0 | 4.1932 | 23.7219 | 78 | 1139 | negative regulation of RNA biosynthetic process |
| GO:0051173 | 0 | 3.0141 | 58.9402 | 129 | 2830 | positive regulation of nitrogen compound metabolic process |
| GO:0045934 | 0 | 3.7123 | 28.4079 | 83 | 1364 | negative regulation of nucleobase-containing compound metabolic process |
| GO:2001141 | 0 | 3.4616 | 40.2492 | 99 | 2336 | regulation of RNA biosynthetic process |
| GO:0032502 | 0 | 4.0088 | 36.7951 | 90 | 2692 | developmental process |
| GO:0048736 | 0 | 10.4834 | 3.5406 | 29 | 170 | appendage development |
| GO:0090596 | 0 | 8.2322 | 5.1442 | 34 | 247 | sensory organ morphogenesis |
| GO:0019219 | 0 | 3.0856 | 45.665 | 101 | 2662 | regulation of nucleobase-containing compound metabolic process |
| GO:0007275 | 0 | 3.5394 | 35.8048 | 85 | 2567 | multicellular organism development |
| GO:0034641 | 0 | 2.391 | 131.0221 | 202 | 6291 | cellular nitrogen compound metabolic process |
| GO:0006725 | 0 | 2.3654 | 119.4632 | 189 | 5736 | cellular aromatic compound metabolic process |
| GO:0022008 | 0 | 4.1852 | 14.3956 | 50 | 754 | neurogenesis |
| GO:0007156 | 0 | 9.4126 | 3.1657 | 24 | 152 | homophilic cell adhesion via plasma membrane adhesion molecules |
| GO:0046483 | 0 | 2.3313 | 118.7134 | 187 | 5700 | heterocycle metabolic process |
| GO:0060255 | 0 | 2.8635 | 55.0258 | 108 | 3233 | regulation of macromolecule metabolic process |
| GO:1901360 | 0 | 2.3168 | 123.8368 | 192 | 5946 | organic cyclic compound metabolic process |
| GO:0048513 | 0 | 2.8394 | 41.8416 | 91 | 2372 | animal organ development |
| GO:0050789 | 0 | 2.8331 | 193.754 | 252 | 9806 | regulation of biological process |
| GO:0048562 | 0 | 9.4618 | 2.8592 | 22 | 148 | embryonic organ morphogenesis |
| GO:0009653 | 0 | 6.039 | 6.1847 | 31 | 372 | anatomical structure morphogenesis |
| GO:0043583 | 0 | 7.0109 | 4.2487 | 25 | 204 | ear development |
| GO:0010605 | 0 | 2.4566 | 54.1083 | 106 | 2598 | negative regulation of macromolecule metabolic process |
| GO:0016339 | 0 | 31.411 | 0.5832 | 11 | 28 | calcium-dependent cell-cell adhesion via plasma membrane cell adhesion molecules |
| GO:0048522 | 0 | 2.3879 | 57.9936 | 105 | 3210 | positive regulation of cellular process |
| GO:0007416 | 0 | 7.8278 | 2.8949 | 19 | 139 | synapse assembly |
| GO:0007417 | 0 | 3.7294 | 12.0627 | 39 | 635 | central nervous system development |
| GO:0048704 | 0 | 16.5818 | 0.9787 | 12 | 48 | embryonic skeletal system morphogenesis |
| GO:0003002 | 0 | 11.538 | 1.4973 | 14 | 84 | regionalization |
| GO:0001764 | 0 | 7.6495 | 2.7908 | 18 | 134 | neuron migration |
| GO:0051241 | 0 | 2.8602 | 21.7649 | 54 | 1051 | negative regulation of multicellular organismal process |
| GO:0007267 | 0 | 2.8281 | 22.548 | 55 | 1115 | cell-cell signaling |
| GO:0048565 | 0 | 7.788 | 2.5883 | 17 | 125 | digestive tract development |
| GO:2000026 | 0 | 2.5228 | 31.1772 | 67 | 1578 | regulation of multicellular organismal development |
| GO:0098609 | 0 | 3.0817 | 16.245 | 44 | 780 | cell-cell adhesion |
| GO:0060537 | 0 | 5.2284 | 4.8058 | 22 | 238 | muscle tissue development |
| GO:0097659 | 0 | 2.4802 | 35.0075 | 70 | 2252 | nucleic acid-templated transcription |
| GO:0060581 | 0 | 41.9868 | 0.3124 | 7 | 15 | cell fate commitment involved in pattern specification |
| GO:0035115 | 0 | 18.873 | 0.6665 | 9 | 32 | embryonic forelimb morphogenesis |
| GO:0021514 | 0 | 33.5852 | 0.3541 | 7 | 17 | ventral spinal cord interneuron differentiation |
| GO:0060562 | 0 | 6.979 | 2.4951 | 15 | 124 | epithelial tube morphogenesis |
| GO:0071542 | 0 | 16.0729 | 0.7498 | 9 | 36 | dopaminergic neuron differentiation |
| GO:0008284 | 0 | 2.8099 | 16.8035 | 42 | 822 | positive regulation of cell proliferation |
| GO:0048729 | 0 | 3.4644 | 9.6914 | 30 | 491 | tissue morphogenesis |
| GO:0045596 | 0 | 3.154 | 12.0516 | 34 | 589 | negative regulation of cell differentiation |
| GO:0061564 | 0 | 3.4912 | 9.268 | 29 | 445 | axon development |
| GO:0001756 | 0 | 10.2464 | 1.3121 | 11 | 63 | somitogenesis |
| GO:0048557 | 0 | 27.9841 | 0.3957 | 7 | 19 | embryonic digestive tract morphogenesis |
| GO:0035116 | 0 | 19.2376 | 0.5832 | 8 | 28 | embryonic hindlimb morphogenesis |
| GO:0060021 | 0 | 8.3936 | 1.6936 | 12 | 82 | palate development |
| GO:0061138 | 0 | 5.6373 | 3.2239 | 16 | 156 | morphogenesis of a branching epithelium |
| GO:0007399 | 0 | 4.6739 | 4.5872 | 19 | 307 | nervous system development |
| GO:0001654 | 0 | 3.7917 | 7.0395 | 24 | 338 | eye development |
| GO:0048468 | 0 | 2.4896 | 21.8734 | 48 | 1152 | cell development |
| GO:0048870 | 0 | 2.2631 | 29.5117 | 59 | 1417 | cell motility |
| GO:0021513 | 0 | 22.3831 | 0.4582 | 7 | 22 | spinal cord dorsal/ventral patterning |
| GO:0007517 | 0 | 4.6009 | 4.6232 | 19 | 231 | muscle organ development |
| GO:0071772 | 0 | 5.4721 | 3.3115 | 16 | 159 | response to BMP |
| GO:0007498 | 0 | 6.3741 | 2.5201 | 14 | 121 | mesoderm development |
| GO:0048646 | 0 | 2.6758 | 16.7112 | 40 | 859 | anatomical structure formation involved in morphogenesis |
| GO:0061333 | 0 | 8.5883 | 1.5204 | 11 | 73 | renal tubule morphogenesis |
| GO:0051962 | 0 | 3.279 | 9.4554 | 28 | 454 | positive regulation of nervous system development |
| GO:0051094 | 0 | 2.8023 | 14.3274 | 36 | 738 | positive regulation of developmental process |
| GO:0016331 | 0 | 5.6303 | 3.0199 | 15 | 145 | morphogenesis of embryonic epithelium |
| GO:0030878 | 0 | 19.7473 | 0.4998 | 7 | 24 | thyroid gland development |
| GO:0061458 | 0 | 3.3924 | 8.4766 | 26 | 407 | reproductive system development |
| GO:0048665 | 0 | 29.4854 | 0.3247 | 6 | 16 | neuron fate specification |
| GO:0043067 | 0 | 2.1889 | 30.3865 | 59 | 1459 | regulation of programmed cell death |
| GO:0060548 | 0 | 2.5045 | 19.0983 | 43 | 917 | negative regulation of cell death |
| GO:0048536 | 0 | 13.7342 | 0.7498 | 8 | 36 | spleen development |
| GO:0007268 | 0 | 2.9005 | 12.1837 | 32 | 585 | chemical synaptic transmission |
| GO:0048706 | 0 | 17.778 | 0.5321 | 7 | 27 | embryonic skeletal system development |
| GO:0099537 | 0 | 2.8897 | 12.2254 | 32 | 587 | trans-synaptic signaling |
| GO:0048667 | 0 | 3.0525 | 10.4759 | 29 | 503 | cell morphogenesis involved in neuron differentiation |
| GO:0045666 | 0 | 3.7063 | 6.5605 | 22 | 315 | positive regulation of neuron differentiation |
| GO:0021983 | 0 | 16.9238 | 0.5578 | 7 | 27 | pituitary gland development |
| GO:0021602 | 0 | 16.782 | 0.5623 | 7 | 27 | cranial nerve morphogenesis |
| GO:0048634 | 0 | 5.5393 | 2.8533 | 14 | 137 | regulation of muscle organ development |
| GO:0042472 | 0 | 8.467 | 1.3933 | 10 | 68 | inner ear morphogenesis |
| GO:0072080 | 0 | 8.3905 | 1.4054 | 10 | 68 | nephron tubule development |
| GO:0003206 | 0 | 5.8456 | 2.5201 | 13 | 121 | cardiac chamber morphogenesis |
| GO:2000543 | 0 | 39.7523 | 0.2291 | 5 | 11 | positive regulation of gastrulation |
| GO:0042474 | 0 | 22.0732 | 0.3957 | 6 | 19 | middle ear morphogenesis |
| GO:0072079 | 0 | 22.0732 | 0.3957 | 6 | 19 | nephron tubule formation |
| GO:0071495 | 0 | 2.2113 | 25.6796 | 51 | 1233 | cellular response to endogenous stimulus |
| GO:0060993 | 0 | 7 | 1.8119 | 11 | 87 | kidney morphogenesis |
| GO:0048593 | 0 | 6.9656 | 1.8186 | 11 | 88 | camera-type eye morphogenesis |
| GO:0060349 | 0 | 6.9087 | 1.8328 | 11 | 88 | bone morphogenesis |
| GO:0035050 | 0 | 7.7837 | 1.4995 | 10 | 72 | embryonic heart tube development |
| GO:0048863 | 0 | 4.0411 | 4.918 | 18 | 238 | stem cell differentiation |
| GO:0021854 | 0 | 20.4953 | 0.4165 | 6 | 20 | hypothalamus development |
| GO:0071363 | 0 | 2.7073 | 12.9752 | 32 | 623 | cellular response to growth factor stimulus |
| GO:0048701 | 0 | 10.6768 | 0.9164 | 8 | 44 | embryonic cranial skeleton morphogenesis |
| GO:0072089 | 0 | 5.8126 | 2.3326 | 12 | 112 | stem cell proliferation |
| GO:0014032 | 0 | 8.4963 | 1.2496 | 9 | 60 | neural crest cell development |
| GO:0060429 | 0 | 3.4513 | 6.6916 | 21 | 365 | epithelium development |
| GO:0007411 | 0 | 4.2767 | 4.1338 | 16 | 200 | axon guidance |
| GO:0009059 | 0 | 1.9092 | 53.8359 | 84 | 3454 | macromolecule biosynthetic process |
| GO:1901861 | 0 | 5.2132 | 2.7908 | 13 | 134 | regulation of muscle tissue development |
| GO:0010467 | 0 | 1.9148 | 53.1402 | 83 | 3433 | gene expression |
| GO:0030154 | 0 | 2.8566 | 11.0667 | 28 | 743 | cell differentiation |
| GO:0045995 | 0 | 5.5341 | 2.4367 | 12 | 117 | regulation of embryonic development |
| GO:0003357 | 0 | 63.4251 | 0.1458 | 4 | 7 | noradrenergic neuron differentiation |
| GO:0048523 | 0 | 1.9097 | 46.2439 | 75 | 2637 | negative regulation of cellular process |
| GO:0048812 | 0 | 2.7201 | 11.6422 | 29 | 559 | neuron projection morphogenesis |
| GO:0042475 | 0 | 6.6984 | 1.7078 | 10 | 82 | odontogenesis of dentin-containing tooth |
| GO:0048514 | 0 | 2.7407 | 11.1424 | 28 | 535 | blood vessel morphogenesis |
| GO:0007379 | 0 | 23.8453 | 0.3124 | 5 | 15 | segment specification |
| GO:0021542 | 0 | 23.8453 | 0.3124 | 5 | 15 | dentate gyrus development |
| GO:0035914 | 0 | 7.4676 | 1.3954 | 9 | 67 | skeletal muscle cell differentiation |
| GO:0010720 | 0 | 2.8645 | 9.5 | 25 | 460 | positive regulation of cell development |
| GO:0048858 | 0 | 2.6326 | 11.9963 | 29 | 576 | cell projection morphogenesis |
| GO:0021517 | 0 | 14.6409 | 0.5308 | 6 | 26 | ventral spinal cord development |
| GO:0009954 | 0 | 14.5152 | 0.5353 | 6 | 26 | proximal/distal pattern formation |
| GO:0072359 | 0 | 2.2284 | 20.1605 | 41 | 968 | circulatory system development |
| GO:0072088 | 0 | 8.6067 | 1.0952 | 8 | 53 | nephron epithelium morphogenesis |
| GO:0072048 | 0 | 38.0503 | 0.1874 | 4 | 9 | renal system pattern specification |
| GO:0007368 | 0 | 5.2071 | 2.3534 | 11 | 113 | determination of left/right symmetry |
| GO:0042693 | 0 | 18.3391 | 0.3749 | 5 | 18 | muscle cell fate commitment |
| GO:0022610 | 0 | 1.997 | 27.5124 | 50 | 1321 | biological adhesion |
| GO:0001656 | 0 | 9.2673 | 0.8969 | 7 | 44 | metanephros development |
| GO:0060041 | 0 | 4.6805 | 2.8325 | 12 | 136 | retina development in camera-type eye |
| GO:0007218 | 0 | 5.6693 | 1.9786 | 10 | 95 | neuropeptide signaling pathway |
| GO:0022612 | 0 | 5.0574 | 2.4159 | 11 | 116 | gland morphogenesis |
| GO:0021953 | 0 | 6.2635 | 1.6191 | 9 | 83 | central nervous system neuron differentiation |
| GO:0021520 | 0 | 31.8956 | 0.2071 | 4 | 10 | spinal cord motor neuron cell fate specification |
| GO:0021913 | 0 | 142.2985 | 0.0833 | 3 | 4 | regulation of transcription from RNA polymerase II promoter involved in ventral spinal cord interneuron specification |
| GO:0034287 | 0 | 142.2985 | 0.0833 | 3 | 4 | detection of monosaccharide stimulus |
| GO:0051594 | 0 | 142.2985 | 0.0833 | 3 | 4 | detection of glucose |
| GO:0072086 | 0 | 142.2985 | 0.0833 | 3 | 4 | specification of loop of Henle identity |
| GO:0072171 | 0 | 7.2444 | 1.2704 | 8 | 61 | mesonephric tubule morphogenesis |
| GO:0031018 | 0 | 8.8226 | 0.9372 | 7 | 45 | endocrine pancreas development |
| GO:0008285 | 0 | 2.4079 | 13.4959 | 30 | 653 | negative regulation of cell proliferation |
| GO:1901700 | 0 | 1.9081 | 31.1154 | 54 | 1494 | response to oxygen-containing compound |
| GO:0060325 | 0 | 11.0276 | 0.6665 | 6 | 32 | face morphogenesis |
| GO:0023019 | 0 | 15.8919 | 0.4165 | 5 | 20 | signal transduction involved in regulation of gene expression |
| GO:0006935 | 0 | 2.4967 | 11.6839 | 27 | 561 | chemotaxis |
| GO:0009799 | 1e-04 | 4.7392 | 2.5617 | 11 | 123 | specification of symmetry |
| GO:0048762 | 1e-04 | 8.2427 | 0.9895 | 7 | 49 | mesenchymal cell differentiation |
| GO:0090009 | 1e-04 | 27.1754 | 0.2291 | 4 | 11 | primitive streak formation |
| GO:0060840 | 1e-04 | 5.8471 | 1.7286 | 9 | 83 | artery development |
| GO:0043586 | 1e-04 | 14.8977 | 0.4374 | 5 | 21 | tongue development |
| GO:0048485 | 1e-04 | 14.8977 | 0.4374 | 5 | 21 | sympathetic nervous system development |
| GO:0051240 | 1e-04 | 2.1683 | 18.099 | 36 | 947 | positive regulation of multicellular organismal process |
| GO:0030901 | 1e-04 | 5.6182 | 1.7911 | 9 | 86 | midbrain development |
| GO:0072175 | 1e-04 | 4.5352 | 2.6658 | 11 | 128 | epithelial tube formation |
| GO:0040007 | 1e-04 | 2.1146 | 18.9525 | 37 | 910 | growth |
| GO:0021515 | 1e-04 | 13.6352 | 0.4657 | 5 | 23 | cell differentiation in spinal cord |
| GO:0030182 | 1e-04 | 2.516 | 10.7635 | 25 | 605 | neuron differentiation |
| GO:0002568 | 1e-04 | 71.1448 | 0.1041 | 3 | 5 | somatic diversification of T cell receptor genes |
| GO:0033153 | 1e-04 | 71.1448 | 0.1041 | 3 | 5 | T cell receptor V(D)J recombination |
| GO:0061009 | 1e-04 | 71.1448 | 0.1041 | 3 | 5 | common bile duct development |
| GO:0045665 | 1e-04 | 3.835 | 3.6866 | 13 | 178 | negative regulation of neuron differentiation |
| GO:0045686 | 1e-04 | 13.2407 | 0.479 | 5 | 23 | negative regulation of glial cell differentiation |
| GO:0090103 | 1e-04 | 13.2407 | 0.479 | 5 | 23 | cochlea morphogenesis |
| GO:0021879 | 1e-04 | 21.6142 | 0.2649 | 4 | 13 | forebrain neuron differentiation |
| GO:0031076 | 1e-04 | 9.246 | 0.7706 | 6 | 37 | embryonic camera-type eye development |
| GO:0022603 | 1e-04 | 2.1014 | 18.5299 | 36 | 903 | regulation of anatomical structure morphogenesis |
| GO:0048935 | 1e-04 | 21.1337 | 0.2707 | 4 | 13 | peripheral nervous system neuron development |
| GO:0060914 | 1e-04 | 12.5431 | 0.4998 | 5 | 24 | heart formation |
| GO:0030902 | 1e-04 | 4.6943 | 2.3425 | 10 | 114 | hindbrain development |
| GO:0007389 | 1e-04 | 11.8763 | 0.5054 | 5 | 30 | pattern specification process |
| GO:0043009 | 1e-04 | 2.9082 | 6.6592 | 18 | 356 | chordate embryonic development |
| GO:0001657 | 1e-04 | 5.1477 | 1.9369 | 9 | 93 | ureteric bud development |
| GO:0060740 | 1e-04 | 11.9152 | 0.5207 | 5 | 25 | prostate gland epithelium morphogenesis |
| GO:0072163 | 1e-04 | 5.0869 | 1.9577 | 9 | 94 | mesonephric epithelium development |
| GO:0001944 | 1e-04 | 2.2845 | 13.1724 | 28 | 636 | vasculature development |
| GO:0007519 | 2e-04 | 6.8242 | 1.1646 | 7 | 58 | skeletal muscle tissue development |
| GO:0021527 | 2e-04 | 19.0192 | 0.2916 | 4 | 14 | spinal cord association neuron differentiation |
| GO:0048853 | 2e-04 | 19.0192 | 0.2916 | 4 | 14 | forebrain morphogenesis |
| GO:0032989 | 2e-04 | 2.0147 | 20.3687 | 38 | 978 | cellular component morphogenesis |
| GO:0002065 | 2e-04 | 6.7844 | 1.173 | 7 | 57 | columnar/cuboidal epithelial cell differentiation |
| GO:0003278 | 2e-04 | 47.4269 | 0.125 | 3 | 6 | apoptotic process involved in heart morphogenesis |
| GO:0048241 | 2e-04 | 47.4269 | 0.125 | 3 | 6 | epinephrine transport |
| GO:0060022 | 2e-04 | 47.4269 | 0.125 | 3 | 6 | hard palate development |
| GO:0001947 | 2e-04 | 6.7001 | 1.1871 | 7 | 57 | heart looping |
| GO:0021846 | 2e-04 | 11.3471 | 0.5415 | 5 | 26 | cell proliferation in forebrain |
| GO:0050767 | 2e-04 | 2.7498 | 7.419 | 19 | 374 | regulation of neurogenesis |
| GO:0051216 | 2e-04 | 3.7696 | 3.4498 | 12 | 167 | cartilage development |
| GO:0060415 | 2e-04 | 5.5589 | 1.6037 | 8 | 77 | muscle tissue morphogenesis |
| GO:0016070 | 2e-04 | 1.722 | 46.2212 | 69 | 2985 | RNA metabolic process |
| GO:0072498 | 2e-04 | 17.2891 | 0.3124 | 4 | 15 | embryonic skeletal joint development |
| GO:0007492 | 2e-04 | 5.4791 | 1.6245 | 8 | 78 | endoderm development |
| GO:0042733 | 2e-04 | 6.3577 | 1.2425 | 7 | 60 | embryonic digit morphogenesis |
| GO:0030509 | 2e-04 | 6.3042 | 1.2508 | 7 | 61 | BMP signaling pathway |
| GO:0060441 | 3e-04 | 10.3591 | 0.5832 | 5 | 28 | epithelial tube branching involved in lung morphogenesis |
| GO:0014013 | 3e-04 | 4.6977 | 2.1035 | 9 | 101 | regulation of gliogenesis |
| GO:0060541 | 3e-04 | 3.6037 | 3.5957 | 12 | 174 | respiratory system development |
| GO:0021521 | 3e-04 | 35.887 | 0.1445 | 3 | 7 | ventral spinal cord interneuron specification |
| GO:0021798 | 3e-04 | 35.5679 | 0.1458 | 3 | 7 | forebrain dorsal/ventral pattern formation |
| GO:0035726 | 3e-04 | 35.5679 | 0.1458 | 3 | 7 | common myeloid progenitor cell proliferation |
| GO:2001012 | 3e-04 | 35.5679 | 0.1458 | 3 | 7 | mesenchymal cell differentiation involved in renal system development |
| GO:0003203 | 3e-04 | 9.9268 | 0.604 | 5 | 29 | endocardial cushion morphogenesis |
| GO:0072001 | 3e-04 | 3.0205 | 5.3231 | 15 | 260 | renal system development |
| GO:0010656 | 3e-04 | 7.3457 | 0.9372 | 6 | 45 | negative regulation of muscle cell apoptotic process |
| GO:0048538 | 3e-04 | 7.3457 | 0.9372 | 6 | 45 | thymus development |
| GO:0043066 | 3e-04 | 2.2052 | 13.1147 | 27 | 652 | negative regulation of apoptotic process |
| GO:0015837 | 3e-04 | 5.1122 | 1.7286 | 8 | 83 | amine transport |
| GO:0003151 | 3e-04 | 7.2833 | 0.9427 | 6 | 46 | outflow tract morphogenesis |
| GO:0061351 | 3e-04 | 5.0903 | 1.7333 | 8 | 85 | neural precursor cell proliferation |
| GO:0048486 | 4e-04 | 14.6274 | 0.3541 | 4 | 17 | parasympathetic nervous system development |
| GO:0048806 | 4e-04 | 7.1616 | 0.958 | 6 | 46 | genitalia development |
| GO:0009605 | 4e-04 | 1.6575 | 42.9243 | 65 | 2061 | response to external stimulus |
| GO:0030900 | 4e-04 | 7.0423 | 0.9638 | 6 | 51 | forebrain development |
| GO:0001837 | 4e-04 | 4.0069 | 2.7075 | 10 | 130 | epithelial to mesenchymal transition |
| GO:0001569 | 4e-04 | 9.162 | 0.6456 | 5 | 31 | branching involved in blood vessel morphogenesis |
| GO:0010667 | 4e-04 | 9.162 | 0.6456 | 5 | 31 | negative regulation of cardiac muscle cell apoptotic process |
| GO:0003326 | 4e-04 | Inf | 0.0417 | 2 | 2 | pancreatic A cell fate commitment |
| GO:0003329 | 4e-04 | Inf | 0.0417 | 2 | 2 | pancreatic PP cell fate commitment |
| GO:0003404 | 4e-04 | Inf | 0.0417 | 2 | 2 | optic vesicle morphogenesis |
| GO:0021560 | 4e-04 | Inf | 0.0417 | 2 | 2 | abducens nerve development |
| GO:0021599 | 4e-04 | Inf | 0.0417 | 2 | 2 | abducens nerve formation |
| GO:0021623 | 4e-04 | Inf | 0.0417 | 2 | 2 | oculomotor nerve formation |
| GO:0043503 | 4e-04 | Inf | 0.0417 | 2 | 2 | skeletal muscle fiber adaptation |
| GO:0060465 | 4e-04 | Inf | 0.0417 | 2 | 2 | pharynx development |
| GO:0072272 | 4e-04 | Inf | 0.0417 | 2 | 2 | proximal/distal pattern formation involved in metanephric nephron development |
| GO:2001055 | 4e-04 | Inf | 0.0417 | 2 | 2 | positive regulation of mesenchymal cell apoptotic process |
| GO:2001111 | 4e-04 | Inf | 0.0417 | 2 | 2 | positive regulation of lens epithelial cell proliferation |
| GO:0035137 | 4e-04 | 29.1119 | 0.163 | 3 | 8 | hindlimb morphogenesis |
| GO:0001759 | 4e-04 | 13.5817 | 0.3749 | 4 | 18 | organ induction |
| GO:0072074 | 4e-04 | 13.5817 | 0.3749 | 4 | 18 | kidney mesenchyme development |
| GO:0021549 | 5e-04 | 4.8522 | 1.8119 | 8 | 87 | cerebellum development |
| GO:0002118 | 5e-04 | 28.4525 | 0.1666 | 3 | 8 | aggressive behavior |
| GO:0042756 | 5e-04 | 28.4525 | 0.1666 | 3 | 8 | drinking behavior |
| GO:0048743 | 5e-04 | 28.4525 | 0.1666 | 3 | 8 | positive regulation of skeletal muscle fiber development |
| GO:0050678 | 5e-04 | 2.7907 | 6.1231 | 16 | 294 | regulation of epithelial cell proliferation |
| GO:1902742 | 5e-04 | 8.8222 | 0.6665 | 5 | 32 | apoptotic process involved in development |
| GO:0045165 | 5e-04 | 4.244 | 2.2992 | 9 | 121 | cell fate commitment |
| GO:0010171 | 5e-04 | 6.6607 | 1.0205 | 6 | 49 | body morphogenesis |
| GO:0048641 | 5e-04 | 6.6607 | 1.0205 | 6 | 49 | regulation of skeletal muscle tissue development |
| GO:0035150 | 5e-04 | 3.8454 | 2.8116 | 10 | 135 | regulation of tube size |
| GO:0010463 | 5e-04 | 12.8097 | 0.3917 | 4 | 19 | mesenchymal cell proliferation |
| GO:0002209 | 6e-04 | 8.5065 | 0.6873 | 5 | 33 | behavioral defense response |
| GO:0001710 | 6e-04 | 12.6754 | 0.3957 | 4 | 19 | mesodermal cell fate commitment |
| GO:0021895 | 6e-04 | 12.6754 | 0.3957 | 4 | 19 | cerebral cortex neuron differentiation |
| GO:2000678 | 6e-04 | 12.6754 | 0.3957 | 4 | 19 | negative regulation of transcription regulatory region DNA binding |
| GO:0060688 | 6e-04 | 6.5089 | 1.0413 | 6 | 50 | regulation of morphogenesis of a branching structure |
| GO:0046631 | 6e-04 | 4.1525 | 2.3534 | 9 | 113 | alpha-beta T cell activation |
| GO:0055001 | 6e-04 | 3.4832 | 3.3948 | 11 | 163 | muscle cell development |
| GO:0061005 | 6e-04 | 6.3639 | 1.0622 | 6 | 51 | cell differentiation involved in kidney development |
| GO:0048048 | 6e-04 | 8.2127 | 0.7081 | 5 | 34 | embryonic eye morphogenesis |
| GO:0030917 | 7e-04 | 23.709 | 0.1874 | 3 | 9 | midbrain-hindbrain boundary development |
| GO:0048664 | 7e-04 | 23.709 | 0.1874 | 3 | 9 | neuron fate determination |
| GO:2000288 | 7e-04 | 23.709 | 0.1874 | 3 | 9 | positive regulation of myoblast proliferation |
| GO:0048645 | 7e-04 | 8.0498 | 0.7192 | 5 | 35 | animal organ formation |
| GO:0001667 | 7e-04 | 2.5852 | 6.9978 | 17 | 336 | ameboidal-type cell migration |
| GO:0007219 | 7e-04 | 3.4151 | 3.4573 | 11 | 166 | Notch signaling pathway |
| GO:0035909 | 7e-04 | 7.9384 | 0.7289 | 5 | 35 | aorta morphogenesis |
| GO:0009948 | 8e-04 | 7.7718 | 0.7414 | 5 | 36 | anterior/posterior axis specification |
| GO:0003231 | 8e-04 | 3.9608 | 2.4576 | 9 | 118 | cardiac ventricle development |
| GO:0007369 | 8e-04 | 3.3574 | 3.5111 | 11 | 171 | gastrulation |
| GO:0010842 | 8e-04 | 11.1828 | 0.4374 | 4 | 21 | retina layer formation |
| GO:0071392 | 8e-04 | 7.6819 | 0.7498 | 5 | 36 | cellular response to estradiol stimulus |
| GO:0006355 | 9e-04 | 1.9673 | 17.9054 | 32 | 1307 | regulation of transcription, DNA-templated |
| GO:0045844 | 9e-04 | 4.9947 | 1.5412 | 7 | 74 | positive regulation of striated muscle tissue development |
| GO:0007631 | 9e-04 | 4.3424 | 2.0033 | 8 | 97 | feeding behavior |
| GO:0007224 | 9e-04 | 3.8889 | 2.4992 | 9 | 120 | smoothened signaling pathway |
| GO:0030323 | 9e-04 | 3.3074 | 3.5614 | 11 | 171 | respiratory tube development |
| GO:0003279 | 9e-04 | 4.3043 | 2.0202 | 8 | 97 | cardiac septum development |
| GO:0008406 | 0.0011 | 3.0581 | 4.1862 | 12 | 201 | gonad development |
| GO:0060425 | 0.0011 | 10.1417 | 0.4727 | 4 | 23 | lung morphogenesis |
| GO:0033993 | 0.0012 | 2.2275 | 10.0096 | 21 | 502 | response to lipid |
| GO:0021532 | 0.0012 | 7.0027 | 0.8122 | 5 | 39 | neural tube patterning |
| GO:0031128 | 0.0013 | 17.9785 | 0.2266 | 3 | 11 | developmental induction |
| GO:0072047 | 0.0013 | 95.1497 | 0.0621 | 2 | 3 | proximal/distal pattern formation involved in nephron development |
| GO:0061074 | 0.0013 | 95.1437 | 0.0621 | 2 | 3 | regulation of neural retina development |
| GO:0080090 | 0.0013 | 1.8649 | 22.5138 | 37 | 1784 | regulation of primary metabolic process |
| GO:0022414 | 0.0013 | 1.7142 | 27.4915 | 44 | 1320 | reproductive process |
| GO:0002877 | 0.0013 | 94.5833 | 0.0625 | 2 | 3 | regulation of acute inflammatory response to non-antigenic stimulus |
| GO:0003350 | 0.0013 | 94.5833 | 0.0625 | 2 | 3 | pulmonary myocardium development |
| GO:0014707 | 0.0013 | 94.5833 | 0.0625 | 2 | 3 | branchiomeric skeletal muscle development |
| GO:0021530 | 0.0013 | 94.5833 | 0.0625 | 2 | 3 | spinal cord oligodendrocyte cell fate specification |
| GO:0021912 | 0.0013 | 94.5833 | 0.0625 | 2 | 3 | regulation of transcription from RNA polymerase II promoter involved in spinal cord motor neuron fate specification |
| GO:0035880 | 0.0013 | 94.5833 | 0.0625 | 2 | 3 | embryonic nail plate morphogenesis |
| GO:0035990 | 0.0013 | 94.5833 | 0.0625 | 2 | 3 | tendon cell differentiation |
| GO:0035993 | 0.0013 | 94.5833 | 0.0625 | 2 | 3 | deltoid tuberosity development |
| GO:0036023 | 0.0013 | 94.5833 | 0.0625 | 2 | 3 | embryonic skeletal limb joint morphogenesis |
| GO:0048619 | 0.0013 | 94.5833 | 0.0625 | 2 | 3 | embryonic hindgut morphogenesis |
| GO:0055014 | 0.0013 | 94.5833 | 0.0625 | 2 | 3 | atrial cardiac muscle cell development |
| GO:0060741 | 0.0013 | 94.5833 | 0.0625 | 2 | 3 | prostate gland stromal morphogenesis |
| GO:0060743 | 0.0013 | 94.5833 | 0.0625 | 2 | 3 | epithelial cell maturation involved in prostate gland development |
| GO:0061010 | 0.0013 | 94.5833 | 0.0625 | 2 | 3 | gall bladder development |
| GO:0061031 | 0.0013 | 94.5833 | 0.0625 | 2 | 3 | endodermal digestive tract morphogenesis |
| GO:0072190 | 0.0013 | 94.5833 | 0.0625 | 2 | 3 | ureter urothelium development |
| GO:0090427 | 0.0013 | 94.5833 | 0.0625 | 2 | 3 | activation of meiosis |
| GO:0097021 | 0.0013 | 94.5833 | 0.0625 | 2 | 3 | lymphocyte migration into lymphoid organs |
| GO:0140076 | 0.0013 | 94.5833 | 0.0625 | 2 | 3 | negative regulation of lipoprotein transport |
| GO:1902869 | 0.0013 | 94.5833 | 0.0625 | 2 | 3 | regulation of amacrine cell differentiation |
| GO:1905563 | 0.0013 | 94.5833 | 0.0625 | 2 | 3 | negative regulation of vascular endothelial cell proliferation |
| GO:0097746 | 0.0013 | 3.6881 | 2.6242 | 9 | 126 | regulation of blood vessel diameter |
| GO:0045787 | 0.0013 | 2.4369 | 7.3936 | 17 | 355 | positive regulation of cell cycle |
| GO:0060525 | 0.0013 | 17.7795 | 0.2291 | 3 | 11 | prostate glandular acinus development |
| GO:0030879 | 0.0014 | 3.6566 | 2.645 | 9 | 127 | mammary gland development |
| GO:0072073 | 0.0014 | 6.7601 | 0.836 | 5 | 41 | kidney epithelium development |
| GO:0042481 | 0.0014 | 9.5036 | 0.4998 | 4 | 24 | regulation of odontogenesis |
| GO:0061217 | 0.0014 | 9.5036 | 0.4998 | 4 | 24 | regulation of mesonephros development |
| GO:0021537 | 0.0016 | 5.2408 | 1.2591 | 6 | 63 | telencephalon development |
| GO:0045778 | 0.0016 | 4.4597 | 1.7078 | 7 | 82 | positive regulation of ossification |
| GO:0003018 | 0.0016 | 3.2879 | 3.249 | 10 | 156 | vascular process in circulatory system |
| GO:0072132 | 0.0016 | 16.1128 | 0.2453 | 3 | 12 | mesenchyme morphogenesis |
| GO:1903036 | 0.0017 | 5.2035 | 1.2704 | 6 | 61 | positive regulation of response to wounding |
| GO:0003148 | 0.0017 | 9.0505 | 0.5207 | 4 | 25 | outflow tract septum morphogenesis |
| GO:0060037 | 0.0017 | 9.0505 | 0.5207 | 4 | 25 | pharyngeal system development |
| GO:0060850 | 0.0017 | 15.9448 | 0.2478 | 3 | 12 | regulation of transcription involved in cell fate commitment |
| GO:0001707 | 0.0017 | 5.1703 | 1.2769 | 6 | 62 | mesoderm formation |
| GO:0010454 | 0.0017 | 15.803 | 0.2499 | 3 | 12 | negative regulation of cell fate commitment |
| GO:0055015 | 0.0017 | 15.803 | 0.2499 | 3 | 12 | ventricular cardiac muscle cell development |
| GO:0060536 | 0.0017 | 15.803 | 0.2499 | 3 | 12 | cartilage morphogenesis |
| GO:0097154 | 0.0017 | 15.803 | 0.2499 | 3 | 12 | GABAergic neuron differentiation |
| GO:0043524 | 0.0018 | 3.5069 | 2.7492 | 9 | 132 | negative regulation of neuron apoptotic process |
| GO:0001942 | 0.0018 | 4.3433 | 1.7495 | 7 | 84 | hair follicle development |
| GO:0002064 | 0.0019 | 3.0036 | 3.8946 | 11 | 187 | epithelial cell development |
| GO:0021884 | 0.0019 | 8.6385 | 0.5415 | 4 | 26 | forebrain neuron development |
| GO:0030510 | 0.002 | 4.2874 | 1.7703 | 7 | 85 | regulation of BMP signaling pathway |
| GO:0022404 | 0.0021 | 4.2328 | 1.7911 | 7 | 86 | molting cycle process |
| GO:0031323 | 0.0021 | 1.7899 | 24.003 | 38 | 1902 | regulation of cellular metabolic process |
| GO:0023061 | 0.0022 | 2.2535 | 8.4349 | 18 | 405 | signal release |
| GO:0030855 | 0.0022 | 2.254 | 8.4414 | 18 | 431 | epithelial cell differentiation |
| GO:0060911 | 0.0022 | 14.2218 | 0.2707 | 3 | 13 | cardiac cell fate commitment |
| GO:0061029 | 0.0022 | 14.2218 | 0.2707 | 3 | 13 | eyelid development in camera-type eye |
| GO:0061548 | 0.0022 | 14.2218 | 0.2707 | 3 | 13 | ganglion development |
| GO:0071880 | 0.0022 | 14.2218 | 0.2707 | 3 | 13 | adenylate cyclase-activating adrenergic receptor signaling pathway |
| GO:0035883 | 0.0022 | 8.2624 | 0.5623 | 4 | 27 | enteroendocrine cell differentiation |
| GO:0071383 | 0.0023 | 2.642 | 5.2067 | 13 | 250 | cellular response to steroid hormone stimulus |
| GO:0050795 | 0.0025 | 4.7684 | 1.3746 | 6 | 66 | regulation of behavior |
| GO:0021877 | 0.0025 | 47.5599 | 0.0828 | 2 | 4 | forebrain neuron fate commitment |
| GO:0042596 | 0.0025 | 7.9629 | 0.58 | 4 | 28 | fear response |
| GO:0003219 | 0.0025 | 47.2887 | 0.0833 | 2 | 4 | cardiac right ventricle formation |
| GO:0003308 | 0.0025 | 47.2887 | 0.0833 | 2 | 4 | negative regulation of Wnt signaling pathway involved in heart development |
| GO:0007198 | 0.0025 | 47.2887 | 0.0833 | 2 | 4 | adenylate cyclase-inhibiting serotonin receptor signaling pathway |
| GO:0021557 | 0.0025 | 47.2887 | 0.0833 | 2 | 4 | oculomotor nerve development |
| GO:0021764 | 0.0025 | 47.2887 | 0.0833 | 2 | 4 | amygdala development |
| GO:0021797 | 0.0025 | 47.2887 | 0.0833 | 2 | 4 | forebrain anterior/posterior pattern specification |
| GO:0032811 | 0.0025 | 47.2887 | 0.0833 | 2 | 4 | negative regulation of epinephrine secretion |
| GO:0035625 | 0.0025 | 47.2887 | 0.0833 | 2 | 4 | epidermal growth factor-activated receptor transactivation by G-protein coupled receptor signaling pathway |
| GO:0042662 | 0.0025 | 47.2887 | 0.0833 | 2 | 4 | negative regulation of mesodermal cell fate specification |
| GO:0048866 | 0.0025 | 47.2887 | 0.0833 | 2 | 4 | stem cell fate specification |
| GO:0061055 | 0.0025 | 47.2887 | 0.0833 | 2 | 4 | myotome development |
| GO:0061325 | 0.0025 | 47.2887 | 0.0833 | 2 | 4 | cell proliferation involved in outflow tract morphogenesis |
| GO:0070253 | 0.0025 | 47.2887 | 0.0833 | 2 | 4 | somatostatin secretion |
| GO:0072193 | 0.0025 | 47.2887 | 0.0833 | 2 | 4 | ureter smooth muscle cell differentiation |
| GO:0097476 | 0.0025 | 47.2887 | 0.0833 | 2 | 4 | spinal cord motor neuron migration |
| GO:1905903 | 0.0025 | 47.2887 | 0.0833 | 2 | 4 | negative regulation of mesoderm formation |
| GO:0002053 | 0.0025 | 7.9177 | 0.5832 | 4 | 28 | positive regulation of mesenchymal cell proliferation |
| GO:0032330 | 0.0026 | 5.8046 | 0.958 | 5 | 46 | regulation of chondrocyte differentiation |
| GO:0050796 | 0.0027 | 3.0554 | 3.4781 | 10 | 167 | regulation of insulin secretion |
| GO:0021871 | 0.0027 | 13.0794 | 0.2883 | 3 | 14 | forebrain regionalization |
| GO:0021984 | 0.0027 | 12.9281 | 0.2916 | 3 | 14 | adenohypophysis development |
| GO:0035239 | 0.0028 | 7.6478 | 0.5957 | 4 | 31 | tube morphogenesis |
| GO:0010662 | 0.0028 | 5.666 | 0.9789 | 5 | 47 | regulation of striated muscle cell apoptotic process |
| GO:0050433 | 0.0028 | 5.666 | 0.9789 | 5 | 47 | regulation of catecholamine secretion |
| GO:0035108 | 0.0029 | 12.5966 | 0.2944 | 3 | 15 | limb morphogenesis |
| GO:0021772 | 0.0029 | 7.6005 | 0.604 | 4 | 29 | olfactory bulb development |
| GO:0046887 | 0.003 | 3.5428 | 2.4159 | 8 | 116 | positive regulation of hormone secretion |
| GO:0045843 | 0.0031 | 5.5339 | 0.9997 | 5 | 48 | negative regulation of striated muscle tissue development |
| GO:0060563 | 0.0031 | 5.5339 | 0.9997 | 5 | 48 | neuroepithelial cell differentiation |
| GO:0048638 | 0.0032 | 2.4446 | 6.0398 | 14 | 290 | regulation of developmental growth |
| GO:0001501 | 0.0032 | 2.8002 | 4.1546 | 11 | 219 | skeletal system development |
| GO:0071599 | 0.0034 | 11.85 | 0.3124 | 3 | 15 | otic vesicle development |
| GO:0050885 | 0.0034 | 5.4078 | 1.0205 | 5 | 49 | neuromuscular process controlling balance |
| GO:0031016 | 0.0035 | 7.17 | 0.634 | 4 | 31 | pancreas development |
| GO:0007548 | 0.0036 | 2.7513 | 4.2262 | 11 | 206 | sex differentiation |
| GO:0002520 | 0.0036 | 1.7649 | 18.5568 | 31 | 891 | immune system development |
| GO:0001709 | 0.0036 | 7.0977 | 0.6403 | 4 | 31 | cell fate determination |
| GO:0048713 | 0.0037 | 7.0366 | 0.6456 | 4 | 31 | regulation of oligodendrocyte differentiation |
| GO:0051093 | 0.0037 | 2.7357 | 4.2488 | 11 | 223 | negative regulation of developmental process |
| GO:0048747 | 0.0037 | 5.2873 | 1.0413 | 5 | 50 | muscle fiber development |
| GO:0015844 | 0.0038 | 4.3332 | 1.4995 | 6 | 72 | monoamine transport |
| GO:0006590 | 0.0041 | 10.9378 | 0.3332 | 3 | 16 | thyroid hormone generation |
| GO:0072224 | 0.0041 | 10.9378 | 0.3332 | 3 | 16 | metanephric glomerulus development |
| GO:0035881 | 0.0041 | 31.7106 | 0.1035 | 2 | 5 | amacrine cell differentiation |
| GO:0042310 | 0.0041 | 4.2683 | 1.5204 | 6 | 73 | vasoconstriction |
| GO:0021523 | 0.0041 | 31.5238 | 0.1041 | 2 | 5 | somatic motor neuron differentiation |
| GO:0021779 | 0.0041 | 31.5238 | 0.1041 | 2 | 5 | oligodendrocyte cell fate commitment |
| GO:0021780 | 0.0041 | 31.5238 | 0.1041 | 2 | 5 | glial cell fate specification |
| GO:0035989 | 0.0041 | 31.5238 | 0.1041 | 2 | 5 | tendon development |
| GO:0038170 | 0.0041 | 31.5238 | 0.1041 | 2 | 5 | somatostatin signaling pathway |
| GO:0043305 | 0.0041 | 31.5238 | 0.1041 | 2 | 5 | negative regulation of mast cell degranulation |
| GO:0043415 | 0.0041 | 31.5238 | 0.1041 | 2 | 5 | positive regulation of skeletal muscle tissue regeneration |
| GO:0048625 | 0.0041 | 31.5238 | 0.1041 | 2 | 5 | myoblast fate commitment |
| GO:0060023 | 0.0041 | 31.5238 | 0.1041 | 2 | 5 | soft palate development |
| GO:0060729 | 0.0041 | 31.5238 | 0.1041 | 2 | 5 | intestinal epithelial structure maintenance |
| GO:0061056 | 0.0041 | 31.5238 | 0.1041 | 2 | 5 | sclerotome development |
| GO:0061743 | 0.0041 | 31.5238 | 0.1041 | 2 | 5 | motor learning |
| GO:0072162 | 0.0041 | 31.5238 | 0.1041 | 2 | 5 | metanephric mesenchymal cell differentiation |
| GO:0090131 | 0.0041 | 31.5238 | 0.1041 | 2 | 5 | mesenchyme migration |
| GO:0097070 | 0.0041 | 31.5238 | 0.1041 | 2 | 5 | ductus arteriosus closure |
| GO:2000987 | 0.0041 | 31.5238 | 0.1041 | 2 | 5 | positive regulation of behavioral fear response |
| GO:0050768 | 0.0042 | 5.1343 | 1.0669 | 5 | 53 | negative regulation of neurogenesis |
| GO:0003008 | 0.0043 | 1.5127 | 40.3209 | 57 | 1936 | system process |
| GO:0070887 | 0.0044 | 1.4329 | 59.7316 | 79 | 2868 | cellular response to chemical stimulus |
| GO:0055006 | 0.0044 | 4.2053 | 1.5412 | 6 | 74 | cardiac cell development |
| GO:0030326 | 0.0045 | 6.6397 | 0.6763 | 4 | 34 | embryonic limb morphogenesis |
| GO:1901214 | 0.0045 | 2.4333 | 5.6233 | 13 | 270 | regulation of neuron death |
| GO:0007188 | 0.0046 | 3.0126 | 3.1657 | 9 | 152 | adenylate cyclase-modulating G-protein coupled receptor signaling pathway |
| GO:0000578 | 0.0047 | 6.5505 | 0.6873 | 4 | 33 | embryonic axis specification |
| GO:0014904 | 0.0047 | 6.5505 | 0.6873 | 4 | 33 | myotube cell development |
| GO:0043388 | 0.0048 | 4.9559 | 1.1038 | 5 | 53 | positive regulation of DNA binding |
| GO:0001503 | 0.0048 | 2.4082 | 5.6783 | 13 | 277 | ossification |
| GO:0003198 | 0.0049 | 10.1559 | 0.3541 | 3 | 17 | epithelial to mesenchymal transition involved in endocardial cushion formation |
| GO:0021533 | 0.0049 | 10.1559 | 0.3541 | 3 | 17 | cell differentiation in hindbrain |
| GO:0090190 | 0.0049 | 10.1559 | 0.3541 | 3 | 17 | positive regulation of branching involved in ureteric bud morphogenesis |
| GO:2000136 | 0.0049 | 10.1559 | 0.3541 | 3 | 17 | regulation of cell proliferation involved in heart morphogenesis |
| GO:2000738 | 0.0049 | 10.1559 | 0.3541 | 3 | 17 | positive regulation of stem cell differentiation |
| GO:0001655 | 0.0049 | 6.4343 | 0.6953 | 4 | 35 | urogenital system development |
| GO:0046883 | 0.0051 | 3.2159 | 2.642 | 8 | 129 | regulation of hormone secretion |
| GO:0035265 | 0.0052 | 2.9501 | 3.2282 | 9 | 155 | organ growth |
| GO:0045823 | 0.0052 | 6.3317 | 0.7081 | 4 | 34 | positive regulation of heart contraction |
| GO:0051154 | 0.0052 | 6.3317 | 0.7081 | 4 | 34 | negative regulation of striated muscle cell differentiation |
| GO:2000826 | 0.0057 | 9.5554 | 0.3719 | 3 | 18 | regulation of heart morphogenesis |
| GO:0031960 | 0.0057 | 2.9099 | 3.2698 | 9 | 157 | response to corticosteroid |
| GO:0045595 | 0.0058 | 1.7573 | 16.8366 | 28 | 895 | regulation of cell differentiation |
| GO:0060008 | 0.0058 | 9.4782 | 0.3749 | 3 | 18 | Sertoli cell differentiation |
| GO:0060438 | 0.0058 | 9.4782 | 0.3749 | 3 | 18 | trachea development |
| GO:0072077 | 0.0058 | 9.4782 | 0.3749 | 3 | 18 | renal vesicle morphogenesis |
| GO:0051101 | 0.0058 | 4.7202 | 1.1528 | 5 | 56 | regulation of DNA binding |
| GO:0045687 | 0.0058 | 6.1271 | 0.7289 | 4 | 35 | positive regulation of glial cell differentiation |
| GO:0051147 | 0.0059 | 2.7067 | 3.8946 | 10 | 187 | regulation of muscle cell differentiation |
| GO:1903844 | 0.0061 | 3.4434 | 2.166 | 7 | 104 | regulation of cellular response to transforming growth factor beta stimulus |
| GO:0003211 | 0.0061 | 23.7799 | 0.1243 | 2 | 6 | cardiac ventricle formation |
| GO:0021885 | 0.0061 | 4.6635 | 1.1663 | 5 | 56 | forebrain cell migration |
| GO:0040012 | 0.0061 | 1.7271 | 17.6612 | 29 | 848 | regulation of locomotion |
| GO:0051171 | 0.0061 | 2.023 | 10.189 | 19 | 823 | regulation of nitrogen compound metabolic process |
| GO:0021536 | 0.0061 | 9.2201 | 0.3818 | 3 | 19 | diencephalon development |
| GO:0014062 | 0.0061 | 23.6414 | 0.125 | 2 | 6 | regulation of serotonin secretion |
| GO:0021546 | 0.0061 | 23.6414 | 0.125 | 2 | 6 | rhombomere development |
| GO:0021902 | 0.0061 | 23.6414 | 0.125 | 2 | 6 | commitment of neuronal cell to specific neuron type in forebrain |
| GO:0046533 | 0.0061 | 23.6414 | 0.125 | 2 | 6 | negative regulation of photoreceptor cell differentiation |
| GO:0048541 | 0.0061 | 23.6414 | 0.125 | 2 | 6 | Peyer's patch development |
| GO:0060426 | 0.0061 | 23.6414 | 0.125 | 2 | 6 | lung vasculature development |
| GO:0060527 | 0.0061 | 23.6414 | 0.125 | 2 | 6 | prostate epithelial cord arborization involved in prostate glandular acinus morphogenesis |
| GO:0061312 | 0.0061 | 23.6414 | 0.125 | 2 | 6 | BMP signaling pathway involved in heart development |
| GO:0072143 | 0.0061 | 23.6414 | 0.125 | 2 | 6 | mesangial cell development |
| GO:2000675 | 0.0061 | 23.6414 | 0.125 | 2 | 6 | negative regulation of type B pancreatic cell apoptotic process |
| GO:0046546 | 0.0062 | 3.1078 | 2.7283 | 8 | 131 | development of primary male sexual characteristics |
| GO:0120036 | 0.0062 | 1.5812 | 27.429 | 41 | 1317 | plasma membrane bounded cell projection organization |
| GO:0007586 | 0.0064 | 2.8515 | 3.3323 | 9 | 160 | digestion |
| GO:0021545 | 0.0064 | 9.0623 | 0.3882 | 3 | 19 | cranial nerve development |
| GO:0007167 | 0.0064 | 1.6747 | 20.1188 | 32 | 966 | enzyme linked receptor protein signaling pathway |
| GO:0014003 | 0.0064 | 5.9353 | 0.7498 | 4 | 36 | oligodendrocyte development |
| GO:0006357 | 0.0065 | 2.6664 | 3.9538 | 10 | 278 | regulation of transcription from RNA polymerase II promoter |
| GO:0060038 | 0.0066 | 4.5735 | 1.1871 | 5 | 57 | cardiac muscle cell proliferation |
| GO:0021766 | 0.0067 | 4.5525 | 1.1912 | 5 | 58 | hippocampus development |
| GO:0071559 | 0.0068 | 2.5119 | 4.6027 | 11 | 221 | response to transforming growth factor beta |
| GO:2000112 | 0.0068 | 2.2477 | 6.6385 | 14 | 527 | regulation of cellular macromolecule biosynthetic process |
| GO:0002089 | 0.0068 | 8.8853 | 0.3957 | 3 | 19 | lens morphogenesis in camera-type eye |
| GO:0007530 | 0.0068 | 8.8853 | 0.3957 | 3 | 19 | sex determination |
| GO:0060602 | 0.0068 | 8.8853 | 0.3957 | 3 | 19 | branch elongation of an epithelium |
| GO:0002042 | 0.0071 | 5.755 | 0.7706 | 4 | 37 | cell migration involved in sprouting angiogenesis |
| GO:0060412 | 0.0071 | 5.755 | 0.7706 | 4 | 37 | ventricular septum morphogenesis |
| GO:0055024 | 0.0073 | 3.7607 | 1.7078 | 6 | 82 | regulation of cardiac muscle tissue development |
| GO:1904888 | 0.0074 | 8.5472 | 0.4078 | 3 | 20 | cranial skeletal system development |
| GO:0042633 | 0.0074 | 3.3062 | 2.2493 | 7 | 108 | hair cycle |
| GO:0060560 | 0.0076 | 2.6026 | 4.0404 | 10 | 194 | developmental growth involved in morphogenesis |
| GO:0001658 | 0.0076 | 5.6311 | 0.7852 | 4 | 38 | branching involved in ureteric bud morphogenesis |
| GO:0048663 | 0.0077 | 8.3841 | 0.4127 | 3 | 21 | neuron fate commitment |
| GO:0010942 | 0.0077 | 1.8136 | 13.2876 | 23 | 638 | positive regulation of cell death |
| GO:0032941 | 0.0078 | 5.5854 | 0.7914 | 4 | 38 | secretion by tissue |
| GO:0045777 | 0.0078 | 5.5854 | 0.7914 | 4 | 38 | positive regulation of blood pressure |
| GO:0021544 | 0.0078 | 8.3621 | 0.4165 | 3 | 20 | subpallium development |
| GO:0043576 | 0.0078 | 8.3621 | 0.4165 | 3 | 20 | regulation of respiratory gaseous exchange |
| GO:0072234 | 0.0078 | 8.3621 | 0.4165 | 3 | 20 | metanephric nephron tubule development |
| GO:1903306 | 0.0078 | 8.3621 | 0.4165 | 3 | 20 | negative regulation of regulated secretory pathway |
| GO:2000178 | 0.0078 | 8.3621 | 0.4165 | 3 | 20 | negative regulation of neural precursor cell proliferation |
| GO:2001273 | 0.0078 | 8.3621 | 0.4165 | 3 | 20 | regulation of glucose import in response to insulin stimulus |
| GO:0035195 | 0.008 | 2.341 | 5.3733 | 12 | 258 | gene silencing by miRNA |
| GO:0035136 | 0.0081 | 19.4043 | 0.1422 | 2 | 7 | forelimb morphogenesis |
| GO:0009914 | 0.0081 | 2.2505 | 6.0504 | 13 | 293 | hormone transport |
| GO:0055007 | 0.0082 | 3.2416 | 2.291 | 7 | 110 | cardiac muscle cell differentiation |
| GO:0048545 | 0.0083 | 5.4613 | 0.8056 | 4 | 40 | response to steroid hormone |
| GO:1902692 | 0.0084 | 19.0607 | 0.1447 | 2 | 7 | regulation of neuroblast proliferation |
| GO:0031327 | 0.0084 | 2.0531 | 8.1842 | 16 | 475 | negative regulation of cellular biosynthetic process |
| GO:0003253 | 0.0085 | 18.9119 | 0.1458 | 2 | 7 | cardiac neural crest cell migration involved in outflow tract morphogenesis |
| GO:0010700 | 0.0085 | 18.9119 | 0.1458 | 2 | 7 | negative regulation of norepinephrine secretion |
| GO:0021796 | 0.0085 | 18.9119 | 0.1458 | 2 | 7 | cerebral cortex regionalization |
| GO:0048341 | 0.0085 | 18.9119 | 0.1458 | 2 | 7 | paraxial mesoderm formation |
| GO:0048752 | 0.0085 | 18.9119 | 0.1458 | 2 | 7 | semicircular canal morphogenesis |
| GO:0060430 | 0.0085 | 18.9119 | 0.1458 | 2 | 7 | lung saccule development |
| GO:0072177 | 0.0085 | 18.9119 | 0.1458 | 2 | 7 | mesonephric duct development |
| GO:1903365 | 0.0085 | 18.9119 | 0.1458 | 2 | 7 | regulation of fear response |
| GO:2000049 | 0.0085 | 18.9119 | 0.1458 | 2 | 7 | positive regulation of cell-cell adhesion mediated by cadherin |
| GO:0021543 | 0.0085 | 3.6225 | 1.7663 | 6 | 87 | pallium development |
| GO:0048709 | 0.0087 | 8.0132 | 0.4312 | 3 | 21 | oligodendrocyte differentiation |
| GO:0061311 | 0.0089 | 7.9424 | 0.4349 | 3 | 21 | cell surface receptor signaling pathway involved in heart development |
| GO:0030072 | 0.0089 | 2.4106 | 4.7837 | 11 | 231 | peptide hormone secretion |
| GO:0045892 | 0.0089 | 2.2233 | 6.1279 | 13 | 346 | negative regulation of transcription, DNA-templated |
| GO:0002052 | 0.009 | 7.897 | 0.4374 | 3 | 21 | positive regulation of neuroblast proliferation |
| GO:0015874 | 0.009 | 7.897 | 0.4374 | 3 | 21 | norepinephrine transport |
| GO:0031290 | 0.009 | 7.897 | 0.4374 | 3 | 21 | retinal ganglion cell axon guidance |
| GO:0045061 | 0.009 | 7.897 | 0.4374 | 3 | 21 | thymic T cell selection |
| GO:0030858 | 0.0093 | 4.171 | 1.2913 | 5 | 62 | positive regulation of epithelial cell differentiation |
| GO:0003170 | 0.0094 | 5.2745 | 0.8331 | 4 | 40 | heart valve development |
| GO:0030857 | 0.0094 | 5.2745 | 0.8331 | 4 | 40 | negative regulation of epithelial cell differentiation |
| GO:0044058 | 0.0094 | 5.2745 | 0.8331 | 4 | 40 | regulation of digestive system process |
| GO:0002791 | 0.0095 | 1.9701 | 9.0181 | 17 | 433 | regulation of peptide secretion |
| GO:0002690 | 0.0096 | 3.5274 | 1.8119 | 6 | 87 | positive regulation of leukocyte chemotaxis |
| GO:0016441 | 0.0098 | 2.2752 | 5.5191 | 12 | 265 | posttranscriptional gene silencing |
| GO:0072210 | 0.0099 | 7.588 | 0.4519 | 3 | 22 | metanephric nephron development |
| GO:0008152 | 0.0099 | 1.3362 | 225.8054 | 246 | 10842 | metabolic process |
| GO:0043367 | 0.01 | 4.0988 | 1.3121 | 5 | 63 | CD4-positive, alpha-beta T cell differentiation |
| GOMFID | Pvalue | OddsRatio | ExpCount | Count | Size | Term |
| GO:0050911 | 5e-04 | 3.5855 | 3.3147 | 11 | 371 | detection of chemical stimulus involved in sensory perception of smell |
| GO:0035195 | 5e-04 | 4.2085 | 2.3051 | 9 | 258 | gene silencing by miRNA |
| GO:0016441 | 6e-04 | 4.0916 | 2.3677 | 9 | 265 | posttranscriptional gene silencing |
| GO:0031047 | 0.0011 | 3.7488 | 2.5732 | 9 | 288 | gene silencing by RNA |
| GO:0001510 | 0.0023 | 7.8386 | 0.5539 | 4 | 62 | RNA methylation |
| GO:0009593 | 0.0024 | 2.9255 | 4.0206 | 11 | 450 | detection of chemical stimulus |
| GO:0070475 | 0.0027 | 32.1219 | 0.0804 | 2 | 9 | rRNA base methylation |
| GO:0050906 | 0.0029 | 2.8455 | 4.1278 | 11 | 462 | detection of stimulus involved in sensory perception |
| GO:0007606 | 0.0032 | 2.807 | 4.1814 | 11 | 468 | sensory perception of chemical stimulus |
| GO:0000387 | 0.0043 | 9.9731 | 0.3306 | 3 | 37 | spliceosomal snRNP assembly |
| GO:0043043 | 0.0054 | 2.2427 | 7.1656 | 15 | 802 | peptide biosynthetic process |
| GO:0034249 | 0.0056 | 2.9237 | 3.2611 | 9 | 365 | negative regulation of cellular amide metabolic process |
| GO:0006396 | 0.0057 | 2.1716 | 7.9071 | 16 | 885 | RNA processing |
| GO:1905205 | 0.0058 | 20.4361 | 0.1162 | 2 | 13 | positive regulation of connective tissue replacement |
| GO:0000375 | 0.0063 | 3.0933 | 2.734 | 8 | 306 | RNA splicing, via transesterification reactions |
| GO:0045019 | 0.0067 | 18.7319 | 0.1251 | 2 | 14 | negative regulation of nitric oxide biosynthetic process |
| GO:0010656 | 0.0075 | 8.0694 | 0.4021 | 3 | 45 | negative regulation of muscle cell apoptotic process |
| GO:0010665 | 0.0075 | 8.0694 | 0.4021 | 3 | 45 | regulation of cardiac muscle cell apoptotic process |
| GO:0015671 | 0.0077 | 17.2899 | 0.134 | 2 | 15 | oxygen transport |
| GO:0006417 | 0.0077 | 2.4767 | 4.7085 | 11 | 527 | regulation of translation |
| GO:0030593 | 0.008 | 5.4036 | 0.7862 | 4 | 88 | neutrophil chemotaxis |
| GO:1904683 | 0.0088 | 16.0539 | 0.143 | 2 | 16 | regulation of metalloendopeptidase activity |
| GO:0002037 | 0.0089 | Inf | 0.0089 | 1 | 1 | negative regulation of L-glutamate transport |
| GO:0046293 | 0.0089 | Inf | 0.0089 | 1 | 1 | formaldehyde biosynthetic process |
| GO:0061519 | 0.0089 | Inf | 0.0089 | 1 | 1 | macrophage homeostasis |
| GO:1901506 | 0.0089 | Inf | 0.0089 | 1 | 1 | regulation of acylglycerol transport |
| GO:1904905 | 0.0089 | Inf | 0.0089 | 1 | 1 | negative regulation of endothelial cell-matrix adhesion via fibronectin |
| GO:1904989 | 0.0089 | Inf | 0.0089 | 1 | 1 | positive regulation of endothelial cell activation |
| GO:1905884 | 0.0089 | Inf | 0.0089 | 1 | 1 | negative regulation of triglyceride transport |
| GOMFID | Pvalue | OddsRatio | ExpCount | Count | Size | Term |
| GO:0031424 | 0 | 15.3971 | 0.8912 | 11 | 226 | keratinization |
| GO:0009913 | 0 | 10.8386 | 1.3763 | 12 | 349 | epidermal cell differentiation |
| GO:0043588 | 0 | 9.1894 | 1.609 | 12 | 408 | skin development |
| GO:0018149 | 0 | 32.055 | 0.2287 | 6 | 58 | peptide cross-linking |
| GO:0009593 | 0 | 7.4348 | 1.7746 | 11 | 450 | detection of chemical stimulus |
| GO:0006959 | 0 | 10.8537 | 0.8597 | 8 | 218 | humoral immune response |
| GO:0098542 | 0 | 6.4671 | 1.814 | 10 | 460 | defense response to other organism |
| GO:0050906 | 0 | 6.4376 | 1.8219 | 10 | 462 | detection of stimulus involved in sensory perception |
| GO:0007606 | 0 | 6.3509 | 1.8456 | 10 | 468 | sensory perception of chemical stimulus |
| GO:0050911 | 0 | 7.1435 | 1.4631 | 9 | 371 | detection of chemical stimulus involved in sensory perception of smell |
| GO:0043207 | 0 | 4.8893 | 3.2101 | 13 | 814 | response to external biotic stimulus |
| GO:0061844 | 0 | 22.8624 | 0.2011 | 4 | 51 | antimicrobial humoral immune response mediated by antimicrobial peptide |
| GO:0035195 | 1e-04 | 7.7863 | 1.0174 | 7 | 258 | gene silencing by miRNA |
| GO:0016441 | 1e-04 | 7.5717 | 1.045 | 7 | 265 | posttranscriptional gene silencing |
| GO:0031047 | 1e-04 | 6.9419 | 1.1357 | 7 | 288 | gene silencing by RNA |
| GO:0050829 | 2e-04 | 14.9009 | 0.2997 | 4 | 76 | defense response to Gram-negative bacterium |
| GO:0050830 | 4e-04 | 13.2379 | 0.3352 | 4 | 85 | defense response to Gram-positive bacterium |
| GO:1904628 | 4e-04 | 86.8763 | 0.0315 | 2 | 8 | cellular response to phorbol 13-acetate 12-myristate |
| GO:0034249 | 6e-04 | 5.4224 | 1.4394 | 7 | 365 | negative regulation of cellular amide metabolic process |
| GO:0009617 | 0.001 | 4.3238 | 2.0704 | 8 | 525 | response to bacterium |
| GO:0045087 | 0.0015 | 3.4302 | 3.3047 | 10 | 838 | innate immune response |
| GO:0045653 | 0.0022 | 32.5585 | 0.071 | 2 | 18 | negative regulation of megakaryocyte differentiation |
| GO:0050877 | 0.0025 | 2.8779 | 4.7796 | 12 | 1212 | nervous system process |
| GO:0060429 | 0.0025 | 2.8779 | 4.7796 | 12 | 1212 | epithelium development |
| GO:0007186 | 0.0032 | 2.7776 | 4.9373 | 12 | 1252 | G-protein coupled receptor signaling pathway |
| GO:0044140 | 0.0039 | Inf | 0.0039 | 1 | 1 | negative regulation of growth of symbiont on or near host surface |
| GO:0006417 | 0.0046 | 3.6948 | 2.0783 | 7 | 527 | regulation of translation |
| GO:0006335 | 0.007 | 17.3495 | 0.1262 | 2 | 32 | DNA replication-dependent nucleosome assembly |
| GO:0035606 | 0.0079 | 256.5714 | 0.0079 | 1 | 2 | peptidyl-cysteine S-trans-nitrosylation |
| GO:0070488 | 0.0079 | 256.5714 | 0.0079 | 1 | 2 | neutrophil aggregation |
| GO:0000183 | 0.0079 | 16.2631 | 0.1341 | 2 | 34 | chromatin silencing at rDNA |
| GO:0000387 | 0.0093 | 14.8664 | 0.1459 | 2 | 37 | spliceosomal snRNP assembly |
| GOMFID | Pvalue | OddsRatio | ExpCount | Count | Size | Term |
| GO:0007156 | 0 | 12.6874 | 1.639 | 17 | 152 | homophilic cell adhesion via plasma membrane adhesion molecules |
| GO:0050911 | 0 | 6.8292 | 4.0006 | 23 | 371 | detection of chemical stimulus involved in sensory perception of smell |
| GO:0009593 | 0 | 5.5377 | 4.8524 | 23 | 450 | detection of chemical stimulus |
| GO:0050906 | 0 | 5.3822 | 4.9818 | 23 | 462 | detection of stimulus involved in sensory perception |
| GO:0007606 | 0 | 5.3076 | 5.0465 | 23 | 468 | sensory perception of chemical stimulus |
| GO:0098609 | 0 | 3.3773 | 8.4109 | 25 | 780 | cell-cell adhesion |
| GO:0009913 | 0 | 4.4124 | 3.7633 | 15 | 349 | epidermal cell differentiation |
| GO:0031424 | 0 | 5.4492 | 2.437 | 12 | 226 | keratinization |
| GO:0043588 | 0 | 3.7359 | 4.3995 | 15 | 408 | skin development |
| GO:0050877 | 0 | 2.4969 | 13.0692 | 29 | 1212 | nervous system process |
| GO:0007186 | 2e-04 | 2.3078 | 13.5005 | 28 | 1252 | G-protein coupled receptor signaling pathway |
| GO:0002904 | 3e-04 | 185.5838 | 0.0323 | 2 | 3 | positive regulation of B cell apoptotic process |
| GO:0022610 | 4e-04 | 2.1745 | 14.2446 | 28 | 1321 | biological adhesion |
| GO:0009395 | 7e-04 | 11.3564 | 0.399 | 4 | 37 | phospholipid catabolic process |
| GO:0032375 | 9e-04 | 18.65 | 0.1941 | 3 | 18 | negative regulation of cholesterol transport |
| GO:0009988 | 9e-04 | 7.2348 | 0.7548 | 5 | 70 | cell-cell recognition |
| GO:0090342 | 0.001 | 10.1261 | 0.4421 | 4 | 41 | regulation of cell aging |
| GO:0010901 | 0.0011 | 61.8536 | 0.0539 | 2 | 5 | regulation of very-low-density lipoprotein particle remodeling |
| GO:0035609 | 0.0011 | 61.8536 | 0.0539 | 2 | 5 | C-terminal protein deglutamylation |
| GO:0060429 | 0.0013 | 2.0875 | 13.0692 | 25 | 1212 | epithelium development |
| GO:0002740 | 0.0017 | 46.3873 | 0.0647 | 2 | 6 | negative regulation of cytokine secretion involved in immune response |
| GO:0046503 | 0.0029 | 7.34 | 0.5931 | 4 | 55 | glycerolipid catabolic process |
| GO:0016339 | 0.0033 | 11.183 | 0.3019 | 3 | 28 | calcium-dependent cell-cell adhesion via plasma membrane cell adhesion molecules |
| GO:0001906 | 0.0034 | 4.3828 | 1.4557 | 6 | 135 | cell killing |
| GO:0018149 | 0.0035 | 6.9309 | 0.6254 | 4 | 58 | peptide cross-linking |
| GO:0034371 | 0.004 | 26.5021 | 0.097 | 2 | 9 | chylomicron remodeling |
| GO:0034447 | 0.004 | 26.5021 | 0.097 | 2 | 9 | very-low-density lipoprotein particle clearance |
| GO:0030856 | 0.004 | 4.2499 | 1.4989 | 6 | 139 | regulation of epithelial cell differentiation |
| GO:0045670 | 0.0042 | 6.5649 | 0.6578 | 4 | 61 | regulation of osteoclast differentiation |
| GO:0032369 | 0.0044 | 9.983 | 0.3343 | 3 | 31 | negative regulation of lipid transport |
| GO:0065005 | 0.0044 | 9.983 | 0.3343 | 3 | 31 | protein-lipid complex assembly |
| GO:0009617 | 0.0046 | 2.4359 | 5.6612 | 13 | 525 | response to bacterium |
| GO:0002701 | 0.0049 | 9.6381 | 0.3451 | 3 | 32 | negative regulation of production of molecular mediator of immune response |
| GO:0010838 | 0.0049 | 23.1879 | 0.1078 | 2 | 10 | positive regulation of keratinocyte proliferation |
| GO:0034378 | 0.0049 | 23.1879 | 0.1078 | 2 | 10 | chylomicron assembly |
| GO:0090279 | 0.0053 | 9.3163 | 0.3558 | 3 | 33 | regulation of calcium ion import |
| GO:1905898 | 0.0053 | 9.3163 | 0.3558 | 3 | 33 | positive regulation of response to endoplasmic reticulum stress |
| GO:0010985 | 0.006 | 20.6101 | 0.1186 | 2 | 11 | negative regulation of lipoprotein particle clearance |
| GO:0048245 | 0.006 | 20.6101 | 0.1186 | 2 | 11 | eosinophil chemotaxis |
| GO:2000774 | 0.006 | 20.6101 | 0.1186 | 2 | 11 | positive regulation of cellular senescence |
| GO:0035195 | 0.007 | 3.0283 | 2.7821 | 8 | 258 | gene silencing by miRNA |
| GO:0002862 | 0.0071 | 18.548 | 0.1294 | 2 | 12 | negative regulation of inflammatory response to antigenic stimulus |
| GO:0033700 | 0.0071 | 18.548 | 0.1294 | 2 | 12 | phospholipid efflux |
| GO:0034384 | 0.0071 | 18.548 | 0.1294 | 2 | 12 | high-density lipoprotein particle clearance |
| GO:0055088 | 0.0076 | 4.3426 | 1.2185 | 5 | 113 | lipid homeostasis |
| GO:0042632 | 0.008 | 5.4191 | 0.7872 | 4 | 73 | cholesterol homeostasis |
| GO:0016441 | 0.0081 | 2.9445 | 2.8575 | 8 | 265 | posttranscriptional gene silencing |
| GO:0097201 | 0.0083 | 16.8607 | 0.1402 | 2 | 13 | negative regulation of transcription from RNA polymerase II promoter in response to stress |
| GO:0007339 | 0.0085 | 7.7607 | 0.4205 | 3 | 39 | binding of sperm to zona pellucida |
| GO:1901216 | 0.0088 | 5.2658 | 0.8087 | 4 | 75 | positive regulation of neuron death |
| GO:0010595 | 0.0092 | 5.1923 | 0.8195 | 4 | 76 | positive regulation of endothelial cell migration |
| GO:0045019 | 0.0097 | 15.4547 | 0.151 | 2 | 14 | negative regulation of nitric oxide biosynthetic process |
| GOMFID | Pvalue | OddsRatio | ExpCount | Count | Size | Term |
| GO:0032502 | 0 | 3.1753 | 45.5835 | 81 | 5825 | developmental process |
| GO:0009952 | 0 | 10.8979 | 1.526 | 14 | 195 | anterior/posterior pattern specification |
| GO:0032501 | 0 | 2.9087 | 54.5907 | 87 | 6976 | multicellular organismal process |
| GO:0009890 | 0 | 2.9228 | 12.779 | 31 | 1633 | negative regulation of biosynthetic process |
| GO:0016339 | 0 | 28.6511 | 0.2191 | 5 | 28 | calcium-dependent cell-cell adhesion via plasma membrane cell adhesion molecules |
| GO:0006355 | 0 | 2.4277 | 26.9823 | 50 | 3448 | regulation of transcription, DNA-templated |
| GO:2000113 | 0 | 3.0061 | 11.5191 | 29 | 1472 | negative regulation of cellular macromolecule biosynthetic process |
| GO:2001141 | 0 | 2.4035 | 27.1936 | 50 | 3475 | regulation of RNA biosynthetic process |
| GO:0048562 | 0 | 6.1367 | 2.0049 | 11 | 260 | embryonic organ morphogenesis |
| GO:0021761 | 0 | 10.3781 | 0.7591 | 7 | 97 | limbic system development |
| GO:0007416 | 0 | 8.196 | 1.0877 | 8 | 139 | synapse assembly |
| GO:0048663 | 0 | 12.8286 | 0.5321 | 6 | 68 | neuron fate commitment |
| GO:0007156 | 0 | 7.45 | 1.1895 | 8 | 152 | homophilic cell adhesion via plasma membrane adhesion molecules |
| GO:0045944 | 0 | 3.0128 | 8.3655 | 22 | 1069 | positive regulation of transcription from RNA polymerase II promoter |
| GO:0021543 | 0 | 7.0544 | 1.2521 | 8 | 160 | pallium development |
| GO:0007399 | 0 | 2.4935 | 14.851 | 31 | 2008 | nervous system development |
| GO:0019219 | 0 | 2.1159 | 31.5055 | 52 | 4026 | regulation of nucleobase-containing compound metabolic process |
| GO:0048706 | 0 | 8.181 | 0.9469 | 7 | 121 | embryonic skeletal system development |
| GO:0010629 | 1e-04 | 2.4728 | 14.2424 | 30 | 1820 | negative regulation of gene expression |
| GO:0072272 | 1e-04 | Inf | 0.0157 | 2 | 2 | proximal/distal pattern formation involved in metanephric nephron development |
| GO:0034654 | 1e-04 | 2.0776 | 31.9359 | 52 | 4081 | nucleobase-containing compound biosynthetic process |
| GO:0035239 | 1e-04 | 4.589 | 2.6372 | 11 | 337 | tube morphogenesis |
| GO:0048731 | 1e-04 | 2.5669 | 14.2355 | 29 | 2278 | system development |
| GO:0000122 | 1e-04 | 3.2037 | 5.9317 | 17 | 758 | negative regulation of transcription from RNA polymerase II promoter |
| GO:0009954 | 1e-04 | 19.3616 | 0.2426 | 4 | 31 | proximal/distal pattern formation |
| GO:0051254 | 1e-04 | 2.542 | 11.2765 | 25 | 1441 | positive regulation of RNA metabolic process |
| GO:0007517 | 2e-04 | 4.1466 | 2.9033 | 11 | 371 | muscle organ development |
| GO:0060537 | 2e-04 | 4.1349 | 2.9111 | 11 | 372 | muscle tissue development |
| GO:0061010 | 2e-04 | 257.616 | 0.0235 | 2 | 3 | gall bladder development |
| GO:0007519 | 2e-04 | 6.4645 | 1.1817 | 7 | 151 | skeletal muscle tissue development |
| GO:0035195 | 2e-04 | 4.8559 | 2.019 | 9 | 258 | gene silencing by miRNA |
| GO:0021542 | 2e-04 | 32.4395 | 0.1174 | 3 | 15 | dentate gyrus development |
| GO:0042127 | 2e-04 | 3.2167 | 5.2052 | 15 | 708 | regulation of cell proliferation |
| GO:0065007 | 2e-04 | 2.2216 | 88.3264 | 106 | 11287 | biological regulation |
| GO:0016441 | 2e-04 | 4.7211 | 2.0738 | 9 | 265 | posttranscriptional gene silencing |
| GO:0048598 | 2e-04 | 4.7107 | 2.087 | 9 | 292 | embryonic morphogenesis |
| GO:0007198 | 4e-04 | 128.8 | 0.0313 | 2 | 4 | adenylate cyclase-inhibiting serotonin receptor signaling pathway |
| GO:0072086 | 4e-04 | 128.8 | 0.0313 | 2 | 4 | specification of loop of Henle identity |
| GO:1903508 | 4e-04 | 2.4225 | 10.7209 | 23 | 1370 | positive regulation of nucleic acid-templated transcription |
| GO:0031047 | 4e-04 | 4.3256 | 2.2537 | 9 | 288 | gene silencing by RNA |
| GO:0034641 | 5e-04 | 1.8297 | 49.2302 | 68 | 6291 | cellular nitrogen compound metabolic process |
| GO:0050794 | 5e-04 | 2.1211 | 56.8737 | 73 | 8509 | regulation of cellular process |
| GO:1903507 | 5e-04 | 2.5051 | 8.9054 | 20 | 1138 | negative regulation of nucleic acid-templated transcription |
| GO:0007420 | 5e-04 | 3.0277 | 5.0631 | 14 | 647 | brain development |
| GO:0034249 | 6e-04 | 3.7913 | 2.8563 | 10 | 365 | negative regulation of cellular amide metabolic process |
| GO:0002568 | 6e-04 | 85.8613 | 0.0391 | 2 | 5 | somatic diversification of T cell receptor genes |
| GO:0033153 | 6e-04 | 85.8613 | 0.0391 | 2 | 5 | T cell receptor V(D)J recombination |
| GO:0031326 | 6e-04 | 3.8356 | 2.9315 | 10 | 480 | regulation of cellular biosynthetic process |
| GO:0007267 | 7e-04 | 2.275 | 11.8948 | 24 | 1520 | cell-cell signaling |
| GO:0010556 | 8e-04 | 4.0316 | 2.4876 | 9 | 406 | regulation of macromolecule biosynthetic process |
| GO:0007405 | 8e-04 | 10.4403 | 0.4226 | 4 | 54 | neuroblast proliferation |
| GO:0014062 | 9e-04 | 64.392 | 0.047 | 2 | 6 | regulation of serotonin secretion |
| GO:0048729 | 0.001 | 2.9668 | 4.7657 | 13 | 609 | tissue morphogenesis |
| GO:0098609 | 0.0011 | 2.685 | 6.1039 | 15 | 780 | cell-cell adhesion |
| GO:0051253 | 0.0012 | 2.338 | 9.4845 | 20 | 1212 | negative regulation of RNA metabolic process |
| GO:0048645 | 0.0012 | 9.4882 | 0.4617 | 4 | 59 | animal organ formation |
| GO:0051171 | 0.0012 | 3.0121 | 4.9861 | 13 | 823 | regulation of nitrogen compound metabolic process |
| GO:0090304 | 0.0012 | 1.7717 | 38.3919 | 55 | 4906 | nucleic acid metabolic process |
| GO:1901576 | 0.0012 | 1.7484 | 47.7434 | 65 | 6101 | organic substance biosynthetic process |
| GO:0007188 | 0.0012 | 5.4192 | 1.1895 | 6 | 152 | adenylate cyclase-modulating G-protein coupled receptor signaling pathway |
| GO:0009792 | 0.0013 | 3.0129 | 4.3118 | 12 | 551 | embryo development ending in birth or egg hatching |
| GO:0048518 | 0.0019 | 1.7166 | 41.8742 | 58 | 5351 | positive regulation of biological process |
| GO:0021953 | 0.0019 | 6.0909 | 0.8813 | 5 | 115 | central nervous system neuron differentiation |
| GO:0061004 | 0.0021 | 36.7886 | 0.0704 | 2 | 9 | pattern specification involved in kidney development |
| GO:0007268 | 0.0021 | 2.828 | 4.5779 | 12 | 585 | chemical synaptic transmission |
| GO:0099537 | 0.0022 | 2.8178 | 4.5936 | 12 | 587 | trans-synaptic signaling |
| GO:0060173 | 0.0022 | 4.819 | 1.3303 | 6 | 170 | limb development |
| GO:0010628 | 0.0022 | 2.0309 | 13.7651 | 25 | 1759 | positive regulation of gene expression |
| GO:0072088 | 0.0023 | 7.783 | 0.5556 | 4 | 71 | nephron epithelium morphogenesis |
| GO:0032467 | 0.0023 | 12.5424 | 0.2661 | 3 | 34 | positive regulation of cytokinesis |
| GO:0061333 | 0.0026 | 7.5565 | 0.5713 | 4 | 73 | renal tubule morphogenesis |
| GO:0090370 | 0.0026 | 32.188 | 0.0783 | 2 | 10 | negative regulation of cholesterol efflux |
| GO:0010557 | 0.003 | 2.0341 | 12.5364 | 23 | 1602 | positive regulation of macromolecule biosynthetic process |
| GO:0030326 | 0.0031 | 5.4129 | 0.986 | 5 | 126 | embryonic limb morphogenesis |
| GO:2000774 | 0.0032 | 28.6098 | 0.0861 | 2 | 11 | positive regulation of cellular senescence |
| GO:0000079 | 0.0036 | 6.8575 | 0.626 | 4 | 80 | regulation of cyclin-dependent protein serine/threonine kinase activity |
| GO:0006725 | 0.0037 | 1.6449 | 44.8871 | 60 | 5736 | cellular aromatic compound metabolic process |
| GO:0000904 | 0.0038 | 2.6233 | 4.9144 | 12 | 628 | cell morphogenesis involved in differentiation |
| GO:0060272 | 0.0038 | 25.7472 | 0.0939 | 2 | 12 | embryonic skeletal joint morphogenesis |
| GO:0001708 | 0.0039 | 6.6808 | 0.6417 | 4 | 82 | cell fate specification |
| GO:0061053 | 0.0039 | 6.6808 | 0.6417 | 4 | 82 | somite development |
| GO:0031328 | 0.004 | 1.9573 | 13.5929 | 24 | 1737 | positive regulation of cellular biosynthetic process |
| GO:0021520 | 0.0045 | 23.4051 | 0.1017 | 2 | 13 | spinal cord motor neuron cell fate specification |
| GO:0071880 | 0.0045 | 23.4051 | 0.1017 | 2 | 13 | adenylate cyclase-activating adrenergic receptor signaling pathway |
| GO:0006935 | 0.0046 | 2.6814 | 4.3901 | 11 | 561 | chemotaxis |
| GO:0080090 | 0.0046 | 2.1365 | 10.9645 | 20 | 1784 | regulation of primary metabolic process |
| GO:0030855 | 0.0047 | 2.4469 | 5.7126 | 13 | 730 | epithelial cell differentiation |
| GO:0046632 | 0.0048 | 6.2764 | 0.6808 | 4 | 87 | alpha-beta T cell differentiation |
| GO:0060993 | 0.0048 | 6.2764 | 0.6808 | 4 | 87 | kidney morphogenesis |
| GO:0030154 | 0.0048 | 1.8958 | 16.397 | 27 | 2422 | cell differentiation |
| GO:0072080 | 0.005 | 6.2013 | 0.6886 | 4 | 88 | nephron tubule development |
| GO:0006837 | 0.0052 | 21.4533 | 0.1096 | 2 | 14 | serotonin transport |
| GO:0048853 | 0.0052 | 21.4533 | 0.1096 | 2 | 14 | forebrain morphogenesis |
| GO:0046483 | 0.0053 | 1.609 | 44.6053 | 59 | 5700 | heterocycle metabolic process |
| GO:0043583 | 0.0054 | 3.983 | 1.5964 | 6 | 204 | ear development |
| GO:0035107 | 0.0057 | 4.6727 | 1.1347 | 5 | 145 | appendage morphogenesis |
| GO:0009888 | 0.0058 | 2.2482 | 7.2789 | 15 | 1028 | tissue development |
| GO:0007379 | 0.006 | 19.8018 | 0.1174 | 2 | 15 | segment specification |
| GO:0042472 | 0.0063 | 5.7857 | 0.7356 | 4 | 94 | inner ear morphogenesis |
| GO:0050767 | 0.0065 | 2.4376 | 5.2666 | 12 | 673 | regulation of neurogenesis |
| GO:0007218 | 0.0066 | 5.7218 | 0.7434 | 4 | 95 | neuropeptide signaling pathway |
| GO:0021879 | 0.0066 | 8.4446 | 0.3834 | 3 | 49 | forebrain neuron differentiation |
| GO:0022037 | 0.0068 | 5.6592 | 0.7512 | 4 | 96 | metencephalon development |
| GO:0048747 | 0.007 | 8.2644 | 0.3913 | 3 | 50 | muscle fiber development |
| GO:0008284 | 0.0073 | 2.237 | 6.7221 | 14 | 859 | positive regulation of cell proliferation |
| GO:0021515 | 0.0074 | 8.0917 | 0.3991 | 3 | 51 | cell differentiation in spinal cord |
| GO:0048535 | 0.0077 | 17.1595 | 0.133 | 2 | 17 | lymph node development |
| GO:0001979 | 0.0078 | Inf | 0.0078 | 1 | 1 | regulation of systemic arterial blood pressure by chemoreceptor signaling |
| GO:0001980 | 0.0078 | Inf | 0.0078 | 1 | 1 | regulation of systemic arterial blood pressure by ischemic conditions |
| GO:0003029 | 0.0078 | Inf | 0.0078 | 1 | 1 | detection of hypoxic conditions in blood by carotid body chemoreceptor signaling |
| GO:0003142 | 0.0078 | Inf | 0.0078 | 1 | 1 | cardiogenic plate morphogenesis |
| GO:0048621 | 0.0078 | Inf | 0.0078 | 1 | 1 | post-embryonic digestive tract morphogenesis |
| GO:0060807 | 0.0078 | Inf | 0.0078 | 1 | 1 | regulation of transcription from RNA polymerase II promoter involved in definitive endodermal cell fate specification |
| GO:0061011 | 0.0078 | Inf | 0.0078 | 1 | 1 | hepatic duct development |
| GO:0061153 | 0.0078 | Inf | 0.0078 | 1 | 1 | trachea gland development |
| GO:0061682 | 0.0078 | Inf | 0.0078 | 1 | 1 | seminal vesicle morphogenesis |
| GO:0070473 | 0.0078 | Inf | 0.0078 | 1 | 1 | negative regulation of uterine smooth muscle contraction |
| GO:1903769 | 0.0078 | Inf | 0.0078 | 1 | 1 | negative regulation of cell proliferation in bone marrow |
| GO:2000287 | 0.0078 | Inf | 0.0078 | 1 | 1 | positive regulation of myotome development |
| GO:0019932 | 0.0078 | 3.2607 | 2.2694 | 7 | 290 | second-messenger-mediated signaling |
| GO:0007411 | 0.0079 | 3.6641 | 1.7294 | 6 | 221 | axon guidance |
| GO:0003002 | 0.0079 | 5.4199 | 0.7828 | 4 | 114 | regionalization |
| GO:0045597 | 0.0082 | 2.2039 | 6.816 | 14 | 871 | positive regulation of cell differentiation |
| GO:0006417 | 0.0084 | 2.5765 | 4.124 | 10 | 527 | regulation of translation |
| GO:0032372 | 0.0086 | 16.086 | 0.1409 | 2 | 18 | negative regulation of sterol transport |
| GO:0031324 | 0.0089 | 1.7876 | 16.1959 | 26 | 2196 | negative regulation of cellular metabolic process |
| GO:1901360 | 0.0089 | 1.5543 | 46.5304 | 60 | 5946 | organic cyclic compound metabolic process |
| GO:0007631 | 0.0093 | 5.1521 | 0.8217 | 4 | 105 | feeding behavior |
| GO:0042953 | 0.0095 | 15.1388 | 0.1487 | 2 | 19 | lipoprotein transport |
| GO:0048557 | 0.0095 | 15.1388 | 0.1487 | 2 | 19 | embryonic digestive tract morphogenesis |
| GO:0051152 | 0.0095 | 15.1388 | 0.1487 | 2 | 19 | positive regulation of smooth muscle cell differentiation |
| GO:0072079 | 0.0095 | 15.1388 | 0.1487 | 2 | 19 | nephron tubule formation |
| GO:0051173 | 0.0099 | 1.67 | 22.1462 | 33 | 2830 | positive regulation of nitrogen compound metabolic process |
| GOMFID | Pvalue | OddsRatio | ExpCount | Count | Size | Term |
| GO:0019730 | 0 | 72.518 | 0.1116 | 6 | 43 | antimicrobial humoral response |
| GO:0050911 | 0 | 12.5231 | 1.0287 | 10 | 371 | detection of chemical stimulus involved in sensory perception of smell |
| GO:0009593 | 0 | 10.2234 | 1.2478 | 10 | 450 | detection of chemical stimulus |
| GO:0050906 | 0 | 9.9444 | 1.281 | 10 | 462 | detection of stimulus involved in sensory perception |
| GO:0031640 | 0 | 39.5417 | 0.1553 | 5 | 56 | killing of cells of other organism |
| GO:0043312 | 0 | 9.8324 | 1.2949 | 10 | 467 | neutrophil degranulation |
| GO:0007606 | 0 | 9.8104 | 1.2977 | 10 | 468 | sensory perception of chemical stimulus |
| GO:0042119 | 0 | 9.5946 | 1.3254 | 10 | 478 | neutrophil activation |
| GO:0002275 | 0 | 8.7988 | 1.4391 | 10 | 519 | myeloid cell activation involved in immune response |
| GO:0002444 | 0 | 8.7279 | 1.4502 | 10 | 523 | myeloid leukocyte mediated immunity |
| GO:0043207 | 0 | 6.9744 | 2.2571 | 12 | 814 | response to external biotic stimulus |
| GO:0035821 | 0 | 18.4271 | 0.3882 | 6 | 140 | modification of morphology or physiology of other organism |
| GO:0051873 | 0 | 128.373 | 0.0333 | 3 | 12 | killing by host of symbiont cells |
| GO:0009913 | 0 | 10.0455 | 0.9677 | 8 | 349 | epidermal cell differentiation |
| GO:0070488 | 0 | Inf | 0.0055 | 2 | 2 | neutrophil aggregation |
| GO:0002263 | 0 | 6.8172 | 1.8328 | 10 | 661 | cell activation involved in immune response |
| GO:0051818 | 0 | 76.9952 | 0.0499 | 3 | 18 | disruption of cells of other organism involved in symbiotic interaction |
| GO:0045055 | 0 | 6.3295 | 1.9659 | 10 | 709 | regulated exocytosis |
| GO:0007186 | 0 | 4.9002 | 3.4716 | 13 | 1252 | G-protein coupled receptor signaling pathway |
| GO:0043588 | 1e-04 | 7.2504 | 1.1313 | 7 | 408 | skin development |
| GO:0009635 | 2e-04 | 150.5023 | 0.0194 | 2 | 7 | response to herbicide |
| GO:0050877 | 4e-04 | 4.0362 | 3.3607 | 11 | 1212 | nervous system process |
| GO:0061844 | 4e-04 | 24.0119 | 0.1414 | 3 | 51 | antimicrobial humoral immune response mediated by antimicrobial peptide |
| GO:0031424 | 4e-04 | 9.0288 | 0.6267 | 5 | 226 | keratinization |
| GO:0017014 | 5e-04 | 75.2279 | 0.0333 | 2 | 12 | protein nitrosylation |
| GO:0032119 | 5e-04 | 75.2279 | 0.0333 | 2 | 12 | sequestering of zinc ion |
| GO:0042742 | 7e-04 | 11.2702 | 0.398 | 4 | 153 | defense response to bacterium |
| GO:0002523 | 7e-04 | 62.6822 | 0.0388 | 2 | 14 | leukocyte migration involved in inflammatory response |
| GO:0051851 | 7e-04 | 18.8794 | 0.1775 | 3 | 64 | modification by host of symbiont morphology or physiology |
| GO:0045321 | 8e-04 | 3.8651 | 3.1166 | 10 | 1124 | leukocyte activation |
| GO:0042268 | 9e-04 | 53.7209 | 0.0444 | 2 | 16 | regulation of cytolysis |
| GO:0032602 | 0.0012 | 15.7642 | 0.2107 | 3 | 76 | chemokine production |
| GO:0044116 | 0.0012 | 44.2326 | 0.0527 | 2 | 19 | growth of symbiont involved in interaction with host |
| GO:0050830 | 0.0017 | 14.0261 | 0.2357 | 3 | 85 | defense response to Gram-positive bacterium |
| GO:0046916 | 0.0022 | 12.6319 | 0.2606 | 3 | 94 | cellular transition metal ion homeostasis |
| GO:0018198 | 0.0023 | 31.3178 | 0.0721 | 2 | 26 | peptidyl-cysteine modification |
| GO:0070207 | 0.0025 | 30.0633 | 0.0749 | 2 | 27 | protein homotrimerization |
| GO:0016192 | 0.0026 | 2.9688 | 4.9301 | 12 | 1778 | vesicle-mediated transport |
| GO:0055069 | 0.0027 | 28.9052 | 0.0776 | 2 | 28 | zinc ion homeostasis |
| GO:0019547 | 0.0028 | Inf | 0.0028 | 1 | 1 | arginine catabolic process to ornithine |
| GO:0032644 | 0.0028 | Inf | 0.0028 | 1 | 1 | regulation of fractalkine production |
| GO:0044140 | 0.0028 | Inf | 0.0028 | 1 | 1 | negative regulation of growth of symbiont on or near host surface |
| GO:0050754 | 0.0028 | Inf | 0.0028 | 1 | 1 | positive regulation of fractalkine biosynthetic process |
| GO:0050756 | 0.0028 | Inf | 0.0028 | 1 | 1 | fractalkine metabolic process |
| GO:0060007 | 0.0028 | Inf | 0.0028 | 1 | 1 | linear vestibuloocular reflex |
| GO:0070965 | 0.0028 | Inf | 0.0028 | 1 | 1 | positive regulation of neutrophil mediated killing of fungus |
| GO:1900150 | 0.0028 | Inf | 0.0028 | 1 | 1 | regulation of defense response to fungus |
| GO:0050729 | 0.0035 | 10.7323 | 0.305 | 3 | 110 | positive regulation of inflammatory response |
| GO:0032940 | 0.0038 | 3.1043 | 3.8098 | 10 | 1374 | secretion by cell |
| GO:0050832 | 0.0047 | 21.3598 | 0.103 | 2 | 38 | defense response to fungus |
| GO:0006952 | 0.0048 | 4.2825 | 1.6048 | 6 | 650 | defense response |
| GO:0010963 | 0.0055 | 367.7955 | 0.0055 | 1 | 2 | regulation of L-arginine import |
| GO:0035606 | 0.0055 | 367.7955 | 0.0055 | 1 | 2 | peptidyl-cysteine S-trans-nitrosylation |
| GO:0050725 | 0.0055 | 367.7955 | 0.0055 | 1 | 2 | positive regulation of interleukin-1 beta biosynthetic process |
| GO:0070949 | 0.0055 | 367.7955 | 0.0055 | 1 | 2 | regulation of neutrophil mediated killing of symbiont cell |
| GO:0070960 | 0.0055 | 367.7955 | 0.0055 | 1 | 2 | positive regulation of neutrophil mediated cytotoxicity |
| GO:0031343 | 0.0063 | 18.3131 | 0.1192 | 2 | 43 | positive regulation of cell killing |
| GO:0045087 | 0.0078 | 3.4034 | 2.3236 | 7 | 838 | innate immune response |
| GO:0002526 | 0.0081 | 7.8464 | 0.4131 | 3 | 149 | acute inflammatory response |
| GO:0010043 | 0.0081 | 15.9693 | 0.1359 | 2 | 49 | response to zinc ion |
| GO:0015891 | 0.0083 | 183.8864 | 0.0083 | 1 | 3 | siderophore transport |
| GO:0032827 | 0.0083 | 183.8864 | 0.0083 | 1 | 3 | negative regulation of natural killer cell differentiation involved in immune response |
| GO:0045360 | 0.0083 | 183.8864 | 0.0083 | 1 | 3 | regulation of interleukin-1 biosynthetic process |
| GO:0051714 | 0.0083 | 183.8864 | 0.0083 | 1 | 3 | positive regulation of cytolysis in other organism |
| GO:0050896 | 0.0098 | 2.1699 | 22.7509 | 31 | 8205 | response to stimulus |
| GO:2001244 | 0.0098 | 14.4293 | 0.1497 | 2 | 54 | positive regulation of intrinsic apoptotic signaling pathway |
| GOMFID | Pvalue | OddsRatio | ExpCount | Count | Size | Term |
| GO:0010469 | 1e-04 | 3.0289 | 6.1185 | 17 | 561 | regulation of receptor activity |
| GO:0042107 | 2e-04 | 6.7034 | 1.1452 | 7 | 105 | cytokine metabolic process |
| GO:0014717 | 4e-04 | 183.44 | 0.0327 | 2 | 3 | regulation of satellite cell activation involved in skeletal muscle regeneration |
| GO:0045079 | 4e-04 | 183.44 | 0.0327 | 2 | 3 | negative regulation of chemokine biosynthetic process |
| GO:0045085 | 4e-04 | 183.44 | 0.0327 | 2 | 3 | negative regulation of interleukin-2 biosynthetic process |
| GO:0070458 | 4e-04 | 183.44 | 0.0327 | 2 | 3 | cellular detoxification of nitrogen compound |
| GO:0042035 | 5e-04 | 6.5141 | 1.0034 | 6 | 92 | regulation of cytokine biosynthetic process |
| GO:0035195 | 5e-04 | 3.8159 | 2.8139 | 10 | 258 | gene silencing by miRNA |
| GO:0016441 | 7e-04 | 3.7095 | 2.8902 | 10 | 265 | posttranscriptional gene silencing |
| GO:0006417 | 7e-04 | 2.8103 | 5.7477 | 15 | 527 | regulation of translation |
| GO:0018916 | 7e-04 | 91.7143 | 0.0436 | 2 | 4 | nitrobenzene metabolic process |
| GO:0021615 | 7e-04 | 91.7143 | 0.0436 | 2 | 4 | glossopharyngeal nerve morphogenesis |
| GO:0051602 | 0.0012 | 9.4934 | 0.469 | 4 | 43 | response to electrical stimulus |
| GO:0031047 | 0.0013 | 3.3977 | 3.141 | 10 | 288 | gene silencing by RNA |
| GO:0009952 | 0.0014 | 4.0161 | 2.1267 | 8 | 195 | anterior/posterior pattern specification |
| GO:0014719 | 0.0017 | 45.8514 | 0.0654 | 2 | 6 | skeletal muscle satellite cell activation |
| GO:0045765 | 0.0021 | 3.4139 | 2.8029 | 9 | 257 | regulation of angiogenesis |
| GO:0030878 | 0.0022 | 13.1617 | 0.2618 | 3 | 24 | thyroid gland development |
| GO:0034249 | 0.0023 | 2.9385 | 3.9808 | 11 | 365 | negative regulation of cellular amide metabolic process |
| GO:0002690 | 0.0026 | 5.6615 | 0.9489 | 5 | 87 | positive regulation of leukocyte chemotaxis |
| GO:0002637 | 0.0026 | 7.5513 | 0.578 | 4 | 53 | regulation of immunoglobulin production |
| GO:0045647 | 0.0032 | 30.5638 | 0.0873 | 2 | 8 | negative regulation of erythrocyte differentiation |
| GO:0071863 | 0.0032 | 30.5638 | 0.0873 | 2 | 8 | regulation of cell proliferation in bone marrow |
| GO:1903251 | 0.0032 | 30.5638 | 0.0873 | 2 | 8 | multi-ciliated epithelial cell differentiation |
| GO:0002237 | 0.0033 | 2.9628 | 3.5773 | 10 | 328 | response to molecule of bacterial origin |
| GO:0048704 | 0.0033 | 5.3345 | 1.0034 | 5 | 92 | embryonic skeletal system morphogenesis |
| GO:0090023 | 0.0034 | 11.0531 | 0.3054 | 3 | 28 | positive regulation of neutrophil chemotaxis |
| GO:0031099 | 0.0035 | 3.8016 | 1.9522 | 7 | 179 | regeneration |
| GO:0032101 | 0.004 | 2.2431 | 7.6018 | 16 | 697 | regulation of response to external stimulus |
| GO:0008283 | 0.0041 | 1.7387 | 21.4311 | 34 | 1965 | cell proliferation |
| GO:0043403 | 0.0042 | 10.2331 | 0.3272 | 3 | 30 | skeletal muscle tissue regeneration |
| GO:0002701 | 0.005 | 9.5262 | 0.349 | 3 | 32 | negative regulation of production of molecular mediator of immune response |
| GO:0039530 | 0.005 | 22.92 | 0.1091 | 2 | 10 | MDA-5 signaling pathway |
| GO:0042178 | 0.005 | 22.92 | 0.1091 | 2 | 10 | xenobiotic catabolic process |
| GO:0048514 | 0.0059 | 2.3583 | 5.8349 | 13 | 535 | blood vessel morphogenesis |
| GO:0009888 | 0.0061 | 1.7141 | 20.3186 | 32 | 1863 | tissue development |
| GO:0051024 | 0.0061 | 20.3721 | 0.12 | 2 | 11 | positive regulation of immunoglobulin secretion |
| GO:1902622 | 0.0065 | 8.6315 | 0.3817 | 3 | 35 | regulation of neutrophil migration |
| GO:0043043 | 0.0068 | 2.0664 | 8.7469 | 17 | 802 | peptide biosynthetic process |
| GO:1900029 | 0.0073 | 18.3337 | 0.1309 | 2 | 12 | positive regulation of ruffle assembly |
| GO:0003009 | 0.0075 | 8.1227 | 0.4035 | 3 | 37 | skeletal muscle contraction |
| GO:0002703 | 0.0078 | 3.6704 | 1.7232 | 6 | 158 | regulation of leukocyte mediated immunity |
| GO:0043616 | 0.0081 | 7.8901 | 0.4144 | 3 | 38 | keratinocyte proliferation |
| GO:0010558 | 0.0085 | 1.7398 | 16.7086 | 27 | 1532 | negative regulation of macromolecule biosynthetic process |
| GO:0002708 | 0.0087 | 5.2789 | 0.8071 | 4 | 74 | positive regulation of lymphocyte mediated immunity |
| GO:1903034 | 0.0092 | 3.5296 | 1.7886 | 6 | 164 | regulation of response to wounding |
| GO:0014744 | 0.0099 | 15.2762 | 0.1527 | 2 | 14 | positive regulation of muscle adaptation |
| GOMFID | Pvalue | OddsRatio | ExpCount | Count | Size | Term |
| GO:0051787 | 3e-04 | 29.9606 | 0.1379 | 3 | 11 | misfolded protein binding |
| GO:0005094 | 5e-04 | 159.0647 | 0.0376 | 2 | 3 | Rho GDP-dissociation inhibitor activity |
| GO:0016744 | 5e-04 | 159.0647 | 0.0376 | 2 | 3 | transferase activity, transferring aldehyde or ketonic groups |
| GO:1903231 | 5e-04 | 5.4543 | 1.3918 | 7 | 111 | mRNA binding involved in posttranscriptional gene silencing |
| GO:0004082 | 9e-04 | 79.5274 | 0.0502 | 2 | 4 | bisphosphoglycerate mutase activity |
| GO:0004583 | 9e-04 | 79.5274 | 0.0502 | 2 | 4 | dolichyl-phosphate-glucose-glycolipid alpha-glucosyltransferase activity |
| GO:0046538 | 9e-04 | 79.5274 | 0.0502 | 2 | 4 | 2,3-bisphosphoglycerate-dependent phosphoglycerate mutase activity |
| GO:0016787 | 9e-04 | 1.7536 | 29.9798 | 47 | 2391 | hydrolase activity |
| GO:0004126 | 0.0042 | 26.5025 | 0.1003 | 2 | 8 | cytidine deaminase activity |
| GO:0003924 | 0.0063 | 2.8507 | 3.3227 | 9 | 265 | GTPase activity |
| GO:0050786 | 0.008 | 17.665 | 0.1379 | 2 | 11 | RAGE receptor binding |
| GOMFID | Pvalue | OddsRatio | ExpCount | Count | Size | Term |
| GO:0005094 | 5e-04 | 157.4778 | 0.038 | 2 | 3 | Rho GDP-dissociation inhibitor activity |
| GO:0016744 | 5e-04 | 157.4778 | 0.038 | 2 | 3 | transferase activity, transferring aldehyde or ketonic groups |
| GO:0004082 | 9e-04 | 78.734 | 0.0506 | 2 | 4 | bisphosphoglycerate mutase activity |
| GO:0004583 | 9e-04 | 78.734 | 0.0506 | 2 | 4 | dolichyl-phosphate-glucose-glycolipid alpha-glucosyltransferase activity |
| GO:0046538 | 9e-04 | 78.734 | 0.0506 | 2 | 4 | 2,3-bisphosphoglycerate-dependent phosphoglycerate mutase activity |
| GO:0016787 | 0.0021 | 1.6828 | 30.2752 | 46 | 2391 | hydrolase activity |
| GO:1903231 | 0.0029 | 4.5599 | 1.4055 | 6 | 111 | mRNA binding involved in posttranscriptional gene silencing |
| GO:0004126 | 0.0042 | 26.2381 | 0.1013 | 2 | 8 | cytidine deaminase activity |
| GO:0003924 | 0.0067 | 2.8213 | 3.3555 | 9 | 265 | GTPase activity |
| GO:0004252 | 0.0074 | 3.2889 | 2.2412 | 7 | 177 | serine-type endopeptidase activity |
| GO:0019864 | 0.0081 | 17.4888 | 0.1393 | 2 | 11 | IgG binding |
| GO:0050786 | 0.0081 | 17.4888 | 0.1393 | 2 | 11 | RAGE receptor binding |
| GO:0051787 | 0.0081 | 17.4888 | 0.1393 | 2 | 11 | misfolded protein binding |
| GOMFID | Pvalue | OddsRatio | ExpCount | Count | Size | Term |
| GO:0043565 | 0 | 1.902 | 31.2519 | 55 | 996 | sequence-specific DNA binding |
| GO:0005515 | 0 | 1.5238 | 286.7168 | 326 | 9690 | protein binding |
| GO:0000975 | 0 | 1.9744 | 25.6353 | 47 | 817 | regulatory region DNA binding |
| GO:0005126 | 2e-04 | 2.6039 | 8.2523 | 20 | 263 | cytokine receptor binding |
| GO:0008134 | 3e-04 | 2.0897 | 15.8142 | 31 | 504 | transcription factor binding |
| GO:0031727 | 3e-04 | 46.5743 | 0.1569 | 3 | 5 | CCR2 chemokine receptor binding |
| GO:0003690 | 5e-04 | 1.8147 | 24.5999 | 42 | 784 | double-stranded DNA binding |
| GO:0001012 | 5e-04 | 1.9442 | 18.5754 | 34 | 592 | RNA polymerase II regulatory region DNA binding |
| GO:0004879 | 6e-04 | 5.4638 | 1.4747 | 7 | 47 | nuclear receptor activity |
| GO:0140110 | 0.0011 | 1.5439 | 47.6309 | 69 | 1518 | transcription regulator activity |
| GO:0003676 | 0.0013 | 1.3615 | 121.3678 | 151 | 3868 | nucleic acid binding |
| GO:0001159 | 0.0013 | 2.1207 | 11.4841 | 23 | 366 | core promoter proximal region DNA binding |
| GO:0005125 | 0.0013 | 2.5174 | 6.7775 | 16 | 216 | cytokine activity |
| GO:0000976 | 0.0014 | 1.8848 | 17.3781 | 31 | 560 | transcription regulatory region sequence-specific DNA binding |
| GO:0000978 | 0.0016 | 2.119 | 10.9821 | 22 | 350 | RNA polymerase II core promoter proximal region sequence-specific DNA binding |
| GO:0019904 | 0.0017 | 1.7856 | 20.6777 | 35 | 659 | protein domain specific binding |
| GO:0003707 | 0.002 | 4.3682 | 1.7885 | 7 | 57 | steroid hormone receptor activity |
| GO:0001223 | 0.0026 | 8.2894 | 0.5962 | 4 | 19 | transcription coactivator binding |
| GO:0003735 | 0.0027 | 2.7251 | 4.7066 | 12 | 150 | structural constituent of ribosome |
| GO:0046404 | 0.0029 | 61.9802 | 0.0941 | 2 | 3 | ATP-dependent polydeoxyribonucleotide 5'-hydroxyl-kinase activity |
| GO:0051731 | 0.0057 | 30.9881 | 0.1255 | 2 | 4 | polynucleotide 5'-hydroxyl-kinase activity |
| GO:0016247 | 0.0064 | 2.6946 | 3.9536 | 10 | 126 | channel regulator activity |
| GO:0001046 | 0.0078 | 2.7824 | 3.4515 | 9 | 110 | core promoter sequence-specific DNA binding |
| GO:0008170 | 0.0078 | 3.007 | 2.8553 | 8 | 91 | N-methyltransferase activity |
| GO:0003682 | 0.0079 | 1.7601 | 14.8415 | 25 | 473 | chromatin binding |
| GO:0001134 | 0.0086 | 8.4632 | 0.4393 | 3 | 14 | transcription factor activity, transcription factor recruiting |
| GO:0050780 | 0.0086 | 8.4632 | 0.4393 | 3 | 14 | dopamine receptor binding |
| GO:0042054 | 0.0087 | 3.6632 | 1.7885 | 6 | 57 | histone methyltransferase activity |
| GO:0000981 | 0.0089 | 1.6134 | 21.3522 | 33 | 688 | RNA polymerase II transcription factor activity, sequence-specific DNA binding |
| GO:0046923 | 0.0092 | 20.6574 | 0.1569 | 2 | 5 | ER retention sequence binding |
| GO:0046976 | 0.0092 | 20.6574 | 0.1569 | 2 | 5 | histone methyltransferase activity (H3-K27 specific) |
| GO:1990948 | 0.0092 | 20.6574 | 0.1569 | 2 | 5 | ubiquitin ligase inhibitor activity |
| GOMFID | Pvalue | OddsRatio | ExpCount | Count | Size | Term |
| GO:0031727 | 2e-04 | 51.9747 | 0.1411 | 3 | 5 | CCR2 chemokine receptor binding |
| GO:0140110 | 7e-04 | 1.5993 | 42.849 | 64 | 1518 | transcription regulator activity |
| GO:0044212 | 9e-04 | 1.7983 | 23.0053 | 39 | 815 | transcription regulatory region DNA binding |
| GO:1990837 | 9e-04 | 1.8588 | 19.9567 | 35 | 707 | sequence-specific double-stranded DNA binding |
| GO:0001067 | 0.001 | 1.7911 | 23.0899 | 39 | 818 | regulatory region nucleic acid binding |
| GO:0000981 | 0.0018 | 1.7812 | 20.7471 | 35 | 735 | RNA polymerase II transcription factor activity, sequence-specific DNA binding |
| GO:0005515 | 0.0028 | 1.3589 | 260.4183 | 287 | 9690 | protein binding |
| GO:0000977 | 0.0028 | 1.8291 | 16.6823 | 29 | 591 | RNA polymerase II regulatory region sequence-specific DNA binding |
| GO:0003677 | 0.0041 | 1.401 | 66.2777 | 87 | 2348 | DNA binding |
| GO:0008134 | 0.0047 | 1.8429 | 14.2266 | 25 | 504 | transcription factor binding |
| GO:0019904 | 0.007 | 1.6871 | 18.6018 | 30 | 659 | protein domain specific binding |
| GO:0046923 | 0.0075 | 23.0476 | 0.1411 | 2 | 5 | ER retention sequence binding |
| GO:0005126 | 0.0079 | 2.119 | 7.4238 | 15 | 263 | cytokine receptor binding |
| GO:0005125 | 0.0085 | 2.2399 | 6.0971 | 13 | 216 | cytokine activity |
| GO:0046965 | 0.0095 | 7.9905 | 0.4516 | 3 | 16 | retinoid X receptor binding |
| GOMFID | Pvalue | OddsRatio | ExpCount | Count | Size | Term |
| GO:0004984 | 0 | 13.9347 | 1.5353 | 16 | 371 | olfactory receptor activity |
| GO:0004930 | 0 | 7.3647 | 3.2445 | 18 | 784 | G-protein coupled receptor activity |
| GO:0099600 | 0 | 4.5519 | 5.0571 | 18 | 1222 | transmembrane receptor activity |
| GO:0038023 | 0 | 4.3221 | 5.3012 | 18 | 1281 | signaling receptor activity |
| GO:0060089 | 0 | 3.5343 | 6.3565 | 18 | 1536 | molecular transducer activity |
| GO:0015245 | 0.0011 | 49.5785 | 0.0497 | 2 | 12 | fatty acid transporter activity |
| GO:0004993 | 0.0034 | 26.0794 | 0.0869 | 2 | 21 | G-protein coupled serotonin receptor activity |
| GO:0015636 | 0.0041 | Inf | 0.0041 | 1 | 1 | short-chain fatty acid uptake transporter activity |
| GO:0102116 | 0.0041 | Inf | 0.0041 | 1 | 1 | laurate hydroxylase activity |
| GO:0103002 | 0.0041 | Inf | 0.0041 | 1 | 1 | 16-hydroxypalmitate dehydrogenase activity |
| GO:0045550 | 0.0083 | 244.2727 | 0.0083 | 1 | 2 | geranylgeranyl reductase activity |
| GO:0071791 | 0.0083 | 244.2727 | 0.0083 | 1 | 2 | chemokine (C-C motif) ligand 5 binding |
| GOMFID | Pvalue | OddsRatio | ExpCount | Count | Size | Term |
| GO:0004984 | 0 | 16.1152 | 1.4666 | 17 | 371 | olfactory receptor activity |
| GO:0004930 | 0 | 9.8334 | 3.0992 | 21 | 784 | G-protein coupled receptor activity |
| GO:0099600 | 0 | 6.9839 | 4.8306 | 23 | 1222 | transmembrane receptor activity |
| GO:0038023 | 0 | 6.63 | 5.0639 | 23 | 1281 | signaling receptor activity |
| GO:0060089 | 0 | 5.4181 | 6.0719 | 23 | 1536 | molecular transducer activity |
| GO:0042056 | 0 | 42.936 | 0.1146 | 4 | 29 | chemoattractant activity |
| GO:0032394 | 0 | Inf | 0.0079 | 2 | 2 | MHC class Ib receptor activity |
| GO:0008009 | 0 | 24.3667 | 0.1897 | 4 | 48 | chemokine activity |
| GO:0031726 | 2e-04 | 173.3656 | 0.0198 | 2 | 5 | CCR1 chemokine receptor binding |
| GO:0031730 | 2e-04 | 130.0161 | 0.0237 | 2 | 6 | CCR5 chemokine receptor binding |
| GO:0030545 | 5e-04 | 4.822 | 1.8658 | 8 | 472 | receptor regulator activity |
| GO:0016004 | 8e-04 | 57.767 | 0.0435 | 2 | 11 | phospholipase activator activity |
| GO:1903231 | 0.001 | 9.9807 | 0.4388 | 4 | 111 | mRNA binding involved in posttranscriptional gene silencing |
| GO:0042288 | 0.0023 | 32.4798 | 0.0712 | 2 | 18 | MHC class I protein binding |
| GO:0005126 | 0.0035 | 5.323 | 1.0196 | 5 | 262 | cytokine receptor binding |
| GO:0043325 | 0.0037 | 24.7389 | 0.0909 | 2 | 23 | phosphatidylinositol-3,4-bisphosphate binding |
| GO:0005133 | 0.004 | Inf | 0.004 | 1 | 1 | interferon-gamma receptor binding |
| GO:0046817 | 0.004 | Inf | 0.004 | 1 | 1 | chemokine receptor antagonist activity |
| GO:0005549 | 0.0043 | 9.8643 | 0.3281 | 3 | 83 | odorant binding |
| GO:0004435 | 0.0051 | 20.7755 | 0.1067 | 2 | 27 | phosphatidylinositol phospholipase C activity |
| GO:0031729 | 0.0079 | 255.9524 | 0.0079 | 1 | 2 | CCR4 chemokine receptor binding |
| GO:0071791 | 0.0079 | 255.9524 | 0.0079 | 1 | 2 | chemokine (C-C motif) ligand 5 binding |
| GOMFID | Pvalue | OddsRatio | ExpCount | Count | Size | Term |
| GO:1903231 | 1e-04 | 7.9493 | 0.9736 | 7 | 111 | mRNA binding involved in posttranscriptional gene silencing |
| GO:0003723 | 2e-04 | 2.2825 | 14.4807 | 29 | 1651 | RNA binding |
| GO:0004984 | 4e-04 | 3.6592 | 3.254 | 11 | 371 | olfactory receptor activity |
| GO:0008009 | 8e-04 | 10.5428 | 0.421 | 4 | 48 | chemokine activity |
| GO:0005344 | 0.0065 | 19.0905 | 0.1228 | 2 | 14 | oxygen carrier activity |
| GO:0005126 | 0.0086 | 3.1986 | 2.3067 | 7 | 263 | cytokine receptor binding |
| GO:0000254 | 0.0088 | Inf | 0.0088 | 1 | 1 | C-4 methylsterol oxidase activity |
| GO:0033981 | 0.0088 | Inf | 0.0088 | 1 | 1 | D-dopachrome decarboxylase activity |
| GO:0052906 | 0.0088 | Inf | 0.0088 | 1 | 1 | tRNA (guanine(37)-N(1))-methyltransferase activity |
| GO:0070180 | 0.0088 | Inf | 0.0088 | 1 | 1 | large ribosomal subunit rRNA binding |
| GO:0090560 | 0.0088 | Inf | 0.0088 | 1 | 1 | 2-(3-amino-3-carboxypropyl)histidine synthase activity |
| GO:0097602 | 0.0095 | 15.2695 | 0.1491 | 2 | 17 | cullin family protein binding |
| GO:0008757 | 0.0098 | 4.0593 | 1.2981 | 5 | 148 | S-adenosylmethionine-dependent methyltransferase activity |
| GOMFID | Pvalue | OddsRatio | ExpCount | Count | Size | Term |
| GO:0004984 | 0 | 5.3552 | 2.9561 | 14 | 371 | olfactory receptor activity |
| GO:0004930 | 0 | 3.238 | 6.2468 | 18 | 784 | G-protein coupled receptor activity |
| GO:0005549 | 5e-04 | 8.2625 | 0.6613 | 5 | 83 | odorant binding |
| GO:0005522 | 0.0027 | 31.6004 | 0.0797 | 2 | 10 | profilin binding |
| GO:0019864 | 0.0033 | 28.0875 | 0.0876 | 2 | 11 | IgG binding |
| GO:0099600 | 0.0037 | 2.1333 | 9.7368 | 19 | 1222 | transmembrane receptor activity |
| GO:0038023 | 0.0056 | 2.0458 | 10.1205 | 19 | 1280 | signaling receptor activity |
| GO:0004343 | 0.008 | Inf | 0.008 | 1 | 1 | glucosamine 6-phosphate N-acetyltransferase activity |
| GO:0004492 | 0.008 | Inf | 0.008 | 1 | 1 | methylmalonyl-CoA decarboxylase activity |
| GO:0005142 | 0.008 | Inf | 0.008 | 1 | 1 | interleukin-11 receptor binding |
| GO:0008493 | 0.008 | Inf | 0.008 | 1 | 1 | tetracycline transporter activity |
| GO:0030273 | 0.008 | Inf | 0.008 | 1 | 1 | melanin-concentrating hormone receptor activity |
| GO:0030377 | 0.008 | Inf | 0.008 | 1 | 1 | urokinase plasminogen activator receptor activity |
| GO:0032556 | 0.008 | Inf | 0.008 | 1 | 1 | pyrimidine deoxyribonucleotide binding |
| GO:0047840 | 0.008 | Inf | 0.008 | 1 | 1 | dCTP diphosphatase activity |
| GO:0052717 | 0.008 | Inf | 0.008 | 1 | 1 | tRNA-specific adenosine-34 deaminase activity |
| GO:0070363 | 0.008 | Inf | 0.008 | 1 | 1 | mitochondrial light strand promoter sense binding |
| GOMFID | Pvalue | OddsRatio | ExpCount | Count | Size | Term |
| GO:0004984 | 0 | 8.0015 | 1.3291 | 9 | 371 | olfactory receptor activity |
| GO:1903231 | 0 | 14.2631 | 0.3977 | 5 | 111 | mRNA binding involved in posttranscriptional gene silencing |
| GO:0004930 | 1e-04 | 4.6503 | 2.8086 | 11 | 784 | G-protein coupled receptor activity |
| GO:0099600 | 0.0037 | 2.8837 | 4.3778 | 11 | 1222 | transmembrane receptor activity |
| GO:0042056 | 0.0048 | 21.3029 | 0.1039 | 2 | 29 | chemoattractant activity |
| GO:0038023 | 0.0052 | 2.7389 | 4.5891 | 11 | 1281 | signaling receptor activity |
| GOMFID | Pvalue | OddsRatio | ExpCount | Count | Size | Term |
| GO:0004984 | 0 | 7.7051 | 2.7957 | 18 | 371 | olfactory receptor activity |
| GO:0004930 | 0 | 5.1984 | 5.9078 | 25 | 784 | G-protein coupled receptor activity |
| GO:0099600 | 0 | 3.3678 | 9.2084 | 26 | 1222 | transmembrane receptor activity |
| GO:0038023 | 0 | 3.1967 | 9.653 | 26 | 1281 | signaling receptor activity |
| GO:0060089 | 0 | 2.7421 | 11.5746 | 27 | 1536 | molecular transducer activity |
| GO:0004938 | 2e-04 | 267.7833 | 0.0226 | 2 | 3 | alpha2-adrenergic receptor activity |
| GO:0035662 | 2e-04 | 267.7833 | 0.0226 | 2 | 3 | Toll-like receptor 4 binding |
| GO:0005549 | 4e-04 | 8.7607 | 0.6254 | 5 | 83 | odorant binding |
| GO:0050544 | 6e-04 | 89.25 | 0.0377 | 2 | 5 | arachidonic acid binding |
| GO:1901567 | 7e-04 | 20.2286 | 0.1733 | 3 | 23 | fatty acid derivative binding |
| GO:0051379 | 0.0012 | 53.5433 | 0.0527 | 2 | 7 | epinephrine binding |
| GO:0000981 | 0.0013 | 2.7593 | 5.5386 | 14 | 735 | RNA polymerase II transcription factor activity, sequence-specific DNA binding |
| GO:0004935 | 0.002 | 38.2405 | 0.0678 | 2 | 9 | adrenergic receptor activity |
| GO:0004859 | 0.003 | 29.7389 | 0.0829 | 2 | 11 | phospholipase inhibitor activity |
| GO:0036041 | 0.003 | 29.7389 | 0.0829 | 2 | 11 | long-chain fatty acid binding |
| GO:0050786 | 0.003 | 29.7389 | 0.0829 | 2 | 11 | RAGE receptor binding |
| GO:0008017 | 0.0047 | 4.1038 | 1.5523 | 6 | 206 | microtubule binding |
| GO:0008009 | 0.0056 | 8.9765 | 0.3617 | 3 | 48 | chemokine activity |
| GO:0048018 | 0.0065 | 2.8556 | 3.3533 | 9 | 445 | receptor ligand activity |
| GO:0008489 | 0.0075 | Inf | 0.0075 | 1 | 1 | UDP-galactose:glucosylceramide beta-1,4-galactosyltransferase activity |
| GO:0008613 | 0.0075 | Inf | 0.0075 | 1 | 1 | diuretic hormone activity |
| GO:0033676 | 0.0075 | Inf | 0.0075 | 1 | 1 | double-stranded DNA-dependent ATPase activity |
| GO:0033798 | 0.0075 | Inf | 0.0075 | 1 | 1 | thyroxine 5-deiodinase activity |
| GO:0033981 | 0.0075 | Inf | 0.0075 | 1 | 1 | D-dopachrome decarboxylase activity |
| GO:0046789 | 0.0075 | Inf | 0.0075 | 1 | 1 | host cell surface receptor binding |
| GO:0047263 | 0.0075 | Inf | 0.0075 | 1 | 1 | N-acylsphingosine galactosyltransferase activity |
| GO:0031690 | 0.008 | 16.7208 | 0.1356 | 2 | 18 | adrenergic receptor binding |
| GO:0071837 | 0.008 | 16.7208 | 0.1356 | 2 | 18 | HMG box domain binding |
| GO:0098641 | 0.008 | 16.7208 | 0.1356 | 2 | 18 | cadherin binding involved in cell-cell adhesion |
| GOMFID | Pvalue | OddsRatio | ExpCount | Count | Size | Term |
| GO:0005515 | 1e-04 | 1.6048 | 240.8787 | 275 | 10773 | protein binding |
| GO:0004950 | 2e-04 | 11.07 | 0.559 | 5 | 25 | chemokine receptor activity |
| GO:0005125 | 4e-04 | 3.112 | 4.8296 | 14 | 216 | cytokine activity |
| GO:0019957 | 8e-04 | 22.0362 | 0.2012 | 3 | 9 | C-C chemokine binding |
| GO:0005126 | 9e-04 | 2.7157 | 5.8805 | 15 | 263 | cytokine receptor binding |
| GO:0005164 | 0.0038 | 7.0628 | 0.6484 | 4 | 29 | tumor necrosis factor receptor binding |
| GO:0019863 | 0.0048 | 29.3056 | 0.1118 | 2 | 5 | IgE binding |
| GO:0031727 | 0.0048 | 29.3056 | 0.1118 | 2 | 5 | CCR2 chemokine receptor binding |
| GO:0046923 | 0.0048 | 29.3056 | 0.1118 | 2 | 5 | ER retention sequence binding |
| GO:0023026 | 0.005 | 10.1661 | 0.3578 | 3 | 16 | MHC class II protein complex binding |
| GO:0003823 | 0.0055 | 4.8051 | 1.1403 | 5 | 51 | antigen binding |
| GO:0042288 | 0.007 | 8.8095 | 0.4025 | 3 | 18 | MHC class I protein binding |
| GO:0003708 | 0.0097 | 17.5811 | 0.1565 | 2 | 7 | retinoic acid receptor activity |
| GO:0032393 | 0.0097 | 17.5811 | 0.1565 | 2 | 7 | MHC class I receptor activity |
| GO:0097322 | 0.0097 | 17.5811 | 0.1565 | 2 | 7 | 7SK snRNA binding |
| GOMFID | Pvalue | OddsRatio | ExpCount | Count | Size | Term |
| GO:0031727 | 1e-04 | 67.8643 | 0.109 | 3 | 5 | CCR2 chemokine receptor binding |
| GO:0001637 | 2e-04 | 11.3628 | 0.5451 | 5 | 25 | G-protein coupled chemoattractant receptor activity |
| GO:0005125 | 3e-04 | 3.1965 | 4.7096 | 14 | 216 | cytokine activity |
| GO:0004896 | 4e-04 | 4.8733 | 1.8097 | 8 | 83 | cytokine receptor activity |
| GO:0019957 | 8e-04 | 22.6157 | 0.1962 | 3 | 9 | C-C chemokine binding |
| GO:0001055 | 0.0015 | 16.9596 | 0.2398 | 3 | 11 | RNA polymerase II activity |
| GO:0042379 | 0.0019 | 5.0538 | 1.3082 | 6 | 60 | chemokine receptor binding |
| GO:0016493 | 0.002 | 15.0743 | 0.2616 | 3 | 12 | C-C chemokine receptor activity |
| GO:0008047 | 0.0029 | 2.0546 | 10.771 | 21 | 494 | enzyme activator activity |
| GO:0016174 | 0.0045 | 30.0741 | 0.109 | 2 | 5 | NAD(P)H oxidase activity |
| GO:0019863 | 0.0045 | 30.0741 | 0.109 | 2 | 5 | IgE binding |
| GO:0046923 | 0.0045 | 30.0741 | 0.109 | 2 | 5 | ER retention sequence binding |
| GO:0023026 | 0.0047 | 10.4334 | 0.3489 | 3 | 16 | MHC class II protein complex binding |
| GO:0005515 | 0.0062 | 1.3546 | 234.89 | 257 | 10773 | protein binding |
| GO:0032393 | 0.0093 | 18.0422 | 0.1526 | 2 | 7 | MHC class I receptor activity |
| GOMFID | Pvalue | OddsRatio | ExpCount | Count | Size | Term |
| GO:0004984 | 0 | 6.5094 | 4.1706 | 23 | 371 | olfactory receptor activity |
| GO:0004930 | 0 | 3.3531 | 8.8133 | 26 | 784 | G-protein coupled receptor activity |
| GO:0099600 | 1e-04 | 2.3538 | 13.7371 | 29 | 1222 | transmembrane receptor activity |
| GO:0038023 | 5e-04 | 2.141 | 14.4004 | 28 | 1281 | signaling receptor activity |
| GO:0004583 | 7e-04 | 88.9222 | 0.045 | 2 | 4 | dolichyl-phosphate-glucose-glycolipid alpha-glucosyltransferase activity |
| GO:0060089 | 0.0019 | 1.9006 | 17.267 | 30 | 1536 | molecular transducer activity |
| GO:0005549 | 0.0024 | 5.7692 | 0.933 | 5 | 83 | odorant binding |
| GO:0003993 | 0.0034 | 29.6333 | 0.0899 | 2 | 8 | acid phosphatase activity |
| GO:0016004 | 0.0065 | 19.7519 | 0.1237 | 2 | 11 | phospholipase activator activity |
| GO:0005509 | 0.0077 | 2.1394 | 7.4194 | 15 | 660 | calcium ion binding |
| GOMFID | Pvalue | OddsRatio | ExpCount | Count | Size | Term |
| GO:0004984 | 0 | 6.9507 | 3.9414 | 23 | 371 | olfactory receptor activity |
| GO:0004930 | 0 | 3.5851 | 8.3291 | 26 | 784 | G-protein coupled receptor activity |
| GO:0005509 | 0 | 3.5356 | 7.0117 | 22 | 660 | calcium ion binding |
| GO:0099600 | 0 | 2.7371 | 12.9823 | 31 | 1222 | transmembrane receptor activity |
| GO:0038023 | 0 | 2.4938 | 13.6091 | 30 | 1281 | signaling receptor activity |
| GO:0019864 | 2e-04 | 35.5251 | 0.1169 | 3 | 11 | IgG binding |
| GO:0060089 | 4e-04 | 2.1201 | 16.3182 | 31 | 1536 | molecular transducer activity |
| GO:0055102 | 6e-04 | 21.8548 | 0.17 | 3 | 16 | lipase inhibitor activity |
| GO:1903231 | 0.0012 | 5.4778 | 1.1792 | 6 | 111 | mRNA binding involved in posttranscriptional gene silencing |
| GO:0003993 | 0.003 | 31.3961 | 0.085 | 2 | 8 | acid phosphatase activity |
| GO:0019957 | 0.0038 | 26.9092 | 0.0956 | 2 | 9 | C-C chemokine binding |
| GO:0016004 | 0.0058 | 20.9268 | 0.1169 | 2 | 11 | phospholipase activator activity |
| GOMFID | Pvalue | OddsRatio | ExpCount | Count | Size | Term |
| GO:0004984 | 0 | 7.1214 | 3.1623 | 19 | 371 | olfactory receptor activity |
| GO:0004930 | 0 | 3.8055 | 6.6826 | 22 | 784 | G-protein coupled receptor activity |
| GO:0038023 | 0 | 3.1451 | 10.919 | 29 | 1281 | signaling receptor activity |
| GO:0099600 | 0 | 3.0242 | 10.4161 | 27 | 1222 | transmembrane receptor activity |
| GO:0060089 | 0 | 2.8004 | 13.0925 | 31 | 1536 | molecular transducer activity |
| GO:0048020 | 0 | 17.7112 | 0.3324 | 5 | 39 | CCR chemokine receptor binding |
| GO:0003735 | 0 | 6.8949 | 1.2786 | 8 | 150 | structural constituent of ribosome |
| GO:0034875 | 4e-04 | 118.0147 | 0.0341 | 2 | 4 | caffeine oxidase activity |
| GO:0008009 | 7e-04 | 10.8602 | 0.4091 | 4 | 48 | chemokine activity |
| GO:0001758 | 0.0015 | 47.1971 | 0.0597 | 2 | 7 | retinal dehydrogenase activity |
| GO:0048018 | 0.0015 | 3.1169 | 3.7931 | 11 | 445 | receptor ligand activity |
| GO:0001664 | 0.0017 | 3.8897 | 2.1991 | 8 | 258 | G-protein coupled receptor binding |
| GO:0005126 | 0.0019 | 3.8122 | 2.2418 | 8 | 263 | cytokine receptor binding |
| GO:0016725 | 0.0025 | 33.708 | 0.0767 | 2 | 9 | oxidoreductase activity, acting on CH or CH2 groups |
| GO:0016493 | 0.0045 | 23.5912 | 0.1023 | 2 | 12 | C-C chemokine receptor activity |
| GO:0005549 | 0.0055 | 6.0355 | 0.7075 | 4 | 83 | odorant binding |
| GO:0003746 | 0.008 | 16.8466 | 0.1364 | 2 | 16 | translation elongation factor activity |
| GO:0005163 | 0.0085 | Inf | 0.0085 | 1 | 1 | nerve growth factor receptor binding |
| GO:0008493 | 0.0085 | Inf | 0.0085 | 1 | 1 | tetracycline transporter activity |
| GO:0008392 | 0.009 | 15.7225 | 0.1449 | 2 | 17 | arachidonic acid epoxygenase activity |
| GOMFID | Pvalue | OddsRatio | ExpCount | Count | Size | Term |
| GO:0004984 | 0 | 5.8801 | 3.529 | 18 | 371 | olfactory receptor activity |
| GO:0099600 | 0 | 2.7623 | 11.6237 | 28 | 1222 | transmembrane receptor activity |
| GO:0060089 | 0 | 2.5344 | 14.6105 | 32 | 1536 | molecular transducer activity |
| GO:0004930 | 0 | 3.1606 | 7.4574 | 21 | 784 | G-protein coupled receptor activity |
| GO:0038023 | 1e-04 | 2.5587 | 11.0137 | 25 | 1190 | signaling receptor activity |
| GO:0003735 | 1e-04 | 6.1331 | 1.4268 | 8 | 150 | structural constituent of ribosome |
| GO:0004971 | 3e-04 | 210.9868 | 0.0285 | 2 | 3 | AMPA glutamate receptor activity |
| GO:0008392 | 5e-04 | 22.737 | 0.1617 | 3 | 17 | arachidonic acid epoxygenase activity |
| GO:0034875 | 5e-04 | 105.4868 | 0.038 | 2 | 4 | caffeine oxidase activity |
| GO:0005234 | 6e-04 | 21.2199 | 0.1712 | 3 | 18 | extracellularly glutamate-gated ion channel activity |
| GO:0004222 | 7e-04 | 6.0352 | 1.0749 | 6 | 113 | metalloendopeptidase activity |
| GO:0022824 | 9e-04 | 10.1549 | 0.4376 | 4 | 46 | transmitter-gated ion channel activity |
| GO:0030594 | 0.0018 | 6.2237 | 0.8656 | 5 | 91 | neurotransmitter receptor activity |
| GO:0001758 | 0.0018 | 42.1868 | 0.0666 | 2 | 7 | retinal dehydrogenase activity |
| GO:0008066 | 0.0019 | 13.8321 | 0.2473 | 3 | 26 | glutamate receptor activity |
| GO:0016725 | 0.0031 | 30.1297 | 0.0856 | 2 | 9 | oxidoreductase activity, acting on CH or CH2 groups |
| GO:0008083 | 0.0036 | 4.3521 | 1.4649 | 6 | 154 | growth factor activity |
| GO:0005125 | 0.0046 | 3.6061 | 2.0546 | 7 | 216 | cytokine activity |
| GO:0004866 | 0.0047 | 4.1003 | 1.5505 | 6 | 163 | endopeptidase inhibitor activity |
| GO:0030545 | 0.0055 | 2.5989 | 4.4897 | 11 | 472 | receptor regulator activity |
| GO:0022838 | 0.0063 | 2.687 | 3.938 | 10 | 414 | substrate-specific channel activity |
| GO:0015276 | 0.0083 | 4.2372 | 1.2461 | 5 | 131 | ligand-gated ion channel activity |
| GO:0005261 | 0.0087 | 2.9137 | 2.8917 | 8 | 304 | cation channel activity |
| GO:0019825 | 0.0089 | 7.5658 | 0.428 | 3 | 45 | oxygen binding |
| GO:0022839 | 0.0089 | 7.5658 | 0.428 | 3 | 45 | ion gated channel activity |
| GO:0005129 | 0.0095 | Inf | 0.0095 | 1 | 1 | granulocyte macrophage colony-stimulating factor receptor binding |
| GO:0005133 | 0.0095 | Inf | 0.0095 | 1 | 1 | interferon-gamma receptor binding |
| GO:0005163 | 0.0095 | Inf | 0.0095 | 1 | 1 | nerve growth factor receptor binding |
| GO:0008493 | 0.0095 | Inf | 0.0095 | 1 | 1 | tetracycline transporter activity |
| GO:0102116 | 0.0095 | Inf | 0.0095 | 1 | 1 | laurate hydroxylase activity |
| GO:0103002 | 0.0095 | Inf | 0.0095 | 1 | 1 | 16-hydroxypalmitate dehydrogenase activity |
| GO:1902118 | 0.0095 | Inf | 0.0095 | 1 | 1 | calcidiol binding |
| GOMFID | Pvalue | OddsRatio | ExpCount | Count | Size | Term |
| GO:0003735 | 0 | 21.066 | 0.8524 | 14 | 150 | structural constituent of ribosome |
| GO:0004984 | 0 | 7.914 | 2.1082 | 14 | 371 | olfactory receptor activity |
| GO:0004930 | 0 | 5.2167 | 4.4551 | 19 | 784 | G-protein coupled receptor activity |
| GO:0060089 | 0 | 3.6022 | 8.7284 | 25 | 1536 | molecular transducer activity |
| GO:0099600 | 0 | 3.9019 | 6.944 | 22 | 1222 | transmembrane receptor activity |
| GO:0038023 | 0 | 3.7043 | 7.2793 | 22 | 1281 | signaling receptor activity |
| GO:0016493 | 0 | 60.2584 | 0.0682 | 3 | 12 | C-C chemokine receptor activity |
| GO:0061135 | 0 | 8.1011 | 0.9603 | 7 | 169 | endopeptidase regulator activity |
| GO:0030414 | 1e-04 | 8.0013 | 0.9717 | 7 | 171 | peptidase inhibitor activity |
| GO:0030492 | 3e-04 | 119.2222 | 0.0284 | 2 | 5 | hemoglobin binding |
| GO:0001637 | 4e-04 | 24.6313 | 0.1421 | 3 | 25 | G-protein coupled chemoattractant receptor activity |
| GO:0004896 | 0.0013 | 9.2169 | 0.4716 | 4 | 83 | cytokine receptor activity |
| GO:0005125 | 0.0014 | 5.2784 | 1.2274 | 6 | 216 | cytokine activity |
| GO:0004867 | 0.0016 | 8.5631 | 0.5057 | 4 | 89 | serine-type endopeptidase inhibitor activity |
| GO:0004252 | 0.0034 | 5.3214 | 1.0058 | 5 | 177 | serine-type endopeptidase activity |
| GO:1903231 | 0.0037 | 6.7931 | 0.6308 | 4 | 111 | mRNA binding involved in posttranscriptional gene silencing |
| GO:0004869 | 0.004 | 10.2046 | 0.3182 | 3 | 56 | cysteine-type endopeptidase inhibitor activity |
| GO:0019843 | 0.004 | 10.2046 | 0.3182 | 3 | 56 | rRNA binding |
| GO:0005132 | 0.0041 | 23.8267 | 0.0966 | 2 | 17 | type I interferon receptor binding |
| GO:0005129 | 0.0057 | Inf | 0.0057 | 1 | 1 | granulocyte macrophage colony-stimulating factor receptor binding |
| GO:0019969 | 0.0057 | Inf | 0.0057 | 1 | 1 | interleukin-10 binding |
| GO:0003723 | 0.0058 | 2.1647 | 8.7985 | 17 | 1595 | RNA binding |
| GO:0017171 | 0.0068 | 4.4777 | 1.1876 | 5 | 209 | serine hydrolase activity |
| GO:0017134 | 0.0075 | 17.0127 | 0.1307 | 2 | 23 | fibroblast growth factor binding |
| GOMFID | Pvalue | OddsRatio | ExpCount | Count | Size | Term |
| GO:0004984 | 0 | 13.0271 | 1.5124 | 15 | 371 | olfactory receptor activity |
| GO:0004930 | 0 | 5.8728 | 3.196 | 15 | 784 | G-protein coupled receptor activity |
| GO:0099600 | 0 | 3.9583 | 4.9816 | 16 | 1222 | transmembrane receptor activity |
| GO:0004867 | 0 | 15.6518 | 0.3628 | 5 | 89 | serine-type endopeptidase inhibitor activity |
| GO:0003735 | 0 | 11.0972 | 0.6115 | 6 | 150 | structural constituent of ribosome |
| GO:0038023 | 0 | 3.7588 | 5.2221 | 16 | 1281 | signaling receptor activity |
| GO:0060089 | 3e-04 | 3.0745 | 6.2616 | 16 | 1536 | molecular transducer activity |
| GO:0061135 | 6e-04 | 7.9768 | 0.6889 | 5 | 169 | endopeptidase regulator activity |
| GO:0030414 | 7e-04 | 7.8797 | 0.6971 | 5 | 171 | peptidase inhibitor activity |
| GO:0004222 | 0.0012 | 9.4791 | 0.4607 | 4 | 113 | metalloendopeptidase activity |
| GO:0017134 | 0.0039 | 23.9628 | 0.0938 | 2 | 23 | fibroblast growth factor binding |
| GO:0004252 | 0.0059 | 5.9485 | 0.7216 | 4 | 177 | serine-type endopeptidase activity |
| GO:0004370 | 0.0081 | 248.0462 | 0.0082 | 1 | 2 | glycerol kinase activity |
| GO:0019767 | 0.0081 | 248.0462 | 0.0082 | 1 | 2 | IgE receptor activity |
| GO:0045550 | 0.0081 | 248.0462 | 0.0082 | 1 | 2 | geranylgeranyl reductase activity |
| GOMFID | Pvalue | OddsRatio | ExpCount | Count | Size | Term |
| GO:0004984 | 0 | 13.666 | 0.9624 | 10 | 371 | olfactory receptor activity |
| GO:0004930 | 0 | 7.9668 | 2.0338 | 12 | 784 | G-protein coupled receptor activity |
| GO:0005549 | 0 | 27.8413 | 0.2153 | 5 | 83 | odorant binding |
| GO:0050786 | 0 | 155.1923 | 0.0285 | 3 | 11 | RAGE receptor binding |
| GO:0038023 | 0 | 5.2605 | 3.3232 | 13 | 1281 | signaling receptor activity |
| GO:0035662 | 0 | 807.35 | 0.0078 | 2 | 3 | Toll-like receptor 4 binding |
| GO:0099600 | 0 | 4.9382 | 3.1701 | 12 | 1222 | transmembrane receptor activity |
| GO:0050544 | 1e-04 | 269.0833 | 0.013 | 2 | 5 | arachidonic acid binding |
| GO:0060089 | 1e-04 | 4.3047 | 3.9847 | 13 | 1536 | molecular transducer activity |
| GO:0036041 | 4e-04 | 89.6611 | 0.0285 | 2 | 11 | long-chain fatty acid binding |
| GO:0033293 | 5e-04 | 22.5077 | 0.1505 | 3 | 58 | monocarboxylic acid binding |
| GO:0061783 | 9e-04 | 53.7767 | 0.0441 | 2 | 17 | peptidoglycan muralytic activity |
| GO:0043177 | 0.0011 | 9.7201 | 0.4592 | 4 | 177 | organic acid binding |
| GO:1901567 | 0.0016 | 38.3976 | 0.0597 | 2 | 23 | fatty acid derivative binding |
| GO:0070191 | 0.0026 | Inf | 0.0026 | 1 | 1 | methionine-R-sulfoxide reductase activity |
| GO:0046914 | 0.0041 | 3.5303 | 2.6383 | 8 | 1017 | transition metal ion binding |
| GO:0004053 | 0.0052 | 393.8293 | 0.0052 | 1 | 2 | arginase activity |
| GO:0015382 | 0.0052 | 393.8293 | 0.0052 | 1 | 2 | sodium:sulfate symporter activity |
| GO:0033745 | 0.0078 | 196.9024 | 0.0078 | 1 | 3 | L-methionine-(R)-S-oxide reductase activity |
| GOMFID | Pvalue | OddsRatio | ExpCount | Count | Size | Term |
| GO:1903231 | 0 | 23.5574 | 0.4731 | 9 | 111 | mRNA binding involved in posttranscriptional gene silencing |
| GO:0004984 | 0 | 9.2432 | 1.5812 | 12 | 371 | olfactory receptor activity |
| GO:0004930 | 0 | 4.6218 | 3.3413 | 13 | 784 | G-protein coupled receptor activity |
| GO:0031726 | 2e-04 | 160.3781 | 0.0213 | 2 | 5 | CCR1 chemokine receptor binding |
| GO:0031730 | 3e-04 | 120.2761 | 0.0256 | 2 | 6 | CCR5 chemokine receptor binding |
| GO:0005549 | 4e-04 | 12.4962 | 0.3537 | 4 | 83 | odorant binding |
| GO:0008009 | 0.0011 | 16.2384 | 0.2046 | 3 | 48 | chemokine activity |
| GO:0099600 | 0.0018 | 2.8633 | 5.208 | 13 | 1222 | transmembrane receptor activity |
| GO:0008308 | 0.0021 | 34.3433 | 0.0682 | 2 | 16 | voltage-gated anion channel activity |
| GO:0038023 | 0.0027 | 2.7193 | 5.4595 | 13 | 1281 | signaling receptor activity |
| GO:0003723 | 0.0035 | 2.4594 | 7.0364 | 15 | 1651 | RNA binding |
| GO:0004146 | 0.0085 | 237.0588 | 0.0085 | 1 | 2 | dihydrofolate reductase activity |
| GO:0038100 | 0.0085 | 237.0588 | 0.0085 | 1 | 2 | nodal binding |
| GOMFID | Pvalue | OddsRatio | ExpCount | Count | Size | Term |
| GO:0048020 | 0 | 22.9126 | 0.2602 | 5 | 39 | CCR chemokine receptor binding |
| GO:0008009 | 3e-04 | 14.0192 | 0.3202 | 4 | 48 | chemokine activity |
| GO:0048018 | 0.0027 | 4.0179 | 1.8691 | 7 | 291 | receptor ligand activity |
| GO:0008083 | 0.0037 | 5.1909 | 1.0273 | 5 | 154 | growth factor activity |
| GO:0008308 | 0.005 | 21.655 | 0.1067 | 2 | 16 | voltage-gated anion channel activity |
| GO:0008173 | 0.0065 | 8.4804 | 0.3802 | 3 | 57 | RNA methyltransferase activity |
| GO:0005130 | 0.0067 | Inf | 0.0067 | 1 | 1 | granulocyte colony-stimulating factor receptor binding |
| GO:0005141 | 0.0067 | Inf | 0.0067 | 1 | 1 | interleukin-10 receptor binding |
| GO:0038164 | 0.0067 | Inf | 0.0067 | 1 | 1 | thrombopoietin receptor activity |
| GO:0052858 | 0.0067 | Inf | 0.0067 | 1 | 1 | peptidyl-lysine acetyltransferase activity |
| GO:0070733 | 0.0067 | Inf | 0.0067 | 1 | 1 | protein adenylyltransferase activity |
| GO:0005126 | 0.0074 | 3.724 | 1.709 | 6 | 261 | cytokine receptor binding |
| GO:0030246 | 0.0079 | 3.6656 | 1.7344 | 6 | 260 | carbohydrate binding |
| GOMFID | Pvalue | OddsRatio | ExpCount | Count | Size | Term |
| GO:0005125 | 0 | 5.3372 | 2.2681 | 11 | 216 | cytokine activity |
| GO:0030545 | 1e-04 | 3.2956 | 4.9561 | 15 | 472 | receptor regulator activity |
| GO:0045236 | 6e-04 | 22.1193 | 0.168 | 3 | 16 | CXCR chemokine receptor binding |
| GO:0005126 | 0.0019 | 3.4698 | 2.7616 | 9 | 263 | cytokine receptor binding |
| GO:0036122 | 0.0047 | 23.8274 | 0.105 | 2 | 10 | BMP binding |
| GO:0043295 | 0.0057 | 21.1786 | 0.1155 | 2 | 11 | glutathione binding |
| GO:1903231 | 0.0063 | 4.5495 | 1.1655 | 5 | 111 | mRNA binding involved in posttranscriptional gene silencing |
| GO:0043565 | 0.0085 | 1.9374 | 10.4583 | 19 | 996 | sequence-specific DNA binding |
| GO:0008191 | 0.0092 | 15.881 | 0.147 | 2 | 14 | metalloendopeptidase inhibitor activity |
| NA. |
| n/a |
| NA. |
| n/a |
| NA. |
| n/a |
| NA. |
| n/a |
| NA. |
| n/a |
| NA. |
| n/a |
| NA. |
| n/a |
| NA. |
| n/a |
| NA. |
| n/a |
| NA. |
| n/a |
| NA. |
| n/a |
| NA. |
| n/a |
| NA. |
| n/a |
| NA. |
| n/a |
| NA. |
| n/a |
| NA. |
| n/a |
| NA. |
| n/a |
| NA. |
| n/a |
| NA. |
| n/a |
| NA. |
| n/a |
| NA. |
| n/a |
| NA. |
| n/a |
| NA. |
| n/a |
| NA. |
| n/a |
| NA. |
| n/a |
| NA. |
| n/a |
| NA. |
| n/a |
| NA. |
| n/a |
| NA. |
| n/a |
| NA. |
| n/a |
| NA. |
| n/a |
| NA. |
| n/a |
| NA. |
| n/a |
| NA. |
| n/a |
| NA. |
| n/a |
| NA. |
| n/a |
| NA. |
| n/a |
| NA. |
| n/a |
| NA. |
| n/a |
| NA. |
| n/a |
| NA. |
| n/a |
| NA. |
| n/a |
| NA. |
| n/a |
| NA. |
| n/a |
| NA. |
| n/a |
| NA. |
| n/a |
| NA. |
| n/a |
| NA. |
| n/a |
| NA. |
| n/a |
| NA. |
| n/a |
| NA. |
| n/a |
| NA. |
| n/a |
| NA. |
| n/a |
| NA. |
| n/a |
| NA. |
| n/a |
| NA. |
| n/a |
| GOMFID | Pvalue | OddsRatio | ExpCount | Count | Size | Term |
| GO:0043312 | 0 | 4.6159 | 7.51 | 30 | 467 | neutrophil degranulation |
| GO:0042119 | 0 | 4.5097 | 7.6708 | 30 | 477 | neutrophil activation |
| GO:0002444 | 0 | 4.2488 | 8.3945 | 31 | 522 | myeloid leukocyte mediated immunity |
| GO:0002275 | 0 | 4.1112 | 8.3462 | 30 | 519 | myeloid cell activation involved in immune response |
| GO:0002263 | 0 | 3.4136 | 10.6137 | 32 | 660 | cell activation involved in immune response |
| GO:0045055 | 0 | 3.0445 | 11.3856 | 31 | 708 | regulated exocytosis |
| GO:0045321 | 0 | 2.4147 | 18.0433 | 39 | 1122 | leukocyte activation |
| GO:0032940 | 0 | 2.1675 | 22.1118 | 43 | 1375 | secretion by cell |
| GO:0061844 | 2e-04 | 8.3263 | 0.8201 | 6 | 51 | antimicrobial humoral immune response mediated by antimicrobial peptide |
| GO:1900239 | 2e-04 | 37.1256 | 0.1287 | 3 | 8 | regulation of phenotypic switching |
| GO:0044663 | 3e-04 | Inf | 0.0322 | 2 | 2 | establishment or maintenance of cell type involved in phenotypic switching |
| GO:0070947 | 3e-04 | Inf | 0.0322 | 2 | 2 | neutrophil mediated killing of fungus |
| GO:0043207 | 3e-04 | 2.2199 | 13.1224 | 27 | 816 | response to external biotic stimulus |
| GO:0031640 | 3e-04 | 7.2023 | 0.9327 | 6 | 58 | killing of cells of other organism |
| GO:0009617 | 4e-04 | 2.5309 | 8.4749 | 20 | 527 | response to bacterium |
| GO:0035821 | 5e-04 | 4.2524 | 2.2835 | 9 | 142 | modification of morphology or physiology of other organism |
| GO:0051240 | 8e-04 | 1.8248 | 23.8165 | 40 | 1481 | positive regulation of multicellular organismal process |
| GO:1901342 | 0.001 | 2.9265 | 4.7279 | 13 | 294 | regulation of vasculature development |
| GO:0051852 | 0.0013 | 16.8689 | 0.2251 | 3 | 14 | disruption by host of symbiont cells |
| GO:0016192 | 0.0013 | 1.7147 | 28.5444 | 45 | 1775 | vesicle-mediated transport |
| GO:0002698 | 0.0014 | 4.5095 | 1.6725 | 7 | 104 | negative regulation of immune effector process |
| GO:0009620 | 0.0015 | 6.6165 | 0.8362 | 5 | 52 | response to fungus |
| GO:1901668 | 0.0015 | 61.6486 | 0.0643 | 2 | 4 | regulation of superoxide dismutase activity |
| GO:0001817 | 0.0016 | 2.2178 | 9.5845 | 20 | 596 | regulation of cytokine production |
| GO:0031348 | 0.0016 | 6.4543 | 0.8544 | 5 | 54 | negative regulation of defense response |
| GO:0051896 | 0.0019 | 3.2062 | 3.3128 | 10 | 206 | regulation of protein kinase B signaling |
| GO:0019730 | 0.0019 | 8.4372 | 0.5362 | 4 | 34 | antimicrobial humoral response |
| GO:0045766 | 0.0022 | 3.7087 | 2.2996 | 8 | 143 | positive regulation of angiogenesis |
| GO:0060414 | 0.0025 | 41.0965 | 0.0804 | 2 | 5 | aorta smooth muscle tissue morphogenesis |
| GO:0051234 | 0.0025 | 1.4535 | 78.493 | 100 | 4881 | establishment of localization |
| GO:0050830 | 0.0028 | 4.6153 | 1.3991 | 6 | 87 | defense response to Gram-positive bacterium |
| GO:0001816 | 0.0028 | 5.6016 | 0.9712 | 5 | 63 | cytokine production |
| GO:0019731 | 0.0031 | 7.2946 | 0.6111 | 4 | 38 | antibacterial humoral response |
| GO:0032682 | 0.0033 | 11.5938 | 0.3055 | 3 | 19 | negative regulation of chemokine production |
| GO:0051094 | 0.0035 | 1.761 | 19.3941 | 32 | 1206 | positive regulation of developmental process |
| GO:0010269 | 0.0037 | 30.8205 | 0.0965 | 2 | 6 | response to selenium ion |
| GO:2001015 | 0.0037 | 30.8205 | 0.0965 | 2 | 6 | negative regulation of skeletal muscle cell differentiation |
| GO:0019430 | 0.0044 | 10.3043 | 0.3377 | 3 | 21 | removal of superoxide radicals |
| GO:0045087 | 0.0045 | 1.8854 | 13.4762 | 24 | 838 | innate immune response |
| GO:0032757 | 0.0049 | 6.3574 | 0.6915 | 4 | 43 | positive regulation of interleukin-8 production |
| GO:0044003 | 0.0049 | 6.3574 | 0.6915 | 4 | 43 | modification by symbiont of host morphology or physiology |
| GO:0009635 | 0.0051 | 24.6548 | 0.1126 | 2 | 7 | response to herbicide |
| GO:0051597 | 0.0051 | 24.6548 | 0.1126 | 2 | 7 | response to methylmercury |
| GO:0070244 | 0.0051 | 24.6548 | 0.1126 | 2 | 7 | negative regulation of thymocyte apoptotic process |
| GO:0071450 | 0.0057 | 9.2727 | 0.3699 | 3 | 23 | cellular response to oxygen radical |
| GO:2000482 | 0.0057 | 9.2727 | 0.3699 | 3 | 23 | regulation of interleukin-8 secretion |
| GO:0002719 | 0.0065 | 8.8306 | 0.386 | 3 | 24 | negative regulation of cytokine production involved in immune response |
| GO:0070942 | 0.0068 | 20.5444 | 0.1287 | 2 | 8 | neutrophil mediated cytotoxicity |
| GO:0090286 | 0.0068 | 20.5444 | 0.1287 | 2 | 8 | cytoskeletal anchoring at nuclear membrane |
| GO:1900165 | 0.0068 | 20.5444 | 0.1287 | 2 | 8 | negative regulation of interleukin-6 secretion |
| GO:1904951 | 0.0069 | 2.0983 | 8.0085 | 16 | 498 | positive regulation of establishment of protein localization |
| GO:0002221 | 0.007 | 3.0287 | 2.7821 | 8 | 173 | pattern recognition receptor signaling pathway |
| GO:0002793 | 0.007 | 2.6333 | 3.9882 | 10 | 248 | positive regulation of peptide secretion |
| GO:0001558 | 0.0072 | 2.2858 | 5.9662 | 13 | 371 | regulation of cell growth |
| GO:0000302 | 0.0072 | 2.7877 | 3.3932 | 9 | 211 | response to reactive oxygen species |
| GO:0070206 | 0.0079 | 5.5077 | 0.788 | 4 | 49 | protein trimerization |
| GO:0000303 | 0.0081 | 8.0617 | 0.4181 | 3 | 26 | response to superoxide |
| GO:0033234 | 0.0086 | 17.6084 | 0.1447 | 2 | 9 | negative regulation of protein sumoylation |
| GO:0070255 | 0.0086 | 17.6084 | 0.1447 | 2 | 9 | regulation of mucus secretion |
| GO:1902931 | 0.0086 | 17.6084 | 0.1447 | 2 | 9 | negative regulation of alcohol biosynthetic process |
| GO:0010614 | 0.009 | 7.7253 | 0.4342 | 3 | 27 | negative regulation of cardiac muscle hypertrophy |
| GO:0080134 | 0.0093 | 1.6237 | 21.549 | 33 | 1340 | regulation of response to stress |
| GO:0050715 | 0.0095 | 3.5212 | 1.8011 | 6 | 112 | positive regulation of cytokine secretion |
| GO:0050728 | 0.0099 | 3.4881 | 1.8172 | 6 | 113 | negative regulation of inflammatory response |
| GO:0071702 | 0.01 | 1.454 | 42.31 | 57 | 2631 | organic substance transport |
| GOMFID | Pvalue | OddsRatio | ExpCount | Count | Size | Term |
| GO:0043312 | 0 | 4.8058 | 7.251 | 30 | 467 | neutrophil degranulation |
| GO:0042119 | 0 | 4.6953 | 7.4063 | 30 | 477 | neutrophil activation |
| GO:0002444 | 0 | 4.4244 | 8.105 | 31 | 522 | myeloid leukocyte mediated immunity |
| GO:0002275 | 0 | 4.2804 | 8.0584 | 30 | 519 | myeloid cell activation involved in immune response |
| GO:0002263 | 0 | 3.6893 | 10.2477 | 33 | 660 | cell activation involved in immune response |
| GO:0045055 | 0 | 3.1703 | 10.993 | 31 | 708 | regulated exocytosis |
| GO:0045321 | 0 | 2.6778 | 17.4211 | 41 | 1122 | leukocyte activation |
| GO:0032940 | 0 | 2.1973 | 21.3494 | 42 | 1375 | secretion by cell |
| GO:0044663 | 2e-04 | Inf | 0.0311 | 2 | 2 | establishment or maintenance of cell type involved in phenotypic switching |
| GO:0070947 | 2e-04 | Inf | 0.0311 | 2 | 2 | neutrophil mediated killing of fungus |
| GO:0009617 | 6e-04 | 2.4833 | 8.1826 | 19 | 527 | response to bacterium |
| GO:0046110 | 7e-04 | 127.816 | 0.0466 | 2 | 3 | xanthine metabolic process |
| GO:0043207 | 9e-04 | 2.1145 | 12.6699 | 25 | 816 | response to external biotic stimulus |
| GO:0061844 | 0.0011 | 7.0111 | 0.7919 | 5 | 51 | antimicrobial humoral immune response mediated by antimicrobial peptide |
| GO:0051852 | 0.0012 | 17.4885 | 0.2174 | 3 | 14 | disruption by host of symbiont cells |
| GO:0009620 | 0.0012 | 6.8615 | 0.8074 | 5 | 52 | response to fungus |
| GO:0035821 | 0.0017 | 3.8767 | 2.2048 | 8 | 142 | modification of morphology or physiology of other organism |
| GO:0019730 | 0.0017 | 8.7193 | 0.5194 | 4 | 34 | antimicrobial humoral response |
| GO:0031640 | 0.002 | 6.0824 | 0.9006 | 5 | 58 | killing of cells of other organism |
| GO:0016192 | 0.0021 | 1.6923 | 27.5601 | 43 | 1775 | vesicle-mediated transport |
| GO:0006664 | 0.0022 | 4.1596 | 1.8011 | 7 | 116 | glycolipid metabolic process |
| GO:0060414 | 0.0023 | 42.6 | 0.0776 | 2 | 5 | aorta smooth muscle tissue morphogenesis |
| GO:0019731 | 0.0028 | 7.5636 | 0.59 | 4 | 38 | antibacterial humoral response |
| GO:0032682 | 0.003 | 12.0196 | 0.295 | 3 | 19 | negative regulation of chemokine production |
| GO:2000116 | 0.0031 | 2.9873 | 3.5401 | 10 | 228 | regulation of cysteine-type endopeptidase activity |
| GO:0010269 | 0.0035 | 31.948 | 0.0932 | 2 | 6 | response to selenium ion |
| GO:2001015 | 0.0035 | 31.948 | 0.0932 | 2 | 6 | negative regulation of skeletal muscle cell differentiation |
| GO:0032496 | 0.0035 | 2.6219 | 4.8288 | 12 | 311 | response to lipopolysaccharide |
| GO:0051234 | 0.0037 | 1.4395 | 75.7863 | 96 | 4881 | establishment of localization |
| GO:0051250 | 0.0039 | 3.7443 | 1.9874 | 7 | 128 | negative regulation of lymphocyte activation |
| GO:1904018 | 0.0041 | 3.3253 | 2.5464 | 8 | 164 | positive regulation of vasculature development |
| GO:0044003 | 0.0044 | 6.5918 | 0.6677 | 4 | 43 | modification by symbiont of host morphology or physiology |
| GO:0002704 | 0.0047 | 6.4266 | 0.6832 | 4 | 44 | negative regulation of leukocyte mediated immunity |
| GO:0050866 | 0.0048 | 3.2414 | 2.6085 | 8 | 168 | negative regulation of cell activation |
| GO:0009635 | 0.0048 | 25.5568 | 0.1087 | 2 | 7 | response to herbicide |
| GO:0051597 | 0.0048 | 25.5568 | 0.1087 | 2 | 7 | response to methylmercury |
| GO:0070244 | 0.0048 | 25.5568 | 0.1087 | 2 | 7 | negative regulation of thymocyte apoptotic process |
| GO:0045087 | 0.0059 | 1.8686 | 13.0115 | 23 | 838 | innate immune response |
| GO:0002719 | 0.0059 | 9.1549 | 0.3726 | 3 | 24 | negative regulation of cytokine production involved in immune response |
| GO:0070942 | 0.0063 | 21.296 | 0.1242 | 2 | 8 | neutrophil mediated cytotoxicity |
| GO:0090286 | 0.0063 | 21.296 | 0.1242 | 2 | 8 | cytoskeletal anchoring at nuclear membrane |
| GO:1900165 | 0.0063 | 21.296 | 0.1242 | 2 | 8 | negative regulation of interleukin-6 secretion |
| GO:1900239 | 0.0063 | 21.296 | 0.1242 | 2 | 8 | regulation of phenotypic switching |
| GO:0070206 | 0.007 | 5.7108 | 0.7608 | 4 | 49 | protein trimerization |
| GO:0001816 | 0.0071 | 2.6273 | 3.9994 | 10 | 265 | cytokine production |
| GO:0033234 | 0.008 | 18.2526 | 0.1397 | 2 | 9 | negative regulation of protein sumoylation |
| GO:0070255 | 0.008 | 18.2526 | 0.1397 | 2 | 9 | regulation of mucus secretion |
| GO:1902931 | 0.008 | 18.2526 | 0.1397 | 2 | 9 | negative regulation of alcohol biosynthetic process |
| GO:0072606 | 0.0082 | 8.009 | 0.4192 | 3 | 27 | interleukin-8 secretion |
| GO:0050728 | 0.0084 | 3.6177 | 1.7545 | 6 | 113 | negative regulation of inflammatory response |
| GO:0001819 | 0.0088 | 2.2267 | 6.1176 | 13 | 394 | positive regulation of cytokine production |
| GO:0030851 | 0.0091 | 7.6882 | 0.4348 | 3 | 28 | granulocyte differentiation |
| GO:0050854 | 0.0092 | 5.2433 | 0.8229 | 4 | 53 | regulation of antigen receptor-mediated signaling pathway |
| GO:0051898 | 0.0092 | 5.2433 | 0.8229 | 4 | 53 | negative regulation of protein kinase B signaling |
| GO:0031348 | 0.0092 | 5.2301 | 0.8242 | 4 | 54 | negative regulation of defense response |
| GO:0006853 | 0.01 | 15.97 | 0.1553 | 2 | 10 | carnitine shuttle |
| GOMFID | Pvalue | OddsRatio | ExpCount | Count | Size | Term |
| GO:1903039 | 0 | 3.2563 | 6.7457 | 20 | 213 | positive regulation of leukocyte cell-cell adhesion |
| GO:1900239 | 1e-04 | 30.8078 | 0.2534 | 4 | 8 | regulation of phenotypic switching |
| GO:0050863 | 1e-04 | 2.5363 | 9.7543 | 23 | 308 | regulation of T cell activation |
| GO:0051251 | 2e-04 | 2.6107 | 8.2341 | 20 | 260 | positive regulation of lymphocyte activation |
| GO:0050867 | 3e-04 | 2.4651 | 9.5643 | 22 | 302 | positive regulation of cell activation |
| GO:0032508 | 3e-04 | 4.7294 | 2.1535 | 9 | 68 | DNA duplex unwinding |
| GO:0048625 | 3e-04 | 46.1272 | 0.1583 | 3 | 5 | myoblast fate commitment |
| GO:0051152 | 3e-04 | 10.2823 | 0.6334 | 5 | 20 | positive regulation of smooth muscle cell differentiation |
| GO:0048523 | 4e-04 | 1.3918 | 141.0887 | 176 | 4455 | negative regulation of cellular process |
| GO:1902187 | 6e-04 | 13.688 | 0.4117 | 4 | 13 | negative regulation of viral release from host cell |
| GO:0001912 | 6e-04 | 6.6175 | 1.0768 | 6 | 34 | positive regulation of leukocyte mediated cytotoxicity |
| GO:0000060 | 6e-04 | 5.4108 | 1.4885 | 7 | 47 | protein import into nucleus, translocation |
| GO:0042102 | 9e-04 | 3.606 | 3.0403 | 10 | 96 | positive regulation of T cell proliferation |
| GO:0016070 | 9e-04 | 1.3573 | 140.012 | 172 | 4421 | RNA metabolic process |
| GO:0002434 | 0.001 | Inf | 0.0633 | 2 | 2 | immune complex clearance |
| GO:0090265 | 0.001 | Inf | 0.0633 | 2 | 2 | positive regulation of immune complex clearance by monocytes and macrophages |
| GO:0051026 | 0.001 | 23.0607 | 0.2217 | 3 | 7 | chiasma assembly |
| GO:0002827 | 0.001 | 11.1979 | 0.475 | 4 | 15 | positive regulation of T-helper 1 type immune response |
| GO:0097696 | 0.0011 | 2.7749 | 5.4155 | 14 | 171 | STAT cascade |
| GO:0006355 | 0.0012 | 1.3777 | 109.0706 | 138 | 3444 | regulation of transcription, DNA-templated |
| GO:0072657 | 0.0013 | 1.9354 | 15.8349 | 29 | 500 | protein localization to membrane |
| GO:0002694 | 0.0015 | 1.9662 | 14.5047 | 27 | 458 | regulation of leukocyte activation |
| GO:2001141 | 0.0016 | 1.3636 | 109.9257 | 138 | 3471 | regulation of RNA biosynthetic process |
| GO:0042886 | 0.0017 | 1.4564 | 62.2944 | 85 | 1967 | amide transport |
| GO:0010629 | 0.002 | 1.4607 | 58.304 | 80 | 1841 | negative regulation of gene expression |
| GO:0007166 | 0.0021 | 1.393 | 83.2281 | 108 | 2628 | cell surface receptor signaling pathway |
| GO:0045785 | 0.0022 | 2.0269 | 11.9712 | 23 | 378 | positive regulation of cell adhesion |
| GO:2000402 | 0.0023 | 15.3718 | 0.285 | 3 | 9 | negative regulation of lymphocyte migration |
| GO:0045934 | 0.0023 | 1.5211 | 43.1342 | 62 | 1362 | negative regulation of nucleobase-containing compound metabolic process |
| GO:0022407 | 0.0028 | 1.9556 | 12.9213 | 24 | 408 | regulation of cell-cell adhesion |
| GO:0046425 | 0.0028 | 2.7183 | 4.7188 | 12 | 149 | regulation of JAK-STAT cascade |
| GO:0048584 | 0.0028 | 1.4227 | 64.3213 | 86 | 2031 | positive regulation of response to stimulus |
| GO:0007079 | 0.0029 | 61.3867 | 0.095 | 2 | 3 | mitotic chromosome movement towards spindle pole |
| GO:1902463 | 0.0029 | 61.3867 | 0.095 | 2 | 3 | protein localization to cell leading edge |
| GO:2000502 | 0.0029 | 61.3867 | 0.095 | 2 | 3 | negative regulation of natural killer cell chemotaxis |
| GO:0006370 | 0.0031 | 5.708 | 1.0134 | 5 | 32 | 7-methylguanosine mRNA capping |
| GO:0050731 | 0.0032 | 2.5551 | 5.4155 | 13 | 171 | positive regulation of peptidyl-tyrosine phosphorylation |
| GO:0002684 | 0.0032 | 1.6041 | 29.5162 | 45 | 932 | positive regulation of immune system process |
| GO:0036006 | 0.0032 | 13.175 | 0.3167 | 3 | 10 | cellular response to macrophage colony-stimulating factor stimulus |
| GO:0042762 | 0.0032 | 7.6961 | 0.6334 | 4 | 20 | regulation of sulfur metabolic process |
| GO:0006612 | 0.0035 | 2.6405 | 4.8455 | 12 | 153 | protein targeting to membrane |
| GO:0036260 | 0.0036 | 5.5038 | 1.0451 | 5 | 33 | RNA capping |
| GO:0032609 | 0.0036 | 3.165 | 3.072 | 9 | 97 | interferon-gamma production |
| GO:0033554 | 0.0036 | 1.4286 | 57.8606 | 78 | 1827 | cellular response to stress |
| GO:0015031 | 0.0037 | 1.4186 | 60.5526 | 81 | 1912 | protein transport |
| GO:0001819 | 0.0037 | 1.9375 | 12.4779 | 23 | 394 | positive regulation of cytokine production |
| GO:0002223 | 0.0038 | 2.9219 | 3.6737 | 10 | 116 | stimulatory C-type lectin receptor signaling pathway |
| GO:1901623 | 0.0039 | 7.2429 | 0.6651 | 4 | 21 | regulation of lymphocyte chemotaxis |
| GO:2000779 | 0.0039 | 4.4078 | 1.5201 | 6 | 48 | regulation of double-strand break repair |
| GO:0044271 | 0.0041 | 1.2911 | 153.1866 | 181 | 4837 | cellular nitrogen compound biosynthetic process |
| GO:0097659 | 0.0042 | 1.3176 | 114.5495 | 140 | 3617 | nucleic acid-templated transcription |
| GO:0050713 | 0.0043 | 11.5274 | 0.3484 | 3 | 11 | negative regulation of interleukin-1 beta secretion |
| GO:0046635 | 0.0043 | 4.305 | 1.5518 | 6 | 49 | positive regulation of alpha-beta T cell activation |
| GO:1990778 | 0.0044 | 2.212 | 7.6324 | 16 | 241 | protein localization to cell periphery |
| GO:0006281 | 0.0048 | 1.7945 | 15.7715 | 27 | 498 | DNA repair |
| GO:2000181 | 0.005 | 2.9939 | 3.2303 | 9 | 102 | negative regulation of blood vessel morphogenesis |
| GO:0016043 | 0.0051 | 1.2713 | 181.8794 | 210 | 5743 | cellular component organization |
| GO:2000113 | 0.0051 | 1.4485 | 47.2829 | 65 | 1493 | negative regulation of cellular macromolecule biosynthetic process |
| GO:0014742 | 0.0052 | 4.9702 | 1.1401 | 5 | 36 | positive regulation of muscle hypertrophy |
| GO:0043901 | 0.0052 | 2.4974 | 5.0988 | 12 | 161 | negative regulation of multi-organism process |
| GO:1903202 | 0.0053 | 4.1131 | 1.6152 | 6 | 51 | negative regulation of oxidative stress-induced cell death |
| GO:0039694 | 0.0055 | 6.4797 | 0.7284 | 4 | 23 | viral RNA genome replication |
| GO:0061051 | 0.0056 | 10.2459 | 0.38 | 3 | 12 | positive regulation of cell growth involved in cardiac muscle cell development |
| GO:0051155 | 0.0056 | 3.5433 | 2.1535 | 7 | 68 | positive regulation of striated muscle cell differentiation |
| GO:0072683 | 0.0058 | 30.6914 | 0.1267 | 2 | 4 | T cell extravasation |
| GO:0006955 | 0.0059 | 1.4428 | 46.7499 | 64 | 1503 | immune response |
| GO:0016567 | 0.0062 | 1.5915 | 25.6525 | 39 | 810 | protein ubiquitination |
| GO:0044403 | 0.0062 | 1.5915 | 25.6525 | 39 | 810 | symbiosis, encompassing mutualism through parasitism |
| GO:1902883 | 0.0064 | 3.9376 | 1.6785 | 6 | 53 | negative regulation of response to oxidative stress |
| GO:0070647 | 0.0066 | 1.5072 | 34.0766 | 49 | 1076 | protein modification by small protein conjugation or removal |
| GO:0009890 | 0.0071 | 1.4076 | 52.3501 | 70 | 1653 | negative regulation of biosynthetic process |
| GO:0050862 | 0.0071 | 9.2207 | 0.4117 | 3 | 13 | positive regulation of T cell receptor signaling pathway |
| GO:0043502 | 0.0072 | 3.0518 | 2.8186 | 8 | 89 | regulation of muscle adaptation |
| GO:0042088 | 0.0072 | 5.904 | 0.7863 | 4 | 25 | T-helper 1 type immune response |
| GO:0035195 | 0.0073 | 2.0334 | 8.7725 | 17 | 277 | gene silencing by miRNA |
| GO:0010941 | 0.0074 | 1.4143 | 49.8165 | 67 | 1573 | regulation of cell death |
| GO:0001562 | 0.0074 | 5.8618 | 0.7917 | 4 | 25 | response to protozoan |
| GO:0006412 | 0.0075 | 1.5797 | 25.1458 | 38 | 794 | translation |
| GO:0072527 | 0.0077 | 3.3244 | 2.2802 | 7 | 72 | pyrimidine-containing compound metabolic process |
| GO:0002250 | 0.0078 | 1.8994 | 11.0211 | 20 | 348 | adaptive immune response |
| GO:0006518 | 0.0082 | 1.5196 | 30.2763 | 44 | 956 | peptide metabolic process |
| GO:2000725 | 0.0082 | 4.4011 | 1.2668 | 5 | 40 | regulation of cardiac muscle cell differentiation |
| GO:0002683 | 0.0084 | 1.8243 | 12.6046 | 22 | 398 | negative regulation of immune system process |
| GO:1903671 | 0.0085 | 5.595 | 0.8234 | 4 | 26 | negative regulation of sprouting angiogenesis |
| GO:0018130 | 0.0086 | 1.2727 | 130.9861 | 155 | 4136 | heterocycle biosynthetic process |
| GO:0051276 | 0.0086 | 1.4765 | 35.4384 | 50 | 1119 | chromosome organization |
| GO:0019058 | 0.0087 | 1.951 | 9.6593 | 18 | 305 | viral life cycle |
| GO:0002693 | 0.0089 | 8.382 | 0.4434 | 3 | 14 | positive regulation of cellular extravasation |
| GO:0007175 | 0.0089 | 8.382 | 0.4434 | 3 | 14 | negative regulation of epidermal growth factor-activated receptor activity |
| GO:0033033 | 0.0089 | 8.382 | 0.4434 | 3 | 14 | negative regulation of myeloid cell apoptotic process |
| GO:0060312 | 0.0089 | 8.382 | 0.4434 | 3 | 14 | regulation of blood vessel remodeling |
| GO:0002708 | 0.0089 | 3.2248 | 2.3436 | 7 | 74 | positive regulation of lymphocyte mediated immunity |
| GO:0002252 | 0.009 | 1.4842 | 33.822 | 48 | 1072 | immune effector process |
| GO:0019438 | 0.0091 | 1.2697 | 131.2078 | 155 | 4143 | aromatic compound biosynthetic process |
| GO:0016441 | 0.0092 | 1.9792 | 8.9942 | 17 | 284 | posttranscriptional gene silencing |
| GO:0032956 | 0.0092 | 1.9792 | 8.9942 | 17 | 284 | regulation of actin cytoskeleton organization |
| GO:0032946 | 0.0093 | 2.5361 | 4.1804 | 10 | 132 | positive regulation of mononuclear cell proliferation |
| GO:0043308 | 0.0094 | 20.4596 | 0.1583 | 2 | 5 | eosinophil degranulation |
| GO:0052572 | 0.0094 | 20.4596 | 0.1583 | 2 | 5 | response to host immune response |
| GO:0070814 | 0.0094 | 20.4596 | 0.1583 | 2 | 5 | hydrogen sulfide biosynthetic process |
| GO:0045936 | 0.0099 | 1.655 | 18.2734 | 29 | 577 | negative regulation of phosphate metabolic process |
| GO:0002285 | 0.01 | 2.3816 | 4.8771 | 11 | 154 | lymphocyte activation involved in immune response |
| GOMFID | Pvalue | OddsRatio | ExpCount | Count | Size | Term |
| GO:1900239 | 1e-04 | 30.9331 | 0.2524 | 4 | 8 | regulation of phenotypic switching |
| GO:0048625 | 3e-04 | 46.3143 | 0.1577 | 3 | 5 | myoblast fate commitment |
| GO:1902187 | 6e-04 | 13.7437 | 0.4101 | 4 | 13 | negative regulation of viral release from host cell |
| GO:1903037 | 7e-04 | 2.2765 | 10.2842 | 22 | 326 | regulation of leukocyte cell-cell adhesion |
| GO:0048519 | 8e-04 | 1.3686 | 138.9838 | 171 | 4509 | negative regulation of biological process |
| GO:0002434 | 0.001 | Inf | 0.0631 | 2 | 2 | immune complex clearance |
| GO:0090265 | 0.001 | Inf | 0.0631 | 2 | 2 | positive regulation of immune complex clearance by monocytes and macrophages |
| GO:0002449 | 0.0011 | 2.5679 | 6.6563 | 16 | 211 | lymphocyte mediated immunity |
| GO:0061337 | 0.0013 | 2.9939 | 4.3219 | 12 | 137 | cardiac conduction |
| GO:0030155 | 0.0014 | 1.808 | 20.4421 | 35 | 648 | regulation of cell adhesion |
| GO:0048671 | 0.0016 | 18.5222 | 0.2524 | 3 | 8 | negative regulation of collateral sprouting |
| GO:1990778 | 0.0017 | 2.3755 | 7.6027 | 17 | 241 | protein localization to cell periphery |
| GO:0065007 | 0.0018 | 1.3513 | 356.2548 | 386 | 11293 | biological regulation |
| GO:0002683 | 0.0019 | 2.0177 | 12.5555 | 24 | 398 | negative regulation of immune system process |
| GO:0022409 | 0.0021 | 2.3229 | 7.7604 | 17 | 246 | positive regulation of cell-cell adhesion |
| GO:2000402 | 0.0023 | 15.4342 | 0.2839 | 3 | 9 | negative regulation of lymphocyte migration |
| GO:0002696 | 0.0023 | 2.1885 | 9.18 | 19 | 291 | positive regulation of leukocyte activation |
| GO:0016043 | 0.0024 | 1.3015 | 181.1717 | 212 | 5743 | cellular component organization |
| GO:0072657 | 0.0025 | 1.8686 | 15.7733 | 28 | 500 | protein localization to membrane |
| GO:0014707 | 0.0029 | 61.6353 | 0.0946 | 2 | 3 | branchiomeric skeletal muscle development |
| GO:1902463 | 0.0029 | 61.6353 | 0.0946 | 2 | 3 | protein localization to cell leading edge |
| GO:2000502 | 0.0029 | 61.6353 | 0.0946 | 2 | 3 | negative regulation of natural killer cell chemotaxis |
| GO:0008104 | 0.0031 | 1.3805 | 79.7496 | 103 | 2528 | protein localization |
| GO:0050804 | 0.0031 | 2.1249 | 9.4324 | 19 | 299 | modulation of chemical synaptic transmission |
| GO:0050857 | 0.0038 | 7.2723 | 0.6625 | 4 | 21 | positive regulation of antigen receptor-mediated signaling pathway |
| GO:0051249 | 0.0039 | 1.9297 | 12.524 | 23 | 397 | regulation of lymphocyte activation |
| GO:0042110 | 0.004 | 2.2322 | 7.5669 | 16 | 245 | T cell activation |
| GO:0045596 | 0.0041 | 1.7121 | 20.2213 | 33 | 641 | negative regulation of cell differentiation |
| GO:0031324 | 0.0041 | 1.3639 | 81.3585 | 104 | 2579 | negative regulation of cellular metabolic process |
| GO:0046635 | 0.0042 | 4.3225 | 1.5458 | 6 | 49 | positive regulation of alpha-beta T cell activation |
| GO:0042886 | 0.0048 | 1.3994 | 62.052 | 82 | 1967 | amide transport |
| GO:0015031 | 0.0049 | 1.4036 | 60.3169 | 80 | 1912 | protein transport |
| GO:2000181 | 0.0049 | 3.0062 | 3.2177 | 9 | 102 | negative regulation of blood vessel morphogenesis |
| GO:0000186 | 0.0052 | 4.1299 | 1.6089 | 6 | 51 | activation of MAPKK activity |
| GO:2000300 | 0.0054 | 6.506 | 0.7256 | 4 | 23 | regulation of synaptic vesicle exocytosis |
| GO:0072683 | 0.0057 | 30.8157 | 0.1262 | 2 | 4 | T cell extravasation |
| GO:0019222 | 0.0058 | 1.2624 | 199.9418 | 228 | 6338 | regulation of metabolic process |
| GO:0046632 | 0.0061 | 3.1423 | 2.7445 | 8 | 87 | alpha-beta T cell differentiation |
| GO:0045892 | 0.0062 | 1.5057 | 34.8274 | 50 | 1104 | negative regulation of transcription, DNA-templated |
| GO:0001910 | 0.0063 | 3.9537 | 1.672 | 6 | 53 | regulation of leukocyte mediated cytotoxicity |
| GO:0051253 | 0.0063 | 1.4825 | 38.2344 | 54 | 1212 | negative regulation of RNA metabolic process |
| GO:0001819 | 0.0072 | 1.8522 | 12.4293 | 22 | 394 | positive regulation of cytokine production |
| GO:0051172 | 0.0072 | 1.343 | 76.5634 | 97 | 2427 | negative regulation of nitrogen compound metabolic process |
| GO:0051489 | 0.0073 | 4.5493 | 1.2303 | 5 | 39 | regulation of filopodium assembly |
| GO:1903900 | 0.0073 | 2.6335 | 4.038 | 10 | 128 | regulation of viral life cycle |
| GO:0035556 | 0.0074 | 1.3321 | 82.084 | 103 | 2602 | intracellular signal transduction |
| GO:0002250 | 0.0074 | 1.9073 | 10.9782 | 20 | 348 | adaptive immune response |
| GO:0010771 | 0.0075 | 3.338 | 2.2713 | 7 | 72 | negative regulation of cell morphogenesis involved in differentiation |
| GO:0051239 | 0.0076 | 1.3231 | 86.7529 | 108 | 2750 | regulation of multicellular organismal process |
| GO:0019219 | 0.0076 | 1.281 | 126.817 | 151 | 4020 | regulation of nucleobase-containing compound metabolic process |
| GO:0051897 | 0.0077 | 2.4788 | 4.7004 | 11 | 149 | positive regulation of protein kinase B signaling |
| GO:0050865 | 0.0079 | 1.7394 | 15.6155 | 26 | 495 | regulation of cell activation |
| GO:0042088 | 0.0081 | 4.419 | 1.2619 | 5 | 40 | T-helper 1 type immune response |
| GO:0044093 | 0.0083 | 1.3924 | 53.6291 | 71 | 1700 | positive regulation of molecular function |
| GO:0002252 | 0.0084 | 1.4909 | 33.6899 | 48 | 1072 | immune effector process |
| GO:1903671 | 0.0084 | 5.6178 | 0.8202 | 4 | 26 | negative regulation of sprouting angiogenesis |
| GO:0002693 | 0.0088 | 8.416 | 0.4417 | 3 | 14 | positive regulation of cellular extravasation |
| GO:0033033 | 0.0088 | 8.416 | 0.4417 | 3 | 14 | negative regulation of myeloid cell apoptotic process |
| GO:0050870 | 0.0091 | 2.4137 | 4.8158 | 11 | 154 | positive regulation of T cell activation |
| GO:0033227 | 0.0093 | 20.5425 | 0.1577 | 2 | 5 | dsRNA transport |
| GO:0043308 | 0.0093 | 20.5425 | 0.1577 | 2 | 5 | eosinophil degranulation |
| GO:0070814 | 0.0093 | 20.5425 | 0.1577 | 2 | 5 | hydrogen sulfide biosynthetic process |
| GO:0086011 | 0.0097 | 5.3732 | 0.8518 | 4 | 27 | membrane repolarization during action potential |
| GOMFID | Pvalue | OddsRatio | ExpCount | Count | Size | Term |
| GO:0006355 | 0 | 1.8966 | 98.6728 | 155 | 3444 | regulation of transcription, DNA-templated |
| GO:2001141 | 0 | 1.8771 | 99.4464 | 155 | 3471 | regulation of RNA biosynthetic process |
| GO:0000122 | 0 | 2.6237 | 21.7172 | 51 | 758 | negative regulation of transcription from RNA polymerase II promoter |
| GO:0019219 | 0 | 1.7158 | 115.1756 | 166 | 4020 | regulation of nucleobase-containing compound metabolic process |
| GO:0007156 | 0 | 5.007 | 4.3549 | 19 | 152 | homophilic cell adhesion via plasma membrane adhesion molecules |
| GO:0034654 | 0 | 1.6342 | 116.8087 | 163 | 4077 | nucleobase-containing compound biosynthetic process |
| GO:0060173 | 0 | 4.1363 | 4.8706 | 18 | 170 | limb development |
| GO:0045944 | 0 | 2.0797 | 30.6275 | 58 | 1069 | positive regulation of transcription from RNA polymerase II promoter |
| GO:1903507 | 0 | 2.0184 | 32.6044 | 60 | 1138 | negative regulation of nucleic acid-templated transcription |
| GO:0003002 | 0 | 3.1656 | 8.3203 | 24 | 293 | regionalization |
| GO:0009792 | 0 | 2.4849 | 15.7865 | 36 | 551 | embryo development ending in birth or egg hatching |
| GO:0035107 | 0 | 4.3193 | 4.1543 | 16 | 145 | appendage morphogenesis |
| GO:0021879 | 0 | 7.759 | 1.4039 | 9 | 49 | forebrain neuron differentiation |
| GO:0051253 | 0 | 1.9171 | 34.7246 | 61 | 1212 | negative regulation of RNA metabolic process |
| GO:0007267 | 0 | 1.779 | 43.5776 | 71 | 1521 | cell-cell signaling |
| GO:0035295 | 0 | 2.5615 | 11.3907 | 27 | 406 | tube development |
| GO:0060562 | 0 | 3.5959 | 4.8885 | 16 | 173 | epithelial tube morphogenesis |
| GO:0072132 | 0 | 7.245 | 1.3179 | 8 | 46 | mesenchyme morphogenesis |
| GO:0001709 | 1e-04 | 8.051 | 1.0557 | 7 | 37 | cell fate determination |
| GO:0048864 | 1e-04 | 5.6376 | 1.8336 | 9 | 64 | stem cell development |
| GO:0021510 | 1e-04 | 4.4696 | 2.7505 | 11 | 96 | spinal cord development |
| GO:0090596 | 1e-04 | 2.903 | 7.0767 | 19 | 247 | sensory organ morphogenesis |
| GO:0007399 | 1e-04 | 2.2335 | 14.9587 | 31 | 571 | nervous system development |
| GO:0045778 | 1e-04 | 4.7903 | 2.3494 | 10 | 82 | positive regulation of ossification |
| GO:0003263 | 1e-04 | 22.7896 | 0.2865 | 4 | 10 | cardioblast proliferation |
| GO:0014033 | 1e-04 | 5.254 | 1.9482 | 9 | 68 | neural crest cell differentiation |
| GO:0022610 | 1e-04 | 1.7382 | 37.8475 | 61 | 1321 | biological adhesion |
| GO:0045597 | 1e-04 | 1.9494 | 23.1018 | 42 | 814 | positive regulation of cell differentiation |
| GO:0021915 | 2e-04 | 3.4397 | 4.4409 | 14 | 155 | neural tube development |
| GO:0035024 | 2e-04 | 12.229 | 0.5444 | 5 | 19 | negative regulation of Rho protein signal transduction |
| GO:0030182 | 2e-04 | 1.8392 | 28.6215 | 49 | 1018 | neuron differentiation |
| GO:1901576 | 2e-04 | 1.4125 | 175.1987 | 213 | 6115 | organic substance biosynthetic process |
| GO:0009889 | 2e-04 | 1.5519 | 73.1583 | 102 | 2693 | regulation of biosynthetic process |
| GO:0097659 | 2e-04 | 1.7061 | 41.6814 | 65 | 1582 | nucleic acid-templated transcription |
| GO:0021903 | 2e-04 | 19.5327 | 0.3152 | 4 | 11 | rostrocaudal neural tube patterning |
| GO:0055123 | 2e-04 | 3.5415 | 4.0111 | 13 | 140 | digestive system development |
| GO:0060039 | 2e-04 | 11.413 | 0.573 | 5 | 20 | pericardium development |
| GO:0001569 | 2e-04 | 8.2301 | 0.8882 | 6 | 31 | branching involved in blood vessel morphogenesis |
| GO:0048701 | 2e-04 | 6.4969 | 1.2606 | 7 | 44 | embryonic cranial skeleton morphogenesis |
| GO:0060255 | 2e-04 | 1.4035 | 167.4057 | 204 | 5843 | regulation of macromolecule metabolic process |
| GO:0043586 | 3e-04 | 10.699 | 0.6017 | 5 | 21 | tongue development |
| GO:0051216 | 3e-04 | 3.1869 | 4.7573 | 14 | 167 | cartilage development |
| GO:0021513 | 3e-04 | 10.0691 | 0.6303 | 5 | 22 | spinal cord dorsal/ventral patterning |
| GO:1903508 | 4e-04 | 1.6675 | 39.2514 | 61 | 1370 | positive regulation of nucleic acid-templated transcription |
| GO:0048048 | 4e-04 | 7.3469 | 0.9741 | 6 | 34 | embryonic eye morphogenesis |
| GO:0007268 | 4e-04 | 2.0329 | 16.7606 | 32 | 585 | chemical synaptic transmission |
| GO:0048704 | 4e-04 | 5.9385 | 1.3582 | 7 | 48 | embryonic skeletal system morphogenesis |
| GO:0099537 | 4e-04 | 2.0253 | 16.8179 | 32 | 587 | trans-synaptic signaling |
| GO:0021902 | 4e-04 | 34.1169 | 0.1719 | 3 | 6 | commitment of neuronal cell to specific neuron type in forebrain |
| GO:0014031 | 5e-04 | 4.9106 | 1.8336 | 8 | 64 | mesenchymal cell development |
| GO:0051254 | 5e-04 | 1.6362 | 41.2856 | 63 | 1441 | positive regulation of RNA metabolic process |
| GO:0061138 | 5e-04 | 3.0086 | 5.0139 | 14 | 175 | morphogenesis of a branching epithelium |
| GO:0098609 | 5e-04 | 1.8562 | 22.3475 | 39 | 780 | cell-cell adhesion |
| GO:0003214 | 5e-04 | 13.6703 | 0.4011 | 4 | 14 | cardiac left ventricle morphogenesis |
| GO:0045927 | 5e-04 | 2.6568 | 6.8475 | 17 | 239 | positive regulation of growth |
| GO:0030900 | 6e-04 | 2.3156 | 10.1137 | 22 | 353 | forebrain development |
| GO:0002088 | 6e-04 | 4.7407 | 1.8909 | 8 | 66 | lens development in camera-type eye |
| GO:0031076 | 6e-04 | 6.6346 | 1.0601 | 6 | 37 | embryonic camera-type eye development |
| GO:0014706 | 6e-04 | 2.3014 | 10.171 | 22 | 355 | striated muscle tissue development |
| GO:0003148 | 6e-04 | 8.5571 | 0.7163 | 5 | 25 | outflow tract septum morphogenesis |
| GO:0051058 | 7e-04 | 5.3392 | 1.4898 | 7 | 52 | negative regulation of small GTPase mediated signal transduction |
| GO:2000113 | 7e-04 | 1.6011 | 42.7754 | 64 | 1493 | negative regulation of cellular macromolecule biosynthetic process |
| GO:0060581 | 7e-04 | 12.4267 | 0.4298 | 4 | 15 | cell fate commitment involved in pattern specification |
| GO:0003357 | 8e-04 | 25.586 | 0.2006 | 3 | 7 | noradrenergic neuron differentiation |
| GO:0060021 | 8e-04 | 4.0381 | 2.4541 | 9 | 86 | palate development |
| GO:0003206 | 8e-04 | 3.417 | 3.4954 | 11 | 122 | cardiac chamber morphogenesis |
| GO:0003197 | 8e-04 | 6.2317 | 1.1174 | 6 | 39 | endocardial cushion development |
| GO:0043134 | 8e-04 | Inf | 0.0573 | 2 | 2 | regulation of hindgut contraction |
| GO:0043503 | 8e-04 | Inf | 0.0573 | 2 | 2 | skeletal muscle fiber adaptation |
| GO:0072272 | 8e-04 | Inf | 0.0573 | 2 | 2 | proximal/distal pattern formation involved in metanephric nephron development |
| GO:0120054 | 8e-04 | Inf | 0.0573 | 2 | 2 | intestinal motility |
| GO:0120058 | 8e-04 | Inf | 0.0573 | 2 | 2 | positive regulation of small intestinal transit |
| GO:0090304 | 9e-04 | 1.3704 | 140.3882 | 172 | 4900 | nucleic acid metabolic process |
| GO:0009890 | 9e-04 | 1.5599 | 47.3595 | 69 | 1653 | negative regulation of biosynthetic process |
| GO:0060413 | 9e-04 | 11.3905 | 0.4584 | 4 | 16 | atrial septum morphogenesis |
| GO:0010557 | 0.001 | 1.5617 | 45.8697 | 67 | 1601 | positive regulation of macromolecule biosynthetic process |
| GO:0032675 | 0.001 | 3.55 | 3.0656 | 10 | 107 | regulation of interleukin-6 production |
| GO:2000026 | 0.0011 | 1.5245 | 52.0009 | 74 | 1815 | regulation of multicellular organismal development |
| GO:0001558 | 0.0011 | 2.1936 | 10.6294 | 22 | 371 | regulation of cell growth |
| GO:0010628 | 0.0011 | 1.5319 | 50.3105 | 72 | 1756 | positive regulation of gene expression |
| GO:0048483 | 0.0012 | 5.7113 | 1.2033 | 6 | 42 | autonomic nervous system development |
| GO:0022008 | 0.0012 | 1.8174 | 21.0067 | 36 | 753 | neurogenesis |
| GO:0021514 | 0.0012 | 10.5136 | 0.4871 | 4 | 17 | ventral spinal cord interneuron differentiation |
| GO:2000136 | 0.0012 | 10.5136 | 0.4871 | 4 | 17 | regulation of cell proliferation involved in heart morphogenesis |
| GO:0040011 | 0.0012 | 1.5421 | 47.1017 | 68 | 1644 | locomotion |
| GO:0030326 | 0.0014 | 3.6749 | 2.6695 | 9 | 94 | embryonic limb morphogenesis |
| GO:0051674 | 0.0014 | 1.5717 | 40.6266 | 60 | 1418 | localization of cell |
| GO:0048332 | 0.0015 | 4.0409 | 2.1774 | 8 | 76 | mesoderm morphogenesis |
| GO:0035590 | 0.0015 | 9.762 | 0.5157 | 4 | 18 | purinergic nucleotide receptor signaling pathway |
| GO:0060004 | 0.0015 | 9.762 | 0.5157 | 4 | 18 | reflex |
| GO:0060438 | 0.0015 | 9.762 | 0.5157 | 4 | 18 | trachea development |
| GO:0060079 | 0.0015 | 3.6409 | 2.6932 | 9 | 94 | excitatory postsynaptic potential |
| GO:0000902 | 0.0015 | 1.7181 | 25.2412 | 41 | 881 | cell morphogenesis |
| GO:0050794 | 0.0016 | 1.3756 | 228.229 | 257 | 8513 | regulation of cellular process |
| GO:0009653 | 0.0016 | 1.5467 | 44.3205 | 64 | 1666 | anatomical structure morphogenesis |
| GO:0007218 | 0.0016 | 3.5983 | 2.7218 | 9 | 95 | neuropeptide signaling pathway |
| GO:0001764 | 0.0016 | 3.0812 | 3.8392 | 11 | 134 | neuron migration |
| GO:0051240 | 0.0017 | 1.5712 | 39.2557 | 58 | 1396 | positive regulation of multicellular organismal process |
| GO:0007275 | 0.0017 | 1.4746 | 63.8411 | 86 | 2472 | multicellular organism development |
| GO:0048729 | 0.0017 | 1.9784 | 13.8767 | 26 | 497 | tissue morphogenesis |
| GO:0009954 | 0.0017 | 6.5798 | 0.8882 | 5 | 31 | proximal/distal pattern formation |
| GO:0065007 | 0.0018 | 1.3735 | 323.5518 | 352 | 11293 | biological regulation |
| GO:0003215 | 0.0018 | 9.1106 | 0.5444 | 4 | 19 | cardiac right ventricle morphogenesis |
| GO:0022612 | 0.0018 | 3.2467 | 3.3235 | 10 | 116 | gland morphogenesis |
| GO:0001654 | 0.0018 | 2.1832 | 9.6839 | 20 | 338 | eye development |
| GO:0048468 | 0.0019 | 1.5361 | 43.7109 | 63 | 1573 | cell development |
| GO:0032330 | 0.0019 | 5.1389 | 1.3179 | 6 | 46 | regulation of chondrocyte differentiation |
| GO:0001649 | 0.0019 | 2.6 | 5.7301 | 14 | 200 | osteoblast differentiation |
| GO:0035115 | 0.002 | 6.3357 | 0.9168 | 5 | 32 | embryonic forelimb morphogenesis |
| GO:1902742 | 0.002 | 6.3357 | 0.9168 | 5 | 32 | apoptotic process involved in development |
| GO:0008285 | 0.002 | 1.7994 | 19.3392 | 33 | 675 | negative regulation of cell proliferation |
| GO:0070542 | 0.002 | 3.8155 | 2.2921 | 8 | 80 | response to fatty acid |
| GO:2000179 | 0.0021 | 5.0132 | 1.3466 | 6 | 47 | positive regulation of neural precursor cell proliferation |
| GO:0003231 | 0.0022 | 3.1568 | 3.4094 | 10 | 119 | cardiac ventricle development |
| GO:0023019 | 0.0022 | 8.5407 | 0.573 | 4 | 20 | signal transduction involved in regulation of gene expression |
| GO:0003156 | 0.0023 | 6.1091 | 0.9455 | 5 | 33 | regulation of animal organ formation |
| GO:0045987 | 0.0023 | 6.1091 | 0.9455 | 5 | 33 | positive regulation of smooth muscle contraction |
| GO:0048935 | 0.0024 | 14.6804 | 0.2853 | 3 | 10 | peripheral nervous system neuron development |
| GO:0000066 | 0.0024 | 68.095 | 0.086 | 2 | 3 | mitochondrial ornithine transport |
| GO:0002125 | 0.0024 | 68.095 | 0.086 | 2 | 3 | maternal aggressive behavior |
| GO:0002317 | 0.0024 | 68.095 | 0.086 | 2 | 3 | plasma cell differentiation |
| GO:0003274 | 0.0024 | 68.095 | 0.086 | 2 | 3 | endocardial cushion fusion |
| GO:0014908 | 0.0024 | 68.095 | 0.086 | 2 | 3 | myotube differentiation involved in skeletal muscle regeneration |
| GO:0021524 | 0.0024 | 68.095 | 0.086 | 2 | 3 | visceral motor neuron differentiation |
| GO:0046010 | 0.0024 | 68.095 | 0.086 | 2 | 3 | positive regulation of circadian sleep/wake cycle, non-REM sleep |
| GO:0048936 | 0.0024 | 68.095 | 0.086 | 2 | 3 | peripheral nervous system neuron axonogenesis |
| GO:0060913 | 0.0024 | 68.095 | 0.086 | 2 | 3 | cardiac cell fate determination |
| GO:0070294 | 0.0024 | 68.095 | 0.086 | 2 | 3 | renal sodium ion absorption |
| GO:1904000 | 0.0024 | 68.095 | 0.086 | 2 | 3 | positive regulation of eating behavior |
| GO:1904349 | 0.0024 | 68.095 | 0.086 | 2 | 3 | positive regulation of small intestine smooth muscle contraction |
| GO:1905333 | 0.0024 | 68.095 | 0.086 | 2 | 3 | regulation of gastric motility |
| GO:0003211 | 0.0024 | 14.6178 | 0.2865 | 3 | 10 | cardiac ventricle formation |
| GO:0007617 | 0.0027 | 8.0378 | 0.6017 | 4 | 21 | mating behavior |
| GO:0051384 | 0.0028 | 2.8695 | 4.097 | 11 | 143 | response to glucocorticoid |
| GO:0048546 | 0.0029 | 4.6705 | 1.4325 | 6 | 50 | digestive tract morphogenesis |
| GO:0003230 | 0.003 | 5.7011 | 1.0028 | 5 | 35 | cardiac atrium development |
| GO:0016331 | 0.0031 | 2.8263 | 4.1543 | 11 | 145 | morphogenesis of embryonic epithelium |
| GO:0048545 | 0.0032 | 2.0355 | 10.8586 | 21 | 379 | response to steroid hormone |
| GO:0030324 | 0.0032 | 2.6678 | 4.7847 | 12 | 167 | lung development |
| GO:0003272 | 0.0032 | 7.5907 | 0.6303 | 4 | 22 | endocardial cushion formation |
| GO:2000778 | 0.0032 | 7.5907 | 0.6303 | 4 | 22 | positive regulation of interleukin-6 secretion |
| GO:0021521 | 0.0032 | 12.7898 | 0.3152 | 3 | 11 | ventral spinal cord interneuron specification |
| GO:0035413 | 0.0032 | 12.7898 | 0.3152 | 3 | 11 | positive regulation of catenin import into nucleus |
| GO:0060033 | 0.0032 | 12.7898 | 0.3152 | 3 | 11 | anatomical structure regression |
| GO:0051146 | 0.0037 | 2.248 | 7.5065 | 16 | 262 | striated muscle cell differentiation |
| GO:0072175 | 0.0038 | 2.9143 | 3.6673 | 10 | 128 | epithelial tube formation |
| GO:0010226 | 0.0038 | 7.1908 | 0.659 | 4 | 23 | response to lithium ion |
| GO:0001755 | 0.0039 | 5.3441 | 1.0601 | 5 | 37 | neural crest cell migration |
| GO:1990830 | 0.004 | 3.3896 | 2.5499 | 8 | 89 | cellular response to leukemia inhibitory factor |
| GO:0009790 | 0.0041 | 2.0225 | 10.3973 | 20 | 380 | embryo development |
| GO:0045628 | 0.0042 | 11.368 | 0.3438 | 3 | 12 | regulation of T-helper 2 cell differentiation |
| GO:0060536 | 0.0042 | 11.368 | 0.3438 | 3 | 12 | cartilage morphogenesis |
| GO:0060900 | 0.0042 | 11.368 | 0.3438 | 3 | 12 | embryonic camera-type eye formation |
| GO:0001501 | 0.0043 | 2.5608 | 4.9657 | 12 | 179 | skeletal system development |
| GO:0007405 | 0.0043 | 4.2802 | 1.5471 | 6 | 54 | neuroblast proliferation |
| GO:0009991 | 0.0043 | 1.9105 | 12.6349 | 23 | 441 | response to extracellular stimulus |
| GO:0017145 | 0.0043 | 5.1818 | 1.0887 | 5 | 38 | stem cell division |
| GO:2000648 | 0.0043 | 5.1818 | 1.0887 | 5 | 38 | positive regulation of stem cell proliferation |
| GO:0003171 | 0.0045 | 6.8308 | 0.6876 | 4 | 24 | atrioventricular valve development |
| GO:0048520 | 0.0045 | 6.8308 | 0.6876 | 4 | 24 | positive regulation of behavior |
| GO:0006933 | 0.0047 | 34.0454 | 0.1146 | 2 | 4 | negative regulation of cell adhesion involved in substrate-bound cell migration |
| GO:0021555 | 0.0047 | 34.0454 | 0.1146 | 2 | 4 | midbrain-hindbrain boundary morphogenesis |
| GO:0032100 | 0.0047 | 34.0454 | 0.1146 | 2 | 4 | positive regulation of appetite |
| GO:0034287 | 0.0047 | 34.0454 | 0.1146 | 2 | 4 | detection of monosaccharide stimulus |
| GO:0042662 | 0.0047 | 34.0454 | 0.1146 | 2 | 4 | negative regulation of mesodermal cell fate specification |
| GO:0051594 | 0.0047 | 34.0454 | 0.1146 | 2 | 4 | detection of glucose |
| GO:0060214 | 0.0047 | 34.0454 | 0.1146 | 2 | 4 | endocardium formation |
| GO:0060406 | 0.0047 | 34.0454 | 0.1146 | 2 | 4 | positive regulation of penile erection |
| GO:0072086 | 0.0047 | 34.0454 | 0.1146 | 2 | 4 | specification of loop of Henle identity |
| GO:0072513 | 0.0047 | 34.0454 | 0.1146 | 2 | 4 | positive regulation of secondary heart field cardioblast proliferation |
| GO:1903352 | 0.0047 | 34.0454 | 0.1146 | 2 | 4 | L-ornithine transmembrane transport |
| GO:1905903 | 0.0047 | 34.0454 | 0.1146 | 2 | 4 | negative regulation of mesoderm formation |
| GO:0033627 | 0.0047 | 4.1926 | 1.5758 | 6 | 55 | cell adhesion mediated by integrin |
| GO:0051094 | 0.0048 | 2.0813 | 9.0953 | 18 | 335 | positive regulation of developmental process |
| GO:0048562 | 0.0049 | 2.6448 | 4.4117 | 11 | 159 | embryonic organ morphogenesis |
| GO:0031670 | 0.0049 | 5.0291 | 1.1174 | 5 | 39 | cellular response to nutrient |
| GO:0034641 | 0.0049 | 1.2841 | 180.585 | 208 | 6303 | cellular nitrogen compound metabolic process |
| GO:0006725 | 0.0051 | 1.2869 | 164.1682 | 191 | 5730 | cellular aromatic compound metabolic process |
| GO:1901360 | 0.0054 | 1.2828 | 170.1848 | 197 | 5940 | organic cyclic compound metabolic process |
| GO:0007320 | 0.0054 | 10.2305 | 0.3725 | 3 | 13 | insemination |
| GO:0021520 | 0.0054 | 10.2305 | 0.3725 | 3 | 13 | spinal cord motor neuron cell fate specification |
| GO:0060123 | 0.0054 | 10.2305 | 0.3725 | 3 | 13 | regulation of growth hormone secretion |
| GO:0030534 | 0.0055 | 2.7499 | 3.8678 | 10 | 135 | adult behavior |
| GO:0060348 | 0.0055 | 2.4742 | 5.1285 | 12 | 179 | bone development |
| GO:0042472 | 0.0055 | 3.1915 | 2.6932 | 8 | 94 | inner ear morphogenesis |
| GO:0007517 | 0.0056 | 1.9622 | 10.6867 | 20 | 373 | muscle organ development |
| GO:0045600 | 0.0057 | 4.0277 | 1.6331 | 6 | 57 | positive regulation of fat cell differentiation |
| GO:0034645 | 0.0059 | 1.3402 | 94.0298 | 116 | 3458 | cellular macromolecule biosynthetic process |
| GO:0031016 | 0.006 | 3.4767 | 2.1774 | 7 | 76 | pancreas development |
| GO:0021983 | 0.0061 | 4.7491 | 1.1747 | 5 | 41 | pituitary gland development |
| GO:0042476 | 0.0061 | 2.8882 | 3.3235 | 9 | 116 | odontogenesis |
| GO:0010721 | 0.0064 | 2.1168 | 7.9362 | 16 | 277 | negative regulation of cell development |
| GO:0021543 | 0.0064 | 2.5393 | 4.5841 | 11 | 160 | pallium development |
| GO:0050767 | 0.0065 | 1.6826 | 19.2819 | 31 | 673 | regulation of neurogenesis |
| GO:0046483 | 0.0066 | 1.2763 | 163.1368 | 189 | 5694 | heterocycle metabolic process |
| GO:0016477 | 0.0067 | 1.5207 | 32.4648 | 47 | 1151 | cell migration |
| GO:0010470 | 0.0067 | 4.6204 | 1.2033 | 5 | 42 | regulation of gastrulation |
| GO:0042487 | 0.0067 | 9.2999 | 0.4011 | 3 | 14 | regulation of odontogenesis of dentin-containing tooth |
| GO:0042711 | 0.0067 | 9.2999 | 0.4011 | 3 | 14 | maternal behavior |
| GO:0007416 | 0.0067 | 2.6639 | 3.9824 | 10 | 139 | synapse assembly |
| GO:0032990 | 0.0068 | 1.7237 | 16.9898 | 28 | 593 | cell part morphogenesis |
| GO:0030155 | 0.0068 | 1.6903 | 18.5656 | 30 | 648 | regulation of cell adhesion |
| GO:0045665 | 0.0069 | 2.4015 | 5.2717 | 12 | 184 | negative regulation of neuron differentiation |
| GO:0003279 | 0.0071 | 3.0489 | 2.8078 | 8 | 98 | cardiac septum development |
| GO:0051705 | 0.0073 | 3.8032 | 1.719 | 6 | 60 | multi-organism behavior |
| GO:0051961 | 0.0074 | 2.1382 | 7.3632 | 15 | 257 | negative regulation of nervous system development |
| GO:0035051 | 0.0074 | 2.6229 | 4.0397 | 10 | 141 | cardiocyte differentiation |
| GO:0003266 | 0.0077 | 22.791 | 0.1427 | 2 | 5 | regulation of secondary heart field cardioblast proliferation |
| GO:0002568 | 0.0077 | 22.6955 | 0.1433 | 2 | 5 | somatic diversification of T cell receptor genes |
| GO:0006528 | 0.0077 | 22.6955 | 0.1433 | 2 | 5 | asparagine metabolic process |
| GO:0009597 | 0.0077 | 22.6955 | 0.1433 | 2 | 5 | detection of virus |
| GO:0021778 | 0.0077 | 22.6955 | 0.1433 | 2 | 5 | oligodendrocyte cell fate specification |
| GO:0033153 | 0.0077 | 22.6955 | 0.1433 | 2 | 5 | T cell receptor V(D)J recombination |
| GO:0043415 | 0.0077 | 22.6955 | 0.1433 | 2 | 5 | positive regulation of skeletal muscle tissue regeneration |
| GO:0045409 | 0.0077 | 22.6955 | 0.1433 | 2 | 5 | negative regulation of interleukin-6 biosynthetic process |
| GO:0051891 | 0.0077 | 22.6955 | 0.1433 | 2 | 5 | positive regulation of cardioblast differentiation |
| GO:0060023 | 0.0077 | 22.6955 | 0.1433 | 2 | 5 | soft palate development |
| GO:0070309 | 0.0077 | 22.6955 | 0.1433 | 2 | 5 | lens fiber cell morphogenesis |
| GO:0071799 | 0.0077 | 22.6955 | 0.1433 | 2 | 5 | cellular response to prostaglandin D stimulus |
| GO:1902262 | 0.0077 | 22.6955 | 0.1433 | 2 | 5 | apoptotic process involved in blood vessel morphogenesis |
| GO:1904304 | 0.0077 | 22.6955 | 0.1433 | 2 | 5 | regulation of gastro-intestinal system smooth muscle contraction |
| GO:1905007 | 0.0077 | 22.6955 | 0.1433 | 2 | 5 | positive regulation of epithelial to mesenchymal transition involved in endocardial cushion formation |
| GO:1903036 | 0.0079 | 3.7338 | 1.7477 | 6 | 61 | positive regulation of response to wounding |
| GO:0120039 | 0.0079 | 1.7215 | 16.3882 | 27 | 572 | plasma membrane bounded cell projection morphogenesis |
| GO:0016339 | 0.0079 | 5.6909 | 0.8022 | 4 | 28 | calcium-dependent cell-cell adhesion via plasma membrane cell adhesion molecules |
| GO:0018279 | 0.0082 | 4.3829 | 1.2606 | 5 | 44 | protein N-linked glycosylation via asparagine |
| GO:0048521 | 0.0082 | 8.5244 | 0.4298 | 3 | 15 | negative regulation of behavior |
| GO:0072148 | 0.0082 | 8.5244 | 0.4298 | 3 | 15 | epithelial cell fate commitment |
| GO:1904467 | 0.0082 | 8.5244 | 0.4298 | 3 | 15 | regulation of tumor necrosis factor secretion |
| GO:0007389 | 0.0087 | 3.2199 | 2.3299 | 7 | 85 | pattern specification process |
| GO:0042127 | 0.0088 | 1.5746 | 24.6125 | 37 | 890 | regulation of cell proliferation |
| GO:0030217 | 0.0089 | 2.2253 | 6.1353 | 13 | 215 | T cell differentiation |
| GO:0010719 | 0.009 | 5.4629 | 0.8309 | 4 | 29 | negative regulation of epithelial to mesenchymal transition |
| GO:0001756 | 0.0092 | 3.6023 | 1.805 | 6 | 63 | somitogenesis |
| GO:0043367 | 0.0092 | 3.6023 | 1.805 | 6 | 63 | CD4-positive, alpha-beta T cell differentiation |
| GO:0048665 | 0.0096 | 7.9482 | 0.454 | 3 | 16 | neuron fate specification |
| GO:0006928 | 0.0097 | 1.3842 | 54.0638 | 71 | 1887 | movement of cell or subcellular component |
| GO:0060042 | 0.0099 | 4.1686 | 1.3179 | 5 | 46 | retina morphogenesis in camera-type eye |
| GO:0001704 | 0.0099 | 2.6626 | 3.5813 | 9 | 125 | formation of primary germ layer |
| GO:0014061 | 0.0099 | 7.8681 | 0.4584 | 3 | 16 | regulation of norepinephrine secretion |
| GO:0043584 | 0.0099 | 7.8681 | 0.4584 | 3 | 16 | nose development |
| GO:0060850 | 0.0099 | 7.8681 | 0.4584 | 3 | 16 | regulation of transcription involved in cell fate commitment |
| GOMFID | Pvalue | OddsRatio | ExpCount | Count | Size | Term |
| GO:0045944 | 0 | 2.5597 | 32.1425 | 72 | 1069 | positive regulation of transcription from RNA polymerase II promoter |
| GO:2001141 | 0 | 1.9033 | 104.3652 | 164 | 3471 | regulation of RNA biosynthetic process |
| GO:0006355 | 0 | 1.9048 | 103.5534 | 163 | 3444 | regulation of transcription, DNA-templated |
| GO:0060562 | 0 | 4.7938 | 6.7735 | 28 | 228 | epithelial tube morphogenesis |
| GO:0048736 | 0 | 5.5253 | 5.1115 | 24 | 170 | appendage development |
| GO:0000122 | 0 | 2.7173 | 22.7914 | 55 | 758 | negative regulation of transcription from RNA polymerase II promoter |
| GO:0009888 | 0 | 2.0401 | 53.0758 | 95 | 1786 | tissue development |
| GO:0019219 | 0 | 1.73 | 120.8725 | 175 | 4020 | regulation of nucleobase-containing compound metabolic process |
| GO:0007156 | 0 | 5.0537 | 4.5703 | 20 | 152 | homophilic cell adhesion via plasma membrane adhesion molecules |
| GO:0030326 | 0 | 5.544 | 3.7885 | 18 | 126 | embryonic limb morphogenesis |
| GO:0009889 | 0 | 1.684 | 130.6746 | 184 | 4346 | regulation of biosynthetic process |
| GO:1903507 | 0 | 2.18 | 34.2171 | 67 | 1138 | negative regulation of nucleic acid-templated transcription |
| GO:0045597 | 0 | 3.1049 | 11.8093 | 33 | 402 | positive regulation of cell differentiation |
| GO:0007399 | 0 | 2.1217 | 37.6319 | 71 | 1358 | nervous system development |
| GO:0034654 | 0 | 1.6653 | 122.5863 | 173 | 4077 | nucleobase-containing compound biosynthetic process |
| GO:0061138 | 0 | 4.2975 | 5.2619 | 20 | 175 | morphogenesis of a branching epithelium |
| GO:0051253 | 0 | 2.066 | 36.4421 | 68 | 1212 | negative regulation of RNA metabolic process |
| GO:1903508 | 0 | 1.9924 | 41.1929 | 74 | 1370 | positive regulation of nucleic acid-templated transcription |
| GO:0048562 | 0 | 4.0879 | 5.4925 | 20 | 187 | embryonic organ morphogenesis |
| GO:0003206 | 0 | 5.0003 | 3.6683 | 16 | 122 | cardiac chamber morphogenesis |
| GO:0048762 | 0 | 4.0344 | 5.5625 | 20 | 185 | mesenchymal cell differentiation |
| GO:0051254 | 0 | 1.9429 | 43.3277 | 76 | 1441 | positive regulation of RNA metabolic process |
| GO:0007218 | 0 | 5.7106 | 2.8564 | 14 | 95 | neuropeptide signaling pathway |
| GO:0010557 | 0 | 1.8911 | 48.1385 | 82 | 1601 | positive regulation of macromolecule biosynthetic process |
| GO:0032502 | 0 | 1.9679 | 45.9822 | 78 | 1779 | developmental process |
| GO:0035295 | 0 | 3.0358 | 10.1444 | 28 | 351 | tube development |
| GO:0007267 | 0 | 1.8551 | 45.7331 | 77 | 1521 | cell-cell signaling |
| GO:0001568 | 0 | 2.3424 | 18.5819 | 40 | 618 | blood vessel development |
| GO:0003002 | 0 | 4.8529 | 3.2734 | 14 | 114 | regionalization |
| GO:0090596 | 0 | 3.2558 | 7.4267 | 22 | 247 | sensory organ morphogenesis |
| GO:0072132 | 0 | 7.9752 | 1.3831 | 9 | 46 | mesenchyme morphogenesis |
| GO:0010628 | 0 | 1.7497 | 52.799 | 84 | 1756 | positive regulation of gene expression |
| GO:0072358 | 0 | 2.2036 | 19.6343 | 40 | 653 | cardiovascular system development |
| GO:0048863 | 0 | 3.0591 | 7.4875 | 21 | 250 | stem cell differentiation |
| GO:0035148 | 0 | 3.9303 | 4.2396 | 15 | 141 | tube formation |
| GO:0050767 | 0 | 2.1906 | 19.2282 | 39 | 645 | regulation of neurogenesis |
| GO:0019098 | 0 | 9.946 | 0.902 | 7 | 30 | reproductive behavior |
| GO:0021983 | 0 | 7.9338 | 1.2328 | 8 | 41 | pituitary gland development |
| GO:0001569 | 0 | 9.531 | 0.9321 | 7 | 31 | branching involved in blood vessel morphogenesis |
| GO:0009887 | 0 | 3.0654 | 7.1026 | 20 | 257 | animal organ morphogenesis |
| GO:0051961 | 0 | 2.9545 | 7.7274 | 21 | 257 | negative regulation of nervous system development |
| GO:0021513 | 0 | 12.235 | 0.6615 | 6 | 22 | spinal cord dorsal/ventral patterning |
| GO:0031328 | 0 | 1.694 | 52.1977 | 81 | 1736 | positive regulation of cellular biosynthetic process |
| GO:0030324 | 0 | 3.5001 | 5.0213 | 16 | 167 | lung development |
| GO:0048468 | 0 | 1.8223 | 35.7509 | 60 | 1234 | cell development |
| GO:2000026 | 0 | 1.7365 | 44.5135 | 71 | 1526 | regulation of multicellular organismal development |
| GO:0001764 | 1e-04 | 3.8451 | 4.0291 | 14 | 134 | neuron migration |
| GO:0003215 | 1e-04 | 16.3514 | 0.4493 | 5 | 15 | cardiac right ventricle morphogenesis |
| GO:0003231 | 1e-04 | 4.0371 | 3.5781 | 13 | 119 | cardiac ventricle development |
| GO:0021915 | 1e-04 | 3.5341 | 4.6605 | 15 | 155 | neural tube development |
| GO:0003230 | 1e-04 | 8.1674 | 1.0524 | 7 | 35 | cardiac atrium development |
| GO:0043010 | 1e-04 | 2.7053 | 8.7798 | 22 | 292 | camera-type eye development |
| GO:0003148 | 1e-04 | 10.3012 | 0.7517 | 6 | 25 | outflow tract septum morphogenesis |
| GO:0060413 | 1e-04 | 14.8043 | 0.4811 | 5 | 16 | atrial septum morphogenesis |
| GO:0003179 | 1e-04 | 7.8852 | 1.0824 | 7 | 36 | heart valve morphogenesis |
| GO:0060021 | 1e-04 | 4.5147 | 2.7362 | 11 | 91 | palate development |
| GO:0001709 | 1e-04 | 7.6532 | 1.1082 | 7 | 37 | cell fate determination |
| GO:0048598 | 1e-04 | 2.7247 | 8.3115 | 21 | 292 | embryonic morphogenesis |
| GO:0042662 | 1e-04 | 97.367 | 0.1203 | 3 | 4 | negative regulation of mesodermal cell fate specification |
| GO:0060214 | 1e-04 | 97.367 | 0.1203 | 3 | 4 | endocardium formation |
| GO:1905903 | 1e-04 | 97.367 | 0.1203 | 3 | 4 | negative regulation of mesoderm formation |
| GO:2000113 | 1e-04 | 1.6851 | 44.8912 | 70 | 1493 | negative regulation of cellular macromolecule biosynthetic process |
| GO:0048870 | 1e-04 | 1.6952 | 42.6361 | 67 | 1418 | cell motility |
| GO:0003197 | 1e-04 | 7.1446 | 1.1726 | 7 | 39 | endocardial cushion development |
| GO:0045665 | 1e-04 | 3.1425 | 5.5325 | 16 | 184 | negative regulation of neuron differentiation |
| GO:0030198 | 1e-04 | 2.5203 | 9.8021 | 23 | 326 | extracellular matrix organization |
| GO:0048935 | 1e-04 | 21.7635 | 0.2995 | 4 | 10 | peripheral nervous system neuron development |
| GO:0003279 | 2e-04 | 4.1496 | 2.9466 | 11 | 98 | cardiac septum development |
| GO:0030900 | 2e-04 | 2.4731 | 9.972 | 23 | 334 | forebrain development |
| GO:0010719 | 2e-04 | 8.5075 | 0.872 | 6 | 29 | negative regulation of epithelial to mesenchymal transition |
| GO:0031128 | 2e-04 | 8.5075 | 0.872 | 6 | 29 | developmental induction |
| GO:0002089 | 2e-04 | 11.6297 | 0.5713 | 5 | 19 | lens morphogenesis in camera-type eye |
| GO:0060322 | 2e-04 | 1.9765 | 20.5363 | 38 | 683 | head development |
| GO:0021903 | 2e-04 | 18.5773 | 0.3307 | 4 | 11 | rostrocaudal neural tube patterning |
| GO:0045666 | 2e-04 | 2.4893 | 9.4713 | 22 | 315 | positive regulation of neuron differentiation |
| GO:0001501 | 2e-04 | 3.1249 | 5.2016 | 15 | 179 | skeletal system development |
| GO:0060039 | 3e-04 | 10.8537 | 0.6014 | 5 | 20 | pericardium development |
| GO:0051891 | 3e-04 | 48.6804 | 0.1503 | 3 | 5 | positive regulation of cardioblast differentiation |
| GO:0061009 | 3e-04 | 48.6804 | 0.1503 | 3 | 5 | common bile duct development |
| GO:0009954 | 3e-04 | 7.8259 | 0.9321 | 6 | 31 | proximal/distal pattern formation |
| GO:0010721 | 3e-04 | 2.5749 | 8.3288 | 20 | 277 | negative regulation of cell development |
| GO:0001947 | 3e-04 | 5.3378 | 1.7139 | 8 | 57 | heart looping |
| GO:0035050 | 3e-04 | 4.6761 | 2.1649 | 9 | 72 | embryonic heart tube development |
| GO:0048858 | 3e-04 | 2.034 | 17.289 | 33 | 575 | cell projection morphogenesis |
| GO:0048663 | 3e-04 | 5.2612 | 1.7343 | 8 | 58 | neuron fate commitment |
| GO:0048701 | 3e-04 | 6.1772 | 1.323 | 7 | 44 | embryonic cranial skeleton morphogenesis |
| GO:0042127 | 3e-04 | 1.6336 | 44.76 | 68 | 1511 | regulation of cell proliferation |
| GO:0055123 | 3e-04 | 3.365 | 4.2095 | 13 | 140 | digestive system development |
| GO:0043586 | 3e-04 | 10.1747 | 0.6314 | 5 | 21 | tongue development |
| GO:0060536 | 3e-04 | 16.2541 | 0.3608 | 4 | 12 | cartilage morphogenesis |
| GO:0060255 | 3e-04 | 1.3792 | 175.686 | 212 | 5843 | regulation of macromolecule metabolic process |
| GO:0001525 | 4e-04 | 2.2167 | 12.5008 | 26 | 421 | angiogenesis |
| GO:0090304 | 4e-04 | 1.3897 | 147.3321 | 182 | 4900 | nucleic acid metabolic process |
| GO:0003156 | 4e-04 | 7.2453 | 0.9922 | 6 | 33 | regulation of animal organ formation |
| GO:0045987 | 4e-04 | 7.2453 | 0.9922 | 6 | 33 | positive regulation of smooth muscle contraction |
| GO:0032330 | 4e-04 | 5.8596 | 1.3831 | 7 | 46 | regulation of chondrocyte differentiation |
| GO:0099537 | 4e-04 | 1.9884 | 17.6498 | 33 | 587 | trans-synaptic signaling |
| GO:0048332 | 4e-04 | 4.3958 | 2.2852 | 9 | 76 | mesoderm morphogenesis |
| GO:0048704 | 5e-04 | 5.6421 | 1.4264 | 7 | 48 | embryonic skeletal system morphogenesis |
| GO:0003278 | 5e-04 | 32.4515 | 0.1804 | 3 | 6 | apoptotic process involved in heart morphogenesis |
| GO:0007626 | 6e-04 | 2.8539 | 5.6527 | 15 | 188 | locomotory behavior |
| GO:0042711 | 6e-04 | 13.0017 | 0.4209 | 4 | 14 | maternal behavior |
| GO:0071229 | 6e-04 | 2.821 | 5.7129 | 15 | 190 | cellular response to acid chemical |
| GO:0048546 | 7e-04 | 5.3132 | 1.5034 | 7 | 50 | digestive tract morphogenesis |
| GO:0001755 | 8e-04 | 6.3088 | 1.1125 | 6 | 37 | neural crest cell migration |
| GO:0030534 | 8e-04 | 3.2013 | 4.0591 | 12 | 135 | adult behavior |
| GO:0090288 | 8e-04 | 3.2013 | 4.0591 | 12 | 135 | negative regulation of cellular response to growth factor stimulus |
| GO:0045992 | 8e-04 | 8.1377 | 0.7517 | 5 | 25 | negative regulation of embryonic development |
| GO:0048596 | 8e-04 | 8.1377 | 0.7517 | 5 | 25 | embryonic camera-type eye morphogenesis |
| GO:0060037 | 8e-04 | 8.1377 | 0.7517 | 5 | 25 | pharyngeal system development |
| GO:1901576 | 8e-04 | 1.348 | 183.8644 | 218 | 6115 | organic substance biosynthetic process |
| GO:0048812 | 8e-04 | 1.9584 | 16.7778 | 31 | 558 | neuron projection morphogenesis |
| GO:0050807 | 8e-04 | 3.4017 | 3.5179 | 11 | 117 | regulation of synapse organization |
| GO:0001708 | 8e-04 | 4.4643 | 1.9999 | 8 | 67 | cell fate specification |
| GO:0060581 | 8e-04 | 11.8189 | 0.451 | 4 | 15 | cell fate commitment involved in pattern specification |
| GO:0071599 | 8e-04 | 11.8189 | 0.451 | 4 | 15 | otic vesicle development |
| GO:0003357 | 9e-04 | 24.3371 | 0.2105 | 3 | 7 | noradrenergic neuron differentiation |
| GO:0021798 | 9e-04 | 24.3371 | 0.2105 | 3 | 7 | forebrain dorsal/ventral pattern formation |
| GO:0035265 | 9e-04 | 2.9855 | 4.6906 | 13 | 156 | organ growth |
| GO:0001558 | 9e-04 | 2.188 | 11.1551 | 23 | 371 | regulation of cell growth |
| GO:0003218 | 9e-04 | Inf | 0.0601 | 2 | 2 | cardiac left ventricle formation |
| GO:0043134 | 9e-04 | Inf | 0.0601 | 2 | 2 | regulation of hindgut contraction |
| GO:0072272 | 9e-04 | Inf | 0.0601 | 2 | 2 | proximal/distal pattern formation involved in metanephric nephron development |
| GO:0120054 | 9e-04 | Inf | 0.0601 | 2 | 2 | intestinal motility |
| GO:0120058 | 9e-04 | Inf | 0.0601 | 2 | 2 | positive regulation of small intestinal transit |
| GO:0050789 | 9e-04 | 1.3751 | 321.9357 | 354 | 10707 | regulation of biological process |
| GO:0021884 | 9e-04 | 7.7497 | 0.7818 | 5 | 26 | forebrain neuron development |
| GO:0048699 | 0.001 | 1.9299 | 17.0356 | 31 | 600 | generation of neurons |
| GO:0014855 | 0.0011 | 4.2844 | 2.0747 | 8 | 69 | striated muscle cell proliferation |
| GO:0001655 | 0.0011 | 2.2932 | 9.2609 | 20 | 308 | urogenital system development |
| GO:0051216 | 0.0011 | 3.0668 | 4.218 | 12 | 142 | cartilage development |
| GO:0035051 | 0.0011 | 3.0512 | 4.2396 | 12 | 141 | cardiocyte differentiation |
| GO:0097659 | 0.0012 | 1.5781 | 43.0188 | 63 | 1582 | nucleic acid-templated transcription |
| GO:0007631 | 0.0012 | 3.4457 | 3.1571 | 10 | 105 | feeding behavior |
| GO:0048608 | 0.0012 | 2.091 | 12.1474 | 24 | 404 | reproductive structure development |
| GO:0060441 | 0.0013 | 7.0749 | 0.8419 | 5 | 28 | epithelial tube branching involved in lung morphogenesis |
| GO:1902692 | 0.0013 | 7.0749 | 0.8419 | 5 | 28 | regulation of neuroblast proliferation |
| GO:0021859 | 0.0014 | 19.4685 | 0.2405 | 3 | 8 | pyramidal neuron differentiation |
| GO:0030916 | 0.0014 | 19.4685 | 0.2405 | 3 | 8 | otic vesicle formation |
| GO:0060534 | 0.0014 | 19.4685 | 0.2405 | 3 | 8 | trachea cartilage development |
| GO:2000035 | 0.0014 | 19.4685 | 0.2405 | 3 | 8 | regulation of stem cell division |
| GO:0021514 | 0.0014 | 9.9994 | 0.5112 | 4 | 17 | ventral spinal cord interneuron differentiation |
| GO:0055012 | 0.0014 | 9.9994 | 0.5112 | 4 | 17 | ventricular cardiac muscle cell differentiation |
| GO:2000136 | 0.0014 | 9.9994 | 0.5112 | 4 | 17 | regulation of cell proliferation involved in heart morphogenesis |
| GO:0045137 | 0.0015 | 2.582 | 6.194 | 15 | 206 | development of primary sexual characteristics |
| GO:0061333 | 0.0015 | 4.0197 | 2.1949 | 8 | 73 | renal tubule morphogenesis |
| GO:0007275 | 0.0015 | 1.4596 | 70.7687 | 94 | 2749 | multicellular organism development |
| GO:1902742 | 0.0015 | 6.8074 | 0.8686 | 5 | 29 | apoptotic process involved in development |
| GO:0010629 | 0.0016 | 1.4846 | 55.3548 | 77 | 1841 | negative regulation of gene expression |
| GO:0051965 | 0.0017 | 4.4775 | 1.7439 | 7 | 58 | positive regulation of synapse assembly |
| GO:0060004 | 0.0018 | 9.2845 | 0.5412 | 4 | 18 | reflex |
| GO:0042692 | 0.0018 | 2.0664 | 11.7565 | 23 | 391 | muscle cell differentiation |
| GO:0001756 | 0.0018 | 4.4089 | 1.7672 | 7 | 59 | somitogenesis |
| GO:0001657 | 0.0019 | 3.5024 | 2.7963 | 9 | 93 | ureteric bud development |
| GO:0003266 | 0.002 | 16.2227 | 0.2706 | 3 | 9 | regulation of secondary heart field cardioblast proliferation |
| GO:0060180 | 0.002 | 16.2227 | 0.2706 | 3 | 9 | female mating behavior |
| GO:1905770 | 0.002 | 16.2227 | 0.2706 | 3 | 9 | regulation of mesodermal cell differentiation |
| GO:0001822 | 0.002 | 2.3313 | 7.7274 | 17 | 257 | kidney development |
| GO:0042472 | 0.0021 | 3.461 | 2.8264 | 9 | 94 | inner ear morphogenesis |
| GO:0072163 | 0.0021 | 3.461 | 2.8264 | 9 | 94 | mesonephric epithelium development |
| GO:0031018 | 0.0022 | 5.0121 | 1.353 | 6 | 45 | endocrine pancreas development |
| GO:0007519 | 0.0022 | 2.8095 | 4.5703 | 12 | 152 | skeletal muscle tissue development |
| GO:0021895 | 0.0022 | 8.665 | 0.5713 | 4 | 19 | cerebral cortex neuron differentiation |
| GO:0072079 | 0.0022 | 8.665 | 0.5713 | 4 | 19 | nephron tubule formation |
| GO:0007492 | 0.0023 | 3.7314 | 2.3453 | 8 | 78 | endoderm development |
| GO:0098609 | 0.0024 | 1.7071 | 23.4529 | 38 | 780 | cell-cell adhesion |
| GO:0060317 | 0.0025 | 6.0252 | 0.9622 | 5 | 32 | cardiac epithelial to mesenchymal transition |
| GO:0010594 | 0.0025 | 2.9045 | 4.0591 | 11 | 135 | regulation of endothelial cell migration |
| GO:0009952 | 0.0026 | 3.0856 | 3.4844 | 10 | 119 | anterior/posterior pattern specification |
| GO:0042476 | 0.0026 | 3.086 | 3.4879 | 10 | 116 | odontogenesis |
| GO:0002125 | 0.0027 | 64.7778 | 0.0902 | 2 | 3 | maternal aggressive behavior |
| GO:0003166 | 0.0027 | 64.7778 | 0.0902 | 2 | 3 | bundle of His development |
| GO:0003274 | 0.0027 | 64.7778 | 0.0902 | 2 | 3 | endocardial cushion fusion |
| GO:0014016 | 0.0027 | 64.7778 | 0.0902 | 2 | 3 | neuroblast differentiation |
| GO:0021524 | 0.0027 | 64.7778 | 0.0902 | 2 | 3 | visceral motor neuron differentiation |
| GO:0046010 | 0.0027 | 64.7778 | 0.0902 | 2 | 3 | positive regulation of circadian sleep/wake cycle, non-REM sleep |
| GO:0048936 | 0.0027 | 64.7778 | 0.0902 | 2 | 3 | peripheral nervous system neuron axonogenesis |
| GO:0055005 | 0.0027 | 64.7778 | 0.0902 | 2 | 3 | ventricular cardiac myofibril assembly |
| GO:0055014 | 0.0027 | 64.7778 | 0.0902 | 2 | 3 | atrial cardiac muscle cell development |
| GO:0060913 | 0.0027 | 64.7778 | 0.0902 | 2 | 3 | cardiac cell fate determination |
| GO:0061364 | 0.0027 | 64.7778 | 0.0902 | 2 | 3 | apoptotic process involved in luteolysis |
| GO:1904000 | 0.0027 | 64.7778 | 0.0902 | 2 | 3 | positive regulation of eating behavior |
| GO:1904349 | 0.0027 | 64.7778 | 0.0902 | 2 | 3 | positive regulation of small intestine smooth muscle contraction |
| GO:1905333 | 0.0027 | 64.7778 | 0.0902 | 2 | 3 | regulation of gastric motility |
| GO:0009725 | 0.0027 | 1.672 | 25.1968 | 40 | 838 | response to hormone |
| GO:0048667 | 0.0027 | 1.8824 | 15.094 | 27 | 502 | cell morphogenesis involved in neuron differentiation |
| GO:0021854 | 0.0027 | 8.1229 | 0.6014 | 4 | 20 | hypothalamus development |
| GO:2000178 | 0.0027 | 8.1229 | 0.6014 | 4 | 20 | negative regulation of neural precursor cell proliferation |
| GO:0031960 | 0.0027 | 2.7307 | 4.6906 | 12 | 156 | response to corticosteroid |
| GO:0006725 | 0.0027 | 1.305 | 172.2884 | 202 | 5730 | cellular aromatic compound metabolic process |
| GO:2000179 | 0.0027 | 4.767 | 1.4132 | 6 | 47 | positive regulation of neural precursor cell proliferation |
| GO:0007517 | 0.0027 | 2.2052 | 8.6208 | 18 | 290 | muscle organ development |
| GO:0007268 | 0.0027 | 1.8336 | 16.6392 | 29 | 557 | chemical synaptic transmission |
| GO:0007411 | 0.0028 | 2.4035 | 6.6149 | 15 | 220 | axon guidance |
| GO:0003263 | 0.0028 | 13.9043 | 0.3007 | 3 | 10 | cardioblast proliferation |
| GO:0021877 | 0.0028 | 13.9043 | 0.3007 | 3 | 10 | forebrain neuron fate commitment |
| GO:0042415 | 0.0028 | 13.9043 | 0.3007 | 3 | 10 | norepinephrine metabolic process |
| GO:0050680 | 0.0028 | 3.0569 | 3.5179 | 10 | 117 | negative regulation of epithelial cell proliferation |
| GO:0051240 | 0.0028 | 1.6364 | 27.7376 | 43 | 962 | positive regulation of multicellular organismal process |
| GO:0001662 | 0.0028 | 5.8097 | 0.9922 | 5 | 33 | behavioral fear response |
| GO:0032989 | 0.003 | 1.6123 | 29.4063 | 45 | 978 | cellular component morphogenesis |
| GO:0045926 | 0.003 | 2.38 | 6.675 | 15 | 222 | negative regulation of growth |
| GO:0060348 | 0.003 | 2.568 | 5.3821 | 13 | 179 | bone development |
| GO:0055008 | 0.003 | 4.0046 | 1.9243 | 7 | 64 | cardiac muscle tissue morphogenesis |
| GO:0060043 | 0.003 | 4.6532 | 1.4433 | 6 | 48 | regulation of cardiac muscle cell proliferation |
| GO:0021515 | 0.0032 | 5.6511 | 1.015 | 5 | 34 | cell differentiation in spinal cord |
| GO:0045778 | 0.0032 | 3.5288 | 2.4656 | 8 | 82 | positive regulation of ossification |
| GO:0021516 | 0.0032 | 7.6446 | 0.6314 | 4 | 21 | dorsal spinal cord development |
| GO:0048485 | 0.0032 | 7.6446 | 0.6314 | 4 | 21 | sympathetic nervous system development |
| GO:0001838 | 0.0032 | 3.22 | 3.0155 | 9 | 101 | embryonic epithelial tube formation |
| GO:0021543 | 0.0033 | 2.6563 | 4.8108 | 12 | 160 | pallium development |
| GO:0048644 | 0.0035 | 3.4816 | 2.4956 | 8 | 83 | muscle organ morphogenesis |
| GO:0046483 | 0.0035 | 1.2954 | 171.2059 | 200 | 5694 | heterocycle metabolic process |
| GO:0043583 | 0.0035 | 2.4176 | 6.1338 | 14 | 204 | ear development |
| GO:0032526 | 0.0036 | 3.1616 | 3.0669 | 9 | 102 | response to retinoic acid |
| GO:0042063 | 0.0036 | 2.2563 | 7.4869 | 16 | 249 | gliogenesis |
| GO:0045823 | 0.0037 | 5.4217 | 1.0524 | 5 | 35 | positive regulation of heart contraction |
| GO:0003157 | 0.0037 | 12.1655 | 0.3307 | 3 | 11 | endocardium development |
| GO:0007512 | 0.0037 | 12.1655 | 0.3307 | 3 | 11 | adult heart development |
| GO:0021521 | 0.0037 | 12.1655 | 0.3307 | 3 | 11 | ventral spinal cord interneuron specification |
| GO:0003272 | 0.0038 | 7.2195 | 0.6615 | 4 | 22 | endocardial cushion formation |
| GO:0051962 | 0.0039 | 1.963 | 11.7781 | 22 | 396 | positive regulation of nervous system development |
| GO:0060420 | 0.0039 | 3.8037 | 2.0145 | 7 | 67 | regulation of heart growth |
| GO:0051173 | 0.0039 | 1.3619 | 84.9715 | 108 | 2826 | positive regulation of nitrogen compound metabolic process |
| GO:0071542 | 0.0042 | 5.2464 | 1.0824 | 5 | 36 | dopaminergic neuron differentiation |
| GO:0010720 | 0.0042 | 1.8604 | 14.1018 | 25 | 469 | positive regulation of cell development |
| GO:0014032 | 0.0044 | 6.9113 | 0.6846 | 4 | 23 | neural crest cell development |
| GO:0002009 | 0.0045 | 2.548 | 4.9916 | 12 | 176 | morphogenesis of an epithelium |
| GO:0001704 | 0.0045 | 2.8428 | 3.7585 | 10 | 125 | formation of primary germ layer |
| GO:1903670 | 0.0045 | 4.2475 | 1.5635 | 6 | 52 | regulation of sprouting angiogenesis |
| GO:0010226 | 0.0045 | 6.8391 | 0.6916 | 4 | 23 | response to lithium ion |
| GO:0048103 | 0.0045 | 6.8391 | 0.6916 | 4 | 23 | somatic stem cell division |
| GO:0007623 | 0.0046 | 2.4345 | 5.6527 | 13 | 188 | circadian rhythm |
| GO:0046632 | 0.0046 | 3.3044 | 2.6159 | 8 | 87 | alpha-beta T cell differentiation |
| GO:0055017 | 0.0046 | 3.3044 | 2.6159 | 8 | 87 | cardiac muscle tissue growth |
| GO:0030334 | 0.0047 | 1.6677 | 22.0096 | 35 | 732 | regulation of cell migration |
| GO:0002042 | 0.0047 | 5.0822 | 1.1125 | 5 | 37 | cell migration involved in sprouting angiogenesis |
| GO:0003214 | 0.0048 | 10.8578 | 0.3594 | 3 | 12 | cardiac left ventricle morphogenesis |
| GO:0010454 | 0.0049 | 10.8131 | 0.3608 | 3 | 12 | negative regulation of cell fate commitment |
| GO:0033605 | 0.0049 | 10.8131 | 0.3608 | 3 | 12 | positive regulation of catecholamine secretion |
| GO:0042659 | 0.0049 | 10.8131 | 0.3608 | 3 | 12 | regulation of cell fate specification |
| GO:2000095 | 0.0049 | 10.8131 | 0.3608 | 3 | 12 | regulation of Wnt signaling pathway, planar cell polarity pathway |
| GO:0014902 | 0.0049 | 2.9994 | 3.2173 | 9 | 107 | myotube differentiation |
| GO:0007422 | 0.005 | 3.6219 | 2.1047 | 7 | 70 | peripheral nervous system development |
| GO:0030512 | 0.005 | 3.6219 | 2.1047 | 7 | 70 | negative regulation of transforming growth factor beta receptor signaling pathway |
| GO:0030879 | 0.005 | 2.7939 | 3.8186 | 10 | 127 | mammary gland development |
| GO:0021953 | 0.0052 | 3.2338 | 2.664 | 8 | 91 | central nervous system neuron differentiation |
| GO:0003219 | 0.0052 | 32.3868 | 0.1203 | 2 | 4 | cardiac right ventricle formation |
| GO:0003308 | 0.0052 | 32.3868 | 0.1203 | 2 | 4 | negative regulation of Wnt signaling pathway involved in heart development |
| GO:0003415 | 0.0052 | 32.3868 | 0.1203 | 2 | 4 | chondrocyte hypertrophy |
| GO:0007621 | 0.0052 | 32.3868 | 0.1203 | 2 | 4 | negative regulation of female receptivity |
| GO:0021555 | 0.0052 | 32.3868 | 0.1203 | 2 | 4 | midbrain-hindbrain boundary morphogenesis |
| GO:0021797 | 0.0052 | 32.3868 | 0.1203 | 2 | 4 | forebrain anterior/posterior pattern specification |
| GO:0032100 | 0.0052 | 32.3868 | 0.1203 | 2 | 4 | positive regulation of appetite |
| GO:0034287 | 0.0052 | 32.3868 | 0.1203 | 2 | 4 | detection of monosaccharide stimulus |
| GO:0043553 | 0.0052 | 32.3868 | 0.1203 | 2 | 4 | negative regulation of phosphatidylinositol 3-kinase activity |
| GO:0048866 | 0.0052 | 32.3868 | 0.1203 | 2 | 4 | stem cell fate specification |
| GO:0051414 | 0.0052 | 32.3868 | 0.1203 | 2 | 4 | response to cortisol |
| GO:0051464 | 0.0052 | 32.3868 | 0.1203 | 2 | 4 | positive regulation of cortisol secretion |
| GO:0051594 | 0.0052 | 32.3868 | 0.1203 | 2 | 4 | detection of glucose |
| GO:0060164 | 0.0052 | 32.3868 | 0.1203 | 2 | 4 | regulation of timing of neuron differentiation |
| GO:0072086 | 0.0052 | 32.3868 | 0.1203 | 2 | 4 | specification of loop of Henle identity |
| GO:0090244 | 0.0052 | 32.3868 | 0.1203 | 2 | 4 | Wnt signaling pathway involved in somitogenesis |
| GO:1990086 | 0.0052 | 32.3868 | 0.1203 | 2 | 4 | lens fiber cell apoptotic process |
| GO:0003171 | 0.0053 | 6.4967 | 0.7216 | 4 | 24 | atrioventricular valve development |
| GO:0030878 | 0.0053 | 6.4967 | 0.7216 | 4 | 24 | thyroid gland development |
| GO:0032673 | 0.0053 | 6.4967 | 0.7216 | 4 | 24 | regulation of interleukin-4 production |
| GO:0048520 | 0.0053 | 6.4967 | 0.7216 | 4 | 24 | positive regulation of behavior |
| GO:0060487 | 0.0053 | 6.4967 | 0.7216 | 4 | 24 | lung epithelial cell differentiation |
| GO:0007618 | 0.0053 | 4.9278 | 1.1426 | 5 | 38 | mating |
| GO:0060412 | 0.0053 | 4.9278 | 1.1426 | 5 | 38 | ventricular septum morphogenesis |
| GO:2000648 | 0.0053 | 4.9278 | 1.1426 | 5 | 38 | positive regulation of stem cell proliferation |
| GO:0034645 | 0.0053 | 1.3374 | 98.2506 | 121 | 3458 | cellular macromolecule biosynthetic process |
| GO:0072088 | 0.0054 | 3.565 | 2.1348 | 7 | 71 | nephron epithelium morphogenesis |
| GO:1901360 | 0.0054 | 1.275 | 178.6026 | 206 | 5940 | organic cyclic compound metabolic process |
| GO:0045667 | 0.0056 | 2.939 | 3.2774 | 9 | 109 | regulation of osteoblast differentiation |
| GO:0060541 | 0.0057 | 6.337 | 0.7346 | 4 | 25 | respiratory system development |
| GO:0035710 | 0.0058 | 3.51 | 2.1649 | 7 | 72 | CD4-positive, alpha-beta T cell activation |
| GO:0008584 | 0.0059 | 2.7235 | 3.9088 | 10 | 130 | male gonad development |
| GO:0021879 | 0.0059 | 9.8767 | 0.3853 | 3 | 13 | forebrain neuron differentiation |
| GO:0035136 | 0.006 | 4.7826 | 1.1726 | 5 | 39 | forelimb morphogenesis |
| GO:0021520 | 0.0062 | 9.7311 | 0.3909 | 3 | 13 | spinal cord motor neuron cell fate specification |
| GO:0021781 | 0.0062 | 9.7311 | 0.3909 | 3 | 13 | glial cell fate commitment |
| GO:0040034 | 0.0062 | 9.7311 | 0.3909 | 3 | 13 | regulation of development, heterochronic |
| GO:0060123 | 0.0062 | 9.7311 | 0.3909 | 3 | 13 | regulation of growth hormone secretion |
| GO:2000647 | 0.0062 | 9.7311 | 0.3909 | 3 | 13 | negative regulation of stem cell proliferation |
| GO:0061037 | 0.0062 | 6.1869 | 0.7517 | 4 | 25 | negative regulation of cartilage development |
| GO:0043627 | 0.0063 | 3.4566 | 2.1949 | 7 | 73 | response to estrogen |
| GO:0051270 | 0.0068 | 1.5806 | 25.8282 | 39 | 859 | regulation of cellular component movement |
| GO:0010558 | 0.0069 | 3.8471 | 1.7018 | 6 | 60 | negative regulation of macromolecule biosynthetic process |
| GO:0021517 | 0.007 | 5.9496 | 0.7762 | 4 | 26 | ventral spinal cord development |
| GO:0007368 | 0.007 | 2.8252 | 3.3977 | 9 | 113 | determination of left/right symmetry |
| GO:0019932 | 0.0071 | 2.0376 | 8.7497 | 17 | 291 | second-messenger-mediated signaling |
| GO:0022603 | 0.0072 | 1.6418 | 21.0302 | 33 | 717 | regulation of anatomical structure morphogenesis |
| GO:0016202 | 0.0073 | 2.635 | 4.0291 | 10 | 134 | regulation of striated muscle tissue development |
| GO:0071495 | 0.0076 | 1.5138 | 31.8475 | 46 | 1073 | cellular response to endogenous stimulus |
| GO:0007155 | 0.0077 | 1.7458 | 15.5825 | 26 | 535 | cell adhesion |
| GO:0032736 | 0.0077 | 8.8459 | 0.4209 | 3 | 14 | positive regulation of interleukin-13 production |
| GO:0042487 | 0.0077 | 8.8459 | 0.4209 | 3 | 14 | regulation of odontogenesis of dentin-containing tooth |
| GO:2000846 | 0.0077 | 8.8459 | 0.4209 | 3 | 14 | regulation of corticosteroid hormone secretion |
| GO:0045927 | 0.0078 | 3.3023 | 2.2858 | 7 | 77 | positive regulation of growth |
| GO:0043009 | 0.0078 | 1.9721 | 9.5568 | 18 | 332 | chordate embryonic development |
| GO:0001754 | 0.0082 | 4.394 | 1.2628 | 5 | 42 | eye photoreceptor cell differentiation |
| GO:0070849 | 0.0082 | 4.394 | 1.2628 | 5 | 42 | response to epidermal growth factor |
| GO:0061564 | 0.0083 | 1.8 | 13.3501 | 23 | 444 | axon development |
| GO:0022612 | 0.0083 | 2.7455 | 3.4879 | 9 | 116 | gland morphogenesis |
| GO:0003211 | 0.0084 | 21.7212 | 0.1495 | 2 | 5 | cardiac ventricle formation |
| GO:0002118 | 0.0084 | 21.6777 | 0.1498 | 2 | 5 | aggressive behavior |
| GO:0002568 | 0.0085 | 21.5898 | 0.1503 | 2 | 5 | somatic diversification of T cell receptor genes |
| GO:0021778 | 0.0085 | 21.5898 | 0.1503 | 2 | 5 | oligodendrocyte cell fate specification |
| GO:0033153 | 0.0085 | 21.5898 | 0.1503 | 2 | 5 | T cell receptor V(D)J recombination |
| GO:0045409 | 0.0085 | 21.5898 | 0.1503 | 2 | 5 | negative regulation of interleukin-6 biosynthetic process |
| GO:0045636 | 0.0085 | 21.5898 | 0.1503 | 2 | 5 | positive regulation of melanocyte differentiation |
| GO:0070100 | 0.0085 | 21.5898 | 0.1503 | 2 | 5 | negative regulation of chemokine-mediated signaling pathway |
| GO:0071504 | 0.0085 | 21.5898 | 0.1503 | 2 | 5 | cellular response to heparin |
| GO:1902744 | 0.0085 | 21.5898 | 0.1503 | 2 | 5 | negative regulation of lamellipodium organization |
| GO:1903232 | 0.0085 | 21.5898 | 0.1503 | 2 | 5 | melanosome assembly |
| GO:1904304 | 0.0085 | 21.5898 | 0.1503 | 2 | 5 | regulation of gastro-intestinal system smooth muscle contraction |
| GO:1904956 | 0.0085 | 21.5898 | 0.1503 | 2 | 5 | regulation of midbrain dopaminergic neuron differentiation |
| GO:1905007 | 0.0085 | 21.5898 | 0.1503 | 2 | 5 | positive regulation of epithelial to mesenchymal transition involved in endocardial cushion formation |
| GO:0035108 | 0.0087 | 8.3608 | 0.4379 | 3 | 15 | limb morphogenesis |
| GO:0071773 | 0.0087 | 2.4298 | 4.7808 | 11 | 159 | cellular response to BMP stimulus |
| GO:0010810 | 0.0087 | 2.3231 | 5.4423 | 12 | 181 | regulation of cell-substrate adhesion |
| GO:0045598 | 0.0088 | 2.7199 | 3.5179 | 9 | 117 | regulation of fat cell differentiation |
| GO:0048869 | 0.009 | 1.4004 | 53.1954 | 70 | 1954 | cellular developmental process |
| GO:0014706 | 0.0092 | 2.6989 | 3.5401 | 9 | 121 | striated muscle tissue development |
| GO:2000027 | 0.0092 | 2.2176 | 6.16 | 13 | 207 | regulation of organ morphogenesis |
| GO:0072089 | 0.0093 | 3.6005 | 1.8098 | 6 | 61 | stem cell proliferation |
| GO:0002053 | 0.0093 | 5.4125 | 0.8419 | 4 | 28 | positive regulation of mesenchymal cell proliferation |
| GO:0007274 | 0.0093 | 5.4125 | 0.8419 | 4 | 28 | neuromuscular synaptic transmission |
| GO:0010837 | 0.0093 | 5.4125 | 0.8419 | 4 | 28 | regulation of keratinocyte proliferation |
| GO:0002830 | 0.0094 | 8.1082 | 0.451 | 3 | 15 | positive regulation of type 2 immune response |
| GO:0007379 | 0.0094 | 8.1082 | 0.451 | 3 | 15 | segment specification |
| GO:0021542 | 0.0094 | 8.1082 | 0.451 | 3 | 15 | dentate gyrus development |
| GO:0048521 | 0.0094 | 8.1082 | 0.451 | 3 | 15 | negative regulation of behavior |
| GO:0034641 | 0.0096 | 1.2488 | 189.5172 | 215 | 6303 | cellular nitrogen compound metabolic process |
| GO:0040017 | 0.0097 | 1.7497 | 14.3123 | 24 | 476 | positive regulation of locomotion |
| GO:0048639 | 0.0099 | 2.3811 | 4.871 | 11 | 162 | positive regulation of developmental growth |
| GO:0048066 | 0.01 | 4.1681 | 1.323 | 5 | 44 | developmental pigmentation |
| GO:0031324 | 0.01 | 1.3254 | 77.5448 | 97 | 2579 | negative regulation of cellular metabolic process |
| GOMFID | Pvalue | OddsRatio | ExpCount | Count | Size | Term |
| GO:0009593 | 0 | 6.3711 | 2.9601 | 16 | 449 | detection of chemical stimulus |
| GO:0050906 | 0 | 6.1945 | 3.0392 | 16 | 461 | detection of stimulus involved in sensory perception |
| GO:0007606 | 0 | 6.1098 | 3.0788 | 16 | 467 | sensory perception of chemical stimulus |
| GO:0050911 | 0 | 6.1076 | 2.4393 | 13 | 370 | detection of chemical stimulus involved in sensory perception of smell |
| GO:0007186 | 0 | 3.1339 | 8.2541 | 22 | 1252 | G-protein coupled receptor signaling pathway |
| GO:0006968 | 0 | 16.0804 | 0.356 | 5 | 54 | cellular defense response |
| GO:0010623 | 1e-04 | 46.4798 | 0.0857 | 3 | 13 | programmed cell death involved in cell development |
| GO:0050877 | 1e-04 | 2.8848 | 7.9772 | 20 | 1210 | nervous system process |
| GO:0032649 | 3e-04 | 9.4732 | 0.5802 | 5 | 88 | regulation of interferon-gamma production |
| GO:0072676 | 3e-04 | 9.2491 | 0.5933 | 5 | 90 | lymphocyte migration |
| GO:0006688 | 4e-04 | 23.2255 | 0.1516 | 3 | 23 | glycosphingolipid biosynthetic process |
| GO:0006955 | 6e-04 | 2.3367 | 11.8947 | 24 | 1837 | immune response |
| GO:0046649 | 7e-04 | 3.268 | 4.0348 | 12 | 612 | lymphocyte activation |
| GO:0031424 | 7e-04 | 5.0835 | 1.49 | 7 | 226 | keratinization |
| GO:0050707 | 8e-04 | 5.9269 | 1.0944 | 6 | 166 | regulation of cytokine secretion |
| GO:0051047 | 9e-04 | 3.9427 | 2.4789 | 9 | 376 | positive regulation of secretion |
| GO:2000404 | 0.0011 | 16.5814 | 0.2044 | 3 | 31 | regulation of T cell migration |
| GO:1902715 | 0.0012 | 51.1651 | 0.0527 | 2 | 8 | positive regulation of interferon-gamma secretion |
| GO:1905522 | 0.0012 | 51.1651 | 0.0527 | 2 | 8 | negative regulation of macrophage migration |
| GO:0055065 | 0.0012 | 3.2201 | 3.7249 | 11 | 565 | metal ion homeostasis |
| GO:0043588 | 0.0015 | 3.6191 | 2.6898 | 9 | 408 | skin development |
| GO:0001775 | 0.0015 | 2.4085 | 8.353 | 18 | 1267 | cell activation |
| GO:0070374 | 0.0018 | 5.0353 | 1.279 | 6 | 194 | positive regulation of ERK1 and ERK2 cascade |
| GO:0010820 | 0.0019 | 38.369 | 0.0659 | 2 | 10 | positive regulation of T cell chemotaxis |
| GO:0070098 | 0.0019 | 8.1998 | 0.5274 | 4 | 80 | chemokine-mediated signaling pathway |
| GO:0030595 | 0.002 | 4.9033 | 1.312 | 6 | 199 | leukocyte chemotaxis |
| GO:0009913 | 0.0022 | 3.7399 | 2.3009 | 8 | 349 | epidermal cell differentiation |
| GO:0072507 | 0.0025 | 3.3516 | 2.8942 | 9 | 439 | divalent inorganic cation homeostasis |
| GO:0019835 | 0.0027 | 11.8964 | 0.2769 | 3 | 42 | cytolysis |
| GO:0032309 | 0.0027 | 11.8964 | 0.2769 | 3 | 42 | icosanoid secretion |
| GO:0002685 | 0.003 | 11.4029 | 0.2877 | 3 | 45 | regulation of leukocyte migration |
| GO:1901571 | 0.0032 | 11.0446 | 0.2967 | 3 | 45 | fatty acid derivative transport |
| GO:0002418 | 0.0037 | 25.573 | 0.0923 | 2 | 14 | immune response to tumor cell |
| GO:2001237 | 0.0042 | 6.5521 | 0.6527 | 4 | 99 | negative regulation of extrinsic apoptotic signaling pathway |
| GO:0050714 | 0.0042 | 4.2165 | 1.5163 | 6 | 230 | positive regulation of protein secretion |
| GO:2000484 | 0.0043 | 23.6044 | 0.0989 | 2 | 15 | positive regulation of interleukin-8 secretion |
| GO:0001819 | 0.0045 | 3.2945 | 2.5975 | 8 | 394 | positive regulation of cytokine production |
| GO:0006874 | 0.0047 | 3.2771 | 2.6107 | 8 | 396 | cellular calcium ion homeostasis |
| GO:0002699 | 0.0051 | 4.7997 | 1.1076 | 5 | 168 | positive regulation of immune effector process |
| GO:0052695 | 0.0055 | 20.4546 | 0.1121 | 2 | 17 | cellular glucuronidation |
| GO:0032370 | 0.0057 | 8.9151 | 0.3626 | 3 | 55 | positive regulation of lipid transport |
| GO:0006873 | 0.0058 | 2.748 | 3.9095 | 10 | 593 | cellular ion homeostasis |
| GO:0090026 | 0.0061 | 19.175 | 0.1187 | 2 | 18 | positive regulation of monocyte chemotaxis |
| GO:0097529 | 0.0062 | 4.5729 | 1.1603 | 5 | 176 | myeloid leukocyte migration |
| GO:0050920 | 0.0063 | 4.546 | 1.1669 | 5 | 177 | regulation of chemotaxis |
| GO:0002355 | 0.0066 | Inf | 0.0066 | 1 | 1 | detection of tumor cell |
| GO:0002642 | 0.0066 | Inf | 0.0066 | 1 | 1 | positive regulation of immunoglobulin biosynthetic process |
| GO:0030887 | 0.0066 | Inf | 0.0066 | 1 | 1 | positive regulation of myeloid dendritic cell activation |
| GO:0032078 | 0.0066 | Inf | 0.0066 | 1 | 1 | negative regulation of endodeoxyribonuclease activity |
| GO:0035705 | 0.0066 | Inf | 0.0066 | 1 | 1 | T-helper 17 cell chemotaxis |
| GO:0043143 | 0.0066 | Inf | 0.0066 | 1 | 1 | regulation of translation by machinery localization |
| GO:0043310 | 0.0066 | Inf | 0.0066 | 1 | 1 | negative regulation of eosinophil degranulation |
| GO:1900758 | 0.0066 | Inf | 0.0066 | 1 | 1 | negative regulation of D-amino-acid oxidase activity |
| GO:1901706 | 0.0066 | Inf | 0.0066 | 1 | 1 | mesenchymal cell differentiation involved in bone development |
| GO:1902225 | 0.0066 | Inf | 0.0066 | 1 | 1 | negative regulation of acrosome reaction |
| GO:1903615 | 0.0066 | Inf | 0.0066 | 1 | 1 | positive regulation of protein tyrosine phosphatase activity |
| GO:1904155 | 0.0066 | Inf | 0.0066 | 1 | 1 | DN2 thymocyte differentiation |
| GO:1904156 | 0.0066 | Inf | 0.0066 | 1 | 1 | DN3 thymocyte differentiation |
| GO:2000464 | 0.0066 | Inf | 0.0066 | 1 | 1 | positive regulation of astrocyte chemotaxis |
| GO:0046641 | 0.0068 | 18.0459 | 0.1253 | 2 | 19 | positive regulation of alpha-beta T cell proliferation |
| GO:0048878 | 0.008 | 2.2267 | 6.8235 | 14 | 1035 | chemical homeostasis |
| GO:0015711 | 0.008 | 2.9776 | 2.8612 | 8 | 434 | organic anion transport |
| GO:0002544 | 0.0083 | 16.1444 | 0.1384 | 2 | 21 | chronic inflammatory response |
| GO:0097503 | 0.0083 | 16.1444 | 0.1384 | 2 | 21 | sialylation |
| GO:1901623 | 0.0083 | 16.1444 | 0.1384 | 2 | 21 | regulation of lymphocyte chemotaxis |
| GO:0002687 | 0.0084 | 5.3128 | 0.7977 | 4 | 121 | positive regulation of leukocyte migration |
| GO:0002825 | 0.0091 | 15.3362 | 0.145 | 2 | 22 | regulation of T-helper 1 type immune response |
| GO:0006063 | 0.0091 | 15.3362 | 0.145 | 2 | 22 | uronic acid metabolic process |
| GO:0007204 | 0.0093 | 3.5414 | 1.7932 | 6 | 272 | positive regulation of cytosolic calcium ion concentration |
| GO:0070661 | 0.0097 | 3.5012 | 1.813 | 6 | 275 | leukocyte proliferation |
| GO:0070227 | 0.0098 | 7.2381 | 0.4417 | 3 | 67 | lymphocyte apoptotic process |
| GOMFID | Pvalue | OddsRatio | ExpCount | Count | Size | Term |
| GO:0007156 | 0 | 8.456 | 3.8304 | 26 | 152 | homophilic cell adhesion via plasma membrane adhesion molecules |
| GO:0007389 | 0 | 4.1993 | 9.8652 | 36 | 394 | pattern specification process |
| GO:0045944 | 0 | 2.5759 | 26.9391 | 61 | 1069 | positive regulation of transcription from RNA polymerase II promoter |
| GO:0060173 | 0 | 5.0557 | 4.284 | 19 | 170 | limb development |
| GO:2001141 | 0 | 1.8021 | 87.4701 | 133 | 3471 | regulation of RNA biosynthetic process |
| GO:0000122 | 0 | 2.6196 | 19.1018 | 45 | 758 | negative regulation of transcription from RNA polymerase II promoter |
| GO:0006355 | 0 | 1.7998 | 86.7896 | 132 | 3444 | regulation of transcription, DNA-templated |
| GO:0019219 | 0 | 1.712 | 101.305 | 146 | 4020 | regulation of nucleobase-containing compound metabolic process |
| GO:0007399 | 0 | 2.4935 | 19.6972 | 44 | 869 | nervous system development |
| GO:0034654 | 0 | 1.6976 | 102.7414 | 147 | 4077 | nucleobase-containing compound biosynthetic process |
| GO:0021953 | 0 | 4.6241 | 4.1328 | 17 | 164 | central nervous system neuron differentiation |
| GO:1903508 | 0 | 2.022 | 34.5243 | 63 | 1370 | positive regulation of nucleic acid-templated transcription |
| GO:0051254 | 0 | 1.9836 | 36.3136 | 65 | 1441 | positive regulation of RNA metabolic process |
| GO:0098609 | 0 | 2.3389 | 19.6562 | 42 | 780 | cell-cell adhesion |
| GO:0010628 | 0 | 1.8888 | 44.2516 | 75 | 1756 | positive regulation of gene expression |
| GO:0021903 | 0 | 32.6217 | 0.2772 | 5 | 11 | rostrocaudal neural tube patterning |
| GO:0021515 | 0 | 8.453 | 1.2852 | 9 | 51 | cell differentiation in spinal cord |
| GO:0022610 | 0 | 1.9851 | 33.2895 | 60 | 1321 | biological adhesion |
| GO:0048665 | 0 | 16.9254 | 0.5007 | 6 | 20 | neuron fate specification |
| GO:0007267 | 0 | 1.8999 | 38.3296 | 66 | 1521 | cell-cell signaling |
| GO:0060562 | 0 | 3.1668 | 7.5853 | 22 | 301 | epithelial tube morphogenesis |
| GO:0021517 | 0 | 8.9981 | 1.0836 | 8 | 43 | ventral spinal cord development |
| GO:0048935 | 0 | 24.4632 | 0.3276 | 5 | 13 | peripheral nervous system neuron development |
| GO:0009952 | 0 | 3.9313 | 4.487 | 16 | 181 | anterior/posterior pattern specification |
| GO:0048729 | 0 | 2.3997 | 15.3722 | 34 | 610 | tissue morphogenesis |
| GO:0043009 | 0 | 2.8037 | 9.6811 | 25 | 392 | chordate embryonic development |
| GO:0048704 | 0 | 7.9711 | 1.1951 | 8 | 48 | embryonic skeletal system morphogenesis |
| GO:0010557 | 0 | 1.8246 | 40.3456 | 67 | 1601 | positive regulation of macromolecule biosynthetic process |
| GO:0060579 | 0 | 19.5681 | 0.378 | 5 | 15 | ventral spinal cord interneuron fate commitment |
| GO:2000026 | 0 | 1.7559 | 45.7384 | 73 | 1815 | regulation of multicellular organismal development |
| GO:0001764 | 0 | 4.2595 | 3.3768 | 13 | 134 | neuron migration |
| GO:1903507 | 0 | 1.931 | 28.6779 | 51 | 1138 | negative regulation of nucleic acid-templated transcription |
| GO:0051253 | 1e-04 | 1.8834 | 30.5427 | 53 | 1212 | negative regulation of RNA metabolic process |
| GO:0021555 | 1e-04 | 116.8966 | 0.1008 | 3 | 4 | midbrain-hindbrain boundary morphogenesis |
| GO:0060164 | 1e-04 | 116.8966 | 0.1008 | 3 | 4 | regulation of timing of neuron differentiation |
| GO:0045165 | 1e-04 | 3.367 | 5.1654 | 16 | 207 | cell fate commitment |
| GO:0045597 | 1e-04 | 2.0757 | 20.2596 | 39 | 813 | positive regulation of cell differentiation |
| GO:0010470 | 1e-04 | 7.8537 | 1.0584 | 7 | 42 | regulation of gastrulation |
| GO:0035107 | 1e-04 | 3.9018 | 3.654 | 13 | 145 | appendage morphogenesis |
| GO:0031328 | 1e-04 | 1.7231 | 43.7476 | 69 | 1736 | positive regulation of cellular biosynthetic process |
| GO:0007275 | 1e-04 | 1.631 | 65.7445 | 94 | 2950 | multicellular organism development |
| GO:0009890 | 1e-04 | 1.7258 | 41.656 | 66 | 1653 | negative regulation of biosynthetic process |
| GO:0009954 | 1e-04 | 9.407 | 0.7812 | 6 | 31 | proximal/distal pattern formation |
| GO:0021872 | 1e-04 | 6.1689 | 1.4868 | 8 | 59 | forebrain generation of neurons |
| GO:0060573 | 1e-04 | 22.3125 | 0.2772 | 4 | 11 | cell fate specification involved in pattern specification |
| GO:0072089 | 1e-04 | 4.3017 | 2.8224 | 11 | 112 | stem cell proliferation |
| GO:0051094 | 1e-04 | 2.9294 | 6.628 | 18 | 281 | positive regulation of developmental process |
| GO:0032502 | 2e-04 | 1.9648 | 24.3672 | 43 | 1160 | developmental process |
| GO:0060255 | 2e-04 | 1.439 | 147.245 | 182 | 5843 | regulation of macromolecule metabolic process |
| GO:0040034 | 2e-04 | 17.352 | 0.3276 | 4 | 13 | regulation of development, heterochronic |
| GO:0021511 | 3e-04 | 10.2931 | 0.6048 | 5 | 24 | spinal cord patterning |
| GO:0042536 | 3e-04 | 38.9606 | 0.1512 | 3 | 6 | negative regulation of tumor necrosis factor biosynthetic process |
| GO:0046483 | 3e-04 | 1.4249 | 143.4902 | 177 | 5694 | heterocycle metabolic process |
| GO:0003214 | 3e-04 | 15.6158 | 0.3528 | 4 | 14 | cardiac left ventricle morphogenesis |
| GO:2000113 | 3e-04 | 1.6912 | 37.624 | 59 | 1493 | negative regulation of cellular macromolecule biosynthetic process |
| GO:0003148 | 3e-04 | 9.7778 | 0.63 | 5 | 25 | outflow tract septum morphogenesis |
| GO:0048565 | 4e-04 | 3.7419 | 3.2004 | 11 | 127 | digestive tract development |
| GO:0006725 | 4e-04 | 1.4107 | 144.3974 | 177 | 5730 | cellular aromatic compound metabolic process |
| GO:0007420 | 5e-04 | 2.0277 | 16.2794 | 31 | 646 | brain development |
| GO:0001501 | 5e-04 | 3.1684 | 4.4152 | 13 | 179 | skeletal system development |
| GO:0003357 | 5e-04 | 29.2186 | 0.1764 | 3 | 7 | noradrenergic neuron differentiation |
| GO:0009653 | 5e-04 | 1.7969 | 26.3831 | 44 | 1159 | anatomical structure morphogenesis |
| GO:0021915 | 6e-04 | 3.3139 | 3.906 | 12 | 155 | neural tube development |
| GO:0048483 | 6e-04 | 6.5281 | 1.0584 | 6 | 42 | autonomic nervous system development |
| GO:0034641 | 6e-04 | 1.3918 | 158.8372 | 191 | 6303 | cellular nitrogen compound metabolic process |
| GO:0072272 | 6e-04 | Inf | 0.0504 | 2 | 2 | proximal/distal pattern formation involved in metanephric nephron development |
| GO:0120054 | 6e-04 | Inf | 0.0504 | 2 | 2 | intestinal motility |
| GO:0120058 | 6e-04 | Inf | 0.0504 | 2 | 2 | positive regulation of small intestinal transit |
| GO:0009953 | 7e-04 | 4.1167 | 2.394 | 9 | 95 | dorsal/ventral pattern formation |
| GO:1901360 | 8e-04 | 1.387 | 149.6895 | 181 | 5940 | organic cyclic compound metabolic process |
| GO:0048701 | 8e-04 | 6.1838 | 1.1088 | 6 | 44 | embryonic cranial skeleton morphogenesis |
| GO:2000035 | 8e-04 | 23.3734 | 0.2016 | 3 | 8 | regulation of stem cell division |
| GO:0051240 | 8e-04 | 1.775 | 25.2584 | 42 | 1027 | positive regulation of multicellular organismal process |
| GO:0090304 | 9e-04 | 1.3942 | 123.4812 | 153 | 4900 | nucleic acid metabolic process |
| GO:0001569 | 0.001 | 7.5186 | 0.7812 | 5 | 31 | branching involved in blood vessel morphogenesis |
| GO:0003206 | 0.001 | 3.5153 | 3.0744 | 10 | 122 | cardiac chamber morphogenesis |
| GO:1902742 | 0.0011 | 7.2396 | 0.8064 | 5 | 32 | apoptotic process involved in development |
| GO:0035024 | 0.0011 | 10.4072 | 0.4788 | 4 | 19 | negative regulation of Rho protein signal transduction |
| GO:0048557 | 0.0011 | 10.4072 | 0.4788 | 4 | 19 | embryonic digestive tract morphogenesis |
| GO:0051093 | 0.0012 | 1.801 | 21.7982 | 37 | 865 | negative regulation of developmental process |
| GO:0042127 | 0.0012 | 1.5953 | 39.5896 | 59 | 1571 | regulation of cell proliferation |
| GO:0009889 | 0.0013 | 1.4924 | 63.3669 | 86 | 2693 | regulation of biosynthetic process |
| GO:0021854 | 0.0014 | 9.7562 | 0.504 | 4 | 20 | hypothalamus development |
| GO:0060039 | 0.0014 | 9.7562 | 0.504 | 4 | 20 | pericardium development |
| GO:2000178 | 0.0014 | 9.7562 | 0.504 | 4 | 20 | negative regulation of neural precursor cell proliferation |
| GO:0061138 | 0.0016 | 2.9036 | 4.41 | 12 | 175 | morphogenesis of a branching epithelium |
| GO:0003211 | 0.0017 | 16.6932 | 0.252 | 3 | 10 | cardiac ventricle formation |
| GO:0043586 | 0.0017 | 9.1817 | 0.5292 | 4 | 21 | tongue development |
| GO:0007409 | 0.0017 | 2.1528 | 10.3069 | 21 | 409 | axonogenesis |
| GO:0014706 | 0.0017 | 2.2452 | 8.9461 | 19 | 355 | striated muscle tissue development |
| GO:0048598 | 0.0018 | 2.4357 | 6.9567 | 16 | 292 | embryonic morphogenesis |
| GO:0048732 | 0.0018 | 2.1415 | 10.3573 | 21 | 411 | gland development |
| GO:0014016 | 0.0019 | 77.7396 | 0.0756 | 2 | 3 | neuroblast differentiation |
| GO:0014707 | 0.0019 | 77.7396 | 0.0756 | 2 | 3 | branchiomeric skeletal muscle development |
| GO:0021524 | 0.0019 | 77.7396 | 0.0756 | 2 | 3 | visceral motor neuron differentiation |
| GO:0045085 | 0.0019 | 77.7396 | 0.0756 | 2 | 3 | negative regulation of interleukin-2 biosynthetic process |
| GO:0046010 | 0.0019 | 77.7396 | 0.0756 | 2 | 3 | positive regulation of circadian sleep/wake cycle, non-REM sleep |
| GO:0140076 | 0.0019 | 77.7396 | 0.0756 | 2 | 3 | negative regulation of lipoprotein transport |
| GO:1904000 | 0.0019 | 77.7396 | 0.0756 | 2 | 3 | positive regulation of eating behavior |
| GO:1904349 | 0.0019 | 77.7396 | 0.0756 | 2 | 3 | positive regulation of small intestine smooth muscle contraction |
| GO:1905333 | 0.0019 | 77.7396 | 0.0756 | 2 | 3 | regulation of gastric motility |
| GO:0007268 | 0.0019 | 1.9333 | 14.7421 | 27 | 585 | chemical synaptic transmission |
| GO:0003179 | 0.002 | 6.3039 | 0.9072 | 5 | 36 | heart valve morphogenesis |
| GO:0051216 | 0.002 | 2.8333 | 4.5108 | 12 | 179 | cartilage development |
| GO:0060348 | 0.002 | 2.8333 | 4.5108 | 12 | 179 | bone development |
| GO:0099537 | 0.002 | 1.9262 | 14.7925 | 27 | 587 | trans-synaptic signaling |
| GO:0003272 | 0.002 | 8.6711 | 0.5544 | 4 | 22 | endocardial cushion formation |
| GO:0060021 | 0.0021 | 3.7828 | 2.2932 | 8 | 91 | palate development |
| GO:0031324 | 0.0022 | 1.4451 | 64.9914 | 87 | 2579 | negative regulation of cellular metabolic process |
| GO:0072073 | 0.0022 | 3.1471 | 3.402 | 10 | 135 | kidney epithelium development |
| GO:0048870 | 0.0024 | 1.5767 | 35.7339 | 53 | 1418 | cell motility |
| GO:0007610 | 0.0024 | 1.9486 | 13.5208 | 25 | 540 | behavior |
| GO:0060538 | 0.0025 | 2.907 | 4.032 | 11 | 160 | skeletal muscle organ development |
| GO:0060079 | 0.0026 | 3.6502 | 2.3688 | 8 | 94 | excitatory postsynaptic potential |
| GO:0048514 | 0.0026 | 1.9388 | 13.5829 | 25 | 539 | blood vessel morphogenesis |
| GO:0048762 | 0.0026 | 3.3103 | 2.9174 | 9 | 117 | mesenchymal cell differentiation |
| GO:0003197 | 0.0028 | 5.7466 | 0.9828 | 5 | 39 | endocardial cushion development |
| GO:0042659 | 0.003 | 12.9819 | 0.3024 | 3 | 12 | regulation of cell fate specification |
| GO:0010629 | 0.0031 | 1.4943 | 46.3937 | 65 | 1841 | negative regulation of gene expression |
| GO:0001709 | 0.0032 | 5.582 | 1.008 | 5 | 40 | cell fate determination |
| GO:0003231 | 0.0032 | 3.2136 | 2.9988 | 9 | 119 | cardiac ventricle development |
| GO:0051173 | 0.0032 | 1.4094 | 71.2159 | 93 | 2826 | positive regulation of nitrogen compound metabolic process |
| GO:0048596 | 0.0033 | 7.4309 | 0.63 | 4 | 25 | embryonic camera-type eye morphogenesis |
| GO:0045669 | 0.0033 | 4.5149 | 1.4616 | 6 | 58 | positive regulation of osteoblast differentiation |
| GO:0003279 | 0.0033 | 3.4871 | 2.4696 | 8 | 98 | cardiac septum development |
| GO:0001838 | 0.0034 | 3.1845 | 3.024 | 9 | 120 | embryonic epithelial tube formation |
| GO:0048699 | 0.0035 | 1.8922 | 13.9175 | 25 | 579 | generation of neurons |
| GO:0021797 | 0.0037 | 38.8673 | 0.1008 | 2 | 4 | forebrain anterior/posterior pattern specification |
| GO:0021913 | 0.0037 | 38.8673 | 0.1008 | 2 | 4 | regulation of transcription from RNA polymerase II promoter involved in ventral spinal cord interneuron specification |
| GO:0032100 | 0.0037 | 38.8673 | 0.1008 | 2 | 4 | positive regulation of appetite |
| GO:0034287 | 0.0037 | 38.8673 | 0.1008 | 2 | 4 | detection of monosaccharide stimulus |
| GO:0042662 | 0.0037 | 38.8673 | 0.1008 | 2 | 4 | negative regulation of mesodermal cell fate specification |
| GO:0051594 | 0.0037 | 38.8673 | 0.1008 | 2 | 4 | detection of glucose |
| GO:0072086 | 0.0037 | 38.8673 | 0.1008 | 2 | 4 | specification of loop of Henle identity |
| GO:1905903 | 0.0037 | 38.8673 | 0.1008 | 2 | 4 | negative regulation of mesoderm formation |
| GO:1990086 | 0.0037 | 38.8673 | 0.1008 | 2 | 4 | lens fiber cell apoptotic process |
| GO:0051241 | 0.0037 | 1.6407 | 25.7234 | 40 | 1029 | negative regulation of multicellular organismal process |
| GO:0048562 | 0.0037 | 2.741 | 4.254 | 11 | 175 | embryonic organ morphogenesis |
| GO:0021520 | 0.0038 | 11.683 | 0.3276 | 3 | 13 | spinal cord motor neuron cell fate specification |
| GO:0002063 | 0.0038 | 7.0927 | 0.6552 | 4 | 26 | chondrocyte development |
| GO:0021884 | 0.0038 | 7.0927 | 0.6552 | 4 | 26 | forebrain neuron development |
| GO:1901576 | 0.0046 | 1.3093 | 154.0995 | 180 | 6115 | organic substance biosynthetic process |
| GO:0030889 | 0.0047 | 10.6202 | 0.3528 | 3 | 14 | negative regulation of B cell proliferation |
| GO:0051967 | 0.0047 | 10.6202 | 0.3528 | 3 | 14 | negative regulation of synaptic transmission, glutamatergic |
| GO:0030851 | 0.005 | 6.5008 | 0.7056 | 4 | 28 | granulocyte differentiation |
| GO:1902692 | 0.005 | 6.5008 | 0.7056 | 4 | 28 | regulation of neuroblast proliferation |
| GO:0001656 | 0.0053 | 3.5604 | 2.1168 | 7 | 84 | metanephros development |
| GO:0000902 | 0.0053 | 1.6565 | 22.2014 | 35 | 881 | cell morphogenesis |
| GO:0120039 | 0.0055 | 1.8179 | 14.4145 | 25 | 572 | plasma membrane bounded cell projection morphogenesis |
| GO:0048468 | 0.0056 | 1.4533 | 46.7635 | 64 | 1871 | cell development |
| GO:0051962 | 0.0057 | 1.9235 | 11.4409 | 21 | 454 | positive regulation of nervous system development |
| GO:0010719 | 0.0057 | 6.2404 | 0.7308 | 4 | 29 | negative regulation of epithelial to mesenchymal transition |
| GO:0007379 | 0.0058 | 9.7346 | 0.378 | 3 | 15 | segment specification |
| GO:0048521 | 0.0058 | 9.7346 | 0.378 | 3 | 15 | negative regulation of behavior |
| GO:1904019 | 0.0058 | 3.4867 | 2.1572 | 7 | 86 | epithelial cell apoptotic process |
| GO:0021778 | 0.006 | 25.9099 | 0.126 | 2 | 5 | oligodendrocyte cell fate specification |
| GO:0045347 | 0.006 | 25.9099 | 0.126 | 2 | 5 | negative regulation of MHC class II biosynthetic process |
| GO:0045409 | 0.006 | 25.9099 | 0.126 | 2 | 5 | negative regulation of interleukin-6 biosynthetic process |
| GO:0045636 | 0.006 | 25.9099 | 0.126 | 2 | 5 | positive regulation of melanocyte differentiation |
| GO:0061056 | 0.006 | 25.9099 | 0.126 | 2 | 5 | sclerotome development |
| GO:1904304 | 0.006 | 25.9099 | 0.126 | 2 | 5 | regulation of gastro-intestinal system smooth muscle contraction |
| GO:1905007 | 0.006 | 25.9099 | 0.126 | 2 | 5 | positive regulation of epithelial to mesenchymal transition involved in endocardial cushion formation |
| GO:2000851 | 0.006 | 25.9099 | 0.126 | 2 | 5 | positive regulation of glucocorticoid secretion |
| GO:0051172 | 0.0062 | 1.396 | 61.161 | 80 | 2427 | negative regulation of nitrogen compound metabolic process |
| GO:0010810 | 0.0063 | 2.5445 | 4.5612 | 11 | 181 | regulation of cell-substrate adhesion |
| GO:0007423 | 0.0063 | 1.8741 | 12.2932 | 22 | 492 | sensory organ development |
| GO:0050767 | 0.0064 | 1.7544 | 16.123 | 27 | 645 | regulation of neurogenesis |
| GO:0060993 | 0.0064 | 3.4262 | 2.1924 | 7 | 87 | kidney morphogenesis |
| GO:0048869 | 0.0064 | 1.4483 | 48.153 | 65 | 2046 | cellular developmental process |
| GO:0045666 | 0.0064 | 2.1135 | 7.9381 | 16 | 315 | positive regulation of neuron differentiation |
| GO:0014033 | 0.0073 | 3.7843 | 1.7136 | 6 | 68 | neural crest cell differentiation |
| GO:0003151 | 0.0073 | 4.4876 | 1.2216 | 5 | 49 | outflow tract morphogenesis |
| GO:0001953 | 0.0073 | 5.7774 | 0.7812 | 4 | 31 | negative regulation of cell-matrix adhesion |
| GO:0042462 | 0.0073 | 5.7774 | 0.7812 | 4 | 31 | eye photoreceptor cell development |
| GO:0043010 | 0.0074 | 2.1364 | 7.3585 | 15 | 292 | camera-type eye development |
| GO:0061326 | 0.0076 | 3.3017 | 2.268 | 7 | 90 | renal tubule development |
| GO:0045927 | 0.0078 | 2.2653 | 6.0229 | 13 | 239 | positive regulation of growth |
| GO:0072078 | 0.0078 | 3.724 | 1.7388 | 6 | 69 | nephron tubule morphogenesis |
| GO:0035115 | 0.0082 | 5.5707 | 0.8064 | 4 | 32 | embryonic forelimb morphogenesis |
| GO:0061178 | 0.0083 | 4.3388 | 1.26 | 5 | 50 | regulation of insulin secretion involved in cellular response to glucose stimulus |
| GO:0032990 | 0.0086 | 1.7483 | 14.9437 | 25 | 593 | cell part morphogenesis |
| GO:0007416 | 0.0087 | 2.7157 | 3.5028 | 9 | 139 | synapse assembly |
| GO:0003175 | 0.0089 | 19.4312 | 0.1512 | 2 | 6 | tricuspid valve development |
| GO:0008063 | 0.0089 | 19.4312 | 0.1512 | 2 | 6 | Toll signaling pathway |
| GO:0021546 | 0.0089 | 19.4312 | 0.1512 | 2 | 6 | rhombomere development |
| GO:0021902 | 0.0089 | 19.4312 | 0.1512 | 2 | 6 | commitment of neuronal cell to specific neuron type in forebrain |
| GO:0032109 | 0.0089 | 19.4312 | 0.1512 | 2 | 6 | positive regulation of response to nutrient levels |
| GO:0043152 | 0.0089 | 19.4312 | 0.1512 | 2 | 6 | induction of bacterial agglutination |
| GO:0051045 | 0.0089 | 19.4312 | 0.1512 | 2 | 6 | negative regulation of membrane protein ectodomain proteolysis |
| GO:0051136 | 0.0089 | 19.4312 | 0.1512 | 2 | 6 | regulation of NK T cell differentiation |
| GO:0060350 | 0.009 | 4.2442 | 1.2852 | 5 | 51 | endochondral bone morphogenesis |
| GO:0001662 | 0.0091 | 5.3783 | 0.8316 | 4 | 33 | behavioral fear response |
| GO:0045987 | 0.0091 | 5.3783 | 0.8316 | 4 | 33 | positive regulation of smooth muscle contraction |
| GO:0030326 | 0.0092 | 3.1751 | 2.3503 | 7 | 94 | embryonic limb morphogenesis |
| GO:0035148 | 0.0095 | 2.6743 | 3.5532 | 9 | 141 | tube formation |
| GO:0035050 | 0.0095 | 3.554 | 1.8144 | 6 | 72 | embryonic heart tube development |
| GO:0045598 | 0.0095 | 2.8757 | 2.9484 | 8 | 117 | regulation of fat cell differentiation |
| GO:1903670 | 0.0098 | 4.1537 | 1.3104 | 5 | 52 | regulation of sprouting angiogenesis |
| GO:0060008 | 0.0098 | 7.7862 | 0.4536 | 3 | 18 | Sertoli cell differentiation |
| GO:0060973 | 0.0098 | 7.7862 | 0.4536 | 3 | 18 | cell migration involved in heart development |
| GO:0007417 | 0.0099 | 2.4975 | 4.2115 | 10 | 176 | central nervous system development |
| GOMFID | Pvalue | OddsRatio | ExpCount | Count | Size | Term |
| GO:0007156 | 0 | 8.3406 | 4.4111 | 29 | 152 | homophilic cell adhesion via plasma membrane adhesion molecules |
| GO:0007389 | 0 | 4.6937 | 11.3717 | 45 | 394 | pattern specification process |
| GO:0009790 | 0 | 3.0751 | 27.0179 | 71 | 931 | embryo development |
| GO:0007399 | 0 | 3.4296 | 19.2163 | 56 | 763 | nervous system development |
| GO:0045944 | 0 | 2.6718 | 31.0227 | 72 | 1069 | positive regulation of transcription from RNA polymerase II promoter |
| GO:0007275 | 0 | 2.2511 | 64.0422 | 115 | 2579 | multicellular organism development |
| GO:0007267 | 0 | 2.558 | 31.382 | 70 | 1116 | cell-cell signaling |
| GO:0000122 | 0 | 2.7693 | 21.9974 | 54 | 758 | negative regulation of transcription from RNA polymerase II promoter |
| GO:0006355 | 0 | 1.8597 | 99.946 | 155 | 3444 | regulation of transcription, DNA-templated |
| GO:0021515 | 0 | 11.7429 | 1.48 | 13 | 51 | cell differentiation in spinal cord |
| GO:0021517 | 0 | 13.2642 | 1.2479 | 12 | 43 | ventral spinal cord development |
| GO:2001141 | 0 | 1.8406 | 100.7296 | 155 | 3471 | regulation of RNA biosynthetic process |
| GO:0007420 | 0 | 3.0727 | 14.5769 | 40 | 510 | brain development |
| GO:0032502 | 0 | 1.9332 | 81.7382 | 127 | 3413 | developmental process |
| GO:0035113 | 0 | 5.7583 | 3.6566 | 18 | 126 | embryonic appendage morphogenesis |
| GO:1903508 | 0 | 2.1154 | 39.7579 | 75 | 1370 | positive regulation of nucleic acid-templated transcription |
| GO:0019219 | 0 | 1.7139 | 116.6617 | 168 | 4020 | regulation of nucleobase-containing compound metabolic process |
| GO:0001764 | 0 | 5.3584 | 3.8887 | 18 | 134 | neuron migration |
| GO:0035108 | 0 | 5.9912 | 3.1299 | 16 | 109 | limb morphogenesis |
| GO:0021953 | 0 | 5.7846 | 3.2199 | 16 | 114 | central nervous system neuron differentiation |
| GO:0001501 | 0 | 2.8813 | 13.8137 | 36 | 476 | skeletal system development |
| GO:1903507 | 0 | 2.1501 | 33.0251 | 64 | 1138 | negative regulation of nucleic acid-templated transcription |
| GO:0090596 | 0 | 3.7406 | 7.168 | 24 | 247 | sensory organ morphogenesis |
| GO:0009952 | 0 | 5.4801 | 3.3739 | 16 | 119 | anterior/posterior pattern specification |
| GO:0051254 | 0 | 1.9956 | 41.8183 | 75 | 1441 | positive regulation of RNA metabolic process |
| GO:0010557 | 0 | 1.9456 | 46.4616 | 81 | 1601 | positive regulation of macromolecule biosynthetic process |
| GO:0048870 | 0 | 1.9992 | 41.1508 | 74 | 1418 | cell motility |
| GO:0007218 | 0 | 5.9295 | 2.7569 | 14 | 95 | neuropeptide signaling pathway |
| GO:0001654 | 0 | 3.1499 | 9.8089 | 28 | 338 | eye development |
| GO:0051253 | 0 | 2.0395 | 35.1726 | 65 | 1212 | negative regulation of RNA metabolic process |
| GO:0034654 | 0 | 1.6172 | 118.3159 | 164 | 4077 | nucleobase-containing compound biosynthetic process |
| GO:2000026 | 0 | 1.8396 | 52.6719 | 87 | 1815 | regulation of multicellular organismal development |
| GO:0031328 | 0 | 1.8535 | 50.3793 | 84 | 1736 | positive regulation of cellular biosynthetic process |
| GO:0045165 | 0 | 3.9808 | 5.3246 | 19 | 188 | cell fate commitment |
| GO:0051961 | 0 | 3.4062 | 7.4582 | 23 | 257 | negative regulation of nervous system development |
| GO:0060579 | 0 | 22.5806 | 0.4353 | 6 | 15 | ventral spinal cord interneuron fate commitment |
| GO:0035115 | 0 | 11.3283 | 0.9287 | 8 | 32 | embryonic forelimb morphogenesis |
| GO:0009953 | 0 | 5.4266 | 2.7569 | 13 | 95 | dorsal/ventral pattern formation |
| GO:0021511 | 0 | 13.9698 | 0.6965 | 7 | 24 | spinal cord patterning |
| GO:0050767 | 0 | 2.3483 | 18.5514 | 40 | 645 | regulation of neurogenesis |
| GO:0022610 | 0 | 1.9183 | 38.3359 | 67 | 1321 | biological adhesion |
| GO:0010721 | 0 | 3.1339 | 8.0386 | 23 | 277 | negative regulation of cell development |
| GO:0048699 | 0 | 2.4124 | 16.2612 | 36 | 600 | generation of neurons |
| GO:0007268 | 0 | 2.3664 | 16.9769 | 37 | 585 | chemical synaptic transmission |
| GO:0021889 | 0 | 28.1706 | 0.3192 | 5 | 11 | olfactory bulb interneuron differentiation |
| GO:0021903 | 0 | 28.1706 | 0.3192 | 5 | 11 | rostrocaudal neural tube patterning |
| GO:0060573 | 0 | 28.1706 | 0.3192 | 5 | 11 | cell fate specification involved in pattern specification |
| GO:0099537 | 0 | 2.3575 | 17.0349 | 37 | 587 | trans-synaptic signaling |
| GO:0007631 | 0 | 4.8337 | 3.0471 | 13 | 105 | feeding behavior |
| GO:0048665 | 0 | 14.6618 | 0.5747 | 6 | 20 | neuron fate specification |
| GO:0010628 | 0 | 1.7464 | 50.9597 | 81 | 1756 | positive regulation of gene expression |
| GO:0014706 | 0 | 2.7402 | 10.3022 | 26 | 355 | striated muscle tissue development |
| GO:0021988 | 0 | 10.3216 | 0.8706 | 7 | 30 | olfactory lobe development |
| GO:0007626 | 0 | 4.5395 | 3.217 | 13 | 112 | locomotory behavior |
| GO:0021524 | 0 | Inf | 0.0871 | 3 | 3 | visceral motor neuron differentiation |
| GO:0061364 | 0 | Inf | 0.0871 | 3 | 3 | apoptotic process involved in luteolysis |
| GO:0045665 | 0 | 3.4961 | 5.3397 | 17 | 184 | negative regulation of neuron differentiation |
| GO:0009888 | 0 | 1.7976 | 40.7056 | 67 | 1450 | tissue development |
| GO:2000113 | 0 | 1.7586 | 43.3274 | 70 | 1493 | negative regulation of cellular macromolecule biosynthetic process |
| GO:0060041 | 0 | 3.9265 | 3.9468 | 14 | 136 | retina development in camera-type eye |
| GO:0098609 | 0 | 2.0478 | 22.6359 | 43 | 780 | cell-cell adhesion |
| GO:0048593 | 0 | 4.9193 | 2.5296 | 11 | 88 | camera-type eye morphogenesis |
| GO:0048048 | 0 | 8.7902 | 0.9867 | 7 | 34 | embryonic eye morphogenesis |
| GO:0010720 | 0 | 2.374 | 13.6105 | 30 | 469 | positive regulation of cell development |
| GO:0043009 | 0 | 2.6649 | 9.7292 | 24 | 345 | chordate embryonic development |
| GO:0072001 | 1e-04 | 2.8717 | 7.9226 | 21 | 273 | renal system development |
| GO:0009890 | 1e-04 | 1.702 | 47.9706 | 75 | 1653 | negative regulation of biosynthetic process |
| GO:0051962 | 1e-04 | 2.3672 | 13.1752 | 29 | 454 | positive regulation of nervous system development |
| GO:0007411 | 1e-04 | 3.2298 | 5.7334 | 17 | 199 | axon guidance |
| GO:0003151 | 1e-04 | 6.6728 | 1.4121 | 8 | 49 | outflow tract morphogenesis |
| GO:0048754 | 1e-04 | 3.7118 | 4.1499 | 14 | 143 | branching morphogenesis of an epithelial tube |
| GO:0001709 | 1e-04 | 7.9434 | 1.0694 | 7 | 37 | cell fate determination |
| GO:0031076 | 1e-04 | 7.9097 | 1.0738 | 7 | 37 | embryonic camera-type eye development |
| GO:0021884 | 1e-04 | 10.1542 | 0.7545 | 6 | 26 | forebrain neuron development |
| GO:0016331 | 1e-04 | 3.6546 | 4.2079 | 14 | 145 | morphogenesis of embryonic epithelium |
| GO:0021913 | 1e-04 | 101.0128 | 0.1161 | 3 | 4 | regulation of transcription from RNA polymerase II promoter involved in ventral spinal cord interneuron specification |
| GO:0002009 | 1e-04 | 2.5303 | 10.1998 | 24 | 359 | morphogenesis of an epithelium |
| GO:0046883 | 1e-04 | 2.8891 | 7.11 | 19 | 245 | regulation of hormone secretion |
| GO:0061564 | 1e-04 | 2.3312 | 12.885 | 28 | 444 | axon development |
| GO:0001763 | 1e-04 | 3.1867 | 5.4558 | 16 | 188 | morphogenesis of a branching structure |
| GO:0048935 | 1e-04 | 22.5835 | 0.289 | 4 | 10 | peripheral nervous system neuron development |
| GO:0045666 | 1e-04 | 2.5863 | 9.1414 | 22 | 315 | positive regulation of neuron differentiation |
| GO:0023061 | 1e-04 | 2.371 | 11.7532 | 26 | 405 | signal release |
| GO:0048562 | 2e-04 | 3.4197 | 4.4611 | 14 | 159 | embryonic organ morphogenesis |
| GO:0021983 | 2e-04 | 6.9774 | 1.1898 | 7 | 41 | pituitary gland development |
| GO:0002089 | 2e-04 | 12.067 | 0.5514 | 5 | 19 | lens morphogenesis in camera-type eye |
| GO:0021915 | 2e-04 | 3.3933 | 4.4982 | 14 | 155 | neural tube development |
| GO:0003231 | 2e-04 | 3.8243 | 3.4534 | 12 | 119 | cardiac ventricle development |
| GO:0009914 | 2e-04 | 2.5987 | 8.6771 | 21 | 299 | hormone transport |
| GO:0019098 | 2e-04 | 8.4597 | 0.8706 | 6 | 30 | reproductive behavior |
| GO:0048812 | 2e-04 | 2.111 | 16.1933 | 32 | 558 | neuron projection morphogenesis |
| GO:0060349 | 2e-04 | 4.3609 | 2.5538 | 10 | 88 | bone morphogenesis |
| GO:0009954 | 2e-04 | 8.1208 | 0.8996 | 6 | 31 | proximal/distal pattern formation |
| GO:0021779 | 2e-04 | 50.5032 | 0.1451 | 3 | 5 | oligodendrocyte cell fate commitment |
| GO:0021780 | 2e-04 | 50.5032 | 0.1451 | 3 | 5 | glial cell fate specification |
| GO:0061056 | 2e-04 | 50.5032 | 0.1451 | 3 | 5 | sclerotome development |
| GO:0071805 | 2e-04 | 2.993 | 5.775 | 16 | 199 | potassium ion transmembrane transport |
| GO:0060538 | 2e-04 | 3.276 | 4.6433 | 14 | 160 | skeletal muscle organ development |
| GO:0061061 | 2e-04 | 2.0362 | 17.8185 | 34 | 614 | muscle structure development |
| GO:0048701 | 3e-04 | 6.4104 | 1.2769 | 7 | 44 | embryonic cranial skeleton morphogenesis |
| GO:0009889 | 3e-04 | 1.5308 | 73.1583 | 101 | 2693 | regulation of biosynthetic process |
| GO:0021516 | 3e-04 | 10.5573 | 0.6094 | 5 | 21 | dorsal spinal cord development |
| GO:0048858 | 3e-04 | 2.0426 | 16.6867 | 32 | 575 | cell projection morphogenesis |
| GO:0048667 | 4e-04 | 2.1204 | 14.5682 | 29 | 502 | cell morphogenesis involved in neuron differentiation |
| GO:0050796 | 4e-04 | 3.1247 | 4.8464 | 14 | 167 | regulation of insulin secretion |
| GO:0048704 | 4e-04 | 5.8583 | 1.376 | 7 | 48 | embryonic skeletal system morphogenesis |
| GO:0042733 | 5e-04 | 4.9335 | 1.8283 | 8 | 63 | embryonic digit morphogenesis |
| GO:0006935 | 5e-04 | 2.0244 | 16.2804 | 31 | 561 | chemotaxis |
| GO:0014031 | 5e-04 | 4.8451 | 1.8573 | 8 | 64 | mesenchymal cell development |
| GO:0048864 | 5e-04 | 4.8451 | 1.8573 | 8 | 64 | stem cell development |
| GO:0040012 | 5e-04 | 1.8139 | 24.6383 | 42 | 849 | regulation of locomotion |
| GO:0035137 | 5e-04 | 6.7652 | 1.0447 | 6 | 36 | hindlimb morphogenesis |
| GO:0060255 | 5e-04 | 1.3712 | 169.5658 | 204 | 5843 | regulation of macromolecule metabolic process |
| GO:0035640 | 5e-04 | 8.8886 | 0.6965 | 5 | 24 | exploration behavior |
| GO:0006813 | 5e-04 | 2.6571 | 6.8488 | 17 | 236 | potassium ion transport |
| GO:0060173 | 6e-04 | 8.7928 | 0.6979 | 5 | 25 | limb development |
| GO:0003214 | 6e-04 | 13.4895 | 0.4063 | 4 | 14 | cardiac left ventricle morphogenesis |
| GO:0030198 | 6e-04 | 2.3645 | 9.4606 | 21 | 326 | extracellular matrix organization |
| GO:0009887 | 6e-04 | 2.0751 | 14.3481 | 28 | 536 | animal organ morphogenesis |
| GO:0002042 | 6e-04 | 6.5465 | 1.0738 | 6 | 37 | cell migration involved in sprouting angiogenesis |
| GO:0007618 | 7e-04 | 6.3415 | 1.1028 | 6 | 38 | mating |
| GO:0045777 | 7e-04 | 6.3415 | 1.1028 | 6 | 38 | positive regulation of blood pressure |
| GO:2000648 | 7e-04 | 6.3415 | 1.1028 | 6 | 38 | positive regulation of stem cell proliferation |
| GO:0021542 | 7e-04 | 12.2624 | 0.4353 | 4 | 15 | dentate gyrus development |
| GO:0072148 | 7e-04 | 12.2624 | 0.4353 | 4 | 15 | epithelial cell fate commitment |
| GO:0014033 | 8e-04 | 4.521 | 1.9734 | 8 | 68 | neural crest cell differentiation |
| GO:0001826 | 8e-04 | 25.2484 | 0.2031 | 3 | 7 | inner cell mass cell differentiation |
| GO:0003357 | 8e-04 | 25.2484 | 0.2031 | 3 | 7 | noradrenergic neuron differentiation |
| GO:0035385 | 8e-04 | 25.2484 | 0.2031 | 3 | 7 | Roundabout signaling pathway |
| GO:0003404 | 8e-04 | Inf | 0.058 | 2 | 2 | optic vesicle morphogenesis |
| GO:0043503 | 8e-04 | Inf | 0.058 | 2 | 2 | skeletal muscle fiber adaptation |
| GO:0072272 | 8e-04 | Inf | 0.058 | 2 | 2 | proximal/distal pattern formation involved in metanephric nephron development |
| GO:0032989 | 8e-04 | 1.7219 | 28.3819 | 46 | 978 | cellular component morphogenesis |
| GO:0060485 | 0.0011 | 2.571 | 6.6342 | 16 | 230 | mesenchyme development |
| GO:1902692 | 0.0011 | 7.3409 | 0.8126 | 5 | 28 | regulation of neuroblast proliferation |
| GO:0048565 | 0.0012 | 3.2248 | 3.6856 | 11 | 127 | digestive tract development |
| GO:0003206 | 0.0012 | 3.7588 | 2.6178 | 9 | 91 | cardiac chamber morphogenesis |
| GO:0002118 | 0.0012 | 20.1974 | 0.2322 | 3 | 8 | aggressive behavior |
| GO:0021859 | 0.0012 | 20.1974 | 0.2322 | 3 | 8 | pyramidal neuron differentiation |
| GO:0060534 | 0.0012 | 20.1974 | 0.2322 | 3 | 8 | trachea cartilage development |
| GO:0051270 | 0.0012 | 1.7416 | 24.9285 | 41 | 859 | regulation of cellular component movement |
| GO:0060219 | 0.0012 | 10.3746 | 0.4933 | 4 | 17 | camera-type eye photoreceptor cell differentiation |
| GO:2000136 | 0.0012 | 10.3746 | 0.4933 | 4 | 17 | regulation of cell proliferation involved in heart morphogenesis |
| GO:0072175 | 0.0013 | 3.197 | 3.7146 | 11 | 128 | epithelial tube formation |
| GO:0060021 | 0.0013 | 3.7243 | 2.6409 | 9 | 91 | palate development |
| GO:0021879 | 0.0015 | 9.8085 | 0.5134 | 4 | 18 | forebrain neuron differentiation |
| GO:0010629 | 0.0015 | 1.5007 | 53.4264 | 75 | 1841 | negative regulation of gene expression |
| GO:0021761 | 0.0017 | 3.9592 | 2.2183 | 8 | 77 | limbic system development |
| GO:0003266 | 0.0018 | 16.8301 | 0.2612 | 3 | 9 | regulation of secondary heart field cardioblast proliferation |
| GO:0060180 | 0.0018 | 16.8301 | 0.2612 | 3 | 9 | female mating behavior |
| GO:0031018 | 0.0018 | 5.201 | 1.3059 | 6 | 45 | endocrine pancreas development |
| GO:0009653 | 0.0018 | 1.9211 | 15.4606 | 28 | 622 | anatomical structure morphogenesis |
| GO:0008015 | 0.0018 | 2.1404 | 10.3686 | 21 | 362 | blood circulation |
| GO:0003209 | 0.0018 | 6.4927 | 0.8996 | 5 | 31 | cardiac atrium morphogenesis |
| GO:0030278 | 0.0019 | 2.7158 | 5.1076 | 13 | 176 | regulation of ossification |
| GO:0072079 | 0.0019 | 8.9901 | 0.5514 | 4 | 19 | nephron tubule formation |
| GO:0030902 | 0.0021 | 2.9909 | 3.9468 | 11 | 136 | hindbrain development |
| GO:0051937 | 0.0021 | 4.3075 | 1.7993 | 7 | 62 | catecholamine transport |
| GO:0042391 | 0.0021 | 2.0723 | 11.2018 | 22 | 386 | regulation of membrane potential |
| GO:0008038 | 0.0021 | 6.2518 | 0.9287 | 5 | 32 | neuron recognition |
| GO:0003279 | 0.0022 | 3.4299 | 2.844 | 9 | 98 | cardiac septum development |
| GO:0019932 | 0.0022 | 2.254 | 8.4449 | 18 | 291 | second-messenger-mediated signaling |
| GO:0097756 | 0.0022 | 3.7646 | 2.3216 | 8 | 80 | negative regulation of blood vessel diameter |
| GO:0002067 | 0.0023 | 4.9467 | 1.364 | 6 | 47 | glandular epithelial cell differentiation |
| GO:2000179 | 0.0023 | 4.9467 | 1.364 | 6 | 47 | positive regulation of neural precursor cell proliferation |
| GO:0021854 | 0.0023 | 8.4277 | 0.5804 | 4 | 20 | hypothalamus development |
| GO:0023019 | 0.0023 | 8.4277 | 0.5804 | 4 | 20 | signal transduction involved in regulation of gene expression |
| GO:0060039 | 0.0023 | 8.4277 | 0.5804 | 4 | 20 | pericardium development |
| GO:2000178 | 0.0023 | 8.4277 | 0.5804 | 4 | 20 | negative regulation of neural precursor cell proliferation |
| GO:0048732 | 0.0024 | 2.0885 | 10.6047 | 21 | 370 | gland development |
| GO:0007416 | 0.0024 | 2.9202 | 4.0338 | 11 | 139 | synapse assembly |
| GO:0045987 | 0.0024 | 6.0281 | 0.9577 | 5 | 33 | positive regulation of smooth muscle contraction |
| GO:0003166 | 0.0025 | 67.1983 | 0.0871 | 2 | 3 | bundle of His development |
| GO:0014016 | 0.0025 | 67.1983 | 0.0871 | 2 | 3 | neuroblast differentiation |
| GO:0014908 | 0.0025 | 67.1983 | 0.0871 | 2 | 3 | myotube differentiation involved in skeletal muscle regeneration |
| GO:0021530 | 0.0025 | 67.1983 | 0.0871 | 2 | 3 | spinal cord oligodendrocyte cell fate specification |
| GO:0021912 | 0.0025 | 67.1983 | 0.0871 | 2 | 3 | regulation of transcription from RNA polymerase II promoter involved in spinal cord motor neuron fate specification |
| GO:0048936 | 0.0025 | 67.1983 | 0.0871 | 2 | 3 | peripheral nervous system neuron axonogenesis |
| GO:0060913 | 0.0025 | 67.1983 | 0.0871 | 2 | 3 | cardiac cell fate determination |
| GO:0140076 | 0.0025 | 67.1983 | 0.0871 | 2 | 3 | negative regulation of lipoprotein transport |
| GO:0021520 | 0.0025 | 14.4859 | 0.289 | 3 | 10 | spinal cord motor neuron cell fate specification |
| GO:0003211 | 0.0025 | 14.4249 | 0.2902 | 3 | 10 | cardiac ventricle formation |
| GO:0003263 | 0.0025 | 14.4249 | 0.2902 | 3 | 10 | cardioblast proliferation |
| GO:0007417 | 0.0025 | 2.7455 | 4.653 | 12 | 176 | central nervous system development |
| GO:0030334 | 0.0027 | 1.7347 | 21.2429 | 35 | 732 | regulation of cell migration |
| GO:0048639 | 0.0027 | 2.7205 | 4.7013 | 12 | 162 | positive regulation of developmental growth |
| GO:0048468 | 0.0028 | 1.5969 | 31.8479 | 48 | 1173 | cell development |
| GO:0010842 | 0.0028 | 7.9315 | 0.6094 | 4 | 21 | retina layer formation |
| GO:0031290 | 0.0028 | 7.9315 | 0.6094 | 4 | 21 | retinal ganglion cell axon guidance |
| GO:0043586 | 0.0028 | 7.9315 | 0.6094 | 4 | 21 | tongue development |
| GO:0048485 | 0.0028 | 7.9315 | 0.6094 | 4 | 21 | sympathetic nervous system development |
| GO:0065007 | 0.0028 | 1.3489 | 327.7266 | 355 | 11293 | biological regulation |
| GO:0001656 | 0.003 | 3.5655 | 2.4377 | 8 | 84 | metanephros development |
| GO:0033555 | 0.0032 | 3.9473 | 1.9444 | 7 | 67 | multicellular organismal response to stress |
| GO:0061448 | 0.0033 | 2.356 | 6.7327 | 15 | 232 | connective tissue development |
| GO:0021537 | 0.0033 | 2.5351 | 5.4386 | 13 | 191 | telencephalon development |
| GO:0051240 | 0.0033 | 1.6209 | 27.9935 | 43 | 1007 | positive regulation of multicellular organismal process |
| GO:0021559 | 0.0034 | 12.621 | 0.3192 | 3 | 11 | trigeminal nerve development |
| GO:2001053 | 0.0034 | 12.621 | 0.3192 | 3 | 11 | regulation of mesenchymal cell apoptotic process |
| GO:0001525 | 0.0034 | 1.9232 | 13.1172 | 24 | 452 | angiogenesis |
| GO:0007623 | 0.0034 | 2.5277 | 5.4558 | 13 | 188 | circadian rhythm |
| GO:0010811 | 0.0035 | 3.1784 | 3.0471 | 9 | 105 | positive regulation of cell-substrate adhesion |
| GO:0072009 | 0.0035 | 3.1784 | 3.0471 | 9 | 105 | nephron epithelium development |
| GO:0051173 | 0.0035 | 1.3746 | 82.0115 | 105 | 2826 | positive regulation of nitrogen compound metabolic process |
| GO:0035914 | 0.0035 | 3.8823 | 1.9734 | 7 | 68 | skeletal muscle cell differentiation |
| GO:0071300 | 0.0035 | 3.8823 | 1.9734 | 7 | 68 | cellular response to retinoic acid |
| GO:0030324 | 0.0035 | 2.6319 | 4.8464 | 12 | 167 | lung development |
| GO:0014003 | 0.0036 | 5.4437 | 1.0447 | 5 | 36 | oligodendrocyte development |
| GO:0071542 | 0.0036 | 5.4437 | 1.0447 | 5 | 36 | dopaminergic neuron differentiation |
| GO:0030072 | 0.0037 | 2.3234 | 6.8198 | 15 | 235 | peptide hormone secretion |
| GO:0035296 | 0.0039 | 2.9001 | 3.6856 | 10 | 127 | regulation of tube diameter |
| GO:0007601 | 0.0041 | 2.4705 | 5.5719 | 13 | 192 | visual perception |
| GO:0001755 | 0.0041 | 5.2733 | 1.0738 | 5 | 37 | neural crest cell migration |
| GO:0021987 | 0.0042 | 3.0815 | 3.1342 | 9 | 108 | cerebral cortex development |
| GO:0030154 | 0.0042 | 1.5902 | 30.1561 | 45 | 1218 | cell differentiation |
| GO:0001568 | 0.0042 | 1.7552 | 17.9346 | 30 | 618 | blood vessel development |
| GO:0040007 | 0.0044 | 2.1508 | 8.3231 | 17 | 294 | growth |
| GO:0010454 | 0.0044 | 11.2179 | 0.3482 | 3 | 12 | negative regulation of cell fate commitment |
| GO:0033605 | 0.0044 | 11.2179 | 0.3482 | 3 | 12 | positive regulation of catecholamine secretion |
| GO:0042659 | 0.0044 | 11.2179 | 0.3482 | 3 | 12 | regulation of cell fate specification |
| GO:0060900 | 0.0044 | 11.2179 | 0.3482 | 3 | 12 | embryonic camera-type eye formation |
| GO:0050877 | 0.0045 | 1.5296 | 35.1146 | 51 | 1210 | nervous system process |
| GO:0045595 | 0.0047 | 1.6845 | 21.2315 | 34 | 782 | regulation of cell differentiation |
| GO:0001964 | 0.0047 | 6.7405 | 0.6965 | 4 | 24 | startle response |
| GO:0042481 | 0.0047 | 6.7405 | 0.6965 | 4 | 24 | regulation of odontogenesis |
| GO:0051482 | 0.0047 | 6.7405 | 0.6965 | 4 | 24 | positive regulation of cytosolic calcium ion concentration involved in phospholipase C-activating G-protein coupled signaling pathway |
| GO:0060487 | 0.0047 | 6.7405 | 0.6965 | 4 | 24 | lung epithelial cell differentiation |
| GO:0021675 | 0.0048 | 3.6425 | 2.0895 | 7 | 72 | nerve development |
| GO:0007188 | 0.0048 | 2.6488 | 4.4111 | 11 | 152 | adenylate cyclase-modulating G-protein coupled receptor signaling pathway |
| GO:0001992 | 0.0049 | 33.597 | 0.1161 | 2 | 4 | regulation of systemic arterial blood pressure by vasopressin |
| GO:0001994 | 0.0049 | 33.597 | 0.1161 | 2 | 4 | norepinephrine-epinephrine vasoconstriction involved in regulation of systemic arterial blood pressure |
| GO:0007621 | 0.0049 | 33.597 | 0.1161 | 2 | 4 | negative regulation of female receptivity |
| GO:0021555 | 0.0049 | 33.597 | 0.1161 | 2 | 4 | midbrain-hindbrain boundary morphogenesis |
| GO:0021797 | 0.0049 | 33.597 | 0.1161 | 2 | 4 | forebrain anterior/posterior pattern specification |
| GO:0034287 | 0.0049 | 33.597 | 0.1161 | 2 | 4 | detection of monosaccharide stimulus |
| GO:0042662 | 0.0049 | 33.597 | 0.1161 | 2 | 4 | negative regulation of mesodermal cell fate specification |
| GO:0048866 | 0.0049 | 33.597 | 0.1161 | 2 | 4 | stem cell fate specification |
| GO:0050923 | 0.0049 | 33.597 | 0.1161 | 2 | 4 | regulation of negative chemotaxis |
| GO:0051414 | 0.0049 | 33.597 | 0.1161 | 2 | 4 | response to cortisol |
| GO:0051594 | 0.0049 | 33.597 | 0.1161 | 2 | 4 | detection of glucose |
| GO:0060164 | 0.0049 | 33.597 | 0.1161 | 2 | 4 | regulation of timing of neuron differentiation |
| GO:0060214 | 0.0049 | 33.597 | 0.1161 | 2 | 4 | endocardium formation |
| GO:0072086 | 0.0049 | 33.597 | 0.1161 | 2 | 4 | specification of loop of Henle identity |
| GO:0097176 | 0.0049 | 33.597 | 0.1161 | 2 | 4 | epoxide metabolic process |
| GO:1905903 | 0.0049 | 33.597 | 0.1161 | 2 | 4 | negative regulation of mesoderm formation |
| GO:0061333 | 0.0052 | 3.5871 | 2.1185 | 7 | 73 | renal tubule morphogenesis |
| GO:0072089 | 0.0053 | 3.5723 | 2.1251 | 7 | 74 | stem cell proliferation |
| GO:0003148 | 0.0055 | 6.4191 | 0.7255 | 4 | 25 | outflow tract septum morphogenesis |
| GO:0090304 | 0.0055 | 1.292 | 142.1996 | 168 | 4900 | nucleic acid metabolic process |
| GO:0045597 | 0.0056 | 2.0024 | 9.9583 | 19 | 359 | positive regulation of cell differentiation |
| GO:0007320 | 0.0056 | 10.0955 | 0.3773 | 3 | 13 | insemination |
| GO:0021978 | 0.0056 | 10.0955 | 0.3773 | 3 | 13 | telencephalon regionalization |
| GO:0040034 | 0.0056 | 10.0955 | 0.3773 | 3 | 13 | regulation of development, heterochronic |
| GO:0070365 | 0.0056 | 10.0955 | 0.3773 | 3 | 13 | hepatocyte differentiation |
| GO:0001657 | 0.0056 | 3.1862 | 2.6989 | 8 | 93 | ureteric bud development |
| GO:0019233 | 0.0056 | 3.1862 | 2.6989 | 8 | 93 | sensory perception of pain |
| GO:0003170 | 0.0057 | 4.8204 | 1.1608 | 5 | 40 | heart valve development |
| GO:0035265 | 0.0059 | 2.575 | 4.5272 | 11 | 156 | organ growth |
| GO:0042472 | 0.006 | 3.1489 | 2.7279 | 8 | 94 | inner ear morphogenesis |
| GO:0060079 | 0.006 | 3.1489 | 2.7279 | 8 | 94 | excitatory postsynaptic potential |
| GO:0072163 | 0.006 | 3.1489 | 2.7279 | 8 | 94 | mesonephric epithelium development |
| GO:0019229 | 0.006 | 3.9742 | 1.6542 | 6 | 57 | regulation of vasoconstriction |
| GO:0010594 | 0.006 | 2.7131 | 3.9177 | 10 | 135 | regulation of endothelial cell migration |
| GO:0050880 | 0.006 | 2.7131 | 3.9177 | 10 | 135 | regulation of blood vessel size |
| GO:0051952 | 0.006 | 3.4811 | 2.1765 | 7 | 75 | regulation of amine transport |
| GO:0002063 | 0.0063 | 6.1269 | 0.7545 | 4 | 26 | chondrocyte development |
| GO:0071495 | 0.0064 | 1.4989 | 35.753 | 51 | 1232 | cellular response to endogenous stimulus |
| GO:0008344 | 0.0065 | 3.4305 | 2.2055 | 7 | 76 | adult locomotory behavior |
| GO:0045669 | 0.0065 | 3.8975 | 1.6832 | 6 | 58 | positive regulation of osteoblast differentiation |
| GO:0003188 | 0.007 | 9.1772 | 0.4063 | 3 | 14 | heart valve formation |
| GO:0042711 | 0.007 | 9.1772 | 0.4063 | 3 | 14 | maternal behavior |
| GO:0010470 | 0.0071 | 4.5592 | 1.2189 | 5 | 42 | regulation of gastrulation |
| GO:0008016 | 0.0071 | 2.2148 | 6.6457 | 14 | 229 | regulation of heart contraction |
| GO:0001958 | 0.0072 | 5.8602 | 0.7835 | 4 | 27 | endochondral ossification |
| GO:0040008 | 0.0075 | 1.6928 | 17.9055 | 29 | 617 | regulation of growth |
| GO:0042127 | 0.0078 | 1.4343 | 44.7615 | 61 | 1554 | regulation of cell proliferation |
| GO:0060421 | 0.0078 | 4.439 | 1.2479 | 5 | 43 | positive regulation of heart growth |
| GO:0016199 | 0.0079 | 22.3966 | 0.1451 | 2 | 5 | axon midline choice point recognition |
| GO:0045636 | 0.0079 | 22.3966 | 0.1451 | 2 | 5 | positive regulation of melanocyte differentiation |
| GO:0060729 | 0.0079 | 22.3966 | 0.1451 | 2 | 5 | intestinal epithelial structure maintenance |
| GO:0061009 | 0.0079 | 22.3966 | 0.1451 | 2 | 5 | common bile duct development |
| GO:0070100 | 0.0079 | 22.3966 | 0.1451 | 2 | 5 | negative regulation of chemokine-mediated signaling pathway |
| GO:0071504 | 0.0079 | 22.3966 | 0.1451 | 2 | 5 | cellular response to heparin |
| GO:0090130 | 0.008 | 2.1181 | 7.4292 | 15 | 256 | tissue migration |
| GO:0055067 | 0.0081 | 2.5878 | 4.0919 | 10 | 141 | monovalent inorganic cation homeostasis |
| GO:0048523 | 0.0082 | 1.2813 | 129.2856 | 153 | 4455 | negative regulation of cellular process |
| GO:0044057 | 0.0082 | 1.7541 | 14.8874 | 25 | 513 | regulation of system process |
| GO:0060560 | 0.0084 | 2.4405 | 4.7562 | 11 | 165 | developmental growth involved in morphogenesis |
| GO:0007379 | 0.0085 | 8.4119 | 0.4353 | 3 | 15 | segment specification |
| GO:0008595 | 0.0085 | 8.4119 | 0.4353 | 3 | 15 | anterior/posterior axis specification, embryo |
| GO:0072358 | 0.009 | 1.6527 | 18.9503 | 30 | 653 | cardiovascular system development |
| GO:1902742 | 0.0092 | 5.4255 | 0.8364 | 4 | 29 | apoptotic process involved in development |
| GO:0003203 | 0.0094 | 5.3907 | 0.8416 | 4 | 29 | endocardial cushion morphogenesis |
| GO:0003401 | 0.0094 | 5.3907 | 0.8416 | 4 | 29 | axis elongation |
| GO:0031128 | 0.0094 | 5.3907 | 0.8416 | 4 | 29 | developmental induction |
| GO:0061036 | 0.0094 | 5.3907 | 0.8416 | 4 | 29 | positive regulation of cartilage development |
| GO:0035176 | 0.0095 | 4.2165 | 1.3059 | 5 | 45 | social behavior |
| GO:0035239 | 0.0096 | 2.2889 | 5.5112 | 12 | 194 | tube morphogenesis |
| GO:0022414 | 0.0097 | 1.4515 | 38.2778 | 53 | 1319 | reproductive process |
| GO:0001756 | 0.0097 | 3.5545 | 1.8283 | 6 | 63 | somitogenesis |
| GO:0051146 | 0.0098 | 2.0658 | 7.6033 | 15 | 262 | striated muscle cell differentiation |
| GO:0001101 | 0.0099 | 1.9629 | 9.0543 | 17 | 312 | response to acid chemical |
| GOMFID | Pvalue | OddsRatio | ExpCount | Count | Size | Term |
| GO:0006959 | 0 | 4.5463 | 4.156 | 17 | 219 | humoral immune response |
| GO:0071346 | 0 | 5.4807 | 2.6568 | 13 | 140 | cellular response to interferon-gamma |
| GO:0007166 | 0 | 1.7784 | 49.8721 | 78 | 2628 | cell surface receptor signaling pathway |
| GO:0071310 | 1e-04 | 1.7473 | 44.8621 | 70 | 2364 | cellular response to organic substance |
| GO:0023052 | 1e-04 | 1.5607 | 115.2486 | 148 | 6073 | signaling |
| GO:0060759 | 1e-04 | 4.0448 | 3.2261 | 12 | 170 | regulation of response to cytokine stimulus |
| GO:0002250 | 1e-04 | 2.9327 | 6.6041 | 18 | 348 | adaptive immune response |
| GO:2001300 | 1e-04 | 52.1934 | 0.1139 | 3 | 6 | lipoxin metabolic process |
| GO:0060326 | 1e-04 | 3.2623 | 4.953 | 15 | 261 | cell chemotaxis |
| GO:0035666 | 2e-04 | 11.4069 | 0.5314 | 5 | 28 | TRIF-dependent toll-like receptor signaling pathway |
| GO:0071356 | 2e-04 | 3.1205 | 5.1618 | 15 | 272 | cellular response to tumor necrosis factor |
| GO:0007154 | 2e-04 | 1.5108 | 115.6661 | 146 | 6095 | cell communication |
| GO:0042221 | 4e-04 | 1.5326 | 79.078 | 106 | 4167 | response to chemical |
| GO:0044657 | 4e-04 | Inf | 0.038 | 2 | 2 | pore formation in membrane of other organism during symbiotic interaction |
| GO:0052043 | 4e-04 | Inf | 0.038 | 2 | 2 | modification by symbiont of host cellular component |
| GO:0052185 | 4e-04 | Inf | 0.038 | 2 | 2 | modification of structure of other organism involved in symbiotic interaction |
| GO:0052332 | 4e-04 | Inf | 0.038 | 2 | 2 | modification by organism of membrane in other organism involved in symbiotic interaction |
| GO:0061844 | 4e-04 | 7.0097 | 0.9678 | 6 | 51 | antimicrobial humoral immune response mediated by antimicrobial peptide |
| GO:0045087 | 6e-04 | 2.6429 | 6.8666 | 17 | 380 | innate immune response |
| GO:0010818 | 6e-04 | 12.3104 | 0.3985 | 4 | 21 | T cell chemotaxis |
| GO:0051716 | 7e-04 | 1.4573 | 129.7661 | 158 | 6838 | cellular response to stimulus |
| GO:0001932 | 7e-04 | 1.7985 | 25.1827 | 42 | 1327 | regulation of protein phosphorylation |
| GO:0019731 | 7e-04 | 7.9453 | 0.7211 | 5 | 38 | antibacterial humoral response |
| GO:0010803 | 7e-04 | 6.1827 | 1.0817 | 6 | 57 | regulation of tumor necrosis factor-mediated signaling pathway |
| GO:0050900 | 8e-04 | 2.485 | 7.7047 | 18 | 406 | leukocyte migration |
| GO:0070098 | 8e-04 | 5.0491 | 1.5182 | 7 | 80 | chemokine-mediated signaling pathway |
| GO:0050832 | 8e-04 | 7.7111 | 0.7401 | 5 | 39 | defense response to fungus |
| GO:0002263 | 8e-04 | 2.1267 | 12.525 | 25 | 660 | cell activation involved in immune response |
| GO:0006879 | 9e-04 | 5.9486 | 1.1197 | 6 | 59 | cellular iron ion homeostasis |
| GO:0048522 | 0.001 | 1.465 | 90.4264 | 116 | 4765 | positive regulation of cellular process |
| GO:0023014 | 0.001 | 1.9409 | 17.0605 | 31 | 899 | signal transduction by protein phosphorylation |
| GO:0042330 | 0.0011 | 2.1954 | 10.6462 | 22 | 561 | taxis |
| GO:1902531 | 0.0011 | 1.6678 | 33.0962 | 51 | 1744 | regulation of intracellular signal transduction |
| GO:0019220 | 0.0014 | 1.6634 | 31.7868 | 49 | 1675 | regulation of phosphate metabolic process |
| GO:0071347 | 0.0016 | 4.4379 | 1.7079 | 7 | 90 | cellular response to interleukin-1 |
| GO:0034340 | 0.0017 | 4.3848 | 1.7269 | 7 | 91 | response to type I interferon |
| GO:0051707 | 0.0018 | 1.9257 | 15.4474 | 28 | 814 | response to other organism |
| GO:0045088 | 0.0019 | 2.3513 | 7.6478 | 17 | 403 | regulation of innate immune response |
| GO:0002286 | 0.0019 | 4.2823 | 1.7649 | 7 | 93 | T cell activation involved in immune response |
| GO:0002323 | 0.0021 | 8.3668 | 0.5503 | 4 | 29 | natural killer cell activation involved in immune response |
| GO:0002760 | 0.0021 | 52.0261 | 0.0759 | 2 | 4 | positive regulation of antimicrobial humoral response |
| GO:0032100 | 0.0021 | 52.0261 | 0.0759 | 2 | 4 | positive regulation of appetite |
| GO:0061356 | 0.0021 | 52.0261 | 0.0759 | 2 | 4 | regulation of Wnt protein secretion |
| GO:0070574 | 0.0021 | 52.0261 | 0.0759 | 2 | 4 | cadmium ion transmembrane transport |
| GO:0071315 | 0.0021 | 52.0261 | 0.0759 | 2 | 4 | cellular response to morphine |
| GO:0055076 | 0.0022 | 3.7307 | 2.2962 | 8 | 121 | transition metal ion homeostasis |
| GO:0043410 | 0.0025 | 2.171 | 9.2419 | 19 | 487 | positive regulation of MAPK cascade |
| GO:0045321 | 0.0026 | 1.7497 | 21.2924 | 35 | 1122 | leukocyte activation |
| GO:0007076 | 0.0026 | 13.041 | 0.2847 | 3 | 15 | mitotic chromosome condensation |
| GO:0034097 | 0.0026 | 1.9426 | 13.6382 | 25 | 748 | response to cytokine |
| GO:0002251 | 0.003 | 7.469 | 0.6073 | 4 | 32 | organ or tissue specific immune response |
| GO:0019372 | 0.0032 | 12.0371 | 0.3036 | 3 | 16 | lipoxygenase pathway |
| GO:0048583 | 0.0033 | 1.4437 | 66.6276 | 87 | 3615 | regulation of response to stimulus |
| GO:0043547 | 0.0033 | 2.2779 | 7.4011 | 16 | 390 | positive regulation of GTPase activity |
| GO:0032268 | 0.0034 | 1.4933 | 48.6955 | 67 | 2566 | regulation of cellular protein metabolic process |
| GO:0045409 | 0.0035 | 34.6819 | 0.0949 | 2 | 5 | negative regulation of interleukin-6 biosynthetic process |
| GO:1903322 | 0.0036 | 2.9184 | 3.6246 | 10 | 191 | positive regulation of protein modification by small protein conjugation or removal |
| GO:0051607 | 0.0036 | 2.7446 | 4.2319 | 11 | 223 | defense response to virus |
| GO:0043312 | 0.0036 | 2.139 | 8.8624 | 18 | 467 | neutrophil degranulation |
| GO:0009607 | 0.0037 | 1.8183 | 16.2824 | 28 | 858 | response to biotic stimulus |
| GO:0070423 | 0.0038 | 6.9702 | 0.6452 | 4 | 34 | nucleotide-binding oligomerization domain containing signaling pathway |
| GO:0045055 | 0.0045 | 1.8826 | 13.4359 | 24 | 708 | regulated exocytosis |
| GO:0090026 | 0.0045 | 10.4308 | 0.3416 | 3 | 18 | positive regulation of monocyte chemotaxis |
| GO:0042119 | 0.0045 | 2.091 | 9.0521 | 18 | 477 | neutrophil activation |
| GO:0050778 | 0.0046 | 1.9053 | 12.7147 | 23 | 670 | positive regulation of immune response |
| GO:0031640 | 0.0048 | 4.9408 | 1.1007 | 5 | 58 | killing of cells of other organism |
| GO:0048247 | 0.0049 | 6.4129 | 0.6939 | 4 | 37 | lymphocyte chemotaxis |
| GO:1904668 | 0.0049 | 4.0883 | 1.5751 | 6 | 83 | positive regulation of ubiquitin protein ligase activity |
| GO:0002275 | 0.005 | 2.0278 | 9.8492 | 19 | 519 | myeloid cell activation involved in immune response |
| GO:0006950 | 0.005 | 1.4109 | 68.4128 | 88 | 3605 | response to stress |
| GO:0032109 | 0.0051 | 26.0098 | 0.1139 | 2 | 6 | positive regulation of response to nutrient levels |
| GO:0051673 | 0.0051 | 26.0098 | 0.1139 | 2 | 6 | membrane disruption in other organism |
| GO:0042276 | 0.0052 | 9.7783 | 0.3606 | 3 | 19 | error-prone translesion synthesis |
| GO:0002444 | 0.0053 | 2.0153 | 9.9061 | 19 | 522 | myeloid leukocyte mediated immunity |
| GO:0002758 | 0.0056 | 2.4613 | 5.1238 | 12 | 270 | innate immune response-activating signal transduction |
| GO:0060337 | 0.0059 | 3.9343 | 1.632 | 6 | 86 | type I interferon signaling pathway |
| GO:0006508 | 0.0061 | 1.549 | 31.635 | 46 | 1667 | proteolysis |
| GO:0002227 | 0.0061 | 9.2025 | 0.3795 | 3 | 20 | innate immune response in mucosa |
| GO:0060544 | 0.0061 | 9.2025 | 0.3795 | 3 | 20 | regulation of necroptotic process |
| GO:1904380 | 0.0061 | 9.2025 | 0.3795 | 3 | 20 | endoplasmic reticulum mannose trimming |
| GO:1903321 | 0.0062 | 3.0953 | 2.7327 | 8 | 144 | negative regulation of protein modification by small protein conjugation or removal |
| GO:0031098 | 0.0063 | 2.4231 | 5.1998 | 12 | 274 | stress-activated protein kinase signaling cascade |
| GO:0030522 | 0.0065 | 2.4138 | 5.2187 | 12 | 275 | intracellular receptor signaling pathway |
| GO:0002223 | 0.0066 | 3.3738 | 2.2014 | 7 | 116 | stimulatory C-type lectin receptor signaling pathway |
| GO:0051247 | 0.0068 | 1.559 | 29.3008 | 43 | 1544 | positive regulation of protein metabolic process |
| GO:0033141 | 0.007 | 8.6907 | 0.3985 | 3 | 21 | positive regulation of peptidyl-serine phosphorylation of STAT protein |
| GO:0016198 | 0.0071 | 20.8065 | 0.1328 | 2 | 7 | axon choice point recognition |
| GO:0006875 | 0.0073 | 1.9883 | 9.4886 | 18 | 500 | cellular metal ion homeostasis |
| GO:0071675 | 0.0074 | 5.649 | 0.7781 | 4 | 41 | regulation of mononuclear cell migration |
| GO:0032479 | 0.0076 | 3.2828 | 2.2583 | 7 | 119 | regulation of type I interferon production |
| GO:0051438 | 0.0076 | 3.2828 | 2.2583 | 7 | 119 | regulation of ubiquitin-protein transferase activity |
| GO:0010562 | 0.0077 | 1.654 | 20.4005 | 32 | 1075 | positive regulation of phosphorus metabolic process |
| GO:0031401 | 0.0078 | 1.6956 | 18.0223 | 29 | 970 | positive regulation of protein modification process |
| GO:0097300 | 0.0081 | 5.5 | 0.797 | 4 | 42 | programmed necrotic cell death |
| GO:0031349 | 0.0084 | 2.0475 | 8.1792 | 16 | 431 | positive regulation of defense response |
| GO:0042327 | 0.0086 | 1.6814 | 18.1422 | 29 | 956 | positive regulation of phosphorylation |
| GO:0038061 | 0.0087 | 3.1966 | 2.3152 | 7 | 122 | NIK/NF-kappaB signaling |
| GO:0043085 | 0.0087 | 1.5649 | 26.3593 | 39 | 1389 | positive regulation of catalytic activity |
| GO:0042059 | 0.0088 | 5.3586 | 0.816 | 4 | 43 | negative regulation of epidermal growth factor receptor signaling pathway |
| GO:0042832 | 0.009 | 7.8207 | 0.4365 | 3 | 23 | defense response to protozoan |
| GO:0002684 | 0.0091 | 2.403 | 4.7988 | 11 | 262 | positive regulation of immune system process |
| GOMFID | Pvalue | OddsRatio | ExpCount | Count | Size | Term |
| GO:0031640 | 1e-04 | 7.023 | 1.1328 | 7 | 58 | killing of cells of other organism |
| GO:0007518 | 4e-04 | Inf | 0.0391 | 2 | 2 | myoblast fate determination |
| GO:0061844 | 5e-04 | 6.803 | 0.9961 | 6 | 51 | antimicrobial humoral immune response mediated by antimicrobial peptide |
| GO:0003350 | 0.0011 | 101.0286 | 0.0586 | 2 | 3 | pulmonary myocardium development |
| GO:0006959 | 0.0013 | 2.9852 | 4.2774 | 12 | 219 | humoral immune response |
| GO:0051852 | 0.0023 | 13.8118 | 0.2734 | 3 | 14 | disruption by host of symbiont cells |
| GO:0007156 | 0.003 | 3.2225 | 2.9688 | 9 | 152 | homophilic cell adhesion via plasma membrane adhesion molecules |
| GO:0051673 | 0.0054 | 25.2524 | 0.1172 | 2 | 6 | membrane disruption in other organism |
| GO:0050832 | 0.0069 | 5.7975 | 0.7617 | 4 | 39 | defense response to fungus |
| GO:0071267 | 0.0075 | 20.2006 | 0.1367 | 2 | 7 | L-methionine salvage |
| GO:0060972 | 0.0076 | 8.4368 | 0.4102 | 3 | 21 | left/right pattern formation |
| GO:0095500 | 0.0086 | 7.9923 | 0.4297 | 3 | 22 | acetylcholine receptor signaling pathway |
| GO:1905144 | 0.0086 | 7.9923 | 0.4297 | 3 | 22 | response to acetylcholine |
| GO:0034340 | 0.0088 | 3.5925 | 1.7774 | 6 | 91 | response to type I interferon |
| GO:0042832 | 0.0098 | 7.5922 | 0.4492 | 3 | 23 | defense response to protozoan |
| GO:0045617 | 0.0099 | 16.8328 | 0.1563 | 2 | 8 | negative regulation of keratinocyte differentiation |
| GO:0070943 | 0.0099 | 16.8328 | 0.1563 | 2 | 8 | neutrophil mediated killing of symbiont cell |
| GOMFID | Pvalue | OddsRatio | ExpCount | Count | Size | Term |
| GO:0002263 | 0 | 3.6497 | 15.9409 | 50 | 660 | cell activation involved in immune response |
| GO:0045087 | 0 | 3.6087 | 11.9902 | 38 | 507 | innate immune response |
| GO:0045321 | 0 | 3.1999 | 15.2823 | 43 | 664 | leukocyte activation |
| GO:0071216 | 0 | 5.2169 | 4.6132 | 21 | 191 | cellular response to biotic stimulus |
| GO:0002275 | 0 | 3.2536 | 12.4016 | 36 | 516 | myeloid cell activation involved in immune response |
| GO:0002444 | 0 | 3.1943 | 12.6078 | 36 | 522 | myeloid leukocyte mediated immunity |
| GO:0051707 | 0 | 2.6769 | 19.6604 | 47 | 814 | response to other organism |
| GO:0042119 | 0 | 2.9636 | 11.5209 | 31 | 477 | neutrophil activation |
| GO:0001817 | 0 | 2.84 | 12.7951 | 33 | 536 | regulation of cytokine production |
| GO:0032940 | 0 | 2.2905 | 24.2285 | 50 | 1029 | secretion by cell |
| GO:0043312 | 0 | 2.9207 | 11.2794 | 30 | 467 | neutrophil degranulation |
| GO:0002237 | 0 | 3.3437 | 7.898 | 24 | 327 | response to molecule of bacterial origin |
| GO:0071222 | 0 | 5.5551 | 2.6584 | 13 | 112 | cellular response to lipopolysaccharide |
| GO:0090026 | 0 | 20.5 | 0.4348 | 6 | 18 | positive regulation of monocyte chemotaxis |
| GO:0002285 | 0 | 4.4937 | 3.7195 | 15 | 154 | lymphocyte activation involved in immune response |
| GO:0007166 | 0 | 1.731 | 59.9728 | 92 | 2549 | cell surface receptor signaling pathway |
| GO:0050776 | 0 | 2.1645 | 21.6409 | 43 | 896 | regulation of immune response |
| GO:0023052 | 0 | 1.5423 | 146.68 | 187 | 6073 | signaling |
| GO:0042330 | 0 | 2.4803 | 13.5497 | 31 | 561 | taxis |
| GO:0042102 | 0 | 5.3507 | 2.3187 | 11 | 96 | positive regulation of T cell proliferation |
| GO:0060326 | 0 | 3.2828 | 6.3039 | 19 | 261 | cell chemotaxis |
| GO:0045055 | 0 | 2.3873 | 14.0386 | 31 | 589 | regulated exocytosis |
| GO:0032101 | 0 | 2.2404 | 16.8828 | 35 | 699 | regulation of response to external stimulus |
| GO:0097530 | 0 | 4.5152 | 2.9466 | 12 | 122 | granulocyte migration |
| GO:0071675 | 1e-04 | 8.4513 | 0.9903 | 7 | 41 | regulation of mononuclear cell migration |
| GO:0048525 | 1e-04 | 5.2893 | 2.1254 | 10 | 88 | negative regulation of viral process |
| GO:0035589 | 1e-04 | 27.2027 | 0.2415 | 4 | 10 | G-protein coupled purinergic nucleotide receptor signaling pathway |
| GO:0002695 | 1e-04 | 3.9602 | 3.5988 | 13 | 149 | negative regulation of leukocyte activation |
| GO:0048584 | 1e-04 | 2.3641 | 13.2716 | 29 | 575 | positive regulation of response to stimulus |
| GO:0050704 | 1e-04 | 7.9808 | 1.0386 | 7 | 43 | regulation of interleukin-1 secretion |
| GO:0007154 | 1e-04 | 1.4856 | 147.2113 | 184 | 6095 | cell communication |
| GO:0032946 | 1e-04 | 4.1363 | 3.1882 | 12 | 132 | positive regulation of mononuclear cell proliferation |
| GO:0032651 | 1e-04 | 6.3245 | 1.4492 | 8 | 60 | regulation of interleukin-1 beta production |
| GO:0050663 | 1e-04 | 5.4599 | 1.8527 | 9 | 79 | cytokine secretion |
| GO:0050670 | 1e-04 | 3.4037 | 4.7823 | 15 | 198 | regulation of lymphocyte proliferation |
| GO:0050713 | 1e-04 | 23.3152 | 0.2657 | 4 | 11 | negative regulation of interleukin-1 beta secretion |
| GO:0070098 | 1e-04 | 5.2184 | 1.9322 | 9 | 80 | chemokine-mediated signaling pathway |
| GO:0002322 | 1e-04 | 61.0643 | 0.1208 | 3 | 5 | B cell proliferation involved in immune response |
| GO:0006955 | 1e-04 | 3.9056 | 3.3456 | 12 | 169 | immune response |
| GO:0050708 | 2e-04 | 2.4952 | 9.8785 | 23 | 409 | regulation of protein secretion |
| GO:0002687 | 2e-04 | 4.1281 | 2.9225 | 11 | 121 | positive regulation of leukocyte migration |
| GO:0070663 | 2e-04 | 3.2085 | 5.0479 | 15 | 209 | regulation of leukocyte proliferation |
| GO:0002831 | 2e-04 | 4.0906 | 2.9466 | 11 | 122 | regulation of response to biotic stimulus |
| GO:0006954 | 2e-04 | 2.2835 | 12.6612 | 27 | 532 | inflammatory response |
| GO:1902187 | 2e-04 | 18.1317 | 0.314 | 4 | 13 | negative regulation of viral release from host cell |
| GO:0002684 | 2e-04 | 2.1413 | 15.5194 | 31 | 666 | positive regulation of immune system process |
| GO:0070374 | 3e-04 | 3.2218 | 4.6856 | 14 | 194 | positive regulation of ERK1 and ERK2 cascade |
| GO:0030593 | 3e-04 | 4.6875 | 2.1254 | 9 | 88 | neutrophil chemotaxis |
| GO:0050921 | 3e-04 | 3.8794 | 3.0916 | 11 | 128 | positive regulation of chemotaxis |
| GO:1903900 | 3e-04 | 3.8794 | 3.0916 | 11 | 128 | regulation of viral life cycle |
| GO:0090196 | 3e-04 | 16.3175 | 0.3381 | 4 | 14 | regulation of chemokine secretion |
| GO:0006950 | 3e-04 | 1.4876 | 87.0709 | 116 | 3605 | response to stress |
| GO:0032692 | 3e-04 | 9.7311 | 0.628 | 5 | 26 | negative regulation of interleukin-1 production |
| GO:0050715 | 3e-04 | 4.5152 | 2.1964 | 9 | 92 | positive regulation of cytokine secretion |
| GO:0051607 | 4e-04 | 2.9898 | 5.3861 | 15 | 223 | defense response to virus |
| GO:0002793 | 4e-04 | 2.8624 | 5.9899 | 16 | 248 | positive regulation of peptide secretion |
| GO:0002313 | 4e-04 | 14.8332 | 0.3623 | 4 | 15 | mature B cell differentiation involved in immune response |
| GO:2000484 | 4e-04 | 14.8332 | 0.3623 | 4 | 15 | positive regulation of interleukin-8 secretion |
| GO:0050867 | 4e-04 | 2.6359 | 7.2941 | 18 | 302 | positive regulation of cell activation |
| GO:0007249 | 5e-04 | 2.8011 | 6.1107 | 16 | 253 | I-kappaB kinase/NF-kappaB signaling |
| GO:0097323 | 6e-04 | Inf | 0.0483 | 2 | 2 | B cell adhesion |
| GO:1904209 | 6e-04 | Inf | 0.0483 | 2 | 2 | positive regulation of chemokine (C-C motif) ligand 2 secretion |
| GO:2000458 | 6e-04 | Inf | 0.0483 | 2 | 2 | regulation of astrocyte chemotaxis |
| GO:0042116 | 6e-04 | 5.3145 | 1.4733 | 7 | 61 | macrophage activation |
| GO:0072676 | 7e-04 | 6.3806 | 1.0732 | 6 | 45 | lymphocyte migration |
| GO:0016192 | 7e-04 | 1.611 | 42.8712 | 64 | 1775 | vesicle-mediated transport |
| GO:1903039 | 7e-04 | 2.9107 | 5.1445 | 14 | 213 | positive regulation of leukocyte cell-cell adhesion |
| GO:2000401 | 7e-04 | 6.2969 | 1.0869 | 6 | 45 | regulation of lymphocyte migration |
| GO:0043615 | 7e-04 | 24.4211 | 0.1932 | 3 | 8 | astrocyte cell migration |
| GO:1902715 | 7e-04 | 24.4211 | 0.1932 | 3 | 8 | positive regulation of interferon-gamma secretion |
| GO:0002440 | 8e-04 | 3.1952 | 4.0335 | 12 | 167 | production of molecular mediator of immune response |
| GO:0031348 | 8e-04 | 3.1952 | 4.0335 | 12 | 167 | negative regulation of defense response |
| GO:0033993 | 8e-04 | 1.8516 | 21.2786 | 37 | 881 | response to lipid |
| GO:0007155 | 8e-04 | 1.8341 | 22.1069 | 38 | 937 | cell adhesion |
| GO:0002521 | 9e-04 | 2.1915 | 11.1344 | 23 | 461 | leukocyte differentiation |
| GO:0051674 | 9e-04 | 1.6577 | 34.2487 | 53 | 1418 | localization of cell |
| GO:0060333 | 0.001 | 4.2643 | 2.053 | 8 | 85 | interferon-gamma-mediated signaling pathway |
| GO:0002688 | 0.0011 | 3.8133 | 2.5602 | 9 | 106 | regulation of leukocyte chemotaxis |
| GO:0002369 | 0.0011 | 7.2951 | 0.797 | 5 | 33 | T cell cytokine production |
| GO:0022408 | 0.0012 | 3.2141 | 3.6712 | 11 | 152 | negative regulation of cell-cell adhesion |
| GO:0010818 | 0.0014 | 9.5943 | 0.5072 | 4 | 21 | T cell chemotaxis |
| GO:0032729 | 0.0015 | 5.3764 | 1.2469 | 6 | 52 | positive regulation of interferon-gamma production |
| GO:0030183 | 0.0015 | 3.6252 | 2.681 | 9 | 111 | B cell differentiation |
| GO:0050863 | 0.0016 | 2.7661 | 4.9988 | 13 | 210 | regulation of T cell activation |
| GO:0045576 | 0.0017 | 5.2225 | 1.2801 | 6 | 53 | mast cell activation |
| GO:0051251 | 0.0017 | 2.5323 | 6.2797 | 15 | 260 | positive regulation of lymphocyte activation |
| GO:0002277 | 0.0017 | 81.2154 | 0.0725 | 2 | 3 | myeloid dendritic cell activation involved in immune response |
| GO:0051046 | 0.0017 | 1.8791 | 16.8828 | 30 | 699 | regulation of secretion |
| GO:0071346 | 0.0019 | 5.0897 | 1.3081 | 6 | 55 | cellular response to interferon-gamma |
| GO:1903532 | 0.002 | 2.2758 | 8.3569 | 18 | 346 | positive regulation of secretion by cell |
| GO:0016553 | 0.002 | 15.2603 | 0.2657 | 3 | 11 | base conversion or substitution editing |
| GO:0046133 | 0.002 | 15.2603 | 0.2657 | 3 | 11 | pyrimidine ribonucleoside catabolic process |
| GO:0002250 | 0.002 | 2.4856 | 6.3889 | 15 | 268 | adaptive immune response |
| GO:0032196 | 0.0021 | 8.5833 | 0.5555 | 4 | 23 | transposition |
| GO:0043903 | 0.0022 | 2.6685 | 5.1687 | 13 | 214 | regulation of symbiosis, encompassing mutualism through parasitism |
| GO:0031663 | 0.0023 | 6.0486 | 0.9355 | 5 | 39 | lipopolysaccharide-mediated signaling pathway |
| GO:2000406 | 0.0024 | 8.1536 | 0.5797 | 4 | 24 | positive regulation of T cell migration |
| GO:0090087 | 0.0024 | 1.7957 | 18.815 | 32 | 779 | regulation of peptide transport |
| GO:0050868 | 0.0026 | 3.6454 | 2.367 | 8 | 98 | negative regulation of T cell activation |
| GO:0046651 | 0.0026 | 4.7608 | 1.3874 | 6 | 59 | lymphocyte proliferation |
| GO:0002699 | 0.0026 | 2.8836 | 4.0577 | 11 | 168 | positive regulation of immune effector process |
| GO:0048534 | 0.0026 | 1.7552 | 20.4574 | 34 | 847 | hematopoietic or lymphoid organ development |
| GO:0006909 | 0.0026 | 2.6029 | 5.2895 | 13 | 219 | phagocytosis |
| GO:0006959 | 0.0026 | 2.6029 | 5.2895 | 13 | 219 | humoral immune response |
| GO:0002694 | 0.0028 | 2.318 | 7.2826 | 16 | 309 | regulation of leukocyte activation |
| GO:2000147 | 0.0029 | 2.0528 | 10.7722 | 21 | 446 | positive regulation of cell motility |
| GO:0002821 | 0.0032 | 3.9265 | 1.9322 | 7 | 80 | positive regulation of adaptive immune response |
| GO:0002292 | 0.0032 | 4.5435 | 1.4492 | 6 | 60 | T cell differentiation involved in immune response |
| GO:0032677 | 0.0032 | 4.5435 | 1.4492 | 6 | 60 | regulation of interleukin-8 production |
| GO:0070201 | 0.0032 | 1.7611 | 19.1532 | 32 | 793 | regulation of establishment of protein localization |
| GO:0001816 | 0.0032 | 5.5167 | 1.0086 | 5 | 45 | cytokine production |
| GO:0046633 | 0.0033 | 7.4114 | 0.628 | 4 | 26 | alpha-beta T cell proliferation |
| GO:0031665 | 0.0033 | 12.2067 | 0.314 | 3 | 13 | negative regulation of lipopolysaccharide-mediated signaling pathway |
| GO:0035745 | 0.0033 | 12.2067 | 0.314 | 3 | 13 | T-helper 2 cell cytokine production |
| GO:1905050 | 0.0033 | 12.2067 | 0.314 | 3 | 13 | positive regulation of metallopeptidase activity |
| GO:0048386 | 0.0034 | 40.6051 | 0.0966 | 2 | 4 | positive regulation of retinoic acid receptor signaling pathway |
| GO:2000391 | 0.0034 | 40.6051 | 0.0966 | 2 | 4 | positive regulation of neutrophil extravasation |
| GO:0002698 | 0.0037 | 3.4162 | 2.5119 | 8 | 104 | negative regulation of immune effector process |
| GO:0002548 | 0.0038 | 5.3123 | 1.0476 | 5 | 44 | monocyte chemotaxis |
| GO:0050718 | 0.0038 | 7.0887 | 0.6521 | 4 | 27 | positive regulation of interleukin-1 beta secretion |
| GO:0050900 | 0.0038 | 2.596 | 4.8852 | 12 | 210 | leukocyte migration |
| GO:0031347 | 0.0039 | 1.9285 | 12.5381 | 23 | 530 | regulation of defense response |
| GO:0032760 | 0.0041 | 4.3035 | 1.5216 | 6 | 63 | positive regulation of tumor necrosis factor production |
| GO:0002757 | 0.0042 | 1.9809 | 11.1344 | 21 | 461 | immune response-activating signal transduction |
| GO:0035587 | 0.0043 | 6.793 | 0.6763 | 4 | 28 | purinergic receptor signaling pathway |
| GO:0043304 | 0.0043 | 6.793 | 0.6763 | 4 | 28 | regulation of mast cell degranulation |
| GO:0032418 | 0.0044 | 4.2291 | 1.5458 | 6 | 64 | lysosome localization |
| GO:0070661 | 0.0045 | 4.2005 | 1.5531 | 6 | 66 | leukocyte proliferation |
| GO:0051222 | 0.0045 | 1.9671 | 11.2069 | 21 | 464 | positive regulation of protein transport |
| GO:0002703 | 0.0049 | 2.7943 | 3.792 | 10 | 157 | regulation of leukocyte mediated immunity |
| GO:0032743 | 0.0049 | 6.5208 | 0.7004 | 4 | 29 | positive regulation of interleukin-2 production |
| GO:0045785 | 0.005 | 2.0693 | 9.1298 | 18 | 378 | positive regulation of cell adhesion |
| GO:0050729 | 0.0052 | 3.2141 | 2.6568 | 8 | 110 | positive regulation of inflammatory response |
| GO:0018377 | 0.0055 | 27.0684 | 0.1208 | 2 | 5 | protein myristoylation |
| GO:0043308 | 0.0055 | 27.0684 | 0.1208 | 2 | 5 | eosinophil degranulation |
| GO:1901078 | 0.0055 | 27.0684 | 0.1208 | 2 | 5 | negative regulation of relaxation of muscle |
| GO:1901509 | 0.0055 | 27.0684 | 0.1208 | 2 | 5 | regulation of endothelial tube morphogenesis |
| GO:0042110 | 0.0055 | 2.9265 | 3.2622 | 9 | 140 | T cell activation |
| GO:0042742 | 0.0059 | 2.3484 | 5.8208 | 13 | 241 | defense response to bacterium |
| GO:0008360 | 0.0061 | 2.8841 | 3.3089 | 9 | 137 | regulation of cell shape |
| GO:0071347 | 0.0061 | 3.4513 | 2.1738 | 7 | 90 | cellular response to interleukin-1 |
| GO:0003159 | 0.0062 | 9.388 | 0.3864 | 3 | 16 | morphogenesis of an endothelium |
| GO:0034113 | 0.0064 | 4.6377 | 1.1835 | 5 | 49 | heterotypic cell-cell adhesion |
| GO:0046635 | 0.0064 | 4.6377 | 1.1835 | 5 | 49 | positive regulation of alpha-beta T cell activation |
| GO:0045089 | 0.0068 | 2.097 | 7.9946 | 16 | 331 | positive regulation of innate immune response |
| GO:0032722 | 0.007 | 4.5343 | 1.2076 | 5 | 50 | positive regulation of chemokine production |
| GO:0045123 | 0.007 | 4.5343 | 1.2076 | 5 | 50 | cellular extravasation |
| GO:0051924 | 0.0071 | 2.3846 | 5.2895 | 12 | 219 | regulation of calcium ion transport |
| GO:0045076 | 0.0074 | 8.7169 | 0.4106 | 3 | 17 | regulation of interleukin-2 biosynthetic process |
| GO:0002532 | 0.0076 | 4.4355 | 1.2318 | 5 | 51 | production of molecular mediator involved in inflammatory response |
| GO:0045071 | 0.0076 | 4.4355 | 1.2318 | 5 | 51 | negative regulation of viral genome replication |
| GO:0035891 | 0.0079 | 5.62 | 0.797 | 4 | 33 | exit from host cell |
| GO:0052126 | 0.0079 | 5.62 | 0.797 | 4 | 33 | movement in host environment |
| GO:0072529 | 0.0079 | 5.62 | 0.797 | 4 | 33 | pyrimidine-containing compound catabolic process |
| GO:0043307 | 0.0082 | 20.3 | 0.1449 | 2 | 6 | eosinophil activation |
| GO:0070383 | 0.0082 | 20.3 | 0.1449 | 2 | 6 | DNA cytosine deamination |
| GO:2000321 | 0.0082 | 20.3 | 0.1449 | 2 | 6 | positive regulation of T-helper 17 cell differentiation |
| GO:0022407 | 0.0082 | 2.2466 | 6.0664 | 13 | 256 | regulation of cell-cell adhesion |
| GO:0002576 | 0.0083 | 2.9518 | 2.8742 | 8 | 119 | platelet degranulation |
| GO:0002822 | 0.0083 | 2.9518 | 2.8742 | 8 | 119 | regulation of adaptive immune response based on somatic recombination of immune receptors built from immunoglobulin superfamily domains |
| GO:0030814 | 0.0083 | 2.7333 | 3.478 | 9 | 144 | regulation of cAMP metabolic process |
| GO:0040012 | 0.0086 | 1.6343 | 20.5057 | 32 | 849 | regulation of locomotion |
| GO:0051234 | 0.0087 | 1.3004 | 117.8898 | 140 | 4881 | establishment of localization |
| GO:0034143 | 0.0087 | 8.1352 | 0.4348 | 3 | 18 | regulation of toll-like receptor 4 signaling pathway |
| GO:0007259 | 0.0087 | 2.549 | 4.1301 | 10 | 171 | JAK-STAT cascade |
| GO:0007194 | 0.0088 | 5.4323 | 0.8212 | 4 | 34 | negative regulation of adenylate cyclase activity |
| GO:0034122 | 0.0088 | 5.4323 | 0.8212 | 4 | 34 | negative regulation of toll-like receptor signaling pathway |
| GO:0071345 | 0.0088 | 1.7254 | 15.7663 | 26 | 674 | cellular response to cytokine stimulus |
| GO:0043902 | 0.0091 | 2.5331 | 4.1543 | 10 | 172 | positive regulation of multi-organism process |
| GO:0009187 | 0.0092 | 2.4034 | 4.8064 | 11 | 199 | cyclic nucleotide metabolic process |
| GO:1901136 | 0.0094 | 2.5174 | 4.1784 | 10 | 173 | carbohydrate derivative catabolic process |
| GO:0009967 | 0.0095 | 1.4782 | 34.8995 | 49 | 1452 | positive regulation of signal transduction |
| GOMFID | Pvalue | OddsRatio | ExpCount | Count | Size | Term |
| GO:0002263 | 0 | 3.4175 | 15.4529 | 46 | 660 | cell activation involved in immune response |
| GO:0071216 | 0 | 5.702 | 4.472 | 22 | 191 | cellular response to biotic stimulus |
| GO:0045321 | 0 | 2.921 | 14.9455 | 39 | 664 | leukocyte activation |
| GO:0045087 | 0 | 3.3705 | 9.922 | 30 | 435 | innate immune response |
| GO:0002237 | 0 | 3.6256 | 7.6562 | 25 | 327 | response to molecule of bacterial origin |
| GO:0071222 | 0 | 6.2682 | 2.5753 | 14 | 112 | cellular response to lipopolysaccharide |
| GO:0002275 | 0 | 2.936 | 12.02 | 32 | 516 | myeloid cell activation involved in immune response |
| GO:0002444 | 0 | 2.8825 | 12.2218 | 32 | 522 | myeloid leukocyte mediated immunity |
| GO:0032651 | 0 | 8.5405 | 1.4048 | 10 | 60 | regulation of interleukin-1 beta production |
| GO:0032692 | 0 | 15.6367 | 0.6087 | 7 | 26 | negative regulation of interleukin-1 production |
| GO:0090026 | 0 | 21.1738 | 0.4214 | 6 | 18 | positive regulation of monocyte chemotaxis |
| GO:0050713 | 0 | 35.2089 | 0.2575 | 5 | 11 | negative regulation of interleukin-1 beta secretion |
| GO:0002285 | 0 | 4.645 | 3.6057 | 15 | 154 | lymphocyte activation involved in immune response |
| GO:0050704 | 0 | 9.7174 | 1.0068 | 8 | 43 | regulation of interleukin-1 secretion |
| GO:0042119 | 0 | 2.7285 | 11.1682 | 28 | 477 | neutrophil activation |
| GO:0007166 | 0 | 1.7276 | 58.0789 | 89 | 2549 | cell surface receptor signaling pathway |
| GO:0043312 | 0 | 2.6788 | 10.9341 | 27 | 467 | neutrophil degranulation |
| GO:0023052 | 0 | 1.5539 | 142.1898 | 182 | 6073 | signaling |
| GO:0050707 | 0 | 6.0415 | 1.8842 | 10 | 82 | regulation of cytokine secretion |
| GO:0032940 | 0 | 2.3179 | 16.4368 | 35 | 732 | secretion by cell |
| GO:0045055 | 0 | 2.2878 | 16.5767 | 35 | 708 | regulated exocytosis |
| GO:0071675 | 0 | 8.7299 | 0.96 | 7 | 41 | regulation of mononuclear cell migration |
| GO:0060326 | 0 | 3.1936 | 6.1109 | 18 | 261 | cell chemotaxis |
| GO:0050778 | 0 | 2.2712 | 15.687 | 33 | 670 | positive regulation of immune response |
| GO:0051707 | 0 | 2.8735 | 7.9029 | 21 | 351 | response to other organism |
| GO:0007154 | 0 | 1.5117 | 142.7049 | 180 | 6095 | cell communication |
| GO:0070374 | 1e-04 | 3.5978 | 4.5422 | 15 | 194 | positive regulation of ERK1 and ERK2 cascade |
| GO:0006955 | 1e-04 | 3.1508 | 6.2031 | 18 | 311 | immune response |
| GO:0035589 | 1e-04 | 28.0922 | 0.2341 | 4 | 10 | G-protein coupled purinergic nucleotide receptor signaling pathway |
| GO:0032946 | 1e-04 | 4.2745 | 3.0906 | 12 | 132 | positive regulation of mononuclear cell proliferation |
| GO:0050670 | 1e-04 | 3.5183 | 4.6359 | 15 | 198 | regulation of lymphocyte proliferation |
| GO:0034097 | 1e-04 | 2.0142 | 22.5471 | 42 | 963 | response to cytokine |
| GO:0002791 | 1e-04 | 2.5388 | 10.1614 | 24 | 434 | regulation of peptide secretion |
| GO:0070098 | 1e-04 | 5.3913 | 1.8731 | 9 | 80 | chemokine-mediated signaling pathway |
| GO:0002322 | 1e-04 | 63.0557 | 0.1171 | 3 | 5 | B cell proliferation involved in immune response |
| GO:0070663 | 1e-04 | 3.3165 | 4.8934 | 15 | 209 | regulation of leukocyte proliferation |
| GO:0097530 | 1e-04 | 4.2269 | 2.8564 | 11 | 122 | granulocyte migration |
| GO:0042330 | 1e-04 | 2.2859 | 13.1349 | 28 | 561 | taxis |
| GO:0048518 | 2e-04 | 1.4897 | 113.6951 | 146 | 4965 | positive regulation of biological process |
| GO:1902187 | 2e-04 | 18.7246 | 0.3044 | 4 | 13 | negative regulation of viral release from host cell |
| GO:0033993 | 2e-04 | 1.978 | 20.6272 | 38 | 881 | response to lipid |
| GO:0048525 | 2e-04 | 4.8428 | 2.0604 | 9 | 88 | negative regulation of viral process |
| GO:0050867 | 3e-04 | 2.7254 | 7.0709 | 18 | 302 | positive regulation of cell activation |
| GO:0050900 | 3e-04 | 3.0232 | 5.3266 | 15 | 235 | leukocyte migration |
| GO:0002313 | 3e-04 | 15.3182 | 0.3512 | 4 | 15 | mature B cell differentiation involved in immune response |
| GO:2000484 | 3e-04 | 15.3182 | 0.3512 | 4 | 15 | positive regulation of interleukin-8 secretion |
| GO:0050714 | 4e-04 | 2.9885 | 5.3851 | 15 | 230 | positive regulation of protein secretion |
| GO:0050863 | 4e-04 | 2.6679 | 7.2113 | 18 | 308 | regulation of T cell activation |
| GO:0042102 | 4e-04 | 4.9535 | 1.7907 | 8 | 77 | positive regulation of T cell proliferation |
| GO:0001816 | 5e-04 | 3.1812 | 4.3878 | 13 | 200 | cytokine production |
| GO:1903039 | 5e-04 | 3.0084 | 4.9871 | 14 | 213 | positive regulation of leukocyte cell-cell adhesion |
| GO:0042116 | 5e-04 | 5.4896 | 1.4282 | 7 | 61 | macrophage activation |
| GO:0097323 | 5e-04 | Inf | 0.0468 | 2 | 2 | B cell adhesion |
| GO:2000458 | 5e-04 | Inf | 0.0468 | 2 | 2 | regulation of astrocyte chemotaxis |
| GO:0002687 | 6e-04 | 3.8322 | 2.833 | 10 | 121 | positive regulation of leukocyte migration |
| GO:0072676 | 6e-04 | 6.5754 | 1.0426 | 6 | 45 | lymphocyte migration |
| GO:0002521 | 6e-04 | 2.267 | 10.7936 | 23 | 461 | leukocyte differentiation |
| GO:0002440 | 6e-04 | 3.3019 | 3.91 | 12 | 167 | production of molecular mediator of immune response |
| GO:0002831 | 6e-04 | 3.7978 | 2.8564 | 10 | 122 | regulation of response to biotic stimulus |
| GO:0043615 | 7e-04 | 25.2175 | 0.1873 | 3 | 8 | astrocyte cell migration |
| GO:0044351 | 7e-04 | 25.2175 | 0.1873 | 3 | 8 | macropinocytosis |
| GO:1902715 | 7e-04 | 25.2175 | 0.1873 | 3 | 8 | positive regulation of interferon-gamma secretion |
| GO:1903900 | 9e-04 | 3.6033 | 2.9969 | 10 | 128 | regulation of viral life cycle |
| GO:0002369 | 9e-04 | 7.5343 | 0.7726 | 5 | 33 | T cell cytokine production |
| GO:0002819 | 0.001 | 3.5428 | 3.0437 | 10 | 130 | regulation of adaptive immune response |
| GO:0002682 | 0.001 | 1.93 | 17.1002 | 31 | 770 | regulation of immune system process |
| GO:0030593 | 0.0011 | 4.2392 | 2.0604 | 8 | 88 | neutrophil chemotaxis |
| GO:0032101 | 0.0011 | 1.945 | 16.366 | 30 | 699 | regulation of response to external stimulus |
| GO:0034122 | 0.0011 | 7.274 | 0.7961 | 5 | 34 | negative regulation of toll-like receptor signaling pathway |
| GO:0002532 | 0.0012 | 5.6346 | 1.1941 | 6 | 51 | production of molecular mediator involved in inflammatory response |
| GO:0071347 | 0.0012 | 4.1353 | 2.1072 | 8 | 90 | cellular response to interleukin-1 |
| GO:0051251 | 0.0012 | 2.6176 | 6.0875 | 15 | 260 | positive regulation of lymphocyte activation |
| GO:0032729 | 0.0013 | 5.5546 | 1.2085 | 6 | 52 | positive regulation of interferon-gamma production |
| GO:0010818 | 0.0013 | 9.908 | 0.4917 | 4 | 21 | T cell chemotaxis |
| GO:0002757 | 0.0013 | 2.1573 | 10.7936 | 22 | 461 | immune response-activating signal transduction |
| GO:0031349 | 0.0013 | 2.4328 | 7.4077 | 17 | 321 | positive regulation of defense response |
| GO:0046631 | 0.0013 | 3.6729 | 2.6457 | 9 | 113 | alpha-beta T cell activation |
| GO:0006954 | 0.0014 | 2.0775 | 12.2314 | 24 | 532 | inflammatory response |
| GO:0051047 | 0.0014 | 2.2841 | 8.8035 | 19 | 376 | positive regulation of secretion |
| GO:0022610 | 0.0015 | 1.6556 | 30.9291 | 48 | 1321 | biological adhesion |
| GO:0022407 | 0.0016 | 2.2139 | 9.5527 | 20 | 408 | regulation of cell-cell adhesion |
| GO:0002277 | 0.0016 | 83.8571 | 0.0702 | 2 | 3 | myeloid dendritic cell activation involved in immune response |
| GO:0071346 | 0.0016 | 5.246 | 1.2707 | 6 | 55 | cellular response to interferon-gamma |
| GO:0016553 | 0.0018 | 15.758 | 0.2575 | 3 | 11 | base conversion or substitution editing |
| GO:0046133 | 0.0018 | 15.758 | 0.2575 | 3 | 11 | pyrimidine ribonucleoside catabolic process |
| GO:0072672 | 0.0018 | 15.758 | 0.2575 | 3 | 11 | neutrophil extravasation |
| GO:0050710 | 0.0019 | 5.0695 | 1.3112 | 6 | 56 | negative regulation of cytokine secretion |
| GO:0031663 | 0.002 | 6.2484 | 0.9066 | 5 | 39 | lipopolysaccharide-mediated signaling pathway |
| GO:0006959 | 0.002 | 2.69 | 5.1275 | 13 | 219 | humoral immune response |
| GO:0051924 | 0.002 | 2.69 | 5.1275 | 13 | 219 | regulation of calcium ion transport |
| GO:0030814 | 0.0021 | 3.1698 | 3.3715 | 10 | 144 | regulation of cAMP metabolic process |
| GO:0002697 | 0.0021 | 2.3171 | 7.7498 | 17 | 331 | regulation of immune effector process |
| GO:0071310 | 0.0022 | 1.4819 | 55.3494 | 76 | 2364 | cellular response to organic substance |
| GO:2000406 | 0.0022 | 8.4202 | 0.5619 | 4 | 24 | positive regulation of T cell migration |
| GO:0046651 | 0.0022 | 4.9237 | 1.3433 | 6 | 59 | lymphocyte proliferation |
| GO:0050663 | 0.0022 | 8.3671 | 0.5618 | 4 | 25 | cytokine secretion |
| GO:0016192 | 0.0022 | 1.5454 | 41.5588 | 60 | 1775 | vesicle-mediated transport |
| GO:0051239 | 0.0024 | 1.4479 | 64.3869 | 86 | 2750 | regulation of multicellular organismal process |
| GO:0051607 | 0.0024 | 2.6381 | 5.2212 | 13 | 223 | defense response to virus |
| GO:0090197 | 0.0024 | 14.0062 | 0.281 | 3 | 12 | positive regulation of chemokine secretion |
| GO:1901136 | 0.0026 | 2.8868 | 4.0505 | 11 | 173 | carbohydrate derivative catabolic process |
| GO:0009187 | 0.0026 | 2.7313 | 4.6593 | 12 | 199 | cyclic nucleotide metabolic process |
| GO:0002695 | 0.0027 | 3.0548 | 3.4886 | 10 | 149 | negative regulation of leukocyte activation |
| GO:0002292 | 0.0027 | 4.6928 | 1.4048 | 6 | 60 | T cell differentiation involved in immune response |
| GO:0032677 | 0.0027 | 4.6928 | 1.4048 | 6 | 60 | regulation of interleukin-8 production |
| GO:0048534 | 0.0029 | 1.7567 | 19.8312 | 33 | 847 | hematopoietic or lymphoid organ development |
| GO:0002218 | 0.003 | 2.3714 | 6.6728 | 15 | 285 | activation of innate immune response |
| GO:0031665 | 0.0031 | 12.6048 | 0.3044 | 3 | 13 | negative regulation of lipopolysaccharide-mediated signaling pathway |
| GO:0035745 | 0.0031 | 12.6048 | 0.3044 | 3 | 13 | T-helper 2 cell cytokine production |
| GO:0045088 | 0.0032 | 2.1198 | 9.4356 | 19 | 403 | regulation of innate immune response |
| GO:0050921 | 0.0032 | 3.2068 | 2.9969 | 9 | 128 | positive regulation of chemotaxis |
| GO:0048386 | 0.0032 | 41.9259 | 0.0937 | 2 | 4 | positive regulation of retinoic acid receptor signaling pathway |
| GO:0051223 | 0.0032 | 1.796 | 17.6069 | 30 | 752 | regulation of protein transport |
| GO:0002548 | 0.0033 | 5.4892 | 1.0151 | 5 | 44 | monocyte chemotaxis |
| GO:0050718 | 0.0034 | 7.3205 | 0.6322 | 4 | 27 | positive regulation of interleukin-1 beta secretion |
| GO:0002688 | 0.0034 | 3.4567 | 2.4818 | 8 | 106 | regulation of leukocyte chemotaxis |
| GO:0032760 | 0.0035 | 4.445 | 1.475 | 6 | 63 | positive regulation of tumor necrosis factor production |
| GO:0002704 | 0.0035 | 5.4055 | 1.0302 | 5 | 44 | negative regulation of leukocyte mediated immunity |
| GO:0048870 | 0.0037 | 1.5659 | 33.2002 | 49 | 1418 | cell motility |
| GO:0060333 | 0.0038 | 3.7947 | 1.9901 | 7 | 85 | interferon-gamma-mediated signaling pathway |
| GO:0070661 | 0.0039 | 4.3443 | 1.5037 | 6 | 66 | leukocyte proliferation |
| GO:2000401 | 0.0039 | 5.27 | 1.0536 | 5 | 45 | regulation of lymphocyte migration |
| GO:0035587 | 0.0039 | 7.0151 | 0.6556 | 4 | 28 | purinergic receptor signaling pathway |
| GO:0002449 | 0.0042 | 2.5646 | 4.9402 | 12 | 211 | lymphocyte mediated immunity |
| GO:0050729 | 0.0043 | 3.3203 | 2.5755 | 8 | 110 | positive regulation of inflammatory response |
| GO:0032743 | 0.0044 | 6.734 | 0.679 | 4 | 29 | positive regulation of interleukin-2 production |
| GO:0051049 | 0.0045 | 1.4934 | 42.0505 | 59 | 1796 | regulation of transport |
| GO:0030183 | 0.0046 | 3.2878 | 2.5989 | 8 | 111 | B cell differentiation |
| GO:0002460 | 0.0046 | 3.0152 | 3.1718 | 9 | 137 | adaptive immune response based on somatic recombination of immune receptors built from immunoglobulin superfamily domains |
| GO:0043903 | 0.0047 | 2.526 | 5.0105 | 12 | 214 | regulation of symbiosis, encompassing mutualism through parasitism |
| GO:1903555 | 0.0048 | 3.256 | 2.6223 | 8 | 112 | regulation of tumor necrosis factor superfamily cytokine production |
| GO:0008360 | 0.005 | 2.9797 | 3.2076 | 9 | 137 | regulation of cell shape |
| GO:0006950 | 0.005 | 1.3656 | 84.4054 | 106 | 3605 | response to stress |
| GO:0043308 | 0.0052 | 27.9489 | 0.1171 | 2 | 5 | eosinophil degranulation |
| GO:0048550 | 0.0052 | 27.9489 | 0.1171 | 2 | 5 | negative regulation of pinocytosis |
| GO:1901078 | 0.0052 | 27.9489 | 0.1171 | 2 | 5 | negative regulation of relaxation of muscle |
| GO:1901509 | 0.0052 | 27.9489 | 0.1171 | 2 | 5 | regulation of endothelial tube morphogenesis |
| GO:0009967 | 0.0053 | 1.5334 | 33.8257 | 49 | 1452 | positive regulation of signal transduction |
| GO:0002694 | 0.0054 | 2.2157 | 7.1096 | 15 | 309 | regulation of leukocyte activation |
| GO:0006909 | 0.0056 | 2.4642 | 5.1275 | 12 | 219 | phagocytosis |
| GO:0003159 | 0.0057 | 9.6941 | 0.3746 | 3 | 16 | morphogenesis of an endothelium |
| GO:0060457 | 0.0057 | 9.6941 | 0.3746 | 3 | 16 | negative regulation of digestive system process |
| GO:0001819 | 0.0057 | 2.2014 | 7.152 | 15 | 313 | positive regulation of cytokine production |
| GO:0031348 | 0.006 | 2.7015 | 3.91 | 10 | 167 | negative regulation of defense response |
| GO:1903530 | 0.006 | 1.9478 | 10.763 | 20 | 467 | regulation of secretion by cell |
| GO:0007249 | 0.0066 | 2.5231 | 4.5904 | 11 | 198 | I-kappaB kinase/NF-kappaB signaling |
| GO:0032479 | 0.0069 | 3.0493 | 2.7862 | 8 | 119 | regulation of type I interferon production |
| GO:0035891 | 0.0071 | 5.8037 | 0.7726 | 4 | 33 | exit from host cell |
| GO:0052126 | 0.0071 | 5.8037 | 0.7726 | 4 | 33 | movement in host environment |
| GO:0072529 | 0.0071 | 5.8037 | 0.7726 | 4 | 33 | pyrimidine-containing compound catabolic process |
| GO:0007259 | 0.0071 | 2.6337 | 4.0037 | 10 | 171 | JAK-STAT cascade |
| GO:0002221 | 0.0077 | 2.6011 | 4.0505 | 10 | 173 | pattern recognition receptor signaling pathway |
| GO:0043307 | 0.0077 | 20.9603 | 0.1405 | 2 | 6 | eosinophil activation |
| GO:0070383 | 0.0077 | 20.9603 | 0.1405 | 2 | 6 | DNA cytosine deamination |
| GO:0090186 | 0.0077 | 20.9603 | 0.1405 | 2 | 6 | regulation of pancreatic juice secretion |
| GO:2000321 | 0.0077 | 20.9603 | 0.1405 | 2 | 6 | positive regulation of T-helper 17 cell differentiation |
| GO:0045576 | 0.0078 | 4.3894 | 1.2409 | 5 | 53 | mast cell activation |
| GO:0007194 | 0.0079 | 5.6099 | 0.7961 | 4 | 34 | negative regulation of adenylate cyclase activity |
| GO:0034143 | 0.008 | 8.4005 | 0.4214 | 3 | 18 | regulation of toll-like receptor 4 signaling pathway |
| GO:0045785 | 0.008 | 2.0094 | 8.8503 | 17 | 378 | positive regulation of cell adhesion |
| GO:0098657 | 0.0086 | 1.7286 | 15.7338 | 26 | 672 | import into cell |
| GO:1903531 | 0.0086 | 2.5536 | 4.1208 | 10 | 176 | negative regulation of secretion by cell |
| GO:0002824 | 0.0087 | 3.6165 | 1.7794 | 6 | 76 | positive regulation of adaptive immune response based on somatic recombination of immune receptors built from immunoglobulin superfamily domains |
| GO:0016525 | 0.0091 | 3.1797 | 2.3413 | 7 | 100 | negative regulation of angiogenesis |
| GO:0043124 | 0.0091 | 4.2133 | 1.2877 | 5 | 55 | negative regulation of I-kappaB kinase/NF-kappaB signaling |
| GO:0010529 | 0.0093 | 7.875 | 0.4449 | 3 | 19 | negative regulation of transposition |
| GO:0046641 | 0.0093 | 7.875 | 0.4449 | 3 | 19 | positive regulation of alpha-beta T cell proliferation |
| GO:0098542 | 0.0096 | 2.285 | 5.5026 | 12 | 240 | defense response to other organism |
| GO:0050829 | 0.0099 | 3.5156 | 1.8262 | 6 | 78 | defense response to Gram-negative bacterium |
| GOMFID | Pvalue | OddsRatio | ExpCount | Count | Size | Term |
| GO:0007156 | 0 | 7.6114 | 2.2758 | 15 | 152 | homophilic cell adhesion via plasma membrane adhesion molecules |
| GO:1901623 | 2e-04 | 15.7224 | 0.3144 | 4 | 21 | regulation of lymphocyte chemotaxis |
| GO:0002548 | 3e-04 | 7.2021 | 0.9283 | 6 | 62 | monocyte chemotaxis |
| GO:0030593 | 4e-04 | 5.8245 | 1.3176 | 7 | 88 | neutrophil chemotaxis |
| GO:1903427 | 5e-04 | 12.7244 | 0.3743 | 4 | 25 | negative regulation of reactive oxygen species biosynthetic process |
| GO:0097530 | 5e-04 | 4.74 | 1.8266 | 8 | 122 | granulocyte migration |
| GO:0003095 | 7e-04 | 132.6639 | 0.0449 | 2 | 3 | pressure natriuresis |
| GO:0019249 | 7e-04 | 132.6639 | 0.0449 | 2 | 3 | lactate biosynthetic process |
| GO:2000502 | 7e-04 | 132.6639 | 0.0449 | 2 | 3 | negative regulation of natural killer cell chemotaxis |
| GO:0098609 | 7e-04 | 2.2079 | 11.6784 | 24 | 780 | cell-cell adhesion |
| GO:0016339 | 8e-04 | 11.1318 | 0.4192 | 4 | 28 | calcium-dependent cell-cell adhesion via plasma membrane cell adhesion molecules |
| GO:0070098 | 0.0013 | 5.4441 | 1.1978 | 6 | 80 | chemokine-mediated signaling pathway |
| GO:0036101 | 0.0013 | 66.3278 | 0.0599 | 2 | 4 | leukotriene B4 catabolic process |
| GO:1901668 | 0.0013 | 66.3278 | 0.0599 | 2 | 4 | regulation of superoxide dismutase activity |
| GO:0090280 | 0.0016 | 15.3596 | 0.2396 | 3 | 16 | positive regulation of calcium ion import |
| GO:0060326 | 0.002 | 2.9846 | 3.9078 | 11 | 261 | cell chemotaxis |
| GO:0006032 | 0.0022 | 44.2158 | 0.0749 | 2 | 5 | chitin catabolic process |
| GO:0075525 | 0.0022 | 44.2158 | 0.0749 | 2 | 5 | viral translational termination-reinitiation |
| GO:1901523 | 0.0022 | 44.2158 | 0.0749 | 2 | 5 | icosanoid catabolic process |
| GO:0009617 | 0.0025 | 2.2827 | 7.8904 | 17 | 527 | response to bacterium |
| GO:2000138 | 0.0032 | 33.1598 | 0.0898 | 2 | 6 | positive regulation of cell proliferation involved in heart morphogenesis |
| GO:0046697 | 0.0036 | 11.0896 | 0.3144 | 3 | 21 | decidualization |
| GO:0030728 | 0.0041 | 10.5053 | 0.3294 | 3 | 22 | ovulation |
| GO:0001906 | 0.0044 | 3.6462 | 2.0362 | 7 | 136 | cell killing |
| GO:0036302 | 0.0045 | 26.5261 | 0.1048 | 2 | 7 | atrioventricular canal development |
| GO:0048733 | 0.0045 | 26.5261 | 0.1048 | 2 | 7 | sebaceous gland development |
| GO:1901299 | 0.0059 | 22.1037 | 0.1198 | 2 | 8 | negative regulation of hydrogen peroxide-mediated programmed cell death |
| GO:1903862 | 0.0059 | 22.1037 | 0.1198 | 2 | 8 | positive regulation of oxidative phosphorylation |
| GO:0019369 | 0.0061 | 5.9291 | 0.7336 | 4 | 49 | arachidonic acid metabolic process |
| GO:0044703 | 0.0061 | 1.8371 | 13.8344 | 24 | 924 | multi-organism reproductive process |
| GO:0006140 | 0.0062 | 2.6798 | 3.9227 | 10 | 262 | regulation of nucleotide metabolic process |
| GO:0045682 | 0.0066 | 4.5177 | 1.1828 | 5 | 79 | regulation of epidermis development |
| GO:0045671 | 0.0067 | 8.6761 | 0.3893 | 3 | 26 | negative regulation of osteoclast differentiation |
| GO:0007267 | 0.0069 | 1.642 | 22.7728 | 35 | 1521 | cell-cell signaling |
| GO:0072676 | 0.0071 | 4.4335 | 1.2034 | 5 | 81 | lymphocyte migration |
| GO:0033234 | 0.0075 | 18.9449 | 0.1348 | 2 | 9 | negative regulation of protein sumoylation |
| GO:0060050 | 0.0075 | 18.9449 | 0.1348 | 2 | 9 | positive regulation of protein glycosylation |
| GO:2000402 | 0.0075 | 18.9449 | 0.1348 | 2 | 9 | negative regulation of lymphocyte migration |
| GO:0045087 | 0.0076 | 1.8508 | 12.5468 | 22 | 838 | innate immune response |
| GO:1902850 | 0.008 | 3.6541 | 1.7368 | 6 | 116 | microtubule cytoskeleton organization involved in mitosis |
| GO:0046605 | 0.0081 | 5.4438 | 0.7935 | 4 | 53 | regulation of centrosome cycle |
| GO:0034219 | 0.0091 | 7.6736 | 0.4342 | 3 | 29 | carbohydrate transmembrane transport |
| GO:0090322 | 0.0091 | 7.6736 | 0.4342 | 3 | 29 | regulation of superoxide metabolic process |
| GO:0042267 | 0.0092 | 5.2296 | 0.8235 | 4 | 55 | natural killer cell mediated cytotoxicity |
| GO:1903578 | 0.0094 | 4.1254 | 1.2876 | 5 | 86 | regulation of ATP metabolic process |
| GO:0002687 | 0.0098 | 3.4941 | 1.8116 | 6 | 121 | positive regulation of leukocyte migration |
| GO:0034308 | 0.0098 | 5.1287 | 0.8384 | 4 | 56 | primary alcohol metabolic process |
| GO:0050830 | 0.0099 | 4.0749 | 1.3026 | 5 | 87 | defense response to Gram-positive bacterium |
| GOMFID | Pvalue | OddsRatio | ExpCount | Count | Size | Term |
| GO:0050906 | 0 | 6.3399 | 3.7494 | 20 | 461 | detection of stimulus involved in sensory perception |
| GO:0050911 | 0 | 7.0631 | 3.0092 | 18 | 370 | detection of chemical stimulus involved in sensory perception of smell |
| GO:0009593 | 0 | 6.1266 | 3.6518 | 19 | 449 | detection of chemical stimulus |
| GO:0007606 | 0 | 5.8737 | 3.7982 | 19 | 467 | sensory perception of chemical stimulus |
| GO:0007186 | 0 | 3.7397 | 10.1826 | 31 | 1252 | G-protein coupled receptor signaling pathway |
| GO:0070098 | 0 | 12.2932 | 0.6506 | 7 | 80 | chemokine-mediated signaling pathway |
| GO:0050877 | 0 | 2.9404 | 9.841 | 25 | 1210 | nervous system process |
| GO:0032501 | 0 | 2.056 | 56.6876 | 80 | 6970 | multicellular organismal process |
| GO:0002407 | 0 | 23.9241 | 0.2033 | 4 | 25 | dendritic cell chemotaxis |
| GO:0060326 | 1e-04 | 5.175 | 2.1227 | 10 | 261 | cell chemotaxis |
| GO:0072676 | 1e-04 | 9.0782 | 0.732 | 6 | 90 | lymphocyte migration |
| GO:0061368 | 2e-04 | 247.6462 | 0.0244 | 2 | 3 | behavioral response to formalin induced pain |
| GO:0051023 | 3e-04 | 28.7746 | 0.1301 | 3 | 16 | regulation of immunoglobulin secretion |
| GO:0006954 | 4e-04 | 3.0275 | 5.441 | 15 | 669 | inflammatory response |
| GO:0042113 | 4e-04 | 4.9048 | 1.7649 | 8 | 217 | B cell activation |
| GO:0006959 | 5e-04 | 5.3627 | 1.4105 | 7 | 177 | humoral immune response |
| GO:0010818 | 6e-04 | 20.7752 | 0.1708 | 3 | 21 | T cell chemotaxis |
| GO:0002377 | 8e-04 | 7.5965 | 0.7157 | 5 | 88 | immunoglobulin production |
| GO:0002286 | 0.001 | 7.1627 | 0.7564 | 5 | 93 | T cell activation involved in immune response |
| GO:0048870 | 0.001 | 2.224 | 11.5327 | 23 | 1418 | cell motility |
| GO:0023052 | 0.0012 | 1.732 | 49.3922 | 67 | 6073 | signaling |
| GO:0010803 | 0.0012 | 9.4605 | 0.4636 | 4 | 57 | regulation of tumor necrosis factor-mediated signaling pathway |
| GO:0007154 | 0.0013 | 1.7219 | 49.5712 | 67 | 6095 | cell communication |
| GO:0002684 | 0.0015 | 2.4529 | 7.58 | 17 | 932 | positive regulation of immune system process |
| GO:0010950 | 0.0015 | 5.2391 | 1.2281 | 6 | 151 | positive regulation of endopeptidase activity |
| GO:0010817 | 0.0015 | 3.1184 | 3.7982 | 11 | 467 | regulation of hormone levels |
| GO:0009607 | 0.0016 | 2.4991 | 6.9782 | 16 | 858 | response to biotic stimulus |
| GO:0080154 | 0.0016 | 14.3757 | 0.2359 | 3 | 29 | regulation of fertilization |
| GO:0071356 | 0.0017 | 3.8695 | 2.2122 | 8 | 272 | cellular response to tumor necrosis factor |
| GO:0071316 | 0.0018 | 41.2615 | 0.0651 | 2 | 8 | cellular response to nicotine |
| GO:0045321 | 0.0018 | 2.2858 | 9.1253 | 19 | 1122 | leukocyte activation |
| GO:0002701 | 0.002 | 13.3472 | 0.2521 | 3 | 31 | negative regulation of production of molecular mediator of immune response |
| GO:0051924 | 0.0021 | 4.1963 | 1.7811 | 7 | 219 | regulation of calcium ion transport |
| GO:0002250 | 0.0022 | 3.4015 | 2.8303 | 9 | 348 | adaptive immune response |
| GO:0015721 | 0.0022 | 12.8861 | 0.2603 | 3 | 32 | bile acid and bile salt transport |
| GO:0043950 | 0.0023 | 35.3648 | 0.0732 | 2 | 9 | positive regulation of cAMP-mediated signaling |
| GO:0071550 | 0.0023 | 35.3648 | 0.0732 | 2 | 9 | death-inducing signaling complex assembly |
| GO:0071803 | 0.0023 | 35.3648 | 0.0732 | 2 | 9 | positive regulation of podosome assembly |
| GO:0090281 | 0.0023 | 35.3648 | 0.0732 | 2 | 9 | negative regulation of calcium ion import |
| GO:2000304 | 0.0023 | 35.3648 | 0.0732 | 2 | 9 | positive regulation of ceramide biosynthetic process |
| GO:0009988 | 0.0024 | 7.7082 | 0.5612 | 4 | 69 | cell-cell recognition |
| GO:0051707 | 0.0026 | 2.4548 | 6.6203 | 15 | 814 | response to other organism |
| GO:0051716 | 0.0026 | 1.6551 | 55.614 | 72 | 6838 | cellular response to stimulus |
| GO:0006955 | 0.0032 | 2.1296 | 10.3761 | 20 | 1361 | immune response |
| GO:0006702 | 0.0034 | 27.5026 | 0.0895 | 2 | 11 | androgen biosynthetic process |
| GO:0042742 | 0.0036 | 3.7965 | 1.9601 | 7 | 241 | defense response to bacterium |
| GO:0007339 | 0.0039 | 10.376 | 0.3172 | 3 | 39 | binding of sperm to zona pellucida |
| GO:0006705 | 0.0041 | 24.7508 | 0.0976 | 2 | 12 | mineralocorticoid biosynthetic process |
| GO:0034116 | 0.0041 | 24.7508 | 0.0976 | 2 | 12 | positive regulation of heterotypic cell-cell adhesion |
| GO:0030890 | 0.0042 | 10.0949 | 0.3253 | 3 | 40 | positive regulation of B cell proliferation |
| GO:0002521 | 0.0044 | 2.8438 | 3.7494 | 10 | 461 | leukocyte differentiation |
| GO:0032946 | 0.0045 | 4.951 | 1.0736 | 5 | 132 | positive regulation of mononuclear cell proliferation |
| GO:0043506 | 0.0045 | 6.4183 | 0.6669 | 4 | 82 | regulation of JUN kinase activity |
| GO:0071674 | 0.0045 | 6.4183 | 0.6669 | 4 | 82 | mononuclear cell migration |
| GO:0071345 | 0.0046 | 2.6833 | 4.3945 | 11 | 569 | cellular response to cytokine stimulus |
| GO:0002455 | 0.0048 | 9.576 | 0.3416 | 3 | 42 | humoral immune response mediated by circulating immunoglobulin |
| GO:0006703 | 0.0048 | 22.4993 | 0.1057 | 2 | 13 | estrogen biosynthetic process |
| GO:0048266 | 0.0048 | 22.4993 | 0.1057 | 2 | 13 | behavioral response to pain |
| GO:0070374 | 0.0051 | 4.0299 | 1.5778 | 6 | 194 | positive regulation of ERK1 and ERK2 cascade |
| GO:0051345 | 0.0053 | 2.4102 | 5.7826 | 13 | 711 | positive regulation of hydrolase activity |
| GO:0051251 | 0.0054 | 3.5072 | 2.1146 | 7 | 260 | positive regulation of lymphocyte activation |
| GO:0044130 | 0.0056 | 20.6231 | 0.1139 | 2 | 14 | negative regulation of growth of symbiont in host |
| GO:0090153 | 0.0056 | 20.6231 | 0.1139 | 2 | 14 | regulation of sphingolipid biosynthetic process |
| GO:0050670 | 0.0056 | 3.9449 | 1.6104 | 6 | 198 | regulation of lymphocyte proliferation |
| GO:0032649 | 0.0058 | 5.9576 | 0.7157 | 4 | 88 | regulation of interferon-gamma production |
| GO:0051261 | 0.006 | 5.8871 | 0.7238 | 4 | 89 | protein depolymerization |
| GO:0010469 | 0.0061 | 2.5699 | 4.5627 | 11 | 561 | regulation of receptor activity |
| GO:0042330 | 0.0061 | 2.5699 | 4.5627 | 11 | 561 | taxis |
| GO:0071347 | 0.0062 | 5.8183 | 0.732 | 4 | 90 | cellular response to interleukin-1 |
| GO:0002252 | 0.0063 | 2.1035 | 8.7349 | 17 | 1074 | immune effector process |
| GO:2000021 | 0.0063 | 3.8436 | 1.651 | 6 | 203 | regulation of ion homeostasis |
| GO:1901317 | 0.0064 | 19.0355 | 0.122 | 2 | 15 | regulation of flagellated sperm motility |
| GO:0006953 | 0.0066 | 8.4852 | 0.3823 | 3 | 47 | acute-phase response |
| GO:0043244 | 0.0067 | 5.6854 | 0.7482 | 4 | 92 | regulation of protein complex disassembly |
| GO:0070663 | 0.0073 | 3.7286 | 1.6998 | 6 | 209 | regulation of leukocyte proliferation |
| GO:0007342 | 0.0073 | 17.6747 | 0.1301 | 2 | 16 | fusion of sperm to egg plasma membrane involved in single fertilization |
| GO:0030322 | 0.0073 | 17.6747 | 0.1301 | 2 | 16 | stabilization of membrane potential |
| GO:0044144 | 0.0073 | 17.6747 | 0.1301 | 2 | 16 | modulation of growth of symbiont involved in interaction with host |
| GO:1904951 | 0.0075 | 2.6219 | 4.0503 | 10 | 498 | positive regulation of establishment of protein localization |
| GO:0001080 | 0.0081 | Inf | 0.0081 | 1 | 1 | nitrogen catabolite activation of transcription from RNA polymerase II promoter |
| GO:0002737 | 0.0081 | Inf | 0.0081 | 1 | 1 | negative regulation of plasmacytoid dendritic cell cytokine production |
| GO:0007522 | 0.0081 | Inf | 0.0081 | 1 | 1 | visceral muscle development |
| GO:0015728 | 0.0081 | Inf | 0.0081 | 1 | 1 | mevalonate transport |
| GO:0032203 | 0.0081 | Inf | 0.0081 | 1 | 1 | telomere formation via telomerase |
| GO:0033231 | 0.0081 | Inf | 0.0081 | 1 | 1 | carbohydrate export |
| GO:0034255 | 0.0081 | Inf | 0.0081 | 1 | 1 | regulation of urea metabolic process |
| GO:0036145 | 0.0081 | Inf | 0.0081 | 1 | 1 | dendritic cell homeostasis |
| GO:0038185 | 0.0081 | Inf | 0.0081 | 1 | 1 | intracellular bile acid receptor signaling pathway |
| GO:0043143 | 0.0081 | Inf | 0.0081 | 1 | 1 | regulation of translation by machinery localization |
| GO:0043215 | 0.0081 | Inf | 0.0081 | 1 | 1 | daunorubicin transport |
| GO:0051780 | 0.0081 | Inf | 0.0081 | 1 | 1 | behavioral response to nutrient |
| GO:0061048 | 0.0081 | Inf | 0.0081 | 1 | 1 | negative regulation of branching involved in lung morphogenesis |
| GO:0071217 | 0.0081 | Inf | 0.0081 | 1 | 1 | cellular response to external biotic stimulus |
| GO:0090293 | 0.0081 | Inf | 0.0081 | 1 | 1 | nitrogen catabolite regulation of transcription |
| GO:1901557 | 0.0081 | Inf | 0.0081 | 1 | 1 | response to fenofibrate |
| GO:1901625 | 0.0081 | Inf | 0.0081 | 1 | 1 | cellular response to ergosterol |
| GO:1904155 | 0.0081 | Inf | 0.0081 | 1 | 1 | DN2 thymocyte differentiation |
| GO:1904156 | 0.0081 | Inf | 0.0081 | 1 | 1 | DN3 thymocyte differentiation |
| GO:1905231 | 0.0081 | Inf | 0.0081 | 1 | 1 | cellular response to borneol |
| GO:1905233 | 0.0081 | Inf | 0.0081 | 1 | 1 | response to codeine |
| GO:1905235 | 0.0081 | Inf | 0.0081 | 1 | 1 | response to quercetin |
| GO:1905695 | 0.0081 | Inf | 0.0081 | 1 | 1 | positive regulation of phosphatidic acid biosynthetic process |
| GO:1990962 | 0.0081 | Inf | 0.0081 | 1 | 1 | drug transport across blood-brain barrier |
| GO:1990963 | 0.0081 | Inf | 0.0081 | 1 | 1 | establishment of blood-retinal barrier |
| GO:2000011 | 0.0081 | Inf | 0.0081 | 1 | 1 | regulation of adaxial/abaxial pattern formation |
| GO:2001250 | 0.0081 | Inf | 0.0081 | 1 | 1 | positive regulation of ammonia assimilation cycle |
| GO:0006704 | 0.0082 | 16.4954 | 0.1383 | 2 | 17 | glucocorticoid biosynthetic process |
| GO:0007635 | 0.0082 | 16.4954 | 0.1383 | 2 | 17 | chemosensory behavior |
| GO:0019724 | 0.0087 | 5.2641 | 0.8052 | 4 | 99 | B cell mediated immunity |
| GO:0002791 | 0.0091 | 2.6984 | 3.5298 | 9 | 434 | regulation of peptide secretion |
| GO:0034162 | 0.0092 | 15.4635 | 0.1464 | 2 | 18 | toll-like receptor 9 signaling pathway |
| GO:2001269 | 0.0092 | 15.4635 | 0.1464 | 2 | 18 | positive regulation of cysteine-type endopeptidase activity involved in apoptotic signaling pathway |
| GO:0006968 | 0.0096 | 7.3174 | 0.4392 | 3 | 54 | cellular defense response |
| GO:0070838 | 0.0097 | 2.6661 | 3.5704 | 9 | 439 | divalent metal ion transport |
| GO:0051049 | 0.0098 | 1.7966 | 14.607 | 24 | 1796 | regulation of transport |
| GOMFID | Pvalue | OddsRatio | ExpCount | Count | Size | Term |
| GO:0050906 | 0 | 6.0615 | 3.4937 | 18 | 461 | detection of stimulus involved in sensory perception |
| GO:0050911 | 0 | 6.6542 | 2.8041 | 16 | 370 | detection of chemical stimulus involved in sensory perception of smell |
| GO:0009593 | 0 | 5.8192 | 3.4028 | 17 | 449 | detection of chemical stimulus |
| GO:0007606 | 0 | 5.5801 | 3.5392 | 17 | 467 | sensory perception of chemical stimulus |
| GO:0007186 | 0 | 3.4168 | 9.4884 | 27 | 1252 | G-protein coupled receptor signaling pathway |
| GO:0070098 | 0 | 11.1109 | 0.6063 | 6 | 80 | chemokine-mediated signaling pathway |
| GO:0050877 | 0 | 2.891 | 9.1701 | 23 | 1210 | nervous system process |
| GO:0015721 | 1e-04 | 19.3025 | 0.2425 | 4 | 32 | bile acid and bile salt transport |
| GO:0048266 | 1e-04 | 40.2425 | 0.0985 | 3 | 13 | behavioral response to pain |
| GO:0061368 | 2e-04 | 266.2149 | 0.0227 | 2 | 3 | behavioral response to formalin induced pain |
| GO:0070175 | 2e-04 | 266.2149 | 0.0227 | 2 | 3 | positive regulation of enamel mineralization |
| GO:0032501 | 3e-04 | 1.8847 | 52.8226 | 72 | 6970 | multicellular organismal process |
| GO:0060046 | 4e-04 | 23.6618 | 0.1516 | 3 | 20 | regulation of acrosome reaction |
| GO:0097527 | 8e-04 | 66.5413 | 0.0455 | 2 | 6 | necroptotic signaling pathway |
| GO:0002407 | 9e-04 | 18.2784 | 0.1895 | 3 | 25 | dendritic cell chemotaxis |
| GO:0048247 | 0.001 | 9.9925 | 0.4396 | 4 | 58 | lymphocyte chemotaxis |
| GO:0023052 | 0.0012 | 1.764 | 46.0246 | 63 | 6073 | signaling |
| GO:0042113 | 0.0013 | 4.5681 | 1.6445 | 7 | 217 | B cell activation |
| GO:0007154 | 0.0013 | 1.7538 | 46.1913 | 63 | 6095 | cell communication |
| GO:0006959 | 0.0014 | 4.5244 | 1.6597 | 7 | 219 | humoral immune response |
| GO:0070170 | 0.0015 | 44.3554 | 0.0606 | 2 | 8 | regulation of tooth mineralization |
| GO:0071316 | 0.0015 | 44.3554 | 0.0606 | 2 | 8 | cellular response to nicotine |
| GO:2000304 | 0.002 | 38.0165 | 0.0682 | 2 | 9 | positive regulation of ceramide biosynthetic process |
| GO:0009566 | 0.002 | 4.8948 | 1.3111 | 6 | 173 | fertilization |
| GO:0051716 | 0.0022 | 1.7052 | 51.8222 | 68 | 6838 | cellular response to stimulus |
| GO:0042482 | 0.0025 | 33.2624 | 0.0758 | 2 | 10 | positive regulation of odontogenesis |
| GO:0042088 | 0.0034 | 10.8581 | 0.3031 | 3 | 40 | T-helper 1 type immune response |
| GO:0051704 | 0.0035 | 1.8777 | 17.4458 | 29 | 2302 | multi-organism process |
| GO:0034116 | 0.0036 | 26.6066 | 0.0909 | 2 | 12 | positive regulation of heterotypic cell-cell adhesion |
| GO:0046415 | 0.0036 | 26.6066 | 0.0909 | 2 | 12 | urate metabolic process |
| GO:0010469 | 0.0036 | 2.778 | 4.2516 | 11 | 561 | regulation of receptor activity |
| GO:0070374 | 0.0036 | 4.3423 | 1.4702 | 6 | 194 | positive regulation of ERK1 and ERK2 cascade |
| GO:0060326 | 0.0037 | 3.7663 | 1.978 | 7 | 261 | cell chemotaxis |
| GO:0010623 | 0.0042 | 24.1863 | 0.0985 | 2 | 13 | programmed cell death involved in cell development |
| GO:0050789 | 0.0044 | 1.7569 | 81.1436 | 95 | 10707 | regulation of biological process |
| GO:0002377 | 0.0045 | 6.4118 | 0.6669 | 4 | 88 | immunoglobulin production |
| GO:0032649 | 0.0045 | 6.4118 | 0.6669 | 4 | 88 | regulation of interferon-gamma production |
| GO:0045321 | 0.0047 | 2.1774 | 8.5031 | 17 | 1122 | leukocyte activation |
| GO:0006954 | 0.0048 | 2.5423 | 5.0701 | 12 | 669 | inflammatory response |
| GO:0042487 | 0.0049 | 22.1694 | 0.1061 | 2 | 14 | regulation of odontogenesis of dentin-containing tooth |
| GO:0046325 | 0.0049 | 22.1694 | 0.1061 | 2 | 14 | negative regulation of glucose import |
| GO:0090153 | 0.0049 | 22.1694 | 0.1061 | 2 | 14 | regulation of sphingolipid biosynthetic process |
| GO:0043244 | 0.0053 | 6.1188 | 0.6972 | 4 | 92 | regulation of protein complex disassembly |
| GO:0006953 | 0.0054 | 9.1267 | 0.3562 | 3 | 47 | acute-phase response |
| GO:0072678 | 0.0054 | 9.1267 | 0.3562 | 3 | 47 | T cell migration |
| GO:0002286 | 0.0055 | 6.0497 | 0.7048 | 4 | 93 | T cell activation involved in immune response |
| GO:0072577 | 0.0057 | 8.9233 | 0.3638 | 3 | 48 | endothelial cell apoptotic process |
| GO:0071345 | 0.0063 | 2.2799 | 6.6161 | 14 | 873 | cellular response to cytokine stimulus |
| GO:0007342 | 0.0064 | 19 | 0.1213 | 2 | 16 | fusion of sperm to egg plasma membrane involved in single fertilization |
| GO:0030322 | 0.0064 | 19 | 0.1213 | 2 | 16 | stabilization of membrane potential |
| GO:0051023 | 0.0064 | 19 | 0.1213 | 2 | 16 | regulation of immunoglobulin secretion |
| GO:0006909 | 0.0065 | 3.8267 | 1.6597 | 6 | 219 | phagocytosis |
| GO:0046942 | 0.0067 | 3.3621 | 2.2054 | 7 | 291 | carboxylic acid transport |
| GO:0035036 | 0.0068 | 8.3641 | 0.3865 | 3 | 51 | sperm-egg recognition |
| GO:2001237 | 0.0068 | 5.6655 | 0.7503 | 4 | 99 | negative regulation of extrinsic apoptotic signaling pathway |
| GO:0016050 | 0.0072 | 3.0257 | 2.8041 | 8 | 370 | vesicle organization |
| GO:0007635 | 0.0072 | 17.7322 | 0.1288 | 2 | 17 | chemosensory behavior |
| GO:0002642 | 0.0076 | Inf | 0.0076 | 1 | 1 | positive regulation of immunoglobulin biosynthetic process |
| GO:0015728 | 0.0076 | Inf | 0.0076 | 1 | 1 | mevalonate transport |
| GO:0033231 | 0.0076 | Inf | 0.0076 | 1 | 1 | carbohydrate export |
| GO:0036145 | 0.0076 | Inf | 0.0076 | 1 | 1 | dendritic cell homeostasis |
| GO:0043143 | 0.0076 | Inf | 0.0076 | 1 | 1 | regulation of translation by machinery localization |
| GO:0043215 | 0.0076 | Inf | 0.0076 | 1 | 1 | daunorubicin transport |
| GO:0051780 | 0.0076 | Inf | 0.0076 | 1 | 1 | behavioral response to nutrient |
| GO:0061048 | 0.0076 | Inf | 0.0076 | 1 | 1 | negative regulation of branching involved in lung morphogenesis |
| GO:0071217 | 0.0076 | Inf | 0.0076 | 1 | 1 | cellular response to external biotic stimulus |
| GO:1901557 | 0.0076 | Inf | 0.0076 | 1 | 1 | response to fenofibrate |
| GO:1901625 | 0.0076 | Inf | 0.0076 | 1 | 1 | cellular response to ergosterol |
| GO:1902204 | 0.0076 | Inf | 0.0076 | 1 | 1 | positive regulation of hepatocyte growth factor receptor signaling pathway |
| GO:1904155 | 0.0076 | Inf | 0.0076 | 1 | 1 | DN2 thymocyte differentiation |
| GO:1904156 | 0.0076 | Inf | 0.0076 | 1 | 1 | DN3 thymocyte differentiation |
| GO:1905231 | 0.0076 | Inf | 0.0076 | 1 | 1 | cellular response to borneol |
| GO:1905233 | 0.0076 | Inf | 0.0076 | 1 | 1 | response to codeine |
| GO:1905235 | 0.0076 | Inf | 0.0076 | 1 | 1 | response to quercetin |
| GO:1990962 | 0.0076 | Inf | 0.0076 | 1 | 1 | drug transport across blood-brain barrier |
| GO:1990963 | 0.0076 | Inf | 0.0076 | 1 | 1 | establishment of blood-retinal barrier |
| GO:2000011 | 0.0076 | Inf | 0.0076 | 1 | 1 | regulation of adaxial/abaxial pattern formation |
| GO:0051480 | 0.0085 | 3.2123 | 2.3039 | 7 | 304 | regulation of cytosolic calcium ion concentration |
| GO:0052548 | 0.0085 | 2.9344 | 2.8874 | 8 | 381 | regulation of endopeptidase activity |
| GO:0050900 | 0.0086 | 3.5971 | 1.7629 | 6 | 240 | leukocyte migration |
| GO:0002685 | 0.0086 | 4.1968 | 1.258 | 5 | 166 | regulation of leukocyte migration |
| GO:0051966 | 0.0088 | 7.5726 | 0.4244 | 3 | 56 | regulation of synaptic transmission, glutamatergic |
| GO:0032634 | 0.009 | 15.6441 | 0.144 | 2 | 19 | interleukin-5 production |
| GO:0010817 | 0.0092 | 2.6975 | 3.5392 | 9 | 467 | regulation of hormone levels |
| GO:0009651 | 0.0099 | 14.7741 | 0.1516 | 2 | 20 | response to salt stress |
| GO:0048148 | 0.0099 | 14.7741 | 0.1516 | 2 | 20 | behavioral response to cocaine |
| GOMFID | Pvalue | OddsRatio | ExpCount | Count | Size | Term |
| GO:0007389 | 0 | 3.259 | 9.8533 | 29 | 409 | pattern specification process |
| GO:0009954 | 0 | 12.0123 | 0.7468 | 7 | 31 | proximal/distal pattern formation |
| GO:0060173 | 0 | 4.0367 | 4.0955 | 15 | 170 | limb development |
| GO:0007399 | 0 | 2.3197 | 15.4811 | 33 | 689 | nervous system development |
| GO:0022008 | 1e-04 | 1.8425 | 34.354 | 58 | 1426 | neurogenesis |
| GO:0048557 | 1e-04 | 14.6419 | 0.4577 | 5 | 19 | embryonic digestive tract morphogenesis |
| GO:0048704 | 1e-04 | 5.0435 | 2.2164 | 10 | 92 | embryonic skeletal system morphogenesis |
| GO:0009653 | 1e-04 | 1.6757 | 49.3307 | 75 | 2113 | anatomical structure morphogenesis |
| GO:0045944 | 2e-04 | 1.8816 | 25.7535 | 45 | 1069 | positive regulation of transcription from RNA polymerase II promoter |
| GO:0035107 | 2e-04 | 3.739 | 3.4932 | 12 | 145 | appendage morphogenesis |
| GO:0008589 | 2e-04 | 5.4931 | 1.6382 | 8 | 68 | regulation of smoothened signaling pathway |
| GO:0042330 | 2e-04 | 2.2151 | 13.5152 | 28 | 561 | taxis |
| GO:0007156 | 3e-04 | 3.5505 | 3.6619 | 12 | 152 | homophilic cell adhesion via plasma membrane adhesion molecules |
| GO:0007218 | 5e-04 | 4.3156 | 2.2887 | 9 | 95 | neuropeptide signaling pathway |
| GO:0021510 | 5e-04 | 4.2658 | 2.3128 | 9 | 96 | spinal cord development |
| GO:0001501 | 6e-04 | 2.2262 | 11.4674 | 24 | 476 | skeletal system development |
| GO:0072272 | 6e-04 | Inf | 0.0482 | 2 | 2 | proximal/distal pattern formation involved in metanephric nephron development |
| GO:0030182 | 6e-04 | 1.8802 | 21.0179 | 37 | 892 | neuron differentiation |
| GO:0001763 | 6e-04 | 3.0783 | 4.5291 | 13 | 188 | morphogenesis of a branching structure |
| GO:0021522 | 8e-04 | 7.8781 | 0.7468 | 5 | 31 | spinal cord motor neuron differentiation |
| GO:0009792 | 9e-04 | 2.0778 | 13.2742 | 26 | 551 | embryo development ending in birth or egg hatching |
| GO:0030326 | 9e-04 | 3.5576 | 3.0355 | 10 | 126 | embryonic limb morphogenesis |
| GO:0010529 | 0.001 | 10.9037 | 0.4577 | 4 | 19 | negative regulation of transposition |
| GO:0071622 | 0.001 | 5.8616 | 1.1564 | 6 | 48 | regulation of granulocyte chemotaxis |
| GO:0031328 | 0.001 | 1.5946 | 41.8223 | 62 | 1736 | positive regulation of cellular biosynthetic process |
| GO:0007610 | 0.001 | 2.0616 | 13.3706 | 26 | 555 | behavior |
| GO:0050921 | 0.0011 | 3.4968 | 3.0837 | 10 | 128 | positive regulation of chemotaxis |
| GO:0007519 | 0.0011 | 3.2228 | 3.6619 | 11 | 152 | skeletal muscle tissue development |
| GO:1902667 | 0.0012 | 10.2216 | 0.4818 | 4 | 20 | regulation of axon guidance |
| GO:0009952 | 0.0012 | 3.4417 | 3.1271 | 10 | 132 | anterior/posterior pattern specification |
| GO:0007267 | 0.0012 | 1.8029 | 21.8528 | 37 | 934 | cell-cell signaling |
| GO:0002009 | 0.0012 | 2.0925 | 12.142 | 24 | 504 | morphogenesis of an epithelium |
| GO:0007187 | 0.0013 | 2.9894 | 4.2882 | 12 | 178 | G-protein coupled receptor signaling pathway, coupled to cyclic nucleotide second messenger |
| GO:0001667 | 0.0014 | 2.3554 | 8.0946 | 18 | 336 | ameboidal-type cell migration |
| GO:1902622 | 0.0014 | 6.826 | 0.8432 | 5 | 35 | regulation of neutrophil migration |
| GO:0043586 | 0.0014 | 9.6197 | 0.5059 | 4 | 21 | tongue development |
| GO:0072089 | 0.0015 | 3.5995 | 2.6982 | 9 | 112 | stem cell proliferation |
| GO:0051962 | 0.0016 | 2.1263 | 10.9374 | 22 | 454 | positive regulation of nervous system development |
| GO:0002040 | 0.0017 | 3.9177 | 2.2164 | 8 | 92 | sprouting angiogenesis |
| GO:2000026 | 0.0018 | 1.5444 | 43.7255 | 63 | 1815 | regulation of multicellular organismal development |
| GO:0048869 | 0.0018 | 1.396 | 97.3766 | 123 | 4042 | cellular developmental process |
| GO:0007275 | 0.0019 | 1.5091 | 54.6696 | 75 | 2472 | multicellular organism development |
| GO:0021879 | 0.002 | 8.6838 | 0.5493 | 4 | 23 | forebrain neuron differentiation |
| GO:0006355 | 0.0021 | 1.4115 | 82.9701 | 107 | 3444 | regulation of transcription, DNA-templated |
| GO:0048754 | 0.0025 | 3.0995 | 3.445 | 10 | 143 | branching morphogenesis of an epithelial tube |
| GO:0009889 | 0.0025 | 1.3732 | 104.7003 | 130 | 4346 | regulation of biosynthetic process |
| GO:0001838 | 0.0025 | 3.3383 | 2.8909 | 9 | 120 | embryonic epithelial tube formation |
| GO:0010632 | 0.0025 | 2.739 | 4.6496 | 12 | 193 | regulation of epithelial cell migration |
| GO:0003207 | 0.0026 | 13.5997 | 0.2891 | 3 | 12 | cardiac chamber formation |
| GO:2001141 | 0.0027 | 1.3972 | 83.6205 | 107 | 3471 | regulation of RNA biosynthetic process |
| GO:0001756 | 0.0028 | 4.6655 | 1.4145 | 6 | 59 | somitogenesis |
| GO:0042110 | 0.0029 | 2.0486 | 10.7929 | 21 | 448 | T cell activation |
| GO:0021884 | 0.0033 | 7.4311 | 0.6264 | 4 | 26 | forebrain neuron development |
| GO:0048935 | 0.0033 | 12.2389 | 0.3132 | 3 | 13 | peripheral nervous system neuron development |
| GO:0001757 | 0.0034 | 40.7121 | 0.0964 | 2 | 4 | somite specification |
| GO:0007198 | 0.0034 | 40.7121 | 0.0964 | 2 | 4 | adenylate cyclase-inhibiting serotonin receptor signaling pathway |
| GO:0008588 | 0.0034 | 40.7121 | 0.0964 | 2 | 4 | release of cytoplasmic sequestered NF-kappaB |
| GO:0043553 | 0.0034 | 40.7121 | 0.0964 | 2 | 4 | negative regulation of phosphatidylinositol 3-kinase activity |
| GO:0072086 | 0.0034 | 40.7121 | 0.0964 | 2 | 4 | specification of loop of Henle identity |
| GO:1903508 | 0.0034 | 1.5746 | 33.0049 | 49 | 1370 | positive regulation of nucleic acid-templated transcription |
| GO:0007155 | 0.0041 | 1.57 | 31.6799 | 47 | 1315 | cell adhesion |
| GO:0098916 | 0.0042 | 1.8637 | 14.0933 | 25 | 585 | anterograde trans-synaptic signaling |
| GO:0045666 | 0.0042 | 2.2175 | 7.5887 | 16 | 315 | positive regulation of neuron differentiation |
| GO:0019219 | 0.0042 | 1.3555 | 96.8466 | 120 | 4020 | regulation of nucleobase-containing compound metabolic process |
| GO:0090023 | 0.0043 | 6.8109 | 0.6746 | 4 | 28 | positive regulation of neutrophil chemotaxis |
| GO:1902692 | 0.0043 | 6.8109 | 0.6746 | 4 | 28 | regulation of neuroblast proliferation |
| GO:0099536 | 0.0044 | 1.8568 | 14.1415 | 25 | 587 | synaptic signaling |
| GO:0010557 | 0.0045 | 1.5133 | 38.57 | 55 | 1601 | positive regulation of macromolecule biosynthetic process |
| GO:0060326 | 0.0045 | 2.3442 | 6.2878 | 14 | 261 | cell chemotaxis |
| GO:0007189 | 0.0047 | 4.1682 | 1.5659 | 6 | 65 | adenylate cyclase-activating G-protein coupled receptor signaling pathway |
| GO:0022604 | 0.0049 | 2.0286 | 9.8292 | 19 | 408 | regulation of cell morphogenesis |
| GO:0010720 | 0.005 | 1.9499 | 11.2988 | 21 | 469 | positive regulation of cell development |
| GO:0046632 | 0.005 | 3.5909 | 2.0959 | 7 | 87 | alpha-beta T cell differentiation |
| GO:0048667 | 0.0052 | 1.9077 | 12.0938 | 22 | 502 | cell morphogenesis involved in neuron differentiation |
| GO:0002568 | 0.0055 | 27.1397 | 0.1205 | 2 | 5 | somatic diversification of T cell receptor genes |
| GO:0033153 | 0.0055 | 27.1397 | 0.1205 | 2 | 5 | T cell receptor V(D)J recombination |
| GO:0045636 | 0.0055 | 27.1397 | 0.1205 | 2 | 5 | positive regulation of melanocyte differentiation |
| GO:0060012 | 0.0055 | 27.1397 | 0.1205 | 2 | 5 | synaptic transmission, glycinergic |
| GO:0060437 | 0.0055 | 27.1397 | 0.1205 | 2 | 5 | lung growth |
| GO:0061056 | 0.0055 | 27.1397 | 0.1205 | 2 | 5 | sclerotome development |
| GO:0071502 | 0.0055 | 27.1397 | 0.1205 | 2 | 5 | cellular response to temperature stimulus |
| GO:0061564 | 0.0057 | 1.9599 | 10.6965 | 20 | 444 | axon development |
| GO:0030198 | 0.0058 | 2.1373 | 7.8537 | 16 | 326 | extracellular matrix organization |
| GO:0014033 | 0.0059 | 3.9657 | 1.6382 | 6 | 68 | neural crest cell differentiation |
| GO:0019935 | 0.006 | 3.13 | 2.7223 | 8 | 113 | cyclic-nucleotide-mediated signaling |
| GO:0036037 | 0.0062 | 9.4128 | 0.3855 | 3 | 16 | CD8-positive, alpha-beta T cell activation |
| GO:0048870 | 0.0065 | 1.5144 | 34.1613 | 49 | 1418 | cell motility |
| GO:0048858 | 0.0066 | 1.8144 | 13.8524 | 24 | 575 | cell projection morphogenesis |
| GO:0034654 | 0.0068 | 1.3296 | 98.2198 | 120 | 4077 | nucleobase-containing compound biosynthetic process |
| GO:0007605 | 0.0069 | 2.8251 | 3.3728 | 9 | 140 | sensory perception of sound |
| GO:0090596 | 0.0071 | 2.2935 | 5.9505 | 13 | 247 | sensory organ morphogenesis |
| GO:0035148 | 0.0072 | 2.8035 | 3.3969 | 9 | 141 | tube formation |
| GO:0050772 | 0.0072 | 3.782 | 1.7105 | 6 | 71 | positive regulation of axonogenesis |
| GO:0007420 | 0.0075 | 1.7485 | 15.5629 | 26 | 646 | brain development |
| GO:0097485 | 0.0077 | 2.3564 | 5.3482 | 12 | 222 | neuron projection guidance |
| GO:0090132 | 0.0078 | 2.264 | 6.0228 | 13 | 250 | epithelium migration |
| GO:0050931 | 0.0078 | 5.6349 | 0.795 | 4 | 33 | pigment cell differentiation |
| GO:0009888 | 0.0079 | 1.439 | 44.906 | 61 | 1864 | tissue development |
| GO:0009790 | 0.008 | 2.012 | 8.8462 | 17 | 380 | embryo development |
| GO:0051272 | 0.0081 | 1.8911 | 11.0579 | 20 | 459 | positive regulation of cellular component movement |
| GO:0010596 | 0.0081 | 4.3523 | 1.2527 | 5 | 52 | negative regulation of endothelial cell migration |
| GO:0003180 | 0.0081 | 20.3535 | 0.1445 | 2 | 6 | aortic valve morphogenesis |
| GO:0021861 | 0.0081 | 20.3535 | 0.1445 | 2 | 6 | forebrain radial glial cell differentiation |
| GO:0046113 | 0.0081 | 20.3535 | 0.1445 | 2 | 6 | nucleobase catabolic process |
| GO:0061218 | 0.0081 | 20.3535 | 0.1445 | 2 | 6 | negative regulation of mesonephros development |
| GO:0030814 | 0.0082 | 2.7407 | 3.4691 | 9 | 144 | regulation of cAMP metabolic process |
| GO:0021536 | 0.0082 | 3.6686 | 1.7587 | 6 | 73 | diencephalon development |
| GO:0048562 | 0.0085 | 2.5593 | 4.1129 | 10 | 175 | embryonic organ morphogenesis |
| GO:1901881 | 0.0087 | 8.1567 | 0.4336 | 3 | 18 | positive regulation of protein depolymerization |
| GO:0051254 | 0.0087 | 1.487 | 34.7154 | 49 | 1441 | positive regulation of RNA metabolic process |
| GO:0034394 | 0.0088 | 4.2614 | 1.2768 | 5 | 53 | protein localization to cell surface |
| GO:0021761 | 0.009 | 3.1899 | 2.3368 | 7 | 97 | limbic system development |
| GO:1904591 | 0.009 | 3.1899 | 2.3368 | 7 | 97 | positive regulation of protein import |
| GO:0035295 | 0.0095 | 1.7775 | 13.5152 | 23 | 561 | tube development |
| GOMFID | Pvalue | OddsRatio | ExpCount | Count | Size | Term |
| GO:0007268 | 0 | 2.7124 | 13.7689 | 34 | 585 | chemical synaptic transmission |
| GO:0099537 | 0 | 2.7022 | 13.816 | 34 | 587 | trans-synaptic signaling |
| GO:0009887 | 0 | 2.0558 | 22.6893 | 43 | 964 | animal organ morphogenesis |
| GO:0019098 | 1e-04 | 10.5213 | 0.7061 | 6 | 30 | reproductive behavior |
| GO:0007156 | 1e-04 | 3.9815 | 3.5776 | 13 | 152 | homophilic cell adhesion via plasma membrane adhesion molecules |
| GO:0007411 | 1e-04 | 3.3524 | 5.1781 | 16 | 220 | axon guidance |
| GO:0007267 | 1e-04 | 1.9518 | 25.5992 | 46 | 1116 | cell-cell signaling |
| GO:0001764 | 1e-04 | 4.1806 | 3.1539 | 12 | 134 | neuron migration |
| GO:0051962 | 1e-04 | 2.5169 | 10.6856 | 25 | 454 | positive regulation of nervous system development |
| GO:0007218 | 1e-04 | 4.9851 | 2.236 | 10 | 95 | neuropeptide signaling pathway |
| GO:0048870 | 1e-04 | 2.0008 | 22.1693 | 41 | 972 | cell motility |
| GO:0048665 | 1e-04 | 9.3505 | 0.7767 | 6 | 33 | neuron fate specification |
| GO:0040012 | 1e-04 | 2.0482 | 19.9826 | 38 | 849 | regulation of locomotion |
| GO:0016199 | 1e-04 | 62.715 | 0.1177 | 3 | 5 | axon midline choice point recognition |
| GO:0010720 | 1e-04 | 2.4295 | 11.0387 | 25 | 469 | positive regulation of cell development |
| GO:0021879 | 1e-04 | 7.0249 | 1.1533 | 7 | 49 | forebrain neuron differentiation |
| GO:0035295 | 2e-04 | 2.2727 | 13.2041 | 28 | 561 | tube development |
| GO:0022610 | 2e-04 | 1.8103 | 31.0919 | 52 | 1321 | biological adhesion |
| GO:0045666 | 2e-04 | 2.7501 | 7.414 | 19 | 315 | positive regulation of neuron differentiation |
| GO:0048869 | 2e-04 | 1.4997 | 95.1352 | 126 | 4042 | cellular developmental process |
| GO:0060914 | 2e-04 | 11.0491 | 0.5649 | 5 | 24 | heart formation |
| GO:0021891 | 2e-04 | 41.8074 | 0.1412 | 3 | 6 | olfactory bulb interneuron development |
| GO:0003002 | 3e-04 | 2.7564 | 6.9974 | 18 | 300 | regionalization |
| GO:0048812 | 3e-04 | 2.1939 | 13.1335 | 27 | 558 | neuron projection morphogenesis |
| GO:0048667 | 4e-04 | 2.2566 | 11.8154 | 25 | 502 | cell morphogenesis involved in neuron differentiation |
| GO:0006935 | 4e-04 | 2.1811 | 13.2041 | 27 | 561 | chemotaxis |
| GO:0060322 | 4e-04 | 2.0584 | 16.0755 | 31 | 683 | head development |
| GO:0002009 | 4e-04 | 2.2469 | 11.8625 | 25 | 504 | morphogenesis of an epithelium |
| GO:0035385 | 4e-04 | 31.3536 | 0.1648 | 3 | 7 | Roundabout signaling pathway |
| GO:0060017 | 4e-04 | 31.3536 | 0.1648 | 3 | 7 | parathyroid gland development |
| GO:0021953 | 4e-04 | 4.9024 | 1.807 | 8 | 78 | central nervous system neuron differentiation |
| GO:0007416 | 5e-04 | 3.6413 | 3.2716 | 11 | 139 | synapse assembly |
| GO:0050767 | 5e-04 | 2.3293 | 10.0597 | 22 | 436 | regulation of neurogenesis |
| GO:0048858 | 5e-04 | 2.1235 | 13.5336 | 27 | 575 | cell projection morphogenesis |
| GO:0021823 | 6e-04 | Inf | 0.0471 | 2 | 2 | cerebral cortex tangential migration using cell-cell interactions |
| GO:0021836 | 6e-04 | Inf | 0.0471 | 2 | 2 | chemorepulsion involved in postnatal olfactory bulb interneuron migration |
| GO:0050925 | 6e-04 | Inf | 0.0471 | 2 | 2 | negative regulation of negative chemotaxis |
| GO:0072272 | 6e-04 | Inf | 0.0471 | 2 | 2 | proximal/distal pattern formation involved in metanephric nephron development |
| GO:0097112 | 6e-04 | Inf | 0.0471 | 2 | 2 | gamma-aminobutyric acid receptor clustering |
| GO:0051270 | 6e-04 | 1.8995 | 20.218 | 36 | 859 | regulation of cellular component movement |
| GO:2000026 | 6e-04 | 1.6203 | 42.719 | 64 | 1815 | regulation of multicellular organismal development |
| GO:0030900 | 7e-04 | 2.4312 | 8.3084 | 19 | 353 | forebrain development |
| GO:0021954 | 8e-04 | 5.0818 | 1.5299 | 7 | 65 | central nervous system neuron development |
| GO:0008038 | 8e-04 | 7.7714 | 0.7532 | 5 | 32 | neuron recognition |
| GO:0098609 | 8e-04 | 1.9115 | 18.3586 | 33 | 780 | cell-cell adhesion |
| GO:0060180 | 0.001 | 20.8997 | 0.2118 | 3 | 9 | female mating behavior |
| GO:0001667 | 0.0011 | 2.415 | 7.9083 | 18 | 336 | ameboidal-type cell migration |
| GO:0021515 | 0.0012 | 5.6039 | 1.2004 | 6 | 51 | cell differentiation in spinal cord |
| GO:0042220 | 0.0013 | 5.4817 | 1.2239 | 6 | 52 | response to cocaine |
| GO:0009792 | 0.0014 | 2.0399 | 12.9687 | 25 | 551 | embryo development ending in birth or egg hatching |
| GO:0014003 | 0.0015 | 6.7669 | 0.8473 | 5 | 36 | oligodendrocyte development |
| GO:0015844 | 0.0015 | 4.5326 | 1.6946 | 7 | 72 | monoamine transport |
| GO:0060913 | 0.0016 | 83.4053 | 0.0706 | 2 | 3 | cardiac cell fate determination |
| GO:0061364 | 0.0016 | 83.4053 | 0.0706 | 2 | 3 | apoptotic process involved in luteolysis |
| GO:0002042 | 0.0017 | 6.555 | 0.8709 | 5 | 37 | cell migration involved in sprouting angiogenesis |
| GO:0003151 | 0.0018 | 4.3967 | 1.7417 | 7 | 74 | outflow tract morphogenesis |
| GO:0009653 | 0.0018 | 1.6831 | 27.9715 | 44 | 1251 | anatomical structure morphogenesis |
| GO:0003264 | 0.0019 | 15.6728 | 0.2589 | 3 | 11 | regulation of cardioblast proliferation |
| GO:0050713 | 0.0019 | 15.6728 | 0.2589 | 3 | 11 | negative regulation of interleukin-1 beta secretion |
| GO:0007618 | 0.0019 | 6.356 | 0.8944 | 5 | 38 | mating |
| GO:0045777 | 0.0019 | 6.356 | 0.8944 | 5 | 38 | positive regulation of blood pressure |
| GO:0051966 | 0.002 | 5.0419 | 1.3181 | 6 | 56 | regulation of synaptic transmission, glutamatergic |
| GO:0061564 | 0.002 | 2.1213 | 10.4503 | 21 | 444 | axon development |
| GO:0045597 | 0.0021 | 2.2046 | 9.1056 | 19 | 402 | positive regulation of cell differentiation |
| GO:0071495 | 0.0021 | 1.6493 | 28.9972 | 45 | 1232 | cellular response to endogenous stimulus |
| GO:0001964 | 0.0022 | 8.3746 | 0.5649 | 4 | 24 | startle response |
| GO:0021511 | 0.0022 | 8.3746 | 0.5649 | 4 | 24 | spinal cord patterning |
| GO:0032501 | 0.0023 | 1.3957 | 112.3296 | 137 | 5033 | multicellular organismal process |
| GO:0015872 | 0.0024 | 5.992 | 0.9415 | 5 | 40 | dopamine transport |
| GO:0010454 | 0.0024 | 13.9305 | 0.2824 | 3 | 12 | negative regulation of cell fate commitment |
| GO:0045992 | 0.0026 | 7.9753 | 0.5884 | 4 | 25 | negative regulation of embryonic development |
| GO:0097756 | 0.0028 | 4.0338 | 1.8829 | 7 | 80 | negative regulation of blood vessel diameter |
| GO:0033993 | 0.0032 | 1.7304 | 20.7358 | 34 | 881 | response to lipid |
| GO:0001992 | 0.0032 | 41.7 | 0.0941 | 2 | 4 | regulation of systemic arterial blood pressure by vasopressin |
| GO:0001994 | 0.0032 | 41.7 | 0.0941 | 2 | 4 | norepinephrine-epinephrine vasoconstriction involved in regulation of systemic arterial blood pressure |
| GO:0003308 | 0.0032 | 41.7 | 0.0941 | 2 | 4 | negative regulation of Wnt signaling pathway involved in heart development |
| GO:0006933 | 0.0032 | 41.7 | 0.0941 | 2 | 4 | negative regulation of cell adhesion involved in substrate-bound cell migration |
| GO:0007621 | 0.0032 | 41.7 | 0.0941 | 2 | 4 | negative regulation of female receptivity |
| GO:0031394 | 0.0032 | 41.7 | 0.0941 | 2 | 4 | positive regulation of prostaglandin biosynthetic process |
| GO:0033600 | 0.0032 | 41.7 | 0.0941 | 2 | 4 | negative regulation of mammary gland epithelial cell proliferation |
| GO:0042662 | 0.0032 | 41.7 | 0.0941 | 2 | 4 | negative regulation of mesodermal cell fate specification |
| GO:0072086 | 0.0032 | 41.7 | 0.0941 | 2 | 4 | specification of loop of Henle identity |
| GO:0072513 | 0.0032 | 41.7 | 0.0941 | 2 | 4 | positive regulation of secondary heart field cardioblast proliferation |
| GO:1905903 | 0.0032 | 41.7 | 0.0941 | 2 | 4 | negative regulation of mesoderm formation |
| GO:0021517 | 0.0032 | 5.5179 | 1.0121 | 5 | 43 | ventral spinal cord development |
| GO:0007187 | 0.0033 | 2.784 | 4.1895 | 11 | 178 | G-protein coupled receptor signaling pathway, coupled to cyclic nucleotide second messenger |
| GO:0048791 | 0.0035 | 7.2809 | 0.6355 | 4 | 27 | calcium ion-regulated exocytosis of neurotransmitter |
| GO:0023061 | 0.0035 | 2.0966 | 9.5323 | 19 | 405 | signal release |
| GO:0008015 | 0.0035 | 1.9778 | 11.6977 | 22 | 497 | blood circulation |
| GO:0001756 | 0.0036 | 4.4208 | 1.4828 | 6 | 63 | somitogenesis |
| GO:0072091 | 0.0036 | 4.4208 | 1.4828 | 6 | 63 | regulation of stem cell proliferation |
| GO:0007612 | 0.0036 | 3.1361 | 3.0598 | 9 | 130 | learning |
| GO:0003214 | 0.0039 | 11.3963 | 0.3295 | 3 | 14 | cardiac left ventricle morphogenesis |
| GO:0042711 | 0.0039 | 11.3963 | 0.3295 | 3 | 14 | maternal behavior |
| GO:0048864 | 0.0039 | 4.3443 | 1.5063 | 6 | 64 | stem cell development |
| GO:0003018 | 0.0041 | 2.8712 | 3.6953 | 10 | 157 | vascular process in circulatory system |
| GO:0050768 | 0.0042 | 2.4573 | 5.5782 | 13 | 237 | negative regulation of neurogenesis |
| GO:0006584 | 0.0044 | 5.1132 | 1.0827 | 5 | 46 | catecholamine metabolic process |
| GO:0050795 | 0.0045 | 4.1989 | 1.5534 | 6 | 66 | regulation of behavior |
| GO:0048598 | 0.0047 | 1.8717 | 13.463 | 24 | 572 | embryonic morphogenesis |
| GO:0010594 | 0.0047 | 3.0107 | 3.1774 | 9 | 135 | regulation of endothelial cell migration |
| GO:0003008 | 0.0047 | 1.4727 | 45.5905 | 63 | 1937 | system process |
| GO:0007379 | 0.0048 | 10.4459 | 0.353 | 3 | 15 | segment specification |
| GO:0060579 | 0.0048 | 10.4459 | 0.353 | 3 | 15 | ventral spinal cord interneuron fate commitment |
| GO:0050433 | 0.0048 | 4.9912 | 1.1062 | 5 | 47 | regulation of catecholamine secretion |
| GO:0007417 | 0.0051 | 1.7895 | 15.8556 | 27 | 696 | central nervous system development |
| GO:0010648 | 0.0051 | 1.5734 | 29.5385 | 44 | 1255 | negative regulation of cell communication |
| GO:0021988 | 0.0051 | 6.4396 | 0.7061 | 4 | 30 | olfactory lobe development |
| GO:0032102 | 0.0052 | 2.2988 | 6.402 | 14 | 272 | negative regulation of response to external stimulus |
| GO:0022028 | 0.0053 | 27.7982 | 0.1177 | 2 | 5 | tangential migration from the subventricular zone to the olfactory bulb |
| GO:0035609 | 0.0053 | 27.7982 | 0.1177 | 2 | 5 | C-terminal protein deglutamylation |
| GO:0070100 | 0.0053 | 27.7982 | 0.1177 | 2 | 5 | negative regulation of chemokine-mediated signaling pathway |
| GO:0071502 | 0.0053 | 27.7982 | 0.1177 | 2 | 5 | cellular response to temperature stimulus |
| GO:1903232 | 0.0053 | 27.7982 | 0.1177 | 2 | 5 | melanosome assembly |
| GO:0006811 | 0.0053 | 1.5207 | 35.5168 | 51 | 1509 | ion transport |
| GO:0023057 | 0.0054 | 1.5678 | 29.6327 | 44 | 1259 | negative regulation of signaling |
| GO:0048731 | 0.0056 | 1.3774 | 78.5854 | 99 | 3563 | system development |
| GO:0051954 | 0.0058 | 6.2007 | 0.7296 | 4 | 31 | positive regulation of amine transport |
| GO:0040037 | 0.0058 | 9.6418 | 0.3766 | 3 | 16 | negative regulation of fibroblast growth factor receptor signaling pathway |
| GO:0048704 | 0.006 | 3.4617 | 2.1654 | 7 | 92 | embryonic skeletal system morphogenesis |
| GO:0046887 | 0.0061 | 3.1174 | 2.7303 | 8 | 116 | positive regulation of hormone secretion |
| GO:0030335 | 0.0063 | 1.9758 | 10.0737 | 19 | 428 | positive regulation of cell migration |
| GO:0045598 | 0.0064 | 3.0887 | 2.7538 | 8 | 117 | regulation of fat cell differentiation |
| GO:0043278 | 0.0065 | 5.9788 | 0.7532 | 4 | 32 | response to morphine |
| GO:0060317 | 0.0065 | 5.9788 | 0.7532 | 4 | 32 | cardiac epithelial to mesenchymal transition |
| GO:0050772 | 0.0065 | 3.8747 | 1.6711 | 6 | 71 | positive regulation of axonogenesis |
| GO:1901701 | 0.0065 | 1.6208 | 23.3484 | 36 | 992 | cellular response to oxygen-containing compound |
| GO:1903530 | 0.0067 | 1.8107 | 13.8844 | 24 | 596 | regulation of secretion by cell |
| GO:0051446 | 0.0069 | 8.9525 | 0.4001 | 3 | 17 | positive regulation of meiotic cell cycle |
| GO:0060219 | 0.0069 | 8.9525 | 0.4001 | 3 | 17 | camera-type eye photoreceptor cell differentiation |
| GO:0061323 | 0.0069 | 8.9525 | 0.4001 | 3 | 17 | cell proliferation involved in heart morphogenesis |
| GO:0072488 | 0.0069 | 8.9525 | 0.4001 | 3 | 17 | ammonium transmembrane transport |
| GO:0043537 | 0.0072 | 5.7723 | 0.7767 | 4 | 33 | negative regulation of blood vessel endothelial cell migration |
| GO:0045987 | 0.0072 | 5.7723 | 0.7767 | 4 | 33 | positive regulation of smooth muscle contraction |
| GO:0061333 | 0.0074 | 3.7586 | 1.7182 | 6 | 73 | renal tubule morphogenesis |
| GO:2000147 | 0.0076 | 8.5689 | 0.4135 | 3 | 18 | positive regulation of cell motility |
| GO:0071805 | 0.0076 | 2.4697 | 4.6838 | 11 | 199 | potassium ion transmembrane transport |
| GO:0032229 | 0.0078 | 20.8474 | 0.1412 | 2 | 6 | negative regulation of synaptic transmission, GABAergic |
| GO:0033603 | 0.0078 | 20.8474 | 0.1412 | 2 | 6 | positive regulation of dopamine secretion |
| GO:0098914 | 0.0078 | 20.8474 | 0.1412 | 2 | 6 | membrane repolarization during atrial cardiac muscle cell action potential |
| GO:1902947 | 0.0078 | 20.8474 | 0.1412 | 2 | 6 | regulation of tau-protein kinase activity |
| GO:2001279 | 0.0078 | 20.8474 | 0.1412 | 2 | 6 | regulation of unsaturated fatty acid biosynthetic process |
| GO:0048661 | 0.0079 | 3.7031 | 1.7417 | 6 | 74 | positive regulation of smooth muscle cell proliferation |
| GO:0051047 | 0.008 | 2.0095 | 8.8498 | 17 | 376 | positive regulation of secretion |
| GO:0003206 | 0.0082 | 2.9522 | 2.8715 | 8 | 122 | cardiac chamber morphogenesis |
| GO:0050803 | 0.0082 | 2.9522 | 2.8715 | 8 | 122 | regulation of synapse structure or activity |
| GO:0045785 | 0.0084 | 1.9981 | 8.8969 | 17 | 378 | positive regulation of cell adhesion |
| GO:0006821 | 0.0088 | 3.1969 | 2.3301 | 7 | 99 | chloride transport |
| GO:2000826 | 0.0089 | 5.3992 | 0.8238 | 4 | 35 | regulation of heart morphogenesis |
| GO:0001710 | 0.0095 | 7.8325 | 0.4472 | 3 | 19 | mesodermal cell fate commitment |
| GO:0072079 | 0.0095 | 7.8325 | 0.4472 | 3 | 19 | nephron tubule formation |
| GO:0040019 | 0.0098 | 5.2302 | 0.8473 | 4 | 36 | positive regulation of embryonic development |
| GOMFID | Pvalue | OddsRatio | ExpCount | Count | Size | Term |
| GO:1900239 | 3e-04 | 31.4171 | 0.1513 | 3 | 8 | regulation of phenotypic switching |
| GO:0050777 | 7e-04 | 4.0109 | 2.4212 | 9 | 128 | negative regulation of immune response |
| GO:1901570 | 0.0012 | 4.6797 | 1.6267 | 7 | 86 | fatty acid derivative biosynthetic process |
| GO:0030282 | 0.0019 | 4.2969 | 1.7591 | 7 | 93 | bone mineralization |
| GO:0038110 | 0.0021 | 52.2 | 0.0757 | 2 | 4 | interleukin-2-mediated signaling pathway |
| GO:0043570 | 0.0021 | 52.2 | 0.0757 | 2 | 4 | maintenance of DNA repeat elements |
| GO:0002376 | 0.0022 | 1.5135 | 50.5046 | 70 | 2670 | immune system process |
| GO:0043114 | 0.0023 | 8.0716 | 0.5675 | 4 | 30 | regulation of vascular permeability |
| GO:0045123 | 0.0025 | 5.8418 | 0.9458 | 5 | 50 | cellular extravasation |
| GO:0007155 | 0.0034 | 1.6704 | 24.874 | 39 | 1315 | cell adhesion |
| GO:0072104 | 0.0034 | 34.7978 | 0.0946 | 2 | 5 | glomerular capillary formation |
| GO:0002698 | 0.0036 | 3.8069 | 1.9672 | 7 | 104 | negative regulation of immune effector process |
| GO:0035338 | 0.0037 | 11.2141 | 0.3216 | 3 | 17 | long-chain fatty-acyl-CoA biosynthetic process |
| GO:0048535 | 0.0037 | 11.2141 | 0.3216 | 3 | 17 | lymph node development |
| GO:0060973 | 0.0044 | 10.4658 | 0.3405 | 3 | 18 | cell migration involved in heart development |
| GO:0042373 | 0.0051 | 26.0967 | 0.1135 | 2 | 6 | vitamin K metabolic process |
| GO:0043152 | 0.0051 | 26.0967 | 0.1135 | 2 | 6 | induction of bacterial agglutination |
| GO:0045590 | 0.0051 | 26.0967 | 0.1135 | 2 | 6 | negative regulation of regulatory T cell differentiation |
| GO:0046069 | 0.0051 | 26.0967 | 0.1135 | 2 | 6 | cGMP catabolic process |
| GO:0090677 | 0.0051 | 26.0967 | 0.1135 | 2 | 6 | reversible differentiation |
| GO:1990668 | 0.0051 | 26.0967 | 0.1135 | 2 | 6 | vesicle fusion with endoplasmic reticulum-Golgi intermediate compartment (ERGIC) membrane |
| GO:0010529 | 0.0052 | 9.8111 | 0.3594 | 3 | 19 | negative regulation of transposition |
| GO:0006952 | 0.0058 | 1.5832 | 28.2031 | 42 | 1491 | defense response |
| GO:0051152 | 0.006 | 9.2334 | 0.3783 | 3 | 20 | positive regulation of smooth muscle cell differentiation |
| GO:0008535 | 0.0069 | 8.7198 | 0.3972 | 3 | 21 | respiratory chain complex IV assembly |
| GO:0061439 | 0.007 | 20.8761 | 0.1324 | 2 | 7 | kidney vasculature morphogenesis |
| GO:0070669 | 0.007 | 20.8761 | 0.1324 | 2 | 7 | response to interleukin-2 |
| GO:0046006 | 0.0073 | 5.668 | 0.7755 | 4 | 41 | regulation of activated T cell proliferation |
| GO:1904837 | 0.008 | 5.5185 | 0.7945 | 4 | 42 | beta-catenin-TCF complex assembly |
| GO:0006091 | 0.0087 | 2.0395 | 8.2094 | 16 | 434 | generation of precursor metabolites and energy |
| GO:0050764 | 0.0087 | 4.2355 | 1.2673 | 5 | 67 | regulation of phagocytosis |
| GO:0002443 | 0.0089 | 1.7906 | 13.4679 | 23 | 712 | leukocyte mediated immunity |
| GO:0032667 | 0.0093 | 17.3956 | 0.1513 | 2 | 8 | regulation of interleukin-23 production |
| GO:0045630 | 0.0093 | 17.3956 | 0.1513 | 2 | 8 | positive regulation of T-helper 2 cell differentiation |
| GO:0072102 | 0.0093 | 17.3956 | 0.1513 | 2 | 8 | glomerulus morphogenesis |
| GO:0033559 | 0.0093 | 3.5464 | 1.797 | 6 | 95 | unsaturated fatty acid metabolic process |
| GOMFID | Pvalue | OddsRatio | ExpCount | Count | Size | Term |
| GO:0019864 | 4e-04 | 26.8735 | 0.1587 | 3 | 10 | IgG binding |
| GO:0031406 | 5e-04 | 3.8457 | 2.7937 | 10 | 176 | carboxylic acid binding |
| GO:0050786 | 6e-04 | 23.5128 | 0.1746 | 3 | 11 | RAGE receptor binding |
| GO:0005521 | 0.0016 | 15.6713 | 0.2381 | 3 | 15 | lamin binding |
| GO:0016635 | 0.0024 | 41.6497 | 0.0794 | 2 | 5 | oxidoreductase activity, acting on the CH-CH group of donors, quinone or related compound as acceptor |
| GO:0016702 | 0.0055 | 9.398 | 0.3651 | 3 | 23 | oxidoreductase activity, acting on single donors with incorporation of molecular oxygen, incorporation of two atoms of oxygen |
| GO:0008526 | 0.0066 | 20.8209 | 0.127 | 2 | 8 | phosphatidylinositol transporter activity |
| GO:0008553 | 0.0066 | 20.8209 | 0.127 | 2 | 8 | hydrogen-exporting ATPase activity, phosphorylative mechanism |
| GO:0032395 | 0.0084 | 17.8454 | 0.1429 | 2 | 9 | MHC class II receptor activity |
| GO:0005504 | 0.0087 | 7.8297 | 0.4286 | 3 | 27 | fatty acid binding |
| GOMFID | Pvalue | OddsRatio | ExpCount | Count | Size | Term |
| GO:0019864 | 4e-04 | 27.4217 | 0.1556 | 3 | 10 | IgG binding |
| GO:0050786 | 6e-04 | 23.9925 | 0.1712 | 3 | 11 | RAGE receptor binding |
| GO:0005521 | 0.0015 | 15.991 | 0.2335 | 3 | 15 | lamin binding |
| GO:0016635 | 0.0023 | 42.496 | 0.0778 | 2 | 5 | oxidoreductase activity, acting on the CH-CH group of donors, quinone or related compound as acceptor |
| GO:0016702 | 0.0052 | 9.5898 | 0.358 | 3 | 23 | oxidoreductase activity, acting on single donors with incorporation of molecular oxygen, incorporation of two atoms of oxygen |
| GO:0008526 | 0.0064 | 21.244 | 0.1245 | 2 | 8 | phosphatidylinositol transporter activity |
| GO:0031406 | 0.0064 | 3.0779 | 2.7393 | 8 | 176 | carboxylic acid binding |
| GO:0032395 | 0.0081 | 18.208 | 0.1401 | 2 | 9 | MHC class II receptor activity |
| GO:0005504 | 0.0083 | 7.9895 | 0.4202 | 3 | 27 | fatty acid binding |
| GOMFID | Pvalue | OddsRatio | ExpCount | Count | Size | Term |
| GO:0008094 | 1e-04 | 4.6644 | 2.4268 | 10 | 76 | DNA-dependent ATPase activity |
| GO:0003678 | 6e-04 | 5.5025 | 1.4688 | 7 | 46 | DNA helicase activity |
| GO:0042288 | 0.0022 | 8.7218 | 0.5748 | 4 | 18 | MHC class I protein binding |
| GO:0005515 | 0.0029 | 1.317 | 343.7087 | 373 | 10764 | protein binding |
| GO:0070016 | 0.0033 | 13.0631 | 0.3193 | 3 | 10 | armadillo repeat domain binding |
| GO:0008175 | 0.0088 | 5.5474 | 0.8302 | 4 | 26 | tRNA methyltransferase activity |
| GO:0017111 | 0.0093 | 1.5645 | 24.6829 | 37 | 773 | nucleoside-triphosphatase activity |
| GO:0004563 | 0.0095 | 20.2861 | 0.1597 | 2 | 5 | beta-N-acetylhexosaminidase activity |
| GO:0031727 | 0.0095 | 20.2861 | 0.1597 | 2 | 5 | CCR2 chemokine receptor binding |
| GO:0046976 | 0.0095 | 20.2861 | 0.1597 | 2 | 5 | histone methyltransferase activity (H3-K27 specific) |
| GO:0016740 | 0.0098 | 1.3328 | 72.8673 | 92 | 2282 | transferase activity |
| GOMFID | Pvalue | OddsRatio | ExpCount | Count | Size | Term |
| GO:0005515 | 0.002 | 1.3383 | 327.0449 | 357 | 10505 | protein binding |
| GO:0051033 | 0.003 | 60.9883 | 0.0956 | 2 | 3 | RNA transmembrane transporter activity |
| GO:0070016 | 0.0033 | 13.0894 | 0.3187 | 3 | 10 | armadillo repeat domain binding |
| GO:0005283 | 0.0057 | 10.1793 | 0.3824 | 3 | 12 | sodium:amino acid symporter activity |
| GO:0033192 | 0.0058 | 30.4922 | 0.1275 | 2 | 4 | calmodulin-dependent protein phosphatase activity |
| GO:0035877 | 0.0058 | 30.4922 | 0.1275 | 2 | 4 | death effector domain binding |
| GO:0097016 | 0.0058 | 30.4922 | 0.1275 | 2 | 4 | L27 domain binding |
| GO:0005516 | 0.0064 | 2.3295 | 5.8959 | 13 | 185 | calmodulin binding |
| GO:0004709 | 0.0065 | 6.1152 | 0.7649 | 4 | 24 | MAP kinase kinase kinase activity |
| GO:0004601 | 0.0085 | 4.3724 | 1.2748 | 5 | 40 | peroxidase activity |
| GO:0008175 | 0.0087 | 5.5586 | 0.8286 | 4 | 26 | tRNA methyltransferase activity |
| GO:0008013 | 0.0092 | 3.2037 | 2.3583 | 7 | 74 | beta-catenin binding |
| GO:0004563 | 0.0095 | 20.3268 | 0.1593 | 2 | 5 | beta-N-acetylhexosaminidase activity |
| GO:0031727 | 0.0095 | 20.3268 | 0.1593 | 2 | 5 | CCR2 chemokine receptor binding |
| GO:0046923 | 0.0095 | 20.3268 | 0.1593 | 2 | 5 | ER retention sequence binding |
| GO:0046976 | 0.0095 | 20.3268 | 0.1593 | 2 | 5 | histone methyltransferase activity (H3-K27 specific) |
| GOMFID | Pvalue | OddsRatio | ExpCount | Count | Size | Term |
| GO:0060089 | 0 | 3.6996 | 9.9416 | 29 | 1533 | molecular transducer activity |
| GO:0038023 | 0 | 3.896 | 8.2944 | 26 | 1279 | signaling receptor activity |
| GO:0099600 | 0 | 3.8976 | 7.9053 | 25 | 1219 | transmembrane receptor activity |
| GO:0004930 | 0 | 4.4308 | 5.0778 | 19 | 783 | G-protein coupled receptor activity |
| GO:0004984 | 0 | 6.2257 | 2.3995 | 13 | 370 | olfactory receptor activity |
| GO:0004497 | 3e-04 | 9.1948 | 0.5966 | 5 | 92 | monooxygenase activity |
| GO:0005125 | 5e-04 | 5.4262 | 1.4008 | 7 | 216 | cytokine activity |
| GO:0003828 | 6e-04 | 78.068 | 0.0389 | 2 | 6 | alpha-N-acetylneuraminate alpha-2,8-sialyltransferase activity |
| GO:0016493 | 0.0026 | 31.2155 | 0.0778 | 2 | 12 | C-C chemokine receptor activity |
| GO:0016705 | 0.0029 | 5.4969 | 0.9728 | 5 | 150 | oxidoreductase activity, acting on paired donors, with incorporation or reduction of molecular oxygen |
| GO:0005102 | 0.0053 | 2.1188 | 9.3969 | 18 | 1449 | receptor binding |
| GO:0005129 | 0.0065 | Inf | 0.0065 | 1 | 1 | granulocyte macrophage colony-stimulating factor receptor binding |
| GO:0042924 | 0.0065 | Inf | 0.0065 | 1 | 1 | neuromedin U binding |
| GO:0043843 | 0.0065 | Inf | 0.0065 | 1 | 1 | ADP-specific glucokinase activity |
| GO:0047042 | 0.0065 | Inf | 0.0065 | 1 | 1 | androsterone dehydrogenase (B-specific) activity |
| GO:0050479 | 0.0065 | Inf | 0.0065 | 1 | 1 | glyceryl-ether monooxygenase activity |
| GO:0102116 | 0.0065 | Inf | 0.0065 | 1 | 1 | laurate hydroxylase activity |
| GO:0103002 | 0.0065 | Inf | 0.0065 | 1 | 1 | 16-hydroxypalmitate dehydrogenase activity |
| GO:0042379 | 0.0069 | 8.2709 | 0.3891 | 3 | 60 | chemokine receptor binding |
| GOMFID | Pvalue | OddsRatio | ExpCount | Count | Size | Term |
| GO:0099600 | 0 | 2.9909 | 12.8744 | 33 | 1219 | transmembrane receptor activity |
| GO:0008009 | 0 | 16.6349 | 0.5069 | 7 | 48 | chemokine activity |
| GO:0038023 | 0 | 2.8354 | 13.5081 | 33 | 1279 | signaling receptor activity |
| GO:0060089 | 0 | 2.6807 | 16.1907 | 37 | 1533 | molecular transducer activity |
| GO:0004984 | 0 | 4.243 | 3.9077 | 15 | 370 | olfactory receptor activity |
| GO:0048020 | 0 | 16.8082 | 0.355 | 5 | 34 | CCR chemokine receptor binding |
| GO:0004930 | 0 | 2.9606 | 8.2696 | 22 | 783 | G-protein coupled receptor activity |
| GO:0019955 | 1e-04 | 7.5549 | 1.0245 | 7 | 97 | cytokine binding |
| GO:0019957 | 1e-04 | 47.6607 | 0.0951 | 3 | 9 | C-C chemokine binding |
| GO:0030246 | 1e-04 | 4.3544 | 2.746 | 11 | 260 | carbohydrate binding |
| GO:0032394 | 1e-04 | Inf | 0.0211 | 2 | 2 | MHC class Ib receptor activity |
| GO:0016493 | 2e-04 | 31.7679 | 0.1267 | 3 | 12 | C-C chemokine receptor activity |
| GO:0008392 | 7e-04 | 20.4158 | 0.1795 | 3 | 17 | arachidonic acid epoxygenase activity |
| GO:0042288 | 8e-04 | 19.0536 | 0.1901 | 3 | 18 | MHC class I protein binding |
| GO:0031726 | 0.0011 | 63.1834 | 0.0528 | 2 | 5 | CCR1 chemokine receptor binding |
| GO:0016427 | 0.0016 | 47.3846 | 0.0634 | 2 | 6 | tRNA (cytosine) methyltransferase activity |
| GO:0001664 | 0.0017 | 3.5187 | 2.7248 | 9 | 258 | G-protein coupled receptor binding |
| GO:0005126 | 0.0019 | 3.4484 | 2.7777 | 9 | 263 | cytokine receptor binding |
| GO:0001637 | 0.0022 | 12.9854 | 0.264 | 3 | 25 | G-protein coupled chemoattractant receptor activity |
| GO:0032395 | 0.0038 | 27.0719 | 0.0951 | 2 | 9 | MHC class II receptor activity |
| GO:0016709 | 0.0054 | 9.2103 | 0.3591 | 3 | 34 | oxidoreductase activity, acting on paired donors, with incorporation or reduction of molecular oxygen, NAD(P)H as one donor, and incorporation of one atom of oxygen |
| GO:0005506 | 0.0057 | 3.9265 | 1.6159 | 6 | 153 | iron ion binding |
| GO:0001055 | 0.0057 | 21.0533 | 0.1162 | 2 | 11 | RNA polymerase II activity |
| GO:0048018 | 0.0077 | 2.469 | 4.6998 | 11 | 445 | receptor ligand activity |
| GOMFID | Pvalue | OddsRatio | ExpCount | Count | Size | Term |
| GO:0008175 | 0.0015 | 9.3298 | 0.5026 | 4 | 26 | tRNA methyltransferase activity |
| GO:0016428 | 0.0022 | 51.0482 | 0.0773 | 2 | 4 | tRNA (cytosine-5-)-methyltransferase activity |
| GO:0004568 | 0.0036 | 34.03 | 0.0967 | 2 | 5 | chitinase activity |
| GO:1903231 | 0.004 | 3.3597 | 2.5325 | 8 | 131 | mRNA binding involved in posttranscriptional gene silencing |
| GO:0042379 | 0.006 | 4.6703 | 1.1599 | 5 | 60 | chemokine receptor binding |
| GO:0005496 | 0.0072 | 3.7648 | 1.7012 | 6 | 88 | steroid binding |
| GO:0019956 | 0.0084 | 8.0776 | 0.4253 | 3 | 22 | chemokine binding |
| GO:0015485 | 0.0086 | 5.396 | 0.8119 | 4 | 42 | cholesterol binding |
| GO:0001591 | 0.0097 | 17.0118 | 0.1547 | 2 | 8 | dopamine neurotransmitter receptor activity, coupled via Gi/Go |
| GO:0008061 | 0.0097 | 17.0118 | 0.1547 | 2 | 8 | chitin binding |
| GOMFID | Pvalue | OddsRatio | ExpCount | Count | Size | Term |
| GO:0042803 | 4e-04 | 2.1498 | 13.9706 | 28 | 749 | protein homodimerization activity |
| GO:0042379 | 9e-04 | 5.9441 | 1.1191 | 6 | 60 | chemokine receptor binding |
| GO:0031731 | 0.001 | 105.92 | 0.056 | 2 | 3 | CCR6 chemokine receptor binding |
| GO:0016841 | 0.0033 | 35.3022 | 0.0933 | 2 | 5 | ammonia-lyase activity |
| GO:0005132 | 0.0036 | 11.3772 | 0.3171 | 3 | 17 | type I interferon receptor binding |
| GO:0004602 | 0.0043 | 10.6181 | 0.3357 | 3 | 18 | glutathione peroxidase activity |
| GO:0008289 | 0.0045 | 1.9383 | 11.9561 | 22 | 641 | lipid binding |
| GO:0008174 | 0.0068 | 21.1787 | 0.1306 | 2 | 7 | mRNA methyltransferase activity |
| GO:0016494 | 0.0068 | 21.1787 | 0.1306 | 2 | 7 | C-X-C chemokine receptor activity |
| GO:0031433 | 0.0068 | 21.1787 | 0.1306 | 2 | 7 | telethonin binding |
| GO:0005125 | 0.0075 | 2.6072 | 4.0289 | 10 | 216 | cytokine activity |
| GO:0005102 | 0.0078 | 1.569 | 27.0272 | 40 | 1449 | receptor binding |
| GO:0016835 | 0.0093 | 4.1627 | 1.287 | 5 | 69 | carbon-oxygen lyase activity |
| GOMFID | Pvalue | OddsRatio | ExpCount | Count | Size | Term |
| GO:0004364 | 6e-04 | 12.1156 | 0.3902 | 4 | 26 | glutathione transferase activity |
| GO:0030246 | 0.002 | 2.9894 | 3.9022 | 11 | 260 | carbohydrate binding |
| GO:0019966 | 0.0075 | 18.8986 | 0.1351 | 2 | 9 | interleukin-1 binding |
| GO:0004869 | 0.0099 | 5.1162 | 0.8405 | 4 | 56 | cysteine-type endopeptidase inhibitor activity |
| GOMFID | Pvalue | OddsRatio | ExpCount | Count | Size | Term |
| GO:0022843 | 2e-04 | 4.4002 | 2.4779 | 10 | 129 | voltage-gated cation channel activity |
| GO:0005216 | 0.0021 | 2.3272 | 7.7217 | 17 | 402 | ion channel activity |
| GO:0005509 | 0.0021 | 2.0076 | 12.6582 | 24 | 659 | calcium ion binding |
| GO:0015267 | 0.0023 | 2.2449 | 8.4708 | 18 | 441 | channel activity |
| GO:0022832 | 0.0034 | 2.9474 | 3.5919 | 10 | 187 | voltage-gated channel activity |
| GO:0046873 | 0.0041 | 2.1655 | 8.2595 | 17 | 430 | metal ion transmembrane transporter activity |
| GO:0005251 | 0.0063 | 9.0888 | 0.3842 | 3 | 20 | delayed rectifier potassium channel activity |
| GO:0016433 | 0.0072 | 20.5502 | 0.1345 | 2 | 7 | rRNA (adenine) methyltransferase activity |
| GO:0015450 | 0.0095 | 17.1241 | 0.1537 | 2 | 8 | P-P-bond-hydrolysis-driven protein transmembrane transporter activity |
| GOMFID | Pvalue | OddsRatio | ExpCount | Count | Size | Term |
| GO:0030246 | 0 | 3.845 | 6.3591 | 22 | 260 | carbohydrate binding |
| GO:0045028 | 1e-04 | 26.852 | 0.2446 | 4 | 10 | G-protein coupled purinergic nucleotide receptor activity |
| GO:0048020 | 3e-04 | 7.3483 | 0.9539 | 6 | 39 | CCR chemokine receptor binding |
| GO:0016502 | 7e-04 | 12.3878 | 0.4158 | 4 | 17 | nucleotide receptor activity |
| GO:0005126 | 8e-04 | 2.6504 | 6.4325 | 16 | 263 | cytokine receptor binding |
| GO:0035586 | 0.0015 | 9.4706 | 0.5136 | 4 | 21 | purinergic receptor activity |
| GO:0071723 | 0.0015 | 17.217 | 0.2446 | 3 | 10 | lipopeptide binding |
| GO:0089720 | 0.0015 | 17.217 | 0.2446 | 3 | 10 | caspase binding |
| GO:0001730 | 0.0018 | 80.1726 | 0.0734 | 2 | 3 | 2'-5'-oligoadenylate synthetase activity |
| GO:0005068 | 0.0021 | 15.0639 | 0.269 | 3 | 11 | transmembrane receptor protein tyrosine kinase adaptor activity |
| GO:0019955 | 0.0026 | 3.6386 | 2.3724 | 8 | 97 | cytokine binding |
| GO:0004950 | 0.003 | 7.6647 | 0.6115 | 4 | 25 | chemokine receptor activity |
| GO:0035594 | 0.0035 | 40.0838 | 0.0978 | 2 | 4 | ganglioside binding |
| GO:0004872 | 0.0035 | 1.5451 | 36.418 | 53 | 1489 | receptor activity |
| GO:0016641 | 0.0043 | 10.9535 | 0.3424 | 3 | 14 | oxidoreductase activity, acting on the CH-NH2 group of donors, oxygen as acceptor |
| GO:0019863 | 0.0057 | 26.7208 | 0.1223 | 2 | 5 | IgE binding |
| GO:0030883 | 0.0057 | 26.7208 | 0.1223 | 2 | 5 | endogenous lipid antigen binding |
| GO:0030884 | 0.0057 | 26.7208 | 0.1223 | 2 | 5 | exogenous lipid antigen binding |
| GO:0008009 | 0.0062 | 4.6845 | 1.174 | 5 | 48 | chemokine activity |
| GO:0046625 | 0.0077 | 8.6047 | 0.4158 | 3 | 17 | sphingolipid binding |
| GO:0003823 | 0.008 | 4.3781 | 1.2474 | 5 | 51 | antigen binding |
| GO:0005507 | 0.008 | 4.3781 | 1.2474 | 5 | 51 | copper ion binding |
| GO:0015299 | 0.009 | 8.0305 | 0.4402 | 3 | 18 | solute:proton antiporter activity |
| GOMFID | Pvalue | OddsRatio | ExpCount | Count | Size | Term |
| GO:0030246 | 0 | 3.41 | 6.0861 | 19 | 260 | carbohydrate binding |
| GO:0045028 | 1e-04 | 28.0996 | 0.2341 | 4 | 10 | G-protein coupled purinergic nucleotide receptor activity |
| GO:0089720 | 1e-04 | 28.0996 | 0.2341 | 4 | 10 | caspase binding |
| GO:0048020 | 3e-04 | 7.6914 | 0.9129 | 6 | 39 | CCR chemokine receptor binding |
| GO:0005126 | 5e-04 | 2.7776 | 6.1563 | 16 | 263 | cytokine receptor binding |
| GO:0016502 | 6e-04 | 12.9633 | 0.3979 | 4 | 17 | nucleotide receptor activity |
| GO:0019966 | 0.001 | 21.0186 | 0.2107 | 3 | 9 | interleukin-1 binding |
| GO:0035586 | 0.0013 | 9.9106 | 0.4916 | 4 | 21 | purinergic receptor activity |
| GO:0004872 | 0.0013 | 1.6276 | 34.8546 | 53 | 1489 | receptor activity |
| GO:0071723 | 0.0014 | 18.0148 | 0.2341 | 3 | 10 | lipopeptide binding |
| GO:0031720 | 0.0016 | 83.878 | 0.0702 | 2 | 3 | haptoglobin binding |
| GO:0004950 | 0.0025 | 8.0208 | 0.5852 | 4 | 25 | chemokine receptor activity |
| GO:0008009 | 0.0051 | 4.9027 | 1.1236 | 5 | 48 | chemokine activity |
| GO:0019863 | 0.0052 | 27.9558 | 0.117 | 2 | 5 | IgE binding |
| GO:0030883 | 0.0052 | 27.9558 | 0.117 | 2 | 5 | endogenous lipid antigen binding |
| GO:0030884 | 0.0052 | 27.9558 | 0.117 | 2 | 5 | exogenous lipid antigen binding |
| GO:0005507 | 0.0067 | 4.5821 | 1.1938 | 5 | 51 | copper ion binding |
| GO:0001664 | 0.008 | 2.2568 | 6.0393 | 13 | 258 | G-protein coupled receptor binding |
| GOMFID | Pvalue | OddsRatio | ExpCount | Count | Size | Term |
| GO:0048020 | 1e-04 | 10.5362 | 0.6744 | 6 | 39 | CCR chemokine receptor binding |
| GO:0008061 | 3e-04 | 34.4534 | 0.1383 | 3 | 8 | chitin binding |
| GO:0017171 | 3e-04 | 3.5716 | 3.6144 | 12 | 209 | serine hydrolase activity |
| GO:0004878 | 3e-04 | Inf | 0.0346 | 2 | 2 | complement component C5a receptor activity |
| GO:0032394 | 3e-04 | Inf | 0.0346 | 2 | 2 | MHC class Ib receptor activity |
| GO:0004252 | 0.001 | 3.4917 | 3.061 | 10 | 177 | serine-type endopeptidase activity |
| GO:0008009 | 0.0014 | 6.7095 | 0.8301 | 5 | 48 | chemokine activity |
| GO:0000253 | 0.0017 | 57.2266 | 0.0692 | 2 | 4 | 3-keto sterol reductase activity |
| GO:0018685 | 0.0017 | 57.2266 | 0.0692 | 2 | 4 | alkane 1-monooxygenase activity |
| GO:0050051 | 0.0017 | 57.2266 | 0.0692 | 2 | 4 | leukotriene-B4 20-monooxygenase activity |
| GO:0016614 | 0.0019 | 3.8064 | 2.2482 | 8 | 130 | oxidoreductase activity, acting on CH-OH group of donors |
| GO:0000339 | 0.0024 | 13.2447 | 0.2767 | 3 | 16 | RNA cap binding |
| GO:0070011 | 0.0028 | 2.1009 | 10.0649 | 20 | 582 | peptidase activity, acting on L-amino acid peptides |
| GO:0004568 | 0.0029 | 38.1487 | 0.0865 | 2 | 5 | chitinase activity |
| GO:0140096 | 0.0083 | 1.4885 | 37.4578 | 52 | 2166 | catalytic activity, acting on a protein |
| GO:0052650 | 0.0099 | 16.3453 | 0.1556 | 2 | 9 | NADP-retinol dehydrogenase activity |
| GOMFID | Pvalue | OddsRatio | ExpCount | Count | Size | Term |
| GO:0048020 | 0 | 12.4765 | 0.5733 | 6 | 39 | CCR chemokine receptor binding |
| GO:0008061 | 2e-04 | 40.7183 | 0.1176 | 3 | 8 | chitin binding |
| GO:0032394 | 2e-04 | Inf | 0.0294 | 2 | 2 | MHC class Ib receptor activity |
| GO:0008009 | 7e-04 | 7.9399 | 0.7056 | 5 | 48 | chemokine activity |
| GO:0018685 | 0.0013 | 67.589 | 0.0588 | 2 | 4 | alkane 1-monooxygenase activity |
| GO:0050051 | 0.0013 | 67.589 | 0.0588 | 2 | 4 | leukotriene-B4 20-monooxygenase activity |
| GO:0004568 | 0.0021 | 45.0565 | 0.0735 | 2 | 5 | chitinase activity |
| GO:0015144 | 0.0033 | 7.1592 | 0.6174 | 4 | 42 | carbohydrate transmembrane transporter activity |
| GO:0005509 | 0.0041 | 2.0758 | 9.687 | 19 | 659 | calcium ion binding |
| GOMFID | Pvalue | OddsRatio | ExpCount | Count | Size | Term |
| GO:0004984 | 0 | 6.8636 | 3.085 | 18 | 370 | olfactory receptor activity |
| GO:0004930 | 0 | 4.1331 | 6.5286 | 23 | 783 | G-protein coupled receptor activity |
| GO:0038023 | 0 | 3.3872 | 10.6643 | 30 | 1279 | signaling receptor activity |
| GO:0099600 | 0 | 3.4177 | 10.164 | 29 | 1219 | transmembrane receptor activity |
| GO:0060089 | 0 | 3.1395 | 12.7821 | 33 | 1533 | molecular transducer activity |
| GO:0005126 | 1e-04 | 5.0576 | 2.1685 | 10 | 262 | cytokine receptor binding |
| GO:0004769 | 1e-04 | Inf | 0.0167 | 2 | 2 | steroid delta-isomerase activity |
| GO:0102294 | 1e-04 | Inf | 0.0167 | 2 | 2 | cholesterol dehydrogenase activity |
| GO:0003854 | 4e-04 | 120.7068 | 0.0334 | 2 | 4 | 3-beta-hydroxy-delta5-steroid dehydrogenase activity |
| GO:0004896 | 6e-04 | 7.8787 | 0.6921 | 5 | 83 | cytokine receptor activity |
| GO:0008009 | 7e-04 | 11.1117 | 0.4002 | 4 | 48 | chemokine activity |
| GO:0048248 | 7e-04 | 80.4662 | 0.0417 | 2 | 5 | CXCR3 chemokine receptor binding |
| GO:0001637 | 0.0011 | 16.564 | 0.2084 | 3 | 25 | G-protein coupled chemoattractant receptor activity |
| GO:0016229 | 0.0013 | 15.8429 | 0.2168 | 3 | 26 | steroid dehydrogenase activity |
| GO:0019957 | 0.0024 | 34.4769 | 0.075 | 2 | 9 | C-C chemokine binding |
| GO:0048018 | 0.0041 | 2.8728 | 3.7104 | 10 | 445 | receptor ligand activity |
| GO:0016493 | 0.0043 | 24.1293 | 0.1001 | 2 | 12 | C-C chemokine receptor activity |
| GO:0044548 | 0.0051 | 21.9344 | 0.1084 | 2 | 13 | S100 protein binding |
| GO:0005174 | 0.0083 | Inf | 0.0083 | 1 | 1 | CD40 receptor binding |
| GO:0015130 | 0.0083 | Inf | 0.0083 | 1 | 1 | mevalonate transmembrane transporter activity |
| GO:0030380 | 0.0083 | Inf | 0.0083 | 1 | 1 | interleukin-17E receptor binding |
| GO:0070002 | 0.0083 | Inf | 0.0083 | 1 | 1 | glutamic-type peptidase activity |
| GO:1902122 | 0.0083 | Inf | 0.0083 | 1 | 1 | chenodeoxycholic acid binding |
| GO:0005416 | 0.0097 | 15.0752 | 0.1501 | 2 | 18 | cation:amino acid symporter activity |
| GOMFID | Pvalue | OddsRatio | ExpCount | Count | Size | Term |
| GO:0004984 | 0 | 6.6377 | 2.8108 | 16 | 370 | olfactory receptor activity |
| GO:0099600 | 0 | 3.6816 | 9.2605 | 28 | 1219 | transmembrane receptor activity |
| GO:0004930 | 0 | 4.3813 | 5.9483 | 22 | 783 | G-protein coupled receptor activity |
| GO:0038023 | 0 | 3.3283 | 9.7163 | 27 | 1279 | signaling receptor activity |
| GO:0060089 | 0 | 2.9875 | 11.6459 | 29 | 1533 | molecular transducer activity |
| GO:0005126 | 2e-04 | 4.9787 | 1.9743 | 9 | 262 | cytokine receptor binding |
| GO:0015125 | 2e-04 | 33.45 | 0.114 | 3 | 15 | bile acid transmembrane transporter activity |
| GO:0005125 | 3e-04 | 6.1031 | 1.2488 | 7 | 168 | cytokine activity |
| GO:0004896 | 4e-04 | 8.6864 | 0.6305 | 5 | 83 | cytokine receptor activity |
| GO:0046943 | 5e-04 | 6.5407 | 0.9952 | 6 | 131 | carboxylic acid transmembrane transporter activity |
| GO:0001637 | 9e-04 | 18.2341 | 0.1899 | 3 | 25 | G-protein coupled chemoattractant receptor activity |
| GO:0030545 | 9e-04 | 3.325 | 3.5857 | 11 | 472 | receptor regulator activity |
| GO:0019957 | 0.002 | 37.9244 | 0.0684 | 2 | 9 | C-C chemokine binding |
| GO:0016493 | 0.0036 | 26.5421 | 0.0912 | 2 | 12 | C-C chemokine receptor activity |
| GO:0004867 | 0.0047 | 6.3205 | 0.6761 | 4 | 89 | serine-type endopeptidase inhibitor activity |
| GO:0008009 | 0.0058 | 8.9017 | 0.3646 | 3 | 48 | chemokine activity |
| GO:0015291 | 0.0074 | 3.7113 | 1.7093 | 6 | 225 | secondary active transmembrane transporter activity |
| GO:0015130 | 0.0076 | Inf | 0.0076 | 1 | 1 | mevalonate transmembrane transporter activity |
| GO:0030380 | 0.0076 | Inf | 0.0076 | 1 | 1 | interleukin-17E receptor binding |
| GO:0043843 | 0.0076 | Inf | 0.0076 | 1 | 1 | ADP-specific glucokinase activity |
| GO:0005416 | 0.0081 | 16.5826 | 0.1367 | 2 | 18 | cation:amino acid symporter activity |
| GO:0061135 | 0.0094 | 4.1091 | 1.2839 | 5 | 169 | endopeptidase regulator activity |
| GO:0030414 | 0.0099 | 4.0591 | 1.2991 | 5 | 171 | peptidase inhibitor activity |
| GOMFID | Pvalue | OddsRatio | ExpCount | Count | Size | Term |
| GO:0004984 | 1e-04 | 4.6977 | 2.3538 | 10 | 370 | olfactory receptor activity |
| GO:0004930 | 1e-04 | 3.4002 | 4.9811 | 15 | 783 | G-protein coupled receptor activity |
| GO:0099600 | 2e-04 | 2.8063 | 7.7547 | 19 | 1219 | transmembrane receptor activity |
| GO:0048248 | 4e-04 | 106.1716 | 0.0318 | 2 | 5 | CXCR3 chemokine receptor binding |
| GO:0060089 | 6e-04 | 2.4688 | 9.7523 | 21 | 1533 | molecular transducer activity |
| GO:0038023 | 0.0011 | 2.49 | 8.1364 | 18 | 1279 | signaling receptor activity |
| GO:0008009 | 0.0035 | 10.6953 | 0.3054 | 3 | 48 | chemokine activity |
| GO:0004252 | 0.0055 | 4.7212 | 1.126 | 5 | 177 | serine-type endopeptidase activity |
| GO:0005129 | 0.0064 | Inf | 0.0064 | 1 | 1 | granulocyte macrophage colony-stimulating factor receptor binding |
| GO:0005459 | 0.0064 | Inf | 0.0064 | 1 | 1 | UDP-galactose transmembrane transporter activity |
| GO:0030380 | 0.0064 | Inf | 0.0064 | 1 | 1 | interleukin-17E receptor binding |
| GO:0033038 | 0.0071 | 17.6788 | 0.1272 | 2 | 20 | bitter taste receptor activity |
| GOMFID | Pvalue | OddsRatio | ExpCount | Count | Size | Term |
| GO:0004984 | 0 | 8.7748 | 2.6509 | 19 | 370 | olfactory receptor activity |
| GO:0008009 | 0 | 29.6944 | 0.3439 | 8 | 48 | chemokine activity |
| GO:0004930 | 0 | 4.9837 | 5.6098 | 23 | 783 | G-protein coupled receptor activity |
| GO:0048020 | 0 | 26.5157 | 0.2794 | 6 | 39 | CCR chemokine receptor binding |
| GO:0099600 | 0 | 3.4239 | 8.7335 | 25 | 1219 | transmembrane receptor activity |
| GO:0060089 | 0 | 2.9348 | 10.9831 | 27 | 1533 | molecular transducer activity |
| GO:0038023 | 0 | 3.0805 | 9.1634 | 24 | 1279 | signaling receptor activity |
| GO:0005126 | 0 | 6.0619 | 1.8379 | 10 | 261 | cytokine receptor binding |
| GO:0048018 | 0 | 4.5703 | 3.1882 | 13 | 445 | receptor ligand activity |
| GO:0001664 | 5e-04 | 4.6889 | 1.8484 | 8 | 258 | G-protein coupled receptor binding |
| GO:0016004 | 0.0027 | 31.3177 | 0.0788 | 2 | 11 | phospholipase activator activity |
| GO:0005133 | 0.0072 | Inf | 0.0072 | 1 | 1 | interferon-gamma receptor binding |
| GO:0030380 | 0.0072 | Inf | 0.0072 | 1 | 1 | interleukin-17E receptor binding |
| GO:0033038 | 0.0089 | 15.6501 | 0.1433 | 2 | 20 | bitter taste receptor activity |
| GOMFID | Pvalue | OddsRatio | ExpCount | Count | Size | Term |
| GO:0031433 | 0.0011 | 55.8922 | 0.0506 | 2 | 7 | telethonin binding |
| GO:0016409 | 0.0022 | 12.7919 | 0.2601 | 3 | 36 | palmitoyltransferase activity |
| GO:0016863 | 0.0027 | 31.0435 | 0.0795 | 2 | 11 | intramolecular oxidoreductase activity, transposing C=C bonds |
| GO:0015095 | 0.0051 | 21.4863 | 0.1084 | 2 | 15 | magnesium ion transmembrane transporter activity |
| GO:0004984 | 0.0054 | 3.1856 | 2.6737 | 8 | 370 | olfactory receptor activity |
| GO:0008106 | 0.0058 | 19.9503 | 0.1156 | 2 | 16 | alcohol dehydrogenase (NADP+) activity |
| GO:0008329 | 0.0066 | 18.6191 | 0.1228 | 2 | 17 | signaling pattern recognition receptor activity |
| GO:0061783 | 0.0066 | 18.6191 | 0.1228 | 2 | 17 | peptidoglycan muralytic activity |
| GO:0001760 | 0.0072 | Inf | 0.0072 | 1 | 1 | aminocarboxymuconate-semialdehyde decarboxylase activity |
| GO:0008120 | 0.0072 | Inf | 0.0072 | 1 | 1 | ceramide glucosyltransferase activity |
| GO:0008336 | 0.0072 | Inf | 0.0072 | 1 | 1 | gamma-butyrobetaine dioxygenase activity |
| GO:0015130 | 0.0072 | Inf | 0.0072 | 1 | 1 | mevalonate transmembrane transporter activity |
| GO:0016517 | 0.0072 | Inf | 0.0072 | 1 | 1 | interleukin-12 receptor activity |
| GO:0018455 | 0.0072 | Inf | 0.0072 | 1 | 1 | alcohol dehydrogenase [NAD(P)+] activity |
| GO:0047042 | 0.0072 | Inf | 0.0072 | 1 | 1 | androsterone dehydrogenase (B-specific) activity |
| GO:0050129 | 0.0072 | Inf | 0.0072 | 1 | 1 | N-formylglutamate deformylase activity |
| GO:0050459 | 0.0072 | Inf | 0.0072 | 1 | 1 | ethanolamine-phosphate phospho-lyase activity |
| GO:0102769 | 0.0072 | Inf | 0.0072 | 1 | 1 | dihydroceramide glucosyltransferase activity |
| GO:1990698 | 0.0072 | Inf | 0.0072 | 1 | 1 | palmitoleoyltransferase activity |
| GO:0033293 | 0.0085 | 7.6646 | 0.4191 | 3 | 58 | monocarboxylic acid binding |
| GO:0043177 | 0.0092 | 4.1274 | 1.279 | 5 | 177 | organic acid binding |
| GOMFID | Pvalue | OddsRatio | ExpCount | Count | Size | Term |
| GO:0004984 | 0 | 3.9478 | 5.3246 | 19 | 370 | olfactory receptor activity |
| GO:0005549 | 0 | 7.5297 | 1.1944 | 8 | 83 | odorant binding |
| GO:0004930 | 1e-04 | 2.5222 | 11.2679 | 26 | 783 | G-protein coupled receptor activity |
| GO:0038023 | 8e-04 | 1.9482 | 18.4057 | 33 | 1279 | signaling receptor activity |
| GO:0004583 | 0.0012 | 69.0736 | 0.0576 | 2 | 4 | dolichyl-phosphate-glucose-glycolipid alpha-glucosyltransferase activity |
| GO:0060089 | 0.0041 | 1.7063 | 22.061 | 35 | 1533 | molecular transducer activity |
| GO:0016853 | 0.0045 | 3.6303 | 2.0435 | 7 | 142 | isomerase activity |
| GO:0099600 | 0.0052 | 1.7642 | 17.5423 | 29 | 1219 | transmembrane receptor activity |
| GO:0071855 | 0.0074 | 8.3129 | 0.4029 | 3 | 28 | neuropeptide receptor binding |
| GOMFID | Pvalue | OddsRatio | ExpCount | Count | Size | Term |
| GO:0004911 | 3e-04 | Inf | 0.0363 | 2 | 2 | interleukin-2 receptor activity |
| GO:0019976 | 3e-04 | Inf | 0.0363 | 2 | 2 | interleukin-2 binding |
| GO:0102953 | 0.0032 | 36.2877 | 0.0908 | 2 | 5 | hypoglycin A gamma-glutamyl transpeptidase activity |
| GO:0036374 | 0.0065 | 21.7699 | 0.1271 | 2 | 7 | glutathione hydrolase activity |
| GOMFID | Pvalue | OddsRatio | ExpCount | Count | Size | Term |
| GO:0032394 | 6e-04 | Inf | 0.0508 | 2 | 2 | MHC class Ib receptor activity |
| GO:0031720 | 0.0019 | 77.1589 | 0.0762 | 2 | 3 | haptoglobin binding |
| GO:0035663 | 0.0019 | 77.1589 | 0.0762 | 2 | 3 | Toll-like receptor 2 binding |
| GO:0050220 | 0.0019 | 77.1589 | 0.0762 | 2 | 3 | prostaglandin-E synthase activity |
| GO:1900750 | 0.003 | 12.8848 | 0.3046 | 3 | 12 | oligopeptide binding |
| GO:0031014 | 0.0037 | 38.577 | 0.1015 | 2 | 4 | troponin T binding |
| GO:0005523 | 0.0048 | 10.5408 | 0.3554 | 3 | 14 | tropomyosin binding |
| GO:0015057 | 0.0061 | 25.7164 | 0.1269 | 2 | 5 | thrombin-activated receptor activity |
| GO:0072341 | 0.007 | 3.8176 | 1.7008 | 6 | 67 | modified amino acid binding |
| GO:0016805 | 0.0071 | 8.918 | 0.4062 | 3 | 16 | dipeptidase activity |
| GO:0005149 | 0.0085 | 8.2805 | 0.4315 | 3 | 17 | interleukin-1 receptor binding |
| GO:0005319 | 0.0087 | 2.7162 | 3.5031 | 9 | 138 | lipid transporter activity |
| GO:0004565 | 0.009 | 19.2861 | 0.1523 | 2 | 6 | beta-galactosidase activity |
| GO:0019237 | 0.009 | 19.2861 | 0.1523 | 2 | 6 | centromeric DNA binding |
| NA. |
| n/a |
| NA. |
| n/a |
| NA. |
| n/a |
| NA. |
| n/a |
| NA. |
| n/a |
| NA. |
| n/a |
| NA. |
| n/a |
| NA. |
| n/a |
| NA. |
| n/a |
| NA. |
| n/a |
| NA. |
| n/a |
| NA. |
| n/a |
| NA. |
| n/a |
| NA. |
| n/a |
| NA. |
| n/a |
| NA. |
| n/a |
| NA. |
| n/a |
| NA. |
| n/a |
| NA. |
| n/a |
| NA. |
| n/a |
| NA. |
| n/a |
| NA. |
| n/a |
| NA. |
| n/a |
| NA. |
| n/a |
| NA. |
| n/a |
| NA. |
| n/a |
| NA. |
| n/a |
| NA. |
| n/a |
| NA. |
| n/a |
| NA. |
| n/a |
| NA. |
| n/a |
| NA. |
| n/a |
| NA. |
| n/a |
| NA. |
| n/a |
| NA. |
| n/a |
| NA. |
| n/a |
| NA. |
| n/a |
| NA. |
| n/a |
| NA. |
| n/a |
| NA. |
| n/a |
| NA. |
| n/a |
| NA. |
| n/a |
| NA. |
| n/a |
| NA. |
| n/a |
| NA. |
| n/a |
| NA. |
| n/a |
| NA. |
| n/a |
| NA. |
| n/a |
| NA. |
| n/a |
| NA. |
| n/a |
| NA. |
| n/a |
| NA. |
| n/a |
| NA. |
| n/a |
| NA. |
| n/a |
| NA. |
| n/a |
| NA. |
| n/a |
| GOMFID | Pvalue | OddsRatio | ExpCount | Count | Size | Term |
| GO:0043312 | 0 | 4.6189 | 7.5054 | 30 | 467 | neutrophil degranulation |
| GO:0042119 | 0 | 4.5126 | 7.6661 | 30 | 477 | neutrophil activation |
| GO:0002444 | 0 | 4.2516 | 8.3893 | 31 | 522 | myeloid leukocyte mediated immunity |
| GO:0002275 | 0 | 4.1139 | 8.3411 | 30 | 519 | myeloid cell activation involved in immune response |
| GO:0002263 | 0 | 3.4158 | 10.6071 | 32 | 660 | cell activation involved in immune response |
| GO:0045055 | 0 | 3.0464 | 11.3786 | 31 | 708 | regulated exocytosis |
| GO:0045321 | 0 | 2.4163 | 18.0321 | 39 | 1122 | leukocyte activation |
| GO:0032940 | 0 | 2.169 | 22.0982 | 43 | 1375 | secretion by cell |
| GO:0061844 | 2e-04 | 8.3315 | 0.8196 | 6 | 51 | antimicrobial humoral immune response mediated by antimicrobial peptide |
| GO:1900239 | 2e-04 | 37.1488 | 0.1286 | 3 | 8 | regulation of phenotypic switching |
| GO:0044663 | 3e-04 | Inf | 0.0321 | 2 | 2 | establishment or maintenance of cell type involved in phenotypic switching |
| GO:0070947 | 3e-04 | Inf | 0.0321 | 2 | 2 | neutrophil mediated killing of fungus |
| GO:0031640 | 3e-04 | 7.2068 | 0.9321 | 6 | 58 | killing of cells of other organism |
| GO:0035821 | 5e-04 | 4.2551 | 2.2821 | 9 | 142 | modification of morphology or physiology of other organism |
| GO:0043207 | 7e-04 | 2.1272 | 13.1143 | 26 | 816 | response to external biotic stimulus |
| GO:0051240 | 8e-04 | 1.826 | 23.8018 | 40 | 1481 | positive regulation of multicellular organismal process |
| GO:0009617 | 9e-04 | 2.3911 | 8.4696 | 19 | 527 | response to bacterium |
| GO:0051852 | 0.0013 | 16.8795 | 0.225 | 3 | 14 | disruption by host of symbiont cells |
| GO:0002698 | 0.0014 | 4.5123 | 1.6714 | 7 | 104 | negative regulation of immune effector process |
| GO:0009620 | 0.0014 | 6.6207 | 0.8357 | 5 | 52 | response to fungus |
| GO:1901668 | 0.0015 | 61.6873 | 0.0643 | 2 | 4 | regulation of superoxide dismutase activity |
| GO:0001817 | 0.0016 | 2.2192 | 9.5786 | 20 | 596 | regulation of cytokine production |
| GO:0031348 | 0.0016 | 6.4584 | 0.8538 | 5 | 54 | negative regulation of defense response |
| GO:0051896 | 0.0019 | 3.2082 | 3.3107 | 10 | 206 | regulation of protein kinase B signaling |
| GO:0019730 | 0.0019 | 8.4425 | 0.5359 | 4 | 34 | antimicrobial humoral response |
| GO:0045766 | 0.0022 | 3.7111 | 2.2982 | 8 | 143 | positive regulation of angiogenesis |
| GO:0016192 | 0.0023 | 1.6679 | 28.5429 | 44 | 1776 | vesicle-mediated transport |
| GO:0060414 | 0.0025 | 41.1223 | 0.0804 | 2 | 5 | aorta smooth muscle tissue morphogenesis |
| GO:0051234 | 0.0025 | 1.453 | 78.5089 | 100 | 4885 | establishment of localization |
| GO:0050830 | 0.0028 | 4.6182 | 1.3982 | 6 | 87 | defense response to Gram-positive bacterium |
| GO:0001816 | 0.0028 | 5.6053 | 0.9705 | 5 | 63 | cytokine production |
| GO:1901342 | 0.0029 | 2.6826 | 4.725 | 12 | 294 | regulation of vasculature development |
| GO:0019731 | 0.0031 | 7.2992 | 0.6107 | 4 | 38 | antibacterial humoral response |
| GO:0032682 | 0.0033 | 11.601 | 0.3054 | 3 | 19 | negative regulation of chemokine production |
| GO:0051094 | 0.0035 | 1.7622 | 19.3821 | 32 | 1206 | positive regulation of developmental process |
| GO:0010269 | 0.0037 | 30.8398 | 0.0964 | 2 | 6 | response to selenium ion |
| GO:2001015 | 0.0037 | 30.8398 | 0.0964 | 2 | 6 | negative regulation of skeletal muscle cell differentiation |
| GO:0019430 | 0.0044 | 10.3107 | 0.3375 | 3 | 21 | removal of superoxide radicals |
| GO:0045087 | 0.0045 | 1.8866 | 13.4679 | 24 | 838 | innate immune response |
| GO:0032757 | 0.0049 | 6.3614 | 0.6911 | 4 | 43 | positive regulation of interleukin-8 production |
| GO:0044003 | 0.0049 | 6.3614 | 0.6911 | 4 | 43 | modification by symbiont of host morphology or physiology |
| GO:0009635 | 0.0051 | 24.6703 | 0.1125 | 2 | 7 | response to herbicide |
| GO:0051597 | 0.0051 | 24.6703 | 0.1125 | 2 | 7 | response to methylmercury |
| GO:0070244 | 0.0051 | 24.6703 | 0.1125 | 2 | 7 | negative regulation of thymocyte apoptotic process |
| GO:0071450 | 0.0057 | 9.2785 | 0.3696 | 3 | 23 | cellular response to oxygen radical |
| GO:2000482 | 0.0057 | 9.2785 | 0.3696 | 3 | 23 | regulation of interleukin-8 secretion |
| GO:0071702 | 0.0064 | 1.4886 | 42.2839 | 58 | 2631 | organic substance transport |
| GO:0002719 | 0.0065 | 8.8361 | 0.3857 | 3 | 24 | negative regulation of cytokine production involved in immune response |
| GO:0070942 | 0.0068 | 20.5573 | 0.1286 | 2 | 8 | neutrophil mediated cytotoxicity |
| GO:0090286 | 0.0068 | 20.5573 | 0.1286 | 2 | 8 | cytoskeletal anchoring at nuclear membrane |
| GO:1900165 | 0.0068 | 20.5573 | 0.1286 | 2 | 8 | negative regulation of interleukin-6 secretion |
| GO:1904951 | 0.0069 | 2.0997 | 8.0036 | 16 | 498 | positive regulation of establishment of protein localization |
| GO:0002221 | 0.007 | 3.0306 | 2.7804 | 8 | 173 | pattern recognition receptor signaling pathway |
| GO:0002793 | 0.007 | 2.635 | 3.9857 | 10 | 248 | positive regulation of peptide secretion |
| GO:0001558 | 0.0072 | 2.2873 | 5.9625 | 13 | 371 | regulation of cell growth |
| GO:0000302 | 0.0072 | 2.7894 | 3.3911 | 9 | 211 | response to reactive oxygen species |
| GO:0070206 | 0.0078 | 5.5111 | 0.7875 | 4 | 49 | protein trimerization |
| GO:0000303 | 0.0081 | 8.0667 | 0.4179 | 3 | 26 | response to superoxide |
| GO:0033234 | 0.0086 | 17.6194 | 0.1446 | 2 | 9 | negative regulation of protein sumoylation |
| GO:0070255 | 0.0086 | 17.6194 | 0.1446 | 2 | 9 | regulation of mucus secretion |
| GO:1902931 | 0.0086 | 17.6194 | 0.1446 | 2 | 9 | negative regulation of alcohol biosynthetic process |
| GO:0010614 | 0.009 | 7.7301 | 0.4339 | 3 | 27 | negative regulation of cardiac muscle hypertrophy |
| GO:0080134 | 0.0092 | 1.6248 | 21.5357 | 33 | 1340 | regulation of response to stress |
| GO:0050715 | 0.0094 | 3.5234 | 1.8 | 6 | 112 | positive regulation of cytokine secretion |
| GO:0050728 | 0.0098 | 3.4903 | 1.8161 | 6 | 113 | negative regulation of inflammatory response |
| GO:0030851 | 0.01 | 7.4205 | 0.45 | 3 | 28 | granulocyte differentiation |
| GOMFID | Pvalue | OddsRatio | ExpCount | Count | Size | Term |
| GO:0043312 | 0 | 4.8089 | 7.2466 | 30 | 467 | neutrophil degranulation |
| GO:0042119 | 0 | 4.6983 | 7.4017 | 30 | 477 | neutrophil activation |
| GO:0002444 | 0 | 4.4273 | 8.1 | 31 | 522 | myeloid leukocyte mediated immunity |
| GO:0002275 | 0 | 4.2831 | 8.0534 | 30 | 519 | myeloid cell activation involved in immune response |
| GO:0002263 | 0 | 3.6917 | 10.2414 | 33 | 660 | cell activation involved in immune response |
| GO:0045055 | 0 | 3.1724 | 10.9862 | 31 | 708 | regulated exocytosis |
| GO:0045321 | 0 | 2.6796 | 17.4103 | 41 | 1122 | leukocyte activation |
| GO:0032940 | 0 | 2.1988 | 21.3362 | 42 | 1375 | secretion by cell |
| GO:0044663 | 2e-04 | Inf | 0.031 | 2 | 2 | establishment or maintenance of cell type involved in phenotypic switching |
| GO:0070947 | 2e-04 | Inf | 0.031 | 2 | 2 | neutrophil mediated killing of fungus |
| GO:0009617 | 6e-04 | 2.4849 | 8.1776 | 19 | 527 | response to bacterium |
| GO:0043207 | 9e-04 | 2.1159 | 12.6621 | 25 | 816 | response to external biotic stimulus |
| GO:0061844 | 0.0011 | 7.0155 | 0.7914 | 5 | 51 | antimicrobial humoral immune response mediated by antimicrobial peptide |
| GO:0051852 | 0.0012 | 17.4995 | 0.2172 | 3 | 14 | disruption by host of symbiont cells |
| GO:0009620 | 0.0012 | 6.8658 | 0.8069 | 5 | 52 | response to fungus |
| GO:0035821 | 0.0017 | 3.8791 | 2.2034 | 8 | 142 | modification of morphology or physiology of other organism |
| GO:0019730 | 0.0017 | 8.7248 | 0.5191 | 4 | 34 | antimicrobial humoral response |
| GO:0031640 | 0.002 | 6.0862 | 0.9 | 5 | 58 | killing of cells of other organism |
| GO:0016192 | 0.0021 | 1.6924 | 27.5586 | 43 | 1776 | vesicle-mediated transport |
| GO:0006664 | 0.0022 | 4.1623 | 1.8 | 7 | 116 | glycolipid metabolic process |
| GO:0060414 | 0.0023 | 42.6267 | 0.0776 | 2 | 5 | aorta smooth muscle tissue morphogenesis |
| GO:0019731 | 0.0028 | 7.5683 | 0.5897 | 4 | 38 | antibacterial humoral response |
| GO:0032682 | 0.003 | 12.0271 | 0.2948 | 3 | 19 | negative regulation of chemokine production |
| GO:0010269 | 0.0035 | 31.968 | 0.0931 | 2 | 6 | response to selenium ion |
| GO:2001015 | 0.0035 | 31.968 | 0.0931 | 2 | 6 | negative regulation of skeletal muscle cell differentiation |
| GO:0032496 | 0.0035 | 2.6236 | 4.8259 | 12 | 311 | response to lipopolysaccharide |
| GO:0051234 | 0.0037 | 1.4391 | 75.8017 | 96 | 4885 | establishment of localization |
| GO:0051250 | 0.0038 | 3.7466 | 1.9862 | 7 | 128 | negative regulation of lymphocyte activation |
| GO:1904018 | 0.0041 | 3.3274 | 2.5448 | 8 | 164 | positive regulation of vasculature development |
| GO:0044003 | 0.0043 | 6.5959 | 0.6672 | 4 | 43 | modification by symbiont of host morphology or physiology |
| GO:0002704 | 0.0047 | 6.4306 | 0.6828 | 4 | 44 | negative regulation of leukocyte mediated immunity |
| GO:0050866 | 0.0048 | 3.2434 | 2.6069 | 8 | 168 | negative regulation of cell activation |
| GO:0009635 | 0.0048 | 25.5728 | 0.1086 | 2 | 7 | response to herbicide |
| GO:0051597 | 0.0048 | 25.5728 | 0.1086 | 2 | 7 | response to methylmercury |
| GO:0070244 | 0.0048 | 25.5728 | 0.1086 | 2 | 7 | negative regulation of thymocyte apoptotic process |
| GO:0045087 | 0.0058 | 1.8698 | 13.0034 | 23 | 838 | innate immune response |
| GO:0002719 | 0.0059 | 9.1606 | 0.3724 | 3 | 24 | negative regulation of cytokine production involved in immune response |
| GO:0070942 | 0.0063 | 21.3093 | 0.1241 | 2 | 8 | neutrophil mediated cytotoxicity |
| GO:0090286 | 0.0063 | 21.3093 | 0.1241 | 2 | 8 | cytoskeletal anchoring at nuclear membrane |
| GO:1900165 | 0.0063 | 21.3093 | 0.1241 | 2 | 8 | negative regulation of interleukin-6 secretion |
| GO:1900239 | 0.0063 | 21.3093 | 0.1241 | 2 | 8 | regulation of phenotypic switching |
| GO:0070206 | 0.0069 | 5.7143 | 0.7603 | 4 | 49 | protein trimerization |
| GO:0001816 | 0.0071 | 2.629 | 3.9969 | 10 | 265 | cytokine production |
| GO:0033234 | 0.008 | 18.264 | 0.1397 | 2 | 9 | negative regulation of protein sumoylation |
| GO:0070255 | 0.008 | 18.264 | 0.1397 | 2 | 9 | regulation of mucus secretion |
| GO:1902931 | 0.008 | 18.264 | 0.1397 | 2 | 9 | negative regulation of alcohol biosynthetic process |
| GO:0072606 | 0.0082 | 8.0141 | 0.419 | 3 | 27 | interleukin-8 secretion |
| GO:0050728 | 0.0084 | 3.62 | 1.7534 | 6 | 113 | negative regulation of inflammatory response |
| GO:0001819 | 0.0088 | 2.2281 | 6.1138 | 13 | 394 | positive regulation of cytokine production |
| GO:0030851 | 0.0091 | 7.693 | 0.4345 | 3 | 28 | granulocyte differentiation |
| GO:0050854 | 0.0091 | 5.2465 | 0.8224 | 4 | 53 | regulation of antigen receptor-mediated signaling pathway |
| GO:0031348 | 0.0092 | 5.2334 | 0.8237 | 4 | 54 | negative regulation of defense response |
| GO:2000116 | 0.0094 | 2.6668 | 3.5379 | 9 | 228 | regulation of cysteine-type endopeptidase activity |
| GO:0006853 | 0.0099 | 15.98 | 0.1552 | 2 | 10 | carnitine shuttle |
| GOMFID | Pvalue | OddsRatio | ExpCount | Count | Size | Term |
| GO:1903039 | 0 | 3.2516 | 6.7546 | 20 | 213 | positive regulation of leukocyte cell-cell adhesion |
| GO:1900239 | 1e-04 | 30.7652 | 0.2537 | 4 | 8 | regulation of phenotypic switching |
| GO:0050863 | 1e-04 | 2.5326 | 9.7672 | 23 | 308 | regulation of T cell activation |
| GO:0051251 | 2e-04 | 2.6069 | 8.2451 | 20 | 260 | positive regulation of lymphocyte activation |
| GO:0050867 | 3e-04 | 2.4615 | 9.577 | 22 | 302 | positive regulation of cell activation |
| GO:0032508 | 3e-04 | 4.7228 | 2.1564 | 9 | 68 | DNA duplex unwinding |
| GO:0048625 | 3e-04 | 46.0635 | 0.1586 | 3 | 5 | myoblast fate commitment |
| GO:0051152 | 3e-04 | 10.268 | 0.6342 | 5 | 20 | positive regulation of smooth muscle cell differentiation |
| GO:0048523 | 4e-04 | 1.3896 | 141.2127 | 176 | 4453 | negative regulation of cellular process |
| GO:1902187 | 6e-04 | 13.6691 | 0.4123 | 4 | 13 | negative regulation of viral release from host cell |
| GO:0001912 | 6e-04 | 6.6083 | 1.0782 | 6 | 34 | positive regulation of leukocyte mediated cytotoxicity |
| GO:0000060 | 6e-04 | 5.4033 | 1.4905 | 7 | 47 | protein import into nucleus, translocation |
| GO:0042102 | 9e-04 | 3.601 | 3.0443 | 10 | 96 | positive regulation of T cell proliferation |
| GO:0002434 | 0.001 | Inf | 0.0634 | 2 | 2 | immune complex clearance |
| GO:0090265 | 0.001 | Inf | 0.0634 | 2 | 2 | positive regulation of immune complex clearance by monocytes and macrophages |
| GO:0051026 | 0.001 | 23.0288 | 0.222 | 3 | 7 | chiasma assembly |
| GO:0016070 | 0.001 | 1.3535 | 140.2614 | 172 | 4423 | RNA metabolic process |
| GO:0002827 | 0.001 | 11.1824 | 0.4757 | 4 | 15 | positive regulation of T-helper 1 type immune response |
| GO:0097696 | 0.0011 | 2.7709 | 5.4227 | 14 | 171 | STAT cascade |
| GO:0006355 | 0.0013 | 1.3745 | 109.2472 | 138 | 3445 | regulation of transcription, DNA-templated |
| GO:0072657 | 0.0013 | 1.9325 | 15.8559 | 29 | 500 | protein localization to membrane |
| GO:0002694 | 0.0015 | 1.9633 | 14.524 | 27 | 458 | regulation of leukocyte activation |
| GO:2001141 | 0.0017 | 1.3604 | 110.1034 | 138 | 3472 | regulation of RNA biosynthetic process |
| GO:0042886 | 0.0017 | 1.454 | 62.3772 | 85 | 1967 | amide transport |
| GO:0002684 | 0.0019 | 1.6427 | 29.5554 | 46 | 932 | positive regulation of immune system process |
| GO:0048584 | 0.0019 | 1.4418 | 64.375 | 87 | 2030 | positive regulation of response to stimulus |
| GO:0010629 | 0.002 | 1.4602 | 58.318 | 80 | 1839 | negative regulation of gene expression |
| GO:0007166 | 0.0022 | 1.3905 | 83.3387 | 108 | 2628 | cell surface receptor signaling pathway |
| GO:0045785 | 0.0023 | 2.024 | 11.9871 | 23 | 378 | positive regulation of cell adhesion |
| GO:2000402 | 0.0023 | 15.3506 | 0.2854 | 3 | 9 | negative regulation of lymphocyte migration |
| GO:0045934 | 0.0024 | 1.5187 | 43.1915 | 62 | 1362 | negative regulation of nucleobase-containing compound metabolic process |
| GO:0046425 | 0.0028 | 2.7145 | 4.7251 | 12 | 149 | regulation of JAK-STAT cascade |
| GO:0022407 | 0.0028 | 1.9528 | 12.9384 | 24 | 408 | regulation of cell-cell adhesion |
| GO:0007079 | 0.0029 | 61.3021 | 0.0951 | 2 | 3 | mitotic chromosome movement towards spindle pole |
| GO:1902463 | 0.0029 | 61.3021 | 0.0951 | 2 | 3 | protein localization to cell leading edge |
| GO:2000502 | 0.0029 | 61.3021 | 0.0951 | 2 | 3 | negative regulation of natural killer cell chemotaxis |
| GO:0006370 | 0.0031 | 5.7001 | 1.0148 | 5 | 32 | 7-methylguanosine mRNA capping |
| GO:0050731 | 0.0032 | 2.5515 | 5.4227 | 13 | 171 | positive regulation of peptidyl-tyrosine phosphorylation |
| GO:0036006 | 0.0032 | 13.1568 | 0.3171 | 3 | 10 | cellular response to macrophage colony-stimulating factor stimulus |
| GO:0042762 | 0.0032 | 7.6854 | 0.6342 | 4 | 20 | regulation of sulfur metabolic process |
| GO:0006612 | 0.0035 | 2.6368 | 4.8519 | 12 | 153 | protein targeting to membrane |
| GO:0036260 | 0.0036 | 5.4961 | 1.0465 | 5 | 33 | RNA capping |
| GO:0032609 | 0.0036 | 3.1606 | 3.076 | 9 | 97 | interferon-gamma production |
| GO:0033554 | 0.0037 | 1.4281 | 57.8741 | 78 | 1825 | cellular response to stress |
| GO:0001819 | 0.0038 | 1.9347 | 12.4945 | 23 | 394 | positive regulation of cytokine production |
| GO:0002223 | 0.0038 | 2.9178 | 3.6786 | 10 | 116 | stimulatory C-type lectin receptor signaling pathway |
| GO:0015031 | 0.0038 | 1.4162 | 60.633 | 81 | 1912 | protein transport |
| GO:1901623 | 0.0039 | 7.2329 | 0.6659 | 4 | 21 | regulation of lymphocyte chemotaxis |
| GO:2000779 | 0.0039 | 4.4016 | 1.5222 | 6 | 48 | regulation of double-strand break repair |
| GO:0050713 | 0.0043 | 11.5115 | 0.3488 | 3 | 11 | negative regulation of interleukin-1 beta secretion |
| GO:0046635 | 0.0043 | 4.299 | 1.5539 | 6 | 49 | positive regulation of alpha-beta T cell activation |
| GO:1990778 | 0.0044 | 2.2089 | 7.6425 | 16 | 241 | protein localization to cell periphery |
| GO:0044271 | 0.0045 | 1.2875 | 153.4535 | 181 | 4839 | cellular nitrogen compound biosynthetic process |
| GO:0097659 | 0.0045 | 1.3141 | 114.7651 | 140 | 3619 | nucleic acid-templated transcription |
| GO:0006281 | 0.0048 | 1.7958 | 15.7608 | 27 | 497 | DNA repair |
| GO:2000181 | 0.0051 | 2.9897 | 3.2346 | 9 | 102 | negative regulation of blood vessel morphogenesis |
| GO:2000113 | 0.0051 | 1.4484 | 47.2823 | 65 | 1491 | negative regulation of cellular macromolecule biosynthetic process |
| GO:0014742 | 0.0053 | 4.9633 | 1.1416 | 5 | 36 | positive regulation of muscle hypertrophy |
| GO:0043901 | 0.0053 | 2.4939 | 5.1056 | 12 | 161 | negative regulation of multi-organism process |
| GO:1903202 | 0.0053 | 4.1074 | 1.6173 | 6 | 51 | negative regulation of oxidative stress-induced cell death |
| GO:0039694 | 0.0055 | 6.4707 | 0.7294 | 4 | 23 | viral RNA genome replication |
| GO:0016043 | 0.0055 | 1.2679 | 182.1527 | 210 | 5744 | cellular component organization |
| GO:0061051 | 0.0056 | 10.2318 | 0.3805 | 3 | 12 | positive regulation of cell growth involved in cardiac muscle cell development |
| GO:0051155 | 0.0057 | 3.5384 | 2.1564 | 7 | 68 | positive regulation of striated muscle cell differentiation |
| GO:0072683 | 0.0058 | 30.6491 | 0.1268 | 2 | 4 | T cell extravasation |
| GO:0044403 | 0.0063 | 1.5891 | 25.6866 | 39 | 810 | symbiosis, encompassing mutualism through parasitism |
| GO:1902883 | 0.0064 | 3.9321 | 1.6807 | 6 | 53 | negative regulation of response to oxidative stress |
| GO:0016567 | 0.0064 | 1.587 | 25.7183 | 39 | 811 | protein ubiquitination |
| GO:0045087 | 0.0066 | 1.5752 | 26.5745 | 40 | 838 | innate immune response |
| GO:0070647 | 0.0068 | 1.5033 | 34.1536 | 49 | 1077 | protein modification by small protein conjugation or removal |
| GO:0035195 | 0.0069 | 2.0465 | 8.7208 | 17 | 275 | gene silencing by miRNA |
| GO:0009890 | 0.0071 | 1.4073 | 52.3562 | 70 | 1651 | negative regulation of biosynthetic process |
| GO:0050862 | 0.0072 | 9.208 | 0.4123 | 3 | 13 | positive regulation of T cell receptor signaling pathway |
| GO:0043502 | 0.0072 | 3.0475 | 2.8224 | 8 | 89 | regulation of muscle adaptation |
| GO:0042088 | 0.0073 | 5.8957 | 0.7874 | 4 | 25 | T-helper 1 type immune response |
| GO:0006412 | 0.0073 | 1.5818 | 25.1158 | 38 | 792 | translation |
| GO:0001562 | 0.0074 | 5.8537 | 0.7928 | 4 | 25 | response to protozoan |
| GO:0010941 | 0.0076 | 1.412 | 49.8827 | 67 | 1573 | regulation of cell death |
| GO:0072527 | 0.0077 | 3.3198 | 2.2833 | 7 | 72 | pyrimidine-containing compound metabolic process |
| GO:0002250 | 0.0079 | 1.8966 | 11.0357 | 20 | 348 | adaptive immune response |
| GO:0006518 | 0.0081 | 1.5209 | 30.2531 | 44 | 954 | peptide metabolic process |
| GO:2000725 | 0.0083 | 4.395 | 1.2685 | 5 | 40 | regulation of cardiac muscle cell differentiation |
| GO:0002683 | 0.0085 | 1.8217 | 12.6213 | 22 | 398 | negative regulation of immune system process |
| GO:1903671 | 0.0086 | 5.5873 | 0.8245 | 4 | 26 | negative regulation of sprouting angiogenesis |
| GO:0016441 | 0.0088 | 1.9915 | 8.9427 | 17 | 282 | posttranscriptional gene silencing |
| GO:0019058 | 0.0088 | 1.9482 | 9.6721 | 18 | 305 | viral life cycle |
| GO:0051276 | 0.0088 | 1.4742 | 35.4855 | 50 | 1119 | chromosome organization |
| GO:0002693 | 0.0089 | 8.3704 | 0.444 | 3 | 14 | positive regulation of cellular extravasation |
| GO:0007175 | 0.0089 | 8.3704 | 0.444 | 3 | 14 | negative regulation of epidermal growth factor-activated receptor activity |
| GO:0033033 | 0.0089 | 8.3704 | 0.444 | 3 | 14 | negative regulation of myeloid cell apoptotic process |
| GO:0060312 | 0.0089 | 8.3704 | 0.444 | 3 | 14 | regulation of blood vessel remodeling |
| GO:0002708 | 0.0089 | 3.2203 | 2.3467 | 7 | 74 | positive regulation of lymphocyte mediated immunity |
| GO:0002252 | 0.0092 | 1.482 | 33.8672 | 48 | 1072 | immune effector process |
| GO:0018130 | 0.0093 | 1.2689 | 131.2552 | 155 | 4139 | heterocycle biosynthetic process |
| GO:0032946 | 0.0094 | 2.5325 | 4.186 | 10 | 132 | positive regulation of mononuclear cell proliferation |
| GO:0032956 | 0.0094 | 1.9763 | 9.0062 | 17 | 284 | regulation of actin cytoskeleton organization |
| GO:0043308 | 0.0094 | 20.4314 | 0.1586 | 2 | 5 | eosinophil degranulation |
| GO:0052572 | 0.0094 | 20.4314 | 0.1586 | 2 | 5 | response to host immune response |
| GO:0070814 | 0.0094 | 20.4314 | 0.1586 | 2 | 5 | hydrogen sulfide biosynthetic process |
| GO:0019438 | 0.0099 | 1.2655 | 131.5089 | 155 | 4147 | aromatic compound biosynthetic process |
| GOMFID | Pvalue | OddsRatio | ExpCount | Count | Size | Term |
| GO:1900239 | 1e-04 | 30.9528 | 0.2522 | 4 | 8 | regulation of phenotypic switching |
| GO:0048625 | 3e-04 | 46.3438 | 0.1576 | 3 | 5 | myoblast fate commitment |
| GO:1902187 | 6e-04 | 13.7524 | 0.4099 | 4 | 13 | negative regulation of viral release from host cell |
| GO:1903037 | 7e-04 | 2.278 | 10.2778 | 22 | 326 | regulation of leukocyte cell-cell adhesion |
| GO:0048523 | 9e-04 | 1.3839 | 117.0555 | 147 | 3812 | negative regulation of cellular process |
| GO:0002434 | 0.001 | Inf | 0.0631 | 2 | 2 | immune complex clearance |
| GO:0090265 | 0.001 | Inf | 0.0631 | 2 | 2 | positive regulation of immune complex clearance by monocytes and macrophages |
| GO:0002449 | 0.0011 | 2.5696 | 6.6522 | 16 | 211 | lymphocyte mediated immunity |
| GO:0061337 | 0.0013 | 2.9958 | 4.3192 | 12 | 137 | cardiac conduction |
| GO:0030155 | 0.0014 | 1.8092 | 20.4296 | 35 | 648 | regulation of cell adhesion |
| GO:0031323 | 0.0014 | 1.3186 | 187.2394 | 220 | 5939 | regulation of cellular metabolic process |
| GO:0048671 | 0.0015 | 18.534 | 0.2522 | 3 | 8 | negative regulation of collateral sprouting |
| GO:1990778 | 0.0017 | 2.3771 | 7.598 | 17 | 241 | protein localization to cell periphery |
| GO:0016043 | 0.0017 | 1.3133 | 181.0916 | 213 | 5744 | cellular component organization |
| GO:0065007 | 0.0017 | 1.3537 | 356.067 | 386 | 11294 | biological regulation |
| GO:0002683 | 0.0019 | 2.019 | 12.5478 | 24 | 398 | negative regulation of immune system process |
| GO:0045934 | 0.0021 | 1.5291 | 42.9399 | 62 | 1362 | negative regulation of nucleobase-containing compound metabolic process |
| GO:0022409 | 0.0021 | 2.3244 | 7.7557 | 17 | 246 | positive regulation of cell-cell adhesion |
| GO:0051171 | 0.0021 | 1.3062 | 178.8847 | 210 | 5674 | regulation of nitrogen compound metabolic process |
| GO:2000402 | 0.0023 | 15.444 | 0.2837 | 3 | 9 | negative regulation of lymphocyte migration |
| GO:0002696 | 0.0023 | 2.19 | 9.1744 | 19 | 291 | positive regulation of leukocyte activation |
| GO:0072657 | 0.0025 | 1.8699 | 15.7635 | 28 | 500 | protein localization to membrane |
| GO:0014707 | 0.0029 | 61.6745 | 0.0946 | 2 | 3 | branchiomeric skeletal muscle development |
| GO:1902463 | 0.0029 | 61.6745 | 0.0946 | 2 | 3 | protein localization to cell leading edge |
| GO:2000502 | 0.0029 | 61.6745 | 0.0946 | 2 | 3 | negative regulation of natural killer cell chemotaxis |
| GO:0008104 | 0.003 | 1.3815 | 79.7005 | 103 | 2528 | protein localization |
| GO:0050804 | 0.0031 | 2.1263 | 9.4266 | 19 | 299 | modulation of chemical synaptic transmission |
| GO:0010605 | 0.0031 | 1.3756 | 82.4433 | 106 | 2615 | negative regulation of macromolecule metabolic process |
| GO:0050857 | 0.0038 | 7.277 | 0.6621 | 4 | 21 | positive regulation of antigen receptor-mediated signaling pathway |
| GO:0051249 | 0.0039 | 1.9309 | 12.5163 | 23 | 397 | regulation of lymphocyte activation |
| GO:0045892 | 0.0039 | 1.5418 | 34.8059 | 51 | 1104 | negative regulation of transcription, DNA-templated |
| GO:0042110 | 0.004 | 2.2336 | 7.5622 | 16 | 245 | T cell activation |
| GO:0045596 | 0.004 | 1.7133 | 20.2089 | 33 | 641 | negative regulation of cell differentiation |
| GO:0046635 | 0.0042 | 4.3253 | 1.5448 | 6 | 49 | positive regulation of alpha-beta T cell activation |
| GO:0045814 | 0.0044 | 2.8545 | 3.7517 | 10 | 119 | negative regulation of gene expression, epigenetic |
| GO:0043949 | 0.0045 | 6.8723 | 0.6936 | 4 | 22 | regulation of cAMP-mediated signaling |
| GO:0080090 | 0.0047 | 1.2749 | 183.5192 | 212 | 5821 | regulation of primary metabolic process |
| GO:0042886 | 0.0047 | 1.4004 | 62.0138 | 82 | 1967 | amide transport |
| GO:0015031 | 0.0048 | 1.4047 | 60.2798 | 80 | 1912 | protein transport |
| GO:2000181 | 0.0049 | 3.0081 | 3.2158 | 9 | 102 | negative regulation of blood vessel morphogenesis |
| GO:0000186 | 0.0052 | 4.1325 | 1.6079 | 6 | 51 | activation of MAPKK activity |
| GO:0035556 | 0.0052 | 1.35 | 82.0335 | 104 | 2602 | intracellular signal transduction |
| GO:2000300 | 0.0054 | 6.5102 | 0.7251 | 4 | 23 | regulation of synaptic vesicle exocytosis |
| GO:0044093 | 0.0056 | 1.4172 | 53.5961 | 72 | 1700 | positive regulation of molecular function |
| GO:0072683 | 0.0057 | 30.8353 | 0.1261 | 2 | 4 | T cell extravasation |
| GO:2000680 | 0.0057 | 30.8353 | 0.1261 | 2 | 4 | regulation of rubidium ion transport |
| GO:0046632 | 0.0061 | 3.1443 | 2.7429 | 8 | 87 | alpha-beta T cell differentiation |
| GO:0001910 | 0.0062 | 3.9562 | 1.6709 | 6 | 53 | regulation of leukocyte mediated cytotoxicity |
| GO:0016070 | 0.0063 | 1.2809 | 139.4443 | 165 | 4423 | RNA metabolic process |
| GO:0048522 | 0.0068 | 1.2718 | 150.1951 | 176 | 4764 | positive regulation of cellular process |
| GO:0051241 | 0.007 | 1.5075 | 33.3557 | 48 | 1058 | negative regulation of multicellular organismal process |
| GO:1902679 | 0.0071 | 1.4886 | 35.9094 | 51 | 1139 | negative regulation of RNA biosynthetic process |
| GO:0001819 | 0.0071 | 1.8534 | 12.4217 | 22 | 394 | positive regulation of cytokine production |
| GO:0044092 | 0.0072 | 1.4931 | 35.0897 | 50 | 1113 | negative regulation of molecular function |
| GO:0051489 | 0.0073 | 4.5522 | 1.2296 | 5 | 39 | regulation of filopodium assembly |
| GO:1903900 | 0.0073 | 2.6352 | 4.0355 | 10 | 128 | regulation of viral life cycle |
| GO:0002250 | 0.0074 | 1.9086 | 10.9714 | 20 | 348 | adaptive immune response |
| GO:0010771 | 0.0075 | 3.3402 | 2.27 | 7 | 72 | negative regulation of cell morphogenesis involved in differentiation |
| GO:0051897 | 0.0076 | 2.4804 | 4.6975 | 11 | 149 | positive regulation of protein kinase B signaling |
| GO:0050865 | 0.0079 | 1.7406 | 15.6059 | 26 | 495 | regulation of cell activation |
| GO:0050790 | 0.0079 | 1.352 | 69.5803 | 89 | 2207 | regulation of catalytic activity |
| GO:0016574 | 0.0081 | 4.4218 | 1.2611 | 5 | 40 | histone ubiquitination |
| GO:0042088 | 0.0081 | 4.4218 | 1.2611 | 5 | 40 | T-helper 1 type immune response |
| GO:0002252 | 0.0083 | 1.4919 | 33.6692 | 48 | 1072 | immune effector process |
| GO:1903506 | 0.0083 | 1.2918 | 109.2414 | 132 | 3465 | regulation of nucleic acid-templated transcription |
| GO:1903671 | 0.0084 | 5.6213 | 0.8197 | 4 | 26 | negative regulation of sprouting angiogenesis |
| GO:0002693 | 0.0087 | 8.4213 | 0.4414 | 3 | 14 | positive regulation of cellular extravasation |
| GO:0033033 | 0.0087 | 8.4213 | 0.4414 | 3 | 14 | negative regulation of myeloid cell apoptotic process |
| GO:0050870 | 0.0091 | 2.4152 | 4.8128 | 11 | 154 | positive regulation of T cell activation |
| GO:0045936 | 0.0093 | 1.6632 | 18.1911 | 29 | 577 | negative regulation of phosphate metabolic process |
| GO:0033227 | 0.0093 | 20.5556 | 0.1576 | 2 | 5 | dsRNA transport |
| GO:0043308 | 0.0093 | 20.5556 | 0.1576 | 2 | 5 | eosinophil degranulation |
| GO:0070814 | 0.0093 | 20.5556 | 0.1576 | 2 | 5 | hydrogen sulfide biosynthetic process |
| GO:0086011 | 0.0096 | 5.3766 | 0.8512 | 4 | 27 | membrane repolarization during action potential |
| GO:0050793 | 0.01 | 1.3303 | 73.8365 | 93 | 2342 | regulation of developmental process |
| GOMFID | Pvalue | OddsRatio | ExpCount | Count | Size | Term |
| GO:0006355 | 0 | 1.9166 | 98.6407 | 156 | 3445 | regulation of transcription, DNA-templated |
| GO:2001141 | 0 | 1.8969 | 99.4138 | 156 | 3472 | regulation of RNA biosynthetic process |
| GO:0000122 | 0 | 2.6255 | 21.7038 | 51 | 758 | negative regulation of transcription from RNA polymerase II promoter |
| GO:0019219 | 0 | 1.7334 | 115.1333 | 167 | 4021 | regulation of nucleobase-containing compound metabolic process |
| GO:0007156 | 0 | 5.0102 | 4.3522 | 19 | 152 | homophilic cell adhesion via plasma membrane adhesion molecules |
| GO:0034654 | 0 | 1.65 | 116.8227 | 164 | 4080 | nucleobase-containing compound biosynthetic process |
| GO:0045944 | 0 | 2.0833 | 30.58 | 58 | 1068 | positive regulation of transcription from RNA polymerase II promoter |
| GO:0060173 | 0 | 4.1389 | 4.8676 | 18 | 170 | limb development |
| GO:1903507 | 0 | 2.0198 | 32.5844 | 60 | 1138 | negative regulation of nucleic acid-templated transcription |
| GO:0003002 | 0 | 3.1677 | 8.3151 | 24 | 293 | regionalization |
| GO:0009792 | 0 | 2.4865 | 15.7768 | 36 | 551 | embryo development ending in birth or egg hatching |
| GO:0035107 | 0 | 4.322 | 4.1518 | 16 | 145 | appendage morphogenesis |
| GO:0021879 | 0 | 7.764 | 1.403 | 9 | 49 | forebrain neuron differentiation |
| GO:0051253 | 0 | 1.9184 | 34.7032 | 61 | 1212 | negative regulation of RNA metabolic process |
| GO:0007267 | 0 | 1.7789 | 43.5794 | 71 | 1522 | cell-cell signaling |
| GO:0035295 | 0 | 2.5631 | 11.3836 | 27 | 406 | tube development |
| GO:0060562 | 0 | 3.5982 | 4.8855 | 16 | 173 | epithelial tube morphogenesis |
| GO:0072132 | 0 | 7.2496 | 1.3171 | 8 | 46 | mesenchyme morphogenesis |
| GO:0001709 | 1e-04 | 8.0561 | 1.0551 | 7 | 37 | cell fate determination |
| GO:0048864 | 1e-04 | 5.6411 | 1.8325 | 9 | 64 | stem cell development |
| GO:0021510 | 1e-04 | 4.4724 | 2.7488 | 11 | 96 | spinal cord development |
| GO:0090596 | 1e-04 | 2.9049 | 7.0724 | 19 | 247 | sensory organ morphogenesis |
| GO:0097659 | 1e-04 | 1.737 | 41.7281 | 66 | 1585 | nucleic acid-templated transcription |
| GO:0007399 | 1e-04 | 2.2351 | 14.9485 | 31 | 571 | nervous system development |
| GO:0045778 | 1e-04 | 4.7933 | 2.3479 | 10 | 82 | positive regulation of ossification |
| GO:0003263 | 1e-04 | 22.804 | 0.2863 | 4 | 10 | cardioblast proliferation |
| GO:0014033 | 1e-04 | 5.2574 | 1.947 | 9 | 68 | neural crest cell differentiation |
| GO:0022610 | 1e-04 | 1.7394 | 37.8242 | 61 | 1321 | biological adhesion |
| GO:0045597 | 1e-04 | 1.9507 | 23.0876 | 42 | 814 | positive regulation of cell differentiation |
| GO:0021915 | 1e-04 | 3.4419 | 4.4381 | 14 | 155 | neural tube development |
| GO:0060255 | 2e-04 | 1.418 | 167.274 | 205 | 5842 | regulation of macromolecule metabolic process |
| GO:0035024 | 2e-04 | 12.2368 | 0.544 | 5 | 19 | negative regulation of Rho protein signal transduction |
| GO:0030182 | 2e-04 | 1.8404 | 28.6037 | 49 | 1018 | neuron differentiation |
| GO:0009889 | 2e-04 | 1.5528 | 73.1252 | 102 | 2694 | regulation of biosynthetic process |
| GO:0021903 | 2e-04 | 19.5451 | 0.315 | 4 | 11 | rostrocaudal neural tube patterning |
| GO:0055123 | 2e-04 | 3.5437 | 4.0086 | 13 | 140 | digestive system development |
| GO:0060039 | 2e-04 | 11.4203 | 0.5727 | 5 | 20 | pericardium development |
| GO:0001569 | 2e-04 | 8.2353 | 0.8876 | 6 | 31 | branching involved in blood vessel morphogenesis |
| GO:0048701 | 2e-04 | 6.501 | 1.2599 | 7 | 44 | embryonic cranial skeleton morphogenesis |
| GO:1901576 | 2e-04 | 1.4006 | 175.1481 | 212 | 6117 | organic substance biosynthetic process |
| GO:0043586 | 3e-04 | 10.7058 | 0.6013 | 5 | 21 | tongue development |
| GO:0051216 | 3e-04 | 3.1889 | 4.7544 | 14 | 167 | cartilage development |
| GO:0021513 | 3e-04 | 10.0754 | 0.6299 | 5 | 22 | spinal cord dorsal/ventral patterning |
| GO:1903508 | 3e-04 | 1.67 | 39.1986 | 61 | 1369 | positive regulation of nucleic acid-templated transcription |
| GO:0048048 | 4e-04 | 7.3515 | 0.9735 | 6 | 34 | embryonic eye morphogenesis |
| GO:0048704 | 4e-04 | 5.9423 | 1.3574 | 7 | 48 | embryonic skeletal system morphogenesis |
| GO:0007268 | 4e-04 | 2.0305 | 16.7789 | 32 | 586 | chemical synaptic transmission |
| GO:0099537 | 4e-04 | 2.0229 | 16.8362 | 32 | 588 | trans-synaptic signaling |
| GO:0090304 | 4e-04 | 1.3971 | 140.359 | 174 | 4902 | nucleic acid metabolic process |
| GO:0021902 | 4e-04 | 34.1385 | 0.1718 | 3 | 6 | commitment of neuronal cell to specific neuron type in forebrain |
| GO:0051254 | 4e-04 | 1.6386 | 41.2315 | 63 | 1440 | positive regulation of RNA metabolic process |
| GO:0014031 | 5e-04 | 4.9137 | 1.8325 | 8 | 64 | mesenchymal cell development |
| GO:0061138 | 5e-04 | 3.0105 | 5.0108 | 14 | 175 | morphogenesis of a branching epithelium |
| GO:0098609 | 5e-04 | 1.8574 | 22.3337 | 39 | 780 | cell-cell adhesion |
| GO:0003214 | 5e-04 | 13.679 | 0.4009 | 4 | 14 | cardiac left ventricle morphogenesis |
| GO:0045927 | 5e-04 | 2.6585 | 6.8433 | 17 | 239 | positive regulation of growth |
| GO:0030900 | 6e-04 | 2.3171 | 10.1075 | 22 | 353 | forebrain development |
| GO:0002088 | 6e-04 | 4.7437 | 1.8898 | 8 | 66 | lens development in camera-type eye |
| GO:0031076 | 6e-04 | 6.6388 | 1.0594 | 6 | 37 | embryonic camera-type eye development |
| GO:0014706 | 6e-04 | 2.3029 | 10.1647 | 22 | 355 | striated muscle tissue development |
| GO:0003148 | 6e-04 | 8.5625 | 0.7158 | 5 | 25 | outflow tract septum morphogenesis |
| GO:0051058 | 7e-04 | 5.3426 | 1.4889 | 7 | 52 | negative regulation of small GTPase mediated signal transduction |
| GO:2000113 | 7e-04 | 1.6047 | 42.6918 | 64 | 1491 | negative regulation of cellular macromolecule biosynthetic process |
| GO:0060581 | 7e-04 | 12.4346 | 0.4295 | 4 | 15 | cell fate commitment involved in pattern specification |
| GO:0003357 | 7e-04 | 25.6023 | 0.2004 | 3 | 7 | noradrenergic neuron differentiation |
| GO:0060021 | 8e-04 | 4.0407 | 2.4526 | 9 | 86 | palate development |
| GO:0003206 | 8e-04 | 3.4191 | 3.4932 | 11 | 122 | cardiac chamber morphogenesis |
| GO:0003197 | 8e-04 | 6.2357 | 1.1167 | 6 | 39 | endocardial cushion development |
| GO:0043134 | 8e-04 | Inf | 0.0573 | 2 | 2 | regulation of hindgut contraction |
| GO:0043503 | 8e-04 | Inf | 0.0573 | 2 | 2 | skeletal muscle fiber adaptation |
| GO:0072272 | 8e-04 | Inf | 0.0573 | 2 | 2 | proximal/distal pattern formation involved in metanephric nephron development |
| GO:0120054 | 8e-04 | Inf | 0.0573 | 2 | 2 | intestinal motility |
| GO:0120058 | 8e-04 | Inf | 0.0573 | 2 | 2 | positive regulation of small intestinal transit |
| GO:0009890 | 8e-04 | 1.5632 | 47.2731 | 69 | 1651 | negative regulation of biosynthetic process |
| GO:0060413 | 9e-04 | 11.3977 | 0.4581 | 4 | 16 | atrial septum morphogenesis |
| GO:0010557 | 9e-04 | 1.5639 | 45.8128 | 67 | 1600 | positive regulation of macromolecule biosynthetic process |
| GO:0032675 | 0.001 | 3.5523 | 3.0637 | 10 | 107 | regulation of interleukin-6 production |
| GO:0010628 | 0.0011 | 1.534 | 50.2509 | 72 | 1755 | positive regulation of gene expression |
| GO:2000026 | 0.0011 | 1.5256 | 51.9689 | 74 | 1815 | regulation of multicellular organismal development |
| GO:0001558 | 0.0011 | 2.1951 | 10.6228 | 22 | 371 | regulation of cell growth |
| GO:0022008 | 0.0012 | 1.8186 | 20.9933 | 36 | 753 | neurogenesis |
| GO:0048483 | 0.0012 | 5.715 | 1.2026 | 6 | 42 | autonomic nervous system development |
| GO:0021514 | 0.0012 | 10.5203 | 0.4868 | 4 | 17 | ventral spinal cord interneuron differentiation |
| GO:2000136 | 0.0012 | 10.5203 | 0.4868 | 4 | 17 | regulation of cell proliferation involved in heart morphogenesis |
| GO:0040011 | 0.0012 | 1.5421 | 47.1013 | 68 | 1645 | locomotion |
| GO:0030326 | 0.0014 | 3.6772 | 2.6678 | 9 | 94 | embryonic limb morphogenesis |
| GO:0051674 | 0.0014 | 1.5715 | 40.6302 | 60 | 1419 | localization of cell |
| GO:0048332 | 0.0015 | 4.0435 | 2.1761 | 8 | 76 | mesoderm morphogenesis |
| GO:0035590 | 0.0015 | 9.7682 | 0.5154 | 4 | 18 | purinergic nucleotide receptor signaling pathway |
| GO:0060004 | 0.0015 | 9.7682 | 0.5154 | 4 | 18 | reflex |
| GO:0060438 | 0.0015 | 9.7682 | 0.5154 | 4 | 18 | trachea development |
| GO:0060079 | 0.0015 | 3.6432 | 2.6915 | 9 | 94 | excitatory postsynaptic potential |
| GO:0000902 | 0.0015 | 1.7193 | 25.2257 | 41 | 881 | cell morphogenesis |
| GO:0009653 | 0.0016 | 1.5478 | 44.2919 | 64 | 1666 | anatomical structure morphogenesis |
| GO:0007218 | 0.0016 | 3.6006 | 2.7201 | 9 | 95 | neuropeptide signaling pathway |
| GO:0001764 | 0.0016 | 3.0832 | 3.8368 | 11 | 134 | neuron migration |
| GO:0007275 | 0.0016 | 1.4759 | 63.7947 | 86 | 2472 | multicellular organism development |
| GO:0051240 | 0.0016 | 1.5723 | 39.2314 | 58 | 1396 | positive regulation of multicellular organismal process |
| GO:0048729 | 0.0017 | 1.9797 | 13.868 | 26 | 497 | tissue morphogenesis |
| GO:0009954 | 0.0017 | 6.584 | 0.8876 | 5 | 31 | proximal/distal pattern formation |
| GO:0003215 | 0.0018 | 9.1164 | 0.544 | 4 | 19 | cardiac right ventricle morphogenesis |
| GO:0001654 | 0.0018 | 2.1846 | 9.678 | 20 | 338 | eye development |
| GO:0022612 | 0.0018 | 3.2488 | 3.3214 | 10 | 116 | gland morphogenesis |
| GO:0048468 | 0.0019 | 1.5372 | 43.6835 | 63 | 1573 | cell development |
| GO:0032330 | 0.0019 | 5.1422 | 1.3171 | 6 | 46 | regulation of chondrocyte differentiation |
| GO:0001649 | 0.0019 | 2.6017 | 5.7266 | 14 | 200 | osteoblast differentiation |
| GO:0008285 | 0.002 | 1.8006 | 19.3273 | 33 | 675 | negative regulation of cell proliferation |
| GO:0035115 | 0.002 | 6.3398 | 0.9163 | 5 | 32 | embryonic forelimb morphogenesis |
| GO:1902742 | 0.002 | 6.3398 | 0.9163 | 5 | 32 | apoptotic process involved in development |
| GO:0070542 | 0.002 | 3.8179 | 2.2906 | 8 | 80 | response to fatty acid |
| GO:0050794 | 0.0021 | 1.3625 | 228.0466 | 256 | 8512 | regulation of cellular process |
| GO:2000179 | 0.0021 | 5.0164 | 1.3458 | 6 | 47 | positive regulation of neural precursor cell proliferation |
| GO:0003231 | 0.0022 | 3.1588 | 3.4073 | 10 | 119 | cardiac ventricle development |
| GO:0023019 | 0.0022 | 8.5461 | 0.5727 | 4 | 20 | signal transduction involved in regulation of gene expression |
| GO:0003156 | 0.0023 | 6.113 | 0.9449 | 5 | 33 | regulation of animal organ formation |
| GO:0045987 | 0.0023 | 6.113 | 0.9449 | 5 | 33 | positive regulation of smooth muscle contraction |
| GO:0048935 | 0.0024 | 14.6898 | 0.2852 | 3 | 10 | peripheral nervous system neuron development |
| GO:0065007 | 0.0024 | 1.3595 | 323.3812 | 351 | 11294 | biological regulation |
| GO:0000066 | 0.0024 | 68.1382 | 0.0859 | 2 | 3 | mitochondrial ornithine transport |
| GO:0002125 | 0.0024 | 68.1382 | 0.0859 | 2 | 3 | maternal aggressive behavior |
| GO:0002317 | 0.0024 | 68.1382 | 0.0859 | 2 | 3 | plasma cell differentiation |
| GO:0003274 | 0.0024 | 68.1382 | 0.0859 | 2 | 3 | endocardial cushion fusion |
| GO:0014908 | 0.0024 | 68.1382 | 0.0859 | 2 | 3 | myotube differentiation involved in skeletal muscle regeneration |
| GO:0021524 | 0.0024 | 68.1382 | 0.0859 | 2 | 3 | visceral motor neuron differentiation |
| GO:0046010 | 0.0024 | 68.1382 | 0.0859 | 2 | 3 | positive regulation of circadian sleep/wake cycle, non-REM sleep |
| GO:0048936 | 0.0024 | 68.1382 | 0.0859 | 2 | 3 | peripheral nervous system neuron axonogenesis |
| GO:0060913 | 0.0024 | 68.1382 | 0.0859 | 2 | 3 | cardiac cell fate determination |
| GO:0070294 | 0.0024 | 68.1382 | 0.0859 | 2 | 3 | renal sodium ion absorption |
| GO:1904000 | 0.0024 | 68.1382 | 0.0859 | 2 | 3 | positive regulation of eating behavior |
| GO:1904349 | 0.0024 | 68.1382 | 0.0859 | 2 | 3 | positive regulation of small intestine smooth muscle contraction |
| GO:1905333 | 0.0024 | 68.1382 | 0.0859 | 2 | 3 | regulation of gastric motility |
| GO:0003211 | 0.0024 | 14.6271 | 0.2863 | 3 | 10 | cardiac ventricle formation |
| GO:0007617 | 0.0027 | 8.0429 | 0.6013 | 4 | 21 | mating behavior |
| GO:0051384 | 0.0027 | 2.8713 | 4.0945 | 11 | 143 | response to glucocorticoid |
| GO:0006725 | 0.0029 | 1.3105 | 164.1817 | 193 | 5734 | cellular aromatic compound metabolic process |
| GO:0048546 | 0.0029 | 4.6735 | 1.4317 | 6 | 50 | digestive tract morphogenesis |
| GO:0003230 | 0.003 | 5.7047 | 1.0022 | 5 | 35 | cardiac atrium development |
| GO:0048545 | 0.003 | 2.0427 | 10.8233 | 21 | 378 | response to steroid hormone |
| GO:0016331 | 0.0031 | 2.8281 | 4.1518 | 11 | 145 | morphogenesis of embryonic epithelium |
| GO:1901360 | 0.0031 | 1.3061 | 170.1946 | 199 | 5944 | organic cyclic compound metabolic process |
| GO:0030324 | 0.0032 | 2.6695 | 4.7817 | 12 | 167 | lung development |
| GO:0003272 | 0.0032 | 7.5956 | 0.6299 | 4 | 22 | endocardial cushion formation |
| GO:2000778 | 0.0032 | 7.5956 | 0.6299 | 4 | 22 | positive regulation of interleukin-6 secretion |
| GO:0021521 | 0.0032 | 12.7979 | 0.315 | 3 | 11 | ventral spinal cord interneuron specification |
| GO:0035413 | 0.0032 | 12.7979 | 0.315 | 3 | 11 | positive regulation of catenin import into nucleus |
| GO:0060033 | 0.0032 | 12.7979 | 0.315 | 3 | 11 | anatomical structure regression |
| GO:0051146 | 0.0037 | 2.2495 | 7.5018 | 16 | 262 | striated muscle cell differentiation |
| GO:0046483 | 0.0037 | 1.3001 | 163.1222 | 191 | 5697 | heterocycle metabolic process |
| GO:0072175 | 0.0038 | 2.9162 | 3.665 | 10 | 128 | epithelial tube formation |
| GO:0010226 | 0.0038 | 7.1953 | 0.6586 | 4 | 23 | response to lithium ion |
| GO:0001755 | 0.0039 | 5.3475 | 1.0594 | 5 | 37 | neural crest cell migration |
| GO:1990830 | 0.004 | 3.3917 | 2.5483 | 8 | 89 | cellular response to leukemia inhibitory factor |
| GO:0009790 | 0.0041 | 2.0239 | 10.3907 | 20 | 380 | embryo development |
| GO:0009991 | 0.0042 | 1.9165 | 12.5985 | 23 | 440 | response to extracellular stimulus |
| GO:0045628 | 0.0042 | 11.3752 | 0.3436 | 3 | 12 | regulation of T-helper 2 cell differentiation |
| GO:0060536 | 0.0042 | 11.3752 | 0.3436 | 3 | 12 | cartilage morphogenesis |
| GO:0060900 | 0.0042 | 11.3752 | 0.3436 | 3 | 12 | embryonic camera-type eye formation |
| GO:0034645 | 0.0042 | 1.3574 | 94.0077 | 117 | 3460 | cellular macromolecule biosynthetic process |
| GO:0001501 | 0.0043 | 2.5624 | 4.9626 | 12 | 179 | skeletal system development |
| GO:0007405 | 0.0043 | 4.283 | 1.5462 | 6 | 54 | neuroblast proliferation |
| GO:0017145 | 0.0043 | 5.1851 | 1.0881 | 5 | 38 | stem cell division |
| GO:2000648 | 0.0043 | 5.1851 | 1.0881 | 5 | 38 | positive regulation of stem cell proliferation |
| GO:0003171 | 0.0045 | 6.8351 | 0.6872 | 4 | 24 | atrioventricular valve development |
| GO:0048520 | 0.0045 | 6.8351 | 0.6872 | 4 | 24 | positive regulation of behavior |
| GO:0051094 | 0.0047 | 2.0827 | 9.0894 | 18 | 335 | positive regulation of developmental process |
| GO:0033627 | 0.0047 | 4.1953 | 1.5748 | 6 | 55 | cell adhesion mediated by integrin |
| GO:0006933 | 0.0047 | 34.067 | 0.1145 | 2 | 4 | negative regulation of cell adhesion involved in substrate-bound cell migration |
| GO:0021555 | 0.0047 | 34.067 | 0.1145 | 2 | 4 | midbrain-hindbrain boundary morphogenesis |
| GO:0032100 | 0.0047 | 34.067 | 0.1145 | 2 | 4 | positive regulation of appetite |
| GO:0034287 | 0.0047 | 34.067 | 0.1145 | 2 | 4 | detection of monosaccharide stimulus |
| GO:0042662 | 0.0047 | 34.067 | 0.1145 | 2 | 4 | negative regulation of mesodermal cell fate specification |
| GO:0051594 | 0.0047 | 34.067 | 0.1145 | 2 | 4 | detection of glucose |
| GO:0060214 | 0.0047 | 34.067 | 0.1145 | 2 | 4 | endocardium formation |
| GO:0060406 | 0.0047 | 34.067 | 0.1145 | 2 | 4 | positive regulation of penile erection |
| GO:0072086 | 0.0047 | 34.067 | 0.1145 | 2 | 4 | specification of loop of Henle identity |
| GO:0072513 | 0.0047 | 34.067 | 0.1145 | 2 | 4 | positive regulation of secondary heart field cardioblast proliferation |
| GO:1903352 | 0.0047 | 34.067 | 0.1145 | 2 | 4 | L-ornithine transmembrane transport |
| GO:1905903 | 0.0047 | 34.067 | 0.1145 | 2 | 4 | negative regulation of mesoderm formation |
| GO:0048562 | 0.0048 | 2.6465 | 4.409 | 11 | 159 | embryonic organ morphogenesis |
| GO:0034641 | 0.0048 | 1.2847 | 180.5311 | 208 | 6305 | cellular nitrogen compound metabolic process |
| GO:0031670 | 0.0049 | 5.0323 | 1.1167 | 5 | 39 | cellular response to nutrient |
| GO:0007320 | 0.0054 | 10.237 | 0.3722 | 3 | 13 | insemination |
| GO:0021520 | 0.0054 | 10.237 | 0.3722 | 3 | 13 | spinal cord motor neuron cell fate specification |
| GO:0060123 | 0.0054 | 10.237 | 0.3722 | 3 | 13 | regulation of growth hormone secretion |
| GO:0030534 | 0.0055 | 2.7516 | 3.8655 | 10 | 135 | adult behavior |
| GO:0060348 | 0.0055 | 2.4758 | 5.1253 | 12 | 179 | bone development |
| GO:0042472 | 0.0055 | 3.1935 | 2.6915 | 8 | 94 | inner ear morphogenesis |
| GO:0007517 | 0.0056 | 1.9635 | 10.6801 | 20 | 373 | muscle organ development |
| GO:0045600 | 0.0056 | 4.0302 | 1.6321 | 6 | 57 | positive regulation of fat cell differentiation |
| GO:0031016 | 0.006 | 3.479 | 2.1761 | 7 | 76 | pancreas development |
| GO:0021983 | 0.006 | 4.7521 | 1.174 | 5 | 41 | pituitary gland development |
| GO:0042476 | 0.0061 | 2.8901 | 3.3214 | 9 | 116 | odontogenesis |
| GO:0010721 | 0.0063 | 2.1182 | 7.9313 | 16 | 277 | negative regulation of cell development |
| GO:0021543 | 0.0064 | 2.541 | 4.5813 | 11 | 160 | pallium development |
| GO:0050767 | 0.0064 | 1.6837 | 19.27 | 31 | 673 | regulation of neurogenesis |
| GO:0016477 | 0.0066 | 1.5217 | 32.4447 | 47 | 1151 | cell migration |
| GO:0010470 | 0.0067 | 4.6234 | 1.2026 | 5 | 42 | regulation of gastrulation |
| GO:0042487 | 0.0067 | 9.3058 | 0.4009 | 3 | 14 | regulation of odontogenesis of dentin-containing tooth |
| GO:0042711 | 0.0067 | 9.3058 | 0.4009 | 3 | 14 | maternal behavior |
| GO:0007416 | 0.0067 | 2.6656 | 3.98 | 10 | 139 | synapse assembly |
| GO:0030155 | 0.0068 | 1.6914 | 18.5542 | 30 | 648 | regulation of cell adhesion |
| GO:0032990 | 0.0068 | 1.7249 | 16.9794 | 28 | 593 | cell part morphogenesis |
| GO:0045665 | 0.0068 | 2.403 | 5.2685 | 12 | 184 | negative regulation of neuron differentiation |
| GO:0003279 | 0.0071 | 3.0508 | 2.806 | 8 | 98 | cardiac septum development |
| GO:0051705 | 0.0072 | 3.8056 | 1.718 | 6 | 60 | multi-organism behavior |
| GO:0051961 | 0.0074 | 2.1395 | 7.3587 | 15 | 257 | negative regulation of nervous system development |
| GO:0035051 | 0.0074 | 2.6246 | 4.0373 | 10 | 141 | cardiocyte differentiation |
| GO:0003266 | 0.0077 | 22.8055 | 0.1426 | 2 | 5 | regulation of secondary heart field cardioblast proliferation |
| GO:0002568 | 0.0077 | 22.7099 | 0.1432 | 2 | 5 | somatic diversification of T cell receptor genes |
| GO:0006528 | 0.0077 | 22.7099 | 0.1432 | 2 | 5 | asparagine metabolic process |
| GO:0009597 | 0.0077 | 22.7099 | 0.1432 | 2 | 5 | detection of virus |
| GO:0021778 | 0.0077 | 22.7099 | 0.1432 | 2 | 5 | oligodendrocyte cell fate specification |
| GO:0033153 | 0.0077 | 22.7099 | 0.1432 | 2 | 5 | T cell receptor V(D)J recombination |
| GO:0043415 | 0.0077 | 22.7099 | 0.1432 | 2 | 5 | positive regulation of skeletal muscle tissue regeneration |
| GO:0045409 | 0.0077 | 22.7099 | 0.1432 | 2 | 5 | negative regulation of interleukin-6 biosynthetic process |
| GO:0051891 | 0.0077 | 22.7099 | 0.1432 | 2 | 5 | positive regulation of cardioblast differentiation |
| GO:0060023 | 0.0077 | 22.7099 | 0.1432 | 2 | 5 | soft palate development |
| GO:0070309 | 0.0077 | 22.7099 | 0.1432 | 2 | 5 | lens fiber cell morphogenesis |
| GO:0071799 | 0.0077 | 22.7099 | 0.1432 | 2 | 5 | cellular response to prostaglandin D stimulus |
| GO:1902262 | 0.0077 | 22.7099 | 0.1432 | 2 | 5 | apoptotic process involved in blood vessel morphogenesis |
| GO:1904304 | 0.0077 | 22.7099 | 0.1432 | 2 | 5 | regulation of gastro-intestinal system smooth muscle contraction |
| GO:1905007 | 0.0077 | 22.7099 | 0.1432 | 2 | 5 | positive regulation of epithelial to mesenchymal transition involved in endocardial cushion formation |
| GO:0120039 | 0.0078 | 1.7226 | 16.3781 | 27 | 572 | plasma membrane bounded cell projection morphogenesis |
| GO:1903036 | 0.0078 | 3.7362 | 1.7466 | 6 | 61 | positive regulation of response to wounding |
| GO:0016339 | 0.0079 | 5.6945 | 0.8017 | 4 | 28 | calcium-dependent cell-cell adhesion via plasma membrane cell adhesion molecules |
| GO:0018279 | 0.0082 | 4.3857 | 1.2599 | 5 | 44 | protein N-linked glycosylation via asparagine |
| GO:0048521 | 0.0082 | 8.5298 | 0.4295 | 3 | 15 | negative regulation of behavior |
| GO:0072148 | 0.0082 | 8.5298 | 0.4295 | 3 | 15 | epithelial cell fate commitment |
| GO:1904467 | 0.0082 | 8.5298 | 0.4295 | 3 | 15 | regulation of tumor necrosis factor secretion |
| GO:0042127 | 0.0087 | 1.5757 | 24.5967 | 37 | 890 | regulation of cell proliferation |
| GO:0007389 | 0.0087 | 3.222 | 2.3285 | 7 | 85 | pattern specification process |
| GO:0030217 | 0.0089 | 2.2267 | 6.1315 | 13 | 215 | T cell differentiation |
| GO:0010719 | 0.0089 | 5.4664 | 0.8304 | 4 | 29 | negative regulation of epithelial to mesenchymal transition |
| GO:0001756 | 0.0091 | 3.6046 | 1.8039 | 6 | 63 | somitogenesis |
| GO:0043367 | 0.0091 | 3.6046 | 1.8039 | 6 | 63 | CD4-positive, alpha-beta T cell differentiation |
| GO:0048665 | 0.0096 | 7.9532 | 0.4537 | 3 | 16 | neuron fate specification |
| GO:0006928 | 0.0097 | 1.3843 | 54.0591 | 71 | 1888 | movement of cell or subcellular component |
| GO:0001704 | 0.0098 | 2.6643 | 3.5791 | 9 | 125 | formation of primary germ layer |
| GO:0060042 | 0.0098 | 4.1713 | 1.3171 | 5 | 46 | retina morphogenesis in camera-type eye |
| GO:0031328 | 0.0099 | 1.398 | 49.6783 | 66 | 1735 | positive regulation of cellular biosynthetic process |
| GO:0014061 | 0.0099 | 7.8731 | 0.4581 | 3 | 16 | regulation of norepinephrine secretion |
| GO:0043584 | 0.0099 | 7.8731 | 0.4581 | 3 | 16 | nose development |
| GO:0060850 | 0.0099 | 7.8731 | 0.4581 | 3 | 16 | regulation of transcription involved in cell fate commitment |
| GOMFID | Pvalue | OddsRatio | ExpCount | Count | Size | Term |
| GO:0045944 | 0 | 2.5642 | 32.0926 | 72 | 1068 | positive regulation of transcription from RNA polymerase II promoter |
| GO:2001141 | 0 | 1.9224 | 104.331 | 165 | 3472 | regulation of RNA biosynthetic process |
| GO:0006355 | 0 | 1.924 | 103.5197 | 164 | 3445 | regulation of transcription, DNA-templated |
| GO:0060562 | 0 | 4.7969 | 6.7693 | 28 | 228 | epithelial tube morphogenesis |
| GO:0048736 | 0 | 5.5288 | 5.1084 | 24 | 170 | appendage development |
| GO:0000122 | 0 | 2.7191 | 22.7773 | 55 | 758 | negative regulation of transcription from RNA polymerase II promoter |
| GO:0009888 | 0 | 2.0416 | 53.0429 | 95 | 1786 | tissue development |
| GO:0019219 | 0 | 1.7469 | 120.8281 | 176 | 4021 | regulation of nucleobase-containing compound metabolic process |
| GO:0007156 | 0 | 5.057 | 4.5675 | 20 | 152 | homophilic cell adhesion via plasma membrane adhesion molecules |
| GO:0009889 | 0 | 1.7014 | 130.564 | 185 | 4345 | regulation of biosynthetic process |
| GO:0030326 | 0 | 5.5475 | 3.7862 | 18 | 126 | embryonic limb morphogenesis |
| GO:1903507 | 0 | 2.1815 | 34.1961 | 67 | 1138 | negative regulation of nucleic acid-templated transcription |
| GO:0034654 | 0 | 1.6806 | 122.601 | 174 | 4080 | nucleobase-containing compound biosynthetic process |
| GO:0045597 | 0 | 3.107 | 11.8018 | 33 | 402 | positive regulation of cell differentiation |
| GO:0007399 | 0 | 2.0857 | 37.6075 | 70 | 1358 | nervous system development |
| GO:0061138 | 0 | 4.3002 | 5.2586 | 20 | 175 | morphogenesis of a branching epithelium |
| GO:0051253 | 0 | 2.0674 | 36.4197 | 68 | 1212 | negative regulation of RNA metabolic process |
| GO:1903508 | 0 | 1.9954 | 41.1374 | 74 | 1369 | positive regulation of nucleic acid-templated transcription |
| GO:0048562 | 0 | 4.0906 | 5.4891 | 20 | 187 | embryonic organ morphogenesis |
| GO:0003206 | 0 | 5.0035 | 3.666 | 16 | 122 | cardiac chamber morphogenesis |
| GO:0048762 | 0 | 4.037 | 5.5591 | 20 | 185 | mesenchymal cell differentiation |
| GO:0051254 | 0 | 1.9458 | 43.2709 | 76 | 1440 | positive regulation of RNA metabolic process |
| GO:0007218 | 0 | 5.7143 | 2.8547 | 14 | 95 | neuropeptide signaling pathway |
| GO:0010557 | 0 | 1.8938 | 48.0788 | 82 | 1600 | positive regulation of macromolecule biosynthetic process |
| GO:0032502 | 0 | 1.9612 | 46.0941 | 78 | 1779 | developmental process |
| GO:0035295 | 0 | 3.0378 | 10.1381 | 28 | 351 | tube development |
| GO:0007267 | 0 | 1.8549 | 45.735 | 77 | 1522 | cell-cell signaling |
| GO:0001568 | 0 | 2.344 | 18.5704 | 40 | 618 | blood vessel development |
| GO:0003002 | 0 | 4.8561 | 3.2714 | 14 | 114 | regionalization |
| GO:0072132 | 0 | 7.9803 | 1.3823 | 9 | 46 | mesenchyme morphogenesis |
| GO:0010628 | 0 | 1.7521 | 52.7365 | 84 | 1755 | positive regulation of gene expression |
| GO:0072358 | 0 | 2.2051 | 19.6222 | 40 | 653 | cardiovascular system development |
| GO:0048863 | 0 | 3.0611 | 7.4829 | 21 | 250 | stem cell differentiation |
| GO:0035148 | 0 | 3.9329 | 4.2369 | 15 | 141 | tube formation |
| GO:0050767 | 0 | 2.192 | 19.2163 | 39 | 645 | regulation of neurogenesis |
| GO:0019098 | 0 | 9.9524 | 0.9015 | 7 | 30 | reproductive behavior |
| GO:0021983 | 0 | 7.9389 | 1.232 | 8 | 41 | pituitary gland development |
| GO:0001569 | 0 | 9.5371 | 0.9315 | 7 | 31 | branching involved in blood vessel morphogenesis |
| GO:0009887 | 0 | 3.0598 | 7.1145 | 20 | 257 | animal organ morphogenesis |
| GO:0051961 | 0 | 2.9564 | 7.7227 | 21 | 257 | negative regulation of nervous system development |
| GO:0021513 | 0 | 12.2427 | 0.6611 | 6 | 22 | spinal cord dorsal/ventral patterning |
| GO:0031328 | 0 | 1.6963 | 52.1355 | 81 | 1735 | positive regulation of cellular biosynthetic process |
| GO:0030324 | 0 | 3.5023 | 5.0182 | 16 | 167 | lung development |
| GO:2000026 | 0 | 1.7378 | 44.4856 | 71 | 1526 | regulation of multicellular organismal development |
| GO:0001764 | 1e-04 | 3.8475 | 4.0266 | 14 | 134 | neuron migration |
| GO:0003215 | 1e-04 | 16.3617 | 0.449 | 5 | 15 | cardiac right ventricle morphogenesis |
| GO:0003231 | 1e-04 | 4.0397 | 3.5759 | 13 | 119 | cardiac ventricle development |
| GO:0021915 | 1e-04 | 3.5364 | 4.6576 | 15 | 155 | neural tube development |
| GO:0003230 | 1e-04 | 8.1726 | 1.0517 | 7 | 35 | cardiac atrium development |
| GO:0043010 | 1e-04 | 2.7071 | 8.7744 | 22 | 292 | camera-type eye development |
| GO:0003148 | 1e-04 | 10.3077 | 0.7512 | 6 | 25 | outflow tract septum morphogenesis |
| GO:0060413 | 1e-04 | 14.8137 | 0.4808 | 5 | 16 | atrial septum morphogenesis |
| GO:0003179 | 1e-04 | 7.8902 | 1.0818 | 7 | 36 | heart valve morphogenesis |
| GO:0060021 | 1e-04 | 4.5176 | 2.7345 | 11 | 91 | palate development |
| GO:0048468 | 1e-04 | 1.787 | 35.7279 | 59 | 1234 | cell development |
| GO:0001709 | 1e-04 | 7.6581 | 1.1075 | 7 | 37 | cell fate determination |
| GO:0048598 | 1e-04 | 2.7265 | 8.3063 | 21 | 292 | embryonic morphogenesis |
| GO:0042662 | 1e-04 | 97.4289 | 0.1202 | 3 | 4 | negative regulation of mesodermal cell fate specification |
| GO:0060214 | 1e-04 | 97.4289 | 0.1202 | 3 | 4 | endocardium formation |
| GO:1905903 | 1e-04 | 97.4289 | 0.1202 | 3 | 4 | negative regulation of mesoderm formation |
| GO:2000113 | 1e-04 | 1.6889 | 44.8034 | 70 | 1491 | negative regulation of cellular macromolecule biosynthetic process |
| GO:0048870 | 1e-04 | 1.695 | 42.6399 | 67 | 1419 | cell motility |
| GO:0045665 | 1e-04 | 3.1445 | 5.5291 | 16 | 184 | negative regulation of neuron differentiation |
| GO:0030198 | 1e-04 | 2.5219 | 9.7961 | 23 | 326 | extracellular matrix organization |
| GO:0003197 | 1e-04 | 7.1492 | 1.1719 | 7 | 39 | endocardial cushion development |
| GO:0048935 | 1e-04 | 21.7773 | 0.2993 | 4 | 10 | peripheral nervous system neuron development |
| GO:0003279 | 2e-04 | 4.1523 | 2.9448 | 11 | 98 | cardiac septum development |
| GO:0030900 | 2e-04 | 2.4747 | 9.9658 | 23 | 334 | forebrain development |
| GO:0090304 | 2e-04 | 1.4155 | 147.3015 | 184 | 4902 | nucleic acid metabolic process |
| GO:0010719 | 2e-04 | 8.5129 | 0.8714 | 6 | 29 | negative regulation of epithelial to mesenchymal transition |
| GO:0031128 | 2e-04 | 8.5129 | 0.8714 | 6 | 29 | developmental induction |
| GO:0002089 | 2e-04 | 11.6371 | 0.5709 | 5 | 19 | lens morphogenesis in camera-type eye |
| GO:0060322 | 2e-04 | 1.9778 | 20.5236 | 38 | 683 | head development |
| GO:0021903 | 2e-04 | 18.5891 | 0.3305 | 4 | 11 | rostrocaudal neural tube patterning |
| GO:0045666 | 2e-04 | 2.4909 | 9.4655 | 22 | 315 | positive regulation of neuron differentiation |
| GO:0060255 | 2e-04 | 1.3929 | 175.5478 | 213 | 5842 | regulation of macromolecule metabolic process |
| GO:0001501 | 2e-04 | 3.1269 | 5.1983 | 15 | 179 | skeletal system development |
| GO:0060039 | 3e-04 | 10.8606 | 0.601 | 5 | 20 | pericardium development |
| GO:0051891 | 3e-04 | 48.7113 | 0.1502 | 3 | 5 | positive regulation of cardioblast differentiation |
| GO:0061009 | 3e-04 | 48.7113 | 0.1502 | 3 | 5 | common bile duct development |
| GO:0009954 | 3e-04 | 7.8309 | 0.9315 | 6 | 31 | proximal/distal pattern formation |
| GO:0010721 | 3e-04 | 2.5766 | 8.3236 | 20 | 277 | negative regulation of cell development |
| GO:0001947 | 3e-04 | 5.3412 | 1.7128 | 8 | 57 | heart looping |
| GO:0035050 | 3e-04 | 4.6791 | 2.1635 | 9 | 72 | embryonic heart tube development |
| GO:0048858 | 3e-04 | 2.0353 | 17.2783 | 33 | 575 | cell projection morphogenesis |
| GO:0042127 | 3e-04 | 1.6348 | 44.7323 | 68 | 1511 | regulation of cell proliferation |
| GO:0055123 | 3e-04 | 3.3672 | 4.2069 | 13 | 140 | digestive system development |
| GO:0048663 | 3e-04 | 5.2646 | 1.7332 | 8 | 58 | neuron fate commitment |
| GO:0048701 | 3e-04 | 6.1811 | 1.3222 | 7 | 44 | embryonic cranial skeleton morphogenesis |
| GO:0043586 | 3e-04 | 10.1812 | 0.631 | 5 | 21 | tongue development |
| GO:0060536 | 3e-04 | 16.2645 | 0.3606 | 4 | 12 | cartilage morphogenesis |
| GO:0001525 | 4e-04 | 2.2182 | 12.4931 | 26 | 421 | angiogenesis |
| GO:0003156 | 4e-04 | 7.2499 | 0.9916 | 6 | 33 | regulation of animal organ formation |
| GO:0045987 | 4e-04 | 7.2499 | 0.9916 | 6 | 33 | positive regulation of smooth muscle contraction |
| GO:0032330 | 4e-04 | 5.8634 | 1.3823 | 7 | 46 | regulation of chondrocyte differentiation |
| GO:0048332 | 4e-04 | 4.3986 | 2.2837 | 9 | 76 | mesoderm morphogenesis |
| GO:0099537 | 4e-04 | 1.9859 | 17.669 | 33 | 588 | trans-synaptic signaling |
| GO:0048704 | 5e-04 | 5.6457 | 1.4255 | 7 | 48 | embryonic skeletal system morphogenesis |
| GO:0003278 | 5e-04 | 32.4722 | 0.1803 | 3 | 6 | apoptotic process involved in heart morphogenesis |
| GO:0007626 | 6e-04 | 2.8558 | 5.6493 | 15 | 188 | locomotory behavior |
| GO:0042711 | 6e-04 | 13.0099 | 0.4207 | 4 | 14 | maternal behavior |
| GO:0071229 | 6e-04 | 2.8228 | 5.7094 | 15 | 190 | cellular response to acid chemical |
| GO:0048546 | 7e-04 | 5.3166 | 1.5025 | 7 | 50 | digestive tract morphogenesis |
| GO:0097659 | 7e-04 | 1.6072 | 43.067 | 64 | 1585 | nucleic acid-templated transcription |
| GO:0001755 | 8e-04 | 6.3128 | 1.1118 | 6 | 37 | neural crest cell migration |
| GO:1901576 | 8e-04 | 1.3486 | 183.8113 | 218 | 6117 | organic substance biosynthetic process |
| GO:0030534 | 8e-04 | 3.2033 | 4.0567 | 12 | 135 | adult behavior |
| GO:0090288 | 8e-04 | 3.2033 | 4.0567 | 12 | 135 | negative regulation of cellular response to growth factor stimulus |
| GO:0045992 | 8e-04 | 8.1429 | 0.7512 | 5 | 25 | negative regulation of embryonic development |
| GO:0048596 | 8e-04 | 8.1429 | 0.7512 | 5 | 25 | embryonic camera-type eye morphogenesis |
| GO:0060037 | 8e-04 | 8.1429 | 0.7512 | 5 | 25 | pharyngeal system development |
| GO:0048812 | 8e-04 | 1.9597 | 16.7675 | 31 | 558 | neuron projection morphogenesis |
| GO:0050807 | 8e-04 | 3.4039 | 3.5158 | 11 | 117 | regulation of synapse organization |
| GO:0001708 | 8e-04 | 4.4672 | 1.9986 | 8 | 67 | cell fate specification |
| GO:0060581 | 8e-04 | 11.8264 | 0.4507 | 4 | 15 | cell fate commitment involved in pattern specification |
| GO:0071599 | 8e-04 | 11.8264 | 0.4507 | 4 | 15 | otic vesicle development |
| GO:0003357 | 9e-04 | 24.3526 | 0.2103 | 3 | 7 | noradrenergic neuron differentiation |
| GO:0021798 | 9e-04 | 24.3526 | 0.2103 | 3 | 7 | forebrain dorsal/ventral pattern formation |
| GO:0035265 | 9e-04 | 2.9874 | 4.6877 | 13 | 156 | organ growth |
| GO:0050789 | 9e-04 | 1.3781 | 321.7074 | 354 | 10706 | regulation of biological process |
| GO:0001558 | 9e-04 | 2.1894 | 11.1483 | 23 | 371 | regulation of cell growth |
| GO:0003218 | 9e-04 | Inf | 0.0601 | 2 | 2 | cardiac left ventricle formation |
| GO:0043134 | 9e-04 | Inf | 0.0601 | 2 | 2 | regulation of hindgut contraction |
| GO:0072272 | 9e-04 | Inf | 0.0601 | 2 | 2 | proximal/distal pattern formation involved in metanephric nephron development |
| GO:0120054 | 9e-04 | Inf | 0.0601 | 2 | 2 | intestinal motility |
| GO:0120058 | 9e-04 | Inf | 0.0601 | 2 | 2 | positive regulation of small intestinal transit |
| GO:0021884 | 9e-04 | 7.7546 | 0.7813 | 5 | 26 | forebrain neuron development |
| GO:0014855 | 0.0011 | 4.2872 | 2.0734 | 8 | 69 | striated muscle cell proliferation |
| GO:0001655 | 0.0011 | 2.2946 | 9.2552 | 20 | 308 | urogenital system development |
| GO:0051216 | 0.0011 | 3.0688 | 4.2154 | 12 | 142 | cartilage development |
| GO:0035051 | 0.0011 | 3.0532 | 4.2369 | 12 | 141 | cardiocyte differentiation |
| GO:0048608 | 0.0012 | 2.0924 | 12.1399 | 24 | 404 | reproductive structure development |
| GO:0007631 | 0.0012 | 3.4479 | 3.1552 | 10 | 105 | feeding behavior |
| GO:0048592 | 0.0013 | 3.0062 | 4.297 | 12 | 143 | eye morphogenesis |
| GO:0060441 | 0.0013 | 7.0794 | 0.8414 | 5 | 28 | epithelial tube branching involved in lung morphogenesis |
| GO:1902692 | 0.0013 | 7.0794 | 0.8414 | 5 | 28 | regulation of neuroblast proliferation |
| GO:0021859 | 0.0013 | 19.4808 | 0.2404 | 3 | 8 | pyramidal neuron differentiation |
| GO:0030916 | 0.0013 | 19.4808 | 0.2404 | 3 | 8 | otic vesicle formation |
| GO:0060534 | 0.0013 | 19.4808 | 0.2404 | 3 | 8 | trachea cartilage development |
| GO:2000035 | 0.0013 | 19.4808 | 0.2404 | 3 | 8 | regulation of stem cell division |
| GO:0021514 | 0.0014 | 10.0057 | 0.5108 | 4 | 17 | ventral spinal cord interneuron differentiation |
| GO:0055012 | 0.0014 | 10.0057 | 0.5108 | 4 | 17 | ventricular cardiac muscle cell differentiation |
| GO:2000136 | 0.0014 | 10.0057 | 0.5108 | 4 | 17 | regulation of cell proliferation involved in heart morphogenesis |
| GO:0045137 | 0.0014 | 2.5837 | 6.1901 | 15 | 206 | development of primary sexual characteristics |
| GO:0006725 | 0.0015 | 1.3278 | 172.3025 | 204 | 5734 | cellular aromatic compound metabolic process |
| GO:0061333 | 0.0015 | 4.0223 | 2.1936 | 8 | 73 | renal tubule morphogenesis |
| GO:1902742 | 0.0015 | 6.8118 | 0.868 | 5 | 29 | apoptotic process involved in development |
| GO:0010629 | 0.0016 | 1.4875 | 55.2606 | 77 | 1839 | negative regulation of gene expression |
| GO:0051965 | 0.0017 | 4.4803 | 1.7429 | 7 | 58 | positive regulation of synapse assembly |
| GO:0042692 | 0.0018 | 2.0677 | 11.7493 | 23 | 391 | muscle cell differentiation |
| GO:0060004 | 0.0018 | 9.2904 | 0.5409 | 4 | 18 | reflex |
| GO:0001756 | 0.0018 | 4.4117 | 1.7661 | 7 | 59 | somitogenesis |
| GO:0001657 | 0.0019 | 3.5046 | 2.7946 | 9 | 93 | ureteric bud development |
| GO:0046483 | 0.0019 | 1.3184 | 171.1906 | 202 | 5697 | heterocycle metabolic process |
| GO:0048699 | 0.002 | 1.861 | 17.0246 | 30 | 600 | generation of neurons |
| GO:0003266 | 0.002 | 16.233 | 0.2704 | 3 | 9 | regulation of secondary heart field cardioblast proliferation |
| GO:0060180 | 0.002 | 16.233 | 0.2704 | 3 | 9 | female mating behavior |
| GO:1905770 | 0.002 | 16.233 | 0.2704 | 3 | 9 | regulation of mesodermal cell differentiation |
| GO:0001822 | 0.002 | 2.3328 | 7.7227 | 17 | 257 | kidney development |
| GO:0042472 | 0.0021 | 3.4632 | 2.8246 | 9 | 94 | inner ear morphogenesis |
| GO:0072163 | 0.0021 | 3.4632 | 2.8246 | 9 | 94 | mesonephric epithelium development |
| GO:0007519 | 0.0022 | 2.8113 | 4.5675 | 12 | 152 | skeletal muscle tissue development |
| GO:0031018 | 0.0022 | 5.0153 | 1.3522 | 6 | 45 | endocrine pancreas development |
| GO:0021895 | 0.0022 | 8.6705 | 0.5709 | 4 | 19 | cerebral cortex neuron differentiation |
| GO:0072079 | 0.0022 | 8.6705 | 0.5709 | 4 | 19 | nephron tubule formation |
| GO:0007275 | 0.0022 | 1.4393 | 70.7182 | 93 | 2749 | multicellular organism development |
| GO:0007492 | 0.0023 | 3.7338 | 2.3438 | 8 | 78 | endoderm development |
| GO:0098609 | 0.0024 | 1.7082 | 23.4384 | 38 | 780 | cell-cell adhesion |
| GO:0060317 | 0.0025 | 6.0291 | 0.9616 | 5 | 32 | cardiac epithelial to mesenchymal transition |
| GO:0010594 | 0.0025 | 2.9064 | 4.0567 | 11 | 135 | regulation of endothelial cell migration |
| GO:0009725 | 0.0026 | 1.6754 | 25.1512 | 40 | 837 | response to hormone |
| GO:0009952 | 0.0026 | 3.0876 | 3.4822 | 10 | 119 | anterior/posterior pattern specification |
| GO:0042476 | 0.0026 | 3.0879 | 3.4857 | 10 | 116 | odontogenesis |
| GO:0048667 | 0.0026 | 1.8837 | 15.0847 | 27 | 502 | cell morphogenesis involved in neuron differentiation |
| GO:0002125 | 0.0026 | 64.8189 | 0.0901 | 2 | 3 | maternal aggressive behavior |
| GO:0003166 | 0.0026 | 64.8189 | 0.0901 | 2 | 3 | bundle of His development |
| GO:0003274 | 0.0026 | 64.8189 | 0.0901 | 2 | 3 | endocardial cushion fusion |
| GO:0014016 | 0.0026 | 64.8189 | 0.0901 | 2 | 3 | neuroblast differentiation |
| GO:0021524 | 0.0026 | 64.8189 | 0.0901 | 2 | 3 | visceral motor neuron differentiation |
| GO:0046010 | 0.0026 | 64.8189 | 0.0901 | 2 | 3 | positive regulation of circadian sleep/wake cycle, non-REM sleep |
| GO:0048936 | 0.0026 | 64.8189 | 0.0901 | 2 | 3 | peripheral nervous system neuron axonogenesis |
| GO:0055005 | 0.0026 | 64.8189 | 0.0901 | 2 | 3 | ventricular cardiac myofibril assembly |
| GO:0055014 | 0.0026 | 64.8189 | 0.0901 | 2 | 3 | atrial cardiac muscle cell development |
| GO:0060913 | 0.0026 | 64.8189 | 0.0901 | 2 | 3 | cardiac cell fate determination |
| GO:0061364 | 0.0026 | 64.8189 | 0.0901 | 2 | 3 | apoptotic process involved in luteolysis |
| GO:1904000 | 0.0026 | 64.8189 | 0.0901 | 2 | 3 | positive regulation of eating behavior |
| GO:1904349 | 0.0026 | 64.8189 | 0.0901 | 2 | 3 | positive regulation of small intestine smooth muscle contraction |
| GO:1905333 | 0.0026 | 64.8189 | 0.0901 | 2 | 3 | regulation of gastric motility |
| GO:0021854 | 0.0027 | 8.1281 | 0.601 | 4 | 20 | hypothalamus development |
| GO:2000178 | 0.0027 | 8.1281 | 0.601 | 4 | 20 | negative regulation of neural precursor cell proliferation |
| GO:0031960 | 0.0027 | 2.7325 | 4.6877 | 12 | 156 | response to corticosteroid |
| GO:0007517 | 0.0027 | 2.2066 | 8.6155 | 18 | 290 | muscle organ development |
| GO:2000179 | 0.0027 | 4.7701 | 1.4123 | 6 | 47 | positive regulation of neural precursor cell proliferation |
| GO:0007411 | 0.0027 | 2.405 | 6.6108 | 15 | 220 | axon guidance |
| GO:0003263 | 0.0028 | 13.9131 | 0.3005 | 3 | 10 | cardioblast proliferation |
| GO:0021877 | 0.0028 | 13.9131 | 0.3005 | 3 | 10 | forebrain neuron fate commitment |
| GO:0050680 | 0.0028 | 3.0589 | 3.5158 | 10 | 117 | negative regulation of epithelial cell proliferation |
| GO:0007268 | 0.0028 | 1.8312 | 16.6588 | 29 | 558 | chemical synaptic transmission |
| GO:0051240 | 0.0028 | 1.6375 | 27.72 | 43 | 962 | positive regulation of multicellular organismal process |
| GO:0001662 | 0.0028 | 5.8134 | 0.9916 | 5 | 33 | behavioral fear response |
| GO:0032989 | 0.0029 | 1.6134 | 29.3882 | 45 | 978 | cellular component morphogenesis |
| GO:0045926 | 0.003 | 2.3815 | 6.6709 | 15 | 222 | negative regulation of growth |
| GO:0060348 | 0.003 | 2.5697 | 5.3788 | 13 | 179 | bone development |
| GO:0055008 | 0.003 | 4.0072 | 1.9232 | 7 | 64 | cardiac muscle tissue morphogenesis |
| GO:0060043 | 0.003 | 4.6562 | 1.4424 | 6 | 48 | regulation of cardiac muscle cell proliferation |
| GO:1901360 | 0.0031 | 1.2972 | 178.6128 | 208 | 5944 | organic cyclic compound metabolic process |
| GO:0021515 | 0.0032 | 5.6547 | 1.0144 | 5 | 34 | cell differentiation in spinal cord |
| GO:0045778 | 0.0032 | 3.5311 | 2.464 | 8 | 82 | positive regulation of ossification |
| GO:0001838 | 0.0032 | 3.2221 | 3.0136 | 9 | 101 | embryonic epithelial tube formation |
| GO:0021516 | 0.0032 | 7.6495 | 0.631 | 4 | 21 | dorsal spinal cord development |
| GO:0048485 | 0.0032 | 7.6495 | 0.631 | 4 | 21 | sympathetic nervous system development |
| GO:0021543 | 0.0033 | 2.658 | 4.8079 | 12 | 160 | pallium development |
| GO:0048644 | 0.0034 | 3.4838 | 2.4941 | 8 | 83 | muscle organ morphogenesis |
| GO:0043583 | 0.0035 | 2.4191 | 6.13 | 14 | 204 | ear development |
| GO:0032526 | 0.0036 | 3.1636 | 3.065 | 9 | 102 | response to retinoic acid |
| GO:0042063 | 0.0036 | 2.2578 | 7.4823 | 16 | 249 | gliogenesis |
| GO:0090596 | 0.0037 | 3.1496 | 3.0754 | 9 | 104 | sensory organ morphogenesis |
| GO:0045823 | 0.0037 | 5.4251 | 1.0517 | 5 | 35 | positive regulation of heart contraction |
| GO:0003157 | 0.0037 | 12.1732 | 0.3305 | 3 | 11 | endocardium development |
| GO:0007512 | 0.0037 | 12.1732 | 0.3305 | 3 | 11 | adult heart development |
| GO:0021521 | 0.0037 | 12.1732 | 0.3305 | 3 | 11 | ventral spinal cord interneuron specification |
| GO:0042415 | 0.0037 | 12.1732 | 0.3305 | 3 | 11 | norepinephrine metabolic process |
| GO:0051173 | 0.0038 | 1.3635 | 84.8892 | 108 | 2825 | positive regulation of nitrogen compound metabolic process |
| GO:0051962 | 0.0038 | 1.9642 | 11.7709 | 22 | 396 | positive regulation of nervous system development |
| GO:0034645 | 0.0038 | 1.3539 | 98.2275 | 122 | 3460 | cellular macromolecule biosynthetic process |
| GO:0003272 | 0.0038 | 7.2241 | 0.6611 | 4 | 22 | endocardial cushion formation |
| GO:0060420 | 0.0039 | 3.8061 | 2.0133 | 7 | 67 | regulation of heart growth |
| GO:0010720 | 0.0042 | 1.8616 | 14.0931 | 25 | 469 | positive regulation of cell development |
| GO:0071542 | 0.0042 | 5.2498 | 1.0818 | 5 | 36 | dopaminergic neuron differentiation |
| GO:0014032 | 0.0044 | 6.9157 | 0.6842 | 4 | 23 | neural crest cell development |
| GO:0002009 | 0.0044 | 2.5496 | 4.9884 | 12 | 176 | morphogenesis of an epithelium |
| GO:0001704 | 0.0045 | 2.8446 | 3.7562 | 10 | 125 | formation of primary germ layer |
| GO:1903670 | 0.0045 | 4.2502 | 1.5626 | 6 | 52 | regulation of sprouting angiogenesis |
| GO:0010226 | 0.0045 | 6.8434 | 0.6911 | 4 | 23 | response to lithium ion |
| GO:0048103 | 0.0045 | 6.8434 | 0.6911 | 4 | 23 | somatic stem cell division |
| GO:0007623 | 0.0045 | 2.4361 | 5.6493 | 13 | 188 | circadian rhythm |
| GO:0046632 | 0.0046 | 3.3065 | 2.6143 | 8 | 87 | alpha-beta T cell differentiation |
| GO:0055017 | 0.0046 | 3.3065 | 2.6143 | 8 | 87 | cardiac muscle tissue growth |
| GO:0030334 | 0.0046 | 1.6689 | 21.9961 | 35 | 732 | regulation of cell migration |
| GO:0002042 | 0.0047 | 5.0854 | 1.1118 | 5 | 37 | cell migration involved in sprouting angiogenesis |
| GO:0003214 | 0.0048 | 10.8647 | 0.3592 | 3 | 12 | cardiac left ventricle morphogenesis |
| GO:0010454 | 0.0048 | 10.8199 | 0.3606 | 3 | 12 | negative regulation of cell fate commitment |
| GO:0033605 | 0.0048 | 10.8199 | 0.3606 | 3 | 12 | positive regulation of catecholamine secretion |
| GO:0042659 | 0.0048 | 10.8199 | 0.3606 | 3 | 12 | regulation of cell fate specification |
| GO:2000095 | 0.0048 | 10.8199 | 0.3606 | 3 | 12 | regulation of Wnt signaling pathway, planar cell polarity pathway |
| GO:0014902 | 0.0049 | 3.0013 | 3.2153 | 9 | 107 | myotube differentiation |
| GO:0007422 | 0.005 | 3.6242 | 2.1034 | 7 | 70 | peripheral nervous system development |
| GO:0030512 | 0.005 | 3.6242 | 2.1034 | 7 | 70 | negative regulation of transforming growth factor beta receptor signaling pathway |
| GO:0030879 | 0.005 | 2.7957 | 3.8163 | 10 | 127 | mammary gland development |
| GO:0021953 | 0.0052 | 3.2359 | 2.6624 | 8 | 91 | central nervous system neuron differentiation |
| GO:0003219 | 0.0052 | 32.4074 | 0.1202 | 2 | 4 | cardiac right ventricle formation |
| GO:0003308 | 0.0052 | 32.4074 | 0.1202 | 2 | 4 | negative regulation of Wnt signaling pathway involved in heart development |
| GO:0003415 | 0.0052 | 32.4074 | 0.1202 | 2 | 4 | chondrocyte hypertrophy |
| GO:0007621 | 0.0052 | 32.4074 | 0.1202 | 2 | 4 | negative regulation of female receptivity |
| GO:0021555 | 0.0052 | 32.4074 | 0.1202 | 2 | 4 | midbrain-hindbrain boundary morphogenesis |
| GO:0021797 | 0.0052 | 32.4074 | 0.1202 | 2 | 4 | forebrain anterior/posterior pattern specification |
| GO:0032100 | 0.0052 | 32.4074 | 0.1202 | 2 | 4 | positive regulation of appetite |
| GO:0034287 | 0.0052 | 32.4074 | 0.1202 | 2 | 4 | detection of monosaccharide stimulus |
| GO:0043553 | 0.0052 | 32.4074 | 0.1202 | 2 | 4 | negative regulation of phosphatidylinositol 3-kinase activity |
| GO:0048866 | 0.0052 | 32.4074 | 0.1202 | 2 | 4 | stem cell fate specification |
| GO:0051414 | 0.0052 | 32.4074 | 0.1202 | 2 | 4 | response to cortisol |
| GO:0051464 | 0.0052 | 32.4074 | 0.1202 | 2 | 4 | positive regulation of cortisol secretion |
| GO:0051594 | 0.0052 | 32.4074 | 0.1202 | 2 | 4 | detection of glucose |
| GO:0060164 | 0.0052 | 32.4074 | 0.1202 | 2 | 4 | regulation of timing of neuron differentiation |
| GO:0072086 | 0.0052 | 32.4074 | 0.1202 | 2 | 4 | specification of loop of Henle identity |
| GO:0090244 | 0.0052 | 32.4074 | 0.1202 | 2 | 4 | Wnt signaling pathway involved in somitogenesis |
| GO:1990086 | 0.0052 | 32.4074 | 0.1202 | 2 | 4 | lens fiber cell apoptotic process |
| GO:0003171 | 0.0053 | 6.5008 | 0.7212 | 4 | 24 | atrioventricular valve development |
| GO:0030878 | 0.0053 | 6.5008 | 0.7212 | 4 | 24 | thyroid gland development |
| GO:0032673 | 0.0053 | 6.5008 | 0.7212 | 4 | 24 | regulation of interleukin-4 production |
| GO:0048520 | 0.0053 | 6.5008 | 0.7212 | 4 | 24 | positive regulation of behavior |
| GO:0060487 | 0.0053 | 6.5008 | 0.7212 | 4 | 24 | lung epithelial cell differentiation |
| GO:0007618 | 0.0053 | 4.931 | 1.1419 | 5 | 38 | mating |
| GO:0060412 | 0.0053 | 4.931 | 1.1419 | 5 | 38 | ventricular septum morphogenesis |
| GO:2000648 | 0.0053 | 4.931 | 1.1419 | 5 | 38 | positive regulation of stem cell proliferation |
| GO:0072088 | 0.0054 | 3.5673 | 2.1335 | 7 | 71 | nephron epithelium morphogenesis |
| GO:0045667 | 0.0056 | 2.9409 | 3.2754 | 9 | 109 | regulation of osteoblast differentiation |
| GO:0060541 | 0.0057 | 6.3411 | 0.7342 | 4 | 25 | respiratory system development |
| GO:0035710 | 0.0058 | 3.5122 | 2.1635 | 7 | 72 | CD4-positive, alpha-beta T cell activation |
| GO:0008584 | 0.0059 | 2.7252 | 3.9064 | 10 | 130 | male gonad development |
| GO:0021879 | 0.0059 | 9.883 | 0.3851 | 3 | 13 | forebrain neuron differentiation |
| GO:0035136 | 0.0059 | 4.7857 | 1.1719 | 5 | 39 | forelimb morphogenesis |
| GO:0021520 | 0.0062 | 9.7373 | 0.3906 | 3 | 13 | spinal cord motor neuron cell fate specification |
| GO:0021781 | 0.0062 | 9.7373 | 0.3906 | 3 | 13 | glial cell fate commitment |
| GO:0040034 | 0.0062 | 9.7373 | 0.3906 | 3 | 13 | regulation of development, heterochronic |
| GO:0060123 | 0.0062 | 9.7373 | 0.3906 | 3 | 13 | regulation of growth hormone secretion |
| GO:2000647 | 0.0062 | 9.7373 | 0.3906 | 3 | 13 | negative regulation of stem cell proliferation |
| GO:0061037 | 0.0062 | 6.1909 | 0.7512 | 4 | 25 | negative regulation of cartilage development |
| GO:0043627 | 0.0063 | 3.4588 | 2.1936 | 7 | 73 | response to estrogen |
| GO:0051270 | 0.0068 | 1.5817 | 25.8123 | 39 | 859 | regulation of cellular component movement |
| GO:0010558 | 0.0069 | 3.8503 | 1.7005 | 6 | 60 | negative regulation of macromolecule biosynthetic process |
| GO:0021517 | 0.0069 | 5.9534 | 0.7757 | 4 | 26 | ventral spinal cord development |
| GO:0007368 | 0.007 | 2.827 | 3.3956 | 9 | 113 | determination of left/right symmetry |
| GO:0019932 | 0.0071 | 2.0389 | 8.7443 | 17 | 291 | second-messenger-mediated signaling |
| GO:0022603 | 0.0071 | 1.6429 | 21.0171 | 33 | 717 | regulation of anatomical structure morphogenesis |
| GO:0016202 | 0.0072 | 2.6367 | 4.0266 | 10 | 134 | regulation of striated muscle tissue development |
| GO:0034641 | 0.0073 | 1.2602 | 189.4606 | 216 | 6305 | cellular nitrogen compound metabolic process |
| GO:0071495 | 0.0074 | 1.5165 | 31.798 | 46 | 1072 | cellular response to endogenous stimulus |
| GO:0007155 | 0.0076 | 1.747 | 15.5724 | 26 | 535 | cell adhesion |
| GO:0032736 | 0.0077 | 8.8515 | 0.4207 | 3 | 14 | positive regulation of interleukin-13 production |
| GO:0042487 | 0.0077 | 8.8515 | 0.4207 | 3 | 14 | regulation of odontogenesis of dentin-containing tooth |
| GO:2000846 | 0.0077 | 8.8515 | 0.4207 | 3 | 14 | regulation of corticosteroid hormone secretion |
| GO:0043009 | 0.0078 | 1.9734 | 9.5508 | 18 | 332 | chordate embryonic development |
| GO:0045927 | 0.0078 | 3.3045 | 2.2844 | 7 | 77 | positive regulation of growth |
| GO:0070849 | 0.0082 | 4.3968 | 1.2621 | 5 | 42 | response to epidermal growth factor |
| GO:0061564 | 0.0082 | 1.8012 | 13.3419 | 23 | 444 | axon development |
| GO:0022414 | 0.0083 | 1.4547 | 39.665 | 55 | 1320 | reproductive process |
| GO:0022612 | 0.0083 | 2.7473 | 3.4857 | 9 | 116 | gland morphogenesis |
| GO:0003211 | 0.0084 | 21.735 | 0.1494 | 2 | 5 | cardiac ventricle formation |
| GO:0002118 | 0.0084 | 21.6915 | 0.1497 | 2 | 5 | aggressive behavior |
| GO:0002568 | 0.0085 | 21.6036 | 0.1502 | 2 | 5 | somatic diversification of T cell receptor genes |
| GO:0021778 | 0.0085 | 21.6036 | 0.1502 | 2 | 5 | oligodendrocyte cell fate specification |
| GO:0033153 | 0.0085 | 21.6036 | 0.1502 | 2 | 5 | T cell receptor V(D)J recombination |
| GO:0045409 | 0.0085 | 21.6036 | 0.1502 | 2 | 5 | negative regulation of interleukin-6 biosynthetic process |
| GO:0045636 | 0.0085 | 21.6036 | 0.1502 | 2 | 5 | positive regulation of melanocyte differentiation |
| GO:0070100 | 0.0085 | 21.6036 | 0.1502 | 2 | 5 | negative regulation of chemokine-mediated signaling pathway |
| GO:0071504 | 0.0085 | 21.6036 | 0.1502 | 2 | 5 | cellular response to heparin |
| GO:1902744 | 0.0085 | 21.6036 | 0.1502 | 2 | 5 | negative regulation of lamellipodium organization |
| GO:1903232 | 0.0085 | 21.6036 | 0.1502 | 2 | 5 | melanosome assembly |
| GO:1904304 | 0.0085 | 21.6036 | 0.1502 | 2 | 5 | regulation of gastro-intestinal system smooth muscle contraction |
| GO:1904956 | 0.0085 | 21.6036 | 0.1502 | 2 | 5 | regulation of midbrain dopaminergic neuron differentiation |
| GO:1905007 | 0.0085 | 21.6036 | 0.1502 | 2 | 5 | positive regulation of epithelial to mesenchymal transition involved in endocardial cushion formation |
| GO:0035108 | 0.0086 | 8.3662 | 0.4376 | 3 | 15 | limb morphogenesis |
| GO:0071773 | 0.0086 | 2.4314 | 4.7778 | 11 | 159 | cellular response to BMP stimulus |
| GO:0010810 | 0.0087 | 2.3245 | 5.4389 | 12 | 181 | regulation of cell-substrate adhesion |
| GO:0045598 | 0.0087 | 2.7216 | 3.5158 | 9 | 117 | regulation of fat cell differentiation |
| GO:0014706 | 0.0091 | 2.7006 | 3.5379 | 9 | 121 | striated muscle tissue development |
| GO:2000027 | 0.0092 | 2.2191 | 6.1562 | 13 | 207 | regulation of organ morphogenesis |
| GO:0072089 | 0.0092 | 3.6028 | 1.8086 | 6 | 61 | stem cell proliferation |
| GO:0002053 | 0.0093 | 5.416 | 0.8414 | 4 | 28 | positive regulation of mesenchymal cell proliferation |
| GO:0007274 | 0.0093 | 5.416 | 0.8414 | 4 | 28 | neuromuscular synaptic transmission |
| GO:0010837 | 0.0093 | 5.416 | 0.8414 | 4 | 28 | regulation of keratinocyte proliferation |
| GO:0002830 | 0.0094 | 8.1134 | 0.4507 | 3 | 15 | positive regulation of type 2 immune response |
| GO:0007379 | 0.0094 | 8.1134 | 0.4507 | 3 | 15 | segment specification |
| GO:0021542 | 0.0094 | 8.1134 | 0.4507 | 3 | 15 | dentate gyrus development |
| GO:0048521 | 0.0094 | 8.1134 | 0.4507 | 3 | 15 | negative regulation of behavior |
| GO:0048869 | 0.0095 | 1.3962 | 53.3232 | 70 | 1955 | cellular developmental process |
| GO:0040017 | 0.0096 | 1.7508 | 14.3034 | 24 | 476 | positive regulation of locomotion |
| GO:0031324 | 0.0096 | 1.3276 | 77.4369 | 97 | 2577 | negative regulation of cellular metabolic process |
| GO:0048639 | 0.0099 | 2.3826 | 4.868 | 11 | 162 | positive regulation of developmental growth |
| GO:0048066 | 0.0099 | 4.1708 | 1.3222 | 5 | 44 | developmental pigmentation |
| GOMFID | Pvalue | OddsRatio | ExpCount | Count | Size | Term |
| GO:0009593 | 0 | 6.9427 | 2.9307 | 17 | 449 | detection of chemical stimulus |
| GO:0050906 | 0 | 6.7499 | 3.009 | 17 | 461 | detection of stimulus involved in sensory perception |
| GO:0007606 | 0 | 6.6574 | 3.0482 | 17 | 467 | sensory perception of chemical stimulus |
| GO:0050911 | 0 | 6.7444 | 2.415 | 14 | 370 | detection of chemical stimulus involved in sensory perception of smell |
| GO:0007186 | 0 | 3.1735 | 8.1719 | 22 | 1252 | G-protein coupled receptor signaling pathway |
| GO:0050877 | 0 | 3.1054 | 7.8978 | 21 | 1210 | nervous system process |
| GO:0010623 | 1e-04 | 46.9631 | 0.0849 | 3 | 13 | programmed cell death involved in cell development |
| GO:0006968 | 4e-04 | 12.6149 | 0.3525 | 4 | 54 | cellular defense response |
| GO:0006688 | 4e-04 | 23.467 | 0.1501 | 3 | 23 | glycosphingolipid biosynthetic process |
| GO:0031424 | 7e-04 | 5.1384 | 1.4751 | 7 | 226 | keratinization |
| GO:0002685 | 8e-04 | 5.9902 | 1.0835 | 6 | 166 | regulation of leukocyte migration |
| GO:1905522 | 0.0012 | 51.6923 | 0.0522 | 2 | 8 | negative regulation of macrophage migration |
| GO:0006955 | 0.0012 | 2.2397 | 11.7742 | 23 | 1837 | immune response |
| GO:0043588 | 0.0014 | 3.659 | 2.6631 | 9 | 408 | skin development |
| GO:0070374 | 0.0017 | 5.0891 | 1.2663 | 6 | 194 | positive regulation of ERK1 and ERK2 cascade |
| GO:0010820 | 0.0018 | 38.7644 | 0.0653 | 2 | 10 | positive regulation of T cell chemotaxis |
| GO:0009913 | 0.002 | 3.7807 | 2.278 | 8 | 349 | epidermal cell differentiation |
| GO:0046649 | 0.0022 | 2.9926 | 3.9946 | 11 | 612 | lymphocyte activation |
| GO:1902713 | 0.0022 | 34.4551 | 0.0718 | 2 | 11 | regulation of interferon-gamma secretion |
| GO:0019835 | 0.0026 | 12.0202 | 0.2741 | 3 | 42 | cytolysis |
| GO:0032309 | 0.0026 | 12.0202 | 0.2741 | 3 | 42 | icosanoid secretion |
| GO:1901571 | 0.0031 | 11.1595 | 0.2937 | 3 | 45 | fatty acid derivative transport |
| GO:0051047 | 0.0032 | 3.4973 | 2.4542 | 8 | 376 | positive regulation of secretion |
| GO:0001775 | 0.0034 | 2.2744 | 8.2698 | 17 | 1267 | cell activation |
| GO:0072678 | 0.0036 | 10.6509 | 0.3068 | 3 | 47 | T cell migration |
| GO:0002418 | 0.0036 | 25.8365 | 0.0914 | 2 | 14 | immune response to tumor cell |
| GO:0032609 | 0.0037 | 6.7641 | 0.6331 | 4 | 97 | interferon-gamma production |
| GO:0055065 | 0.0038 | 2.924 | 3.6878 | 10 | 565 | metal ion homeostasis |
| GO:2001237 | 0.004 | 6.6208 | 0.6462 | 4 | 99 | negative regulation of extrinsic apoptotic signaling pathway |
| GO:0052695 | 0.0054 | 20.6654 | 0.111 | 2 | 17 | cellular glucuronidation |
| GO:0032370 | 0.0055 | 9.0078 | 0.359 | 3 | 55 | positive regulation of lipid transport |
| GO:0097529 | 0.0059 | 4.6213 | 1.1488 | 5 | 176 | myeloid leukocyte migration |
| GO:0090026 | 0.006 | 19.3726 | 0.1175 | 2 | 18 | positive regulation of monocyte chemotaxis |
| GO:0050715 | 0.0062 | 5.8192 | 0.731 | 4 | 112 | positive regulation of cytokine secretion |
| GO:0072503 | 0.0063 | 3.1074 | 2.7479 | 8 | 421 | cellular divalent inorganic cation homeostasis |
| GO:0002355 | 0.0065 | Inf | 0.0065 | 1 | 1 | detection of tumor cell |
| GO:0002642 | 0.0065 | Inf | 0.0065 | 1 | 1 | positive regulation of immunoglobulin biosynthetic process |
| GO:0030887 | 0.0065 | Inf | 0.0065 | 1 | 1 | positive regulation of myeloid dendritic cell activation |
| GO:0032078 | 0.0065 | Inf | 0.0065 | 1 | 1 | negative regulation of endodeoxyribonuclease activity |
| GO:0035705 | 0.0065 | Inf | 0.0065 | 1 | 1 | T-helper 17 cell chemotaxis |
| GO:0043143 | 0.0065 | Inf | 0.0065 | 1 | 1 | regulation of translation by machinery localization |
| GO:0043310 | 0.0065 | Inf | 0.0065 | 1 | 1 | negative regulation of eosinophil degranulation |
| GO:1900758 | 0.0065 | Inf | 0.0065 | 1 | 1 | negative regulation of D-amino-acid oxidase activity |
| GO:1901706 | 0.0065 | Inf | 0.0065 | 1 | 1 | mesenchymal cell differentiation involved in bone development |
| GO:1902225 | 0.0065 | Inf | 0.0065 | 1 | 1 | negative regulation of acrosome reaction |
| GO:1903615 | 0.0065 | Inf | 0.0065 | 1 | 1 | positive regulation of protein tyrosine phosphatase activity |
| GO:2000464 | 0.0065 | Inf | 0.0065 | 1 | 1 | positive regulation of astrocyte chemotaxis |
| GO:0015711 | 0.0075 | 3.0101 | 2.8328 | 8 | 434 | organic anion transport |
| GO:0002544 | 0.0082 | 16.3107 | 0.1371 | 2 | 21 | chronic inflammatory response |
| GO:0097503 | 0.0082 | 16.3107 | 0.1371 | 2 | 21 | sialylation |
| GO:1901623 | 0.0082 | 16.3107 | 0.1371 | 2 | 21 | regulation of lymphocyte chemotaxis |
| GO:0002825 | 0.009 | 15.4942 | 0.1436 | 2 | 22 | regulation of T-helper 1 type immune response |
| GO:0006063 | 0.009 | 15.4942 | 0.1436 | 2 | 22 | uronic acid metabolic process |
| GO:0070661 | 0.0093 | 3.5387 | 1.795 | 6 | 275 | leukocyte proliferation |
| GO:0070227 | 0.0096 | 7.3134 | 0.4373 | 3 | 67 | lymphocyte apoptotic process |
| GO:0030595 | 0.0098 | 4.0676 | 1.2989 | 5 | 199 | leukocyte chemotaxis |
| GOMFID | Pvalue | OddsRatio | ExpCount | Count | Size | Term |
| GO:0007156 | 0 | 8.0719 | 3.8187 | 25 | 152 | homophilic cell adhesion via plasma membrane adhesion molecules |
| GO:0007389 | 0 | 4.3549 | 9.8348 | 37 | 394 | pattern specification process |
| GO:0045944 | 0 | 2.588 | 26.8315 | 61 | 1068 | positive regulation of transcription from RNA polymerase II promoter |
| GO:0000122 | 0 | 2.6985 | 19.0433 | 46 | 758 | negative regulation of transcription from RNA polymerase II promoter |
| GO:0060173 | 0 | 5.0723 | 4.2709 | 19 | 170 | limb development |
| GO:2001141 | 0 | 1.8095 | 87.2276 | 133 | 3472 | regulation of RNA biosynthetic process |
| GO:0006355 | 0 | 1.8072 | 86.5493 | 132 | 3445 | regulation of transcription, DNA-templated |
| GO:0019219 | 0 | 1.7195 | 101.0202 | 146 | 4021 | regulation of nucleobase-containing compound metabolic process |
| GO:0034654 | 0 | 1.704 | 102.5025 | 147 | 4080 | nucleobase-containing compound biosynthetic process |
| GO:0007399 | 0 | 2.4441 | 19.5679 | 43 | 869 | nervous system development |
| GO:1903508 | 0 | 2.0311 | 34.3936 | 63 | 1369 | positive regulation of nucleic acid-templated transcription |
| GO:0051254 | 0 | 1.9925 | 36.1773 | 65 | 1440 | positive regulation of RNA metabolic process |
| GO:0010628 | 0 | 1.8973 | 44.0911 | 75 | 1755 | positive regulation of gene expression |
| GO:0021903 | 0 | 32.7254 | 0.2764 | 5 | 11 | rostrocaudal neural tube patterning |
| GO:0021515 | 0 | 8.4801 | 1.2813 | 9 | 51 | cell differentiation in spinal cord |
| GO:0098609 | 0 | 2.2816 | 19.5961 | 41 | 780 | cell-cell adhesion |
| GO:0048665 | 0 | 16.9796 | 0.4992 | 6 | 20 | neuron fate specification |
| GO:0001764 | 0 | 4.6525 | 3.3665 | 14 | 134 | neuron migration |
| GO:0060562 | 0 | 3.1772 | 7.5621 | 22 | 301 | epithelial tube morphogenesis |
| GO:0021953 | 0 | 4.2788 | 3.8923 | 15 | 156 | central nervous system neuron differentiation |
| GO:0021517 | 0 | 9.0269 | 1.0803 | 8 | 43 | ventral spinal cord development |
| GO:0022610 | 0 | 1.9518 | 33.1877 | 59 | 1321 | biological adhesion |
| GO:0048935 | 0 | 24.5409 | 0.3266 | 5 | 13 | peripheral nervous system neuron development |
| GO:0009952 | 0 | 3.9443 | 4.4731 | 16 | 181 | anterior/posterior pattern specification |
| GO:0048729 | 0 | 2.4078 | 15.3251 | 34 | 610 | tissue morphogenesis |
| GO:0007267 | 0 | 1.8697 | 38.2374 | 65 | 1522 | cell-cell signaling |
| GO:0043009 | 0 | 2.8133 | 9.6507 | 25 | 392 | chordate embryonic development |
| GO:0021872 | 0 | 7.1197 | 1.4823 | 9 | 59 | forebrain generation of neurons |
| GO:2000026 | 0 | 1.7932 | 45.5985 | 74 | 1815 | regulation of multicellular organismal development |
| GO:0010557 | 0 | 1.8327 | 40.197 | 67 | 1600 | positive regulation of macromolecule biosynthetic process |
| GO:1903507 | 0 | 1.9833 | 28.5901 | 52 | 1138 | negative regulation of nucleic acid-templated transcription |
| GO:0048704 | 0 | 7.997 | 1.1914 | 8 | 48 | embryonic skeletal system morphogenesis |
| GO:0060579 | 0 | 19.6303 | 0.3768 | 5 | 15 | ventral spinal cord interneuron fate commitment |
| GO:0051253 | 0 | 1.933 | 30.4493 | 54 | 1212 | negative regulation of RNA metabolic process |
| GO:0009890 | 1e-04 | 1.7673 | 41.4783 | 67 | 1651 | negative regulation of biosynthetic process |
| GO:0045165 | 1e-04 | 3.387 | 5.1367 | 16 | 207 | cell fate commitment |
| GO:0021555 | 1e-04 | 117.2667 | 0.1005 | 3 | 4 | midbrain-hindbrain boundary morphogenesis |
| GO:0060164 | 1e-04 | 117.2667 | 0.1005 | 3 | 4 | regulation of timing of neuron differentiation |
| GO:0031328 | 1e-04 | 1.7307 | 43.5887 | 69 | 1735 | positive regulation of cellular biosynthetic process |
| GO:0035107 | 1e-04 | 3.9145 | 3.6429 | 13 | 145 | appendage morphogenesis |
| GO:0010470 | 1e-04 | 7.8788 | 1.0552 | 7 | 42 | regulation of gastrulation |
| GO:0009954 | 1e-04 | 9.437 | 0.7788 | 6 | 31 | proximal/distal pattern formation |
| GO:0060573 | 1e-04 | 22.3833 | 0.2764 | 4 | 11 | cell fate specification involved in pattern specification |
| GO:0051094 | 1e-04 | 2.949 | 6.5869 | 18 | 281 | positive regulation of developmental process |
| GO:0007275 | 1e-04 | 1.622 | 65.2838 | 93 | 2950 | multicellular organism development |
| GO:0009953 | 1e-04 | 4.6547 | 2.3867 | 10 | 95 | dorsal/ventral pattern formation |
| GO:2000113 | 2e-04 | 1.7351 | 37.4586 | 60 | 1491 | negative regulation of cellular macromolecule biosynthetic process |
| GO:0060255 | 2e-04 | 1.4473 | 146.7695 | 182 | 5842 | regulation of macromolecule metabolic process |
| GO:0007420 | 2e-04 | 2.1094 | 16.2296 | 32 | 646 | brain development |
| GO:0040034 | 2e-04 | 17.407 | 0.3266 | 4 | 13 | regulation of development, heterochronic |
| GO:0046483 | 3e-04 | 1.4314 | 143.1266 | 177 | 5697 | heterocycle metabolic process |
| GO:0021511 | 3e-04 | 10.3258 | 0.603 | 5 | 24 | spinal cord patterning |
| GO:0042536 | 3e-04 | 39.084 | 0.1507 | 3 | 6 | negative regulation of tumor necrosis factor biosynthetic process |
| GO:0003214 | 3e-04 | 15.6653 | 0.3517 | 4 | 14 | cardiac left ventricle morphogenesis |
| GO:0003148 | 3e-04 | 9.8089 | 0.6281 | 5 | 25 | outflow tract septum morphogenesis |
| GO:0048565 | 4e-04 | 3.7539 | 3.1906 | 11 | 127 | digestive tract development |
| GO:0006725 | 4e-04 | 1.4168 | 144.0562 | 177 | 5734 | cellular aromatic compound metabolic process |
| GO:0032502 | 4e-04 | 1.8818 | 24.6711 | 42 | 1188 | developmental process |
| GO:0021884 | 4e-04 | 9.3413 | 0.6532 | 5 | 26 | forebrain neuron development |
| GO:0001709 | 5e-04 | 6.935 | 1.0049 | 6 | 40 | cell fate determination |
| GO:0009653 | 5e-04 | 1.8107 | 26.2109 | 44 | 1159 | anatomical structure morphogenesis |
| GO:0001501 | 5e-04 | 3.179 | 4.4012 | 13 | 179 | skeletal system development |
| GO:0003357 | 5e-04 | 29.3111 | 0.1759 | 3 | 7 | noradrenergic neuron differentiation |
| GO:0045597 | 5e-04 | 2.4458 | 8.7194 | 20 | 359 | positive regulation of cell differentiation |
| GO:0034641 | 5e-04 | 1.399 | 158.4015 | 191 | 6305 | cellular nitrogen compound metabolic process |
| GO:0021915 | 6e-04 | 3.3246 | 3.8941 | 12 | 155 | neural tube development |
| GO:0048483 | 6e-04 | 6.5489 | 1.0552 | 6 | 42 | autonomic nervous system development |
| GO:1902692 | 6e-04 | 8.5279 | 0.7034 | 5 | 28 | regulation of neuroblast proliferation |
| GO:0072272 | 6e-04 | Inf | 0.0502 | 2 | 2 | proximal/distal pattern formation involved in metanephric nephron development |
| GO:0120054 | 6e-04 | Inf | 0.0502 | 2 | 2 | intestinal motility |
| GO:0120058 | 6e-04 | Inf | 0.0502 | 2 | 2 | positive regulation of small intestinal transit |
| GO:0042127 | 7e-04 | 1.6341 | 39.4685 | 60 | 1571 | regulation of cell proliferation |
| GO:1901360 | 7e-04 | 1.3931 | 149.332 | 181 | 5944 | organic cyclic compound metabolic process |
| GO:0051240 | 7e-04 | 1.7868 | 25.1123 | 42 | 1027 | positive regulation of multicellular organismal process |
| GO:0048701 | 8e-04 | 6.2035 | 1.1054 | 6 | 44 | embryonic cranial skeleton morphogenesis |
| GO:0021859 | 8e-04 | 23.4474 | 0.201 | 3 | 8 | pyramidal neuron differentiation |
| GO:2000035 | 8e-04 | 23.4474 | 0.201 | 3 | 8 | regulation of stem cell division |
| GO:0090304 | 8e-04 | 1.4003 | 123.1537 | 153 | 4902 | nucleic acid metabolic process |
| GO:0061564 | 9e-04 | 2.1868 | 11.1547 | 23 | 444 | axon development |
| GO:0001569 | 0.001 | 7.5425 | 0.7788 | 5 | 31 | branching involved in blood vessel morphogenesis |
| GO:0003206 | 0.001 | 3.5266 | 3.065 | 10 | 122 | cardiac chamber morphogenesis |
| GO:0048869 | 0.0011 | 1.428 | 91.6186 | 118 | 3796 | cellular developmental process |
| GO:1902742 | 0.0011 | 7.2627 | 0.8039 | 5 | 32 | apoptotic process involved in development |
| GO:0035024 | 0.0011 | 10.4403 | 0.4773 | 4 | 19 | negative regulation of Rho protein signal transduction |
| GO:0048557 | 0.0011 | 10.4403 | 0.4773 | 4 | 19 | embryonic digestive tract morphogenesis |
| GO:0048562 | 0.0012 | 3.0268 | 4.2405 | 12 | 175 | embryonic organ morphogenesis |
| GO:0031324 | 0.0013 | 1.4742 | 64.7424 | 88 | 2577 | negative regulation of cellular metabolic process |
| GO:0048870 | 0.0014 | 1.6167 | 35.6498 | 54 | 1419 | cell motility |
| GO:0021854 | 0.0014 | 9.7871 | 0.5025 | 4 | 20 | hypothalamus development |
| GO:0060039 | 0.0014 | 9.7871 | 0.5025 | 4 | 20 | pericardium development |
| GO:2000178 | 0.0014 | 9.7871 | 0.5025 | 4 | 20 | negative regulation of neural precursor cell proliferation |
| GO:0061138 | 0.0016 | 2.913 | 4.3966 | 12 | 175 | morphogenesis of a branching epithelium |
| GO:0009889 | 0.0016 | 1.4812 | 62.9689 | 85 | 2694 | regulation of biosynthetic process |
| GO:0003211 | 0.0017 | 16.746 | 0.2512 | 3 | 10 | cardiac ventricle formation |
| GO:0048598 | 0.0017 | 2.4511 | 6.9158 | 16 | 292 | embryonic morphogenesis |
| GO:0043586 | 0.0017 | 9.2108 | 0.5276 | 4 | 21 | tongue development |
| GO:0014706 | 0.0017 | 2.2526 | 8.9187 | 19 | 355 | striated muscle tissue development |
| GO:0048732 | 0.0017 | 2.1486 | 10.3256 | 21 | 411 | gland development |
| GO:0010629 | 0.0018 | 1.5303 | 46.2015 | 66 | 1839 | negative regulation of gene expression |
| GO:0014016 | 0.0019 | 77.9852 | 0.0754 | 2 | 3 | neuroblast differentiation |
| GO:0014707 | 0.0019 | 77.9852 | 0.0754 | 2 | 3 | branchiomeric skeletal muscle development |
| GO:0021524 | 0.0019 | 77.9852 | 0.0754 | 2 | 3 | visceral motor neuron differentiation |
| GO:0045085 | 0.0019 | 77.9852 | 0.0754 | 2 | 3 | negative regulation of interleukin-2 biosynthetic process |
| GO:0046010 | 0.0019 | 77.9852 | 0.0754 | 2 | 3 | positive regulation of circadian sleep/wake cycle, non-REM sleep |
| GO:0140076 | 0.0019 | 77.9852 | 0.0754 | 2 | 3 | negative regulation of lipoprotein transport |
| GO:1904000 | 0.0019 | 77.9852 | 0.0754 | 2 | 3 | positive regulation of eating behavior |
| GO:1904349 | 0.0019 | 77.9852 | 0.0754 | 2 | 3 | positive regulation of small intestine smooth muscle contraction |
| GO:1905333 | 0.0019 | 77.9852 | 0.0754 | 2 | 3 | regulation of gastric motility |
| GO:0007268 | 0.0019 | 1.9362 | 14.7222 | 27 | 586 | chemical synaptic transmission |
| GO:0051216 | 0.0019 | 2.8425 | 4.497 | 12 | 179 | cartilage development |
| GO:0060348 | 0.0019 | 2.8425 | 4.497 | 12 | 179 | bone development |
| GO:0048812 | 0.0019 | 1.9574 | 14.0187 | 26 | 558 | neuron projection morphogenesis |
| GO:0003179 | 0.0019 | 6.3239 | 0.9044 | 5 | 36 | heart valve morphogenesis |
| GO:0099537 | 0.002 | 1.929 | 14.7724 | 27 | 588 | trans-synaptic signaling |
| GO:0051241 | 0.002 | 1.6941 | 25.6441 | 41 | 1029 | negative regulation of multicellular organismal process |
| GO:0003272 | 0.002 | 8.6986 | 0.5527 | 4 | 22 | endocardial cushion formation |
| GO:0060021 | 0.002 | 3.7949 | 2.2862 | 8 | 91 | palate development |
| GO:0072073 | 0.0022 | 3.1572 | 3.3916 | 10 | 135 | kidney epithelium development |
| GO:0007610 | 0.0023 | 1.9552 | 13.4792 | 25 | 540 | behavior |
| GO:0072089 | 0.0024 | 4.1506 | 1.8406 | 7 | 74 | stem cell proliferation |
| GO:0060538 | 0.0024 | 2.9164 | 4.0197 | 11 | 160 | skeletal muscle organ development |
| GO:2000648 | 0.0025 | 5.9399 | 0.9547 | 5 | 38 | positive regulation of stem cell proliferation |
| GO:0048514 | 0.0025 | 1.9453 | 13.5414 | 25 | 539 | blood vessel morphogenesis |
| GO:0060079 | 0.0025 | 3.6619 | 2.3616 | 8 | 94 | excitatory postsynaptic potential |
| GO:0048762 | 0.0026 | 3.321 | 2.9084 | 9 | 117 | mesenchymal cell differentiation |
| GO:0051962 | 0.0026 | 2.0318 | 11.4059 | 22 | 454 | positive regulation of nervous system development |
| GO:0045666 | 0.0027 | 2.2664 | 7.9138 | 17 | 315 | positive regulation of neuron differentiation |
| GO:0003197 | 0.0028 | 5.7649 | 0.9798 | 5 | 39 | endocardial cushion development |
| GO:0051173 | 0.0029 | 1.4157 | 70.9729 | 93 | 2825 | positive regulation of nitrogen compound metabolic process |
| GO:0048858 | 0.0029 | 1.8947 | 14.4458 | 26 | 575 | cell projection morphogenesis |
| GO:0042659 | 0.0029 | 13.023 | 0.3015 | 3 | 12 | regulation of cell fate specification |
| GO:0003231 | 0.0031 | 3.2239 | 2.9897 | 9 | 119 | cardiac ventricle development |
| GO:0048699 | 0.0031 | 1.6307 | 27.9231 | 43 | 1156 | generation of neurons |
| GO:0003279 | 0.0033 | 3.4982 | 2.4621 | 8 | 98 | cardiac septum development |
| GO:0045669 | 0.0033 | 4.5293 | 1.4571 | 6 | 58 | positive regulation of osteoblast differentiation |
| GO:0048596 | 0.0033 | 7.4545 | 0.6281 | 4 | 25 | embryonic camera-type eye morphogenesis |
| GO:0001838 | 0.0033 | 3.1947 | 3.0148 | 9 | 120 | embryonic epithelial tube formation |
| GO:0021797 | 0.0037 | 38.9901 | 0.1005 | 2 | 4 | forebrain anterior/posterior pattern specification |
| GO:0021913 | 0.0037 | 38.9901 | 0.1005 | 2 | 4 | regulation of transcription from RNA polymerase II promoter involved in ventral spinal cord interneuron specification |
| GO:0032100 | 0.0037 | 38.9901 | 0.1005 | 2 | 4 | positive regulation of appetite |
| GO:0034287 | 0.0037 | 38.9901 | 0.1005 | 2 | 4 | detection of monosaccharide stimulus |
| GO:0042662 | 0.0037 | 38.9901 | 0.1005 | 2 | 4 | negative regulation of mesodermal cell fate specification |
| GO:0051594 | 0.0037 | 38.9901 | 0.1005 | 2 | 4 | detection of glucose |
| GO:0072086 | 0.0037 | 38.9901 | 0.1005 | 2 | 4 | specification of loop of Henle identity |
| GO:1905903 | 0.0037 | 38.9901 | 0.1005 | 2 | 4 | negative regulation of mesoderm formation |
| GO:1990086 | 0.0037 | 38.9901 | 0.1005 | 2 | 4 | lens fiber cell apoptotic process |
| GO:0021520 | 0.0037 | 11.72 | 0.3266 | 3 | 13 | spinal cord motor neuron cell fate specification |
| GO:0002063 | 0.0038 | 7.1152 | 0.6532 | 4 | 26 | chondrocyte development |
| GO:0007411 | 0.0038 | 2.4843 | 5.5271 | 13 | 220 | axon guidance |
| GO:0051172 | 0.0039 | 1.4254 | 60.9236 | 81 | 2425 | negative regulation of nitrogen compound metabolic process |
| GO:0090596 | 0.004 | 2.3789 | 6.2054 | 14 | 247 | sensory organ morphogenesis |
| GO:1901576 | 0.004 | 1.3158 | 153.6783 | 180 | 6117 | organic substance biosynthetic process |
| GO:0048667 | 0.0042 | 1.9148 | 12.6118 | 23 | 502 | cell morphogenesis involved in neuron differentiation |
| GO:0030889 | 0.0047 | 10.6539 | 0.3517 | 3 | 14 | negative regulation of B cell proliferation |
| GO:0051967 | 0.0047 | 10.6539 | 0.3517 | 3 | 14 | negative regulation of synaptic transmission, glutamatergic |
| GO:0030851 | 0.005 | 6.5215 | 0.7034 | 4 | 28 | granulocyte differentiation |
| GO:0001656 | 0.0052 | 3.5718 | 2.1103 | 7 | 84 | metanephros development |
| GO:0010719 | 0.0057 | 6.2602 | 0.7286 | 4 | 29 | negative regulation of epithelial to mesenchymal transition |
| GO:0007379 | 0.0057 | 9.7654 | 0.3768 | 3 | 15 | segment specification |
| GO:0048521 | 0.0057 | 9.7654 | 0.3768 | 3 | 15 | negative regulation of behavior |
| GO:1904019 | 0.0057 | 3.4979 | 2.1505 | 7 | 86 | epithelial cell apoptotic process |
| GO:0021537 | 0.0058 | 2.3572 | 5.8034 | 13 | 231 | telencephalon development |
| GO:0045596 | 0.0059 | 1.7866 | 15.2519 | 26 | 612 | negative regulation of cell differentiation |
| GO:0016199 | 0.006 | 25.9918 | 0.1256 | 2 | 5 | axon midline choice point recognition |
| GO:0021778 | 0.006 | 25.9918 | 0.1256 | 2 | 5 | oligodendrocyte cell fate specification |
| GO:0045347 | 0.006 | 25.9918 | 0.1256 | 2 | 5 | negative regulation of MHC class II biosynthetic process |
| GO:0045409 | 0.006 | 25.9918 | 0.1256 | 2 | 5 | negative regulation of interleukin-6 biosynthetic process |
| GO:0045636 | 0.006 | 25.9918 | 0.1256 | 2 | 5 | positive regulation of melanocyte differentiation |
| GO:0061056 | 0.006 | 25.9918 | 0.1256 | 2 | 5 | sclerotome development |
| GO:1904304 | 0.006 | 25.9918 | 0.1256 | 2 | 5 | regulation of gastro-intestinal system smooth muscle contraction |
| GO:1905007 | 0.006 | 25.9918 | 0.1256 | 2 | 5 | positive regulation of epithelial to mesenchymal transition involved in endocardial cushion formation |
| GO:2000851 | 0.006 | 25.9918 | 0.1256 | 2 | 5 | positive regulation of glucocorticoid secretion |
| GO:0010810 | 0.0061 | 2.5527 | 4.5473 | 11 | 181 | regulation of cell-substrate adhesion |
| GO:0060993 | 0.0063 | 3.4372 | 2.1857 | 7 | 87 | kidney morphogenesis |
| GO:2000179 | 0.0063 | 4.6644 | 1.1808 | 5 | 47 | positive regulation of neural precursor cell proliferation |
| GO:0050768 | 0.0071 | 2.2932 | 5.9542 | 13 | 237 | negative regulation of neurogenesis |
| GO:0014033 | 0.0071 | 3.7963 | 1.7084 | 6 | 68 | neural crest cell differentiation |
| GO:0003151 | 0.0072 | 4.5021 | 1.2178 | 5 | 49 | outflow tract morphogenesis |
| GO:0043010 | 0.0072 | 2.1433 | 7.336 | 15 | 292 | camera-type eye development |
| GO:0001953 | 0.0072 | 5.7957 | 0.7788 | 4 | 31 | negative regulation of cell-matrix adhesion |
| GO:0042462 | 0.0072 | 5.7957 | 0.7788 | 4 | 31 | eye photoreceptor cell development |
| GO:0061326 | 0.0075 | 3.3123 | 2.2611 | 7 | 90 | renal tubule development |
| GO:0045927 | 0.0076 | 2.2726 | 6.0044 | 13 | 239 | positive regulation of growth |
| GO:0072078 | 0.0077 | 3.7358 | 1.7335 | 6 | 69 | nephron tubule morphogenesis |
| GO:0010720 | 0.0079 | 1.8634 | 11.7828 | 21 | 469 | positive regulation of cell development |
| GO:0035115 | 0.0081 | 5.5884 | 0.8039 | 4 | 32 | embryonic forelimb morphogenesis |
| GO:0061178 | 0.0082 | 4.3526 | 1.2562 | 5 | 50 | regulation of insulin secretion involved in cellular response to glucose stimulus |
| GO:0007416 | 0.0085 | 2.7245 | 3.4921 | 9 | 139 | synapse assembly |
| GO:0003175 | 0.0088 | 19.4926 | 0.1507 | 2 | 6 | tricuspid valve development |
| GO:0008063 | 0.0088 | 19.4926 | 0.1507 | 2 | 6 | Toll signaling pathway |
| GO:0021546 | 0.0088 | 19.4926 | 0.1507 | 2 | 6 | rhombomere development |
| GO:0021902 | 0.0088 | 19.4926 | 0.1507 | 2 | 6 | commitment of neuronal cell to specific neuron type in forebrain |
| GO:0032109 | 0.0088 | 19.4926 | 0.1507 | 2 | 6 | positive regulation of response to nutrient levels |
| GO:0043152 | 0.0088 | 19.4926 | 0.1507 | 2 | 6 | induction of bacterial agglutination |
| GO:0051045 | 0.0088 | 19.4926 | 0.1507 | 2 | 6 | negative regulation of membrane protein ectodomain proteolysis |
| GO:0051136 | 0.0088 | 19.4926 | 0.1507 | 2 | 6 | regulation of NK T cell differentiation |
| GO:0060350 | 0.0089 | 4.2577 | 1.2813 | 5 | 51 | endochondral bone morphogenesis |
| GO:0001662 | 0.009 | 5.3954 | 0.8291 | 4 | 33 | behavioral fear response |
| GO:0045987 | 0.009 | 5.3954 | 0.8291 | 4 | 33 | positive regulation of smooth muscle contraction |
| GO:0030326 | 0.0091 | 3.1854 | 2.343 | 7 | 94 | embryonic limb morphogenesis |
| GO:0035148 | 0.0093 | 2.6828 | 3.5424 | 9 | 141 | tube formation |
| GO:0045598 | 0.0094 | 2.885 | 2.9394 | 8 | 117 | regulation of fat cell differentiation |
| GO:0035050 | 0.0094 | 3.5654 | 1.8089 | 6 | 72 | embryonic heart tube development |
| GO:0007417 | 0.0095 | 2.5134 | 4.1862 | 10 | 176 | central nervous system development |
| GO:1903670 | 0.0096 | 4.1669 | 1.3064 | 5 | 52 | regulation of sprouting angiogenesis |
| GO:0060008 | 0.0097 | 7.8109 | 0.4522 | 3 | 18 | Sertoli cell differentiation |
| GO:0060973 | 0.0097 | 7.8109 | 0.4522 | 3 | 18 | cell migration involved in heart development |
| GOMFID | Pvalue | OddsRatio | ExpCount | Count | Size | Term |
| GO:0007156 | 0 | 8.3459 | 4.4084 | 29 | 152 | homophilic cell adhesion via plasma membrane adhesion molecules |
| GO:0007389 | 0 | 5.0407 | 9.6786 | 41 | 338 | pattern specification process |
| GO:0007399 | 0 | 3.4432 | 19.152 | 56 | 763 | nervous system development |
| GO:0009790 | 0 | 3.0676 | 25.0046 | 66 | 870 | embryo development |
| GO:0045944 | 0 | 2.7234 | 30.9746 | 73 | 1068 | positive regulation of transcription from RNA polymerase II promoter |
| GO:0007275 | 0 | 2.2632 | 63.8099 | 115 | 2579 | multicellular organism development |
| GO:0000122 | 0 | 2.8334 | 21.9839 | 55 | 758 | negative regulation of transcription from RNA polymerase II promoter |
| GO:0007267 | 0 | 2.5114 | 31.3903 | 69 | 1117 | cell-cell signaling |
| GO:0006355 | 0 | 1.8792 | 99.9135 | 156 | 3445 | regulation of transcription, DNA-templated |
| GO:2001141 | 0 | 1.8598 | 100.6966 | 156 | 3472 | regulation of RNA biosynthetic process |
| GO:0021515 | 0 | 11.7503 | 1.4791 | 13 | 51 | cell differentiation in spinal cord |
| GO:0021517 | 0 | 13.2726 | 1.2471 | 12 | 43 | ventral spinal cord development |
| GO:0007420 | 0 | 3.1661 | 14.5678 | 41 | 510 | brain development |
| GO:0001764 | 0 | 5.7219 | 3.8863 | 19 | 134 | neuron migration |
| GO:0032502 | 0 | 1.944 | 81.4561 | 127 | 3414 | developmental process |
| GO:0035113 | 0 | 5.762 | 3.6543 | 18 | 126 | embryonic appendage morphogenesis |
| GO:1903508 | 0 | 2.1541 | 39.7044 | 76 | 1369 | positive regulation of nucleic acid-templated transcription |
| GO:0019219 | 0 | 1.7313 | 116.6189 | 169 | 4021 | regulation of nucleobase-containing compound metabolic process |
| GO:0001501 | 0 | 2.9771 | 13.8052 | 37 | 476 | skeletal system development |
| GO:0035108 | 0 | 5.9951 | 3.1279 | 16 | 109 | limb morphogenesis |
| GO:1903507 | 0 | 2.1927 | 33.0048 | 65 | 1138 | negative regulation of nucleic acid-templated transcription |
| GO:0021953 | 0 | 5.8019 | 3.2109 | 16 | 114 | central nervous system neuron differentiation |
| GO:0051254 | 0 | 2.032 | 41.7635 | 76 | 1440 | positive regulation of RNA metabolic process |
| GO:0010557 | 0 | 1.979 | 46.4039 | 82 | 1600 | positive regulation of macromolecule biosynthetic process |
| GO:0048870 | 0 | 2.0327 | 41.1545 | 75 | 1419 | cell motility |
| GO:0090596 | 0 | 3.743 | 7.1636 | 24 | 247 | sensory organ morphogenesis |
| GO:0009952 | 0 | 5.4836 | 3.3718 | 16 | 119 | anterior/posterior pattern specification |
| GO:0051253 | 0 | 2.0794 | 35.151 | 66 | 1212 | negative regulation of RNA metabolic process |
| GO:0007218 | 0 | 5.9333 | 2.7552 | 14 | 95 | neuropeptide signaling pathway |
| GO:0001654 | 0 | 3.1519 | 9.8028 | 28 | 338 | eye development |
| GO:0034654 | 0 | 1.6327 | 118.33 | 165 | 4080 | nucleobase-containing compound biosynthetic process |
| GO:0031328 | 0 | 1.8843 | 50.3193 | 85 | 1735 | positive regulation of cellular biosynthetic process |
| GO:2000026 | 0 | 1.841 | 52.6395 | 87 | 1815 | regulation of multicellular organismal development |
| GO:0051961 | 0 | 3.4084 | 7.4536 | 23 | 257 | negative regulation of nervous system development |
| GO:0060579 | 0 | 22.595 | 0.435 | 6 | 15 | ventral spinal cord interneuron fate commitment |
| GO:0035115 | 0 | 11.3355 | 0.9281 | 8 | 32 | embryonic forelimb morphogenesis |
| GO:0009953 | 0 | 5.4301 | 2.7552 | 13 | 95 | dorsal/ventral pattern formation |
| GO:0021511 | 0 | 13.9787 | 0.6961 | 7 | 24 | spinal cord patterning |
| GO:0050767 | 0 | 2.3499 | 18.54 | 40 | 645 | regulation of neurogenesis |
| GO:0022610 | 0 | 1.9196 | 38.3123 | 67 | 1321 | biological adhesion |
| GO:0010721 | 0 | 3.1359 | 8.0337 | 23 | 277 | negative regulation of cell development |
| GO:0048699 | 0 | 2.4205 | 16.212 | 36 | 600 | generation of neurons |
| GO:0021889 | 0 | 28.1885 | 0.319 | 5 | 11 | olfactory bulb interneuron differentiation |
| GO:0021903 | 0 | 28.1885 | 0.319 | 5 | 11 | rostrocaudal neural tube patterning |
| GO:0060573 | 0 | 28.1885 | 0.319 | 5 | 11 | cell fate specification involved in pattern specification |
| GO:0010628 | 0 | 1.7761 | 50.8993 | 82 | 1755 | positive regulation of gene expression |
| GO:0007631 | 0 | 4.8367 | 3.0453 | 13 | 105 | feeding behavior |
| GO:0048665 | 0 | 14.6711 | 0.5744 | 6 | 20 | neuron fate specification |
| GO:0014706 | 0 | 2.742 | 10.2959 | 26 | 355 | striated muscle tissue development |
| GO:0043009 | 0 | 2.7931 | 9.7232 | 25 | 345 | chordate embryonic development |
| GO:0021988 | 0 | 10.3281 | 0.8701 | 7 | 30 | olfactory lobe development |
| GO:0007268 | 0 | 2.29 | 16.9954 | 36 | 586 | chemical synaptic transmission |
| GO:0007626 | 0 | 4.5424 | 3.215 | 13 | 112 | locomotory behavior |
| GO:2000113 | 0 | 1.7936 | 43.2427 | 71 | 1491 | negative regulation of cellular macromolecule biosynthetic process |
| GO:0099537 | 0 | 2.2814 | 17.0534 | 36 | 588 | trans-synaptic signaling |
| GO:0021524 | 0 | Inf | 0.087 | 3 | 3 | visceral motor neuron differentiation |
| GO:0061364 | 0 | Inf | 0.087 | 3 | 3 | apoptotic process involved in luteolysis |
| GO:0045665 | 0 | 3.4983 | 5.3365 | 17 | 184 | negative regulation of neuron differentiation |
| GO:0009888 | 0 | 1.8038 | 40.5883 | 67 | 1450 | tissue development |
| GO:0009890 | 0 | 1.734 | 47.8831 | 76 | 1651 | negative regulation of biosynthetic process |
| GO:0098609 | 0 | 2.0492 | 22.6219 | 43 | 780 | cell-cell adhesion |
| GO:0060041 | 0 | 3.929 | 3.9443 | 14 | 136 | retina development in camera-type eye |
| GO:0048593 | 0 | 4.9224 | 2.5281 | 11 | 88 | camera-type eye morphogenesis |
| GO:0048048 | 0 | 8.7958 | 0.9861 | 7 | 34 | embryonic eye morphogenesis |
| GO:0010720 | 0 | 2.3755 | 13.6022 | 30 | 469 | positive regulation of cell development |
| GO:0072001 | 0 | 2.8735 | 7.9177 | 21 | 273 | renal system development |
| GO:0048704 | 1e-04 | 6.8825 | 1.3752 | 8 | 48 | embryonic skeletal system morphogenesis |
| GO:0051962 | 1e-04 | 2.3688 | 13.1671 | 29 | 454 | positive regulation of nervous system development |
| GO:0007411 | 1e-04 | 3.2319 | 5.7299 | 17 | 199 | axon guidance |
| GO:0003151 | 1e-04 | 6.6771 | 1.4112 | 8 | 49 | outflow tract morphogenesis |
| GO:0048754 | 1e-04 | 3.7141 | 4.1474 | 14 | 143 | branching morphogenesis of an epithelial tube |
| GO:0001709 | 1e-04 | 7.9485 | 1.0687 | 7 | 37 | cell fate determination |
| GO:0031076 | 1e-04 | 7.9147 | 1.0731 | 7 | 37 | embryonic camera-type eye development |
| GO:0021884 | 1e-04 | 10.1606 | 0.7541 | 6 | 26 | forebrain neuron development |
| GO:0016331 | 1e-04 | 3.657 | 4.2054 | 14 | 145 | morphogenesis of embryonic epithelium |
| GO:0021913 | 1e-04 | 101.0769 | 0.116 | 3 | 4 | regulation of transcription from RNA polymerase II promoter involved in ventral spinal cord interneuron specification |
| GO:0002009 | 1e-04 | 2.5319 | 10.1934 | 24 | 359 | morphogenesis of an epithelium |
| GO:0046883 | 1e-04 | 2.891 | 7.1056 | 19 | 245 | regulation of hormone secretion |
| GO:0061564 | 1e-04 | 2.3327 | 12.8771 | 28 | 444 | axon development |
| GO:0021879 | 1e-04 | 13.2419 | 0.513 | 5 | 18 | forebrain neuron differentiation |
| GO:0001763 | 1e-04 | 3.1888 | 5.4525 | 16 | 188 | morphogenesis of a branching structure |
| GO:0048935 | 1e-04 | 22.5978 | 0.2888 | 4 | 10 | peripheral nervous system neuron development |
| GO:0045666 | 1e-04 | 2.588 | 9.1358 | 22 | 315 | positive regulation of neuron differentiation |
| GO:0023061 | 1e-04 | 2.3725 | 11.746 | 26 | 405 | signal release |
| GO:0048562 | 2e-04 | 3.4299 | 4.4484 | 14 | 159 | embryonic organ morphogenesis |
| GO:0021983 | 2e-04 | 6.9818 | 1.1891 | 7 | 41 | pituitary gland development |
| GO:0002089 | 2e-04 | 12.0746 | 0.551 | 5 | 19 | lens morphogenesis in camera-type eye |
| GO:0021915 | 2e-04 | 3.3954 | 4.4954 | 14 | 155 | neural tube development |
| GO:0003231 | 2e-04 | 3.8268 | 3.4513 | 12 | 119 | cardiac ventricle development |
| GO:0009914 | 2e-04 | 2.6004 | 8.6717 | 21 | 299 | hormone transport |
| GO:0019098 | 2e-04 | 8.4651 | 0.8701 | 6 | 30 | reproductive behavior |
| GO:0048812 | 2e-04 | 2.1124 | 16.1834 | 32 | 558 | neuron projection morphogenesis |
| GO:0060349 | 2e-04 | 4.3637 | 2.5522 | 10 | 88 | bone morphogenesis |
| GO:0009954 | 2e-04 | 8.1259 | 0.8991 | 6 | 31 | proximal/distal pattern formation |
| GO:0021779 | 2e-04 | 50.5353 | 0.145 | 3 | 5 | oligodendrocyte cell fate commitment |
| GO:0021780 | 2e-04 | 50.5353 | 0.145 | 3 | 5 | glial cell fate specification |
| GO:0061056 | 2e-04 | 50.5353 | 0.145 | 3 | 5 | sclerotome development |
| GO:0060538 | 2e-04 | 3.2781 | 4.6404 | 14 | 160 | skeletal muscle organ development |
| GO:0009889 | 2e-04 | 1.537 | 72.9406 | 101 | 2694 | regulation of biosynthetic process |
| GO:0061061 | 2e-04 | 2.0375 | 17.8075 | 34 | 614 | muscle structure development |
| GO:0071805 | 2e-04 | 2.9785 | 5.8005 | 16 | 200 | potassium ion transmembrane transport |
| GO:0048701 | 2e-04 | 6.4145 | 1.2761 | 7 | 44 | embryonic cranial skeleton morphogenesis |
| GO:0021516 | 3e-04 | 10.564 | 0.6091 | 5 | 21 | dorsal spinal cord development |
| GO:0060021 | 3e-04 | 4.2013 | 2.6392 | 10 | 91 | palate development |
| GO:0048858 | 3e-04 | 2.044 | 16.6764 | 32 | 575 | cell projection morphogenesis |
| GO:0048667 | 4e-04 | 2.1217 | 14.5592 | 29 | 502 | cell morphogenesis involved in neuron differentiation |
| GO:0060255 | 4e-04 | 1.3852 | 169.4324 | 205 | 5842 | regulation of macromolecule metabolic process |
| GO:0050796 | 4e-04 | 3.1267 | 4.8434 | 14 | 167 | regulation of insulin secretion |
| GO:0042733 | 5e-04 | 4.9367 | 1.8272 | 8 | 63 | embryonic digit morphogenesis |
| GO:0021902 | 5e-04 | 33.688 | 0.174 | 3 | 6 | commitment of neuronal cell to specific neuron type in forebrain |
| GO:0006935 | 5e-04 | 2.0258 | 16.2704 | 31 | 561 | chemotaxis |
| GO:0014031 | 5e-04 | 4.8482 | 1.8562 | 8 | 64 | mesenchymal cell development |
| GO:0048864 | 5e-04 | 4.8482 | 1.8562 | 8 | 64 | stem cell development |
| GO:0040012 | 5e-04 | 1.8151 | 24.6231 | 42 | 849 | regulation of locomotion |
| GO:0035137 | 5e-04 | 6.7695 | 1.0441 | 6 | 36 | hindlimb morphogenesis |
| GO:0035640 | 5e-04 | 8.8943 | 0.6961 | 5 | 24 | exploration behavior |
| GO:0060173 | 6e-04 | 8.7984 | 0.6974 | 5 | 25 | limb development |
| GO:0003214 | 6e-04 | 13.4981 | 0.406 | 4 | 14 | cardiac left ventricle morphogenesis |
| GO:0030198 | 6e-04 | 2.3661 | 9.4548 | 21 | 326 | extracellular matrix organization |
| GO:0006813 | 6e-04 | 2.6465 | 6.8736 | 17 | 237 | potassium ion transport |
| GO:0009887 | 6e-04 | 2.0819 | 14.3051 | 28 | 536 | animal organ morphogenesis |
| GO:0002042 | 6e-04 | 6.5507 | 1.0731 | 6 | 37 | cell migration involved in sprouting angiogenesis |
| GO:0007618 | 7e-04 | 6.3456 | 1.1021 | 6 | 38 | mating |
| GO:0045777 | 7e-04 | 6.3456 | 1.1021 | 6 | 38 | positive regulation of blood pressure |
| GO:2000648 | 7e-04 | 6.3456 | 1.1021 | 6 | 38 | positive regulation of stem cell proliferation |
| GO:0021542 | 7e-04 | 12.2702 | 0.435 | 4 | 15 | dentate gyrus development |
| GO:0072148 | 7e-04 | 12.2702 | 0.435 | 4 | 15 | epithelial cell fate commitment |
| GO:0014033 | 8e-04 | 4.5238 | 1.9722 | 8 | 68 | neural crest cell differentiation |
| GO:0001826 | 8e-04 | 25.2644 | 0.203 | 3 | 7 | inner cell mass cell differentiation |
| GO:0003357 | 8e-04 | 25.2644 | 0.203 | 3 | 7 | noradrenergic neuron differentiation |
| GO:0035385 | 8e-04 | 25.2644 | 0.203 | 3 | 7 | Roundabout signaling pathway |
| GO:0032989 | 8e-04 | 1.7231 | 28.3644 | 46 | 978 | cellular component morphogenesis |
| GO:0003404 | 8e-04 | Inf | 0.058 | 2 | 2 | optic vesicle morphogenesis |
| GO:0043503 | 8e-04 | Inf | 0.058 | 2 | 2 | skeletal muscle fiber adaptation |
| GO:0072272 | 8e-04 | Inf | 0.058 | 2 | 2 | proximal/distal pattern formation involved in metanephric nephron development |
| GO:0010629 | 9e-04 | 1.5285 | 53.3355 | 76 | 1839 | negative regulation of gene expression |
| GO:0060485 | 0.0011 | 2.5727 | 6.6301 | 16 | 230 | mesenchyme development |
| GO:1902692 | 0.0011 | 7.3456 | 0.8121 | 5 | 28 | regulation of neuroblast proliferation |
| GO:0048565 | 0.0012 | 3.2268 | 3.6833 | 11 | 127 | digestive tract development |
| GO:0051270 | 0.0012 | 1.7427 | 24.9131 | 41 | 859 | regulation of cellular component movement |
| GO:0003206 | 0.0012 | 3.7612 | 2.6162 | 9 | 91 | cardiac chamber morphogenesis |
| GO:0002118 | 0.0012 | 20.2103 | 0.232 | 3 | 8 | aggressive behavior |
| GO:0021859 | 0.0012 | 20.2103 | 0.232 | 3 | 8 | pyramidal neuron differentiation |
| GO:0060534 | 0.0012 | 20.2103 | 0.232 | 3 | 8 | trachea cartilage development |
| GO:0060219 | 0.0012 | 10.3812 | 0.493 | 4 | 17 | camera-type eye photoreceptor cell differentiation |
| GO:2000136 | 0.0012 | 10.3812 | 0.493 | 4 | 17 | regulation of cell proliferation involved in heart morphogenesis |
| GO:0061448 | 0.0012 | 2.532 | 6.7286 | 16 | 232 | connective tissue development |
| GO:0072175 | 0.0013 | 3.199 | 3.7123 | 11 | 128 | epithelial tube formation |
| GO:0021761 | 0.0016 | 3.9617 | 2.217 | 8 | 77 | limbic system development |
| GO:0048468 | 0.0016 | 1.6372 | 31.8273 | 49 | 1173 | cell development |
| GO:0009653 | 0.0017 | 1.9285 | 15.4069 | 28 | 622 | anatomical structure morphogenesis |
| GO:0003266 | 0.0018 | 16.8408 | 0.261 | 3 | 9 | regulation of secondary heart field cardioblast proliferation |
| GO:0060180 | 0.0018 | 16.8408 | 0.261 | 3 | 9 | female mating behavior |
| GO:0031018 | 0.0018 | 5.2043 | 1.3051 | 6 | 45 | endocrine pancreas development |
| GO:0008015 | 0.0018 | 2.1418 | 10.3621 | 21 | 362 | blood circulation |
| GO:0003209 | 0.0018 | 6.4968 | 0.8991 | 5 | 31 | cardiac atrium morphogenesis |
| GO:0030278 | 0.0019 | 2.7176 | 5.1044 | 13 | 176 | regulation of ossification |
| GO:0072079 | 0.0019 | 8.9959 | 0.551 | 4 | 19 | nephron tubule formation |
| GO:0030902 | 0.002 | 2.9928 | 3.9443 | 11 | 136 | hindbrain development |
| GO:0051937 | 0.002 | 4.3103 | 1.7982 | 7 | 62 | catecholamine transport |
| GO:0008038 | 0.0021 | 6.2558 | 0.9281 | 5 | 32 | neuron recognition |
| GO:0003279 | 0.0022 | 3.4321 | 2.8422 | 9 | 98 | cardiac septum development |
| GO:0097756 | 0.0022 | 3.767 | 2.3202 | 8 | 80 | negative regulation of blood vessel diameter |
| GO:0048663 | 0.0022 | 6.1684 | 0.9367 | 5 | 33 | neuron fate commitment |
| GO:0002067 | 0.0023 | 4.9498 | 1.3631 | 6 | 47 | glandular epithelial cell differentiation |
| GO:2000179 | 0.0023 | 4.9498 | 1.3631 | 6 | 47 | positive regulation of neural precursor cell proliferation |
| GO:0021854 | 0.0023 | 8.4331 | 0.58 | 4 | 20 | hypothalamus development |
| GO:0023019 | 0.0023 | 8.4331 | 0.58 | 4 | 20 | signal transduction involved in regulation of gene expression |
| GO:0060039 | 0.0023 | 8.4331 | 0.58 | 4 | 20 | pericardium development |
| GO:2000178 | 0.0023 | 8.4331 | 0.58 | 4 | 20 | negative regulation of neural precursor cell proliferation |
| GO:0051173 | 0.0024 | 1.3938 | 81.932 | 106 | 2825 | positive regulation of nitrogen compound metabolic process |
| GO:0048732 | 0.0024 | 2.0899 | 10.5982 | 21 | 370 | gland development |
| GO:0007416 | 0.0024 | 2.9221 | 4.0313 | 11 | 139 | synapse assembly |
| GO:0045987 | 0.0024 | 6.032 | 0.9571 | 5 | 33 | positive regulation of smooth muscle contraction |
| GO:0021520 | 0.0025 | 14.4951 | 0.2888 | 3 | 10 | spinal cord motor neuron cell fate specification |
| GO:0003166 | 0.0025 | 67.2409 | 0.087 | 2 | 3 | bundle of His development |
| GO:0014016 | 0.0025 | 67.2409 | 0.087 | 2 | 3 | neuroblast differentiation |
| GO:0014908 | 0.0025 | 67.2409 | 0.087 | 2 | 3 | myotube differentiation involved in skeletal muscle regeneration |
| GO:0021530 | 0.0025 | 67.2409 | 0.087 | 2 | 3 | spinal cord oligodendrocyte cell fate specification |
| GO:0021912 | 0.0025 | 67.2409 | 0.087 | 2 | 3 | regulation of transcription from RNA polymerase II promoter involved in spinal cord motor neuron fate specification |
| GO:0048936 | 0.0025 | 67.2409 | 0.087 | 2 | 3 | peripheral nervous system neuron axonogenesis |
| GO:0060913 | 0.0025 | 67.2409 | 0.087 | 2 | 3 | cardiac cell fate determination |
| GO:0140076 | 0.0025 | 67.2409 | 0.087 | 2 | 3 | negative regulation of lipoprotein transport |
| GO:0007417 | 0.0025 | 2.7544 | 4.6387 | 12 | 176 | central nervous system development |
| GO:0003211 | 0.0025 | 14.4341 | 0.29 | 3 | 10 | cardiac ventricle formation |
| GO:0003263 | 0.0025 | 14.4341 | 0.29 | 3 | 10 | cardioblast proliferation |
| GO:0030334 | 0.0026 | 1.7359 | 21.2298 | 35 | 732 | regulation of cell migration |
| GO:0048639 | 0.0027 | 2.7223 | 4.6984 | 12 | 162 | positive regulation of developmental growth |
| GO:0010842 | 0.0028 | 7.9365 | 0.6091 | 4 | 21 | retina layer formation |
| GO:0031290 | 0.0028 | 7.9365 | 0.6091 | 4 | 21 | retinal ganglion cell axon guidance |
| GO:0043586 | 0.0028 | 7.9365 | 0.6091 | 4 | 21 | tongue development |
| GO:0048485 | 0.0028 | 7.9365 | 0.6091 | 4 | 21 | sympathetic nervous system development |
| GO:0001656 | 0.003 | 3.5678 | 2.4362 | 8 | 84 | metanephros development |
| GO:0033555 | 0.0032 | 3.9498 | 1.9432 | 7 | 67 | multicellular organismal response to stress |
| GO:0021537 | 0.0033 | 2.5368 | 5.4352 | 13 | 191 | telencephalon development |
| GO:0051240 | 0.0033 | 1.6221 | 27.9758 | 43 | 1007 | positive regulation of multicellular organismal process |
| GO:0001525 | 0.0034 | 1.9245 | 13.1091 | 24 | 452 | angiogenesis |
| GO:0021559 | 0.0034 | 12.629 | 0.319 | 3 | 11 | trigeminal nerve development |
| GO:2001053 | 0.0034 | 12.629 | 0.319 | 3 | 11 | regulation of mesenchymal cell apoptotic process |
| GO:0007623 | 0.0034 | 2.5293 | 5.4525 | 13 | 188 | circadian rhythm |
| GO:0010811 | 0.0035 | 3.1804 | 3.0453 | 9 | 105 | positive regulation of cell-substrate adhesion |
| GO:0072009 | 0.0035 | 3.1804 | 3.0453 | 9 | 105 | nephron epithelium development |
| GO:0035914 | 0.0035 | 3.8848 | 1.9722 | 7 | 68 | skeletal muscle cell differentiation |
| GO:0071300 | 0.0035 | 3.8848 | 1.9722 | 7 | 68 | cellular response to retinoic acid |
| GO:0030324 | 0.0035 | 2.6336 | 4.8434 | 12 | 167 | lung development |
| GO:0014003 | 0.0036 | 5.4472 | 1.0441 | 5 | 36 | oligodendrocyte development |
| GO:0071542 | 0.0036 | 5.4472 | 1.0441 | 5 | 36 | dopaminergic neuron differentiation |
| GO:0030072 | 0.0037 | 2.3249 | 6.8156 | 15 | 235 | peptide hormone secretion |
| GO:0065007 | 0.0037 | 1.3355 | 327.5538 | 354 | 11294 | biological regulation |
| GO:0035296 | 0.0039 | 2.9019 | 3.6833 | 10 | 127 | regulation of tube diameter |
| GO:0030154 | 0.004 | 1.5956 | 30.0688 | 45 | 1219 | cell differentiation |
| GO:0007601 | 0.004 | 2.4721 | 5.5685 | 13 | 192 | visual perception |
| GO:0090304 | 0.0041 | 1.3048 | 142.1701 | 169 | 4902 | nucleic acid metabolic process |
| GO:0001755 | 0.0041 | 5.2766 | 1.0731 | 5 | 37 | neural crest cell migration |
| GO:0021987 | 0.0042 | 3.0834 | 3.1323 | 9 | 108 | cerebral cortex development |
| GO:0001568 | 0.0042 | 1.7563 | 17.9235 | 30 | 618 | blood vessel development |
| GO:0040007 | 0.0044 | 2.1522 | 8.3177 | 17 | 294 | growth |
| GO:0010454 | 0.0044 | 11.2251 | 0.348 | 3 | 12 | negative regulation of cell fate commitment |
| GO:0033605 | 0.0044 | 11.2251 | 0.348 | 3 | 12 | positive regulation of catecholamine secretion |
| GO:0042659 | 0.0044 | 11.2251 | 0.348 | 3 | 12 | regulation of cell fate specification |
| GO:0060900 | 0.0044 | 11.2251 | 0.348 | 3 | 12 | embryonic camera-type eye formation |
| GO:0042391 | 0.0045 | 1.9695 | 11.195 | 21 | 386 | regulation of membrane potential |
| GO:0045595 | 0.0046 | 1.6857 | 21.2176 | 34 | 782 | regulation of cell differentiation |
| GO:0001964 | 0.0047 | 6.7448 | 0.6961 | 4 | 24 | startle response |
| GO:0042481 | 0.0047 | 6.7448 | 0.6961 | 4 | 24 | regulation of odontogenesis |
| GO:0051482 | 0.0047 | 6.7448 | 0.6961 | 4 | 24 | positive regulation of cytosolic calcium ion concentration involved in phospholipase C-activating G-protein coupled signaling pathway |
| GO:0060487 | 0.0047 | 6.7448 | 0.6961 | 4 | 24 | lung epithelial cell differentiation |
| GO:0021675 | 0.0048 | 3.6448 | 2.0882 | 7 | 72 | nerve development |
| GO:0007188 | 0.0048 | 2.6504 | 4.4084 | 11 | 152 | adenylate cyclase-modulating G-protein coupled receptor signaling pathway |
| GO:0001992 | 0.0048 | 33.6183 | 0.116 | 2 | 4 | regulation of systemic arterial blood pressure by vasopressin |
| GO:0001994 | 0.0048 | 33.6183 | 0.116 | 2 | 4 | norepinephrine-epinephrine vasoconstriction involved in regulation of systemic arterial blood pressure |
| GO:0007621 | 0.0048 | 33.6183 | 0.116 | 2 | 4 | negative regulation of female receptivity |
| GO:0021555 | 0.0048 | 33.6183 | 0.116 | 2 | 4 | midbrain-hindbrain boundary morphogenesis |
| GO:0021797 | 0.0048 | 33.6183 | 0.116 | 2 | 4 | forebrain anterior/posterior pattern specification |
| GO:0034287 | 0.0048 | 33.6183 | 0.116 | 2 | 4 | detection of monosaccharide stimulus |
| GO:0042662 | 0.0048 | 33.6183 | 0.116 | 2 | 4 | negative regulation of mesodermal cell fate specification |
| GO:0048866 | 0.0048 | 33.6183 | 0.116 | 2 | 4 | stem cell fate specification |
| GO:0050923 | 0.0048 | 33.6183 | 0.116 | 2 | 4 | regulation of negative chemotaxis |
| GO:0051414 | 0.0048 | 33.6183 | 0.116 | 2 | 4 | response to cortisol |
| GO:0051594 | 0.0048 | 33.6183 | 0.116 | 2 | 4 | detection of glucose |
| GO:0060164 | 0.0048 | 33.6183 | 0.116 | 2 | 4 | regulation of timing of neuron differentiation |
| GO:0060214 | 0.0048 | 33.6183 | 0.116 | 2 | 4 | endocardium formation |
| GO:0072086 | 0.0048 | 33.6183 | 0.116 | 2 | 4 | specification of loop of Henle identity |
| GO:0097176 | 0.0048 | 33.6183 | 0.116 | 2 | 4 | epoxide metabolic process |
| GO:1905903 | 0.0048 | 33.6183 | 0.116 | 2 | 4 | negative regulation of mesoderm formation |
| GO:0019932 | 0.005 | 2.1176 | 8.4397 | 17 | 291 | second-messenger-mediated signaling |
| GO:0061333 | 0.0052 | 3.5894 | 2.1172 | 7 | 73 | renal tubule morphogenesis |
| GO:0072089 | 0.0053 | 3.5746 | 2.1238 | 7 | 74 | stem cell proliferation |
| GO:0045165 | 0.0054 | 2.753 | 3.8602 | 10 | 139 | cell fate commitment |
| GO:0003148 | 0.0054 | 6.4232 | 0.7251 | 4 | 25 | outflow tract septum morphogenesis |
| GO:0045597 | 0.0055 | 2.0037 | 9.9519 | 19 | 359 | positive regulation of cell differentiation |
| GO:0007320 | 0.0056 | 10.1019 | 0.377 | 3 | 13 | insemination |
| GO:0021978 | 0.0056 | 10.1019 | 0.377 | 3 | 13 | telencephalon regionalization |
| GO:0040034 | 0.0056 | 10.1019 | 0.377 | 3 | 13 | regulation of development, heterochronic |
| GO:0070365 | 0.0056 | 10.1019 | 0.377 | 3 | 13 | hepatocyte differentiation |
| GO:0001657 | 0.0056 | 3.1882 | 2.6972 | 8 | 93 | ureteric bud development |
| GO:0019233 | 0.0056 | 3.1882 | 2.6972 | 8 | 93 | sensory perception of pain |
| GO:0003170 | 0.0057 | 4.8234 | 1.1601 | 5 | 40 | heart valve development |
| GO:0035265 | 0.0058 | 2.5767 | 4.5244 | 11 | 156 | organ growth |
| GO:0048523 | 0.0059 | 1.2962 | 129.148 | 154 | 4453 | negative regulation of cellular process |
| GO:0042472 | 0.006 | 3.1509 | 2.7262 | 8 | 94 | inner ear morphogenesis |
| GO:0072163 | 0.006 | 3.1509 | 2.7262 | 8 | 94 | mesonephric epithelium development |
| GO:0010594 | 0.006 | 2.7148 | 3.9153 | 10 | 135 | regulation of endothelial cell migration |
| GO:0050880 | 0.006 | 2.7148 | 3.9153 | 10 | 135 | regulation of blood vessel size |
| GO:0019229 | 0.006 | 3.9767 | 1.6531 | 6 | 57 | regulation of vasoconstriction |
| GO:0051952 | 0.006 | 3.4834 | 2.1752 | 7 | 75 | regulation of amine transport |
| GO:0071495 | 0.0062 | 1.5013 | 35.702 | 51 | 1231 | cellular response to endogenous stimulus |
| GO:0002063 | 0.0063 | 6.1308 | 0.7541 | 4 | 26 | chondrocyte development |
| GO:0008344 | 0.0064 | 3.4327 | 2.2042 | 7 | 76 | adult locomotory behavior |
| GO:0045669 | 0.0065 | 3.9 | 1.6821 | 6 | 58 | positive regulation of osteoblast differentiation |
| GO:0003188 | 0.007 | 9.183 | 0.406 | 3 | 14 | heart valve formation |
| GO:0042711 | 0.007 | 9.183 | 0.406 | 3 | 14 | maternal behavior |
| GO:0010470 | 0.0071 | 4.5621 | 1.2181 | 5 | 42 | regulation of gastrulation |
| GO:0050877 | 0.0071 | 1.4957 | 35.093 | 50 | 1210 | nervous system process |
| GO:0008016 | 0.0071 | 2.2162 | 6.6416 | 14 | 229 | regulation of heart contraction |
| GO:0001958 | 0.0072 | 5.8639 | 0.7831 | 4 | 27 | endochondral ossification |
| GO:0040008 | 0.0075 | 1.6939 | 17.8945 | 29 | 617 | regulation of growth |
| GO:0042127 | 0.0077 | 1.4353 | 44.7339 | 61 | 1554 | regulation of cell proliferation |
| GO:0060421 | 0.0078 | 4.4418 | 1.2471 | 5 | 43 | positive regulation of heart growth |
| GO:0016199 | 0.0079 | 22.4108 | 0.145 | 2 | 5 | axon midline choice point recognition |
| GO:0045636 | 0.0079 | 22.4108 | 0.145 | 2 | 5 | positive regulation of melanocyte differentiation |
| GO:0060729 | 0.0079 | 22.4108 | 0.145 | 2 | 5 | intestinal epithelial structure maintenance |
| GO:0061009 | 0.0079 | 22.4108 | 0.145 | 2 | 5 | common bile duct development |
| GO:0070100 | 0.0079 | 22.4108 | 0.145 | 2 | 5 | negative regulation of chemokine-mediated signaling pathway |
| GO:0071504 | 0.0079 | 22.4108 | 0.145 | 2 | 5 | cellular response to heparin |
| GO:0090130 | 0.0079 | 2.1195 | 7.4246 | 15 | 256 | tissue migration |
| GO:0055067 | 0.0081 | 2.5895 | 4.0893 | 10 | 141 | monovalent inorganic cation homeostasis |
| GO:1901576 | 0.0081 | 1.2622 | 177.4081 | 203 | 6117 | organic substance biosynthetic process |
| GO:0044057 | 0.0082 | 1.7552 | 14.8783 | 25 | 513 | regulation of system process |
| GO:0009880 | 0.0083 | 3.6866 | 1.7692 | 6 | 61 | embryonic pattern specification |
| GO:0060560 | 0.0084 | 2.442 | 4.7533 | 11 | 165 | developmental growth involved in morphogenesis |
| GO:0007379 | 0.0085 | 8.4172 | 0.435 | 3 | 15 | segment specification |
| GO:0008595 | 0.0085 | 8.4172 | 0.435 | 3 | 15 | anterior/posterior axis specification, embryo |
| GO:0072358 | 0.0089 | 1.6538 | 18.9386 | 30 | 653 | cardiovascular system development |
| GO:1902742 | 0.0091 | 5.429 | 0.8359 | 4 | 29 | apoptotic process involved in development |
| GO:0003203 | 0.0093 | 5.3941 | 0.8411 | 4 | 29 | endocardial cushion morphogenesis |
| GO:0003401 | 0.0093 | 5.3941 | 0.8411 | 4 | 29 | axis elongation |
| GO:0031128 | 0.0093 | 5.3941 | 0.8411 | 4 | 29 | developmental induction |
| GO:0061036 | 0.0093 | 5.3941 | 0.8411 | 4 | 29 | positive regulation of cartilage development |
| GO:0006725 | 0.0094 | 1.2585 | 166.3001 | 191 | 5734 | cellular aromatic compound metabolic process |
| GO:0035176 | 0.0094 | 4.2192 | 1.3051 | 5 | 45 | social behavior |
| GO:0035239 | 0.0096 | 2.2904 | 5.5077 | 12 | 194 | tube morphogenesis |
| GO:0022414 | 0.0097 | 1.4513 | 38.2833 | 53 | 1320 | reproductive process |
| GO:0001756 | 0.0097 | 3.5568 | 1.8272 | 6 | 63 | somitogenesis |
| GO:0051146 | 0.0097 | 2.0672 | 7.5986 | 15 | 262 | striated muscle cell differentiation |
| GO:0001101 | 0.0098 | 1.9641 | 9.0488 | 17 | 312 | response to acid chemical |
| GOMFID | Pvalue | OddsRatio | ExpCount | Count | Size | Term |
| GO:0006959 | 0 | 4.5652 | 4.14 | 17 | 219 | humoral immune response |
| GO:0071346 | 0 | 5.5032 | 2.6466 | 13 | 140 | cellular response to interferon-gamma |
| GO:0007166 | 0 | 1.7876 | 49.6796 | 78 | 2628 | cell surface receptor signaling pathway |
| GO:0071310 | 1e-04 | 1.757 | 44.67 | 70 | 2363 | cellular response to organic substance |
| GO:0002684 | 1e-04 | 2.1569 | 17.6185 | 35 | 932 | positive regulation of immune system process |
| GO:0060759 | 1e-04 | 4.0614 | 3.2137 | 12 | 170 | regulation of response to cytokine stimulus |
| GO:0002250 | 1e-04 | 2.9449 | 6.5786 | 18 | 348 | adaptive immune response |
| GO:2001300 | 1e-04 | 52.4013 | 0.1134 | 3 | 6 | lipoxin metabolic process |
| GO:0060326 | 1e-04 | 3.2758 | 4.9339 | 15 | 261 | cell chemotaxis |
| GO:0035666 | 2e-04 | 11.4526 | 0.5293 | 5 | 28 | TRIF-dependent toll-like receptor signaling pathway |
| GO:0050776 | 2e-04 | 2.1031 | 16.9379 | 33 | 896 | regulation of immune response |
| GO:0042221 | 2e-04 | 1.564 | 78.7916 | 107 | 4168 | response to chemical |
| GO:0071356 | 2e-04 | 3.1334 | 5.1419 | 15 | 272 | cellular response to tumor necrosis factor |
| GO:0044657 | 4e-04 | Inf | 0.0378 | 2 | 2 | pore formation in membrane of other organism during symbiotic interaction |
| GO:0052043 | 4e-04 | Inf | 0.0378 | 2 | 2 | modification by symbiont of host cellular component |
| GO:0052185 | 4e-04 | Inf | 0.0378 | 2 | 2 | modification of structure of other organism involved in symbiotic interaction |
| GO:0052332 | 4e-04 | Inf | 0.0378 | 2 | 2 | modification by organism of membrane in other organism involved in symbiotic interaction |
| GO:0061844 | 4e-04 | 7.0379 | 0.9641 | 6 | 51 | antimicrobial humoral immune response mediated by antimicrobial peptide |
| GO:0051716 | 5e-04 | 1.4688 | 129.2651 | 158 | 6838 | cellular response to stimulus |
| GO:0045087 | 6e-04 | 2.567 | 7.4864 | 18 | 417 | innate immune response |
| GO:0010818 | 6e-04 | 12.3595 | 0.397 | 4 | 21 | T cell chemotaxis |
| GO:0001932 | 7e-04 | 1.8067 | 25.0855 | 42 | 1327 | regulation of protein phosphorylation |
| GO:0010803 | 7e-04 | 6.2075 | 1.0775 | 6 | 57 | regulation of tumor necrosis factor-mediated signaling pathway |
| GO:0019731 | 7e-04 | 7.9771 | 0.7183 | 5 | 38 | antibacterial humoral response |
| GO:0050900 | 8e-04 | 2.4954 | 7.675 | 18 | 406 | leukocyte migration |
| GO:0031347 | 8e-04 | 2.1045 | 13.176 | 26 | 697 | regulation of defense response |
| GO:0070098 | 8e-04 | 5.0694 | 1.5123 | 7 | 80 | chemokine-mediated signaling pathway |
| GO:0002263 | 8e-04 | 2.1358 | 12.4766 | 25 | 660 | cell activation involved in immune response |
| GO:0050832 | 8e-04 | 7.742 | 0.7373 | 5 | 39 | defense response to fungus |
| GO:0048522 | 8e-04 | 1.4746 | 90.0584 | 116 | 4764 | positive regulation of cellular process |
| GO:0006879 | 8e-04 | 5.9725 | 1.1153 | 6 | 59 | cellular iron ion homeostasis |
| GO:0023014 | 9e-04 | 1.9494 | 16.9946 | 31 | 899 | signal transduction by protein phosphorylation |
| GO:1902531 | 0.001 | 1.6756 | 32.9685 | 51 | 1744 | regulation of intracellular signal transduction |
| GO:0042330 | 0.001 | 2.2047 | 10.6051 | 22 | 561 | taxis |
| GO:0019220 | 0.0013 | 1.6711 | 31.6641 | 49 | 1675 | regulation of phosphate metabolic process |
| GO:0023052 | 0.0014 | 1.5866 | 48.5682 | 68 | 2783 | signaling |
| GO:0071347 | 0.0016 | 4.4558 | 1.7014 | 7 | 90 | cellular response to interleukin-1 |
| GO:0051707 | 0.0017 | 1.934 | 15.3878 | 28 | 814 | response to other organism |
| GO:0034340 | 0.0017 | 4.4025 | 1.7203 | 7 | 91 | response to type I interferon |
| GO:0002286 | 0.0019 | 4.2996 | 1.7581 | 7 | 93 | T cell activation involved in immune response |
| GO:0002323 | 0.002 | 8.4003 | 0.5482 | 4 | 29 | natural killer cell activation involved in immune response |
| GO:0002760 | 0.0021 | 52.2328 | 0.0756 | 2 | 4 | positive regulation of antimicrobial humoral response |
| GO:0032100 | 0.0021 | 52.2328 | 0.0756 | 2 | 4 | positive regulation of appetite |
| GO:0061356 | 0.0021 | 52.2328 | 0.0756 | 2 | 4 | regulation of Wnt protein secretion |
| GO:0070574 | 0.0021 | 52.2328 | 0.0756 | 2 | 4 | cadmium ion transmembrane transport |
| GO:0071315 | 0.0021 | 52.2328 | 0.0756 | 2 | 4 | cellular response to morphine |
| GO:0055076 | 0.0021 | 3.7458 | 2.2874 | 8 | 121 | transition metal ion homeostasis |
| GO:0043410 | 0.0024 | 2.18 | 9.2062 | 19 | 487 | positive regulation of MAPK cascade |
| GO:0045321 | 0.0024 | 1.7574 | 21.2102 | 35 | 1122 | leukocyte activation |
| GO:0034097 | 0.0025 | 1.9513 | 13.583 | 25 | 748 | response to cytokine |
| GO:0007076 | 0.0026 | 13.0929 | 0.2836 | 3 | 15 | mitotic chromosome condensation |
| GO:0002251 | 0.003 | 7.4988 | 0.6049 | 4 | 32 | organ or tissue specific immune response |
| GO:0032268 | 0.003 | 1.5022 | 48.4697 | 67 | 2564 | regulation of cellular protein metabolic process |
| GO:0019372 | 0.0031 | 12.085 | 0.3025 | 3 | 16 | lipoxygenase pathway |
| GO:0043547 | 0.0032 | 2.2874 | 7.3725 | 16 | 390 | positive regulation of GTPase activity |
| GO:0045409 | 0.0034 | 34.8197 | 0.0945 | 2 | 5 | negative regulation of interleukin-6 biosynthetic process |
| GO:1903322 | 0.0035 | 2.9302 | 3.6107 | 10 | 191 | positive regulation of protein modification by small protein conjugation or removal |
| GO:0043312 | 0.0035 | 2.1479 | 8.8281 | 18 | 467 | neutrophil degranulation |
| GO:0009607 | 0.0035 | 1.8262 | 16.2196 | 28 | 858 | response to biotic stimulus |
| GO:0051607 | 0.0035 | 2.7558 | 4.2156 | 11 | 223 | defense response to virus |
| GO:0048584 | 0.0036 | 1.5425 | 38.375 | 55 | 2030 | positive regulation of response to stimulus |
| GO:0070423 | 0.0037 | 6.998 | 0.6427 | 4 | 34 | nucleotide-binding oligomerization domain containing signaling pathway |
| GO:0007154 | 0.0042 | 1.5047 | 49.7261 | 67 | 2846 | cell communication |
| GO:0045089 | 0.0043 | 2.3538 | 6.2572 | 14 | 331 | positive regulation of innate immune response |
| GO:0042119 | 0.0044 | 2.0997 | 9.0172 | 18 | 477 | neutrophil activation |
| GO:0006950 | 0.0044 | 1.4196 | 68.1109 | 88 | 3603 | response to stress |
| GO:0090026 | 0.0044 | 10.4724 | 0.3403 | 3 | 18 | positive regulation of monocyte chemotaxis |
| GO:0031640 | 0.0047 | 4.9606 | 1.0964 | 5 | 58 | killing of cells of other organism |
| GO:0002275 | 0.0048 | 2.0363 | 9.8111 | 19 | 519 | myeloid cell activation involved in immune response |
| GO:1904668 | 0.0049 | 4.1048 | 1.569 | 6 | 83 | positive regulation of ubiquitin protein ligase activity |
| GO:0048247 | 0.0049 | 6.4388 | 0.6912 | 4 | 37 | lymphocyte chemotaxis |
| GO:0002444 | 0.0051 | 2.0238 | 9.8679 | 19 | 522 | myeloid leukocyte mediated immunity |
| GO:0032109 | 0.0051 | 26.1131 | 0.1134 | 2 | 6 | positive regulation of response to nutrient levels |
| GO:0051673 | 0.0051 | 26.1131 | 0.1134 | 2 | 6 | membrane disruption in other organism |
| GO:0042276 | 0.0052 | 9.8172 | 0.3592 | 3 | 19 | error-prone translesion synthesis |
| GO:0002758 | 0.0054 | 2.4714 | 5.1041 | 12 | 270 | innate immune response-activating signal transduction |
| GO:0002253 | 0.0057 | 1.9991 | 9.9813 | 19 | 528 | activation of immune response |
| GO:0060337 | 0.0058 | 3.9501 | 1.6257 | 6 | 86 | type I interferon signaling pathway |
| GO:0002227 | 0.006 | 9.2392 | 0.3781 | 3 | 20 | innate immune response in mucosa |
| GO:0060544 | 0.006 | 9.2392 | 0.3781 | 3 | 20 | regulation of necroptotic process |
| GO:1904380 | 0.006 | 9.2392 | 0.3781 | 3 | 20 | endoplasmic reticulum mannose trimming |
| GO:0030522 | 0.0061 | 2.4331 | 5.1797 | 12 | 274 | intracellular receptor signaling pathway |
| GO:0031098 | 0.0061 | 2.4331 | 5.1797 | 12 | 274 | stress-activated protein kinase signaling cascade |
| GO:1903321 | 0.0061 | 3.1078 | 2.7222 | 8 | 144 | negative regulation of protein modification by small protein conjugation or removal |
| GO:0051247 | 0.0064 | 1.5661 | 29.1877 | 43 | 1544 | positive regulation of protein metabolic process |
| GO:0002223 | 0.0065 | 3.3874 | 2.1929 | 7 | 116 | stimulatory C-type lectin receptor signaling pathway |
| GO:0033141 | 0.0069 | 8.7253 | 0.397 | 3 | 21 | positive regulation of peptidyl-serine phosphorylation of STAT protein |
| GO:0006875 | 0.007 | 1.9966 | 9.452 | 18 | 500 | cellular metal ion homeostasis |
| GO:0016198 | 0.007 | 20.8892 | 0.1323 | 2 | 7 | axon choice point recognition |
| GO:0010562 | 0.0073 | 1.6612 | 20.3217 | 32 | 1075 | positive regulation of phosphorus metabolic process |
| GO:0071675 | 0.0073 | 5.6716 | 0.7751 | 4 | 41 | regulation of mononuclear cell migration |
| GO:0031401 | 0.0074 | 1.7032 | 17.9507 | 29 | 970 | positive regulation of protein modification process |
| GO:0032479 | 0.0075 | 3.296 | 2.2496 | 7 | 119 | regulation of type I interferon production |
| GO:0051438 | 0.0075 | 3.296 | 2.2496 | 7 | 119 | regulation of ubiquitin-protein transferase activity |
| GO:0065007 | 0.0077 | 1.3869 | 213.5011 | 233 | 11294 | biological regulation |
| GO:0097300 | 0.008 | 5.522 | 0.794 | 4 | 42 | programmed necrotic cell death |
| GO:0043085 | 0.0082 | 1.572 | 26.2576 | 39 | 1389 | positive regulation of catalytic activity |
| GO:0042327 | 0.0082 | 1.6886 | 18.0722 | 29 | 956 | positive regulation of phosphorylation |
| GO:0045055 | 0.0083 | 1.8027 | 13.384 | 23 | 708 | regulated exocytosis |
| GO:0038061 | 0.0085 | 3.2094 | 2.3063 | 7 | 122 | NIK/NF-kappaB signaling |
| GO:0042059 | 0.0087 | 5.38 | 0.8129 | 4 | 43 | negative regulation of epidermal growth factor receptor signaling pathway |
| GO:0042832 | 0.009 | 7.8518 | 0.4348 | 3 | 23 | defense response to protozoan |
| GO:0006508 | 0.0093 | 1.5133 | 31.5507 | 45 | 1669 | proteolysis |
| GO:0023051 | 0.0096 | 1.3842 | 61.8228 | 79 | 3291 | regulation of signaling |
| GO:0010646 | 0.0097 | 1.3854 | 60.9399 | 78 | 3244 | regulation of cell communication |
| GOMFID | Pvalue | OddsRatio | ExpCount | Count | Size | Term |
| GO:0031640 | 1e-04 | 7.0044 | 1.1357 | 7 | 58 | killing of cells of other organism |
| GO:0007518 | 4e-04 | Inf | 0.0392 | 2 | 2 | myoblast fate determination |
| GO:0061844 | 5e-04 | 6.785 | 0.9986 | 6 | 51 | antimicrobial humoral immune response mediated by antimicrobial peptide |
| GO:0003350 | 0.0011 | 100.7658 | 0.0587 | 2 | 3 | pulmonary myocardium development |
| GO:0006959 | 0.0013 | 2.9772 | 4.2883 | 12 | 219 | humoral immune response |
| GO:0051852 | 0.0023 | 13.7758 | 0.2741 | 3 | 14 | disruption by host of symbiont cells |
| GO:0007156 | 0.0031 | 3.2139 | 2.9764 | 9 | 152 | homophilic cell adhesion via plasma membrane adhesion molecules |
| GO:0051673 | 0.0054 | 25.1867 | 0.1175 | 2 | 6 | membrane disruption in other organism |
| GO:0050832 | 0.0069 | 5.7823 | 0.7637 | 4 | 39 | defense response to fungus |
| GO:0071267 | 0.0075 | 20.1481 | 0.1371 | 2 | 7 | L-methionine salvage |
| GO:0060972 | 0.0076 | 8.4148 | 0.4112 | 3 | 21 | left/right pattern formation |
| GO:0095500 | 0.0087 | 7.9714 | 0.4308 | 3 | 22 | acetylcholine receptor signaling pathway |
| GO:1905144 | 0.0087 | 7.9714 | 0.4308 | 3 | 22 | response to acetylcholine |
| GO:0034340 | 0.0089 | 3.583 | 1.7819 | 6 | 91 | response to type I interferon |
| GO:0042832 | 0.0099 | 7.5724 | 0.4504 | 3 | 23 | defense response to protozoan |
| GO:0045617 | 0.0099 | 16.789 | 0.1567 | 2 | 8 | negative regulation of keratinocyte differentiation |
| GO:0070943 | 0.0099 | 16.789 | 0.1567 | 2 | 8 | neutrophil mediated killing of symbiont cell |
| GOMFID | Pvalue | OddsRatio | ExpCount | Count | Size | Term |
| GO:0002263 | 0 | 3.7537 | 15.8904 | 51 | 660 | cell activation involved in immune response |
| GO:0045087 | 0 | 3.622 | 11.9508 | 38 | 507 | innate immune response |
| GO:0071216 | 0 | 5.5317 | 4.5986 | 22 | 191 | cellular response to biotic stimulus |
| GO:0045321 | 0 | 3.1326 | 15.1884 | 42 | 664 | leukocyte activation |
| GO:0051707 | 0 | 2.7555 | 19.5982 | 48 | 814 | response to other organism |
| GO:0002275 | 0 | 3.2652 | 12.3621 | 36 | 516 | myeloid cell activation involved in immune response |
| GO:0002444 | 0 | 3.2056 | 12.5679 | 36 | 522 | myeloid leukocyte mediated immunity |
| GO:0002237 | 0 | 3.5164 | 7.873 | 25 | 327 | response to molecule of bacterial origin |
| GO:0071222 | 0 | 6.0809 | 2.6499 | 14 | 112 | cellular response to lipopolysaccharide |
| GO:0042119 | 0 | 2.9739 | 11.4844 | 31 | 477 | neutrophil activation |
| GO:0032940 | 0 | 2.2994 | 24.1485 | 50 | 1029 | secretion by cell |
| GO:0002285 | 0 | 4.8575 | 3.7078 | 16 | 154 | lymphocyte activation involved in immune response |
| GO:0043312 | 0 | 2.9308 | 11.2437 | 30 | 467 | neutrophil degranulation |
| GO:0006955 | 0 | 3.7165 | 6.2623 | 21 | 311 | immune response |
| GO:0090026 | 0 | 20.5675 | 0.4334 | 6 | 18 | positive regulation of monocyte chemotaxis |
| GO:0045055 | 0 | 2.4388 | 17.0461 | 38 | 708 | regulated exocytosis |
| GO:0007166 | 0 | 1.7644 | 59.7779 | 93 | 2549 | cell surface receptor signaling pathway |
| GO:0002695 | 0 | 4.3225 | 3.5874 | 14 | 149 | negative regulation of leukocyte activation |
| GO:0042330 | 0 | 2.4889 | 13.5068 | 31 | 561 | taxis |
| GO:0042102 | 0 | 5.3685 | 2.3113 | 11 | 96 | positive regulation of T cell proliferation |
| GO:0060326 | 0 | 3.2939 | 6.2839 | 19 | 261 | cell chemotaxis |
| GO:0023052 | 0 | 1.5354 | 146.2157 | 186 | 6073 | signaling |
| GO:0050670 | 0 | 3.6728 | 4.7671 | 16 | 198 | regulation of lymphocyte proliferation |
| GO:0002682 | 0 | 2.1274 | 20.9756 | 41 | 917 | regulation of immune system process |
| GO:0097530 | 0 | 4.5303 | 2.9373 | 12 | 122 | granulocyte migration |
| GO:0070663 | 0 | 3.4611 | 5.032 | 16 | 209 | regulation of leukocyte proliferation |
| GO:0071675 | 0 | 8.4792 | 0.9871 | 7 | 41 | regulation of mononuclear cell migration |
| GO:0048525 | 0 | 5.3069 | 2.1187 | 10 | 88 | negative regulation of viral process |
| GO:0050708 | 1e-04 | 2.6267 | 9.8472 | 24 | 409 | regulation of protein secretion |
| GO:0035589 | 1e-04 | 27.292 | 0.2408 | 4 | 10 | G-protein coupled purinergic nucleotide receptor signaling pathway |
| GO:0050704 | 1e-04 | 8.0072 | 1.0353 | 7 | 43 | regulation of interleukin-1 secretion |
| GO:0032946 | 1e-04 | 4.1501 | 3.1781 | 12 | 132 | positive regulation of mononuclear cell proliferation |
| GO:0032651 | 1e-04 | 6.3455 | 1.4446 | 8 | 60 | regulation of interleukin-1 beta production |
| GO:0007154 | 1e-04 | 1.4792 | 146.7213 | 183 | 6094 | cell communication |
| GO:0050713 | 1e-04 | 23.3917 | 0.2648 | 4 | 11 | negative regulation of interleukin-1 beta secretion |
| GO:0070098 | 1e-04 | 5.2357 | 1.9261 | 9 | 80 | chemokine-mediated signaling pathway |
| GO:0002322 | 1e-04 | 61.2642 | 0.1204 | 3 | 5 | B cell proliferation involved in immune response |
| GO:0050867 | 1e-04 | 2.8093 | 7.2711 | 19 | 302 | positive regulation of cell activation |
| GO:0002687 | 2e-04 | 4.1418 | 2.9132 | 11 | 121 | positive regulation of leukocyte migration |
| GO:1902187 | 2e-04 | 18.1912 | 0.313 | 4 | 13 | negative regulation of viral release from host cell |
| GO:0002440 | 2e-04 | 3.505 | 4.0208 | 13 | 167 | production of molecular mediator of immune response |
| GO:1903039 | 2e-04 | 3.1534 | 5.1283 | 15 | 213 | positive regulation of leukocyte cell-cell adhesion |
| GO:0070374 | 3e-04 | 3.2326 | 4.6708 | 14 | 194 | positive regulation of ERK1 and ERK2 cascade |
| GO:0030593 | 3e-04 | 4.7031 | 2.1187 | 9 | 88 | neutrophil chemotaxis |
| GO:0050921 | 3e-04 | 3.8923 | 3.0818 | 11 | 128 | positive regulation of chemotaxis |
| GO:1903900 | 3e-04 | 3.8923 | 3.0818 | 11 | 128 | regulation of viral life cycle |
| GO:0090196 | 3e-04 | 16.3711 | 0.3371 | 4 | 14 | regulation of chemokine secretion |
| GO:0022408 | 3e-04 | 3.5527 | 3.6596 | 12 | 152 | negative regulation of cell-cell adhesion |
| GO:0050715 | 3e-04 | 4.5303 | 2.1894 | 9 | 92 | positive regulation of cytokine secretion |
| GO:0032692 | 3e-04 | 9.7631 | 0.626 | 5 | 26 | negative regulation of interleukin-1 production |
| GO:0002793 | 3e-04 | 2.8721 | 5.9709 | 16 | 248 | positive regulation of peptide secretion |
| GO:0033993 | 4e-04 | 1.9186 | 21.1872 | 38 | 880 | response to lipid |
| GO:0002313 | 4e-04 | 14.8818 | 0.3611 | 4 | 15 | mature B cell differentiation involved in immune response |
| GO:2000484 | 4e-04 | 14.8818 | 0.3611 | 4 | 15 | positive regulation of interleukin-8 secretion |
| GO:0006954 | 4e-04 | 2.1961 | 12.6203 | 26 | 532 | inflammatory response |
| GO:0007249 | 4e-04 | 2.8106 | 6.0913 | 16 | 253 | I-kappaB kinase/NF-kappaB signaling |
| GO:0006950 | 5e-04 | 1.4766 | 86.7471 | 115 | 3603 | response to stress |
| GO:0097323 | 6e-04 | Inf | 0.0482 | 2 | 2 | B cell adhesion |
| GO:1904209 | 6e-04 | Inf | 0.0482 | 2 | 2 | positive regulation of chemokine (C-C motif) ligand 2 secretion |
| GO:2000458 | 6e-04 | Inf | 0.0482 | 2 | 2 | regulation of astrocyte chemotaxis |
| GO:0051251 | 6e-04 | 2.7287 | 6.2599 | 16 | 260 | positive regulation of lymphocyte activation |
| GO:0032101 | 6e-04 | 2.0514 | 15.0448 | 29 | 632 | regulation of response to external stimulus |
| GO:0050868 | 6e-04 | 4.172 | 2.3595 | 9 | 98 | negative regulation of T cell activation |
| GO:0016192 | 6e-04 | 1.6162 | 42.7596 | 64 | 1776 | vesicle-mediated transport |
| GO:0042116 | 6e-04 | 5.332 | 1.4687 | 7 | 61 | macrophage activation |
| GO:0072676 | 6e-04 | 6.4019 | 1.0698 | 6 | 45 | lymphocyte migration |
| GO:0048518 | 7e-04 | 1.4354 | 111.1394 | 140 | 4809 | positive regulation of biological process |
| GO:2000401 | 7e-04 | 6.3177 | 1.0834 | 6 | 45 | regulation of lymphocyte migration |
| GO:0007155 | 7e-04 | 1.8466 | 21.9748 | 38 | 937 | cell adhesion |
| GO:0043615 | 7e-04 | 24.501 | 0.1926 | 3 | 8 | astrocyte cell migration |
| GO:1902715 | 7e-04 | 24.501 | 0.1926 | 3 | 8 | positive regulation of interferon-gamma secretion |
| GO:0031348 | 7e-04 | 3.2059 | 4.0208 | 12 | 167 | negative regulation of defense response |
| GO:0002699 | 8e-04 | 3.1851 | 4.0448 | 12 | 168 | positive regulation of immune effector process |
| GO:0002521 | 8e-04 | 2.1991 | 11.0992 | 23 | 461 | leukocyte differentiation |
| GO:0051674 | 9e-04 | 1.6625 | 34.1643 | 53 | 1419 | localization of cell |
| GO:0060333 | 0.001 | 4.2785 | 2.0465 | 8 | 85 | interferon-gamma-mediated signaling pathway |
| GO:0002688 | 0.001 | 3.826 | 2.5521 | 9 | 106 | regulation of leukocyte chemotaxis |
| GO:0002369 | 0.0011 | 7.3191 | 0.7945 | 5 | 33 | T cell cytokine production |
| GO:0002374 | 0.0012 | 10.228 | 0.4815 | 4 | 20 | cytokine secretion involved in immune response |
| GO:0002819 | 0.0012 | 3.4403 | 3.1299 | 10 | 130 | regulation of adaptive immune response |
| GO:0090087 | 0.0012 | 1.8662 | 18.7555 | 33 | 779 | regulation of peptide transport |
| GO:0010818 | 0.0014 | 9.6258 | 0.5056 | 4 | 21 | T cell chemotaxis |
| GO:0032729 | 0.0014 | 5.3943 | 1.243 | 6 | 52 | positive regulation of interferon-gamma production |
| GO:0050863 | 0.0015 | 2.7832 | 4.9696 | 13 | 210 | regulation of T cell activation |
| GO:0070201 | 0.0016 | 1.8301 | 19.0925 | 33 | 793 | regulation of establishment of protein localization |
| GO:0045576 | 0.0017 | 5.2397 | 1.276 | 6 | 53 | mast cell activation |
| GO:0002277 | 0.0017 | 81.4807 | 0.0722 | 2 | 3 | myeloid dendritic cell activation involved in immune response |
| GO:0071346 | 0.0019 | 5.1068 | 1.3039 | 6 | 55 | cellular response to interferon-gamma |
| GO:1903532 | 0.0019 | 2.2835 | 8.3304 | 18 | 346 | positive regulation of secretion by cell |
| GO:0002831 | 0.0019 | 5.085 | 1.3093 | 6 | 55 | regulation of response to biotic stimulus |
| GO:0016553 | 0.002 | 15.3102 | 0.2648 | 3 | 11 | base conversion or substitution editing |
| GO:0046133 | 0.002 | 15.3102 | 0.2648 | 3 | 11 | pyrimidine ribonucleoside catabolic process |
| GO:0032196 | 0.002 | 8.6115 | 0.5538 | 4 | 23 | transposition |
| GO:0043903 | 0.0021 | 2.6774 | 5.1523 | 13 | 214 | regulation of symbiosis, encompassing mutualism through parasitism |
| GO:0045785 | 0.0021 | 2.2038 | 9.1009 | 19 | 378 | positive regulation of cell adhesion |
| GO:0050710 | 0.0022 | 4.9244 | 1.3483 | 6 | 56 | negative regulation of cytokine secretion |
| GO:0031663 | 0.0022 | 6.0686 | 0.9325 | 5 | 39 | lipopolysaccharide-mediated signaling pathway |
| GO:2000406 | 0.0024 | 8.1804 | 0.5778 | 4 | 24 | positive regulation of T cell migration |
| GO:0048534 | 0.0025 | 1.7614 | 20.3927 | 34 | 847 | hematopoietic or lymphoid organ development |
| GO:0046651 | 0.0025 | 4.7903 | 1.3792 | 6 | 59 | lymphocyte proliferation |
| GO:0006909 | 0.0026 | 2.6116 | 5.2727 | 13 | 219 | phagocytosis |
| GO:0051924 | 0.0026 | 2.6116 | 5.2727 | 13 | 219 | regulation of calcium ion transport |
| GO:0032653 | 0.0026 | 5.8527 | 0.9631 | 5 | 40 | regulation of interleukin-10 production |
| GO:0002694 | 0.0027 | 2.3327 | 7.2396 | 16 | 309 | regulation of leukocyte activation |
| GO:2000147 | 0.0028 | 2.0598 | 10.7381 | 21 | 446 | positive regulation of cell motility |
| GO:0050778 | 0.0029 | 2.2433 | 7.9908 | 17 | 339 | positive regulation of immune response |
| GO:0001816 | 0.0031 | 5.5532 | 1.0022 | 5 | 45 | cytokine production |
| GO:0002292 | 0.0031 | 4.5584 | 1.4446 | 6 | 60 | T cell differentiation involved in immune response |
| GO:0032677 | 0.0031 | 4.5584 | 1.4446 | 6 | 60 | regulation of interleukin-8 production |
| GO:0046633 | 0.0033 | 7.4358 | 0.626 | 4 | 26 | alpha-beta T cell proliferation |
| GO:0031665 | 0.0033 | 12.2466 | 0.313 | 3 | 13 | negative regulation of lipopolysaccharide-mediated signaling pathway |
| GO:0032688 | 0.0033 | 12.2466 | 0.313 | 3 | 13 | negative regulation of interferon-beta production |
| GO:0035745 | 0.0033 | 12.2466 | 0.313 | 3 | 13 | T-helper 2 cell cytokine production |
| GO:1905050 | 0.0033 | 12.2466 | 0.313 | 3 | 13 | positive regulation of metallopeptidase activity |
| GO:0048386 | 0.0034 | 40.7378 | 0.0963 | 2 | 4 | positive regulation of retinoic acid receptor signaling pathway |
| GO:2000391 | 0.0034 | 40.7378 | 0.0963 | 2 | 4 | positive regulation of neutrophil extravasation |
| GO:0050900 | 0.0037 | 2.6051 | 4.8691 | 12 | 210 | leukocyte migration |
| GO:0002548 | 0.0037 | 5.33 | 1.0443 | 5 | 44 | monocyte chemotaxis |
| GO:0050718 | 0.0037 | 7.112 | 0.6501 | 4 | 27 | positive regulation of interleukin-1 beta secretion |
| GO:0042107 | 0.0038 | 3.392 | 2.528 | 8 | 105 | cytokine metabolic process |
| GO:0002704 | 0.004 | 5.2511 | 1.0594 | 5 | 44 | negative regulation of leukocyte mediated immunity |
| GO:0032760 | 0.004 | 4.3177 | 1.5168 | 6 | 63 | positive regulation of tumor necrosis factor production |
| GO:0002757 | 0.0041 | 1.9876 | 11.0992 | 21 | 461 | immune response-activating signal transduction |
| GO:0051607 | 0.0042 | 2.857 | 3.7136 | 10 | 156 | defense response to virus |
| GO:0035587 | 0.0043 | 6.8152 | 0.6741 | 4 | 28 | purinergic receptor signaling pathway |
| GO:0043304 | 0.0043 | 6.8152 | 0.6741 | 4 | 28 | regulation of mast cell degranulation |
| GO:0032418 | 0.0043 | 4.243 | 1.5409 | 6 | 64 | lysosome localization |
| GO:0051222 | 0.0044 | 1.9738 | 11.1714 | 21 | 464 | positive regulation of protein transport |
| GO:0070661 | 0.0044 | 4.2266 | 1.5439 | 6 | 66 | leukocyte proliferation |
| GO:0032743 | 0.0049 | 6.5422 | 0.6982 | 4 | 29 | positive regulation of interleukin-2 production |
| GO:0001817 | 0.005 | 2.5016 | 5.0566 | 12 | 221 | regulation of cytokine production |
| GO:0050729 | 0.0051 | 3.2247 | 2.6484 | 8 | 110 | positive regulation of inflammatory response |
| GO:0002449 | 0.0052 | 2.49 | 5.0801 | 12 | 211 | lymphocyte mediated immunity |
| GO:0042110 | 0.0053 | 2.945 | 3.2425 | 9 | 140 | T cell activation |
| GO:0030183 | 0.0054 | 3.1932 | 2.6725 | 8 | 111 | B cell differentiation |
| GO:0050688 | 0.0054 | 4.0336 | 1.6131 | 6 | 67 | regulation of defense response to virus |
| GO:0002309 | 0.0055 | 27.1568 | 0.1204 | 2 | 5 | T cell proliferation involved in immune response |
| GO:0018377 | 0.0055 | 27.1568 | 0.1204 | 2 | 5 | protein myristoylation |
| GO:0043308 | 0.0055 | 27.1568 | 0.1204 | 2 | 5 | eosinophil degranulation |
| GO:1901078 | 0.0055 | 27.1568 | 0.1204 | 2 | 5 | negative regulation of relaxation of muscle |
| GO:1901509 | 0.0055 | 27.1568 | 0.1204 | 2 | 5 | regulation of endothelial tube morphogenesis |
| GO:0002460 | 0.0056 | 2.9268 | 3.2631 | 9 | 137 | adaptive immune response based on somatic recombination of immune receptors built from immunoglobulin superfamily domains |
| GO:1903555 | 0.0057 | 3.1623 | 2.6966 | 8 | 112 | regulation of tumor necrosis factor superfamily cytokine production |
| GO:0042742 | 0.0058 | 2.3563 | 5.8024 | 13 | 241 | defense response to bacterium |
| GO:0008360 | 0.0059 | 2.8937 | 3.2985 | 9 | 137 | regulation of cell shape |
| GO:0071347 | 0.006 | 3.4627 | 2.1669 | 7 | 90 | cellular response to interleukin-1 |
| GO:0003159 | 0.0061 | 9.4187 | 0.3852 | 3 | 16 | morphogenesis of an endothelium |
| GO:0036037 | 0.0061 | 9.4187 | 0.3852 | 3 | 16 | CD8-positive, alpha-beta T cell activation |
| GO:0031347 | 0.0063 | 1.9061 | 11.5447 | 21 | 491 | regulation of defense response |
| GO:0034113 | 0.0063 | 4.6529 | 1.1797 | 5 | 49 | heterotypic cell-cell adhesion |
| GO:0046635 | 0.0063 | 4.6529 | 1.1797 | 5 | 49 | positive regulation of alpha-beta T cell activation |
| GO:0048583 | 0.0064 | 1.3803 | 70.54 | 90 | 3078 | regulation of response to stimulus |
| GO:0098657 | 0.0066 | 1.7485 | 16.1793 | 27 | 672 | import into cell |
| GO:0045089 | 0.0066 | 2.1041 | 7.9693 | 16 | 331 | positive regulation of innate immune response |
| GO:0050663 | 0.0067 | 5.8938 | 0.7613 | 4 | 33 | cytokine secretion |
| GO:0032722 | 0.0069 | 4.5492 | 1.2038 | 5 | 50 | positive regulation of chemokine production |
| GO:0045123 | 0.0069 | 4.5492 | 1.2038 | 5 | 50 | cellular extravasation |
| GO:0006959 | 0.0069 | 2.3926 | 5.2727 | 12 | 219 | humoral immune response |
| GO:0002710 | 0.0073 | 8.7454 | 0.4093 | 3 | 17 | negative regulation of T cell mediated immunity |
| GO:0045076 | 0.0073 | 8.7454 | 0.4093 | 3 | 17 | regulation of interleukin-2 biosynthetic process |
| GO:0002532 | 0.0075 | 4.45 | 1.2279 | 5 | 51 | production of molecular mediator involved in inflammatory response |
| GO:0045071 | 0.0075 | 4.45 | 1.2279 | 5 | 51 | negative regulation of viral genome replication |
| GO:0001818 | 0.0078 | 2.5959 | 4.0593 | 10 | 171 | negative regulation of cytokine production |
| GO:0035891 | 0.0078 | 5.6384 | 0.7945 | 4 | 33 | exit from host cell |
| GO:0052126 | 0.0078 | 5.6384 | 0.7945 | 4 | 33 | movement in host environment |
| GO:0072529 | 0.0078 | 5.6384 | 0.7945 | 4 | 33 | pyrimidine-containing compound catabolic process |
| GO:0022407 | 0.0079 | 2.2607 | 6.0308 | 13 | 256 | regulation of cell-cell adhesion |
| GO:0032479 | 0.0081 | 2.9615 | 2.8651 | 8 | 119 | regulation of type I interferon production |
| GO:0043307 | 0.0081 | 20.3663 | 0.1445 | 2 | 6 | eosinophil activation |
| GO:0070383 | 0.0081 | 20.3663 | 0.1445 | 2 | 6 | DNA cytosine deamination |
| GO:2000321 | 0.0081 | 20.3663 | 0.1445 | 2 | 6 | positive regulation of T-helper 17 cell differentiation |
| GO:0030814 | 0.0082 | 2.7424 | 3.467 | 9 | 144 | regulation of cAMP metabolic process |
| GO:0040012 | 0.0082 | 1.64 | 20.4408 | 32 | 849 | regulation of locomotion |
| GO:0071345 | 0.0085 | 1.7316 | 15.7145 | 26 | 674 | cellular response to cytokine stimulus |
| GO:0007259 | 0.0085 | 2.5575 | 4.1171 | 10 | 171 | JAK-STAT cascade |
| GO:0034143 | 0.0086 | 8.1619 | 0.4334 | 3 | 18 | regulation of toll-like receptor 4 signaling pathway |
| GO:0051048 | 0.0086 | 2.4245 | 4.7671 | 11 | 198 | negative regulation of secretion |
| GO:0007194 | 0.0087 | 5.4501 | 0.8186 | 4 | 34 | negative regulation of adenylate cyclase activity |
| GO:0034122 | 0.0087 | 5.4501 | 0.8186 | 4 | 34 | negative regulation of toll-like receptor signaling pathway |
| GO:0043902 | 0.0089 | 2.5416 | 4.1411 | 10 | 172 | positive regulation of multi-organism process |
| GO:0009967 | 0.0089 | 1.4849 | 34.7647 | 49 | 1451 | positive regulation of signal transduction |
| GO:0009187 | 0.009 | 2.4114 | 4.7912 | 11 | 199 | cyclic nucleotide metabolic process |
| GO:1901136 | 0.0092 | 2.5258 | 4.1652 | 10 | 173 | carbohydrate derivative catabolic process |
| GO:0002824 | 0.0099 | 3.5129 | 1.8298 | 6 | 76 | positive regulation of adaptive immune response based on somatic recombination of immune receptors built from immunoglobulin superfamily domains |
| GOMFID | Pvalue | OddsRatio | ExpCount | Count | Size | Term |
| GO:0002263 | 0 | 3.5322 | 15.3621 | 47 | 660 | cell activation involved in immune response |
| GO:0071216 | 0 | 6.0523 | 4.4457 | 23 | 191 | cellular response to biotic stimulus |
| GO:0045321 | 0 | 2.9515 | 14.8098 | 39 | 664 | leukocyte activation |
| GO:0071222 | 0 | 6.8481 | 2.5599 | 15 | 112 | cellular response to lipopolysaccharide |
| GO:0002237 | 0 | 3.8186 | 7.6112 | 26 | 327 | response to molecule of bacterial origin |
| GO:0045087 | 0 | 2.6878 | 18.2861 | 44 | 794 | innate immune response |
| GO:0001816 | 0 | 4.1841 | 5.8867 | 22 | 265 | cytokine production |
| GO:0002275 | 0 | 2.9554 | 11.949 | 32 | 516 | myeloid cell activation involved in immune response |
| GO:0002285 | 0 | 5.0361 | 3.5845 | 16 | 154 | lymphocyte activation involved in immune response |
| GO:0002444 | 0 | 2.9014 | 12.15 | 32 | 522 | myeloid leukocyte mediated immunity |
| GO:0032651 | 0 | 8.5935 | 1.3966 | 10 | 60 | regulation of interleukin-1 beta production |
| GO:0032692 | 0 | 15.7329 | 0.6052 | 7 | 26 | negative regulation of interleukin-1 production |
| GO:0090026 | 0 | 21.3038 | 0.419 | 6 | 18 | positive regulation of monocyte chemotaxis |
| GO:0050713 | 0 | 35.4245 | 0.256 | 5 | 11 | negative regulation of interleukin-1 beta secretion |
| GO:0050704 | 0 | 9.7773 | 1.0009 | 8 | 43 | regulation of interleukin-1 secretion |
| GO:0042119 | 0 | 2.7462 | 11.1026 | 28 | 477 | neutrophil activation |
| GO:0043312 | 0 | 2.6962 | 10.8698 | 27 | 467 | neutrophil degranulation |
| GO:0050670 | 0 | 3.8079 | 4.6086 | 16 | 198 | regulation of lymphocyte proliferation |
| GO:0050707 | 0 | 6.0971 | 1.8678 | 10 | 82 | regulation of cytokine secretion |
| GO:0050778 | 0 | 2.3662 | 15.5948 | 34 | 670 | positive regulation of immune response |
| GO:0045055 | 0 | 2.303 | 16.4793 | 35 | 708 | regulated exocytosis |
| GO:0070663 | 0 | 3.5884 | 4.8647 | 16 | 209 | regulation of leukocyte proliferation |
| GO:0071675 | 0 | 8.7836 | 0.9543 | 7 | 41 | regulation of mononuclear cell migration |
| GO:0060326 | 0 | 3.2138 | 6.075 | 18 | 261 | cell chemotaxis |
| GO:0051707 | 0 | 2.8932 | 7.8534 | 21 | 351 | response to other organism |
| GO:0006955 | 0 | 3.1765 | 6.1565 | 18 | 311 | immune response |
| GO:0070374 | 1e-04 | 3.6204 | 4.5155 | 15 | 194 | positive regulation of ERK1 and ERK2 cascade |
| GO:0032946 | 1e-04 | 4.3011 | 3.0724 | 12 | 132 | positive regulation of mononuclear cell proliferation |
| GO:0002682 | 1e-04 | 2.0651 | 20.4527 | 39 | 917 | regulation of immune system process |
| GO:0033993 | 1e-04 | 2.0548 | 20.4828 | 39 | 880 | response to lipid |
| GO:0050867 | 1e-04 | 2.9135 | 7.0293 | 19 | 302 | positive regulation of cell activation |
| GO:0070098 | 1e-04 | 5.4246 | 1.8621 | 9 | 80 | chemokine-mediated signaling pathway |
| GO:0071346 | 1e-04 | 4.0302 | 3.2586 | 12 | 140 | cellular response to interferon-gamma |
| GO:0002322 | 1e-04 | 63.44 | 0.1164 | 3 | 5 | B cell proliferation involved in immune response |
| GO:0032940 | 1e-04 | 2.2425 | 14.4125 | 30 | 654 | secretion by cell |
| GO:0002831 | 1e-04 | 4.2532 | 2.8397 | 11 | 122 | regulation of response to biotic stimulus |
| GO:0097530 | 1e-04 | 4.2532 | 2.8397 | 11 | 122 | granulocyte migration |
| GO:0042330 | 1e-04 | 2.3008 | 13.0578 | 28 | 561 | taxis |
| GO:0034097 | 1e-04 | 1.9714 | 22.4147 | 41 | 963 | response to cytokine |
| GO:1903039 | 1e-04 | 3.2691 | 4.9578 | 15 | 213 | positive regulation of leukocyte cell-cell adhesion |
| GO:0002440 | 1e-04 | 3.6329 | 3.8871 | 13 | 167 | production of molecular mediator of immune response |
| GO:1902187 | 2e-04 | 18.839 | 0.3026 | 4 | 13 | negative regulation of viral release from host cell |
| GO:0048525 | 2e-04 | 4.8728 | 2.0483 | 9 | 88 | negative regulation of viral process |
| GO:0002521 | 2e-04 | 2.393 | 10.7302 | 24 | 461 | leukocyte differentiation |
| GO:0002819 | 2e-04 | 3.9652 | 3.0259 | 11 | 130 | regulation of adaptive immune response |
| GO:0050900 | 3e-04 | 3.043 | 5.294 | 15 | 235 | leukocyte migration |
| GO:0050710 | 3e-04 | 6.0889 | 1.3034 | 7 | 56 | negative regulation of cytokine secretion |
| GO:0002313 | 3e-04 | 15.4118 | 0.3491 | 4 | 15 | mature B cell differentiation involved in immune response |
| GO:2000484 | 3e-04 | 15.4118 | 0.3491 | 4 | 15 | positive regulation of interleukin-8 secretion |
| GO:0050714 | 3e-04 | 3.0073 | 5.3534 | 15 | 230 | positive regulation of protein secretion |
| GO:0042102 | 4e-04 | 4.9842 | 1.7801 | 8 | 77 | positive regulation of T cell proliferation |
| GO:0051251 | 4e-04 | 2.8291 | 6.0517 | 16 | 260 | positive regulation of lymphocyte activation |
| GO:0032101 | 5e-04 | 2.032 | 16.2698 | 31 | 699 | regulation of response to external stimulus |
| GO:0002704 | 5e-04 | 6.7165 | 1.0241 | 6 | 44 | negative regulation of leukocyte mediated immunity |
| GO:0042116 | 5e-04 | 5.5234 | 1.4198 | 7 | 61 | macrophage activation |
| GO:0002687 | 5e-04 | 3.856 | 2.8164 | 10 | 121 | positive regulation of leukocyte migration |
| GO:0097323 | 5e-04 | Inf | 0.0466 | 2 | 2 | B cell adhesion |
| GO:2000458 | 5e-04 | Inf | 0.0466 | 2 | 2 | regulation of astrocyte chemotaxis |
| GO:0072676 | 5e-04 | 6.6162 | 1.0364 | 6 | 45 | lymphocyte migration |
| GO:0022407 | 6e-04 | 2.3522 | 9.4966 | 21 | 408 | regulation of cell-cell adhesion |
| GO:0051924 | 6e-04 | 2.9375 | 5.0974 | 14 | 219 | regulation of calcium ion transport |
| GO:0043615 | 6e-04 | 25.3712 | 0.1862 | 3 | 8 | astrocyte cell migration |
| GO:0044351 | 6e-04 | 25.3712 | 0.1862 | 3 | 8 | macropinocytosis |
| GO:1902715 | 6e-04 | 25.3712 | 0.1862 | 3 | 8 | positive regulation of interferon-gamma secretion |
| GO:0002695 | 7e-04 | 3.4152 | 3.4681 | 11 | 149 | negative regulation of leukocyte activation |
| GO:0022610 | 8e-04 | 1.7083 | 30.7474 | 49 | 1321 | biological adhesion |
| GO:0023052 | 8e-04 | 1.457 | 99.1002 | 126 | 4480 | signaling |
| GO:1903900 | 8e-04 | 3.6256 | 2.9793 | 10 | 128 | regulation of viral life cycle |
| GO:0002791 | 9e-04 | 2.5227 | 7.1622 | 17 | 312 | regulation of peptide secretion |
| GO:0002369 | 9e-04 | 7.5804 | 0.7681 | 5 | 33 | T cell cytokine production |
| GO:0030593 | 0.001 | 4.2654 | 2.0483 | 8 | 88 | neutrophil chemotaxis |
| GO:0002374 | 0.001 | 10.5922 | 0.4655 | 4 | 20 | cytokine secretion involved in immune response |
| GO:0034122 | 0.0011 | 7.3186 | 0.7914 | 5 | 34 | negative regulation of toll-like receptor signaling pathway |
| GO:0002532 | 0.0011 | 5.6692 | 1.1871 | 6 | 51 | production of molecular mediator involved in inflammatory response |
| GO:0071347 | 0.0012 | 4.1608 | 2.0948 | 8 | 90 | cellular response to interleukin-1 |
| GO:0016192 | 0.0012 | 1.5873 | 41.3379 | 61 | 1776 | vesicle-mediated transport |
| GO:0032729 | 0.0012 | 5.5889 | 1.2013 | 6 | 52 | positive regulation of interferon-gamma production |
| GO:1903555 | 0.0012 | 3.7317 | 2.6069 | 9 | 112 | regulation of tumor necrosis factor superfamily cytokine production |
| GO:0002757 | 0.0012 | 2.1711 | 10.7302 | 22 | 461 | immune response-activating signal transduction |
| GO:0031349 | 0.0012 | 2.4485 | 7.3633 | 17 | 321 | positive regulation of defense response |
| GO:0007166 | 0.0012 | 1.5796 | 43.2192 | 63 | 1969 | cell surface receptor signaling pathway |
| GO:0006954 | 0.0012 | 2.0912 | 12.1577 | 24 | 532 | inflammatory response |
| GO:0010818 | 0.0013 | 9.9685 | 0.4888 | 4 | 21 | T cell chemotaxis |
| GO:0002460 | 0.0013 | 3.4074 | 3.1529 | 10 | 137 | adaptive immune response based on somatic recombination of immune receptors built from immunoglobulin superfamily domains |
| GO:0035589 | 0.0013 | 18.12 | 0.2328 | 3 | 10 | G-protein coupled purinergic nucleotide receptor signaling pathway |
| GO:0051047 | 0.0014 | 2.2986 | 8.7517 | 19 | 376 | positive regulation of secretion |
| GO:0002449 | 0.0014 | 2.8177 | 4.9112 | 13 | 211 | lymphocyte mediated immunity |
| GO:0048534 | 0.0014 | 1.8295 | 19.7147 | 34 | 847 | hematopoietic or lymphoid organ development |
| GO:0002277 | 0.0016 | 84.367 | 0.0698 | 2 | 3 | myeloid dendritic cell activation involved in immune response |
| GO:0016553 | 0.0018 | 15.854 | 0.256 | 3 | 11 | base conversion or substitution editing |
| GO:0046133 | 0.0018 | 15.854 | 0.256 | 3 | 11 | pyrimidine ribonucleoside catabolic process |
| GO:0072672 | 0.0018 | 15.854 | 0.256 | 3 | 11 | neutrophil extravasation |
| GO:0032479 | 0.0019 | 3.4927 | 2.7698 | 9 | 119 | regulation of type I interferon production |
| GO:0006959 | 0.0019 | 2.7068 | 5.0974 | 13 | 219 | humoral immune response |
| GO:0031663 | 0.0019 | 6.287 | 0.9013 | 5 | 39 | lipopolysaccharide-mediated signaling pathway |
| GO:0030814 | 0.002 | 3.1895 | 3.3517 | 10 | 144 | regulation of cAMP metabolic process |
| GO:0046651 | 0.0021 | 4.9694 | 1.3314 | 6 | 59 | lymphocyte proliferation |
| GO:2000406 | 0.0021 | 8.4717 | 0.5586 | 4 | 24 | positive regulation of T cell migration |
| GO:0007154 | 0.0022 | 1.4069 | 99.6566 | 124 | 4507 | cell communication |
| GO:0051607 | 0.0022 | 2.6546 | 5.1905 | 13 | 223 | defense response to virus |
| GO:0090197 | 0.0024 | 14.0916 | 0.2793 | 3 | 12 | positive regulation of chemokine secretion |
| GO:1901136 | 0.0025 | 2.9048 | 4.0267 | 11 | 173 | carbohydrate derivative catabolic process |
| GO:0009187 | 0.0025 | 2.7483 | 4.6319 | 12 | 199 | cyclic nucleotide metabolic process |
| GO:0002292 | 0.0027 | 4.7216 | 1.3966 | 6 | 60 | T cell differentiation involved in immune response |
| GO:0032677 | 0.0027 | 4.7216 | 1.3966 | 6 | 60 | regulation of interleukin-8 production |
| GO:0071310 | 0.0028 | 1.4685 | 55.0009 | 75 | 2363 | cellular response to organic substance |
| GO:1903531 | 0.0028 | 2.8514 | 4.0966 | 11 | 176 | negative regulation of secretion by cell |
| GO:0010647 | 0.0029 | 1.5578 | 36.9388 | 54 | 1587 | positive regulation of cell communication |
| GO:0050863 | 0.0029 | 2.575 | 5.3393 | 13 | 232 | regulation of T cell activation |
| GO:0002218 | 0.0029 | 2.3863 | 6.6336 | 15 | 285 | activation of innate immune response |
| GO:0031665 | 0.003 | 12.6816 | 0.3026 | 3 | 13 | negative regulation of lipopolysaccharide-mediated signaling pathway |
| GO:0032688 | 0.003 | 12.6816 | 0.3026 | 3 | 13 | negative regulation of interferon-beta production |
| GO:0035745 | 0.003 | 12.6816 | 0.3026 | 3 | 13 | T-helper 2 cell cytokine production |
| GO:0050921 | 0.0031 | 3.2267 | 2.9793 | 9 | 128 | positive regulation of chemotaxis |
| GO:0023056 | 0.0031 | 1.5511 | 37.0784 | 54 | 1593 | positive regulation of signaling |
| GO:0042107 | 0.0031 | 3.5141 | 2.444 | 8 | 105 | cytokine metabolic process |
| GO:0048386 | 0.0031 | 42.1809 | 0.0931 | 2 | 4 | positive regulation of retinoic acid receptor signaling pathway |
| GO:0002548 | 0.0032 | 5.5233 | 1.009 | 5 | 44 | monocyte chemotaxis |
| GO:0050718 | 0.0033 | 7.3653 | 0.6284 | 4 | 27 | positive regulation of interleukin-1 beta secretion |
| GO:0002688 | 0.0033 | 3.478 | 2.4672 | 8 | 106 | regulation of leukocyte chemotaxis |
| GO:0048870 | 0.0034 | 1.5755 | 33.0284 | 49 | 1419 | cell motility |
| GO:0045785 | 0.0034 | 2.1531 | 8.7983 | 18 | 378 | positive regulation of cell adhesion |
| GO:0032760 | 0.0034 | 4.4723 | 1.4664 | 6 | 63 | positive regulation of tumor necrosis factor production |
| GO:0045824 | 0.0034 | 5.4386 | 1.0241 | 5 | 44 | negative regulation of innate immune response |
| GO:0070661 | 0.0037 | 4.3846 | 1.4904 | 6 | 66 | leukocyte proliferation |
| GO:2000401 | 0.0038 | 5.3023 | 1.0474 | 5 | 45 | regulation of lymphocyte migration |
| GO:0043900 | 0.0039 | 2.8851 | 3.6769 | 10 | 161 | regulation of multi-organism process |
| GO:0051049 | 0.004 | 1.504 | 41.8034 | 59 | 1796 | regulation of transport |
| GO:0009306 | 0.0042 | 2.3648 | 6.2352 | 14 | 275 | protein secretion |
| GO:0050729 | 0.0042 | 3.3408 | 2.5603 | 8 | 110 | positive regulation of inflammatory response |
| GO:0098657 | 0.0043 | 1.8148 | 15.6414 | 27 | 672 | import into cell |
| GO:0032743 | 0.0043 | 6.7752 | 0.675 | 4 | 29 | positive regulation of interleukin-2 production |
| GO:0030183 | 0.0044 | 3.3081 | 2.5836 | 8 | 111 | B cell differentiation |
| GO:0043903 | 0.0045 | 2.5418 | 4.981 | 12 | 214 | regulation of symbiosis, encompassing mutualism through parasitism |
| GO:0042110 | 0.0045 | 3.0311 | 3.1547 | 9 | 140 | T cell activation |
| GO:0035556 | 0.0046 | 1.42 | 60.5638 | 80 | 2602 | intracellular signal transduction |
| GO:0032695 | 0.0046 | 10.5667 | 0.3491 | 3 | 15 | negative regulation of interleukin-12 production |
| GO:0008360 | 0.0048 | 2.9981 | 3.1888 | 9 | 137 | regulation of cell shape |
| GO:0002694 | 0.005 | 2.2365 | 7.0476 | 15 | 309 | regulation of leukocyte activation |
| GO:0002309 | 0.0052 | 28.1188 | 0.1164 | 2 | 5 | T cell proliferation involved in immune response |
| GO:0043308 | 0.0052 | 28.1188 | 0.1164 | 2 | 5 | eosinophil degranulation |
| GO:0048550 | 0.0052 | 28.1188 | 0.1164 | 2 | 5 | negative regulation of pinocytosis |
| GO:1901078 | 0.0052 | 28.1188 | 0.1164 | 2 | 5 | negative regulation of relaxation of muscle |
| GO:1901509 | 0.0052 | 28.1188 | 0.1164 | 2 | 5 | regulation of endothelial tube morphogenesis |
| GO:0006909 | 0.0053 | 2.4796 | 5.0974 | 12 | 219 | phagocytosis |
| GO:0001819 | 0.0054 | 2.2156 | 7.1088 | 15 | 313 | positive regulation of cytokine production |
| GO:1903530 | 0.0055 | 1.9664 | 10.6691 | 20 | 467 | regulation of secretion by cell |
| GO:0003159 | 0.0056 | 9.7532 | 0.3724 | 3 | 16 | morphogenesis of an endothelium |
| GO:0036037 | 0.0056 | 9.7532 | 0.3724 | 3 | 16 | CD8-positive, alpha-beta T cell activation |
| GO:0060457 | 0.0056 | 9.7532 | 0.3724 | 3 | 16 | negative regulation of digestive system process |
| GO:0006950 | 0.0057 | 1.3595 | 83.8629 | 105 | 3603 | response to stress |
| GO:0051241 | 0.0058 | 1.625 | 23.9773 | 37 | 1040 | negative regulation of multicellular organismal process |
| GO:0002699 | 0.006 | 2.7009 | 3.9103 | 10 | 168 | positive regulation of immune effector process |
| GO:0070201 | 0.0062 | 1.7059 | 18.4578 | 30 | 793 | regulation of establishment of protein localization |
| GO:0002710 | 0.0067 | 9.056 | 0.3957 | 3 | 17 | negative regulation of T cell mediated immunity |
| GO:0007259 | 0.0068 | 2.65 | 3.9802 | 10 | 171 | JAK-STAT cascade |
| GO:0035891 | 0.0069 | 5.8392 | 0.7681 | 4 | 33 | exit from host cell |
| GO:0052126 | 0.0069 | 5.8392 | 0.7681 | 4 | 33 | movement in host environment |
| GO:0072529 | 0.0069 | 5.8392 | 0.7681 | 4 | 33 | pyrimidine-containing compound catabolic process |
| GO:0002221 | 0.0074 | 2.6172 | 4.0267 | 10 | 173 | pattern recognition receptor signaling pathway |
| GO:0043307 | 0.0076 | 21.0878 | 0.1397 | 2 | 6 | eosinophil activation |
| GO:0070383 | 0.0076 | 21.0878 | 0.1397 | 2 | 6 | DNA cytosine deamination |
| GO:0090186 | 0.0076 | 21.0878 | 0.1397 | 2 | 6 | regulation of pancreatic juice secretion |
| GO:2000321 | 0.0076 | 21.0878 | 0.1397 | 2 | 6 | positive regulation of T-helper 17 cell differentiation |
| GO:0045576 | 0.0076 | 4.4163 | 1.2336 | 5 | 53 | mast cell activation |
| GO:0007194 | 0.0077 | 5.6442 | 0.7914 | 4 | 34 | negative regulation of adenylate cyclase activity |
| GO:0002792 | 0.0077 | 2.9868 | 2.8397 | 8 | 122 | negative regulation of peptide secretion |
| GO:0019221 | 0.0078 | 1.8363 | 12.536 | 22 | 549 | cytokine-mediated signaling pathway |
| GO:0034143 | 0.0079 | 8.4517 | 0.419 | 3 | 18 | regulation of toll-like receptor 4 signaling pathway |
| GO:0051224 | 0.0084 | 2.4334 | 4.7483 | 11 | 204 | negative regulation of protein transport |
| GO:0002824 | 0.0085 | 3.6387 | 1.769 | 6 | 76 | positive regulation of adaptive immune response based on somatic recombination of immune receptors built from immunoglobulin superfamily domains |
| GO:0046634 | 0.0085 | 3.6387 | 1.769 | 6 | 76 | regulation of alpha-beta T cell activation |
| GO:0016525 | 0.0088 | 3.1992 | 2.3276 | 7 | 100 | negative regulation of angiogenesis |
| GO:0043124 | 0.0089 | 4.2391 | 1.2802 | 5 | 55 | negative regulation of I-kappaB kinase/NF-kappaB signaling |
| GO:0098542 | 0.0092 | 2.2997 | 5.4692 | 12 | 240 | defense response to other organism |
| GO:0010529 | 0.0092 | 7.923 | 0.4422 | 3 | 19 | negative regulation of transposition |
| GO:0046641 | 0.0092 | 7.923 | 0.4422 | 3 | 19 | positive regulation of alpha-beta T cell proliferation |
| GO:0030100 | 0.0093 | 2.3957 | 4.8181 | 11 | 207 | regulation of endocytosis |
| GO:0050829 | 0.0096 | 3.5372 | 1.8155 | 6 | 78 | defense response to Gram-negative bacterium |
| GOMFID | Pvalue | OddsRatio | ExpCount | Count | Size | Term |
| GO:0007156 | 0 | 7.5825 | 2.2837 | 15 | 152 | homophilic cell adhesion via plasma membrane adhesion molecules |
| GO:1901623 | 2e-04 | 15.6657 | 0.3155 | 4 | 21 | regulation of lymphocyte chemotaxis |
| GO:0002548 | 3e-04 | 7.1759 | 0.9315 | 6 | 62 | monocyte chemotaxis |
| GO:0030593 | 4e-04 | 5.8033 | 1.3222 | 7 | 88 | neutrophil chemotaxis |
| GO:1903427 | 5e-04 | 12.6786 | 0.3756 | 4 | 25 | negative regulation of reactive oxygen species biosynthetic process |
| GO:0097530 | 5e-04 | 4.7226 | 1.833 | 8 | 122 | granulocyte migration |
| GO:0003095 | 7e-04 | 132.1901 | 0.0451 | 2 | 3 | pressure natriuresis |
| GO:0019249 | 7e-04 | 132.1901 | 0.0451 | 2 | 3 | lactate biosynthetic process |
| GO:2000502 | 7e-04 | 132.1901 | 0.0451 | 2 | 3 | negative regulation of natural killer cell chemotaxis |
| GO:0098609 | 7e-04 | 2.1991 | 11.7192 | 24 | 780 | cell-cell adhesion |
| GO:0016339 | 8e-04 | 11.0917 | 0.4207 | 4 | 28 | calcium-dependent cell-cell adhesion via plasma membrane cell adhesion molecules |
| GO:0070098 | 0.0013 | 5.4243 | 1.202 | 6 | 80 | chemokine-mediated signaling pathway |
| GO:0036101 | 0.0013 | 66.0909 | 0.0601 | 2 | 4 | leukotriene B4 catabolic process |
| GO:1901668 | 0.0013 | 66.0909 | 0.0601 | 2 | 4 | regulation of superoxide dismutase activity |
| GO:0090280 | 0.0016 | 15.3045 | 0.2404 | 3 | 16 | positive regulation of calcium ion import |
| GO:0060326 | 0.002 | 2.9735 | 3.9214 | 11 | 261 | cell chemotaxis |
| GO:0006032 | 0.0022 | 44.0579 | 0.0751 | 2 | 5 | chitin catabolic process |
| GO:0075525 | 0.0022 | 44.0579 | 0.0751 | 2 | 5 | viral translational termination-reinitiation |
| GO:1901523 | 0.0022 | 44.0579 | 0.0751 | 2 | 5 | icosanoid catabolic process |
| GO:2000138 | 0.0032 | 33.0413 | 0.0901 | 2 | 6 | positive regulation of cell proliferation involved in heart morphogenesis |
| GO:0042742 | 0.0036 | 2.9165 | 3.6209 | 10 | 241 | defense response to bacterium |
| GO:0046697 | 0.0036 | 11.0498 | 0.3155 | 3 | 21 | decidualization |
| GO:0030728 | 0.0042 | 10.4676 | 0.3305 | 3 | 22 | ovulation |
| GO:0001906 | 0.0045 | 3.6329 | 2.0433 | 7 | 136 | cell killing |
| GO:0036302 | 0.0045 | 26.4314 | 0.1052 | 2 | 7 | atrioventricular canal development |
| GO:0048733 | 0.0045 | 26.4314 | 0.1052 | 2 | 7 | sebaceous gland development |
| GO:1901299 | 0.0059 | 22.0248 | 0.1202 | 2 | 8 | negative regulation of hydrogen peroxide-mediated programmed cell death |
| GO:1903862 | 0.0059 | 22.0248 | 0.1202 | 2 | 8 | positive regulation of oxidative phosphorylation |
| GO:0006140 | 0.0064 | 2.6699 | 3.9365 | 10 | 262 | regulation of nucleotide metabolic process |
| GO:0044703 | 0.0065 | 1.8277 | 13.8978 | 24 | 925 | multi-organism reproductive process |
| GO:0019369 | 0.0067 | 5.779 | 0.7512 | 4 | 50 | arachidonic acid metabolic process |
| GO:0045682 | 0.0067 | 4.5013 | 1.1869 | 5 | 79 | regulation of epidermis development |
| GO:0045671 | 0.0067 | 8.645 | 0.3906 | 3 | 26 | negative regulation of osteoclast differentiation |
| GO:0072676 | 0.0072 | 4.4173 | 1.2077 | 5 | 81 | lymphocyte migration |
| GO:0007267 | 0.0073 | 1.634 | 22.8675 | 35 | 1522 | cell-cell signaling |
| GO:0033234 | 0.0075 | 18.8772 | 0.1352 | 2 | 9 | negative regulation of protein sumoylation |
| GO:0060050 | 0.0075 | 18.8772 | 0.1352 | 2 | 9 | positive regulation of protein glycosylation |
| GO:2000402 | 0.0075 | 18.8772 | 0.1352 | 2 | 9 | negative regulation of lymphocyte migration |
| GO:0045087 | 0.0079 | 1.8435 | 12.5906 | 22 | 838 | innate immune response |
| GO:1902850 | 0.0081 | 3.6408 | 1.7429 | 6 | 116 | microtubule cytoskeleton organization involved in mitosis |
| GO:0046605 | 0.0082 | 5.4241 | 0.7963 | 4 | 53 | regulation of centrosome cycle |
| GO:0034219 | 0.0092 | 7.646 | 0.4357 | 3 | 29 | carbohydrate transmembrane transport |
| GO:0090322 | 0.0092 | 7.646 | 0.4357 | 3 | 29 | regulation of superoxide metabolic process |
| GO:0042267 | 0.0093 | 5.2108 | 0.8264 | 4 | 55 | natural killer cell mediated cytotoxicity |
| GO:1903578 | 0.0095 | 4.1105 | 1.2921 | 5 | 86 | regulation of ATP metabolic process |
| GO:0002687 | 0.0099 | 3.4814 | 1.818 | 6 | 121 | positive regulation of leukocyte migration |
| GO:0034308 | 0.0099 | 5.1103 | 0.8414 | 4 | 56 | primary alcohol metabolic process |
| GOMFID | Pvalue | OddsRatio | ExpCount | Count | Size | Term |
| GO:0007389 | 0 | 3.2519 | 9.8724 | 29 | 409 | pattern specification process |
| GO:0009954 | 0 | 11.9879 | 0.7483 | 7 | 31 | proximal/distal pattern formation |
| GO:0048568 | 0 | 2.8532 | 9.9207 | 26 | 411 | embryonic organ development |
| GO:0060173 | 0 | 4.0283 | 4.1034 | 15 | 170 | limb development |
| GO:0009887 | 0 | 2.1067 | 23.269 | 45 | 964 | animal organ morphogenesis |
| GO:0007399 | 0 | 2.3135 | 15.5172 | 33 | 689 | nervous system development |
| GO:0022008 | 1e-04 | 1.8381 | 34.4207 | 58 | 1426 | neurogenesis |
| GO:0048598 | 1e-04 | 2.3403 | 13.8069 | 30 | 572 | embryonic morphogenesis |
| GO:0048557 | 1e-04 | 14.6124 | 0.4586 | 5 | 19 | embryonic digestive tract morphogenesis |
| GO:0048704 | 1e-04 | 5.0332 | 2.2207 | 10 | 92 | embryonic skeletal system morphogenesis |
| GO:0045944 | 2e-04 | 1.8793 | 25.7793 | 45 | 1068 | positive regulation of transcription from RNA polymerase II promoter |
| GO:0035107 | 2e-04 | 3.7313 | 3.5 | 12 | 145 | appendage morphogenesis |
| GO:0008589 | 2e-04 | 5.4819 | 1.6414 | 8 | 68 | regulation of smoothened signaling pathway |
| GO:0042330 | 2e-04 | 2.2103 | 13.5414 | 28 | 561 | taxis |
| GO:0007156 | 3e-04 | 3.5432 | 3.669 | 12 | 152 | homophilic cell adhesion via plasma membrane adhesion molecules |
| GO:0007218 | 5e-04 | 4.3068 | 2.2931 | 9 | 95 | neuropeptide signaling pathway |
| GO:0021510 | 5e-04 | 4.257 | 2.3172 | 9 | 96 | spinal cord development |
| GO:0072272 | 6e-04 | Inf | 0.0483 | 2 | 2 | proximal/distal pattern formation involved in metanephric nephron development |
| GO:0030182 | 6e-04 | 1.8758 | 21.0607 | 37 | 892 | neuron differentiation |
| GO:0001763 | 7e-04 | 3.072 | 4.5379 | 13 | 188 | morphogenesis of a branching structure |
| GO:0021522 | 8e-04 | 7.8623 | 0.7483 | 5 | 31 | spinal cord motor neuron differentiation |
| GO:0009792 | 9e-04 | 2.0734 | 13.3 | 26 | 551 | embryo development ending in birth or egg hatching |
| GO:0030326 | 0.001 | 3.5503 | 3.0414 | 10 | 126 | embryonic limb morphogenesis |
| GO:0010529 | 0.001 | 10.8818 | 0.4586 | 4 | 19 | negative regulation of transposition |
| GO:0071622 | 0.001 | 5.8497 | 1.1586 | 6 | 48 | regulation of granulocyte chemotaxis |
| GO:0007610 | 0.001 | 2.0572 | 13.3966 | 26 | 555 | behavior |
| GO:0050921 | 0.0011 | 3.4897 | 3.0897 | 10 | 128 | positive regulation of chemotaxis |
| GO:0007519 | 0.0012 | 3.2162 | 3.669 | 11 | 152 | skeletal muscle tissue development |
| GO:1902667 | 0.0012 | 10.201 | 0.4828 | 4 | 20 | regulation of axon guidance |
| GO:0009952 | 0.0012 | 3.4345 | 3.1333 | 10 | 132 | anterior/posterior pattern specification |
| GO:0007267 | 0.0013 | 1.7984 | 21.8999 | 37 | 934 | cell-cell signaling |
| GO:0002009 | 0.0013 | 2.088 | 12.1655 | 24 | 504 | morphogenesis of an epithelium |
| GO:0001501 | 0.0013 | 2.1183 | 11.4897 | 23 | 476 | skeletal system development |
| GO:0007187 | 0.0013 | 2.9833 | 4.2966 | 12 | 178 | G-protein coupled receptor signaling pathway, coupled to cyclic nucleotide second messenger |
| GO:0001667 | 0.0014 | 2.3504 | 8.1103 | 18 | 336 | ameboidal-type cell migration |
| GO:1902622 | 0.0014 | 6.8122 | 0.8448 | 5 | 35 | regulation of neutrophil migration |
| GO:0043586 | 0.0014 | 9.6004 | 0.5069 | 4 | 21 | tongue development |
| GO:0072089 | 0.0016 | 3.5921 | 2.7034 | 9 | 112 | stem cell proliferation |
| GO:0051962 | 0.0016 | 2.1218 | 10.9586 | 22 | 454 | positive regulation of nervous system development |
| GO:0031328 | 0.0017 | 1.5604 | 41.8793 | 61 | 1735 | positive regulation of cellular biosynthetic process |
| GO:0002040 | 0.0017 | 3.9097 | 2.2207 | 8 | 92 | sprouting angiogenesis |
| GO:0021879 | 0.002 | 8.6661 | 0.5504 | 4 | 23 | forebrain neuron differentiation |
| GO:0048754 | 0.0025 | 3.0931 | 3.4517 | 10 | 143 | branching morphogenesis of an epithelial tube |
| GO:0001838 | 0.0025 | 3.3315 | 2.8966 | 9 | 120 | embryonic epithelial tube formation |
| GO:0010632 | 0.0026 | 2.7334 | 4.6586 | 12 | 193 | regulation of epithelial cell migration |
| GO:0003207 | 0.0026 | 13.5724 | 0.2897 | 3 | 12 | cardiac chamber formation |
| GO:0009653 | 0.0026 | 1.652 | 27.7426 | 43 | 1221 | anatomical structure morphogenesis |
| GO:0048869 | 0.0028 | 1.3745 | 97.5897 | 122 | 4043 | cellular developmental process |
| GO:0001756 | 0.0028 | 4.656 | 1.4172 | 6 | 59 | somitogenesis |
| GO:2000026 | 0.003 | 1.5106 | 43.8103 | 62 | 1815 | regulation of multicellular organismal development |
| GO:0042110 | 0.003 | 2.0442 | 10.8138 | 21 | 448 | T cell activation |
| GO:0006355 | 0.0032 | 1.3885 | 83.1552 | 106 | 3445 | regulation of transcription, DNA-templated |
| GO:0021884 | 0.0033 | 7.4161 | 0.6276 | 4 | 26 | forebrain neuron development |
| GO:0048935 | 0.0033 | 12.2144 | 0.3138 | 3 | 13 | peripheral nervous system neuron development |
| GO:0001757 | 0.0034 | 40.6308 | 0.0966 | 2 | 4 | somite specification |
| GO:0007198 | 0.0034 | 40.6308 | 0.0966 | 2 | 4 | adenylate cyclase-inhibiting serotonin receptor signaling pathway |
| GO:0008588 | 0.0034 | 40.6308 | 0.0966 | 2 | 4 | release of cytoplasmic sequestered NF-kappaB |
| GO:0043553 | 0.0034 | 40.6308 | 0.0966 | 2 | 4 | negative regulation of phosphatidylinositol 3-kinase activity |
| GO:0072086 | 0.0034 | 40.6308 | 0.0966 | 2 | 4 | specification of loop of Henle identity |
| GO:1903508 | 0.0034 | 1.5723 | 33.0448 | 49 | 1369 | positive regulation of nucleic acid-templated transcription |
| GO:0007275 | 0.0039 | 1.4419 | 61.4764 | 81 | 2769 | multicellular organism development |
| GO:2001141 | 0.0041 | 1.3744 | 83.8069 | 106 | 3472 | regulation of RNA biosynthetic process |
| GO:0045666 | 0.0043 | 2.2129 | 7.6034 | 16 | 315 | positive regulation of neuron differentiation |
| GO:0007155 | 0.0043 | 1.5665 | 31.7414 | 47 | 1315 | cell adhesion |
| GO:0090023 | 0.0043 | 6.7973 | 0.6759 | 4 | 28 | positive regulation of neutrophil chemotaxis |
| GO:1902692 | 0.0043 | 6.7973 | 0.6759 | 4 | 28 | regulation of neuroblast proliferation |
| GO:0098916 | 0.0044 | 1.8562 | 14.1448 | 25 | 586 | anterograde trans-synaptic signaling |
| GO:0099536 | 0.0046 | 1.8494 | 14.1931 | 25 | 588 | synaptic signaling |
| GO:0060326 | 0.0046 | 2.3393 | 6.3 | 14 | 261 | cell chemotaxis |
| GO:0007189 | 0.0047 | 4.1597 | 1.569 | 6 | 65 | adenylate cyclase-activating G-protein coupled receptor signaling pathway |
| GO:0022604 | 0.005 | 2.0243 | 9.8483 | 19 | 408 | regulation of cell morphogenesis |
| GO:0046632 | 0.0051 | 3.5836 | 2.1 | 7 | 87 | alpha-beta T cell differentiation |
| GO:0010720 | 0.0051 | 1.9458 | 11.3207 | 21 | 469 | positive regulation of cell development |
| GO:0009889 | 0.0051 | 1.3373 | 104.8793 | 128 | 4345 | regulation of biosynthetic process |
| GO:0048667 | 0.0054 | 1.9037 | 12.1172 | 22 | 502 | cell morphogenesis involved in neuron differentiation |
| GO:0002568 | 0.0055 | 27.0855 | 0.1207 | 2 | 5 | somatic diversification of T cell receptor genes |
| GO:0033153 | 0.0055 | 27.0855 | 0.1207 | 2 | 5 | T cell receptor V(D)J recombination |
| GO:0045636 | 0.0055 | 27.0855 | 0.1207 | 2 | 5 | positive regulation of melanocyte differentiation |
| GO:0060012 | 0.0055 | 27.0855 | 0.1207 | 2 | 5 | synaptic transmission, glycinergic |
| GO:0060437 | 0.0055 | 27.0855 | 0.1207 | 2 | 5 | lung growth |
| GO:0061056 | 0.0055 | 27.0855 | 0.1207 | 2 | 5 | sclerotome development |
| GO:0071502 | 0.0055 | 27.0855 | 0.1207 | 2 | 5 | cellular response to temperature stimulus |
| GO:0061564 | 0.0058 | 1.9558 | 10.7172 | 20 | 444 | axon development |
| GO:0030198 | 0.0059 | 2.1329 | 7.869 | 16 | 326 | extracellular matrix organization |
| GO:0014033 | 0.0059 | 3.9577 | 1.6414 | 6 | 68 | neural crest cell differentiation |
| GO:0019935 | 0.0061 | 3.1236 | 2.7276 | 8 | 113 | cyclic-nucleotide-mediated signaling |
| GO:0036037 | 0.0062 | 9.3939 | 0.3862 | 3 | 16 | CD8-positive, alpha-beta T cell activation |
| GO:0048858 | 0.0067 | 1.8106 | 13.8793 | 24 | 575 | cell projection morphogenesis |
| GO:0048870 | 0.0068 | 1.5097 | 34.2517 | 49 | 1419 | cell motility |
| GO:0007605 | 0.0069 | 2.8193 | 3.3793 | 9 | 140 | sensory perception of sound |
| GO:0010557 | 0.0071 | 1.478 | 38.6207 | 54 | 1600 | positive regulation of macromolecule biosynthetic process |
| GO:0035148 | 0.0073 | 2.7978 | 3.4034 | 9 | 141 | tube formation |
| GO:0050772 | 0.0073 | 3.7743 | 1.7138 | 6 | 71 | positive regulation of axonogenesis |
| GO:0007420 | 0.0077 | 1.7448 | 15.5931 | 26 | 646 | brain development |
| GO:0097485 | 0.0078 | 2.3516 | 5.3586 | 12 | 222 | neuron projection guidance |
| GO:0050931 | 0.0079 | 5.6235 | 0.7966 | 4 | 33 | pigment cell differentiation |
| GO:0090132 | 0.0079 | 2.2594 | 6.0345 | 13 | 250 | epithelium migration |
| GO:0003180 | 0.0082 | 20.3128 | 0.1448 | 2 | 6 | aortic valve morphogenesis |
| GO:0021861 | 0.0082 | 20.3128 | 0.1448 | 2 | 6 | forebrain radial glial cell differentiation |
| GO:0046113 | 0.0082 | 20.3128 | 0.1448 | 2 | 6 | nucleobase catabolic process |
| GO:0061218 | 0.0082 | 20.3128 | 0.1448 | 2 | 6 | negative regulation of mesonephros development |
| GO:0010596 | 0.0082 | 4.3436 | 1.2552 | 5 | 52 | negative regulation of endothelial cell migration |
| GO:0051272 | 0.0082 | 1.8871 | 11.0793 | 20 | 459 | positive regulation of cellular component movement |
| GO:0030814 | 0.0083 | 2.7351 | 3.4759 | 9 | 144 | regulation of cAMP metabolic process |
| GO:0021536 | 0.0083 | 3.6612 | 1.7621 | 6 | 73 | diencephalon development |
| GO:0019219 | 0.0087 | 1.318 | 97.0586 | 118 | 4021 | regulation of nucleobase-containing compound metabolic process |
| GO:1901881 | 0.0087 | 8.1404 | 0.4345 | 3 | 18 | positive regulation of protein depolymerization |
| GO:0034394 | 0.0089 | 4.2528 | 1.2793 | 5 | 53 | protein localization to cell surface |
| GO:0051254 | 0.0089 | 1.4847 | 34.7586 | 49 | 1440 | positive regulation of RNA metabolic process |
| GO:0021761 | 0.0091 | 3.1834 | 2.3414 | 7 | 97 | limbic system development |
| GO:1904591 | 0.0091 | 3.1834 | 2.3414 | 7 | 97 | positive regulation of protein import |
| GO:0035295 | 0.0097 | 1.7738 | 13.5414 | 23 | 561 | tube development |
| GOMFID | Pvalue | OddsRatio | ExpCount | Count | Size | Term |
| GO:0007268 | 0 | 2.7171 | 13.7479 | 34 | 586 | chemical synaptic transmission |
| GO:0099537 | 0 | 2.7069 | 13.7948 | 34 | 588 | trans-synaptic signaling |
| GO:0050767 | 0 | 2.3338 | 15.789 | 34 | 673 | regulation of neurogenesis |
| GO:0019098 | 1e-04 | 10.5567 | 0.7038 | 6 | 30 | reproductive behavior |
| GO:0007156 | 1e-04 | 3.9952 | 3.566 | 13 | 152 | homophilic cell adhesion via plasma membrane adhesion molecules |
| GO:0007267 | 1e-04 | 1.9575 | 25.5355 | 46 | 1117 | cell-cell signaling |
| GO:0007218 | 1e-04 | 5.0021 | 2.2288 | 10 | 95 | neuropeptide signaling pathway |
| GO:0009887 | 1e-04 | 2.0072 | 22.616 | 42 | 964 | animal organ morphogenesis |
| GO:0040012 | 1e-04 | 2.0556 | 19.918 | 38 | 849 | regulation of locomotion |
| GO:0048665 | 1e-04 | 9.3819 | 0.7742 | 6 | 33 | neuron fate specification |
| GO:0035295 | 2e-04 | 2.2808 | 13.1614 | 28 | 561 | tube development |
| GO:0022610 | 2e-04 | 1.8172 | 30.9914 | 52 | 1321 | biological adhesion |
| GO:0051962 | 2e-04 | 2.4122 | 10.6511 | 24 | 454 | positive regulation of nervous system development |
| GO:0060914 | 2e-04 | 11.0862 | 0.5631 | 5 | 24 | heart formation |
| GO:0048870 | 2e-04 | 1.949 | 22.1164 | 40 | 973 | cell motility |
| GO:0007411 | 2e-04 | 3.1295 | 5.1613 | 15 | 220 | axon guidance |
| GO:0021891 | 2e-04 | 41.9471 | 0.1408 | 3 | 6 | olfactory bulb interneuron development |
| GO:0048869 | 3e-04 | 1.4881 | 94.8512 | 125 | 4043 | cellular developmental process |
| GO:0010720 | 3e-04 | 2.3286 | 11.003 | 24 | 469 | positive regulation of cell development |
| GO:0001764 | 3e-04 | 3.8035 | 3.1437 | 11 | 134 | neuron migration |
| GO:0002009 | 4e-04 | 2.2548 | 11.8241 | 25 | 504 | morphogenesis of an epithelium |
| GO:0035385 | 4e-04 | 31.4583 | 0.1642 | 3 | 7 | Roundabout signaling pathway |
| GO:0060017 | 4e-04 | 31.4583 | 0.1642 | 3 | 7 | parathyroid gland development |
| GO:0021953 | 4e-04 | 4.9055 | 1.8059 | 8 | 78 | central nervous system neuron differentiation |
| GO:0007416 | 4e-04 | 3.6537 | 3.261 | 11 | 139 | synapse assembly |
| GO:0045666 | 5e-04 | 2.5982 | 7.3901 | 18 | 315 | positive regulation of neuron differentiation |
| GO:0051270 | 5e-04 | 1.9064 | 20.1526 | 36 | 859 | regulation of cellular component movement |
| GO:0021823 | 5e-04 | Inf | 0.0469 | 2 | 2 | cerebral cortex tangential migration using cell-cell interactions |
| GO:0021836 | 5e-04 | Inf | 0.0469 | 2 | 2 | chemorepulsion involved in postnatal olfactory bulb interneuron migration |
| GO:0050925 | 5e-04 | Inf | 0.0469 | 2 | 2 | negative regulation of negative chemotaxis |
| GO:0072272 | 5e-04 | Inf | 0.0469 | 2 | 2 | proximal/distal pattern formation involved in metanephric nephron development |
| GO:0097112 | 5e-04 | Inf | 0.0469 | 2 | 2 | gamma-aminobutyric acid receptor clustering |
| GO:0003002 | 7e-04 | 2.5957 | 6.9746 | 17 | 300 | regionalization |
| GO:0048812 | 7e-04 | 2.11 | 13.091 | 26 | 558 | neuron projection morphogenesis |
| GO:0060322 | 8e-04 | 1.9903 | 16.0236 | 30 | 683 | head development |
| GO:0006935 | 8e-04 | 2.0978 | 13.1614 | 26 | 561 | chemotaxis |
| GO:0098609 | 8e-04 | 1.9184 | 18.2993 | 33 | 780 | cell-cell adhesion |
| GO:0048667 | 8e-04 | 2.1632 | 11.7772 | 24 | 502 | cell morphogenesis involved in neuron differentiation |
| GO:2000026 | 9e-04 | 1.5952 | 42.581 | 63 | 1815 | regulation of multicellular organismal development |
| GO:0021879 | 0.001 | 5.885 | 1.1496 | 6 | 49 | forebrain neuron differentiation |
| GO:0060180 | 0.001 | 20.9696 | 0.2111 | 3 | 9 | female mating behavior |
| GO:0001667 | 0.001 | 2.4234 | 7.8828 | 18 | 336 | ameboidal-type cell migration |
| GO:0048858 | 0.0011 | 2.0424 | 13.4898 | 26 | 575 | cell projection morphogenesis |
| GO:0021515 | 0.0012 | 5.6228 | 1.1965 | 6 | 51 | cell differentiation in spinal cord |
| GO:0042220 | 0.0013 | 5.5002 | 1.22 | 6 | 52 | response to cocaine |
| GO:0009792 | 0.0013 | 2.0471 | 12.9268 | 25 | 551 | embryo development ending in birth or egg hatching |
| GO:0014003 | 0.0014 | 6.7896 | 0.8446 | 5 | 36 | oligodendrocyte development |
| GO:0015844 | 0.0015 | 4.5478 | 1.6892 | 7 | 72 | monoamine transport |
| GO:0060913 | 0.0016 | 83.6834 | 0.0704 | 2 | 3 | cardiac cell fate determination |
| GO:0061364 | 0.0016 | 83.6834 | 0.0704 | 2 | 3 | apoptotic process involved in luteolysis |
| GO:0002042 | 0.0016 | 6.577 | 0.868 | 5 | 37 | cell migration involved in sprouting angiogenesis |
| GO:0003151 | 0.0017 | 4.4115 | 1.7361 | 7 | 74 | outflow tract morphogenesis |
| GO:0009653 | 0.0017 | 1.6843 | 27.953 | 44 | 1251 | anatomical structure morphogenesis |
| GO:0030900 | 0.0018 | 2.2979 | 8.2816 | 18 | 353 | forebrain development |
| GO:0003264 | 0.0018 | 15.7252 | 0.2581 | 3 | 11 | regulation of cardioblast proliferation |
| GO:0050713 | 0.0018 | 15.7252 | 0.2581 | 3 | 11 | negative regulation of interleukin-1 beta secretion |
| GO:0007618 | 0.0018 | 6.3773 | 0.8915 | 5 | 38 | mating |
| GO:0045777 | 0.0018 | 6.3773 | 0.8915 | 5 | 38 | positive regulation of blood pressure |
| GO:0051966 | 0.0019 | 5.0589 | 1.3138 | 6 | 56 | regulation of synaptic transmission, glutamatergic |
| GO:0071495 | 0.002 | 1.6569 | 28.88 | 45 | 1231 | cellular response to endogenous stimulus |
| GO:0045597 | 0.0021 | 2.2061 | 9.0999 | 19 | 402 | positive regulation of cell differentiation |
| GO:0001964 | 0.0022 | 8.4027 | 0.5631 | 4 | 24 | startle response |
| GO:0021511 | 0.0022 | 8.4027 | 0.5631 | 4 | 24 | spinal cord patterning |
| GO:0015872 | 0.0023 | 6.0122 | 0.9384 | 5 | 40 | dopamine transport |
| GO:0010454 | 0.0024 | 13.9771 | 0.2815 | 3 | 12 | negative regulation of cell fate commitment |
| GO:0045992 | 0.0026 | 8.002 | 0.5865 | 4 | 25 | negative regulation of embryonic development |
| GO:0097756 | 0.0027 | 4.0474 | 1.8768 | 7 | 80 | negative regulation of blood vessel diameter |
| GO:0032501 | 0.0028 | 1.3863 | 111.9214 | 136 | 5034 | multicellular organismal process |
| GO:0033993 | 0.003 | 1.7388 | 20.6453 | 34 | 880 | response to lipid |
| GO:0001992 | 0.0032 | 41.8391 | 0.0938 | 2 | 4 | regulation of systemic arterial blood pressure by vasopressin |
| GO:0001994 | 0.0032 | 41.8391 | 0.0938 | 2 | 4 | norepinephrine-epinephrine vasoconstriction involved in regulation of systemic arterial blood pressure |
| GO:0003308 | 0.0032 | 41.8391 | 0.0938 | 2 | 4 | negative regulation of Wnt signaling pathway involved in heart development |
| GO:0006933 | 0.0032 | 41.8391 | 0.0938 | 2 | 4 | negative regulation of cell adhesion involved in substrate-bound cell migration |
| GO:0007621 | 0.0032 | 41.8391 | 0.0938 | 2 | 4 | negative regulation of female receptivity |
| GO:0031394 | 0.0032 | 41.8391 | 0.0938 | 2 | 4 | positive regulation of prostaglandin biosynthetic process |
| GO:0033600 | 0.0032 | 41.8391 | 0.0938 | 2 | 4 | negative regulation of mammary gland epithelial cell proliferation |
| GO:0042662 | 0.0032 | 41.8391 | 0.0938 | 2 | 4 | negative regulation of mesodermal cell fate specification |
| GO:0072086 | 0.0032 | 41.8391 | 0.0938 | 2 | 4 | specification of loop of Henle identity |
| GO:0072513 | 0.0032 | 41.8391 | 0.0938 | 2 | 4 | positive regulation of secondary heart field cardioblast proliferation |
| GO:1905903 | 0.0032 | 41.8391 | 0.0938 | 2 | 4 | negative regulation of mesoderm formation |
| GO:0021517 | 0.0032 | 5.5365 | 1.0088 | 5 | 43 | ventral spinal cord development |
| GO:0007187 | 0.0033 | 2.7935 | 4.176 | 11 | 178 | G-protein coupled receptor signaling pathway, coupled to cyclic nucleotide second messenger |
| GO:0023061 | 0.0034 | 2.1039 | 9.5015 | 19 | 405 | signal release |
| GO:0048791 | 0.0034 | 7.3053 | 0.6334 | 4 | 27 | calcium ion-regulated exocytosis of neurotransmitter |
| GO:0008015 | 0.0034 | 1.9847 | 11.6599 | 22 | 497 | blood circulation |
| GO:0001756 | 0.0035 | 4.4356 | 1.478 | 6 | 63 | somitogenesis |
| GO:0007612 | 0.0036 | 3.1468 | 3.0499 | 9 | 130 | learning |
| GO:0048864 | 0.0038 | 4.3589 | 1.5015 | 6 | 64 | stem cell development |
| GO:0003214 | 0.0038 | 11.4343 | 0.3284 | 3 | 14 | cardiac left ventricle morphogenesis |
| GO:0042711 | 0.0038 | 11.4343 | 0.3284 | 3 | 14 | maternal behavior |
| GO:0003018 | 0.004 | 2.881 | 3.6833 | 10 | 157 | vascular process in circulatory system |
| GO:0021954 | 0.0041 | 4.2847 | 1.5249 | 6 | 65 | central nervous system neuron development |
| GO:0061564 | 0.0042 | 2.0168 | 10.4165 | 20 | 444 | axon development |
| GO:0003008 | 0.0044 | 1.4784 | 45.4432 | 63 | 1937 | system process |
| GO:0050795 | 0.0045 | 4.2131 | 1.5484 | 6 | 66 | regulation of behavior |
| GO:0010594 | 0.0046 | 3.0209 | 3.1672 | 9 | 135 | regulation of endothelial cell migration |
| GO:0007379 | 0.0047 | 10.4808 | 0.3519 | 3 | 15 | segment specification |
| GO:0060579 | 0.0047 | 10.4808 | 0.3519 | 3 | 15 | ventral spinal cord interneuron fate commitment |
| GO:0006584 | 0.0047 | 5.0079 | 1.1026 | 5 | 47 | catecholamine metabolic process |
| GO:0050433 | 0.0047 | 5.0079 | 1.1026 | 5 | 47 | regulation of catecholamine secretion |
| GO:0010648 | 0.0048 | 1.5793 | 29.443 | 44 | 1255 | negative regulation of cell communication |
| GO:0007417 | 0.005 | 1.7907 | 15.8457 | 27 | 696 | central nervous system development |
| GO:0021988 | 0.005 | 6.4611 | 0.7038 | 4 | 30 | olfactory lobe development |
| GO:0023057 | 0.0051 | 1.5736 | 29.5369 | 44 | 1259 | negative regulation of signaling |
| GO:0032102 | 0.0051 | 2.3067 | 6.3813 | 14 | 272 | negative regulation of response to external stimulus |
| GO:0006811 | 0.0051 | 1.5242 | 35.449 | 51 | 1511 | ion transport |
| GO:0016199 | 0.0052 | 27.8909 | 0.1173 | 2 | 5 | axon midline choice point recognition |
| GO:0022028 | 0.0052 | 27.8909 | 0.1173 | 2 | 5 | tangential migration from the subventricular zone to the olfactory bulb |
| GO:0035609 | 0.0052 | 27.8909 | 0.1173 | 2 | 5 | C-terminal protein deglutamylation |
| GO:0070100 | 0.0052 | 27.8909 | 0.1173 | 2 | 5 | negative regulation of chemokine-mediated signaling pathway |
| GO:0071502 | 0.0052 | 27.8909 | 0.1173 | 2 | 5 | cellular response to temperature stimulus |
| GO:1903232 | 0.0052 | 27.8909 | 0.1173 | 2 | 5 | melanosome assembly |
| GO:0051954 | 0.0057 | 6.2214 | 0.7273 | 4 | 31 | positive regulation of amine transport |
| GO:0040037 | 0.0057 | 9.674 | 0.3754 | 3 | 16 | negative regulation of fibroblast growth factor receptor signaling pathway |
| GO:0048704 | 0.0059 | 3.4734 | 2.1584 | 7 | 92 | embryonic skeletal system morphogenesis |
| GO:0046887 | 0.006 | 3.128 | 2.7214 | 8 | 116 | positive regulation of hormone secretion |
| GO:0030335 | 0.0061 | 1.9827 | 10.0411 | 19 | 428 | positive regulation of cell migration |
| GO:1901701 | 0.0062 | 1.6267 | 23.2729 | 36 | 992 | cellular response to oxygen-containing compound |
| GO:0045598 | 0.0063 | 3.0991 | 2.7449 | 8 | 117 | regulation of fat cell differentiation |
| GO:0050772 | 0.0064 | 3.8878 | 1.6657 | 6 | 71 | positive regulation of axonogenesis |
| GO:0008038 | 0.0064 | 5.9989 | 0.7507 | 4 | 32 | neuron recognition |
| GO:0043278 | 0.0064 | 5.9989 | 0.7507 | 4 | 32 | response to morphine |
| GO:0060317 | 0.0064 | 5.9989 | 0.7507 | 4 | 32 | cardiac epithelial to mesenchymal transition |
| GO:1903530 | 0.0065 | 1.8172 | 13.8391 | 24 | 596 | regulation of secretion by cell |
| GO:0051446 | 0.0068 | 8.9824 | 0.3988 | 3 | 17 | positive regulation of meiotic cell cycle |
| GO:0060219 | 0.0068 | 8.9824 | 0.3988 | 3 | 17 | camera-type eye photoreceptor cell differentiation |
| GO:0061323 | 0.0068 | 8.9824 | 0.3988 | 3 | 17 | cell proliferation involved in heart morphogenesis |
| GO:0072488 | 0.0068 | 8.9824 | 0.3988 | 3 | 17 | ammonium transmembrane transport |
| GO:0043537 | 0.0071 | 5.7916 | 0.7742 | 4 | 33 | negative regulation of blood vessel endothelial cell migration |
| GO:0045987 | 0.0071 | 5.7916 | 0.7742 | 4 | 33 | positive regulation of smooth muscle contraction |
| GO:0061333 | 0.0073 | 3.7712 | 1.7126 | 6 | 73 | renal tubule morphogenesis |
| GO:2000147 | 0.0075 | 8.5989 | 0.4121 | 3 | 18 | positive regulation of cell motility |
| GO:0071805 | 0.0077 | 2.4649 | 4.6921 | 11 | 200 | potassium ion transmembrane transport |
| GO:0032229 | 0.0077 | 20.9169 | 0.1408 | 2 | 6 | negative regulation of synaptic transmission, GABAergic |
| GO:0033603 | 0.0077 | 20.9169 | 0.1408 | 2 | 6 | positive regulation of dopamine secretion |
| GO:0098914 | 0.0077 | 20.9169 | 0.1408 | 2 | 6 | membrane repolarization during atrial cardiac muscle cell action potential |
| GO:1902947 | 0.0077 | 20.9169 | 0.1408 | 2 | 6 | regulation of tau-protein kinase activity |
| GO:2001279 | 0.0077 | 20.9169 | 0.1408 | 2 | 6 | regulation of unsaturated fatty acid biosynthetic process |
| GO:0051047 | 0.0078 | 2.0164 | 8.8212 | 17 | 376 | positive regulation of secretion |
| GO:0048661 | 0.0078 | 3.7155 | 1.7361 | 6 | 74 | positive regulation of smooth muscle cell proliferation |
| GO:0051961 | 0.0079 | 2.2607 | 6.0294 | 13 | 257 | negative regulation of nervous system development |
| GO:0003206 | 0.0081 | 2.9622 | 2.8622 | 8 | 122 | cardiac chamber morphogenesis |
| GO:0050803 | 0.0081 | 2.9622 | 2.8622 | 8 | 122 | regulation of synapse structure or activity |
| GO:0045785 | 0.0082 | 2.005 | 8.8681 | 17 | 378 | positive regulation of cell adhesion |
| GO:0048598 | 0.0087 | 1.7916 | 13.4195 | 23 | 572 | embryonic morphogenesis |
| GO:2000826 | 0.0088 | 5.4173 | 0.8211 | 4 | 35 | regulation of heart morphogenesis |
| GO:0006821 | 0.0092 | 3.173 | 2.3461 | 7 | 100 | chloride transport |
| GO:0001710 | 0.0094 | 7.8586 | 0.4458 | 3 | 19 | mesodermal cell fate commitment |
| GO:0072079 | 0.0094 | 7.8586 | 0.4458 | 3 | 19 | nephron tubule formation |
| GO:0040019 | 0.0097 | 5.2477 | 0.8446 | 4 | 36 | positive regulation of embryonic development |
| GO:0042391 | 0.0099 | 1.9605 | 9.0558 | 17 | 386 | regulation of membrane potential |
| GO:0007399 | 0.01 | 1.6601 | 18.352 | 29 | 852 | nervous system development |
| GOMFID | Pvalue | OddsRatio | ExpCount | Count | Size | Term |
| GO:1900239 | 3e-04 | 31.7561 | 0.1498 | 3 | 8 | regulation of phenotypic switching |
| GO:0050777 | 7e-04 | 4.0551 | 2.3961 | 9 | 128 | negative regulation of immune response |
| GO:1901570 | 0.0011 | 4.7308 | 1.6099 | 7 | 86 | fatty acid derivative biosynthetic process |
| GO:0030282 | 0.0018 | 4.3438 | 1.7409 | 7 | 93 | bone mineralization |
| GO:0038110 | 0.002 | 52.7616 | 0.0749 | 2 | 4 | interleukin-2-mediated signaling pathway |
| GO:0043570 | 0.002 | 52.7616 | 0.0749 | 2 | 4 | maintenance of DNA repeat elements |
| GO:0043114 | 0.0022 | 8.159 | 0.5616 | 4 | 30 | regulation of vascular permeability |
| GO:0045123 | 0.0024 | 5.9052 | 0.936 | 5 | 50 | cellular extravasation |
| GO:0007155 | 0.0028 | 1.6908 | 24.6158 | 39 | 1315 | cell adhesion |
| GO:0072104 | 0.0034 | 35.1722 | 0.0936 | 2 | 5 | glomerular capillary formation |
| GO:0002698 | 0.0034 | 3.8486 | 1.9468 | 7 | 104 | negative regulation of immune effector process |
| GO:0035338 | 0.0036 | 11.3351 | 0.3182 | 3 | 17 | long-chain fatty-acyl-CoA biosynthetic process |
| GO:0048535 | 0.0036 | 11.3351 | 0.3182 | 3 | 17 | lymph node development |
| GO:0060973 | 0.0043 | 10.5787 | 0.3369 | 3 | 18 | cell migration involved in heart development |
| GO:0042373 | 0.005 | 26.3775 | 0.1123 | 2 | 6 | vitamin K metabolic process |
| GO:0043152 | 0.005 | 26.3775 | 0.1123 | 2 | 6 | induction of bacterial agglutination |
| GO:0045590 | 0.005 | 26.3775 | 0.1123 | 2 | 6 | negative regulation of regulatory T cell differentiation |
| GO:0046069 | 0.005 | 26.3775 | 0.1123 | 2 | 6 | cGMP catabolic process |
| GO:0090677 | 0.005 | 26.3775 | 0.1123 | 2 | 6 | reversible differentiation |
| GO:1990668 | 0.005 | 26.3775 | 0.1123 | 2 | 6 | vesicle fusion with endoplasmic reticulum-Golgi intermediate compartment (ERGIC) membrane |
| GO:0051152 | 0.0058 | 9.333 | 0.3744 | 3 | 20 | positive regulation of smooth muscle cell differentiation |
| GO:0002376 | 0.0063 | 1.4516 | 49.1148 | 66 | 2646 | immune system process |
| GO:0008535 | 0.0067 | 8.814 | 0.3931 | 3 | 21 | respiratory chain complex IV assembly |
| GO:0061439 | 0.0069 | 21.1007 | 0.131 | 2 | 7 | kidney vasculature morphogenesis |
| GO:0070669 | 0.0069 | 21.1007 | 0.131 | 2 | 7 | response to interleukin-2 |
| GO:0046006 | 0.0071 | 5.7294 | 0.7675 | 4 | 41 | regulation of activated T cell proliferation |
| GO:1904837 | 0.0077 | 5.5782 | 0.7862 | 4 | 42 | beta-catenin-TCF complex assembly |
| GO:0006091 | 0.0079 | 2.0625 | 8.1241 | 16 | 434 | generation of precursor metabolites and energy |
| GO:0002443 | 0.0079 | 1.8113 | 13.3281 | 23 | 712 | leukocyte mediated immunity |
| GO:0006952 | 0.008 | 1.5574 | 27.9103 | 41 | 1491 | defense response |
| GO:0050764 | 0.0083 | 4.2815 | 1.2542 | 5 | 67 | regulation of phagocytosis |
| GO:0032667 | 0.0091 | 17.5828 | 0.1498 | 2 | 8 | regulation of interleukin-23 production |
| GO:0045630 | 0.0091 | 17.5828 | 0.1498 | 2 | 8 | positive regulation of T-helper 2 cell differentiation |
| GO:0072102 | 0.0091 | 17.5828 | 0.1498 | 2 | 8 | glomerulus morphogenesis |
| GO:0033559 | 0.0093 | 3.545 | 1.797 | 6 | 96 | unsaturated fatty acid metabolic process |
| GO:0010718 | 0.0098 | 5.1691 | 0.8424 | 4 | 45 | positive regulation of epithelial to mesenchymal transition |
| GO:0002507 | 0.0098 | 7.5534 | 0.4493 | 3 | 24 | tolerance induction |
| GOMFID | Pvalue | OddsRatio | ExpCount | Count | Size | Term |
| GO:0019864 | 4e-04 | 26.8971 | 0.1586 | 3 | 10 | IgG binding |
| GO:0050786 | 6e-04 | 23.5335 | 0.1745 | 3 | 11 | RAGE receptor binding |
| GO:0005521 | 0.0016 | 15.685 | 0.2379 | 3 | 15 | lamin binding |
| GO:0031406 | 0.0021 | 3.4087 | 2.8071 | 9 | 177 | carboxylic acid binding |
| GO:0016635 | 0.0024 | 41.6863 | 0.0793 | 2 | 5 | oxidoreductase activity, acting on the CH-CH group of donors, quinone or related compound as acceptor |
| GO:0016702 | 0.0055 | 9.4063 | 0.3648 | 3 | 23 | oxidoreductase activity, acting on single donors with incorporation of molecular oxygen, incorporation of two atoms of oxygen |
| GO:0008526 | 0.0066 | 20.8392 | 0.1269 | 2 | 8 | phosphatidylinositol transporter activity |
| GO:0008553 | 0.0066 | 20.8392 | 0.1269 | 2 | 8 | hydrogen-exporting ATPase activity, phosphorylative mechanism |
| GO:0032395 | 0.0084 | 17.8611 | 0.1427 | 2 | 9 | MHC class II receptor activity |
| GO:0005504 | 0.0087 | 7.8366 | 0.4282 | 3 | 27 | fatty acid binding |
| GOMFID | Pvalue | OddsRatio | ExpCount | Count | Size | Term |
| GO:0019864 | 4e-04 | 27.4458 | 0.1555 | 3 | 10 | IgG binding |
| GO:0050786 | 6e-04 | 24.0136 | 0.1711 | 3 | 11 | RAGE receptor binding |
| GO:0005521 | 0.0015 | 16.005 | 0.2333 | 3 | 15 | lamin binding |
| GO:0016635 | 0.0023 | 42.5333 | 0.0778 | 2 | 5 | oxidoreductase activity, acting on the CH-CH group of donors, quinone or related compound as acceptor |
| GO:0016702 | 0.0052 | 9.5982 | 0.3577 | 3 | 23 | oxidoreductase activity, acting on single donors with incorporation of molecular oxygen, incorporation of two atoms of oxygen |
| GO:0008526 | 0.0063 | 21.2627 | 0.1244 | 2 | 8 | phosphatidylinositol transporter activity |
| GO:0031406 | 0.0066 | 3.0622 | 2.7525 | 8 | 177 | carboxylic acid binding |
| GO:0032395 | 0.0081 | 18.224 | 0.14 | 2 | 9 | MHC class II receptor activity |
| GO:0005504 | 0.0083 | 7.9965 | 0.4199 | 3 | 27 | fatty acid binding |
| GOMFID | Pvalue | OddsRatio | ExpCount | Count | Size | Term |
| GO:0008094 | 1e-04 | 4.6591 | 2.4294 | 10 | 76 | DNA-dependent ATPase activity |
| GO:0003678 | 6e-04 | 5.4963 | 1.4704 | 7 | 46 | DNA helicase activity |
| GO:0042288 | 0.0022 | 8.7121 | 0.5754 | 4 | 18 | MHC class I protein binding |
| GO:0005515 | 0.0025 | 1.3234 | 344.14 | 374 | 10766 | protein binding |
| GO:0070016 | 0.0033 | 13.0485 | 0.3197 | 3 | 10 | armadillo repeat domain binding |
| GO:0008175 | 0.0088 | 5.5412 | 0.8311 | 4 | 26 | tRNA methyltransferase activity |
| GO:0004563 | 0.0096 | 20.2636 | 0.1598 | 2 | 5 | beta-N-acetylhexosaminidase activity |
| GO:0031727 | 0.0096 | 20.2636 | 0.1598 | 2 | 5 | CCR2 chemokine receptor binding |
| GO:0046976 | 0.0096 | 20.2636 | 0.1598 | 2 | 5 | histone methyltransferase activity (H3-K27 specific) |
| GO:0017111 | 0.0097 | 1.5604 | 24.7413 | 37 | 774 | nucleoside-triphosphatase activity |
| GOMFID | Pvalue | OddsRatio | ExpCount | Count | Size | Term |
| GO:0005515 | 7e-04 | 1.3808 | 337.377 | 371 | 10692 | protein binding |
| GO:0051033 | 0.003 | 61.0428 | 0.0955 | 2 | 3 | RNA transmembrane transporter activity |
| GO:0070016 | 0.0033 | 13.1011 | 0.3184 | 3 | 10 | armadillo repeat domain binding |
| GO:0005283 | 0.0057 | 10.1884 | 0.3821 | 3 | 12 | sodium:amino acid symporter activity |
| GO:0033192 | 0.0058 | 30.5195 | 0.1274 | 2 | 4 | calmodulin-dependent protein phosphatase activity |
| GO:0035877 | 0.0058 | 30.5195 | 0.1274 | 2 | 4 | death effector domain binding |
| GO:0097016 | 0.0058 | 30.5195 | 0.1274 | 2 | 4 | L27 domain binding |
| GO:0004709 | 0.0065 | 6.1207 | 0.7642 | 4 | 24 | MAP kinase kinase kinase activity |
| GO:0004601 | 0.0084 | 4.3763 | 1.2737 | 5 | 40 | peroxidase activity |
| GO:0008175 | 0.0087 | 5.5636 | 0.8279 | 4 | 26 | tRNA methyltransferase activity |
| GO:0008013 | 0.0091 | 3.2066 | 2.3563 | 7 | 74 | beta-catenin binding |
| GO:0004563 | 0.0095 | 20.345 | 0.1592 | 2 | 5 | beta-N-acetylhexosaminidase activity |
| GO:0031727 | 0.0095 | 20.345 | 0.1592 | 2 | 5 | CCR2 chemokine receptor binding |
| GO:0046923 | 0.0095 | 20.345 | 0.1592 | 2 | 5 | ER retention sequence binding |
| GO:0046976 | 0.0095 | 20.345 | 0.1592 | 2 | 5 | histone methyltransferase activity (H3-K27 specific) |
| GOMFID | Pvalue | OddsRatio | ExpCount | Count | Size | Term |
| GO:0038023 | 0 | 3.95 | 8.2083 | 26 | 1279 | signaling receptor activity |
| GO:0004984 | 0 | 6.8798 | 2.3746 | 14 | 370 | olfactory receptor activity |
| GO:0099600 | 0 | 3.9509 | 7.8233 | 25 | 1219 | transmembrane receptor activity |
| GO:0060089 | 0 | 3.5731 | 9.8384 | 28 | 1533 | molecular transducer activity |
| GO:0004930 | 0 | 4.4873 | 5.0251 | 19 | 783 | G-protein coupled receptor activity |
| GO:0005125 | 1e-04 | 6.3674 | 1.3862 | 8 | 216 | cytokine activity |
| GO:0004497 | 3e-04 | 9.0864 | 0.6033 | 5 | 94 | monooxygenase activity |
| GO:0003828 | 6e-04 | 78.9069 | 0.0385 | 2 | 6 | alpha-N-acetylneuraminate alpha-2,8-sialyltransferase activity |
| GO:0016705 | 0.003 | 5.4813 | 0.9755 | 5 | 152 | oxidoreductase activity, acting on paired donors, with incorporation or reduction of molecular oxygen |
| GO:0030545 | 0.0033 | 3.1998 | 3.0292 | 9 | 472 | receptor regulator activity |
| GO:0005102 | 0.0047 | 2.1473 | 9.2929 | 18 | 1448 | receptor binding |
| GO:0005129 | 0.0064 | Inf | 0.0064 | 1 | 1 | granulocyte macrophage colony-stimulating factor receptor binding |
| GO:0042924 | 0.0064 | Inf | 0.0064 | 1 | 1 | neuromedin U binding |
| GO:0043843 | 0.0064 | Inf | 0.0064 | 1 | 1 | ADP-specific glucokinase activity |
| GO:0047042 | 0.0064 | Inf | 0.0064 | 1 | 1 | androsterone dehydrogenase (B-specific) activity |
| GO:0050479 | 0.0064 | Inf | 0.0064 | 1 | 1 | glyceryl-ether monooxygenase activity |
| GO:0102116 | 0.0064 | Inf | 0.0064 | 1 | 1 | laurate hydroxylase activity |
| GO:0103002 | 0.0064 | Inf | 0.0064 | 1 | 1 | 16-hydroxypalmitate dehydrogenase activity |
| GO:0042379 | 0.0067 | 8.3606 | 0.3851 | 3 | 60 | chemokine receptor binding |
| GO:1903231 | 0.0096 | 5.1123 | 0.8279 | 4 | 129 | mRNA binding involved in posttranscriptional gene silencing |
| GO:0005509 | 0.0098 | 2.5288 | 4.2357 | 10 | 660 | calcium ion binding |
| GOMFID | Pvalue | OddsRatio | ExpCount | Count | Size | Term |
| GO:0008009 | 0 | 16.7527 | 0.5035 | 7 | 48 | chemokine activity |
| GO:0099600 | 0 | 2.9006 | 12.788 | 32 | 1219 | transmembrane receptor activity |
| GO:0060089 | 0 | 2.609 | 16.0821 | 36 | 1533 | molecular transducer activity |
| GO:0038023 | 0 | 2.7499 | 13.4175 | 32 | 1279 | signaling receptor activity |
| GO:0004984 | 0 | 4.2744 | 3.8815 | 15 | 370 | olfactory receptor activity |
| GO:0048020 | 0 | 16.9272 | 0.3526 | 5 | 34 | CCR chemokine receptor binding |
| GO:0004930 | 1e-04 | 2.8249 | 8.2141 | 21 | 783 | G-protein coupled receptor activity |
| GO:0030246 | 1e-04 | 4.386 | 2.7276 | 11 | 260 | carbohydrate binding |
| GO:0032394 | 1e-04 | Inf | 0.021 | 2 | 2 | MHC class Ib receptor activity |
| GO:0019955 | 5e-04 | 6.4101 | 1.0176 | 6 | 97 | cytokine binding |
| GO:0008392 | 7e-04 | 20.5573 | 0.1783 | 3 | 17 | arachidonic acid epoxygenase activity |
| GO:0042288 | 8e-04 | 19.1856 | 0.1888 | 3 | 18 | MHC class I protein binding |
| GO:0031726 | 0.0011 | 63.619 | 0.0525 | 2 | 5 | CCR1 chemokine receptor binding |
| GO:0016427 | 0.0016 | 47.7113 | 0.0629 | 2 | 6 | tRNA (cytosine) methyltransferase activity |
| GO:0001664 | 0.0016 | 3.544 | 2.7066 | 9 | 258 | G-protein coupled receptor binding |
| GO:0005126 | 0.0019 | 3.4731 | 2.759 | 9 | 263 | cytokine receptor binding |
| GO:0019957 | 0.0038 | 27.2585 | 0.0944 | 2 | 9 | C-C chemokine binding |
| GO:0032395 | 0.0038 | 27.2585 | 0.0944 | 2 | 9 | MHC class II receptor activity |
| GO:0016709 | 0.0053 | 9.2741 | 0.3567 | 3 | 34 | oxidoreductase activity, acting on paired donors, with incorporation or reduction of molecular oxygen, NAD(P)H as one donor, and incorporation of one atom of oxygen |
| GO:0001055 | 0.0057 | 21.1984 | 0.1154 | 2 | 11 | RNA polymerase II activity |
| GO:0005506 | 0.0057 | 3.9272 | 1.6156 | 6 | 154 | iron ion binding |
| GO:0016493 | 0.0067 | 19.0774 | 0.1259 | 2 | 12 | C-C chemokine receptor activity |
| GO:0048018 | 0.0074 | 2.4869 | 4.6683 | 11 | 445 | receptor ligand activity |
| GOMFID | Pvalue | OddsRatio | ExpCount | Count | Size | Term |
| GO:1903231 | 0.0033 | 3.465 | 2.4598 | 8 | 129 | mRNA binding involved in posttranscriptional gene silencing |
| GO:0004568 | 0.0035 | 34.5125 | 0.0953 | 2 | 5 | chitinase activity |
| GO:0016427 | 0.0052 | 25.8827 | 0.1144 | 2 | 6 | tRNA (cytosine) methyltransferase activity |
| GO:0042379 | 0.0057 | 4.7371 | 1.1441 | 5 | 60 | chemokine receptor binding |
| GO:0005496 | 0.0067 | 3.8189 | 1.678 | 6 | 88 | steroid binding |
| GO:0019956 | 0.0081 | 8.1925 | 0.4195 | 3 | 22 | chemokine binding |
| GO:0015485 | 0.0082 | 5.473 | 0.8009 | 4 | 42 | cholesterol binding |
| GO:0001591 | 0.0094 | 17.253 | 0.1525 | 2 | 8 | dopamine neurotransmitter receptor activity, coupled via Gi/Go |
| GO:0008061 | 0.0094 | 17.253 | 0.1525 | 2 | 8 | chitin binding |
| GOMFID | Pvalue | OddsRatio | ExpCount | Count | Size | Term |
| GO:0042803 | 4e-04 | 2.1598 | 13.9123 | 28 | 749 | protein homodimerization activity |
| GO:0042379 | 8e-04 | 5.9699 | 1.1145 | 6 | 60 | chemokine receptor binding |
| GO:0031731 | 0.001 | 106.3746 | 0.0557 | 2 | 3 | CCR6 chemokine receptor binding |
| GO:0016841 | 0.0033 | 35.4537 | 0.0929 | 2 | 5 | ammonia-lyase activity |
| GO:0005132 | 0.0036 | 11.4262 | 0.3158 | 3 | 17 | type I interferon receptor binding |
| GO:0004602 | 0.0042 | 10.6638 | 0.3343 | 3 | 18 | glutathione peroxidase activity |
| GO:0008289 | 0.0043 | 1.9471 | 11.9063 | 22 | 641 | lipid binding |
| GO:0004888 | 0.0067 | 1.6476 | 21.8251 | 34 | 1175 | transmembrane signaling receptor activity |
| GO:0008174 | 0.0068 | 21.2696 | 0.13 | 2 | 7 | mRNA methyltransferase activity |
| GO:0016494 | 0.0068 | 21.2696 | 0.13 | 2 | 7 | C-X-C chemokine receptor activity |
| GO:0031433 | 0.0068 | 21.2696 | 0.13 | 2 | 7 | telethonin binding |
| GO:0005102 | 0.0072 | 1.5778 | 26.8959 | 40 | 1448 | receptor binding |
| GO:0005125 | 0.0073 | 2.6187 | 4.0121 | 10 | 216 | cytokine activity |
| GO:0016835 | 0.0091 | 4.1807 | 1.2816 | 5 | 69 | carbon-oxygen lyase activity |
| GOMFID | Pvalue | OddsRatio | ExpCount | Count | Size | Term |
| GO:0004364 | 6e-04 | 12.1263 | 0.3899 | 4 | 26 | glutathione transferase activity |
| GO:0030246 | 0.0019 | 2.992 | 3.8988 | 11 | 260 | carbohydrate binding |
| GO:0019966 | 0.0075 | 18.9152 | 0.135 | 2 | 9 | interleukin-1 binding |
| GO:0004869 | 0.0098 | 5.1207 | 0.8397 | 4 | 56 | cysteine-type endopeptidase inhibitor activity |
| GOMFID | Pvalue | OddsRatio | ExpCount | Count | Size | Term |
| GO:0022843 | 2e-04 | 4.3745 | 2.4916 | 10 | 129 | voltage-gated cation channel activity |
| GO:0005216 | 0.0022 | 2.3133 | 7.7646 | 17 | 402 | ion channel activity |
| GO:0005509 | 0.0023 | 1.992 | 12.7479 | 24 | 660 | calcium ion binding |
| GO:0015267 | 0.0024 | 2.2314 | 8.5179 | 18 | 441 | channel activity |
| GO:0022832 | 0.0035 | 2.9302 | 3.6119 | 10 | 187 | voltage-gated channel activity |
| GO:0046873 | 0.0044 | 2.1472 | 8.3248 | 17 | 431 | metal ion transmembrane transporter activity |
| GO:0005251 | 0.0064 | 9.037 | 0.3863 | 3 | 20 | delayed rectifier potassium channel activity |
| GO:0016616 | 0.0066 | 3.3747 | 2.2019 | 7 | 114 | oxidoreductase activity, acting on the CH-OH group of donors, NAD or NADP as acceptor |
| GO:0016433 | 0.0073 | 20.4334 | 0.1352 | 2 | 7 | rRNA (adenine) methyltransferase activity |
| GO:0015450 | 0.0096 | 17.0268 | 0.1545 | 2 | 8 | P-P-bond-hydrolysis-driven protein transmembrane transporter activity |
| GOMFID | Pvalue | OddsRatio | ExpCount | Count | Size | Term |
| GO:0030246 | 0 | 3.8591 | 6.3376 | 22 | 260 | carbohydrate binding |
| GO:0045028 | 1e-04 | 26.9463 | 0.2438 | 4 | 10 | G-protein coupled purinergic nucleotide receptor activity |
| GO:0048020 | 3e-04 | 7.3742 | 0.9506 | 6 | 39 | CCR chemokine receptor binding |
| GO:0016502 | 6e-04 | 12.4312 | 0.4144 | 4 | 17 | nucleotide receptor activity |
| GO:0005126 | 8e-04 | 2.66 | 6.4107 | 16 | 263 | cytokine receptor binding |
| GO:0035586 | 0.0015 | 9.5038 | 0.5119 | 4 | 21 | purinergic receptor activity |
| GO:0071723 | 0.0015 | 17.2773 | 0.2438 | 3 | 10 | lipopeptide binding |
| GO:0089720 | 0.0015 | 17.2773 | 0.2438 | 3 | 10 | caspase binding |
| GO:0001730 | 0.0017 | 80.4529 | 0.0731 | 2 | 3 | 2'-5'-oligoadenylate synthetase activity |
| GO:0004872 | 0.002 | 1.5863 | 36.2947 | 54 | 1489 | receptor activity |
| GO:0005068 | 0.002 | 15.1167 | 0.2681 | 3 | 11 | transmembrane receptor protein tyrosine kinase adaptor activity |
| GO:0004950 | 0.0029 | 7.6916 | 0.6094 | 4 | 25 | chemokine receptor activity |
| GO:0035594 | 0.0034 | 40.2239 | 0.0975 | 2 | 4 | ganglioside binding |
| GO:0016641 | 0.0043 | 10.9919 | 0.3413 | 3 | 14 | oxidoreductase activity, acting on the CH-NH2 group of donors, oxygen as acceptor |
| GO:0019863 | 0.0056 | 26.8142 | 0.1219 | 2 | 5 | IgE binding |
| GO:0030883 | 0.0056 | 26.8142 | 0.1219 | 2 | 5 | endogenous lipid antigen binding |
| GO:0030884 | 0.0056 | 26.8142 | 0.1219 | 2 | 5 | exogenous lipid antigen binding |
| GO:0008009 | 0.0061 | 4.701 | 1.17 | 5 | 48 | chemokine activity |
| GO:0046625 | 0.0076 | 8.6348 | 0.4144 | 3 | 17 | sphingolipid binding |
| GO:0003823 | 0.0079 | 4.3935 | 1.2431 | 5 | 51 | antigen binding |
| GO:0005507 | 0.0085 | 4.2998 | 1.2675 | 5 | 52 | copper ion binding |
| GO:0015299 | 0.0089 | 8.0587 | 0.4388 | 3 | 18 | solute:proton antiporter activity |
| GO:0019955 | 0.0095 | 3.1512 | 2.3644 | 7 | 97 | cytokine binding |
| GOMFID | Pvalue | OddsRatio | ExpCount | Count | Size | Term |
| GO:0030246 | 0 | 3.4325 | 6.0488 | 19 | 260 | carbohydrate binding |
| GO:0089720 | 1e-04 | 28.2788 | 0.2326 | 4 | 10 | caspase binding |
| GO:0048020 | 3e-04 | 7.7407 | 0.9073 | 6 | 39 | CCR chemokine receptor binding |
| GO:0005126 | 5e-04 | 2.7958 | 6.1185 | 16 | 263 | cytokine receptor binding |
| GO:0019966 | 9e-04 | 21.1524 | 0.2094 | 3 | 9 | interleukin-1 binding |
| GO:0004872 | 0.0012 | 1.6394 | 34.6407 | 53 | 1489 | receptor activity |
| GO:0045028 | 0.0013 | 18.1295 | 0.2326 | 3 | 10 | G-protein coupled purinergic nucleotide receptor activity |
| GO:0071723 | 0.0013 | 18.1295 | 0.2326 | 3 | 10 | lipopeptide binding |
| GO:0031720 | 0.0016 | 84.4107 | 0.0698 | 2 | 3 | haptoglobin binding |
| GO:0004950 | 0.0025 | 8.072 | 0.5816 | 4 | 25 | chemokine receptor activity |
| GO:0008009 | 0.005 | 4.934 | 1.1167 | 5 | 48 | chemokine activity |
| GO:0019863 | 0.0052 | 28.1333 | 0.1163 | 2 | 5 | IgE binding |
| GO:0030883 | 0.0052 | 28.1333 | 0.1163 | 2 | 5 | endogenous lipid antigen binding |
| GO:0030884 | 0.0052 | 28.1333 | 0.1163 | 2 | 5 | exogenous lipid antigen binding |
| GO:0016502 | 0.0067 | 9.0607 | 0.3955 | 3 | 17 | nucleotide receptor activity |
| GO:0005507 | 0.007 | 4.513 | 1.2098 | 5 | 52 | copper ion binding |
| GO:0001664 | 0.0076 | 2.2716 | 6.0022 | 13 | 258 | G-protein coupled receptor binding |
| GOMFID | Pvalue | OddsRatio | ExpCount | Count | Size | Term |
| GO:0048020 | 1e-04 | 10.5064 | 0.6763 | 6 | 39 | CCR chemokine receptor binding |
| GO:0008061 | 3e-04 | 34.3576 | 0.1387 | 3 | 8 | chitin binding |
| GO:0004878 | 3e-04 | Inf | 0.0347 | 2 | 2 | complement component C5a receptor activity |
| GO:0032394 | 3e-04 | Inf | 0.0347 | 2 | 2 | MHC class Ib receptor activity |
| GO:0017171 | 3e-04 | 3.5251 | 3.6588 | 12 | 211 | serine hydrolase activity |
| GO:0004252 | 0.0012 | 3.44 | 3.1039 | 10 | 179 | serine-type endopeptidase activity |
| GO:0008009 | 0.0014 | 6.6907 | 0.8323 | 5 | 48 | chemokine activity |
| GO:0000253 | 0.0018 | 57.0681 | 0.0694 | 2 | 4 | 3-keto sterol reductase activity |
| GO:0018685 | 0.0018 | 57.0681 | 0.0694 | 2 | 4 | alkane 1-monooxygenase activity |
| GO:0050051 | 0.0018 | 57.0681 | 0.0694 | 2 | 4 | leukotriene-B4 20-monooxygenase activity |
| GO:0016614 | 0.002 | 3.7645 | 2.2716 | 8 | 131 | oxidoreductase activity, acting on CH-OH group of donors |
| GO:0000339 | 0.0024 | 13.2078 | 0.2774 | 3 | 16 | RNA cap binding |
| GO:0004568 | 0.0029 | 38.043 | 0.0867 | 2 | 5 | chitinase activity |
| GO:0070011 | 0.003 | 2.0869 | 10.1268 | 20 | 584 | peptidase activity, acting on L-amino acid peptides |
| GO:0140096 | 0.009 | 1.481 | 37.6112 | 52 | 2169 | catalytic activity, acting on a protein |
| GO:0052650 | 0.01 | 16.3001 | 0.1561 | 2 | 9 | NADP-retinol dehydrogenase activity |
| GOMFID | Pvalue | OddsRatio | ExpCount | Count | Size | Term |
| GO:0048020 | 0 | 12.4331 | 0.5752 | 6 | 39 | CCR chemokine receptor binding |
| GO:0008061 | 2e-04 | 40.5788 | 0.118 | 3 | 8 | chitin binding |
| GO:0032394 | 2e-04 | Inf | 0.0295 | 2 | 2 | MHC class Ib receptor activity |
| GO:0008009 | 7e-04 | 7.9124 | 0.7079 | 5 | 48 | chemokine activity |
| GO:0018685 | 0.0013 | 67.3586 | 0.059 | 2 | 4 | alkane 1-monooxygenase activity |
| GO:0050051 | 0.0013 | 67.3586 | 0.059 | 2 | 4 | leukotriene-B4 20-monooxygenase activity |
| GO:0004568 | 0.0021 | 44.903 | 0.0737 | 2 | 5 | chitinase activity |
| GO:0015144 | 0.0033 | 7.1346 | 0.6194 | 4 | 42 | carbohydrate transmembrane transporter activity |
| GO:0005509 | 0.0043 | 2.0648 | 9.734 | 19 | 660 | calcium ion binding |
| GOMFID | Pvalue | OddsRatio | ExpCount | Count | Size | Term |
| GO:0004984 | 0 | 5.6764 | 3.0139 | 15 | 370 | olfactory receptor activity |
| GO:0038023 | 0 | 3.044 | 10.4183 | 27 | 1279 | signaling receptor activity |
| GO:0060089 | 0 | 2.8512 | 12.4873 | 30 | 1533 | molecular transducer activity |
| GO:0099600 | 0 | 3.0594 | 9.9295 | 26 | 1219 | transmembrane receptor activity |
| GO:0004930 | 0 | 3.3692 | 6.378 | 19 | 783 | G-protein coupled receptor activity |
| GO:0005126 | 1e-04 | 5.1886 | 2.1181 | 10 | 262 | cytokine receptor binding |
| GO:0008009 | 6e-04 | 11.3842 | 0.391 | 4 | 48 | chemokine activity |
| GO:0048248 | 6e-04 | 82.4103 | 0.0407 | 2 | 5 | CXCR3 chemokine receptor binding |
| GO:0048018 | 0.0035 | 2.9467 | 3.6248 | 10 | 445 | receptor ligand activity |
| GO:0004896 | 0.0047 | 6.3267 | 0.6761 | 4 | 83 | cytokine receptor activity |
| GO:0044548 | 0.0048 | 22.4643 | 0.1059 | 2 | 13 | S100 protein binding |
| GO:0005174 | 0.0081 | Inf | 0.0081 | 1 | 1 | CD40 receptor binding |
| GO:0015130 | 0.0081 | Inf | 0.0081 | 1 | 1 | mevalonate transmembrane transporter activity |
| GO:0030107 | 0.0081 | Inf | 0.0081 | 1 | 1 | HLA-A specific inhibitory MHC class I receptor activity |
| GO:0030380 | 0.0081 | Inf | 0.0081 | 1 | 1 | interleukin-17E receptor binding |
| GO:0070002 | 0.0081 | Inf | 0.0081 | 1 | 1 | glutamic-type peptidase activity |
| GO:1902122 | 0.0081 | Inf | 0.0081 | 1 | 1 | chenodeoxycholic acid binding |
| GO:0019902 | 0.009 | 4.1513 | 1.2707 | 5 | 156 | phosphatase binding |
| GO:0005416 | 0.0093 | 15.4394 | 0.1466 | 2 | 18 | cation:amino acid symporter activity |
| GOMFID | Pvalue | OddsRatio | ExpCount | Count | Size | Term |
| GO:0004984 | 0 | 6.8366 | 2.7399 | 16 | 370 | olfactory receptor activity |
| GO:0099600 | 0 | 3.806 | 9.0268 | 28 | 1219 | transmembrane receptor activity |
| GO:0004930 | 0 | 4.2655 | 5.7982 | 21 | 783 | G-protein coupled receptor activity |
| GO:0038023 | 0 | 3.4396 | 9.4712 | 27 | 1279 | signaling receptor activity |
| GO:0060089 | 0 | 3.0896 | 11.3521 | 29 | 1533 | molecular transducer activity |
| GO:0005126 | 1e-04 | 5.1199 | 1.9241 | 9 | 262 | cytokine receptor binding |
| GO:0015125 | 2e-04 | 34.344 | 0.1111 | 3 | 15 | bile acid transmembrane transporter activity |
| GO:0005125 | 2e-04 | 6.2763 | 1.2166 | 7 | 168 | cytokine activity |
| GO:0046943 | 4e-04 | 6.72 | 0.9701 | 6 | 131 | carboxylic acid transmembrane transporter activity |
| GO:0030545 | 8e-04 | 3.4202 | 3.4952 | 11 | 472 | receptor regulator activity |
| GO:0004896 | 0.0034 | 6.9865 | 0.6146 | 4 | 83 | cytokine receptor activity |
| GO:0008009 | 0.0054 | 9.1396 | 0.3554 | 3 | 48 | chemokine activity |
| GO:0015291 | 0.0067 | 3.7955 | 1.6736 | 6 | 226 | secondary active transmembrane transporter activity |
| GO:0015130 | 0.0074 | Inf | 0.0074 | 1 | 1 | mevalonate transmembrane transporter activity |
| GO:0030107 | 0.0074 | Inf | 0.0074 | 1 | 1 | HLA-A specific inhibitory MHC class I receptor activity |
| GO:0030380 | 0.0074 | Inf | 0.0074 | 1 | 1 | interleukin-17E receptor binding |
| GO:0043843 | 0.0074 | Inf | 0.0074 | 1 | 1 | ADP-specific glucokinase activity |
| GO:0005416 | 0.0077 | 17.0222 | 0.1333 | 2 | 18 | cation:amino acid symporter activity |
| GOMFID | Pvalue | OddsRatio | ExpCount | Count | Size | Term |
| GO:0004984 | 0 | 5.131 | 2.3974 | 11 | 370 | olfactory receptor activity |
| GO:0099600 | 0 | 3.1098 | 7.8985 | 21 | 1219 | transmembrane receptor activity |
| GO:0004930 | 0 | 3.5939 | 5.0734 | 16 | 783 | G-protein coupled receptor activity |
| GO:0060089 | 1e-04 | 2.7101 | 9.933 | 23 | 1533 | molecular transducer activity |
| GO:0038023 | 2e-04 | 2.7736 | 8.2873 | 20 | 1279 | signaling receptor activity |
| GO:0048248 | 4e-04 | 104.1877 | 0.0324 | 2 | 5 | CXCR3 chemokine receptor binding |
| GO:0004252 | 0.0011 | 5.5796 | 1.1598 | 6 | 179 | serine-type endopeptidase activity |
| GO:0017171 | 0.0025 | 4.6992 | 1.3672 | 6 | 211 | serine hydrolase activity |
| GO:0008009 | 0.0037 | 10.4935 | 0.311 | 3 | 48 | chemokine activity |
| GO:0005129 | 0.0065 | Inf | 0.0065 | 1 | 1 | granulocyte macrophage colony-stimulating factor receptor binding |
| GO:0005459 | 0.0065 | Inf | 0.0065 | 1 | 1 | UDP-galactose transmembrane transporter activity |
| GO:0030107 | 0.0065 | Inf | 0.0065 | 1 | 1 | HLA-A specific inhibitory MHC class I receptor activity |
| GO:0030380 | 0.0065 | Inf | 0.0065 | 1 | 1 | interleukin-17E receptor binding |
| GO:0033038 | 0.0073 | 17.3484 | 0.1296 | 2 | 20 | bitter taste receptor activity |
| GOMFID | Pvalue | OddsRatio | ExpCount | Count | Size | Term |
| GO:0004984 | 0 | 8.2116 | 2.6486 | 18 | 370 | olfactory receptor activity |
| GO:0008009 | 0 | 29.7204 | 0.3436 | 8 | 48 | chemokine activity |
| GO:0004930 | 0 | 4.7141 | 5.6049 | 22 | 783 | G-protein coupled receptor activity |
| GO:0048020 | 0 | 26.5388 | 0.2792 | 6 | 39 | CCR chemokine receptor binding |
| GO:0099600 | 0 | 3.4272 | 8.7259 | 25 | 1219 | transmembrane receptor activity |
| GO:0060089 | 0 | 2.9376 | 10.9737 | 27 | 1533 | molecular transducer activity |
| GO:0038023 | 0 | 3.0835 | 9.1554 | 24 | 1279 | signaling receptor activity |
| GO:0005126 | 0 | 6.0673 | 1.8363 | 10 | 261 | cytokine receptor binding |
| GO:0048018 | 0 | 4.5744 | 3.1854 | 13 | 445 | receptor ligand activity |
| GO:0001664 | 5e-04 | 4.693 | 1.8468 | 8 | 258 | G-protein coupled receptor binding |
| GO:0016004 | 0.0027 | 31.345 | 0.0787 | 2 | 11 | phospholipase activator activity |
| GO:0005133 | 0.0072 | Inf | 0.0072 | 1 | 1 | interferon-gamma receptor binding |
| GO:0030107 | 0.0072 | Inf | 0.0072 | 1 | 1 | HLA-A specific inhibitory MHC class I receptor activity |
| GO:0030380 | 0.0072 | Inf | 0.0072 | 1 | 1 | interleukin-17E receptor binding |
| GO:0033038 | 0.0089 | 15.6637 | 0.1432 | 2 | 20 | bitter taste receptor activity |
| GOMFID | Pvalue | OddsRatio | ExpCount | Count | Size | Term |
| GO:0031433 | 0.001 | 56.4351 | 0.0501 | 2 | 7 | telethonin binding |
| GO:0016409 | 0.0021 | 12.9171 | 0.2577 | 3 | 36 | palmitoyltransferase activity |
| GO:0015095 | 0.005 | 21.695 | 0.1074 | 2 | 15 | magnesium ion transmembrane transporter activity |
| GO:0004984 | 0.0051 | 3.2181 | 2.6486 | 8 | 370 | olfactory receptor activity |
| GO:0008106 | 0.0057 | 20.1441 | 0.1145 | 2 | 16 | alcohol dehydrogenase (NADP+) activity |
| GO:0008329 | 0.0064 | 18.8 | 0.1217 | 2 | 17 | signaling pattern recognition receptor activity |
| GO:0061783 | 0.0064 | 18.8 | 0.1217 | 2 | 17 | peptidoglycan muralytic activity |
| GO:0001760 | 0.0072 | Inf | 0.0072 | 1 | 1 | aminocarboxymuconate-semialdehyde decarboxylase activity |
| GO:0008120 | 0.0072 | Inf | 0.0072 | 1 | 1 | ceramide glucosyltransferase activity |
| GO:0008336 | 0.0072 | Inf | 0.0072 | 1 | 1 | gamma-butyrobetaine dioxygenase activity |
| GO:0015055 | 0.0072 | Inf | 0.0072 | 1 | 1 | secretin receptor activity |
| GO:0015130 | 0.0072 | Inf | 0.0072 | 1 | 1 | mevalonate transmembrane transporter activity |
| GO:0016517 | 0.0072 | Inf | 0.0072 | 1 | 1 | interleukin-12 receptor activity |
| GO:0018455 | 0.0072 | Inf | 0.0072 | 1 | 1 | alcohol dehydrogenase [NAD(P)+] activity |
| GO:0047042 | 0.0072 | Inf | 0.0072 | 1 | 1 | androsterone dehydrogenase (B-specific) activity |
| GO:0050129 | 0.0072 | Inf | 0.0072 | 1 | 1 | N-formylglutamate deformylase activity |
| GO:0050459 | 0.0072 | Inf | 0.0072 | 1 | 1 | ethanolamine-phosphate phospho-lyase activity |
| GO:0102769 | 0.0072 | Inf | 0.0072 | 1 | 1 | dihydroceramide glucosyltransferase activity |
| GO:1990698 | 0.0072 | Inf | 0.0072 | 1 | 1 | palmitoleoyltransferase activity |
| GO:0033293 | 0.0083 | 7.7397 | 0.4152 | 3 | 58 | monocarboxylic acid binding |
| GO:0043177 | 0.0091 | 4.1441 | 1.2742 | 5 | 178 | organic acid binding |
| GO:0004930 | 0.0095 | 2.3178 | 5.5499 | 12 | 782 | G-protein coupled receptor activity |
| GOMFID | Pvalue | OddsRatio | ExpCount | Count | Size | Term |
| GO:0004984 | 0 | 3.9327 | 5.3428 | 19 | 370 | olfactory receptor activity |
| GO:0005549 | 0 | 7.5025 | 1.1985 | 8 | 83 | odorant binding |
| GO:0004930 | 1e-04 | 2.5122 | 11.3065 | 26 | 783 | G-protein coupled receptor activity |
| GO:0038023 | 8e-04 | 1.9402 | 18.4687 | 33 | 1279 | signaling receptor activity |
| GO:0004583 | 0.0012 | 68.8319 | 0.0578 | 2 | 4 | dolichyl-phosphate-glucose-glycolipid alpha-glucosyltransferase activity |
| GO:0060089 | 0.0044 | 1.6993 | 22.1365 | 35 | 1533 | molecular transducer activity |
| GO:0016853 | 0.0046 | 3.6173 | 2.0505 | 7 | 142 | isomerase activity |
| GO:0099600 | 0.0054 | 1.7571 | 17.6023 | 29 | 1219 | transmembrane receptor activity |
| GO:0071855 | 0.0075 | 8.2836 | 0.4043 | 3 | 28 | neuropeptide receptor binding |
| GOMFID | Pvalue | OddsRatio | ExpCount | Count | Size | Term |
| GO:0004911 | 3e-04 | Inf | 0.036 | 2 | 2 | interleukin-2 receptor activity |
| GO:0019976 | 3e-04 | Inf | 0.036 | 2 | 2 | interleukin-2 binding |
| GO:0102953 | 0.0031 | 36.5747 | 0.0901 | 2 | 5 | hypoglycin A gamma-glutamyl transpeptidase activity |
| GO:0036374 | 0.0064 | 21.9421 | 0.1261 | 2 | 7 | glutathione hydrolase activity |
| GOMFID | Pvalue | OddsRatio | ExpCount | Count | Size | Term |
| GO:0032394 | 6e-04 | Inf | 0.051 | 2 | 2 | MHC class Ib receptor activity |
| GO:0031720 | 0.0019 | 76.8418 | 0.0765 | 2 | 3 | haptoglobin binding |
| GO:0035663 | 0.0019 | 76.8418 | 0.0765 | 2 | 3 | Toll-like receptor 2 binding |
| GO:0050220 | 0.0019 | 76.8418 | 0.0765 | 2 | 3 | prostaglandin-E synthase activity |
| GO:0005484 | 0.0023 | 6.0355 | 0.943 | 5 | 37 | SNAP receptor activity |
| GO:1900750 | 0.003 | 12.8317 | 0.3058 | 3 | 12 | oligopeptide binding |
| GO:0031014 | 0.0038 | 38.4185 | 0.1019 | 2 | 4 | troponin T binding |
| GO:0005523 | 0.0049 | 10.4973 | 0.3568 | 3 | 14 | tropomyosin binding |
| GO:0015057 | 0.0062 | 25.6107 | 0.1274 | 2 | 5 | thrombin-activated receptor activity |
| GO:0016805 | 0.0072 | 8.8812 | 0.4078 | 3 | 16 | dipeptidase activity |
| GO:0072341 | 0.0076 | 3.7402 | 1.733 | 6 | 68 | modified amino acid binding |
| GO:0005149 | 0.0086 | 8.2463 | 0.4333 | 3 | 17 | interleukin-1 receptor binding |
| GO:0005319 | 0.0089 | 2.7049 | 3.5171 | 9 | 138 | lipid transporter activity |
| GO:0004565 | 0.0091 | 19.2068 | 0.1529 | 2 | 6 | beta-galactosidase activity |
| GO:0019237 | 0.0091 | 19.2068 | 0.1529 | 2 | 6 | centromeric DNA binding |
| NA. |
| n/a |
| NA. |
| n/a |
| NA. |
| n/a |
| NA. |
| n/a |
| NA. |
| n/a |
| NA. |
| n/a |
| NA. |
| n/a |
| NA. |
| n/a |
| NA. |
| n/a |
| NA. |
| n/a |
| NA. |
| n/a |
| NA. |
| n/a |
| NA. |
| n/a |
| NA. |
| n/a |
| NA. |
| n/a |
| NA. |
| n/a |
| NA. |
| n/a |
| NA. |
| n/a |
| NA. |
| n/a |
| NA. |
| n/a |
| NA. |
| n/a |
| NA. |
| n/a |
| NA. |
| n/a |
| NA. |
| n/a |
| NA. |
| n/a |
| NA. |
| n/a |
| NA. |
| n/a |
| NA. |
| n/a |
| NA. |
| n/a |
| NA. |
| n/a |
| NA. |
| n/a |
| NA. |
| n/a |
| NA. |
| n/a |
| NA. |
| n/a |
| NA. |
| n/a |
| NA. |
| n/a |
| NA. |
| n/a |
| NA. |
| n/a |
| NA. |
| n/a |
| NA. |
| n/a |
| NA. |
| n/a |
| NA. |
| n/a |
| NA. |
| n/a |
| NA. |
| n/a |
| NA. |
| n/a |
| NA. |
| n/a |
| NA. |
| n/a |
| NA. |
| n/a |
| NA. |
| n/a |
| NA. |
| n/a |
| NA. |
| n/a |
| NA. |
| n/a |
| NA. |
| n/a |
| NA. |
| n/a |
| NA. |
| n/a |
| NA. |
| n/a |
| NA. |
| n/a |
| NA. |
| n/a |
| NA. |
| n/a |
| NA. |
| n/a |
| NA. |
| n/a |
| NA. |
| n/a |
| NA. |
| n/a |
| NA. |
| n/a |
| NA. |
| n/a |
| NA. |
| n/a |
| NA. |
| n/a |
| NA. |
| n/a |
| NA. |
| n/a |
| NA. |
| n/a |
| NA. |
| n/a |
| NA. |
| n/a |
| NA. |
| n/a |
| NA. |
| n/a |
| NA. |
| n/a |
| NA. |
| n/a |
| NA. |
| n/a |
| NA. |
| n/a |
| NA. |
| n/a |
| NA. |
| n/a |
| NA. |
| n/a |
| NA. |
| n/a |
| NA. |
| n/a |
| NA. |
| n/a |
| NA. |
| n/a |
| NA. |
| n/a |
| NA. |
| n/a |
| NA. |
| n/a |
| NA. |
| n/a |
| NA. |
| n/a |
| NA. |
| n/a |
| NA. |
| n/a |
| NA. |
| n/a |
| NA. |
| n/a |
| NA. |
| n/a |
| NA. |
| n/a |
| NA. |
| n/a |
| NA. |
| n/a |
| NA. |
| n/a |
| NA. |
| n/a |
| NA. |
| n/a |
| NA. |
| n/a |
| NA. |
| n/a |
| NA. |
| n/a |
| NA. |
| n/a |
| NA. |
| n/a |
| NA. |
| n/a |
| NA. |
| n/a |
| NA. |
| n/a |
| NA. |
| n/a |
| NA. |
| n/a |
| NA. |
| n/a |
| NA. |
| n/a |
| NA. |
| n/a |
| NA. |
| n/a |
| NA. |
| n/a |
| NA. |
| n/a |
| NA. |
| n/a |
| NA. |
| n/a |
| NA. |
| n/a |
| NA. |
| n/a |
| NA. |
| n/a |
| NA. |
| n/a |
| NA. |
| n/a |
| NA. |
| n/a |
| NA. |
| n/a |
| NA. |
| n/a |
| NA. |
| n/a |
| NA. |
| n/a |
| NA. |
| n/a |
| NA. |
| n/a |
| NA. |
| n/a |
| NA. |
| n/a |
| NA. |
| n/a |
| NA. |
| n/a |
| NA. |
| n/a |
| NA. |
| n/a |
| NA. |
| n/a |
| NA. |
| n/a |
| NA. |
| n/a |
| NA. |
| n/a |
| NA. |
| n/a |
| NA. |
| n/a |
| NA. |
| n/a |
| NA. |
| n/a |
| NA. |
| n/a |
| NA. |
| n/a |
| NA. |
| n/a |
| NA. |
| n/a |
| NA. |
| n/a |
| NA. |
| n/a |
| NA. |
| n/a |
| NA. |
| n/a |
| NA. |
| n/a |
| NA. |
| n/a |
| NA. |
| n/a |
| NA. |
| n/a |
| NA. |
| n/a |
| NA. |
| n/a |
| NA. |
| n/a |
| NA. |
| n/a |
| NA. |
| n/a |
| NA. |
| n/a |
| NA. |
| n/a |
| NA. |
| n/a |
| NA. |
| n/a |
| NA. |
| n/a |
| NA. |
| n/a |
| NA. |
| n/a |
| NA. |
| n/a |
| NA. |
| n/a |
| NA. |
| n/a |
| NA. |
| n/a |
| NA. |
| n/a |
| NA. |
| n/a |
| NA. |
| n/a |
| NA. |
| n/a |
| NA. |
| n/a |
| NA. |
| n/a |
| NA. |
| n/a |
| NA. |
| n/a |
| NA. |
| n/a |
| NA. |
| n/a |
| NA. |
| n/a |
| NA. |
| n/a |
| NA. |
| n/a |
| NA. |
| n/a |
| NA. |
| n/a |
| NA. |
| n/a |
| NA. |
| n/a |
| NA. |
| n/a |
| NA. |
| n/a |
| NA. |
| n/a |
| NA. |
| n/a |
| NA. |
| n/a |
| NA. |
| n/a |
| NA. |
| n/a |
| NA. |
| n/a |
| NA. |
| n/a |
| NA. |
| n/a |
| NA. |
| n/a |
| NA. |
| n/a |
| NA. |
| n/a |
| NA. |
| n/a |
| NA. |
| n/a |
| NA. |
| n/a |
| NA. |
| n/a |
| NA. |
| n/a |
| NA. |
| n/a |
| NA. |
| n/a |
| NA. |
| n/a |
| NA. |
| n/a |
| NA. |
| n/a |
| NA. |
| n/a |
| NA. |
| n/a |
| NA. |
| n/a |
| NA. |
| n/a |
| NA. |
| n/a |
| NA. |
| n/a |
| NA. |
| n/a |
| NA. |
| n/a |
| NA. |
| n/a |
| NA. |
| n/a |
| NA. |
| n/a |
| NA. |
| n/a |
| NA. |
| n/a |
| NA. |
| n/a |
| NA. |
| n/a |
| NA. |
| n/a |
| NA. |
| n/a |
| NA. |
| n/a |
| NA. |
| n/a |
| NA. |
| n/a |
| NA. |
| n/a |
| NA. |
| n/a |
| NA. |
| n/a |
| NA. |
| n/a |
| NA. |
| n/a |
| NA. |
| n/a |
| NA. |
| n/a |
| NA. |
| n/a |
| NA. |
| n/a |
| NA. |
| n/a |
| NA. |
| n/a |
| NA. |
| n/a |
| NA. |
| n/a |
| NA. |
| n/a |
| NA. |
| n/a |
| NA. |
| n/a |
| NA. |
| n/a |
| NA. |
| n/a |
| NA. |
| n/a |
| NA. |
| n/a |
| NA. |
| n/a |
| NA. |
| n/a |
| NA. |
| n/a |
| NA. |
| n/a |
| NA. |
| n/a |
| NA. |
| n/a |
| NA. |
| n/a |
| NA. |
| n/a |
| NA. |
| n/a |
| NA. |
| n/a |
| NA. |
| n/a |
| NA. |
| n/a |
| NA. |
| n/a |
| NA. |
| n/a |
| NA. |
| n/a |
| NA. |
| n/a |
| NA. |
| n/a |
| NA. |
| n/a |
| NA. |
| n/a |
| NA. |
| n/a |
| NA. |
| n/a |
| NA. |
| n/a |
| NA. |
| n/a |
| NA. |
| n/a |
| NA. |
| n/a |
| NA. |
| n/a |
| NA. |
| n/a |
| NA. |
| n/a |
| NA. |
| n/a |
| NA. |
| n/a |
| NA. |
| n/a |
| NA. |
| n/a |
| NA. |
| n/a |
| NA. |
| n/a |
| NA. |
| n/a |
| NA. |
| n/a |
| NA. |
| n/a |
| NA. |
| n/a |
| NA. |
| n/a |
| NA. |
| n/a |
| NA. |
| n/a |
| NA. |
| n/a |
| NA. |
| n/a |
| NA. |
| n/a |
| NA. |
| n/a |
| NA. |
| n/a |
| NA. |
| n/a |
| NA. |
| n/a |
| NA. |
| n/a |
| NA. |
| n/a |
| NA. |
| n/a |
| NA. |
| n/a |
| NA. |
| n/a |
| NA. |
| n/a |
| NA. |
| n/a |
| NA. |
| n/a |
| NA. |
| n/a |
| NA. |
| n/a |
| NA. |
| n/a |
| NA. |
| n/a |
| NA. |
| n/a |
| NA. |
| n/a |
| NA. |
| n/a |
| NA. |
| n/a |
| NA. |
| n/a |
| NA. |
| n/a |
| NA. |
| n/a |
| NA. |
| n/a |
| NA. |
| n/a |
| NA. |
| n/a |
| NA. |
| n/a |
| NA. |
| n/a |
| NA. |
| n/a |
| NA. |
| n/a |
| NA. |
| n/a |
| NA. |
| n/a |
| NA. |
| n/a |
| NA. |
| n/a |
| NA. |
| n/a |
| NA. |
| n/a |
| NA. |
| n/a |
| NA. |
| n/a |
| NA. |
| n/a |
| NA. |
| n/a |
| NA. |
| n/a |
| NA. |
| n/a |
| NA. |
| n/a |
| NA. |
| n/a |
| NA. |
| n/a |
| NA. |
| n/a |
| NA. |
| n/a |
| NA. |
| n/a |
| NA. |
| n/a |
| NA. |
| n/a |
| NA. |
| n/a |
| NA. |
| n/a |
| NA. |
| n/a |
| NA. |
| n/a |
| NA. |
| n/a |
| NA. |
| n/a |
| NA. |
| n/a |
| NA. |
| n/a |
| NA. |
| n/a |
| NA. |
| n/a |
| NA. |
| n/a |
| NA. |
| n/a |
| NA. |
| n/a |
| NA. |
| n/a |
| NA. |
| n/a |
| NA. |
| n/a |
| NA. |
| n/a |
| NA. |
| n/a |
| NA. |
| n/a |
| NA. |
| n/a |
| NA. |
| n/a |
| NA. |
| n/a |
| NA. |
| n/a |
| NA. |
| n/a |
| NA. |
| n/a |
| NA. |
| n/a |
| NA. |
| n/a |
| NA. |
| n/a |
| NA. |
| n/a |
| NA. |
| n/a |
| NA. |
| n/a |
| NA. |
| n/a |
| NA. |
| n/a |
| NA. |
| n/a |
| NA. |
| n/a |
| NA. |
| n/a |
| NA. |
| n/a |
| NA. |
| n/a |
| NA. |
| n/a |
| NA. |
| n/a |
| NA. |
| n/a |
| NA. |
| n/a |
| NA. |
| n/a |
| NA. |
| n/a |
| NA. |
| n/a |
Differential Variability
GO enrichment analysis was also performed for differentially variable regions.
| comparison | |
| Hypermethylation/hypomethylation | |
| ontology | |
| regions | |
| differential methylation measure |
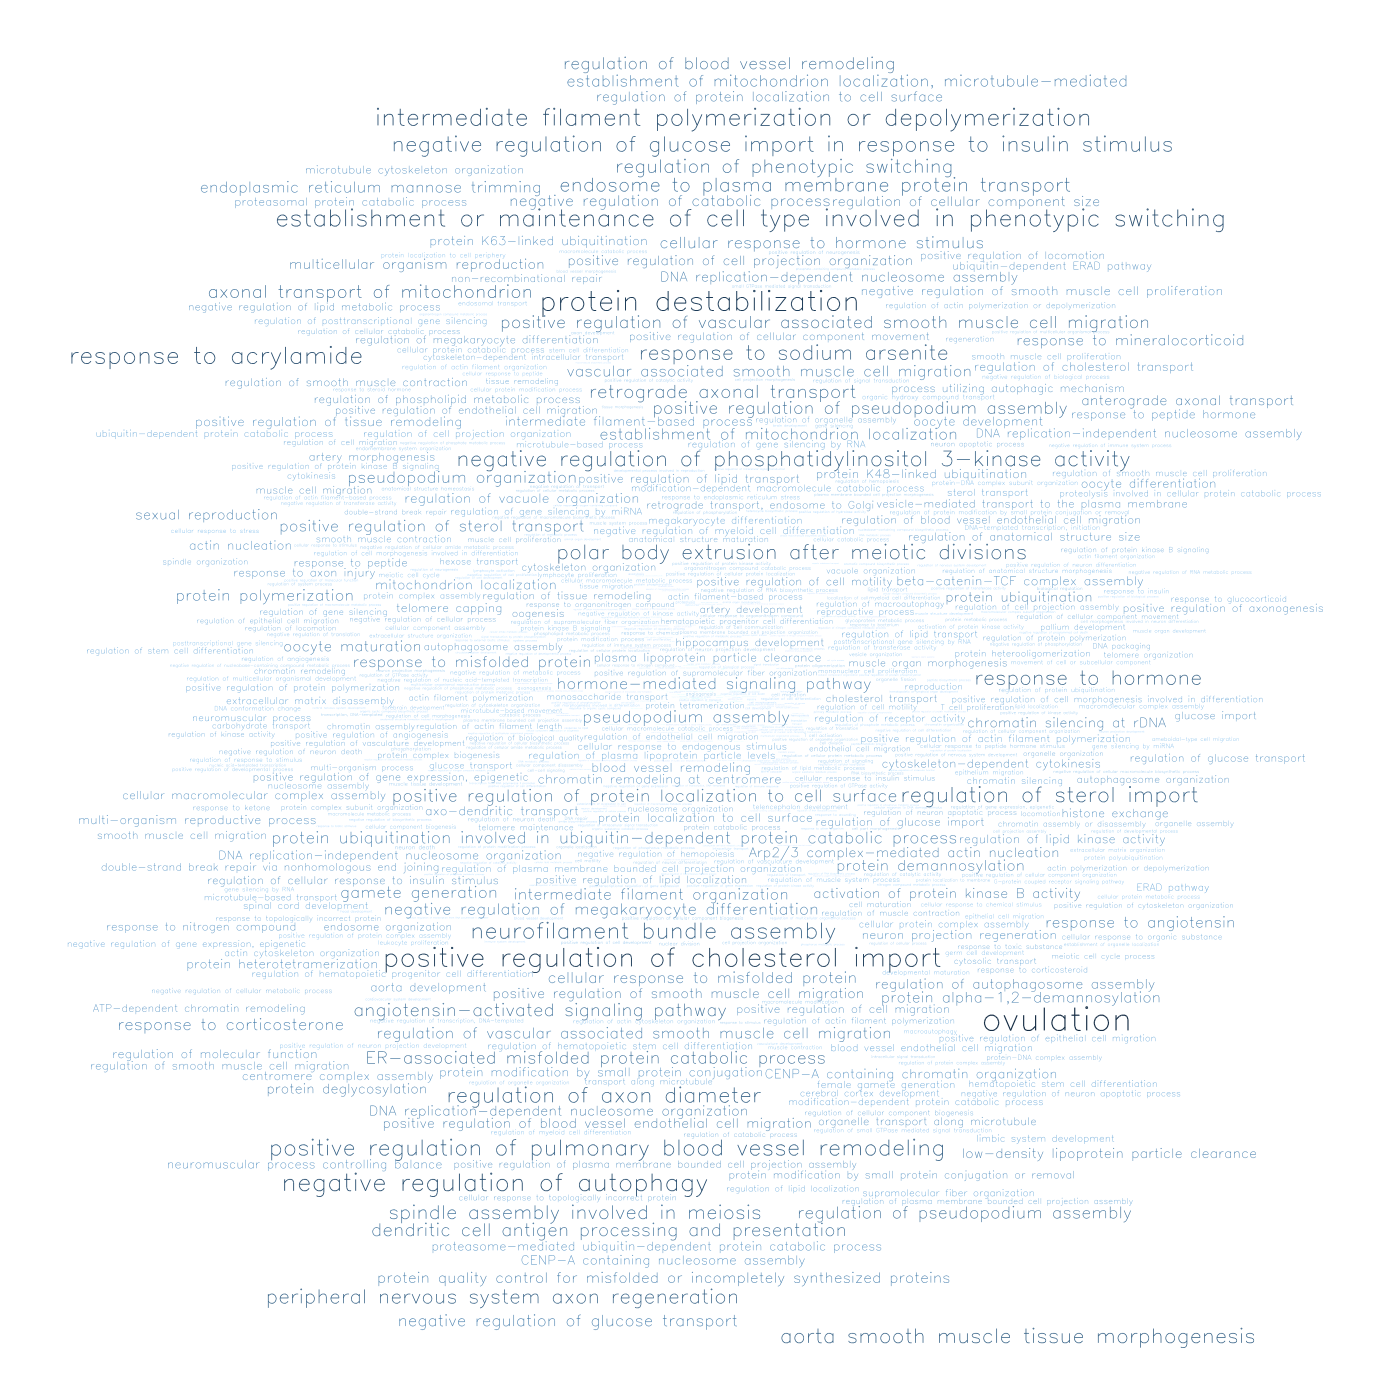
Workclouds for GO enrichment terms (Differential Variability)
| comparison | |
| Hypermethylation/hypomethylation | |
| ontology | |
| regions | |
| differential methylation measure |
| GOMFID | Pvalue | OddsRatio | ExpCount | Count | Size | Term |
| GO:0030728 | 2e-04 | 134.9583 | 0.019 | 2 | 22 | ovulation |
| GO:0031648 | 6e-04 | 67.3958 | 0.0362 | 2 | 42 | protein destabilization |
| GO:1904109 | 9e-04 | Inf | 9e-04 | 1 | 1 | positive regulation of cholesterol import |
| GO:0010507 | 0.0014 | 42.0599 | 0.0569 | 2 | 66 | negative regulation of autophagy |
| GO:0044663 | 0.0017 | 1247.2308 | 0.0017 | 1 | 2 | establishment or maintenance of cell type involved in phenotypic switching |
| GO:0045105 | 0.0017 | 1247.2308 | 0.0017 | 1 | 2 | intermediate filament polymerization or depolymerization |
| GO:1903937 | 0.0017 | 1247.2308 | 0.0017 | 1 | 2 | response to acrylamide |
| GO:0033693 | 0.0026 | 623.5769 | 0.0026 | 1 | 3 | neurofilament bundle assembly |
| GO:1905111 | 0.0026 | 623.5769 | 0.0026 | 1 | 3 | positive regulation of pulmonary blood vessel remodeling |
| GO:0031133 | 0.0034 | 415.6923 | 0.0035 | 1 | 4 | regulation of axon diameter |
| GO:0043553 | 0.0034 | 415.6923 | 0.0035 | 1 | 4 | negative regulation of phosphatidylinositol 3-kinase activity |
| GO:2000909 | 0.0034 | 415.6923 | 0.0035 | 1 | 4 | regulation of sterol import |
| GO:2001274 | 0.0034 | 415.6923 | 0.0035 | 1 | 4 | negative regulation of glucose import in response to insulin stimulus |
| GO:0040038 | 0.0043 | 311.75 | 0.0043 | 1 | 5 | polar body extrusion after meiotic divisions |
| GO:0060414 | 0.0043 | 311.75 | 0.0043 | 1 | 5 | aorta smooth muscle tissue morphogenesis |
| GO:1903935 | 0.0043 | 311.75 | 0.0043 | 1 | 5 | response to sodium arsenite |
| GO:0009725 | 0.0047 | 7.3491 | 0.7255 | 4 | 841 | response to hormone |
| GO:0014012 | 0.0052 | 249.3846 | 0.0052 | 1 | 6 | peripheral nervous system axon regeneration |
| GO:0090306 | 0.006 | 207.8077 | 0.006 | 1 | 7 | spindle assembly involved in meiosis |
| GO:0099638 | 0.006 | 207.8077 | 0.006 | 1 | 7 | endosome to plasma membrane protein transport |
| GO:1900239 | 0.0069 | 178.1099 | 0.0069 | 1 | 8 | regulation of phenotypic switching |
| GO:0008090 | 0.0077 | 155.8365 | 0.0078 | 1 | 9 | retrograde axonal transport |
| GO:0002468 | 0.0086 | 138.5128 | 0.0086 | 1 | 10 | dendritic cell antigen processing and presentation |
| GO:0019896 | 0.0086 | 138.5128 | 0.0086 | 1 | 10 | axonal transport of mitochondrion |
| GO:0038166 | 0.0095 | 124.6538 | 0.0095 | 1 | 11 | angiotensin-activated signaling pathway |
| GOMFID | Pvalue | OddsRatio | ExpCount | Count | Size | Term |
| GO:0006624 | 0.0011 | 2027.375 | 0.0011 | 1 | 2 | vacuolar protein processing |
| GO:0006289 | 0.0016 | 41.8442 | 0.0621 | 2 | 112 | nucleotide-excision repair |
| GO:1902527 | 0.0022 | 675.7083 | 0.0022 | 1 | 4 | positive regulation of protein monoubiquitination |
| GO:1902255 | 0.0028 | 506.75 | 0.0028 | 1 | 5 | positive regulation of intrinsic apoptotic signaling pathway by p53 class mediator |
| GO:0051606 | 0.0038 | 12.7733 | 0.3405 | 3 | 614 | detection of stimulus |
| GO:0016051 | 0.0046 | 24.6298 | 0.1043 | 2 | 188 | carbohydrate biosynthetic process |
| GO:0044262 | 0.0073 | 19.2682 | 0.1325 | 2 | 239 | cellular carbohydrate metabolic process |
| GO:0045721 | 0.0077 | 155.8365 | 0.0078 | 1 | 14 | negative regulation of gluconeogenesis |
| GO:0032515 | 0.0083 | 144.6964 | 0.0083 | 1 | 15 | negative regulation of phosphoprotein phosphatase activity |
| GO:0048012 | 0.0088 | 135.0417 | 0.0089 | 1 | 16 | hepatocyte growth factor receptor signaling pathway |
| GO:0090305 | 0.0094 | 16.815 | 0.1514 | 2 | 273 | nucleic acid phosphodiester bond hydrolysis |
| GO:2000479 | 0.0094 | 126.5938 | 0.0094 | 1 | 17 | regulation of cAMP-dependent protein kinase activity |
| GO:0035635 | 0.0099 | 119.1397 | 0.01 | 1 | 18 | entry of bacterium into host cell |
| GO:0047497 | 0.0099 | 119.1397 | 0.01 | 1 | 18 | mitochondrion transport along microtubule |
| GOMFID | Pvalue | OddsRatio | ExpCount | Count | Size | Term |
| GO:0036037 | 4e-04 | 85.6402 | 0.0286 | 2 | 16 | CD8-positive, alpha-beta T cell activation |
| GO:1901985 | 0.0015 | 39.9259 | 0.0572 | 2 | 32 | positive regulation of protein acetylation |
| GO:0002300 | 0.0018 | Inf | 0.0018 | 1 | 1 | CD8-positive, alpha-beta intraepithelial T cell differentiation |
| GO:2000657 | 0.0018 | Inf | 0.0018 | 1 | 1 | negative regulation of apolipoprotein binding |
| GO:0016572 | 0.0019 | 35.22 | 0.0643 | 2 | 36 | histone phosphorylation |
| GO:0002305 | 0.0036 | 578.5357 | 0.0036 | 1 | 2 | CD8-positive, gamma-delta intraepithelial T cell differentiation |
| GO:0043376 | 0.0036 | 578.5357 | 0.0036 | 1 | 2 | regulation of CD8-positive, alpha-beta T cell differentiation |
| GO:0030595 | 0.0052 | 9.4215 | 0.3556 | 3 | 199 | leukocyte chemotaxis |
| GO:0090170 | 0.0071 | 192.8214 | 0.0071 | 1 | 4 | regulation of Golgi inheritance |
| GO:2000672 | 0.0071 | 192.8214 | 0.0071 | 1 | 4 | negative regulation of motor neuron apoptotic process |
| GOMFID | Pvalue | OddsRatio | ExpCount | Count | Size | Term |
| GO:0045653 | 0 | 405.15 | 0.0078 | 2 | 18 | negative regulation of megakaryocyte differentiation |
| GO:0006335 | 1e-04 | 215.8933 | 0.0138 | 2 | 32 | DNA replication-dependent nucleosome assembly |
| GO:0000183 | 1e-04 | 202.375 | 0.0147 | 2 | 34 | chromatin silencing at rDNA |
| GO:0034080 | 1e-04 | 170.3579 | 0.0173 | 2 | 40 | CENP-A containing nucleosome assembly |
| GO:0051290 | 1e-04 | 154.0952 | 0.019 | 2 | 44 | protein heterotetramerization |
| GO:1904837 | 1e-04 | 154.0952 | 0.019 | 2 | 44 | beta-catenin-TCF complex assembly |
| GO:0034724 | 2e-04 | 132.0245 | 0.022 | 2 | 51 | DNA replication-independent nucleosome organization |
| GO:0016233 | 2e-04 | 122.0302 | 0.0237 | 2 | 55 | telomere capping |
| GO:0006303 | 4e-04 | 92.2971 | 0.0311 | 2 | 72 | double-strand break repair via nonhomologous end joining |
| GO:0043044 | 4e-04 | 88.4877 | 0.0323 | 2 | 75 | ATP-dependent chromatin remodeling |
| GO:0045815 | 5e-04 | 86.1173 | 0.0332 | 2 | 77 | positive regulation of gene expression, epigenetic |
| GO:1902036 | 8e-04 | 66.4948 | 0.0427 | 2 | 99 | regulation of hematopoietic stem cell differentiation |
| GO:0060964 | 8e-04 | 63.8455 | 0.0444 | 2 | 103 | regulation of gene silencing by miRNA |
| GO:0045814 | 0.0011 | 55.0598 | 0.0513 | 2 | 119 | negative regulation of gene expression, epigenetic |
| GO:0060968 | 0.0012 | 51.5104 | 0.0548 | 2 | 127 | regulation of gene silencing |
| GO:1903707 | 0.0014 | 48.0239 | 0.0587 | 2 | 136 | negative regulation of hemopoiesis |
| GO:0031497 | 0.0016 | 45.9486 | 0.0612 | 2 | 142 | chromatin assembly |
| GO:0032200 | 0.002 | 39.9031 | 0.0703 | 2 | 163 | telomere organization |
| GO:0002244 | 0.0026 | 35.2527 | 0.0794 | 2 | 184 | hematopoietic progenitor cell differentiation |
| GO:0065004 | 0.0035 | 30.2075 | 0.0923 | 2 | 214 | protein-DNA complex assembly |
| GO:0006352 | 0.0041 | 27.569 | 0.1009 | 2 | 234 | DNA-templated transcription, initiation |
| GO:0045637 | 0.0041 | 27.569 | 0.1009 | 2 | 234 | regulation of myeloid cell differentiation |
| GO:0048534 | 0.0043 | 13.6312 | 0.3662 | 3 | 849 | hematopoietic or lymphoid organ development |
| GO:0048863 | 0.0049 | 25.2474 | 0.11 | 2 | 255 | stem cell differentiation |
| GO:0071103 | 0.0051 | 24.8482 | 0.1117 | 2 | 259 | DNA conformation change |
| GO:0035194 | 0.0052 | 24.3664 | 0.1139 | 2 | 264 | posttranscriptional gene silencing by RNA |
| GO:0017148 | 0.0091 | 18.1926 | 0.1514 | 2 | 351 | negative regulation of translation |
| GO:0060249 | 0.01 | 17.329 | 0.1587 | 2 | 368 | anatomical structure homeostasis |
| GOMFID | Pvalue | OddsRatio | ExpCount | Count | Size | Term |
| GO:0007014 | 0.0017 | Inf | 0.0017 | 1 | 1 | actin ubiquitination |
| GO:0019408 | 0.0017 | Inf | 0.0017 | 1 | 1 | dolichol biosynthetic process |
| GO:1903883 | 0.0017 | Inf | 0.0017 | 1 | 1 | positive regulation of interleukin-17-mediated signaling pathway |
| GO:1903886 | 0.0017 | Inf | 0.0017 | 1 | 1 | positive regulation of chemokine (C-C motif) ligand 20 production |
| GO:0046580 | 0.0028 | 28.2465 | 0.0794 | 2 | 46 | negative regulation of Ras protein signal transduction |
| GO:0043547 | 0.0043 | 6.8286 | 0.6729 | 4 | 390 | positive regulation of GTPase activity |
| GO:0010803 | 0.0043 | 22.5818 | 0.0983 | 2 | 57 | regulation of tumor necrosis factor-mediated signaling pathway |
| GO:0042787 | 0.0054 | 9.3635 | 0.3589 | 3 | 208 | protein ubiquitination involved in ubiquitin-dependent protein catabolic process |
| GO:0046782 | 0.0054 | 20.0236 | 0.1104 | 2 | 64 | regulation of viral transcription |
| GOMFID | Pvalue | OddsRatio | ExpCount | Count | Size | Term |
| GO:0035606 | 0.001 | 2317.1429 | 0.001 | 1 | 2 | peptidyl-cysteine S-trans-nitrosylation |
| GO:0070488 | 0.001 | 2317.1429 | 0.001 | 1 | 2 | neutrophil aggregation |
| GO:0010159 | 0.0015 | 1158.5 | 0.0015 | 1 | 3 | specification of animal organ position |
| GO:0021615 | 0.002 | 772.2857 | 0.002 | 1 | 4 | glossopharyngeal nerve morphogenesis |
| GO:0060017 | 0.0034 | 386.0714 | 0.0035 | 1 | 7 | parathyroid gland development |
| GO:1904627 | 0.0049 | 257.3333 | 0.0049 | 1 | 10 | response to phorbol 13-acetate 12-myristate |
| GO:0017014 | 0.0059 | 210.5195 | 0.0059 | 1 | 12 | protein nitrosylation |
| GO:0032119 | 0.0059 | 210.5195 | 0.0059 | 1 | 12 | sequestering of zinc ion |
| GO:0002523 | 0.0069 | 178.1099 | 0.0069 | 1 | 14 | leukocyte migration involved in inflammatory response |
| GO:0010042 | 0.0079 | 154.3429 | 0.0079 | 1 | 16 | response to manganese ion |
| GO:0060294 | 0.0084 | 144.6875 | 0.0084 | 1 | 17 | cilium movement involved in cell motility |
| GOMFID | Pvalue | OddsRatio | ExpCount | Count | Size | Term |
| GO:0031648 | 7e-04 | 62.2077 | 0.0388 | 2 | 42 | protein destabilization |
| GO:1904109 | 9e-04 | Inf | 9e-04 | 1 | 1 | positive regulation of cholesterol import |
| GO:0010507 | 0.0017 | 38.8221 | 0.061 | 2 | 66 | negative regulation of autophagy |
| GO:0045105 | 0.0018 | 1158.0714 | 0.0018 | 1 | 2 | intermediate filament polymerization or depolymerization |
| GO:1903937 | 0.0018 | 1158.0714 | 0.0018 | 1 | 2 | response to acrylamide |
| GO:0033693 | 0.0028 | 579 | 0.0028 | 1 | 3 | neurofilament bundle assembly |
| GO:0031133 | 0.0037 | 385.9762 | 0.0037 | 1 | 4 | regulation of axon diameter |
| GO:0043553 | 0.0037 | 385.9762 | 0.0037 | 1 | 4 | negative regulation of phosphatidylinositol 3-kinase activity |
| GO:2000909 | 0.0037 | 385.9762 | 0.0037 | 1 | 4 | regulation of sterol import |
| GO:0040038 | 0.0046 | 289.4643 | 0.0046 | 1 | 5 | polar body extrusion after meiotic divisions |
| GO:1903935 | 0.0046 | 289.4643 | 0.0046 | 1 | 5 | response to sodium arsenite |
| GO:0010760 | 0.0055 | 231.5571 | 0.0055 | 1 | 6 | negative regulation of macrophage chemotaxis |
| GO:0014012 | 0.0055 | 231.5571 | 0.0055 | 1 | 6 | peripheral nervous system axon regeneration |
| GO:0090306 | 0.0065 | 192.9524 | 0.0065 | 1 | 7 | spindle assembly involved in meiosis |
| GO:0099638 | 0.0065 | 192.9524 | 0.0065 | 1 | 7 | endosome to plasma membrane protein transport |
| GO:0008090 | 0.0083 | 144.6964 | 0.0083 | 1 | 9 | retrograde axonal transport |
| GO:0002468 | 0.0092 | 128.6111 | 0.0092 | 1 | 10 | dendritic cell antigen processing and presentation |
| GO:0019896 | 0.0092 | 128.6111 | 0.0092 | 1 | 10 | axonal transport of mitochondrion |
| GOMFID | Pvalue | OddsRatio | ExpCount | Count | Size | Term |
| GO:0031648 | 7e-04 | 62.2077 | 0.0388 | 2 | 42 | protein destabilization |
| GO:0010760 | 0.0055 | 231.5571 | 0.0055 | 1 | 6 | negative regulation of macrophage chemotaxis |
| GO:0003374 | 0.0074 | 165.3776 | 0.0074 | 1 | 8 | dynamin family protein polymerization involved in mitochondrial fission |
| NA. |
| n/a |
| GOMFID | Pvalue | OddsRatio | ExpCount | Count | Size | Term |
| GO:0140076 | 0.0011 | 1622.1 | 0.0011 | 1 | 3 | negative regulation of lipoprotein transport |
| GO:0018344 | 0.0022 | 648.72 | 0.0022 | 1 | 6 | protein geranylgeranylation |
| GO:0019367 | 0.0026 | 540.5667 | 0.0026 | 1 | 7 | fatty acid elongation, saturated fatty acid |
| GO:0034625 | 0.0026 | 540.5667 | 0.0026 | 1 | 7 | fatty acid elongation, monounsaturated fatty acid |
| GO:0034626 | 0.0026 | 540.5667 | 0.0026 | 1 | 7 | fatty acid elongation, polyunsaturated fatty acid |
| GO:1904995 | 0.0026 | 540.5667 | 0.0026 | 1 | 7 | negative regulation of leukocyte adhesion to vascular endothelial cell |
| GO:0098789 | 0.003 | 463.3143 | 0.003 | 1 | 8 | pre-mRNA cleavage required for polyadenylation |
| GO:0097354 | 0.0033 | 405.375 | 0.0033 | 1 | 9 | prenylation |
| GO:0035195 | 0.0036 | 31.1855 | 0.0954 | 2 | 258 | gene silencing by miRNA |
| GO:0090370 | 0.0037 | 360.3111 | 0.0037 | 1 | 10 | negative regulation of cholesterol efflux |
| GO:0016441 | 0.0038 | 30.3422 | 0.098 | 2 | 265 | posttranscriptional gene silencing |
| GO:0010985 | 0.0041 | 324.26 | 0.0041 | 1 | 11 | negative regulation of lipoprotein particle clearance |
| GO:0036109 | 0.0044 | 294.7636 | 0.0044 | 1 | 12 | alpha-linolenic acid metabolic process |
| GO:0031047 | 0.0045 | 27.8619 | 0.1065 | 2 | 288 | gene silencing by RNA |
| GO:0042761 | 0.0048 | 270.1833 | 0.0048 | 1 | 13 | very long-chain fatty acid biosynthetic process |
| GO:0043651 | 0.0059 | 216.1067 | 0.0059 | 1 | 16 | linoleic acid metabolic process |
| GO:0035338 | 0.0063 | 202.5875 | 0.0063 | 1 | 17 | long-chain fatty-acyl-CoA biosynthetic process |
| GO:0032372 | 0.0066 | 190.6588 | 0.0067 | 1 | 18 | negative regulation of sterol transport |
| GO:0044872 | 0.007 | 180.0556 | 0.007 | 1 | 19 | lipoprotein localization |
| GO:0034249 | 0.0071 | 21.8457 | 0.1349 | 2 | 365 | negative regulation of cellular amide metabolic process |
| GO:0006379 | 0.0088 | 140.8696 | 0.0089 | 1 | 24 | mRNA cleavage |
| NA. |
| n/a |
| GOMFID | Pvalue | OddsRatio | ExpCount | Count | Size | Term |
| GO:1904628 | 0 | 772.0952 | 0.0044 | 2 | 8 | cellular response to phorbol 13-acetate 12-myristate |
| GO:0050918 | 4e-04 | 83.974 | 0.0316 | 2 | 57 | positive chemotaxis |
| GO:0002548 | 5e-04 | 76.9524 | 0.0344 | 2 | 62 | monocyte chemotaxis |
| GO:0050829 | 8e-04 | 62.3398 | 0.0421 | 2 | 76 | defense response to Gram-negative bacterium |
| GO:0050830 | 0.001 | 55.5491 | 0.0471 | 2 | 85 | defense response to Gram-positive bacterium |
| GO:1990668 | 0.0033 | 405.375 | 0.0033 | 1 | 6 | vesicle fusion with endoplasmic reticulum-Golgi intermediate compartment (ERGIC) membrane |
| GO:0048280 | 0.005 | 253.3125 | 0.005 | 1 | 9 | vesicle fusion with Golgi apparatus |
| GO:1902902 | 0.0055 | 225.1528 | 0.0055 | 1 | 10 | negative regulation of autophagosome assembly |
| GO:0015671 | 0.0083 | 144.6964 | 0.0083 | 1 | 15 | oxygen transport |
| GO:0060326 | 0.0085 | 17.6766 | 0.1442 | 2 | 260 | cell chemotaxis |
| GO:0045292 | 0.0088 | 135.0417 | 0.0089 | 1 | 16 | mRNA cis splicing, via spliceosome |
| GOMFID | Pvalue | OddsRatio | ExpCount | Count | Size | Term |
| GO:0016441 | 1e-04 | 24.4506 | 0.2286 | 4 | 265 | posttranscriptional gene silencing |
| GO:0031047 | 1e-04 | 22.438 | 0.2484 | 4 | 288 | gene silencing by RNA |
| GO:0034249 | 2e-04 | 17.5668 | 0.3149 | 4 | 365 | negative regulation of cellular amide metabolic process |
| GO:2000113 | 9e-04 | 7.5455 | 1.2698 | 6 | 1472 | negative regulation of cellular macromolecule biosynthetic process |
| GO:0009890 | 0.0015 | 6.7246 | 1.4087 | 6 | 1633 | negative regulation of biosynthetic process |
| GO:0044338 | 0.0017 | 1247.2308 | 0.0017 | 1 | 2 | canonical Wnt signaling pathway involved in mesenchymal stem cell differentiation |
| GO:0035425 | 0.0026 | 623.5769 | 0.0026 | 1 | 3 | autocrine signaling |
| GO:0010629 | 0.0027 | 5.9541 | 1.57 | 6 | 1820 | negative regulation of gene expression |
| GO:0060964 | 0.0035 | 26.5908 | 0.0889 | 2 | 103 | regulation of gene silencing by miRNA |
| GO:0006412 | 0.0036 | 7.9907 | 0.6703 | 4 | 777 | translation |
| GO:0003150 | 0.0043 | 311.75 | 0.0043 | 1 | 5 | muscular septum morphogenesis |
| GO:0044339 | 0.0052 | 249.3846 | 0.0052 | 1 | 6 | canonical Wnt signaling pathway involved in osteoblast differentiation |
| GO:0060022 | 0.0052 | 249.3846 | 0.0052 | 1 | 6 | hard palate development |
| GO:0060968 | 0.0052 | 21.4533 | 0.1096 | 2 | 127 | regulation of gene silencing |
| GO:0043604 | 0.0055 | 7.0126 | 0.7583 | 4 | 879 | amide biosynthetic process |
| GO:0035195 | 0.0057 | 20.8641 | 0.1153 | 2 | 155 | gene silencing by miRNA |
| GO:0006518 | 0.007 | 6.5369 | 0.81 | 4 | 939 | peptide metabolic process |
| GO:0003149 | 0.0077 | 155.8365 | 0.0078 | 1 | 9 | membranous septum morphogenesis |
| GO:0035414 | 0.0086 | 138.5128 | 0.0086 | 1 | 10 | negative regulation of catenin import into nucleus |
| GOMFID | Pvalue | OddsRatio | ExpCount | Count | Size | Term |
| GO:0005179 | 0.0034 | 27.4547 | 0.0882 | 2 | 119 | hormone activity |
| GO:0008022 | 0.007 | 18.7216 | 0.1282 | 2 | 173 | protein C-terminus binding |
| GO:0001055 | 0.0081 | 146.9818 | 0.0082 | 1 | 11 | RNA polymerase II activity |
| GO:0043274 | 0.0096 | 122.4697 | 0.0096 | 1 | 13 | phospholipase binding |
| GO:1904264 | 0.0096 | 122.4697 | 0.0096 | 1 | 13 | ubiquitin protein ligase activity involved in ERAD pathway |
| GOMFID | Pvalue | OddsRatio | ExpCount | Count | Size | Term |
| GO:0001055 | 0 | 299.3889 | 0.0095 | 2 | 11 | RNA polymerase II activity |
| GO:0034062 | 6e-04 | 65.5894 | 0.0372 | 2 | 43 | 5'-3' RNA polymerase activity |
| GO:0031249 | 9e-04 | Inf | 9e-04 | 1 | 1 | denatured protein binding |
| GO:0055131 | 0.0052 | 248.7846 | 0.0052 | 1 | 6 | C3HC4-type RING finger domain binding |
| GO:0016779 | 0.0052 | 21.4013 | 0.1098 | 2 | 127 | nucleotidyltransferase activity |
| GO:0016740 | 0.0086 | 4.5687 | 1.9776 | 6 | 2287 | transferase activity |
| GOMFID | Pvalue | OddsRatio | ExpCount | Count | Size | Term |
| GO:0005549 | 5e-04 | 79.516 | 0.0359 | 2 | 83 | odorant binding |
| GO:0004522 | 0.0017 | 898.8889 | 0.0017 | 1 | 4 | ribonuclease A activity |
| GO:0004865 | 0.0035 | 385.1429 | 0.0035 | 1 | 8 | protein serine/threonine phosphatase inhibitor activity |
| GO:0008157 | 0.0078 | 158.4902 | 0.0078 | 1 | 18 | protein phosphatase 1 binding |
| GO:0016894 | 0.0095 | 128.2698 | 0.0095 | 1 | 22 | endonuclease activity, active with either ribo- or deoxyribonucleic acids and producing 3'-phosphomonoesters |
| GOMFID | Pvalue | OddsRatio | ExpCount | Count | Size | Term |
| GO:0048020 | 3e-04 | 96.9489 | 0.0265 | 2 | 39 | CCR chemokine receptor binding |
| GO:0008009 | 5e-04 | 77.9372 | 0.0326 | 2 | 48 | chemokine activity |
| GO:0004095 | 0.0027 | 539.2 | 0.0027 | 1 | 4 | carnitine O-palmitoyltransferase activity |
| GO:0016274 | 0.0081 | 146.9818 | 0.0082 | 1 | 12 | protein-arginine N-methyltransferase activity |
| GOMFID | Pvalue | OddsRatio | ExpCount | Count | Size | Term |
| GO:0001055 | 2e-04 | 138.0598 | 0.019 | 2 | 11 | RNA polymerase II activity |
| GO:0000254 | 0.0017 | Inf | 0.0017 | 1 | 1 | C-4 methylsterol oxidase activity |
| GO:0034062 | 0.0025 | 30.2458 | 0.0744 | 2 | 43 | 5'-3' RNA polymerase activity |
| GO:0071791 | 0.0035 | 598.5556 | 0.0035 | 1 | 2 | chemokine (C-C motif) ligand 5 binding |
| GO:0004702 | 0.0056 | 19.6569 | 0.1124 | 2 | 65 | signal transducer, downstream of receptor, with serine/threonine kinase activity |
| GO:0097016 | 0.0069 | 199.4938 | 0.0069 | 1 | 4 | L27 domain binding |
| GO:0005134 | 0.0086 | 149.6111 | 0.0086 | 1 | 5 | interleukin-2 receptor binding |
| GOMFID | Pvalue | OddsRatio | ExpCount | Count | Size | Term |
| GO:0016493 | 2e-04 | 119.637 | 0.0215 | 2 | 12 | C-C chemokine receptor activity |
| GO:0001637 | 9e-04 | 51.9742 | 0.0448 | 2 | 25 | G-protein coupled chemoattractant receptor activity |
| GO:0005544 | 0.0028 | 28.4286 | 0.0788 | 2 | 44 | calcium-dependent phospholipid binding |
| GO:0070699 | 0.0036 | 577.1429 | 0.0036 | 1 | 2 | type II activin receptor binding |
| GO:0071791 | 0.0036 | 577.1429 | 0.0036 | 1 | 2 | chemokine (C-C motif) ligand 5 binding |
| GO:0004702 | 0.006 | 18.9277 | 0.1164 | 2 | 65 | signal transducer, downstream of receptor, with serine/threonine kinase activity |
| GO:0034711 | 0.0071 | 192.3571 | 0.0072 | 1 | 4 | inhibin binding |
| GO:0097016 | 0.0071 | 192.3571 | 0.0072 | 1 | 4 | L27 domain binding |
| GO:0031727 | 0.0089 | 144.2589 | 0.009 | 1 | 5 | CCR2 chemokine receptor binding |
| GO:0004896 | 0.0096 | 14.7051 | 0.1487 | 2 | 83 | cytokine receptor activity |
| GOMFID | Pvalue | OddsRatio | ExpCount | Count | Size | Term |
| GO:0005549 | 5e-04 | 79.516 | 0.0359 | 2 | 83 | odorant binding |
| GO:0042393 | 0.0026 | 35.3635 | 0.0791 | 2 | 183 | histone binding |
| GO:0005095 | 0.006 | 207.3077 | 0.0061 | 1 | 14 | GTPase inhibitor activity |
| GOMFID | Pvalue | OddsRatio | ExpCount | Count | Size | Term |
| GO:0005134 | 0.0028 | 505.5312 | 0.0028 | 1 | 5 | interleukin-2 receptor binding |
| GO:0043515 | 0.0028 | 505.5312 | 0.0028 | 1 | 5 | kinetochore binding |
| GO:0016493 | 0.0067 | 183.75 | 0.0067 | 1 | 12 | C-C chemokine receptor activity |
| GO:0071837 | 0.01 | 118.8529 | 0.01 | 1 | 18 | HMG box domain binding |
| GOMFID | Pvalue | OddsRatio | ExpCount | Count | Size | Term |
| GO:0001055 | 2e-04 | 128.1825 | 0.0204 | 2 | 11 | RNA polymerase II activity |
| GO:0060589 | 3e-04 | 9.5939 | 0.6208 | 5 | 335 | nucleoside-triphosphatase regulator activity |
| GO:0005096 | 0.0015 | 9.1926 | 0.5003 | 4 | 270 | GTPase activator activity |
| GO:0034062 | 0.0029 | 28.0819 | 0.0797 | 2 | 43 | 5'-3' RNA polymerase activity |
| GO:0000253 | 0.0074 | 185.7126 | 0.0074 | 1 | 4 | 3-keto sterol reductase activity |
| GOMFID | Pvalue | OddsRatio | ExpCount | Count | Size | Term |
| GO:0046811 | 6e-04 | 4046 | 6e-04 | 1 | 2 | histone deacetylase inhibitor activity |
| GO:0051430 | 0.0012 | 1348.5 | 0.0012 | 1 | 4 | corticotropin-releasing hormone receptor 1 binding |
| GO:0051431 | 0.0012 | 1348.5 | 0.0012 | 1 | 4 | corticotropin-releasing hormone receptor 2 binding |
| GO:0004984 | 0.005 | 28.5745 | 0.1146 | 2 | 371 | olfactory receptor activity |
| GO:0051428 | 0.0062 | 212.7105 | 0.0062 | 1 | 20 | peptide hormone receptor binding |
| GO:0048018 | 0.0071 | 23.69 | 0.1374 | 2 | 445 | receptor ligand activity |
| GO:0071855 | 0.0086 | 149.6111 | 0.0086 | 1 | 28 | neuropeptide receptor binding |
| GO:0005184 | 0.0089 | 144.2589 | 0.009 | 1 | 29 | neuropeptide hormone activity |
| GOMFID | Pvalue | OddsRatio | ExpCount | Count | Size | Term |
| GO:0071933 | 0.0028 | 505.5312 | 0.0028 | 1 | 9 | Arp2/3 complex binding |
| GO:0017049 | 0.0052 | 252.6406 | 0.0053 | 1 | 17 | GTP-Rho binding |
| GOMFID | Pvalue | OddsRatio | ExpCount | Count | Size | Term |
| GO:0005125 | 3e-04 | 32.1268 | 0.1334 | 3 | 216 | cytokine activity |
| GO:0031851 | 6e-04 | Inf | 6e-04 | 1 | 1 | kappa-type opioid receptor binding |
| GO:0032003 | 6e-04 | Inf | 6e-04 | 1 | 1 | interleukin-28 receptor binding |
| GO:0004522 | 0.0025 | 599.1481 | 0.0025 | 1 | 4 | ribonuclease A activity |
| GO:0030545 | 0.0025 | 14.3567 | 0.2915 | 3 | 472 | receptor regulator activity |
| GO:0005134 | 0.0031 | 449.3333 | 0.0031 | 1 | 5 | interleukin-2 receptor binding |
| GO:0043208 | 0.0049 | 256.7143 | 0.0049 | 1 | 8 | glycosphingolipid binding |
| GO:0008270 | 0.0099 | 8.6359 | 0.4744 | 3 | 768 | zinc ion binding |
| GOMFID | Pvalue | OddsRatio | ExpCount | Count | Size | Term |
| GO:0016175 | 0.0028 | 505.5312 | 0.0028 | 1 | 9 | superoxide-generating NADPH oxidase activity |
| GO:0016176 | 0.0031 | 449.3333 | 0.0031 | 1 | 10 | superoxide-generating NADPH oxidase activator activity |
| GOMFID | Pvalue | OddsRatio | ExpCount | Count | Size | Term |
| GO:0035662 | 0.0017 | 1011.1875 | 0.0017 | 1 | 3 | Toll-like receptor 4 binding |
| GO:0050544 | 0.0028 | 505.5312 | 0.0028 | 1 | 5 | arachidonic acid binding |
| GO:0032395 | 0.005 | 252.7031 | 0.005 | 1 | 9 | MHC class II receptor activity |
| GO:0036041 | 0.0061 | 202.1375 | 0.0061 | 1 | 11 | long-chain fatty acid binding |
| GO:0050786 | 0.0061 | 202.1375 | 0.0061 | 1 | 11 | RAGE receptor binding |
| GO:0071837 | 0.01 | 118.8529 | 0.01 | 1 | 18 | HMG box domain binding |
| GOMFID | Pvalue | OddsRatio | ExpCount | Count | Size | Term |
| GO:0031859 | 6e-04 | Inf | 6e-04 | 1 | 1 | platelet activating factor receptor binding |
| GO:0042624 | 6e-04 | Inf | 6e-04 | 1 | 1 | ATPase activity, uncoupled |
| GO:0031691 | 0.0012 | 1797.6667 | 0.0012 | 1 | 2 | alpha-1A adrenergic receptor binding |
| GO:0031762 | 0.0012 | 1797.6667 | 0.0012 | 1 | 2 | follicle-stimulating hormone receptor binding |
| GO:0031692 | 0.0019 | 898.7778 | 0.0019 | 1 | 3 | alpha-1B adrenergic receptor binding |
| GO:0031826 | 0.0019 | 898.7778 | 0.0019 | 1 | 3 | type 2A serotonin receptor binding |
| GO:1990763 | 0.0037 | 359.4444 | 0.0037 | 1 | 6 | arrestin family protein binding |
| GO:0031748 | 0.0049 | 256.7143 | 0.0049 | 1 | 8 | D1 dopamine receptor binding |
| GO:0031702 | 0.0062 | 199.642 | 0.0062 | 1 | 10 | type 1 angiotensin receptor binding |
| GO:0043422 | 0.0074 | 163.3232 | 0.0074 | 1 | 12 | protein kinase B binding |
| GOMFID | Pvalue | OddsRatio | ExpCount | Count | Size | Term |
| GO:0042624 | 4e-04 | Inf | 4e-04 | 1 | 1 | ATPase activity, uncoupled |
| GO:0033038 | 0.0086 | 141.7895 | 0.0086 | 1 | 20 | bitter taste receptor activity |
| GO:0046961 | 0.0086 | 141.7895 | 0.0086 | 1 | 20 | proton-transporting ATPase activity, rotational mechanism |
| GOMFID | Pvalue | OddsRatio | ExpCount | Count | Size | Term |
| GO:0033981 | 0.001 | Inf | 0.001 | 1 | 1 | D-dopachrome decarboxylase activity |
| GO:0050178 | 0.002 | 1078.2 | 0.002 | 1 | 2 | phenylpyruvate tautomerase activity |
| GO:0004167 | 0.003 | 539.0667 | 0.003 | 1 | 3 | dopachrome isomerase activity |
| GOMFID | Pvalue | OddsRatio | ExpCount | Count | Size | Term |
| GO:0001055 | 0 | 276.3419 | 0.0102 | 2 | 11 | RNA polymerase II activity |
| GO:0034062 | 7e-04 | 60.5403 | 0.0398 | 2 | 43 | 5'-3' RNA polymerase activity |
| GO:0033981 | 9e-04 | Inf | 9e-04 | 1 | 1 | D-dopachrome decarboxylase activity |
| GO:0050178 | 0.0019 | 1155.2857 | 0.0019 | 1 | 2 | phenylpyruvate tautomerase activity |
| GO:0004167 | 0.0028 | 577.6071 | 0.0028 | 1 | 3 | dopachrome isomerase activity |
| GO:0019763 | 0.0055 | 231 | 0.0056 | 1 | 6 | immunoglobulin receptor activity |
| GO:0016779 | 0.006 | 19.7538 | 0.1177 | 2 | 127 | nucleotidyltransferase activity |
| GOMFID | Pvalue | OddsRatio | ExpCount | Count | Size | Term |
| GO:1903231 | 0 | 223.2917 | 0.0343 | 3 | 111 | mRNA binding involved in posttranscriptional gene silencing |
| GO:0005153 | 6e-04 | 4046 | 6e-04 | 1 | 2 | interleukin-8 receptor binding |
| GO:0003723 | 0.009 | 13.2315 | 0.5099 | 3 | 1651 | RNA binding |
| GOMFID | Pvalue | OddsRatio | ExpCount | Count | Size | Term |
| GO:0032395 | 0.0061 | 202.1375 | 0.0061 | 1 | 9 | MHC class II receptor activity |
| GO:0008143 | 0.0095 | 124.3538 | 0.0095 | 1 | 14 | poly(A) binding |
| GOMFID | Pvalue | OddsRatio | ExpCount | Count | Size | Term |
| GO:0004984 | 6e-04 | 25.7837 | 0.1833 | 3 | 371 | olfactory receptor activity |
| GO:0005549 | 7e-04 | 66.2593 | 0.041 | 2 | 83 | odorant binding |
| GO:1903231 | 0.0013 | 49.1529 | 0.0548 | 2 | 111 | mRNA binding involved in posttranscriptional gene silencing |
| GO:0004930 | 0.0053 | 11.8318 | 0.3874 | 3 | 784 | G-protein coupled receptor activity |
| GOMFID | Pvalue | OddsRatio | ExpCount | Count | Size | Term |
| GO:0004035 | 0.0015 | 1078.7333 | 0.0015 | 1 | 4 | alkaline phosphatase activity |
| GO:0001849 | 0.003 | 462.2 | 0.003 | 1 | 8 | complement component C1q binding |
| GOMFID | Pvalue | OddsRatio | ExpCount | Count | Size | Term |
| GO:0019767 | 0.0014 | 1617.8 | 0.0014 | 1 | 2 | IgE receptor activity |
| GO:0046811 | 0.0014 | 1617.8 | 0.0014 | 1 | 2 | histone deacetylase inhibitor activity |
| GO:1903231 | 0.0025 | 32.7625 | 0.0754 | 2 | 111 | mRNA binding involved in posttranscriptional gene silencing |
| GO:0051430 | 0.0027 | 539.2 | 0.0027 | 1 | 4 | corticotropin-releasing hormone receptor 1 binding |
| GO:0051431 | 0.0027 | 539.2 | 0.0027 | 1 | 4 | corticotropin-releasing hormone receptor 2 binding |
| GO:0019863 | 0.0034 | 404.375 | 0.0034 | 1 | 5 | IgE binding |
| GO:0001849 | 0.0054 | 231.0286 | 0.0054 | 1 | 8 | complement component C1q binding |
| GO:0008553 | 0.0054 | 231.0286 | 0.0054 | 1 | 8 | hydrogen-exporting ATPase activity, phosphorylative mechanism |
| GO:0034713 | 0.0061 | 202.1375 | 0.0061 | 1 | 9 | type I transforming growth factor beta receptor binding |
| GO:0019864 | 0.0075 | 161.69 | 0.0075 | 1 | 11 | IgG binding |
| GO:0035091 | 0.0088 | 16.8173 | 0.1447 | 2 | 213 | phosphatidylinositol binding |
| GOMFID | Pvalue | OddsRatio | ExpCount | Count | Size | Term |
| GO:0004869 | 0.001 | 49.7593 | 0.0484 | 2 | 56 | cysteine-type endopeptidase inhibitor activity |
| GO:0071791 | 0.0017 | 1244.2308 | 0.0017 | 1 | 2 | chemokine (C-C motif) ligand 5 binding |
| GO:0030628 | 0.0043 | 311 | 0.0043 | 1 | 5 | pre-mRNA 3'-splice site binding |
| GO:0008474 | 0.0086 | 138.1795 | 0.0086 | 1 | 10 | palmitoyl-(protein) hydrolase activity |
| GO:0045028 | 0.0086 | 138.1795 | 0.0086 | 1 | 10 | G-protein coupled purinergic nucleotide receptor activity |
| GO:0061135 | 0.0091 | 15.977 | 0.1461 | 2 | 169 | endopeptidase regulator activity |
| GO:0030414 | 0.0093 | 15.786 | 0.1479 | 2 | 171 | peptidase inhibitor activity |
| GOMFID | Pvalue | OddsRatio | ExpCount | Count | Size | Term |
| GO:1903231 | 7e-04 | 73.7385 | 0.0411 | 2 | 111 | mRNA binding involved in posttranscriptional gene silencing |
| GO:0004663 | 0.0011 | 1618.2 | 0.0011 | 1 | 3 | Rab geranylgeranyltransferase activity |
| GO:0008318 | 0.0022 | 647.16 | 0.0022 | 1 | 6 | protein prenyltransferase activity |
| GO:0009922 | 0.0026 | 539.2667 | 0.0026 | 1 | 7 | fatty acid elongase activity |
| GO:0102336 | 0.0026 | 539.2667 | 0.0026 | 1 | 7 | 3-oxo-arachidoyl-CoA synthase activity |
| GO:0102337 | 0.0026 | 539.2667 | 0.0026 | 1 | 7 | 3-oxo-cerotoyl-CoA synthase activity |
| GO:0102338 | 0.0026 | 539.2667 | 0.0026 | 1 | 7 | 3-oxo-lignoceronyl-CoA synthase activity |
| GO:0102756 | 0.0026 | 539.2667 | 0.0026 | 1 | 7 | very-long-chain 3-ketoacyl-CoA synthase activity |
| GOMFID | Pvalue | OddsRatio | ExpCount | Count | Size | Term |
| GO:0005549 | 0.0051 | Inf | 0.0051 | 1 | 83 | odorant binding |
| GOMFID | Pvalue | OddsRatio | ExpCount | Count | Size | Term |
| GO:0042056 | 1e-04 | 170.9418 | 0.0161 | 2 | 29 | chemoattractant activity |
| GO:0017070 | 0.0061 | 202.1375 | 0.0061 | 1 | 11 | U6 snRNA binding |
| GO:0005344 | 0.0078 | 155.4615 | 0.0078 | 1 | 14 | oxygen carrier activity |
| GO:0030955 | 0.0083 | 144.3482 | 0.0083 | 1 | 15 | potassium ion binding |
| GO:0042288 | 0.01 | 118.8529 | 0.01 | 1 | 18 | MHC class I protein binding |
| GOMFID | Pvalue | OddsRatio | ExpCount | Count | Size | Term |
| GO:1903231 | 0.0029 | 29.4844 | 0.0823 | 2 | 111 | mRNA binding involved in posttranscriptional gene silencing |
| GO:0001055 | 0.0081 | 146.9818 | 0.0082 | 1 | 11 | RNA polymerase II activity |
| NA. |
| n/a |
| NA. |
| n/a |
| NA. |
| n/a |
| NA. |
| n/a |
| NA. |
| n/a |
| NA. |
| n/a |
| NA. |
| n/a |
| NA. |
| n/a |
| NA. |
| n/a |
| NA. |
| n/a |
| NA. |
| n/a |
| NA. |
| n/a |
| NA. |
| n/a |
| NA. |
| n/a |
| NA. |
| n/a |
| NA. |
| n/a |
| NA. |
| n/a |
| NA. |
| n/a |
| NA. |
| n/a |
| NA. |
| n/a |
| NA. |
| n/a |
| NA. |
| n/a |
| NA. |
| n/a |
| NA. |
| n/a |
| NA. |
| n/a |
| NA. |
| n/a |
| NA. |
| n/a |
| NA. |
| n/a |
| NA. |
| n/a |
| NA. |
| n/a |
| NA. |
| n/a |
| NA. |
| n/a |
| NA. |
| n/a |
| NA. |
| n/a |
| NA. |
| n/a |
| NA. |
| n/a |
| NA. |
| n/a |
| NA. |
| n/a |
| NA. |
| n/a |
| NA. |
| n/a |
| NA. |
| n/a |
| NA. |
| n/a |
| NA. |
| n/a |
| NA. |
| n/a |
| NA. |
| n/a |
| NA. |
| n/a |
| NA. |
| n/a |
| NA. |
| n/a |
| NA. |
| n/a |
| NA. |
| n/a |
| NA. |
| n/a |
| NA. |
| n/a |
| NA. |
| n/a |
| NA. |
| n/a |
| NA. |
| n/a |
| NA. |
| n/a |
| GOMFID | Pvalue | OddsRatio | ExpCount | Count | Size | Term |
| GO:0032458 | 8e-04 | Inf | 8e-04 | 1 | 1 | slow endocytic recycling |
| GO:0061146 | 0.0024 | 675.625 | 0.0024 | 1 | 3 | Peyer's patch morphogenesis |
| GO:0071593 | 0.0024 | 675.625 | 0.0024 | 1 | 3 | lymphocyte aggregation |
| GO:0097021 | 0.0024 | 675.625 | 0.0024 | 1 | 3 | lymphocyte migration into lymphoid organs |
| GO:0050921 | 0.0045 | 23.2193 | 0.1025 | 2 | 128 | positive regulation of chemotaxis |
| GO:0048537 | 0.0048 | 270.2 | 0.0048 | 1 | 6 | mucosal-associated lymphoid tissue development |
| GO:0060753 | 0.0048 | 270.2 | 0.0048 | 1 | 6 | regulation of mast cell chemotaxis |
| GO:0060263 | 0.0096 | 122.7727 | 0.0096 | 1 | 12 | regulation of respiratory burst |
| GO:0097531 | 0.0096 | 122.7727 | 0.0096 | 1 | 12 | mast cell migration |
| GOMFID | Pvalue | OddsRatio | ExpCount | Count | Size | Term |
| GO:0030421 | 0.0017 | Inf | 0.0017 | 1 | 1 | defecation |
| GO:0061580 | 0.0017 | Inf | 0.0017 | 1 | 1 | colon epithelial cell migration |
| GO:0086024 | 0.0017 | Inf | 0.0017 | 1 | 1 | adrenergic receptor signaling pathway involved in positive regulation of heart rate |
| GO:0006480 | 0.0033 | 623.1538 | 0.0033 | 1 | 2 | N-terminal protein amino acid methylation |
| GO:0006711 | 0.0033 | 623.1538 | 0.0033 | 1 | 2 | estrogen catabolic process |
| GO:1901898 | 0.0033 | 623.1538 | 0.0033 | 1 | 2 | negative regulation of relaxation of cardiac muscle |
| GO:0032922 | 0.0035 | 25.3365 | 0.0882 | 2 | 53 | circadian regulation of gene expression |
| GO:0003245 | 0.005 | 311.5577 | 0.005 | 1 | 3 | cardiac muscle tissue growth involved in heart morphogenesis |
| GO:0071918 | 0.0066 | 207.6923 | 0.0067 | 1 | 4 | urea transmembrane transport |
| GO:2000623 | 0.0066 | 207.6923 | 0.0067 | 1 | 4 | negative regulation of nuclear-transcribed mRNA catabolic process, nonsense-mediated decay |
| GOMFID | Pvalue | OddsRatio | ExpCount | Count | Size | Term |
| GO:0061580 | 0.0014 | Inf | 0.0014 | 1 | 1 | colon epithelial cell migration |
| GO:0006687 | 0.004 | 23.6513 | 0.0949 | 2 | 67 | glycosphingolipid metabolic process |
| GO:0099566 | 0.0042 | 368.2955 | 0.0043 | 1 | 3 | regulation of postsynaptic cytosolic calcium ion concentration |
| GO:0006682 | 0.0071 | 184.125 | 0.0071 | 1 | 5 | galactosylceramide biosynthetic process |
| GO:0061087 | 0.0071 | 184.125 | 0.0071 | 1 | 5 | positive regulation of histone H3-K27 methylation |
| GO:0051597 | 0.0099 | 122.7348 | 0.0099 | 1 | 7 | response to methylmercury |
| GOMFID | Pvalue | OddsRatio | ExpCount | Count | Size | Term |
| GO:0061900 | 0.0011 | 47.9289 | 0.0482 | 2 | 27 | glial cell activation |
| GO:0048240 | 0.0011 | 46.0826 | 0.05 | 2 | 28 | sperm capacitation |
| GO:0002881 | 0.0018 | Inf | 0.0018 | 1 | 1 | negative regulation of chronic inflammatory response to non-antigenic stimulus |
| GO:0019408 | 0.0018 | Inf | 0.0018 | 1 | 1 | dolichol biosynthetic process |
| GO:0061512 | 0.002 | 34.2138 | 0.0661 | 2 | 37 | protein localization to cilium |
| GO:0007266 | 0.0033 | 11.1457 | 0.302 | 3 | 169 | Rho protein signal transduction |
| GO:0042495 | 0.0036 | 578.5714 | 0.0036 | 1 | 2 | detection of triacyl bacterial lipopeptide |
| GO:0042496 | 0.0036 | 578.5714 | 0.0036 | 1 | 2 | detection of diacyl bacterial lipopeptide |
| GO:0050854 | 0.004 | 23.4568 | 0.0947 | 2 | 53 | regulation of antigen receptor-mediated signaling pathway |
| GO:0030595 | 0.0052 | 9.4221 | 0.3556 | 3 | 199 | leukocyte chemotaxis |
| GO:0042116 | 0.0053 | 20.2662 | 0.109 | 2 | 61 | macrophage activation |
| GO:0002282 | 0.0054 | 289.2679 | 0.0054 | 1 | 3 | microglial cell activation involved in immune response |
| GO:0014005 | 0.0054 | 289.2679 | 0.0054 | 1 | 3 | microglia development |
| GO:0032289 | 0.0054 | 289.2679 | 0.0054 | 1 | 3 | central nervous system myelin formation |
| GO:0035915 | 0.0054 | 289.2679 | 0.0054 | 1 | 3 | pore formation in membrane of other organism |
| GO:0038123 | 0.0054 | 289.2679 | 0.0054 | 1 | 3 | toll-like receptor TLR1:TLR2 signaling pathway |
| GO:0071727 | 0.0054 | 289.2679 | 0.0054 | 1 | 3 | cellular response to triacyl bacterial lipopeptide |
| GO:0010646 | 0.0069 | 2.827 | 5.8054 | 12 | 3249 | regulation of cell communication |
| GO:0002408 | 0.0071 | 192.8333 | 0.0071 | 1 | 4 | myeloid dendritic cell chemotaxis |
| GO:0032741 | 0.0071 | 192.8333 | 0.0071 | 1 | 4 | positive regulation of interleukin-18 production |
| GO:0038124 | 0.0071 | 192.8333 | 0.0071 | 1 | 4 | toll-like receptor TLR6:TLR2 signaling pathway |
| GO:0042494 | 0.0071 | 192.8333 | 0.0071 | 1 | 4 | detection of bacterial lipoprotein |
| GO:0071726 | 0.0071 | 192.8333 | 0.0071 | 1 | 4 | cellular response to diacyl bacterial lipopeptide |
| GO:2000676 | 0.0071 | 192.8333 | 0.0071 | 1 | 4 | positive regulation of type B pancreatic cell apoptotic process |
| GO:0023051 | 0.0078 | 2.7765 | 5.8893 | 12 | 3296 | regulation of signaling |
| GO:0002757 | 0.0087 | 5.5121 | 0.8237 | 4 | 461 | immune response-activating signal transduction |
| GO:0051222 | 0.0089 | 5.4751 | 0.8291 | 4 | 464 | positive regulation of protein transport |
| GO:0070098 | 0.0089 | 15.3115 | 0.1429 | 2 | 80 | chemokine-mediated signaling pathway |
| GO:0030317 | 0.0092 | 15.1167 | 0.1447 | 2 | 81 | flagellated sperm motility |
| GOMFID | Pvalue | OddsRatio | ExpCount | Count | Size | Term |
| GO:0045087 | 0.0011 | 6.1967 | 1.2322 | 6 | 833 | innate immune response |
| GO:0045381 | 0.0015 | Inf | 0.0015 | 1 | 1 | regulation of interleukin-18 biosynthetic process |
| GO:0045751 | 0.0015 | Inf | 0.0015 | 1 | 1 | negative regulation of Toll signaling pathway |
| GO:0050851 | 0.0037 | 10.8575 | 0.3142 | 3 | 204 | antigen receptor-mediated signaling pathway |
| GO:0006950 | 0.0039 | 3.2401 | 5.553 | 12 | 3605 | response to stress |
| GO:0043402 | 0.0046 | 337.5625 | 0.0046 | 1 | 3 | glucocorticoid mediated signaling pathway |
| GO:0042742 | 0.0058 | 9.1484 | 0.3712 | 3 | 241 | defense response to bacterium |
| GO:0002357 | 0.0061 | 225.0278 | 0.0062 | 1 | 4 | defense response to tumor cell |
| GO:0008588 | 0.0061 | 225.0278 | 0.0062 | 1 | 4 | release of cytoplasmic sequestered NF-kappaB |
| GO:0019732 | 0.0061 | 225.0278 | 0.0062 | 1 | 4 | antifungal humoral response |
| GO:0072376 | 0.007 | 17.5272 | 0.1263 | 2 | 82 | protein activation cascade |
| GO:0045409 | 0.0077 | 168.7604 | 0.0077 | 1 | 5 | negative regulation of interleukin-6 biosynthetic process |
| GO:0061302 | 0.0077 | 168.7604 | 0.0077 | 1 | 5 | smooth muscle cell-matrix adhesion |
| GO:0061760 | 0.0077 | 168.7604 | 0.0077 | 1 | 5 | antifungal innate immune response |
| GO:0002253 | 0.0081 | 5.7001 | 0.8133 | 4 | 528 | activation of immune response |
| GO:1904666 | 0.0086 | 15.746 | 0.1402 | 2 | 91 | regulation of ubiquitin protein ligase activity |
| GO:0010265 | 0.0092 | 135 | 0.0092 | 1 | 6 | SCF complex assembly |
| GO:0032020 | 0.0092 | 135 | 0.0092 | 1 | 6 | ISG15-protein conjugation |
| GO:0045345 | 0.0092 | 135 | 0.0092 | 1 | 6 | positive regulation of MHC class I biosynthetic process |
| GO:1903361 | 0.0092 | 135 | 0.0092 | 1 | 6 | protein localization to basolateral plasma membrane |
| GOMFID | Pvalue | OddsRatio | ExpCount | Count | Size | Term |
| GO:0042356 | 0.0013 | Inf | 0.0013 | 1 | 1 | GDP-4-dehydro-D-rhamnose reductase activity |
| GO:0050577 | 0.0013 | Inf | 0.0013 | 1 | 1 | GDP-L-fucose synthase activity |
| GO:0031531 | 0.0039 | 404.2 | 0.0039 | 1 | 3 | thyrotropin-releasing hormone receptor binding |
| GO:0042608 | 0.009 | 134.7 | 0.0091 | 1 | 7 | T cell receptor binding |
| GOMFID | Pvalue | OddsRatio | ExpCount | Count | Size | Term |
| GO:0008445 | 0.0014 | Inf | 0.0014 | 1 | 1 | D-aspartate oxidase activity |
| GO:0005275 | 0.0043 | 367.4091 | 0.0043 | 1 | 3 | amine transmembrane transporter activity |
| GO:0005350 | 0.0043 | 367.4091 | 0.0043 | 1 | 3 | pyrimidine nucleobase transmembrane transporter activity |
| GO:0015265 | 0.0043 | 367.4091 | 0.0043 | 1 | 3 | urea channel activity |
| GO:0005345 | 0.0057 | 244.9242 | 0.0057 | 1 | 4 | purine nucleobase transmembrane transporter activity |
| GO:0015254 | 0.0057 | 244.9242 | 0.0057 | 1 | 4 | glycerol channel activity |
| GO:0015288 | 0.0085 | 146.9364 | 0.0085 | 1 | 6 | porin activity |
| GO:0042608 | 0.0099 | 122.4394 | 0.0099 | 1 | 7 | T cell receptor binding |
| GOMFID | Pvalue | OddsRatio | ExpCount | Count | Size | Term |
| GO:0070016 | 4e-04 | 89.6444 | 0.029 | 2 | 10 | armadillo repeat domain binding |
| GO:0003844 | 0.0029 | Inf | 0.0029 | 1 | 1 | 1,4-alpha-glucan branching enzyme activity |
| GO:0004742 | 0.0029 | Inf | 0.0029 | 1 | 1 | dihydrolipoyllysine-residue acetyltransferase activity |
| GO:0004910 | 0.0029 | Inf | 0.0029 | 1 | 1 | interleukin-1, Type II, blocking receptor activity |
| GO:0046539 | 0.0029 | Inf | 0.0029 | 1 | 1 | histamine N-methyltransferase activity |
| GO:0102752 | 0.0029 | Inf | 0.0029 | 1 | 1 | 1,4-alpha-glucan branching enzyme activity (using a glucosylated glycogenin as primer for glycogen synthesis) |
| GO:0004857 | 0.0047 | 5.0197 | 1.1002 | 5 | 379 | enzyme inhibitor activity |
| GO:0005052 | 0.0058 | 350.9348 | 0.0058 | 1 | 2 | peroxisome matrix targeting signal-1 binding |
| GO:0030366 | 0.0058 | 350.9348 | 0.0058 | 1 | 2 | molybdopterin synthase activity |
| GO:0102521 | 0.0058 | 350.9348 | 0.0058 | 1 | 2 | tRNA-4-demethylwyosine synthase activity |
| GOMFID | Pvalue | OddsRatio | ExpCount | Count | Size | Term |
| GO:0102522 | 0.0024 | Inf | 0.0024 | 1 | 1 | tRNA 4-demethylwyosine alpha-amino-alpha-carboxypropyltransferase activity |
| GO:0005052 | 0.0048 | 425.0263 | 0.0048 | 1 | 2 | peroxisome matrix targeting signal-1 binding |
| GO:0019785 | 0.0048 | 425.0263 | 0.0048 | 1 | 2 | ISG15-specific protease activity |
| GO:0030366 | 0.0048 | 425.0263 | 0.0048 | 1 | 2 | molybdopterin synthase activity |
| GO:0000386 | 0.0072 | 212.5 | 0.0072 | 1 | 3 | second spliceosomal transesterification activity |
| GO:0030414 | 0.008 | 7.9286 | 0.4119 | 3 | 171 | peptidase inhibitor activity |
| GO:0061575 | 0.0096 | 141.6579 | 0.0096 | 1 | 4 | cyclin-dependent protein serine/threonine kinase activator activity |
| GO:1905394 | 0.0096 | 141.6579 | 0.0096 | 1 | 4 | retromer complex binding |
| GOMFID | Pvalue | OddsRatio | ExpCount | Count | Size | Term |
| GO:0036220 | 0.0017 | Inf | 0.0017 | 1 | 1 | ITP diphosphatase activity |
| GO:0036222 | 0.0017 | Inf | 0.0017 | 1 | 1 | XTP diphosphatase activity |
| GO:0035870 | 0.0033 | 621.6538 | 0.0033 | 1 | 2 | dITP diphosphatase activity |
| GO:0046899 | 0.0033 | 621.6538 | 0.0033 | 1 | 2 | nucleoside triphosphate adenylate kinase activity |
| GO:0003684 | 0.0046 | 21.8373 | 0.1017 | 2 | 61 | damaged DNA binding |
| GO:0004792 | 0.005 | 310.8077 | 0.005 | 1 | 3 | thiosulfate sulfurtransferase activity |
| GO:1990599 | 0.005 | 310.8077 | 0.005 | 1 | 3 | 3' overhang single-stranded DNA endodeoxyribonuclease activity |
| GO:0004499 | 0.0083 | 155.3846 | 0.0083 | 1 | 5 | N,N-dimethylaniline monooxygenase activity |
| GO:0035529 | 0.0083 | 155.3846 | 0.0083 | 1 | 5 | NADH pyrophosphatase activity |
| GO:0051575 | 0.0083 | 155.3846 | 0.0083 | 1 | 5 | 5'-deoxyribose-5-phosphate lyase activity |
| GOMFID | Pvalue | OddsRatio | ExpCount | Count | Size | Term |
| GO:0036220 | 0.0017 | Inf | 0.0017 | 1 | 1 | ITP diphosphatase activity |
| GO:0036222 | 0.0017 | Inf | 0.0017 | 1 | 1 | XTP diphosphatase activity |
| GO:0035870 | 0.0033 | 621.6538 | 0.0033 | 1 | 2 | dITP diphosphatase activity |
| GO:0046899 | 0.0033 | 621.6538 | 0.0033 | 1 | 2 | nucleoside triphosphate adenylate kinase activity |
| GO:0003684 | 0.0046 | 21.8373 | 0.1017 | 2 | 61 | damaged DNA binding |
| GO:1990599 | 0.005 | 310.8077 | 0.005 | 1 | 3 | 3' overhang single-stranded DNA endodeoxyribonuclease activity |
| GO:0004499 | 0.0083 | 155.3846 | 0.0083 | 1 | 5 | N,N-dimethylaniline monooxygenase activity |
| GO:0035529 | 0.0083 | 155.3846 | 0.0083 | 1 | 5 | NADH pyrophosphatase activity |
| GO:0051575 | 0.0083 | 155.3846 | 0.0083 | 1 | 5 | 5'-deoxyribose-5-phosphate lyase activity |
| GOMFID | Pvalue | OddsRatio | ExpCount | Count | Size | Term |
| GO:0032394 | 0 | Inf | 0.0025 | 2 | 2 | MHC class Ib receptor activity |
| GO:0042288 | 2e-04 | 112.1875 | 0.0222 | 2 | 18 | MHC class I protein binding |
| GO:0018455 | 0.0012 | Inf | 0.0012 | 1 | 1 | alcohol dehydrogenase [NAD(P)+] activity |
| GO:0052798 | 0.0012 | Inf | 0.0012 | 1 | 1 | beta-galactoside alpha-2,3-sialyltransferase activity |
| GO:0000253 | 0.0049 | 283.6491 | 0.0049 | 1 | 4 | 3-keto sterol reductase activity |
| GO:0004090 | 0.0049 | 283.6491 | 0.0049 | 1 | 4 | carbonyl reductase (NADPH) activity |
| GO:0050733 | 0.0062 | 212.7237 | 0.0062 | 1 | 5 | RS domain binding |
| GO:0003836 | 0.0074 | 170.1684 | 0.0074 | 1 | 6 | beta-galactoside (CMP) alpha-2,3-sialyltransferase activity |
| GO:0004065 | 0.0098 | 121.5338 | 0.0099 | 1 | 8 | arylsulfatase activity |
| GOMFID | Pvalue | OddsRatio | ExpCount | Count | Size | Term |
| GO:0047961 | 0.0042 | 336.8958 | 0.0042 | 1 | 4 | glycine N-acyltransferase activity |
| GOMFID | Pvalue | OddsRatio | ExpCount | Count | Size | Term |
| GO:0004252 | 0 | 24.4722 | 0.2624 | 5 | 177 | serine-type endopeptidase activity |
| GO:0017171 | 0 | 20.5921 | 0.3098 | 5 | 209 | serine hydrolase activity |
| GO:0008603 | 0 | 293.8545 | 0.0104 | 2 | 7 | cAMP-dependent protein kinase regulator activity |
| GO:0070011 | 0.0014 | 7.1103 | 0.8627 | 5 | 582 | peptidase activity, acting on L-amino acid peptides |
| GO:0008009 | 0.0023 | 31.8597 | 0.0712 | 2 | 48 | chemokine activity |
| GO:0016499 | 0.003 | 702.8696 | 0.003 | 1 | 2 | orexin receptor activity |
| GO:0008240 | 0.0044 | 351.413 | 0.0044 | 1 | 3 | tripeptidyl-peptidase activity |
| GO:0033592 | 0.0044 | 351.413 | 0.0044 | 1 | 3 | RNA strand annealing activity |
| GO:0046848 | 0.0044 | 351.413 | 0.0044 | 1 | 3 | hydroxyapatite binding |
| GO:0030197 | 0.0059 | 234.2609 | 0.0059 | 1 | 4 | extracellular matrix constituent, lubricant activity |
| GO:0030345 | 0.0059 | 234.2609 | 0.0059 | 1 | 4 | structural constituent of tooth enamel |
| GO:0002151 | 0.0074 | 175.6848 | 0.0074 | 1 | 5 | G-quadruplex RNA binding |
| GO:0031726 | 0.0074 | 175.6848 | 0.0074 | 1 | 5 | CCR1 chemokine receptor binding |
| GO:0004691 | 0.0089 | 140.5391 | 0.0089 | 1 | 6 | cAMP-dependent protein kinase activity |
| GO:0031730 | 0.0089 | 140.5391 | 0.0089 | 1 | 6 | CCR5 chemokine receptor binding |
| GOMFID | Pvalue | OddsRatio | ExpCount | Count | Size | Term |
| GO:0001077 | 3e-04 | 15.2395 | 0.3273 | 4 | 265 | transcriptional activator activity, RNA polymerase II core promoter proximal region sequence-specific binding |
| GO:0004082 | 0.0049 | 283.6491 | 0.0049 | 1 | 4 | bisphosphoglycerate mutase activity |
| GO:0046538 | 0.0049 | 283.6491 | 0.0049 | 1 | 4 | 2,3-bisphosphoglycerate-dependent phosphoglycerate mutase activity |
| GO:0003828 | 0.0074 | 170.1684 | 0.0074 | 1 | 6 | alpha-N-acetylneuraminate alpha-2,8-sialyltransferase activity |
| GO:0001046 | 0.008 | 16.5257 | 0.1359 | 2 | 110 | core promoter sequence-specific DNA binding |
| GO:0000150 | 0.0098 | 121.5338 | 0.0099 | 1 | 8 | recombinase activity |
| GOMFID | Pvalue | OddsRatio | ExpCount | Count | Size | Term |
| GO:0003943 | 0.003 | 702.8696 | 0.003 | 1 | 2 | N-acetylgalactosamine-4-sulfatase activity |
| GO:0008269 | 0.003 | 702.8696 | 0.003 | 1 | 2 | JAK pathway signal transduction adaptor activity |
| GO:0071885 | 0.003 | 702.8696 | 0.003 | 1 | 2 | N-terminal protein N-methyltransferase activity |
| GO:0004004 | 0.004 | 23.6144 | 0.0949 | 2 | 64 | ATP-dependent RNA helicase activity |
| GO:0015265 | 0.0044 | 351.413 | 0.0044 | 1 | 3 | urea channel activity |
| GO:0030229 | 0.0059 | 234.2609 | 0.0059 | 1 | 4 | very-low-density lipoprotein particle receptor activity |
| GO:0031698 | 0.0059 | 234.2609 | 0.0059 | 1 | 4 | beta-2 adrenergic receptor binding |
| GO:0005131 | 0.0074 | 175.6848 | 0.0074 | 1 | 5 | growth hormone receptor binding |
| GO:0008142 | 0.0074 | 175.6848 | 0.0074 | 1 | 5 | oxysterol binding |
| GO:0070035 | 0.0083 | 16.0599 | 0.1379 | 2 | 93 | purine NTP-dependent helicase activity |
| GOMFID | Pvalue | OddsRatio | ExpCount | Count | Size | Term |
| GO:0003844 | 0.0015 | Inf | 0.0015 | 1 | 1 | 1,4-alpha-glucan branching enzyme activity |
| GO:0102752 | 0.0015 | Inf | 0.0015 | 1 | 1 | 1,4-alpha-glucan branching enzyme activity (using a glucosylated glycogenin as primer for glycogen synthesis) |
| GO:0003943 | 0.003 | 702.8696 | 0.003 | 1 | 2 | N-acetylgalactosamine-4-sulfatase activity |
| GO:0047275 | 0.003 | 702.8696 | 0.003 | 1 | 2 | glucosaminylgalactosylglucosylceramide beta-galactosyltransferase activity |
| GO:0004971 | 0.0044 | 351.413 | 0.0044 | 1 | 3 | AMPA glutamate receptor activity |
| GO:0099583 | 0.0044 | 351.413 | 0.0044 | 1 | 3 | neurotransmitter receptor activity involved in regulation of postsynaptic cytosolic calcium ion concentration |
| GO:0015333 | 0.0059 | 234.2609 | 0.0059 | 1 | 4 | peptide:proton symporter activity |
| GO:0008494 | 0.0089 | 140.5391 | 0.0089 | 1 | 6 | translation activator activity |
| GOMFID | Pvalue | OddsRatio | ExpCount | Count | Size | Term |
| GO:0005546 | 9e-04 | 17.9043 | 0.1863 | 3 | 58 | phosphatidylinositol-4,5-bisphosphate binding |
| GO:0051916 | 0.0032 | Inf | 0.0032 | 1 | 1 | granulocyte colony-stimulating factor binding |
| GO:0005547 | 0.0053 | 20.1337 | 0.1092 | 2 | 34 | phosphatidylinositol-3,4,5-trisphosphate binding |
| GO:0004831 | 0.0064 | 316.4314 | 0.0064 | 1 | 2 | tyrosine-tRNA ligase activity |
| GO:0005153 | 0.0064 | 316.4314 | 0.0064 | 1 | 2 | interleukin-8 receptor binding |
| GO:0003774 | 0.0089 | 7.5396 | 0.4272 | 3 | 133 | motor activity |
| GO:0005157 | 0.0096 | 158.2059 | 0.0096 | 1 | 3 | macrophage colony-stimulating factor receptor binding |
| GOMFID | Pvalue | OddsRatio | ExpCount | Count | Size | Term |
| GO:0051916 | 0.0031 | Inf | 0.0031 | 1 | 1 | granulocyte colony-stimulating factor binding |
| GO:0004831 | 0.0063 | 322.78 | 0.0063 | 1 | 2 | tyrosine-tRNA ligase activity |
| GO:0005153 | 0.0063 | 322.78 | 0.0063 | 1 | 2 | interleukin-8 receptor binding |
| GO:0016151 | 0.0063 | 322.78 | 0.0063 | 1 | 2 | nickel cation binding |
| GO:0005157 | 0.0094 | 161.38 | 0.0094 | 1 | 3 | macrophage colony-stimulating factor receptor binding |
| GOMFID | Pvalue | OddsRatio | ExpCount | Count | Size | Term |
| GO:0016495 | 0.0018 | Inf | 0.0018 | 1 | 1 | C-X3-C chemokine receptor activity |
| GO:0042497 | 0.0018 | Inf | 0.0018 | 1 | 1 | triacyl lipopeptide binding |
| GO:0005546 | 0.0048 | 21.3042 | 0.1039 | 2 | 58 | phosphatidylinositol-4,5-bisphosphate binding |
| GO:0031531 | 0.0054 | 288.5714 | 0.0054 | 1 | 3 | thyrotropin-releasing hormone receptor binding |
| GO:0005539 | 0.006 | 8.9373 | 0.3743 | 3 | 209 | glycosaminoglycan binding |
| GO:0005089 | 0.0073 | 17.0286 | 0.129 | 2 | 72 | Rho guanyl-nucleotide exchange factor activity |
| GO:0001875 | 0.0089 | 144.2679 | 0.009 | 1 | 5 | lipopolysaccharide receptor activity |
| GO:0019960 | 0.0089 | 144.2679 | 0.009 | 1 | 5 | C-X3-C chemokine binding |
| GO:0031726 | 0.0089 | 144.2679 | 0.009 | 1 | 5 | CCR1 chemokine receptor binding |
| GO:0031727 | 0.0089 | 144.2679 | 0.009 | 1 | 5 | CCR2 chemokine receptor binding |
| GOMFID | Pvalue | OddsRatio | ExpCount | Count | Size | Term |
| GO:0031726 | 0 | 359.0222 | 0.0099 | 2 | 5 | CCR1 chemokine receptor binding |
| GO:0008009 | 1e-04 | 37.0437 | 0.0949 | 3 | 48 | chemokine activity |
| GO:0036470 | 0.002 | Inf | 0.002 | 1 | 1 | tyrosine 3-monooxygenase activator activity |
| GO:0036478 | 0.002 | Inf | 0.002 | 1 | 1 | L-dopa decarboxylase activator activity |
| GO:0036524 | 0.002 | Inf | 0.002 | 1 | 1 | protein deglycase activity |
| GO:0042497 | 0.002 | Inf | 0.002 | 1 | 1 | triacyl lipopeptide binding |
| GO:0045340 | 0.002 | Inf | 0.002 | 1 | 1 | mercury ion binding |
| GO:0042802 | 0.0024 | 3.7253 | 3.0535 | 9 | 1545 | identical protein binding |
| GO:0004878 | 0.0039 | 521.2258 | 0.004 | 1 | 2 | complement component C5a receptor activity |
| GO:0016532 | 0.0039 | 521.2258 | 0.004 | 1 | 2 | superoxide dismutase copper chaperone activity |
| GO:0017159 | 0.0059 | 260.5968 | 0.0059 | 1 | 3 | pantetheine hydrolase activity |
| GO:1903135 | 0.0059 | 260.5968 | 0.0059 | 1 | 3 | cupric ion binding |
| GO:0001875 | 0.0098 | 130.2823 | 0.0099 | 1 | 5 | lipopolysaccharide receptor activity |
| GO:0005047 | 0.0098 | 130.2823 | 0.0099 | 1 | 5 | signal recognition particle binding |
| GO:0016530 | 0.0098 | 130.2823 | 0.0099 | 1 | 5 | metallochaperone activity |
| GO:0031727 | 0.0098 | 130.2823 | 0.0099 | 1 | 5 | CCR2 chemokine receptor binding |
| GO:0044388 | 0.0098 | 130.2823 | 0.0099 | 1 | 5 | small protein activating enzyme binding |
| GO:1903136 | 0.0098 | 130.2823 | 0.0099 | 1 | 5 | cuprous ion binding |
| GOMFID | Pvalue | OddsRatio | ExpCount | Count | Size | Term |
| GO:0001631 | 0.0015 | Inf | 0.0015 | 1 | 1 | cysteinyl leukotriene receptor activity |
| GO:0048020 | 0.0015 | 39.6314 | 0.0578 | 2 | 39 | CCR chemokine receptor binding |
| GO:0008009 | 0.0023 | 31.8597 | 0.0712 | 2 | 48 | chemokine activity |
| GO:0004063 | 0.003 | 702.8696 | 0.003 | 1 | 2 | aryldialkylphosphatase activity |
| GO:0004667 | 0.003 | 702.8696 | 0.003 | 1 | 2 | prostaglandin-D synthase activity |
| GO:0070506 | 0.003 | 702.8696 | 0.003 | 1 | 2 | high-density lipoprotein particle receptor activity |
| GO:0005157 | 0.0044 | 351.413 | 0.0044 | 1 | 3 | macrophage colony-stimulating factor receptor binding |
| GO:0102007 | 0.0044 | 351.413 | 0.0044 | 1 | 3 | acyl-L-homoserine-lactone lactonohydrolase activity |
| GO:0005126 | 0.0057 | 9.2848 | 0.3694 | 3 | 260 | cytokine receptor binding |
| GO:1905394 | 0.0059 | 234.2609 | 0.0059 | 1 | 4 | retromer complex binding |
| GO:0000268 | 0.0074 | 175.6848 | 0.0074 | 1 | 5 | peroxisome targeting sequence binding |
| GO:0004064 | 0.0089 | 140.5391 | 0.0089 | 1 | 6 | arylesterase activity |
| GOMFID | Pvalue | OddsRatio | ExpCount | Count | Size | Term |
| GO:0032394 | 0 | Inf | 0.0042 | 2 | 2 | MHC class Ib receptor activity |
| GO:0042288 | 6e-04 | 63.0508 | 0.0378 | 2 | 18 | MHC class I protein binding |
| GO:0052798 | 0.0021 | Inf | 0.0021 | 1 | 1 | beta-galactoside alpha-2,3-sialyltransferase activity |
| GO:0005052 | 0.0042 | 489.5758 | 0.0042 | 1 | 2 | peroxisome matrix targeting signal-1 binding |
| GO:0042284 | 0.0042 | 489.5758 | 0.0042 | 1 | 2 | sphingolipid delta-4 desaturase activity |
| GO:0044323 | 0.0084 | 163.1717 | 0.0084 | 1 | 4 | retinoic acid-responsive element binding |
| GO:1905394 | 0.0084 | 163.1717 | 0.0084 | 1 | 4 | retromer complex binding |
| GOMFID | Pvalue | OddsRatio | ExpCount | Count | Size | Term |
| GO:0004930 | 0 | 13.2124 | 0.7254 | 6 | 783 | G-protein coupled receptor activity |
| GO:0004984 | 3e-04 | 15.7079 | 0.3428 | 4 | 370 | olfactory receptor activity |
| GO:0099600 | 5e-04 | 8.2237 | 1.1293 | 6 | 1219 | transmembrane receptor activity |
| GO:0038023 | 6e-04 | 7.8047 | 1.1849 | 6 | 1279 | signaling receptor activity |
| GO:0001631 | 9e-04 | Inf | 9e-04 | 1 | 1 | cysteinyl leukotriene receptor activity |
| GO:0060089 | 0.0017 | 6.3955 | 1.4202 | 6 | 1533 | molecular transducer activity |
| GO:0004063 | 0.0019 | 1155.3571 | 0.0019 | 1 | 2 | aryldialkylphosphatase activity |
| GO:0050252 | 0.0019 | 1155.3571 | 0.0019 | 1 | 2 | retinol O-fatty-acyltransferase activity |
| GO:0102007 | 0.0028 | 577.6429 | 0.0028 | 1 | 3 | acyl-L-homoserine-lactone lactonohydrolase activity |
| GO:0004144 | 0.0037 | 385.0714 | 0.0037 | 1 | 4 | diacylglycerol O-acyltransferase activity |
| GO:0003846 | 0.0046 | 288.7857 | 0.0046 | 1 | 5 | 2-acylglycerol O-acyltransferase activity |
| GO:0004064 | 0.0055 | 231.0143 | 0.0056 | 1 | 6 | arylesterase activity |
| GOMFID | Pvalue | OddsRatio | ExpCount | Count | Size | Term |
| GO:0070717 | 4e-04 | 85.4497 | 0.0284 | 2 | 20 | poly-purine tract binding |
| GO:0019782 | 0.0014 | Inf | 0.0014 | 1 | 1 | ISG15 activating enzyme activity |
| GO:0038051 | 0.0014 | Inf | 0.0014 | 1 | 1 | glucocorticoid-activated RNA polymerase II transcription factor binding transcription factor activity |
| GO:0004839 | 0.0057 | 244.9242 | 0.0057 | 1 | 4 | ubiquitin activating enzyme activity |
| GO:0097016 | 0.0057 | 244.9242 | 0.0057 | 1 | 4 | L27 domain binding |
| GO:0099104 | 0.0057 | 244.9242 | 0.0057 | 1 | 4 | potassium channel activator activity |
| GO:0004758 | 0.0071 | 183.6818 | 0.0071 | 1 | 5 | serine C-palmitoyltransferase activity |
| GO:0016427 | 0.0085 | 146.9364 | 0.0085 | 1 | 6 | tRNA (cytosine) methyltransferase activity |
| GO:1990239 | 0.0085 | 146.9364 | 0.0085 | 1 | 6 | steroid hormone binding |
| GOMFID | Pvalue | OddsRatio | ExpCount | Count | Size | Term |
| GO:0035663 | 0 | 897.3333 | 0.007 | 2 | 3 | Toll-like receptor 2 binding |
| GO:0071723 | 2e-04 | 112.1181 | 0.0235 | 2 | 10 | lipopeptide binding |
| GO:0004633 | 0.0023 | Inf | 0.0023 | 1 | 1 | phosphopantothenoylcysteine decarboxylase activity |
| GO:0030290 | 0.0023 | Inf | 0.0023 | 1 | 1 | sphingolipid activator protein activity |
| GO:0032428 | 0.0023 | Inf | 0.0023 | 1 | 1 | beta-N-acetylgalactosaminidase activity |
| GO:0042356 | 0.0023 | Inf | 0.0023 | 1 | 1 | GDP-4-dehydro-D-rhamnose reductase activity |
| GO:0050577 | 0.0023 | Inf | 0.0023 | 1 | 1 | GDP-L-fucose synthase activity |
| GO:0004911 | 0.0047 | 436.5405 | 0.0047 | 1 | 2 | interleukin-2 receptor activity |
| GO:0005153 | 0.0047 | 436.5405 | 0.0047 | 1 | 2 | interleukin-8 receptor binding |
| GO:0019976 | 0.0047 | 436.5405 | 0.0047 | 1 | 2 | interleukin-2 binding |
| GO:0030366 | 0.0047 | 436.5405 | 0.0047 | 1 | 2 | molybdopterin synthase activity |
| GO:0046811 | 0.0047 | 436.5405 | 0.0047 | 1 | 2 | histone deacetylase inhibitor activity |
| GO:0030234 | 0.007 | 3.5306 | 2.2953 | 7 | 978 | enzyme regulator activity |
| GO:0004082 | 0.0094 | 145.4955 | 0.0094 | 1 | 4 | bisphosphoglycerate mutase activity |
| GO:0046538 | 0.0094 | 145.4955 | 0.0094 | 1 | 4 | 2,3-bisphosphoglycerate-dependent phosphoglycerate mutase activity |
| GO:0051430 | 0.0094 | 145.4955 | 0.0094 | 1 | 4 | corticotropin-releasing hormone receptor 1 binding |
| GO:0051431 | 0.0094 | 145.4955 | 0.0094 | 1 | 4 | corticotropin-releasing hormone receptor 2 binding |
| GOMFID | Pvalue | OddsRatio | ExpCount | Count | Size | Term |
| GO:0042056 | 5e-04 | 70.3486 | 0.034 | 2 | 29 | chemoattractant activity |
| GO:0031851 | 0.0012 | Inf | 0.0012 | 1 | 1 | kappa-type opioid receptor binding |
| GO:0030246 | 0.0033 | 11.6111 | 0.3051 | 3 | 260 | carbohydrate binding |
| GO:0031720 | 0.0035 | 449.1667 | 0.0035 | 1 | 3 | haptoglobin binding |
| GO:0005223 | 0.0047 | 299.4259 | 0.0047 | 1 | 4 | intracellular cGMP activated cation channel activity |
| GO:0048030 | 0.0047 | 299.4259 | 0.0047 | 1 | 4 | disaccharide binding |
| GO:0099104 | 0.0047 | 299.4259 | 0.0047 | 1 | 4 | potassium channel activator activity |
| GO:0005249 | 0.005 | 21.2597 | 0.1068 | 2 | 91 | voltage-gated potassium channel activity |
| GO:0004466 | 0.0059 | 224.5556 | 0.0059 | 1 | 5 | long-chain-acyl-CoA dehydrogenase activity |
| GO:0004758 | 0.0059 | 224.5556 | 0.0059 | 1 | 5 | serine C-palmitoyltransferase activity |
| GO:0005134 | 0.0059 | 224.5556 | 0.0059 | 1 | 5 | interleukin-2 receptor binding |
| GO:0005534 | 0.0059 | 224.5556 | 0.0059 | 1 | 5 | galactose binding |
| GO:0004126 | 0.0094 | 128.2937 | 0.0094 | 1 | 8 | cytidine deaminase activity |
| GO:0043208 | 0.0094 | 128.2937 | 0.0094 | 1 | 8 | glycosphingolipid binding |
| GOMFID | Pvalue | OddsRatio | ExpCount | Count | Size | Term |
| GO:0042056 | 8e-04 | 54.3434 | 0.043 | 2 | 29 | chemoattractant activity |
| GO:0046899 | 0.003 | 702.8696 | 0.003 | 1 | 2 | nucleoside triphosphate adenylate kinase activity |
| GO:0048101 | 0.003 | 702.8696 | 0.003 | 1 | 2 | calcium- and calmodulin-regulated 3',5'-cyclic-GMP phosphodiesterase activity |
| GO:0004117 | 0.0044 | 351.413 | 0.0044 | 1 | 3 | calmodulin-dependent cyclic-nucleotide phosphodiesterase activity |
| GO:0004965 | 0.0044 | 351.413 | 0.0044 | 1 | 3 | G-protein coupled GABA receptor activity |
| GO:0030545 | 0.0048 | 6.709 | 0.6996 | 4 | 472 | receptor regulator activity |
| GO:0005025 | 0.0059 | 234.2609 | 0.0059 | 1 | 4 | transforming growth factor beta receptor activity, type I |
| GO:0005549 | 0.0067 | 18.0539 | 0.123 | 2 | 83 | odorant binding |
| GOMFID | Pvalue | OddsRatio | ExpCount | Count | Size | Term |
| GO:0003823 | 4e-04 | 82.3061 | 0.0315 | 2 | 51 | antigen binding |
| GO:0001791 | 0.0012 | 1797.7778 | 0.0012 | 1 | 2 | IgM binding |
| GO:0005153 | 0.0012 | 1797.7778 | 0.0012 | 1 | 2 | interleukin-8 receptor binding |
| GO:0030881 | 0.0055 | 224.625 | 0.0056 | 1 | 9 | beta-2-microglobulin binding |
| GO:0031419 | 0.0055 | 224.625 | 0.0056 | 1 | 9 | cobalamin binding |
| GOMFID | Pvalue | OddsRatio | ExpCount | Count | Size | Term |
| GO:0001605 | 0.0023 | Inf | 0.0023 | 1 | 1 | adrenomedullin receptor activity |
| GO:0003844 | 0.0023 | Inf | 0.0023 | 1 | 1 | 1,4-alpha-glucan branching enzyme activity |
| GO:0031704 | 0.0023 | Inf | 0.0023 | 1 | 1 | apelin receptor binding |
| GO:0032556 | 0.0023 | Inf | 0.0023 | 1 | 1 | pyrimidine deoxyribonucleotide binding |
| GO:0047840 | 0.0023 | Inf | 0.0023 | 1 | 1 | dCTP diphosphatase activity |
| GO:0102752 | 0.0023 | Inf | 0.0023 | 1 | 1 | 1,4-alpha-glucan branching enzyme activity (using a glucosylated glycogenin as primer for glycogen synthesis) |
| GO:0045182 | 0.0042 | 22.9544 | 0.0962 | 2 | 41 | translation regulator activity |
| GO:0001635 | 0.0047 | 436.5405 | 0.0047 | 1 | 2 | calcitonin gene-related peptide receptor activity |
| GO:0001791 | 0.0047 | 436.5405 | 0.0047 | 1 | 2 | IgM binding |
| GO:0030350 | 0.0047 | 436.5405 | 0.0047 | 1 | 2 | iron-responsive element binding |
| GO:0008083 | 0.0056 | 9.0834 | 0.3614 | 3 | 154 | growth factor activity |
| GO:0004948 | 0.007 | 218.2568 | 0.007 | 1 | 3 | calcitonin receptor activity |
| GO:0005157 | 0.007 | 218.2568 | 0.007 | 1 | 3 | macrophage colony-stimulating factor receptor binding |
| GO:0008823 | 0.007 | 218.2568 | 0.007 | 1 | 3 | cupric reductase activity |
| GO:0052851 | 0.007 | 218.2568 | 0.007 | 1 | 3 | ferric-chelate reductase (NADPH) activity |
| GO:0004090 | 0.0094 | 145.4955 | 0.0094 | 1 | 4 | carbonyl reductase (NADPH) activity |
| GO:0015333 | 0.0094 | 145.4955 | 0.0094 | 1 | 4 | peptide:proton symporter activity |
| GOMFID | Pvalue | OddsRatio | ExpCount | Count | Size | Term |
| GO:0004831 | 0.0046 | 448.6944 | 0.0046 | 1 | 2 | tyrosine-tRNA ligase activity |
| GO:0005019 | 0.0046 | 448.6944 | 0.0046 | 1 | 2 | platelet-derived growth factor beta-receptor activity |
| GO:0005153 | 0.0046 | 448.6944 | 0.0046 | 1 | 2 | interleukin-8 receptor binding |
| GO:0016151 | 0.0046 | 448.6944 | 0.0046 | 1 | 2 | nickel cation binding |
| GO:0004715 | 0.0056 | 19.583 | 0.112 | 2 | 49 | non-membrane spanning protein tyrosine kinase activity |
| GO:0004992 | 0.0068 | 224.3333 | 0.0069 | 1 | 3 | platelet activating factor receptor activity |
| GO:0015186 | 0.0091 | 149.5463 | 0.0091 | 1 | 4 | L-glutamine transmembrane transporter activity |
| NA. |
| n/a |
| NA. |
| n/a |
| NA. |
| n/a |
| NA. |
| n/a |
| NA. |
| n/a |
| NA. |
| n/a |
| NA. |
| n/a |
| NA. |
| n/a |
| NA. |
| n/a |
| NA. |
| n/a |
| NA. |
| n/a |
| NA. |
| n/a |
| NA. |
| n/a |
| NA. |
| n/a |
| NA. |
| n/a |
| NA. |
| n/a |
| NA. |
| n/a |
| NA. |
| n/a |
| NA. |
| n/a |
| NA. |
| n/a |
| NA. |
| n/a |
| NA. |
| n/a |
| NA. |
| n/a |
| NA. |
| n/a |
| NA. |
| n/a |
| NA. |
| n/a |
| NA. |
| n/a |
| NA. |
| n/a |
| NA. |
| n/a |
| NA. |
| n/a |
| NA. |
| n/a |
| NA. |
| n/a |
| NA. |
| n/a |
| NA. |
| n/a |
| NA. |
| n/a |
| NA. |
| n/a |
| NA. |
| n/a |
| NA. |
| n/a |
| NA. |
| n/a |
| NA. |
| n/a |
| NA. |
| n/a |
| NA. |
| n/a |
| NA. |
| n/a |
| NA. |
| n/a |
| NA. |
| n/a |
| NA. |
| n/a |
| NA. |
| n/a |
| NA. |
| n/a |
| NA. |
| n/a |
| NA. |
| n/a |
| NA. |
| n/a |
| NA. |
| n/a |
| NA. |
| n/a |
| NA. |
| n/a |
| NA. |
| n/a |
| NA. |
| n/a |
| GOMFID | Pvalue | OddsRatio | ExpCount | Count | Size | Term |
| GO:0032458 | 8e-04 | Inf | 8e-04 | 1 | 1 | slow endocytic recycling |
| GO:0061146 | 0.0024 | 676.0417 | 0.0024 | 1 | 3 | Peyer's patch morphogenesis |
| GO:0071593 | 0.0024 | 676.0417 | 0.0024 | 1 | 3 | lymphocyte aggregation |
| GO:0097021 | 0.0024 | 676.0417 | 0.0024 | 1 | 3 | lymphocyte migration into lymphoid organs |
| GO:0050921 | 0.0045 | 23.2338 | 0.1025 | 2 | 128 | positive regulation of chemotaxis |
| GO:0048537 | 0.0048 | 270.3667 | 0.0048 | 1 | 6 | mucosal-associated lymphoid tissue development |
| GO:0060753 | 0.0048 | 270.3667 | 0.0048 | 1 | 6 | regulation of mast cell chemotaxis |
| GO:0060263 | 0.0096 | 122.8485 | 0.0096 | 1 | 12 | regulation of respiratory burst |
| GO:0097531 | 0.0096 | 122.8485 | 0.0096 | 1 | 12 | mast cell migration |
| GOMFID | Pvalue | OddsRatio | ExpCount | Count | Size | Term |
| GO:0030421 | 0.0017 | Inf | 0.0017 | 1 | 1 | defecation |
| GO:0061580 | 0.0017 | Inf | 0.0017 | 1 | 1 | colon epithelial cell migration |
| GO:0086024 | 0.0017 | Inf | 0.0017 | 1 | 1 | adrenergic receptor signaling pathway involved in positive regulation of heart rate |
| GO:0006480 | 0.0033 | 623.5385 | 0.0033 | 1 | 2 | N-terminal protein amino acid methylation |
| GO:0006711 | 0.0033 | 623.5385 | 0.0033 | 1 | 2 | estrogen catabolic process |
| GO:1901898 | 0.0033 | 623.5385 | 0.0033 | 1 | 2 | negative regulation of relaxation of cardiac muscle |
| GO:0032922 | 0.0035 | 25.3522 | 0.0881 | 2 | 53 | circadian regulation of gene expression |
| GO:0003245 | 0.005 | 311.75 | 0.005 | 1 | 3 | cardiac muscle tissue growth involved in heart morphogenesis |
| GO:0071918 | 0.0066 | 207.8205 | 0.0067 | 1 | 4 | urea transmembrane transport |
| GO:2000623 | 0.0066 | 207.8205 | 0.0067 | 1 | 4 | negative regulation of nuclear-transcribed mRNA catabolic process, nonsense-mediated decay |
| GOMFID | Pvalue | OddsRatio | ExpCount | Count | Size | Term |
| GO:0061580 | 0.0014 | Inf | 0.0014 | 1 | 1 | colon epithelial cell migration |
| GO:0006687 | 0.004 | 23.6659 | 0.0949 | 2 | 67 | glycosphingolipid metabolic process |
| GO:0099566 | 0.0042 | 368.5227 | 0.0042 | 1 | 3 | regulation of postsynaptic cytosolic calcium ion concentration |
| GO:0006682 | 0.0071 | 184.2386 | 0.0071 | 1 | 5 | galactosylceramide biosynthetic process |
| GO:0061087 | 0.0071 | 184.2386 | 0.0071 | 1 | 5 | positive regulation of histone H3-K27 methylation |
| GO:0051597 | 0.0099 | 122.8106 | 0.0099 | 1 | 7 | response to methylmercury |
| GOMFID | Pvalue | OddsRatio | ExpCount | Count | Size | Term |
| GO:0061900 | 0.0011 | 47.9585 | 0.0482 | 2 | 27 | glial cell activation |
| GO:0048240 | 0.0011 | 46.1111 | 0.05 | 2 | 28 | sperm capacitation |
| GO:0002881 | 0.0018 | Inf | 0.0018 | 1 | 1 | negative regulation of chronic inflammatory response to non-antigenic stimulus |
| GO:0019408 | 0.0018 | Inf | 0.0018 | 1 | 1 | dolichol biosynthetic process |
| GO:2000474 | 0.0018 | Inf | 0.0018 | 1 | 1 | regulation of opioid receptor signaling pathway |
| GO:0061512 | 0.002 | 34.2349 | 0.0661 | 2 | 37 | protein localization to cilium |
| GO:0007266 | 0.0033 | 11.1527 | 0.3018 | 3 | 169 | Rho protein signal transduction |
| GO:0042495 | 0.0036 | 578.9286 | 0.0036 | 1 | 2 | detection of triacyl bacterial lipopeptide |
| GO:0042496 | 0.0036 | 578.9286 | 0.0036 | 1 | 2 | detection of diacyl bacterial lipopeptide |
| GO:0050854 | 0.004 | 23.4713 | 0.0946 | 2 | 53 | regulation of antigen receptor-mediated signaling pathway |
| GO:0050794 | 0.0042 | 3.8234 | 18.0054 | 25 | 10083 | regulation of cellular process |
| GO:0009966 | 0.0049 | 3.1356 | 4.8656 | 11 | 2917 | regulation of signal transduction |
| GO:0030595 | 0.0052 | 9.428 | 0.3554 | 3 | 199 | leukocyte chemotaxis |
| GO:0042116 | 0.0053 | 20.2787 | 0.1089 | 2 | 61 | macrophage activation |
| GO:0001560 | 0.0053 | 289.4464 | 0.0054 | 1 | 3 | regulation of cell growth by extracellular stimulus |
| GO:0002282 | 0.0053 | 289.4464 | 0.0054 | 1 | 3 | microglial cell activation involved in immune response |
| GO:0014005 | 0.0053 | 289.4464 | 0.0054 | 1 | 3 | microglia development |
| GO:0032289 | 0.0053 | 289.4464 | 0.0054 | 1 | 3 | central nervous system myelin formation |
| GO:0035915 | 0.0053 | 289.4464 | 0.0054 | 1 | 3 | pore formation in membrane of other organism |
| GO:0038123 | 0.0053 | 289.4464 | 0.0054 | 1 | 3 | toll-like receptor TLR1:TLR2 signaling pathway |
| GO:0071727 | 0.0053 | 289.4464 | 0.0054 | 1 | 3 | cellular response to triacyl bacterial lipopeptide |
| GO:0007154 | 0.0063 | 2.7295 | 10.8821 | 18 | 6094 | cell communication |
| GO:0040011 | 0.0067 | 3.3916 | 2.9375 | 8 | 1645 | locomotion |
| GO:0002408 | 0.0071 | 192.9524 | 0.0071 | 1 | 4 | myeloid dendritic cell chemotaxis |
| GO:0032741 | 0.0071 | 192.9524 | 0.0071 | 1 | 4 | positive regulation of interleukin-18 production |
| GO:0038124 | 0.0071 | 192.9524 | 0.0071 | 1 | 4 | toll-like receptor TLR6:TLR2 signaling pathway |
| GO:0042494 | 0.0071 | 192.9524 | 0.0071 | 1 | 4 | detection of bacterial lipoprotein |
| GO:0071315 | 0.0071 | 192.9524 | 0.0071 | 1 | 4 | cellular response to morphine |
| GO:0071726 | 0.0071 | 192.9524 | 0.0071 | 1 | 4 | cellular response to diacyl bacterial lipopeptide |
| GO:2000676 | 0.0071 | 192.9524 | 0.0071 | 1 | 4 | positive regulation of type B pancreatic cell apoptotic process |
| GO:0002757 | 0.0087 | 5.5156 | 0.8232 | 4 | 461 | immune response-activating signal transduction |
| GO:0051222 | 0.0089 | 5.4786 | 0.8286 | 4 | 464 | positive regulation of protein transport |
| GO:0070098 | 0.0089 | 15.321 | 0.1429 | 2 | 80 | chemokine-mediated signaling pathway |
| GO:0030317 | 0.0091 | 15.1261 | 0.1446 | 2 | 81 | flagellated sperm motility |
| GOMFID | Pvalue | OddsRatio | ExpCount | Count | Size | Term |
| GO:0045087 | 0.0011 | 6.2007 | 1.2314 | 6 | 833 | innate immune response |
| GO:0045381 | 0.0015 | Inf | 0.0015 | 1 | 1 | regulation of interleukin-18 biosynthetic process |
| GO:0045751 | 0.0015 | Inf | 0.0015 | 1 | 1 | negative regulation of Toll signaling pathway |
| GO:0050851 | 0.0037 | 10.8643 | 0.314 | 3 | 204 | antigen receptor-mediated signaling pathway |
| GO:0006950 | 0.0039 | 3.245 | 5.5465 | 12 | 3603 | response to stress |
| GO:0043402 | 0.0046 | 337.7708 | 0.0046 | 1 | 3 | glucocorticoid mediated signaling pathway |
| GO:0042742 | 0.0058 | 9.1541 | 0.371 | 3 | 241 | defense response to bacterium |
| GO:0002357 | 0.0061 | 225.1667 | 0.0062 | 1 | 4 | defense response to tumor cell |
| GO:0008588 | 0.0061 | 225.1667 | 0.0062 | 1 | 4 | release of cytoplasmic sequestered NF-kappaB |
| GO:0019732 | 0.0061 | 225.1667 | 0.0062 | 1 | 4 | antifungal humoral response |
| GO:0072376 | 0.007 | 17.538 | 0.1262 | 2 | 82 | protein activation cascade |
| GO:0045409 | 0.0077 | 168.8646 | 0.0077 | 1 | 5 | negative regulation of interleukin-6 biosynthetic process |
| GO:0061302 | 0.0077 | 168.8646 | 0.0077 | 1 | 5 | smooth muscle cell-matrix adhesion |
| GO:0061760 | 0.0077 | 168.8646 | 0.0077 | 1 | 5 | antifungal innate immune response |
| GO:0002253 | 0.0081 | 5.7037 | 0.8128 | 4 | 528 | activation of immune response |
| GO:1904666 | 0.0086 | 15.7557 | 0.1401 | 2 | 91 | regulation of ubiquitin protein ligase activity |
| GO:0010265 | 0.0092 | 135.0833 | 0.0092 | 1 | 6 | SCF complex assembly |
| GO:0032020 | 0.0092 | 135.0833 | 0.0092 | 1 | 6 | ISG15-protein conjugation |
| GO:0045345 | 0.0092 | 135.0833 | 0.0092 | 1 | 6 | positive regulation of MHC class I biosynthetic process |
| GO:1903361 | 0.0092 | 135.0833 | 0.0092 | 1 | 6 | protein localization to basolateral plasma membrane |
| GOMFID | Pvalue | OddsRatio | ExpCount | Count | Size | Term |
| GO:0030107 | 0.0014 | Inf | 0.0014 | 1 | 1 | HLA-A specific inhibitory MHC class I receptor activity |
| GO:0042356 | 0.0014 | Inf | 0.0014 | 1 | 1 | GDP-4-dehydro-D-rhamnose reductase activity |
| GO:0050577 | 0.0014 | Inf | 0.0014 | 1 | 1 | GDP-L-fucose synthase activity |
| GO:0030109 | 0.0028 | 735.5 | 0.0028 | 1 | 2 | HLA-B specific inhibitory MHC class I receptor activity |
| GO:0031531 | 0.0043 | 367.7273 | 0.0043 | 1 | 3 | thyrotropin-releasing hormone receptor binding |
| GO:0042802 | 0.0044 | 4.1656 | 2.1928 | 7 | 1545 | identical protein binding |
| GO:0032393 | 0.0099 | 122.5455 | 0.0099 | 1 | 7 | MHC class I receptor activity |
| GO:0042608 | 0.0099 | 122.5455 | 0.0099 | 1 | 7 | T cell receptor binding |
| GOMFID | Pvalue | OddsRatio | ExpCount | Count | Size | Term |
| GO:0046943 | 0.001 | 17.1009 | 0.2021 | 3 | 131 | carboxylic acid transmembrane transporter activity |
| GO:0008445 | 0.0015 | Inf | 0.0015 | 1 | 1 | D-aspartate oxidase activity |
| GO:0030107 | 0.0015 | Inf | 0.0015 | 1 | 1 | HLA-A specific inhibitory MHC class I receptor activity |
| GO:0030109 | 0.0031 | 674.125 | 0.0031 | 1 | 2 | HLA-B specific inhibitory MHC class I receptor activity |
| GO:0005275 | 0.0046 | 337.0417 | 0.0046 | 1 | 3 | amine transmembrane transporter activity |
| GO:0005350 | 0.0046 | 337.0417 | 0.0046 | 1 | 3 | pyrimidine nucleobase transmembrane transporter activity |
| GO:0015265 | 0.0046 | 337.0417 | 0.0046 | 1 | 3 | urea channel activity |
| GO:0005345 | 0.0062 | 224.6806 | 0.0062 | 1 | 4 | purine nucleobase transmembrane transporter activity |
| GO:0015254 | 0.0062 | 224.6806 | 0.0062 | 1 | 4 | glycerol channel activity |
| GO:0015288 | 0.0092 | 134.7917 | 0.0093 | 1 | 6 | porin activity |
| GOMFID | Pvalue | OddsRatio | ExpCount | Count | Size | Term |
| GO:0070016 | 4e-04 | 89.7222 | 0.029 | 2 | 10 | armadillo repeat domain binding |
| GO:0003844 | 0.0029 | Inf | 0.0029 | 1 | 1 | 1,4-alpha-glucan branching enzyme activity |
| GO:0004742 | 0.0029 | Inf | 0.0029 | 1 | 1 | dihydrolipoyllysine-residue acetyltransferase activity |
| GO:0004910 | 0.0029 | Inf | 0.0029 | 1 | 1 | interleukin-1, Type II, blocking receptor activity |
| GO:0046539 | 0.0029 | Inf | 0.0029 | 1 | 1 | histamine N-methyltransferase activity |
| GO:0102752 | 0.0029 | Inf | 0.0029 | 1 | 1 | 1,4-alpha-glucan branching enzyme activity (using a glucosylated glycogenin as primer for glycogen synthesis) |
| GO:0004857 | 0.0047 | 5.0242 | 1.0992 | 5 | 379 | enzyme inhibitor activity |
| GO:0005052 | 0.0058 | 351.2391 | 0.0058 | 1 | 2 | peroxisome matrix targeting signal-1 binding |
| GO:0030366 | 0.0058 | 351.2391 | 0.0058 | 1 | 2 | molybdopterin synthase activity |
| GO:0102521 | 0.0058 | 351.2391 | 0.0058 | 1 | 2 | tRNA-4-demethylwyosine synthase activity |
| GOMFID | Pvalue | OddsRatio | ExpCount | Count | Size | Term |
| GO:0102522 | 0.0025 | Inf | 0.0025 | 1 | 1 | tRNA 4-demethylwyosine alpha-amino-alpha-carboxypropyltransferase activity |
| GO:0005052 | 0.0049 | 414.4615 | 0.0049 | 1 | 2 | peroxisome matrix targeting signal-1 binding |
| GO:0019785 | 0.0049 | 414.4615 | 0.0049 | 1 | 2 | ISG15-specific protease activity |
| GO:0030366 | 0.0049 | 414.4615 | 0.0049 | 1 | 2 | molybdopterin synthase activity |
| GO:0000386 | 0.0074 | 207.2179 | 0.0074 | 1 | 3 | second spliceosomal transesterification activity |
| GO:0030414 | 0.0086 | 7.7206 | 0.4221 | 3 | 171 | peptidase inhibitor activity |
| GO:0061575 | 0.0098 | 138.1368 | 0.0099 | 1 | 4 | cyclin-dependent protein serine/threonine kinase activator activity |
| GO:1905394 | 0.0098 | 138.1368 | 0.0099 | 1 | 4 | retromer complex binding |
| GOMFID | Pvalue | OddsRatio | ExpCount | Count | Size | Term |
| GO:0036220 | 0.0017 | Inf | 0.0017 | 1 | 1 | ITP diphosphatase activity |
| GO:0036222 | 0.0017 | Inf | 0.0017 | 1 | 1 | XTP diphosphatase activity |
| GO:0035870 | 0.0035 | 599.1111 | 0.0035 | 1 | 2 | dITP diphosphatase activity |
| GO:0046899 | 0.0035 | 599.1111 | 0.0035 | 1 | 2 | nucleoside triphosphate adenylate kinase activity |
| GO:0003684 | 0.0049 | 21.0143 | 0.1054 | 2 | 61 | damaged DNA binding |
| GO:0004792 | 0.0052 | 299.537 | 0.0052 | 1 | 3 | thiosulfate sulfurtransferase activity |
| GO:1990599 | 0.0052 | 299.537 | 0.0052 | 1 | 3 | 3' overhang single-stranded DNA endodeoxyribonuclease activity |
| GO:0004499 | 0.0086 | 149.75 | 0.0086 | 1 | 5 | N,N-dimethylaniline monooxygenase activity |
| GO:0035529 | 0.0086 | 149.75 | 0.0086 | 1 | 5 | NADH pyrophosphatase activity |
| GO:0051575 | 0.0086 | 149.75 | 0.0086 | 1 | 5 | 5'-deoxyribose-5-phosphate lyase activity |
| GOMFID | Pvalue | OddsRatio | ExpCount | Count | Size | Term |
| GO:0036220 | 0.0016 | Inf | 0.0016 | 1 | 1 | ITP diphosphatase activity |
| GO:0036222 | 0.0016 | Inf | 0.0016 | 1 | 1 | XTP diphosphatase activity |
| GO:0035870 | 0.0032 | 647.12 | 0.0032 | 1 | 2 | dITP diphosphatase activity |
| GO:0046899 | 0.0032 | 647.12 | 0.0032 | 1 | 2 | nucleoside triphosphate adenylate kinase activity |
| GO:0003684 | 0.0043 | 22.7684 | 0.0979 | 2 | 61 | damaged DNA binding |
| GO:1990599 | 0.0048 | 323.54 | 0.0048 | 1 | 3 | 3' overhang single-stranded DNA endodeoxyribonuclease activity |
| GO:0004499 | 0.008 | 161.75 | 0.008 | 1 | 5 | N,N-dimethylaniline monooxygenase activity |
| GO:0035529 | 0.008 | 161.75 | 0.008 | 1 | 5 | NADH pyrophosphatase activity |
| GO:0051575 | 0.008 | 161.75 | 0.008 | 1 | 5 | 5'-deoxyribose-5-phosphate lyase activity |
| GOMFID | Pvalue | OddsRatio | ExpCount | Count | Size | Term |
| GO:0032394 | 0 | Inf | 0.0025 | 2 | 2 | MHC class Ib receptor activity |
| GO:0042288 | 2e-04 | 112.2847 | 0.0222 | 2 | 18 | MHC class I protein binding |
| GO:0018455 | 0.0012 | Inf | 0.0012 | 1 | 1 | alcohol dehydrogenase [NAD(P)+] activity |
| GO:0052798 | 0.0012 | Inf | 0.0012 | 1 | 1 | beta-galactoside alpha-2,3-sialyltransferase activity |
| GO:0000253 | 0.0049 | 283.8947 | 0.0049 | 1 | 4 | 3-keto sterol reductase activity |
| GO:0004090 | 0.0049 | 283.8947 | 0.0049 | 1 | 4 | carbonyl reductase (NADPH) activity |
| GO:0050733 | 0.0062 | 212.9079 | 0.0062 | 1 | 5 | RS domain binding |
| GO:0003836 | 0.0074 | 170.3158 | 0.0074 | 1 | 6 | beta-galactoside (CMP) alpha-2,3-sialyltransferase activity |
| GO:0004065 | 0.0098 | 121.6391 | 0.0099 | 1 | 8 | arylsulfatase activity |
| GOMFID | Pvalue | OddsRatio | ExpCount | Count | Size | Term |
| GO:0047961 | 0.0042 | 337.1875 | 0.0042 | 1 | 4 | glycine N-acyltransferase activity |
| GOMFID | Pvalue | OddsRatio | ExpCount | Count | Size | Term |
| GO:0004252 | 0 | 24.209 | 0.2651 | 5 | 179 | serine-type endopeptidase activity |
| GO:0017171 | 0 | 20.4075 | 0.3125 | 5 | 211 | serine hydrolase activity |
| GO:0008603 | 0 | 294.1091 | 0.0104 | 2 | 7 | cAMP-dependent protein kinase regulator activity |
| GO:0070011 | 0.0014 | 7.0912 | 0.8649 | 5 | 584 | peptidase activity, acting on L-amino acid peptides |
| GO:0008009 | 0.0023 | 31.8874 | 0.0711 | 2 | 48 | chemokine activity |
| GO:0016499 | 0.003 | 703.4783 | 0.003 | 1 | 2 | orexin receptor activity |
| GO:0008240 | 0.0044 | 351.7174 | 0.0044 | 1 | 3 | tripeptidyl-peptidase activity |
| GO:0033592 | 0.0044 | 351.7174 | 0.0044 | 1 | 3 | RNA strand annealing activity |
| GO:0002151 | 0.0074 | 175.837 | 0.0074 | 1 | 5 | G-quadruplex RNA binding |
| GO:0031726 | 0.0074 | 175.837 | 0.0074 | 1 | 5 | CCR1 chemokine receptor binding |
| GO:0004691 | 0.0089 | 140.6609 | 0.0089 | 1 | 6 | cAMP-dependent protein kinase activity |
| GO:0031730 | 0.0089 | 140.6609 | 0.0089 | 1 | 6 | CCR5 chemokine receptor binding |
| GOMFID | Pvalue | OddsRatio | ExpCount | Count | Size | Term |
| GO:0001077 | 3e-04 | 15.2529 | 0.3271 | 4 | 265 | transcriptional activator activity, RNA polymerase II core promoter proximal region sequence-specific binding |
| GO:0004082 | 0.0049 | 283.8947 | 0.0049 | 1 | 4 | bisphosphoglycerate mutase activity |
| GO:0046538 | 0.0049 | 283.8947 | 0.0049 | 1 | 4 | 2,3-bisphosphoglycerate-dependent phosphoglycerate mutase activity |
| GO:0003828 | 0.0074 | 170.3158 | 0.0074 | 1 | 6 | alpha-N-acetylneuraminate alpha-2,8-sialyltransferase activity |
| GO:0001046 | 0.008 | 16.5401 | 0.1358 | 2 | 110 | core promoter sequence-specific DNA binding |
| GO:0000150 | 0.0098 | 121.6391 | 0.0099 | 1 | 8 | recombinase activity |
| GOMFID | Pvalue | OddsRatio | ExpCount | Count | Size | Term |
| GO:0003943 | 0.003 | 703.4783 | 0.003 | 1 | 2 | N-acetylgalactosamine-4-sulfatase activity |
| GO:0008269 | 0.003 | 703.4783 | 0.003 | 1 | 2 | JAK pathway signal transduction adaptor activity |
| GO:0071885 | 0.003 | 703.4783 | 0.003 | 1 | 2 | N-terminal protein N-methyltransferase activity |
| GO:0004004 | 0.004 | 23.6349 | 0.0948 | 2 | 64 | ATP-dependent RNA helicase activity |
| GO:0015265 | 0.0044 | 351.7174 | 0.0044 | 1 | 3 | urea channel activity |
| GO:0030229 | 0.0059 | 234.4638 | 0.0059 | 1 | 4 | very-low-density lipoprotein particle receptor activity |
| GO:0031698 | 0.0059 | 234.4638 | 0.0059 | 1 | 4 | beta-2 adrenergic receptor binding |
| GO:0005131 | 0.0074 | 175.837 | 0.0074 | 1 | 5 | growth hormone receptor binding |
| GO:0008142 | 0.0074 | 175.837 | 0.0074 | 1 | 5 | oxysterol binding |
| GO:0070035 | 0.0083 | 16.0739 | 0.1377 | 2 | 93 | purine NTP-dependent helicase activity |
| GOMFID | Pvalue | OddsRatio | ExpCount | Count | Size | Term |
| GO:0003844 | 0.0015 | Inf | 0.0015 | 1 | 1 | 1,4-alpha-glucan branching enzyme activity |
| GO:0102752 | 0.0015 | Inf | 0.0015 | 1 | 1 | 1,4-alpha-glucan branching enzyme activity (using a glucosylated glycogenin as primer for glycogen synthesis) |
| GO:0003943 | 0.003 | 703.4783 | 0.003 | 1 | 2 | N-acetylgalactosamine-4-sulfatase activity |
| GO:0047275 | 0.003 | 703.4783 | 0.003 | 1 | 2 | glucosaminylgalactosylglucosylceramide beta-galactosyltransferase activity |
| GO:0004971 | 0.0044 | 351.7174 | 0.0044 | 1 | 3 | AMPA glutamate receptor activity |
| GO:0099583 | 0.0044 | 351.7174 | 0.0044 | 1 | 3 | neurotransmitter receptor activity involved in regulation of postsynaptic cytosolic calcium ion concentration |
| GO:0015333 | 0.0059 | 234.4638 | 0.0059 | 1 | 4 | peptide:proton symporter activity |
| GO:0008494 | 0.0089 | 140.6609 | 0.0089 | 1 | 6 | translation activator activity |
| GOMFID | Pvalue | OddsRatio | ExpCount | Count | Size | Term |
| GO:0005546 | 8e-04 | 17.9199 | 0.1861 | 3 | 58 | phosphatidylinositol-4,5-bisphosphate binding |
| GO:0046403 | 0.0032 | Inf | 0.0032 | 1 | 1 | polynucleotide 3'-phosphatase activity |
| GO:0051916 | 0.0032 | Inf | 0.0032 | 1 | 1 | granulocyte colony-stimulating factor binding |
| GO:0005547 | 0.0053 | 20.1513 | 0.1091 | 2 | 34 | phosphatidylinositol-3,4,5-trisphosphate binding |
| GO:0004831 | 0.0064 | 316.7059 | 0.0064 | 1 | 2 | tyrosine-tRNA ligase activity |
| GO:0005153 | 0.0064 | 316.7059 | 0.0064 | 1 | 2 | interleukin-8 receptor binding |
| GO:0003774 | 0.0089 | 7.5462 | 0.4268 | 3 | 133 | motor activity |
| GO:0005157 | 0.0096 | 158.3431 | 0.0096 | 1 | 3 | macrophage colony-stimulating factor receptor binding |
| GO:0046404 | 0.0096 | 158.3431 | 0.0096 | 1 | 3 | ATP-dependent polydeoxyribonucleotide 5'-hydroxyl-kinase activity |
| GOMFID | Pvalue | OddsRatio | ExpCount | Count | Size | Term |
| GO:0046403 | 0.0031 | Inf | 0.0031 | 1 | 1 | polynucleotide 3'-phosphatase activity |
| GO:0051916 | 0.0031 | Inf | 0.0031 | 1 | 1 | granulocyte colony-stimulating factor binding |
| GO:0004831 | 0.0062 | 329.6735 | 0.0062 | 1 | 2 | tyrosine-tRNA ligase activity |
| GO:0005153 | 0.0062 | 329.6735 | 0.0062 | 1 | 2 | interleukin-8 receptor binding |
| GO:0016151 | 0.0062 | 329.6735 | 0.0062 | 1 | 2 | nickel cation binding |
| GO:0005157 | 0.0092 | 164.8265 | 0.0093 | 1 | 3 | macrophage colony-stimulating factor receptor binding |
| GO:0046404 | 0.0092 | 164.8265 | 0.0093 | 1 | 3 | ATP-dependent polydeoxyribonucleotide 5'-hydroxyl-kinase activity |
| GOMFID | Pvalue | OddsRatio | ExpCount | Count | Size | Term |
| GO:0016495 | 0.0019 | Inf | 0.0019 | 1 | 1 | C-X3-C chemokine receptor activity |
| GO:0042497 | 0.0019 | Inf | 0.0019 | 1 | 1 | triacyl lipopeptide binding |
| GO:0005546 | 0.0051 | 20.5599 | 0.1074 | 2 | 58 | phosphatidylinositol-4,5-bisphosphate binding |
| GO:0031531 | 0.0055 | 278.8448 | 0.0056 | 1 | 3 | thyrotropin-releasing hormone receptor binding |
| GO:0005539 | 0.0066 | 8.6133 | 0.3869 | 3 | 209 | glycosaminoglycan binding |
| GO:0005089 | 0.0078 | 16.4337 | 0.1333 | 2 | 72 | Rho guanyl-nucleotide exchange factor activity |
| GO:0001875 | 0.0092 | 139.4052 | 0.0093 | 1 | 5 | lipopolysaccharide receptor activity |
| GO:0019960 | 0.0092 | 139.4052 | 0.0093 | 1 | 5 | C-X3-C chemokine binding |
| GO:0031726 | 0.0092 | 139.4052 | 0.0093 | 1 | 5 | CCR1 chemokine receptor binding |
| GO:0031727 | 0.0092 | 139.4052 | 0.0093 | 1 | 5 | CCR2 chemokine receptor binding |
| GOMFID | Pvalue | OddsRatio | ExpCount | Count | Size | Term |
| GO:0031726 | 0 | 359.3333 | 0.0099 | 2 | 5 | CCR1 chemokine receptor binding |
| GO:0008009 | 1e-04 | 37.0759 | 0.0948 | 3 | 48 | chemokine activity |
| GO:0036470 | 0.002 | Inf | 0.002 | 1 | 1 | tyrosine 3-monooxygenase activator activity |
| GO:0036478 | 0.002 | Inf | 0.002 | 1 | 1 | L-dopa decarboxylase activator activity |
| GO:0036524 | 0.002 | Inf | 0.002 | 1 | 1 | protein deglycase activity |
| GO:0042497 | 0.002 | Inf | 0.002 | 1 | 1 | triacyl lipopeptide binding |
| GO:0045340 | 0.002 | Inf | 0.002 | 1 | 1 | mercury ion binding |
| GO:0042802 | 0.0024 | 3.7289 | 3.0509 | 9 | 1545 | identical protein binding |
| GO:0004878 | 0.0039 | 521.6774 | 0.0039 | 1 | 2 | complement component C5a receptor activity |
| GO:0016532 | 0.0039 | 521.6774 | 0.0039 | 1 | 2 | superoxide dismutase copper chaperone activity |
| GO:0017159 | 0.0059 | 260.8226 | 0.0059 | 1 | 3 | pantetheine hydrolase activity |
| GO:1903135 | 0.0059 | 260.8226 | 0.0059 | 1 | 3 | cupric ion binding |
| GO:0001875 | 0.0098 | 130.3952 | 0.0099 | 1 | 5 | lipopolysaccharide receptor activity |
| GO:0005047 | 0.0098 | 130.3952 | 0.0099 | 1 | 5 | signal recognition particle binding |
| GO:0016530 | 0.0098 | 130.3952 | 0.0099 | 1 | 5 | metallochaperone activity |
| GO:0031727 | 0.0098 | 130.3952 | 0.0099 | 1 | 5 | CCR2 chemokine receptor binding |
| GO:0044388 | 0.0098 | 130.3952 | 0.0099 | 1 | 5 | small protein activating enzyme binding |
| GO:1903136 | 0.0098 | 130.3952 | 0.0099 | 1 | 5 | cuprous ion binding |
| GOMFID | Pvalue | OddsRatio | ExpCount | Count | Size | Term |
| GO:0001631 | 0.0015 | Inf | 0.0015 | 1 | 1 | cysteinyl leukotriene receptor activity |
| GO:0048020 | 0.0015 | 39.6658 | 0.0578 | 2 | 39 | CCR chemokine receptor binding |
| GO:0008009 | 0.0023 | 31.8874 | 0.0711 | 2 | 48 | chemokine activity |
| GO:0004063 | 0.003 | 703.4783 | 0.003 | 1 | 2 | aryldialkylphosphatase activity |
| GO:0004667 | 0.003 | 703.4783 | 0.003 | 1 | 2 | prostaglandin-D synthase activity |
| GO:0070506 | 0.003 | 703.4783 | 0.003 | 1 | 2 | high-density lipoprotein particle receptor activity |
| GO:0005157 | 0.0044 | 351.7174 | 0.0044 | 1 | 3 | macrophage colony-stimulating factor receptor binding |
| GO:0102007 | 0.0044 | 351.7174 | 0.0044 | 1 | 3 | acyl-L-homoserine-lactone lactonohydrolase activity |
| GO:0005126 | 0.0057 | 9.293 | 0.3691 | 3 | 260 | cytokine receptor binding |
| GO:1905394 | 0.0059 | 234.4638 | 0.0059 | 1 | 4 | retromer complex binding |
| GO:0000268 | 0.0074 | 175.837 | 0.0074 | 1 | 5 | peroxisome targeting sequence binding |
| GO:0004064 | 0.0089 | 140.6609 | 0.0089 | 1 | 6 | arylesterase activity |
| GOMFID | Pvalue | OddsRatio | ExpCount | Count | Size | Term |
| GO:0032394 | 0 | Inf | 0.0041 | 2 | 2 | MHC class Ib receptor activity |
| GO:0042288 | 6e-04 | 65.1452 | 0.0367 | 2 | 18 | MHC class I protein binding |
| GO:0052798 | 0.002 | Inf | 0.002 | 1 | 1 | beta-galactoside alpha-2,3-sialyltransferase activity |
| GO:0005052 | 0.0041 | 505.3438 | 0.0041 | 1 | 2 | peroxisome matrix targeting signal-1 binding |
| GO:0042284 | 0.0041 | 505.3438 | 0.0041 | 1 | 2 | sphingolipid delta-4 desaturase activity |
| GO:0044323 | 0.0081 | 168.4271 | 0.0081 | 1 | 4 | retinoic acid-responsive element binding |
| GO:1905394 | 0.0081 | 168.4271 | 0.0081 | 1 | 4 | retromer complex binding |
| GOMFID | Pvalue | OddsRatio | ExpCount | Count | Size | Term |
| GO:0004930 | 0 | 13.2244 | 0.7248 | 6 | 783 | G-protein coupled receptor activity |
| GO:0004984 | 3e-04 | 15.7218 | 0.3425 | 4 | 370 | olfactory receptor activity |
| GO:0099600 | 5e-04 | 8.2314 | 1.1284 | 6 | 1219 | transmembrane receptor activity |
| GO:0038023 | 6e-04 | 7.812 | 1.1839 | 6 | 1279 | signaling receptor activity |
| GO:0001631 | 9e-04 | Inf | 9e-04 | 1 | 1 | cysteinyl leukotriene receptor activity |
| GO:0060089 | 0.0017 | 6.4017 | 1.419 | 6 | 1533 | molecular transducer activity |
| GO:0004063 | 0.0019 | 1156.3571 | 0.0019 | 1 | 2 | aryldialkylphosphatase activity |
| GO:0050252 | 0.0019 | 1156.3571 | 0.0019 | 1 | 2 | retinol O-fatty-acyltransferase activity |
| GO:0102007 | 0.0028 | 578.1429 | 0.0028 | 1 | 3 | acyl-L-homoserine-lactone lactonohydrolase activity |
| GO:0004144 | 0.0037 | 385.4048 | 0.0037 | 1 | 4 | diacylglycerol O-acyltransferase activity |
| GO:0003846 | 0.0046 | 289.0357 | 0.0046 | 1 | 5 | 2-acylglycerol O-acyltransferase activity |
| GO:0004064 | 0.0055 | 231.2143 | 0.0056 | 1 | 6 | arylesterase activity |
| GOMFID | Pvalue | OddsRatio | ExpCount | Count | Size | Term |
| GO:0070717 | 4e-04 | 85.5238 | 0.0284 | 2 | 20 | poly-purine tract binding |
| GO:0019782 | 0.0014 | Inf | 0.0014 | 1 | 1 | ISG15 activating enzyme activity |
| GO:0038051 | 0.0014 | Inf | 0.0014 | 1 | 1 | glucocorticoid-activated RNA polymerase II transcription factor binding transcription factor activity |
| GO:0004839 | 0.0057 | 245.1364 | 0.0057 | 1 | 4 | ubiquitin activating enzyme activity |
| GO:0097016 | 0.0057 | 245.1364 | 0.0057 | 1 | 4 | L27 domain binding |
| GO:0099104 | 0.0057 | 245.1364 | 0.0057 | 1 | 4 | potassium channel activator activity |
| GO:0004758 | 0.0071 | 183.8409 | 0.0071 | 1 | 5 | serine C-palmitoyltransferase activity |
| GO:0016427 | 0.0085 | 147.0636 | 0.0085 | 1 | 6 | tRNA (cytosine) methyltransferase activity |
| GO:1990239 | 0.0085 | 147.0636 | 0.0085 | 1 | 6 | steroid hormone binding |
| GOMFID | Pvalue | OddsRatio | ExpCount | Count | Size | Term |
| GO:0035663 | 0 | 898.1111 | 0.007 | 2 | 3 | Toll-like receptor 2 binding |
| GO:0071723 | 2e-04 | 112.2153 | 0.0234 | 2 | 10 | lipopeptide binding |
| GO:0004633 | 0.0023 | Inf | 0.0023 | 1 | 1 | phosphopantothenoylcysteine decarboxylase activity |
| GO:0030290 | 0.0023 | Inf | 0.0023 | 1 | 1 | sphingolipid activator protein activity |
| GO:0032428 | 0.0023 | Inf | 0.0023 | 1 | 1 | beta-N-acetylgalactosaminidase activity |
| GO:0042356 | 0.0023 | Inf | 0.0023 | 1 | 1 | GDP-4-dehydro-D-rhamnose reductase activity |
| GO:0050577 | 0.0023 | Inf | 0.0023 | 1 | 1 | GDP-L-fucose synthase activity |
| GO:0004911 | 0.0047 | 436.9189 | 0.0047 | 1 | 2 | interleukin-2 receptor activity |
| GO:0005153 | 0.0047 | 436.9189 | 0.0047 | 1 | 2 | interleukin-8 receptor binding |
| GO:0019976 | 0.0047 | 436.9189 | 0.0047 | 1 | 2 | interleukin-2 binding |
| GO:0030366 | 0.0047 | 436.9189 | 0.0047 | 1 | 2 | molybdopterin synthase activity |
| GO:0046811 | 0.0047 | 436.9189 | 0.0047 | 1 | 2 | histone deacetylase inhibitor activity |
| GO:0030234 | 0.0069 | 3.5338 | 2.2934 | 7 | 978 | enzyme regulator activity |
| GO:0004082 | 0.0093 | 145.6216 | 0.0094 | 1 | 4 | bisphosphoglycerate mutase activity |
| GO:0046538 | 0.0093 | 145.6216 | 0.0094 | 1 | 4 | 2,3-bisphosphoglycerate-dependent phosphoglycerate mutase activity |
| GO:0051430 | 0.0093 | 145.6216 | 0.0094 | 1 | 4 | corticotropin-releasing hormone receptor 1 binding |
| GO:0051431 | 0.0093 | 145.6216 | 0.0094 | 1 | 4 | corticotropin-releasing hormone receptor 2 binding |
| GOMFID | Pvalue | OddsRatio | ExpCount | Count | Size | Term |
| GO:0042056 | 5e-04 | 70.4096 | 0.034 | 2 | 29 | chemoattractant activity |
| GO:0031851 | 0.0012 | Inf | 0.0012 | 1 | 1 | kappa-type opioid receptor binding |
| GO:0030246 | 0.0033 | 11.6214 | 0.3048 | 3 | 260 | carbohydrate binding |
| GO:0031720 | 0.0035 | 449.5556 | 0.0035 | 1 | 3 | haptoglobin binding |
| GO:0005223 | 0.0047 | 299.6852 | 0.0047 | 1 | 4 | intracellular cGMP activated cation channel activity |
| GO:0048030 | 0.0047 | 299.6852 | 0.0047 | 1 | 4 | disaccharide binding |
| GO:0099104 | 0.0047 | 299.6852 | 0.0047 | 1 | 4 | potassium channel activator activity |
| GO:0005249 | 0.005 | 21.2783 | 0.1067 | 2 | 91 | voltage-gated potassium channel activity |
| GO:0004466 | 0.0058 | 224.75 | 0.0059 | 1 | 5 | long-chain-acyl-CoA dehydrogenase activity |
| GO:0004758 | 0.0058 | 224.75 | 0.0059 | 1 | 5 | serine C-palmitoyltransferase activity |
| GO:0005134 | 0.0058 | 224.75 | 0.0059 | 1 | 5 | interleukin-2 receptor binding |
| GO:0005534 | 0.0058 | 224.75 | 0.0059 | 1 | 5 | galactose binding |
| GO:0004126 | 0.0093 | 128.4048 | 0.0094 | 1 | 8 | cytidine deaminase activity |
| GO:0043208 | 0.0093 | 128.4048 | 0.0094 | 1 | 8 | glycosphingolipid binding |
| GOMFID | Pvalue | OddsRatio | ExpCount | Count | Size | Term |
| GO:0042056 | 8e-04 | 54.3906 | 0.0429 | 2 | 29 | chemoattractant activity |
| GO:0046899 | 0.003 | 703.4783 | 0.003 | 1 | 2 | nucleoside triphosphate adenylate kinase activity |
| GO:0048101 | 0.003 | 703.4783 | 0.003 | 1 | 2 | calcium- and calmodulin-regulated 3',5'-cyclic-GMP phosphodiesterase activity |
| GO:0004117 | 0.0044 | 351.7174 | 0.0044 | 1 | 3 | calmodulin-dependent cyclic-nucleotide phosphodiesterase activity |
| GO:0004965 | 0.0044 | 351.7174 | 0.0044 | 1 | 3 | G-protein coupled GABA receptor activity |
| GO:0030545 | 0.0048 | 6.715 | 0.699 | 4 | 472 | receptor regulator activity |
| GO:0005025 | 0.0059 | 234.4638 | 0.0059 | 1 | 4 | transforming growth factor beta receptor activity, type I |
| GO:0005549 | 0.0066 | 18.0696 | 0.1229 | 2 | 83 | odorant binding |
| GOMFID | Pvalue | OddsRatio | ExpCount | Count | Size | Term |
| GO:0003823 | 4e-04 | 82.3776 | 0.0315 | 2 | 51 | antigen binding |
| GO:0001791 | 0.0012 | 1799.3333 | 0.0012 | 1 | 2 | IgM binding |
| GO:0005153 | 0.0012 | 1799.3333 | 0.0012 | 1 | 2 | interleukin-8 receptor binding |
| GO:0030881 | 0.0055 | 224.8194 | 0.0056 | 1 | 9 | beta-2-microglobulin binding |
| GO:0031419 | 0.0055 | 224.8194 | 0.0056 | 1 | 9 | cobalamin binding |
| GOMFID | Pvalue | OddsRatio | ExpCount | Count | Size | Term |
| GO:0001605 | 0.0024 | Inf | 0.0024 | 1 | 1 | adrenomedullin receptor activity |
| GO:0003844 | 0.0024 | Inf | 0.0024 | 1 | 1 | 1,4-alpha-glucan branching enzyme activity |
| GO:0031704 | 0.0024 | Inf | 0.0024 | 1 | 1 | apelin receptor binding |
| GO:0032556 | 0.0024 | Inf | 0.0024 | 1 | 1 | pyrimidine deoxyribonucleotide binding |
| GO:0047840 | 0.0024 | Inf | 0.0024 | 1 | 1 | dCTP diphosphatase activity |
| GO:0102752 | 0.0024 | Inf | 0.0024 | 1 | 1 | 1,4-alpha-glucan branching enzyme activity (using a glucosylated glycogenin as primer for glycogen synthesis) |
| GO:0045182 | 0.0044 | 22.352 | 0.0987 | 2 | 41 | translation regulator activity |
| GO:0001635 | 0.0048 | 425.3947 | 0.0048 | 1 | 2 | calcitonin gene-related peptide receptor activity |
| GO:0001791 | 0.0048 | 425.3947 | 0.0048 | 1 | 2 | IgM binding |
| GO:0030350 | 0.0048 | 425.3947 | 0.0048 | 1 | 2 | iron-responsive element binding |
| GO:0008083 | 0.006 | 8.8383 | 0.3706 | 3 | 154 | growth factor activity |
| GO:0004948 | 0.0072 | 212.6842 | 0.0072 | 1 | 3 | calcitonin receptor activity |
| GO:0005157 | 0.0072 | 212.6842 | 0.0072 | 1 | 3 | macrophage colony-stimulating factor receptor binding |
| GO:0008823 | 0.0072 | 212.6842 | 0.0072 | 1 | 3 | cupric reductase activity |
| GO:0052851 | 0.0072 | 212.6842 | 0.0072 | 1 | 3 | ferric-chelate reductase (NADPH) activity |
| GO:0004090 | 0.0096 | 141.7807 | 0.0096 | 1 | 4 | carbonyl reductase (NADPH) activity |
| GO:0015333 | 0.0096 | 141.7807 | 0.0096 | 1 | 4 | peptide:proton symporter activity |
| GOMFID | Pvalue | OddsRatio | ExpCount | Count | Size | Term |
| GO:0004831 | 0.0047 | 436.9189 | 0.0047 | 1 | 2 | tyrosine-tRNA ligase activity |
| GO:0005019 | 0.0047 | 436.9189 | 0.0047 | 1 | 2 | platelet-derived growth factor beta-receptor activity |
| GO:0005153 | 0.0047 | 436.9189 | 0.0047 | 1 | 2 | interleukin-8 receptor binding |
| GO:0016151 | 0.0047 | 436.9189 | 0.0047 | 1 | 2 | nickel cation binding |
| GO:0004715 | 0.0059 | 19.0544 | 0.1149 | 2 | 49 | non-membrane spanning protein tyrosine kinase activity |
| GO:0004992 | 0.007 | 218.4459 | 0.007 | 1 | 3 | platelet activating factor receptor activity |
| GO:0015186 | 0.0093 | 145.6216 | 0.0094 | 1 | 4 | L-glutamine transmembrane transporter activity |
| NA. |
| n/a |
| NA. |
| n/a |
| NA. |
| n/a |
| NA. |
| n/a |
| NA. |
| n/a |
| NA. |
| n/a |
| NA. |
| n/a |
| NA. |
| n/a |
| NA. |
| n/a |
| NA. |
| n/a |
| NA. |
| n/a |
| NA. |
| n/a |
| NA. |
| n/a |
| NA. |
| n/a |
| NA. |
| n/a |
| NA. |
| n/a |
| NA. |
| n/a |
| NA. |
| n/a |
| NA. |
| n/a |
| NA. |
| n/a |
| NA. |
| n/a |
| NA. |
| n/a |
| NA. |
| n/a |
| NA. |
| n/a |
| NA. |
| n/a |
| NA. |
| n/a |
| NA. |
| n/a |
| NA. |
| n/a |
| NA. |
| n/a |
| NA. |
| n/a |
| NA. |
| n/a |
| NA. |
| n/a |
| NA. |
| n/a |
| NA. |
| n/a |
| NA. |
| n/a |
| NA. |
| n/a |
| NA. |
| n/a |
| NA. |
| n/a |
| NA. |
| n/a |
| NA. |
| n/a |
| NA. |
| n/a |
| NA. |
| n/a |
| NA. |
| n/a |
| NA. |
| n/a |
| NA. |
| n/a |
| NA. |
| n/a |
| NA. |
| n/a |
| NA. |
| n/a |
| NA. |
| n/a |
| NA. |
| n/a |
| NA. |
| n/a |
| NA. |
| n/a |
| NA. |
| n/a |
| NA. |
| n/a |
| NA. |
| n/a |
| NA. |
| n/a |
| GOMFID | Pvalue | OddsRatio | ExpCount | Count | Size | Term |
| GO:0070098 | 0 | 18.5611 | 0.4437 | 7 | 80 | chemokine-mediated signaling pathway |
| GO:0030593 | 0 | 16.7196 | 0.488 | 7 | 88 | neutrophil chemotaxis |
| GO:0097530 | 0 | 11.7515 | 0.6766 | 7 | 122 | granulocyte migration |
| GO:0071347 | 0 | 13.6522 | 0.4991 | 6 | 90 | cellular response to interleukin-1 |
| GO:0002548 | 0 | 16.5965 | 0.3438 | 5 | 62 | monocyte chemotaxis |
| GO:0048247 | 0 | 23.2136 | 0.2009 | 4 | 37 | lymphocyte chemotaxis |
| GO:0050900 | 1e-04 | 4.9694 | 2.2515 | 10 | 406 | leukocyte migration |
| GO:0035195 | 1e-04 | 6.2006 | 1.4308 | 8 | 258 | gene silencing by miRNA |
| GO:0060326 | 1e-04 | 6.1506 | 1.4419 | 8 | 260 | cell chemotaxis |
| GO:0016441 | 1e-04 | 6.029 | 1.4696 | 8 | 265 | posttranscriptional gene silencing |
| GO:0071346 | 1e-04 | 8.5314 | 0.7764 | 6 | 140 | cellular response to interferon-gamma |
| GO:0071356 | 1e-04 | 5.8893 | 1.5029 | 8 | 271 | cellular response to tumor necrosis factor |
| GO:0031047 | 2e-04 | 5.5258 | 1.5971 | 8 | 288 | gene silencing by RNA |
| GO:0034097 | 2e-04 | 3.2121 | 5.3293 | 15 | 961 | response to cytokine |
| GO:2000503 | 4e-04 | 91.6761 | 0.0333 | 2 | 6 | positive regulation of natural killer cell chemotaxis |
| GO:0070374 | 7e-04 | 6.0604 | 1.0759 | 6 | 194 | positive regulation of ERK1 and ERK2 cascade |
| GO:0034249 | 9e-04 | 4.3129 | 2.0242 | 8 | 365 | negative regulation of cellular amide metabolic process |
| GO:0042330 | 0.0011 | 3.5363 | 3.1111 | 10 | 561 | taxis |
| GO:0007186 | 0.0013 | 2.607 | 6.9431 | 16 | 1252 | G-protein coupled receptor signaling pathway |
| GO:0043922 | 0.0019 | 36.6568 | 0.0665 | 2 | 12 | negative regulation by host of viral transcription |
| GO:0042221 | 0.002 | 1.9372 | 23.1142 | 36 | 4168 | response to chemical |
| GO:0016032 | 0.0029 | 2.8934 | 4.1703 | 11 | 752 | viral process |
| GO:0010469 | 0.0039 | 3.1375 | 3.1111 | 9 | 561 | regulation of receptor activity |
| GO:0071310 | 0.0042 | 2.0243 | 13.1043 | 23 | 2363 | cellular response to organic substance |
| GO:1903769 | 0.0055 | Inf | 0.0055 | 1 | 1 | negative regulation of cell proliferation in bone marrow |
| GO:1990700 | 0.0055 | Inf | 0.0055 | 1 | 1 | nucleolar chromatin organization |
| GO:0070723 | 0.006 | 19.2823 | 0.1165 | 2 | 21 | response to cholesterol |
| GO:1901623 | 0.006 | 19.2823 | 0.1165 | 2 | 21 | regulation of lymphocyte chemotaxis |
| GO:0051702 | 0.0064 | 8.5273 | 0.3771 | 3 | 68 | interaction with symbiont |
| GO:0035821 | 0.0076 | 5.473 | 0.7764 | 4 | 140 | modification of morphology or physiology of other organism |
| GO:0006417 | 0.0089 | 2.9362 | 2.9225 | 8 | 527 | regulation of translation |
| GO:0052472 | 0.0091 | 15.2604 | 0.1442 | 2 | 26 | modulation by host of symbiont transcription |
| GOMFID | Pvalue | OddsRatio | ExpCount | Count | Size | Term |
| GO:0070098 | 1e-04 | 11.7641 | 0.4732 | 5 | 80 | chemokine-mediated signaling pathway |
| GO:0002376 | 2e-04 | 2.3221 | 15.7999 | 30 | 2671 | immune system process |
| GO:0007186 | 3e-04 | 2.7862 | 7.406 | 18 | 1252 | G-protein coupled receptor signaling pathway |
| GO:0048247 | 4e-04 | 12.9461 | 0.3431 | 4 | 58 | lymphocyte chemotaxis |
| GO:0002548 | 5e-04 | 12.0502 | 0.3668 | 4 | 62 | monocyte chemotaxis |
| GO:0030593 | 0.0018 | 8.3069 | 0.5205 | 4 | 88 | neutrophil chemotaxis |
| GO:0071347 | 0.002 | 8.1127 | 0.5324 | 4 | 90 | cellular response to interleukin-1 |
| GO:0070231 | 0.0027 | 11.7955 | 0.278 | 3 | 47 | T cell apoptotic process |
| GO:0045087 | 0.0038 | 2.6474 | 4.9571 | 12 | 838 | innate immune response |
| GO:0060326 | 0.0044 | 4.1677 | 1.538 | 6 | 260 | cell chemotaxis |
| GO:0071356 | 0.0054 | 3.9919 | 1.6031 | 6 | 271 | cellular response to tumor necrosis factor |
| GO:0000011 | 0.0059 | Inf | 0.0059 | 1 | 1 | vacuole inheritance |
| GO:0000494 | 0.0059 | Inf | 0.0059 | 1 | 1 | box C/D snoRNA 3'-end processing |
| GO:0019408 | 0.0059 | Inf | 0.0059 | 1 | 1 | dolichol biosynthetic process |
| GO:0030887 | 0.0059 | Inf | 0.0059 | 1 | 1 | positive regulation of myeloid dendritic cell activation |
| GO:0033967 | 0.0059 | Inf | 0.0059 | 1 | 1 | box C/D snoRNA metabolic process |
| GO:0043381 | 0.0059 | Inf | 0.0059 | 1 | 1 | negative regulation of memory T cell differentiation |
| GO:0071329 | 0.0059 | Inf | 0.0059 | 1 | 1 | cellular response to sucrose stimulus |
| GO:1903488 | 0.0059 | Inf | 0.0059 | 1 | 1 | negative regulation of lactation |
| GO:1904109 | 0.0059 | Inf | 0.0059 | 1 | 1 | positive regulation of cholesterol import |
| GO:1990258 | 0.0059 | Inf | 0.0059 | 1 | 1 | histone glutamine methylation |
| GO:0097530 | 0.0059 | 5.9009 | 0.7217 | 4 | 122 | granulocyte migration |
| GO:0046782 | 0.0064 | 8.4992 | 0.3786 | 3 | 64 | regulation of viral transcription |
| GO:0043547 | 0.0084 | 3.2344 | 2.307 | 7 | 390 | positive regulation of GTPase activity |
| GO:0051707 | 0.0084 | 2.4771 | 4.8033 | 11 | 812 | response to other organism |
| GO:0006816 | 0.0087 | 3.2086 | 2.3247 | 7 | 393 | calcium ion transport |
| GO:0043903 | 0.0088 | 4.1863 | 1.2659 | 5 | 214 | regulation of symbiosis, encompassing mutualism through parasitism |
| GO:0071346 | 0.0096 | 5.1141 | 0.8281 | 4 | 140 | cellular response to interferon-gamma |
| GO:0030217 | 0.0097 | 4.0872 | 1.2955 | 5 | 219 | T cell differentiation |
| GO:0042147 | 0.01 | 7.1958 | 0.4437 | 3 | 75 | retrograde transport, endosome to Golgi |
| GOMFID | Pvalue | OddsRatio | ExpCount | Count | Size | Term |
| GO:0050911 | 3e-04 | 7.6506 | 0.9144 | 6 | 371 | detection of chemical stimulus involved in sensory perception of smell |
| GO:0009593 | 8e-04 | 6.2579 | 1.1091 | 6 | 450 | detection of chemical stimulus |
| GO:0050906 | 9e-04 | 6.0886 | 1.1387 | 6 | 462 | detection of stimulus involved in sensory perception |
| GO:0007606 | 9e-04 | 6.0073 | 1.1535 | 6 | 468 | sensory perception of chemical stimulus |
| GO:0033141 | 0.0012 | 44.7922 | 0.0518 | 2 | 21 | positive regulation of peptidyl-serine phosphorylation of STAT protein |
| GO:0042100 | 0.0014 | 15.0065 | 0.2218 | 3 | 90 | B cell proliferation |
| GO:0002286 | 0.0016 | 14.3433 | 0.2317 | 3 | 94 | T cell activation involved in immune response |
| GO:0002250 | 0.0016 | 6.5607 | 0.8627 | 5 | 350 | adaptive immune response |
| GO:0002323 | 0.0023 | 31.5049 | 0.0715 | 2 | 29 | natural killer cell activation involved in immune response |
| GO:0034120 | 0.0025 | Inf | 0.0025 | 1 | 1 | positive regulation of erythrocyte aggregation |
| GO:0060735 | 0.0025 | Inf | 0.0025 | 1 | 1 | regulation of eIF2 alpha phosphorylation by dsRNA |
| GO:1901980 | 0.0025 | Inf | 0.0025 | 1 | 1 | positive regulation of inward rectifier potassium channel activity |
| GO:0030183 | 0.0026 | 11.9613 | 0.276 | 3 | 112 | B cell differentiation |
| GO:0043029 | 0.0035 | 25.0077 | 0.0887 | 2 | 36 | T cell homeostasis |
| GO:0070661 | 0.0046 | 6.502 | 0.6803 | 4 | 276 | leukocyte proliferation |
| GO:0006624 | 0.0049 | 415.0769 | 0.0049 | 1 | 2 | vacuolar protein processing |
| GO:0110015 | 0.0049 | 415.0769 | 0.0049 | 1 | 2 | positive regulation of elastin catabolic process |
| GO:0120041 | 0.0049 | 415.0769 | 0.0049 | 1 | 2 | positive regulation of macrophage proliferation |
| GO:0043330 | 0.0055 | 19.7625 | 0.1109 | 2 | 45 | response to exogenous dsRNA |
| GO:0046425 | 0.0058 | 8.9095 | 0.3672 | 3 | 149 | regulation of JAK-STAT cascade |
| GO:1903018 | 0.0067 | 17.6985 | 0.1232 | 2 | 50 | regulation of glycoprotein metabolic process |
| GO:0002317 | 0.0074 | 207.5256 | 0.0074 | 1 | 3 | plasma cell differentiation |
| GO:0006407 | 0.0074 | 207.5256 | 0.0074 | 1 | 3 | rRNA export from nucleus |
| GO:0046013 | 0.0074 | 207.5256 | 0.0074 | 1 | 3 | regulation of T cell homeostatic proliferation |
| GO:0140076 | 0.0074 | 207.5256 | 0.0074 | 1 | 3 | negative regulation of lipoprotein transport |
| GO:1903037 | 0.0083 | 5.4752 | 0.8035 | 4 | 326 | regulation of leukocyte cell-cell adhesion |
| GO:0097696 | 0.0085 | 7.7321 | 0.4215 | 3 | 171 | STAT cascade |
| GO:0042255 | 0.009 | 15.1626 | 0.143 | 2 | 58 | ribosome assembly |
| GO:0060699 | 0.0098 | 138.3419 | 0.0099 | 1 | 4 | regulation of endoribonuclease activity |
| GOMFID | Pvalue | OddsRatio | ExpCount | Count | Size | Term |
| GO:0046982 | 0 | 5.1991 | 2.6361 | 12 | 469 | protein heterodimerization activity |
| GO:0003677 | 4e-04 | 2.3733 | 13.1975 | 26 | 2348 | DNA binding |
| GO:0005179 | 6e-04 | 8.1523 | 0.6689 | 5 | 119 | hormone activity |
| GO:0001055 | 0.0017 | 40.1748 | 0.0618 | 2 | 11 | RNA polymerase II activity |
| GO:1904264 | 0.0023 | 32.8662 | 0.0731 | 2 | 13 | ubiquitin protein ligase activity involved in ERAD pathway |
| GO:0005200 | 0.0027 | 7.4306 | 0.5789 | 4 | 103 | structural constituent of cytoskeleton |
| GO:0008811 | 0.0056 | Inf | 0.0056 | 1 | 1 | chloramphenicol O-acetyltransferase activity |
| GO:0016501 | 0.0056 | Inf | 0.0056 | 1 | 1 | prostacyclin receptor activity |
| GO:0031249 | 0.0056 | Inf | 0.0056 | 1 | 1 | denatured protein binding |
| GO:0031707 | 0.0056 | Inf | 0.0056 | 1 | 1 | endothelin A receptor binding |
| GO:0033560 | 0.0056 | Inf | 0.0056 | 1 | 1 | folate reductase activity |
| GO:0097260 | 0.0056 | Inf | 0.0056 | 1 | 1 | eoxin A4 synthase activity |
| GO:0008047 | 0.0066 | 3.0964 | 2.7767 | 8 | 494 | enzyme activator activity |
| GOMFID | Pvalue | OddsRatio | ExpCount | Count | Size | Term |
| GO:0004082 | 2e-04 | 167.6042 | 0.0242 | 2 | 4 | bisphosphoglycerate mutase activity |
| GO:0046538 | 2e-04 | 167.6042 | 0.0242 | 2 | 4 | 2,3-bisphosphoglycerate-dependent phosphoglycerate mutase activity |
| GO:1903231 | 6e-04 | 8.1081 | 0.6719 | 5 | 111 | mRNA binding involved in posttranscriptional gene silencing |
| GO:0001055 | 0.0019 | 37.2292 | 0.0666 | 2 | 11 | RNA polymerase II activity |
| GO:1904264 | 0.0027 | 30.4564 | 0.0787 | 2 | 13 | ubiquitin protein ligase activity involved in ERAD pathway |
| GO:0004953 | 0.0031 | 27.9167 | 0.0847 | 2 | 14 | icosanoid receptor activity |
| GO:0016805 | 0.0041 | 23.9256 | 0.0968 | 2 | 16 | dipeptidase activity |
| GO:0005096 | 0.006 | 3.9101 | 1.6343 | 6 | 270 | GTPase activator activity |
| GO:0008811 | 0.0061 | Inf | 0.0061 | 1 | 1 | chloramphenicol O-acetyltransferase activity |
| GO:0016495 | 0.0061 | Inf | 0.0061 | 1 | 1 | C-X3-C chemokine receptor activity |
| GO:0016501 | 0.0061 | Inf | 0.0061 | 1 | 1 | prostacyclin receptor activity |
| GO:0018455 | 0.0061 | Inf | 0.0061 | 1 | 1 | alcohol dehydrogenase [NAD(P)+] activity |
| GO:0031249 | 0.0061 | Inf | 0.0061 | 1 | 1 | denatured protein binding |
| GO:0031707 | 0.0061 | Inf | 0.0061 | 1 | 1 | endothelin A receptor binding |
| GO:0033560 | 0.0061 | Inf | 0.0061 | 1 | 1 | folate reductase activity |
| GO:0097260 | 0.0061 | Inf | 0.0061 | 1 | 1 | eoxin A4 synthase activity |
| GO:1904492 | 0.0061 | Inf | 0.0061 | 1 | 1 | Ac-Asp-Glu binding |
| GO:1904493 | 0.0061 | Inf | 0.0061 | 1 | 1 | tetrahydrofolyl-poly(glutamate) polymer binding |
| GO:0004181 | 0.0099 | 14.5553 | 0.1513 | 2 | 25 | metallocarboxypeptidase activity |
| GO:0016866 | 0.0099 | 14.5553 | 0.1513 | 2 | 25 | intramolecular transferase activity |
| GOMFID | Pvalue | OddsRatio | ExpCount | Count | Size | Term |
| GO:0005549 | 1e-04 | 17.3014 | 0.2615 | 4 | 83 | odorant binding |
| GO:0004984 | 0.001 | 5.7622 | 1.1687 | 6 | 371 | olfactory receptor activity |
| GO:0004930 | 0.0029 | 3.6833 | 2.4697 | 8 | 784 | G-protein coupled receptor activity |
| GO:0000210 | 0.0032 | Inf | 0.0032 | 1 | 1 | NAD+ diphosphatase activity |
| GO:0031859 | 0.0032 | Inf | 0.0032 | 1 | 1 | platelet activating factor receptor binding |
| GO:0047485 | 0.0042 | 10.0244 | 0.3245 | 3 | 103 | protein N-terminus binding |
| GO:0031691 | 0.0063 | 322.76 | 0.0063 | 1 | 2 | alpha-1A adrenergic receptor binding |
| GO:0031762 | 0.0063 | 322.76 | 0.0063 | 1 | 2 | follicle-stimulating hormone receptor binding |
| GO:1990932 | 0.0063 | 322.76 | 0.0063 | 1 | 2 | 5.8S rRNA binding |
| GO:0008028 | 0.0081 | 16.0259 | 0.1355 | 2 | 43 | monocarboxylic acid transmembrane transporter activity |
| GO:0031692 | 0.0094 | 161.37 | 0.0095 | 1 | 3 | alpha-1B adrenergic receptor binding |
| GO:0031826 | 0.0094 | 161.37 | 0.0095 | 1 | 3 | type 2A serotonin receptor binding |
| GOMFID | Pvalue | OddsRatio | ExpCount | Count | Size | Term |
| GO:0031859 | 0.0039 | Inf | 0.0039 | 1 | 1 | platelet activating factor receptor binding |
| GO:0097726 | 0.0039 | Inf | 0.0039 | 1 | 1 | LEM domain binding |
| GO:0031691 | 0.0078 | 260.0968 | 0.0078 | 1 | 2 | alpha-1A adrenergic receptor binding |
| GO:0031762 | 0.0078 | 260.0968 | 0.0078 | 1 | 2 | follicle-stimulating hormone receptor binding |
| GO:0043183 | 0.0078 | 260.0968 | 0.0078 | 1 | 2 | vascular endothelial growth factor receptor 1 binding |
| GO:1990932 | 0.0078 | 260.0968 | 0.0078 | 1 | 2 | 5.8S rRNA binding |
| GOMFID | Pvalue | OddsRatio | ExpCount | Count | Size | Term |
| GO:0001055 | 2e-04 | 35.7388 | 0.1162 | 3 | 11 | RNA polymerase II activity |
| GO:0004792 | 3e-04 | 189.5621 | 0.0317 | 2 | 3 | thiosulfate sulfurtransferase activity |
| GO:0016803 | 0.0038 | 27.0702 | 0.0951 | 2 | 9 | ether hydrolase activity |
| GO:0016176 | 0.0047 | 23.6849 | 0.1056 | 2 | 10 | superoxide-generating NADPH oxidase activator activity |
| GO:0004859 | 0.0057 | 21.0519 | 0.1162 | 2 | 11 | phospholipase inhibitor activity |
| GO:0015266 | 0.0057 | 21.0519 | 0.1162 | 2 | 11 | protein channel activity |
| GO:0005096 | 0.008 | 2.9517 | 2.8518 | 8 | 270 | GTPase activator activity |
| GO:0060589 | 0.0093 | 2.6743 | 3.5383 | 9 | 335 | nucleoside-triphosphatase regulator activity |
| GOMFID | Pvalue | OddsRatio | ExpCount | Count | Size | Term |
| GO:0004859 | 1e-04 | 45.9389 | 0.091 | 3 | 11 | phospholipase inhibitor activity |
| GO:0004930 | 3e-04 | 2.8963 | 6.4889 | 17 | 784 | G-protein coupled receptor activity |
| GO:0004984 | 3e-04 | 3.8992 | 3.0707 | 11 | 371 | olfactory receptor activity |
| GO:0038023 | 8e-04 | 2.3086 | 10.6025 | 22 | 1281 | signaling receptor activity |
| GO:0060089 | 0.0017 | 2.0987 | 12.713 | 24 | 1536 | molecular transducer activity |
| GO:0099600 | 0.0025 | 2.168 | 10.1141 | 20 | 1222 | transmembrane receptor activity |
| GO:0001055 | 0.0036 | 27.0152 | 0.091 | 2 | 11 | RNA polymerase II activity |
| GO:0015266 | 0.0036 | 27.0152 | 0.091 | 2 | 11 | protein channel activity |
| GO:0048020 | 0.0041 | 10.1908 | 0.3228 | 3 | 39 | CCR chemokine receptor binding |
| GO:0016493 | 0.0043 | 24.3121 | 0.0993 | 2 | 12 | C-C chemokine receptor activity |
| GO:0005549 | 0.005 | 6.2228 | 0.687 | 4 | 83 | odorant binding |
| GO:0005544 | 0.0057 | 8.9453 | 0.3642 | 3 | 44 | calcium-dependent phospholipid binding |
| GO:0000257 | 0.0083 | Inf | 0.0083 | 1 | 1 | nitrilase activity |
| GO:0004463 | 0.0083 | Inf | 0.0083 | 1 | 1 | leukotriene-A4 hydrolase activity |
| GO:0004503 | 0.0083 | Inf | 0.0083 | 1 | 1 | monophenol monooxygenase activity |
| GO:0004575 | 0.0083 | Inf | 0.0083 | 1 | 1 | sucrose alpha-glucosidase activity |
| GO:0005129 | 0.0083 | Inf | 0.0083 | 1 | 1 | granulocyte macrophage colony-stimulating factor receptor binding |
| GO:0033676 | 0.0083 | Inf | 0.0083 | 1 | 1 | double-stranded DNA-dependent ATPase activity |
| GOMFID | Pvalue | OddsRatio | ExpCount | Count | Size | Term |
| GO:0004984 | 0 | 13.666 | 0.9624 | 10 | 371 | olfactory receptor activity |
| GO:0004930 | 0 | 7.9668 | 2.0338 | 12 | 784 | G-protein coupled receptor activity |
| GO:0099600 | 0 | 5.5391 | 3.1701 | 13 | 1222 | transmembrane receptor activity |
| GO:0038023 | 0 | 5.2605 | 3.3232 | 13 | 1281 | signaling receptor activity |
| GO:0005549 | 1e-04 | 21.4111 | 0.2153 | 4 | 83 | odorant binding |
| GO:0060089 | 1e-04 | 4.3047 | 3.9847 | 13 | 1536 | molecular transducer activity |
| GO:0005132 | 9e-04 | 53.7767 | 0.0441 | 2 | 17 | type I interferon receptor binding |
| GO:0005125 | 0.0023 | 7.9126 | 0.5603 | 4 | 216 | cytokine activity |
| GO:0005133 | 0.0026 | Inf | 0.0026 | 1 | 1 | interferon-gamma receptor binding |
| GO:0033981 | 0.0026 | Inf | 0.0026 | 1 | 1 | D-dopachrome decarboxylase activity |
| GO:0038164 | 0.0026 | Inf | 0.0026 | 1 | 1 | thrombopoietin receptor activity |
| GO:0050178 | 0.0052 | 393.8293 | 0.0052 | 1 | 2 | phenylpyruvate tautomerase activity |
| GO:0004167 | 0.0078 | 196.9024 | 0.0078 | 1 | 3 | dopachrome isomerase activity |
| GO:0004711 | 0.0078 | 196.9024 | 0.0078 | 1 | 3 | ribosomal protein S6 kinase activity |
| GO:0017077 | 0.0078 | 196.9024 | 0.0078 | 1 | 3 | oxidative phosphorylation uncoupler activity |
| GOMFID | Pvalue | OddsRatio | ExpCount | Count | Size | Term |
| GO:0016493 | 4e-04 | 78.7171 | 0.0319 | 2 | 12 | C-C chemokine receptor activity |
| GO:0004930 | 9e-04 | 4.5275 | 2.0823 | 8 | 784 | G-protein coupled receptor activity |
| GO:0001637 | 0.002 | 34.1972 | 0.0664 | 2 | 25 | G-protein coupled chemoattractant receptor activity |
| GO:0004462 | 0.0027 | Inf | 0.0027 | 1 | 1 | lactoylglutathione lyase activity |
| GO:0004603 | 0.0027 | Inf | 0.0027 | 1 | 1 | phenylethanolamine N-methyltransferase activity |
| GO:0004946 | 0.0027 | Inf | 0.0027 | 1 | 1 | bombesin receptor activity |
| GO:0099600 | 0.0042 | 3.259 | 3.2456 | 9 | 1222 | transmembrane receptor activity |
| GO:0001653 | 0.0042 | 10.0169 | 0.3267 | 3 | 123 | peptide receptor activity |
| GO:0005126 | 0.0051 | 6.2917 | 0.6985 | 4 | 263 | cytokine receptor binding |
| GO:0003990 | 0.0053 | 384.4286 | 0.0053 | 1 | 2 | acetylcholinesterase activity |
| GO:0060089 | 0.006 | 2.9034 | 4.0796 | 10 | 1536 | molecular transducer activity |
| GO:0051033 | 0.0079 | 192.2024 | 0.008 | 1 | 3 | RNA transmembrane transporter activity |
| GOMFID | Pvalue | OddsRatio | ExpCount | Count | Size | Term |
| GO:0001055 | 0 | 57.4071 | 0.0734 | 3 | 11 | RNA polymerase II activity |
| GO:0030957 | 0.0019 | 37.9104 | 0.0667 | 2 | 10 | Tat protein binding |
| GO:0034062 | 0.0029 | 11.4586 | 0.2868 | 3 | 43 | 5'-3' RNA polymerase activity |
| GO:0004603 | 0.0067 | Inf | 0.0067 | 1 | 1 | phenylethanolamine N-methyltransferase activity |
| GO:0016784 | 0.0067 | Inf | 0.0067 | 1 | 1 | 3-mercaptopyruvate sulfurtransferase activity |
| GO:0031857 | 0.0067 | Inf | 0.0067 | 1 | 1 | type 1 parathyroid hormone receptor binding |
| GO:0032003 | 0.0067 | Inf | 0.0067 | 1 | 1 | interleukin-28 receptor binding |
| GO:0060589 | 0.0072 | 3.3288 | 2.2347 | 7 | 335 | nucleoside-triphosphatase regulator activity |
| GO:0008198 | 0.0085 | 15.9513 | 0.1401 | 2 | 21 | ferrous iron binding |
| GOMFID | Pvalue | OddsRatio | ExpCount | Count | Size | Term |
| GO:0004984 | 0 | 14.467 | 0.6416 | 7 | 371 | olfactory receptor activity |
| GO:0004930 | 3e-04 | 6.6002 | 1.3559 | 7 | 784 | G-protein coupled receptor activity |
| GO:0005549 | 4e-04 | 24.123 | 0.1435 | 3 | 83 | odorant binding |
| GO:0004516 | 0.0017 | Inf | 0.0017 | 1 | 1 | nicotinate phosphoribosyltransferase activity |
| GO:0046811 | 0.0035 | 598.5556 | 0.0035 | 1 | 2 | histone deacetylase inhibitor activity |
| GO:0099600 | 0.004 | 4.1007 | 2.1134 | 7 | 1222 | transmembrane receptor activity |
| GO:0038023 | 0.0052 | 3.8953 | 2.2154 | 7 | 1281 | signaling receptor activity |
| GO:0004514 | 0.0052 | 299.2593 | 0.0052 | 1 | 3 | nicotinate-nucleotide diphosphorylase (carboxylating) activity |
| GO:0004082 | 0.0069 | 199.4938 | 0.0069 | 1 | 4 | bisphosphoglycerate mutase activity |
| GO:0046538 | 0.0069 | 199.4938 | 0.0069 | 1 | 4 | 2,3-bisphosphoglycerate-dependent phosphoglycerate mutase activity |
| GO:0051430 | 0.0069 | 199.4938 | 0.0069 | 1 | 4 | corticotropin-releasing hormone receptor 1 binding |
| GO:0051431 | 0.0069 | 199.4938 | 0.0069 | 1 | 4 | corticotropin-releasing hormone receptor 2 binding |
| GO:0043515 | 0.0086 | 149.6111 | 0.0086 | 1 | 5 | kinetochore binding |
| GOMFID | Pvalue | OddsRatio | ExpCount | Count | Size | Term |
| GO:1903231 | 0 | 26.0967 | 0.1851 | 4 | 111 | mRNA binding involved in posttranscriptional gene silencing |
| GO:0004984 | 0.0031 | 7.4854 | 0.6187 | 4 | 371 | olfactory receptor activity |
| GO:0097016 | 0.0067 | 207.1795 | 0.0067 | 1 | 4 | L27 domain binding |
| GO:0061665 | 0.0083 | 155.375 | 0.0083 | 1 | 5 | SUMO ligase activity |
| GO:0030165 | 0.0086 | 15.6888 | 0.1401 | 2 | 84 | PDZ domain binding |
| GOMFID | Pvalue | OddsRatio | ExpCount | Count | Size | Term |
| GO:0047485 | 4e-04 | 12.9592 | 0.3435 | 4 | 103 | protein N-terminus binding |
| GO:0004930 | 0.001 | 3.9641 | 2.6149 | 9 | 784 | G-protein coupled receptor activity |
| GO:0004984 | 0.0014 | 5.401 | 1.2374 | 6 | 371 | olfactory receptor activity |
| GO:0005132 | 0.0014 | 41.3359 | 0.0567 | 2 | 17 | type I interferon receptor binding |
| GO:0022829 | 0.0022 | 32.6255 | 0.07 | 2 | 21 | wide pore channel activity |
| GO:0005549 | 0.0027 | 11.8059 | 0.2768 | 3 | 83 | odorant binding |
| GO:0031851 | 0.0033 | Inf | 0.0033 | 1 | 1 | kappa-type opioid receptor binding |
| GO:0032003 | 0.0033 | Inf | 0.0033 | 1 | 1 | interleukin-28 receptor binding |
| GO:0005125 | 0.0058 | 6.0091 | 0.7204 | 4 | 216 | cytokine activity |
| GO:1903231 | 0.006 | 8.7298 | 0.3702 | 3 | 111 | mRNA binding involved in posttranscriptional gene silencing |
| GO:0099600 | 0.0065 | 2.7985 | 4.0758 | 10 | 1222 | transmembrane receptor activity |
| GO:0071568 | 0.0067 | 304.434 | 0.0067 | 1 | 2 | UFM1 transferase activity |
| GO:0003723 | 0.0072 | 2.5272 | 5.5067 | 12 | 1651 | RNA binding |
| GO:0038023 | 0.009 | 2.6581 | 4.2726 | 10 | 1281 | signaling receptor activity |
| GO:0086075 | 0.01 | 152.2075 | 0.01 | 1 | 3 | gap junction channel activity involved in cardiac conduction electrical coupling |
| GOMFID | Pvalue | OddsRatio | ExpCount | Count | Size | Term |
| GO:0004984 | 0 | 11.2479 | 0.7791 | 7 | 371 | olfactory receptor activity |
| GO:0004930 | 2e-04 | 6.0983 | 1.6464 | 8 | 784 | G-protein coupled receptor activity |
| GO:0005549 | 7e-04 | 19.4468 | 0.1743 | 3 | 83 | odorant binding |
| GO:0008536 | 0.0023 | 31.4922 | 0.0714 | 2 | 34 | Ran GTPase binding |
| GO:0099600 | 0.0032 | 3.7871 | 2.5663 | 8 | 1222 | transmembrane receptor activity |
| GO:0060089 | 0.0036 | 3.4489 | 3.2257 | 9 | 1536 | molecular transducer activity |
| GO:0038023 | 0.0043 | 3.5973 | 2.6902 | 8 | 1281 | signaling receptor activity |
| GO:0019843 | 0.0061 | 18.6366 | 0.1176 | 2 | 56 | rRNA binding |
| GO:0008379 | 0.0084 | 163.1616 | 0.0084 | 1 | 4 | thioredoxin peroxidase activity |
| GO:0070891 | 0.0084 | 163.1616 | 0.0084 | 1 | 4 | lipoteichoic acid binding |
| GOMFID | Pvalue | OddsRatio | ExpCount | Count | Size | Term |
| GO:1903231 | 0 | 23.5018 | 0.3085 | 6 | 111 | mRNA binding involved in posttranscriptional gene silencing |
| GO:0004930 | 0 | 5.674 | 2.1791 | 10 | 784 | G-protein coupled receptor activity |
| GO:0099600 | 1e-04 | 4.4884 | 3.3965 | 12 | 1222 | transmembrane receptor activity |
| GO:0060089 | 8e-04 | 3.4887 | 4.2693 | 12 | 1536 | molecular transducer activity |
| GO:0038023 | 0.0026 | 3.531 | 3.0271 | 9 | 1158 | signaling receptor activity |
| GO:0071855 | 0.0027 | 28.8354 | 0.0778 | 2 | 28 | neuropeptide receptor binding |
| GO:0015054 | 0.0028 | Inf | 0.0028 | 1 | 1 | gastrin receptor activity |
| GO:0031707 | 0.0028 | Inf | 0.0028 | 1 | 1 | endothelin A receptor binding |
| GO:0031741 | 0.0028 | Inf | 0.0028 | 1 | 1 | type B gastrin/cholecystokinin receptor binding |
| GO:0033798 | 0.0028 | Inf | 0.0028 | 1 | 1 | thyroxine 5-deiodinase activity |
| GO:0004984 | 0.0035 | 5.389 | 1.0312 | 5 | 371 | olfactory receptor activity |
| GO:0001653 | 0.0048 | 9.5387 | 0.3419 | 3 | 123 | peptide receptor activity |
| GO:0001632 | 0.0056 | 366.9091 | 0.0056 | 1 | 2 | leukotriene B4 receptor activity |
| GO:0004951 | 0.0056 | 366.9091 | 0.0056 | 1 | 2 | cholecystokinin receptor activity |
| GO:0004800 | 0.0083 | 183.4432 | 0.0083 | 1 | 3 | thyroxine 5'-deiodinase activity |
| GO:0004980 | 0.0083 | 183.4432 | 0.0083 | 1 | 3 | melanocyte-stimulating hormone receptor activity |
| GO:0031708 | 0.0083 | 183.4432 | 0.0083 | 1 | 3 | endothelin B receptor binding |
| GO:0035662 | 0.0083 | 183.4432 | 0.0083 | 1 | 3 | Toll-like receptor 4 binding |
| GOMFID | Pvalue | OddsRatio | ExpCount | Count | Size | Term |
| GO:0055106 | 2e-04 | 29.6619 | 0.125 | 3 | 17 | ubiquitin-protein transferase regulator activity |
| GO:1990948 | 5e-04 | 91.5556 | 0.0368 | 2 | 5 | ubiquitin ligase inhibitor activity |
| GO:0051117 | 0.0025 | 7.6226 | 0.566 | 4 | 77 | ATPase binding |
| GO:0046933 | 0.0053 | 21.1151 | 0.1103 | 2 | 15 | proton-transporting ATP synthase activity, rotational mechanism |
| GO:0004853 | 0.0074 | Inf | 0.0074 | 1 | 1 | uroporphyrinogen decarboxylase activity |
| GO:0031859 | 0.0074 | Inf | 0.0074 | 1 | 1 | platelet activating factor receptor binding |
| GO:0034353 | 0.0074 | Inf | 0.0074 | 1 | 1 | RNA pyrophosphohydrolase activity |
| GO:0042624 | 0.0074 | Inf | 0.0074 | 1 | 1 | ATPase activity, uncoupled |
| GO:0070180 | 0.0074 | Inf | 0.0074 | 1 | 1 | large ribosomal subunit rRNA binding |
| GO:0070733 | 0.0074 | Inf | 0.0074 | 1 | 1 | protein adenylyltransferase activity |
| GO:1990175 | 0.0074 | Inf | 0.0074 | 1 | 1 | EH domain binding |
| GO:0051082 | 0.0075 | 5.4998 | 0.7718 | 4 | 105 | unfolded protein binding |
| GOMFID | Pvalue | OddsRatio | ExpCount | Count | Size | Term |
| GO:0051082 | 9e-04 | 7.3284 | 0.7393 | 5 | 105 | unfolded protein binding |
| GO:0051117 | 0.0021 | 7.9716 | 0.5422 | 4 | 77 | ATPase binding |
| GO:0003924 | 0.0027 | 4.0109 | 1.866 | 7 | 265 | GTPase activity |
| GO:0051087 | 0.0032 | 7.0927 | 0.6056 | 4 | 86 | chaperone binding |
| GO:0055106 | 0.0062 | 19.1202 | 0.1197 | 2 | 17 | ubiquitin-protein transferase regulator activity |
| GO:0004853 | 0.007 | Inf | 0.007 | 1 | 1 | uroporphyrinogen decarboxylase activity |
| GO:0031859 | 0.007 | Inf | 0.007 | 1 | 1 | platelet activating factor receptor binding |
| GO:0034353 | 0.007 | Inf | 0.007 | 1 | 1 | RNA pyrophosphohydrolase activity |
| GO:0042624 | 0.007 | Inf | 0.007 | 1 | 1 | ATPase activity, uncoupled |
| GO:0070733 | 0.007 | Inf | 0.007 | 1 | 1 | protein adenylyltransferase activity |
| GO:1990175 | 0.007 | Inf | 0.007 | 1 | 1 | EH domain binding |
| GOMFID | Pvalue | OddsRatio | ExpCount | Count | Size | Term |
| GO:0001055 | 0 | 66.2967 | 0.0639 | 3 | 11 | RNA polymerase II activity |
| GO:0046982 | 4e-04 | 4.0557 | 2.723 | 10 | 469 | protein heterodimerization activity |
| GO:0003677 | 7e-04 | 2.2681 | 13.6326 | 26 | 2348 | DNA binding |
| GO:0016801 | 0.0015 | 43.7174 | 0.0581 | 2 | 10 | hydrolase activity, acting on ether bonds |
| GO:0034062 | 0.002 | 13.233 | 0.2497 | 3 | 43 | 5'-3' RNA polymerase activity |
| GO:0070006 | 0.0053 | 20.5614 | 0.1103 | 2 | 19 | metalloaminopeptidase activity |
| GO:0004463 | 0.0058 | Inf | 0.0058 | 1 | 1 | leukotriene-A4 hydrolase activity |
| GO:0018455 | 0.0058 | Inf | 0.0058 | 1 | 1 | alcohol dehydrogenase [NAD(P)+] activity |
| GO:0031249 | 0.0058 | Inf | 0.0058 | 1 | 1 | denatured protein binding |
| GO:0033981 | 0.0058 | Inf | 0.0058 | 1 | 1 | D-dopachrome decarboxylase activity |
| GO:0097260 | 0.0058 | Inf | 0.0058 | 1 | 1 | eoxin A4 synthase activity |
| GOMFID | Pvalue | OddsRatio | ExpCount | Count | Size | Term |
| GO:0001055 | 0 | 73.6143 | 0.0578 | 3 | 11 | RNA polymerase II activity |
| GO:0034062 | 0.0015 | 14.6936 | 0.2258 | 3 | 43 | 5'-3' RNA polymerase activity |
| GO:0005544 | 0.0016 | 14.3343 | 0.231 | 3 | 44 | calcium-dependent phospholipid binding |
| GO:0004463 | 0.0053 | Inf | 0.0053 | 1 | 1 | leukotriene-A4 hydrolase activity |
| GO:0031249 | 0.0053 | Inf | 0.0053 | 1 | 1 | denatured protein binding |
| GO:0033981 | 0.0053 | Inf | 0.0053 | 1 | 1 | D-dopachrome decarboxylase activity |
| GOMFID | Pvalue | OddsRatio | ExpCount | Count | Size | Term |
| GO:1903231 | 0 | 34.8437 | 0.2605 | 7 | 111 | mRNA binding involved in posttranscriptional gene silencing |
| GO:0003723 | 0.0039 | 3.1581 | 3.8751 | 10 | 1651 | RNA binding |
| GO:0001632 | 0.0047 | 436.5135 | 0.0047 | 1 | 2 | leukotriene B4 receptor activity |
| GO:0005153 | 0.0047 | 436.5135 | 0.0047 | 1 | 2 | interleukin-8 receptor binding |
| GO:0004095 | 0.0094 | 145.4865 | 0.0094 | 1 | 4 | carnitine O-palmitoyltransferase activity |
| GOMFID | Pvalue | OddsRatio | ExpCount | Count | Size | Term |
| GO:1903231 | 2e-04 | 15.7806 | 0.288 | 4 | 111 | mRNA binding involved in posttranscriptional gene silencing |
| GO:0008009 | 3e-04 | 27.5265 | 0.1245 | 3 | 48 | chemokine activity |
| GO:0005132 | 9e-04 | 53.7767 | 0.0441 | 2 | 17 | type I interferon receptor binding |
| GO:0038164 | 0.0026 | Inf | 0.0026 | 1 | 1 | thrombopoietin receptor activity |
| GO:0048020 | 0.0046 | 21.7716 | 0.1012 | 2 | 39 | CCR chemokine receptor binding |
| GO:0048018 | 0.0056 | 4.8243 | 1.1544 | 5 | 445 | receptor ligand activity |
| GO:0017077 | 0.0078 | 196.9024 | 0.0078 | 1 | 3 | oxidative phosphorylation uncoupler activity |
| GO:0033293 | 0.0099 | 14.3679 | 0.1505 | 2 | 58 | monocarboxylic acid binding |
| GOMFID | Pvalue | OddsRatio | ExpCount | Count | Size | Term |
| GO:0004984 | 0 | 24.3167 | 0.6416 | 10 | 371 | olfactory receptor activity |
| GO:0005549 | 0 | 44.8272 | 0.1435 | 5 | 83 | odorant binding |
| GO:0004930 | 0 | 11.0451 | 1.3559 | 10 | 784 | G-protein coupled receptor activity |
| GO:0038023 | 0 | 7.5874 | 2.2154 | 11 | 1281 | signaling receptor activity |
| GO:0099600 | 0 | 6.8528 | 2.1134 | 10 | 1222 | transmembrane receptor activity |
| GO:0060089 | 0 | 6.2105 | 2.6565 | 11 | 1536 | molecular transducer activity |
| GO:1903231 | 0 | 25.0078 | 0.192 | 4 | 111 | mRNA binding involved in posttranscriptional gene silencing |
| GO:0004583 | 0.0069 | 199.4938 | 0.0069 | 1 | 4 | dolichyl-phosphate-glucose-glycolipid alpha-glucosyltransferase activity |
| GOMFID | Pvalue | OddsRatio | ExpCount | Count | Size | Term |
| GO:0008009 | 0 | 34.2787 | 0.2579 | 7 | 48 | chemokine activity |
| GO:1903231 | 0 | 11.2861 | 0.5965 | 6 | 111 | mRNA binding involved in posttranscriptional gene silencing |
| GO:0005126 | 1e-04 | 6.2936 | 1.4133 | 8 | 263 | cytokine receptor binding |
| GO:0031726 | 3e-04 | 126.2745 | 0.0269 | 2 | 5 | CCR1 chemokine receptor binding |
| GO:0031730 | 4e-04 | 94.7 | 0.0322 | 2 | 6 | CCR5 chemokine receptor binding |
| GO:0001664 | 5e-04 | 5.5261 | 1.3864 | 7 | 258 | G-protein coupled receptor binding |
| GO:0048020 | 6e-04 | 20.9961 | 0.1628 | 3 | 31 | CCR chemokine receptor binding |
| GO:0048018 | 0.0027 | 3.6303 | 2.3913 | 8 | 445 | receptor ligand activity |
| GO:0050683 | 0.0054 | Inf | 0.0054 | 1 | 1 | AF-1 domain binding |
| GOMFID | Pvalue | OddsRatio | ExpCount | Count | Size | Term |
| GO:1903231 | 5e-04 | 11.9843 | 0.3702 | 4 | 111 | mRNA binding involved in posttranscriptional gene silencing |
| GO:0033798 | 0.0033 | Inf | 0.0033 | 1 | 1 | thyroxine 5-deiodinase activity |
| GO:0050683 | 0.0033 | Inf | 0.0033 | 1 | 1 | AF-1 domain binding |
| GO:0004930 | 0.0042 | 3.4424 | 2.6149 | 8 | 784 | G-protein coupled receptor activity |
| GO:0019767 | 0.0067 | 304.434 | 0.0067 | 1 | 2 | IgE receptor activity |
| GO:0046811 | 0.0067 | 304.434 | 0.0067 | 1 | 2 | histone deacetylase inhibitor activity |
| GO:0050119 | 0.0067 | 304.434 | 0.0067 | 1 | 2 | N-acetylglucosamine deacetylase activity |
| GO:0004984 | 0.0078 | 4.3967 | 1.2374 | 5 | 371 | olfactory receptor activity |
| GO:0004872 | 0.0092 | 2.5314 | 4.9764 | 11 | 1492 | receptor activity |
| GO:0004800 | 0.01 | 152.2075 | 0.01 | 1 | 3 | thyroxine 5'-deiodinase activity |
| GO:0035939 | 0.01 | 152.2075 | 0.01 | 1 | 3 | microsatellite binding |
| GOMFID | Pvalue | OddsRatio | ExpCount | Count | Size | Term |
| GO:0048020 | 1e-04 | 18.1612 | 0.2529 | 4 | 39 | CCR chemokine receptor binding |
| GO:0008009 | 3e-04 | 14.4383 | 0.3113 | 4 | 48 | chemokine activity |
| GO:0001055 | 0.0022 | 34.6839 | 0.0713 | 2 | 11 | RNA polymerase II activity |
| GO:0001605 | 0.0065 | Inf | 0.0065 | 1 | 1 | adrenomedullin receptor activity |
| GO:0016430 | 0.0065 | Inf | 0.0065 | 1 | 1 | tRNA (adenine-N6-)-methyltransferase activity |
| GO:0016784 | 0.0065 | Inf | 0.0065 | 1 | 1 | 3-mercaptopyruvate sulfurtransferase activity |
| GO:0016913 | 0.0065 | Inf | 0.0065 | 1 | 1 | follicle-stimulating hormone activity |
| GO:0032003 | 0.0065 | Inf | 0.0065 | 1 | 1 | interleukin-28 receptor binding |
| GO:1990259 | 0.0065 | Inf | 0.0065 | 1 | 1 | histone-glutamine methyltransferase activity |
| GOMFID | Pvalue | OddsRatio | ExpCount | Count | Size | Term |
| GO:0004984 | 4e-04 | 7.2068 | 0.9624 | 6 | 371 | olfactory receptor activity |
| GO:0005132 | 9e-04 | 53.7767 | 0.0441 | 2 | 17 | type I interferon receptor binding |
| GO:0031851 | 0.0026 | Inf | 0.0026 | 1 | 1 | kappa-type opioid receptor binding |
| GO:1903231 | 0.003 | 11.4245 | 0.288 | 3 | 111 | mRNA binding involved in posttranscriptional gene silencing |
| GO:0004663 | 0.0078 | 196.9024 | 0.0078 | 1 | 3 | Rab geranylgeranyltransferase activity |
| GO:0030395 | 0.0078 | 196.9024 | 0.0078 | 1 | 3 | lactose binding |
| GO:0019843 | 0.0093 | 14.9019 | 0.1453 | 2 | 56 | rRNA binding |
| GOMFID | Pvalue | OddsRatio | ExpCount | Count | Size | Term |
| GO:1903231 | 0 | 23.6542 | 0.2537 | 5 | 111 | mRNA binding involved in posttranscriptional gene silencing |
| GO:0004984 | 0 | 10.1212 | 0.8479 | 7 | 371 | olfactory receptor activity |
| GO:0004468 | 1e-04 | 230.7 | 0.0137 | 2 | 6 | lysine N-acetyltransferase activity, acting on acetyl phosphate as donor |
| GO:0005549 | 9e-04 | 17.7276 | 0.1897 | 3 | 83 | odorant binding |
| GO:0004930 | 0.0018 | 4.6174 | 1.7917 | 7 | 784 | G-protein coupled receptor activity |
| GO:0047198 | 0.0023 | Inf | 0.0023 | 1 | 1 | cysteine-S-conjugate N-acetyltransferase activity |
| GO:1905394 | 0.0091 | 149.537 | 0.0091 | 1 | 4 | retromer complex binding |
| GOMFID | Pvalue | OddsRatio | ExpCount | Count | Size | Term |
| GO:0004984 | 0.0016 | 5.2905 | 1.2603 | 6 | 371 | olfactory receptor activity |
| GO:0000210 | 0.0034 | Inf | 0.0034 | 1 | 1 | NAD+ diphosphatase activity |
| GO:0005142 | 0.0034 | Inf | 0.0034 | 1 | 1 | interleukin-11 receptor binding |
| GO:0032556 | 0.0034 | Inf | 0.0034 | 1 | 1 | pyrimidine deoxyribonucleotide binding |
| GO:0047840 | 0.0034 | Inf | 0.0034 | 1 | 1 | dCTP diphosphatase activity |
| GO:0070180 | 0.0034 | Inf | 0.0034 | 1 | 1 | large ribosomal subunit rRNA binding |
| GO:0042056 | 0.0043 | 22.5129 | 0.0985 | 2 | 29 | chemoattractant activity |
| GO:0042287 | 0.0043 | 22.5129 | 0.0985 | 2 | 29 | MHC protein binding |
| GO:0004930 | 0.0047 | 3.3689 | 2.6634 | 8 | 784 | G-protein coupled receptor activity |
| GO:0047179 | 0.0068 | 298.7778 | 0.0068 | 1 | 2 | platelet-activating factor acetyltransferase activity |
| GO:0050262 | 0.0068 | 298.7778 | 0.0068 | 1 | 2 | ribosylnicotinamide kinase activity |
| GO:0061769 | 0.0068 | 298.7778 | 0.0068 | 1 | 2 | ribosylnicotinate kinase activity |
| GOMFID | Pvalue | OddsRatio | ExpCount | Count | Size | Term |
| GO:0030275 | 0.0046 | 22.5656 | 0.1019 | 2 | 17 | LRR domain binding |
| GO:1901338 | 0.0057 | 19.9084 | 0.1138 | 2 | 19 | catecholamine binding |
| GO:0004853 | 0.006 | Inf | 0.006 | 1 | 1 | uroporphyrinogen decarboxylase activity |
| GO:0034353 | 0.006 | Inf | 0.006 | 1 | 1 | RNA pyrophosphohydrolase activity |
| GO:0038164 | 0.006 | Inf | 0.006 | 1 | 1 | thrombopoietin receptor activity |
| GO:0042624 | 0.006 | Inf | 0.006 | 1 | 1 | ATPase activity, uncoupled |
| GO:0050683 | 0.006 | Inf | 0.006 | 1 | 1 | AF-1 domain binding |
| GO:0043130 | 0.0064 | 8.5282 | 0.3775 | 3 | 63 | ubiquitin binding |
| GO:0001106 | 0.0097 | 14.7094 | 0.1498 | 2 | 25 | RNA polymerase II transcription corepressor activity |
| NA. |
| n/a |
| NA. |
| n/a |
| NA. |
| n/a |
| NA. |
| n/a |
| NA. |
| n/a |
| NA. |
| n/a |
| NA. |
| n/a |
| NA. |
| n/a |
| NA. |
| n/a |
| NA. |
| n/a |
| NA. |
| n/a |
| NA. |
| n/a |
| NA. |
| n/a |
| NA. |
| n/a |
| NA. |
| n/a |
| NA. |
| n/a |
| NA. |
| n/a |
| NA. |
| n/a |
| NA. |
| n/a |
| NA. |
| n/a |
| NA. |
| n/a |
| NA. |
| n/a |
| NA. |
| n/a |
| NA. |
| n/a |
| NA. |
| n/a |
| NA. |
| n/a |
| NA. |
| n/a |
| NA. |
| n/a |
| NA. |
| n/a |
| NA. |
| n/a |
| NA. |
| n/a |
| NA. |
| n/a |
| NA. |
| n/a |
| NA. |
| n/a |
| NA. |
| n/a |
| NA. |
| n/a |
| NA. |
| n/a |
| NA. |
| n/a |
| NA. |
| n/a |
| NA. |
| n/a |
| NA. |
| n/a |
| NA. |
| n/a |
| NA. |
| n/a |
| NA. |
| n/a |
| NA. |
| n/a |
| NA. |
| n/a |
| NA. |
| n/a |
| NA. |
| n/a |
| NA. |
| n/a |
| NA. |
| n/a |
| NA. |
| n/a |
| NA. |
| n/a |
| NA. |
| n/a |
| NA. |
| n/a |
| NA. |
| n/a |
| NA. |
| n/a |
| GOMFID | Pvalue | OddsRatio | ExpCount | Count | Size | Term |
| GO:0016560 | 4e-04 | 167.9162 | 0.0357 | 2 | 3 | protein import into peroxisome matrix, docking |
| GO:0006367 | 0.0012 | 4.0847 | 2.0929 | 8 | 176 | transcription initiation from RNA polymerase II promoter |
| GO:0010032 | 0.0014 | 55.9651 | 0.0595 | 2 | 5 | meiotic chromosome condensation |
| GO:0030199 | 0.0018 | 8.464 | 0.5232 | 4 | 44 | collagen fibril organization |
| GO:0031333 | 0.0029 | 4.5622 | 1.4032 | 6 | 118 | negative regulation of protein complex assembly |
| GO:0006363 | 0.0053 | 9.3626 | 0.3567 | 3 | 30 | termination of RNA polymerase I transcription |
| GO:0031115 | 0.0059 | 20.9804 | 0.1189 | 2 | 10 | negative regulation of microtubule polymerization |
| GO:0032488 | 0.0059 | 20.9804 | 0.1189 | 2 | 10 | Cdc42 protein signal transduction |
| GO:0006361 | 0.0064 | 8.7158 | 0.3805 | 3 | 32 | transcription initiation from RNA polymerase I promoter |
| GO:0070897 | 0.0076 | 8.1525 | 0.4043 | 3 | 34 | DNA-templated transcriptional preinitiation complex assembly |
| GO:0072350 | 0.0089 | 7.6574 | 0.4281 | 3 | 36 | tricarboxylic acid metabolic process |
| GOMFID | Pvalue | OddsRatio | ExpCount | Count | Size | Term |
| GO:0016560 | 5e-04 | 151.0849 | 0.0396 | 2 | 3 | protein import into peroxisome matrix, docking |
| GO:0033138 | 0.002 | 4.9389 | 1.3054 | 6 | 99 | positive regulation of peptidyl-serine phosphorylation |
| GO:0035987 | 0.0031 | 7.2444 | 0.6065 | 4 | 46 | endodermal cell differentiation |
| GO:0008344 | 0.0033 | 5.3727 | 1.0021 | 5 | 76 | adult locomotory behavior |
| GO:0048646 | 0.0034 | 1.9423 | 13.2118 | 24 | 1002 | anatomical structure formation involved in morphogenesis |
| GO:0021798 | 0.0035 | 30.2094 | 0.0923 | 2 | 7 | forebrain dorsal/ventral pattern formation |
| GO:1904892 | 0.0036 | 3.7803 | 1.9646 | 7 | 149 | regulation of STAT cascade |
| GO:0065009 | 0.0037 | 1.5498 | 42.4176 | 59 | 3217 | regulation of molecular function |
| GO:0007492 | 0.0037 | 5.2248 | 1.0285 | 5 | 78 | endoderm development |
| GO:0046426 | 0.0039 | 6.7602 | 0.6461 | 4 | 49 | negative regulation of JAK-STAT cascade |
| GO:0051683 | 0.0046 | 25.173 | 0.1055 | 2 | 8 | establishment of Golgi localization |
| GO:0034446 | 0.0048 | 4.8884 | 1.0944 | 5 | 83 | substrate adhesion-dependent cell spreading |
| GO:0007062 | 0.0065 | 3.8212 | 1.6614 | 6 | 126 | sister chromatid cohesion |
| GO:0007229 | 0.0077 | 4.3301 | 1.2262 | 5 | 93 | integrin-mediated signaling pathway |
| GO:0038179 | 0.0085 | 7.838 | 0.4219 | 3 | 32 | neurotrophin signaling pathway |
| GO:0051246 | 0.0087 | 1.5117 | 36.1018 | 50 | 2738 | regulation of protein metabolic process |
| GO:1903244 | 0.0088 | 16.7788 | 0.145 | 2 | 11 | positive regulation of cardiac muscle hypertrophy in response to stress |
| GO:0001932 | 0.0089 | 1.7055 | 17.4971 | 28 | 1327 | regulation of protein phosphorylation |
| GO:0010594 | 0.009 | 3.5525 | 1.78 | 6 | 135 | regulation of endothelial cell migration |
| GO:0002312 | 0.009 | 5.2407 | 0.8175 | 4 | 62 | B cell activation involved in immune response |
| GO:0016064 | 0.0092 | 4.1408 | 1.279 | 5 | 97 | immunoglobulin mediated immune response |
| GO:0048854 | 0.0092 | 7.5763 | 0.4351 | 3 | 33 | brain morphogenesis |
| GOMFID | Pvalue | OddsRatio | ExpCount | Count | Size | Term |
| GO:0018149 | 0.0012 | 9.4333 | 0.4646 | 4 | 58 | peptide cross-linking |
| GO:0021766 | 0.0028 | 7.3757 | 0.5847 | 4 | 73 | hippocampus development |
| GO:0006284 | 0.004 | 10.2552 | 0.3204 | 3 | 40 | base-excision repair |
| GO:0007606 | 0.0044 | 2.8525 | 3.7406 | 10 | 467 | sensory perception of chemical stimulus |
| GO:0055078 | 0.0046 | 9.728 | 0.3364 | 3 | 42 | sodium ion homeostasis |
| GO:0045717 | 0.0071 | 17.9531 | 0.1282 | 2 | 16 | negative regulation of fatty acid biosynthetic process |
| GO:0048385 | 0.0071 | 17.9531 | 0.1282 | 2 | 16 | regulation of retinoic acid receptor signaling pathway |
| GO:0046041 | 0.0079 | Inf | 0.0079 | 1 | 1 | ITP metabolic process |
| GO:0000920 | 0.008 | 16.7552 | 0.1362 | 2 | 17 | cell separation after cytokinesis |
| GO:0006193 | 0.008 | Inf | 0.008 | 1 | 1 | ITP catabolic process |
| GO:0009203 | 0.008 | Inf | 0.008 | 1 | 1 | ribonucleoside triphosphate catabolic process |
| GO:0010900 | 0.008 | Inf | 0.008 | 1 | 1 | negative regulation of phosphatidylcholine catabolic process |
| GO:0016108 | 0.008 | Inf | 0.008 | 1 | 1 | tetraterpenoid metabolic process |
| GO:0016121 | 0.008 | Inf | 0.008 | 1 | 1 | carotene catabolic process |
| GO:0016122 | 0.008 | Inf | 0.008 | 1 | 1 | xanthophyll metabolic process |
| GO:0046588 | 0.008 | Inf | 0.008 | 1 | 1 | negative regulation of calcium-dependent cell-cell adhesion |
| GO:0070267 | 0.008 | Inf | 0.008 | 1 | 1 | oncosis |
| GO:1903280 | 0.008 | Inf | 0.008 | 1 | 1 | negative regulation of calcium:sodium antiporter activity |
| GO:1903461 | 0.008 | Inf | 0.008 | 1 | 1 | Okazaki fragment processing involved in mitotic DNA replication |
| GO:1904877 | 0.008 | Inf | 0.008 | 1 | 1 | positive regulation of DNA ligase activity |
| GO:0009144 | 0.009 | 3.1694 | 2.3309 | 7 | 291 | purine nucleoside triphosphate metabolic process |
| GOMFID | Pvalue | OddsRatio | ExpCount | Count | Size | Term |
| GO:0045187 | 3e-04 | 27.974 | 0.1281 | 3 | 21 | regulation of circadian sleep/wake cycle, sleep |
| GO:0022410 | 6e-04 | 20.9727 | 0.1647 | 3 | 27 | circadian sleep/wake cycle process |
| GO:0050795 | 7e-04 | 10.9127 | 0.4026 | 4 | 66 | regulation of behavior |
| GO:0030431 | 0.0014 | 15.2443 | 0.2196 | 3 | 36 | sleep |
| GO:0035195 | 0.0015 | 4.4697 | 1.6896 | 7 | 277 | gene silencing by miRNA |
| GO:0016441 | 0.0018 | 4.3548 | 1.7323 | 7 | 284 | posttranscriptional gene silencing |
| GO:0032754 | 0.002 | 36.9347 | 0.0671 | 2 | 11 | positive regulation of interleukin-5 production |
| GO:0050713 | 0.002 | 36.9347 | 0.0671 | 2 | 11 | negative regulation of interleukin-1 beta secretion |
| GO:0031047 | 0.0027 | 4.0151 | 1.8726 | 7 | 307 | gene silencing by RNA |
| GO:1905205 | 0.0027 | 30.2156 | 0.0793 | 2 | 13 | positive regulation of connective tissue replacement |
| GO:0007622 | 0.0029 | 11.4254 | 0.2867 | 3 | 47 | rhythmic behavior |
| GO:0042753 | 0.0053 | 20.7668 | 0.1098 | 2 | 18 | positive regulation of circadian rhythm |
| GO:0046939 | 0.0061 | 5.864 | 0.7259 | 4 | 119 | nucleotide phosphorylation |
| GO:0000718 | 0.0061 | Inf | 0.0061 | 1 | 1 | nucleotide-excision repair, DNA damage removal |
| GO:0006193 | 0.0061 | Inf | 0.0061 | 1 | 1 | ITP catabolic process |
| GO:0009203 | 0.0061 | Inf | 0.0061 | 1 | 1 | ribonucleoside triphosphate catabolic process |
| GO:0009405 | 0.0061 | Inf | 0.0061 | 1 | 1 | pathogenesis |
| GO:0010729 | 0.0061 | Inf | 0.0061 | 1 | 1 | positive regulation of hydrogen peroxide biosynthetic process |
| GO:0030421 | 0.0061 | Inf | 0.0061 | 1 | 1 | defecation |
| GO:0061580 | 0.0061 | Inf | 0.0061 | 1 | 1 | colon epithelial cell migration |
| GO:0086024 | 0.0061 | Inf | 0.0061 | 1 | 1 | adrenergic receptor signaling pathway involved in positive regulation of heart rate |
| GO:0098504 | 0.0061 | Inf | 0.0061 | 1 | 1 | DNA 3' dephosphorylation involved in DNA repair |
| GO:0098506 | 0.0061 | Inf | 0.0061 | 1 | 1 | polynucleotide 3' dephosphorylation |
| GO:0002374 | 0.0065 | 18.457 | 0.122 | 2 | 20 | cytokine secretion involved in immune response |
| GO:0072539 | 0.0065 | 18.457 | 0.122 | 2 | 20 | T-helper 17 cell differentiation |
| GO:0006110 | 0.0073 | 8.0993 | 0.3965 | 3 | 65 | regulation of glycolytic process |
| GO:0034249 | 0.0091 | 3.1795 | 2.3423 | 7 | 384 | negative regulation of cellular amide metabolic process |
| GOMFID | Pvalue | OddsRatio | ExpCount | Count | Size | Term |
| GO:0006112 | 3e-04 | 9.64 | 0.5709 | 5 | 85 | energy reserve metabolic process |
| GO:0033692 | 6e-04 | 11.3347 | 0.3895 | 4 | 58 | cellular polysaccharide biosynthetic process |
| GO:0051597 | 9e-04 | 60.2467 | 0.047 | 2 | 7 | response to methylmercury |
| GO:0016051 | 0.0016 | 5.1301 | 1.2559 | 6 | 187 | carbohydrate biosynthetic process |
| GO:0005978 | 0.0034 | 10.8349 | 0.3022 | 3 | 45 | glycogen biosynthetic process |
| GO:0005976 | 0.0041 | 6.5655 | 0.6514 | 4 | 97 | polysaccharide metabolic process |
| GO:0051321 | 0.0048 | 4.097 | 1.5581 | 6 | 232 | meiotic cell cycle |
| GO:0010042 | 0.005 | 21.5047 | 0.1075 | 2 | 16 | response to manganese ion |
| GO:0001835 | 0.0067 | Inf | 0.0067 | 1 | 1 | blastocyst hatching |
| GO:0019547 | 0.0067 | Inf | 0.0067 | 1 | 1 | arginine catabolic process to ornithine |
| GO:0061163 | 0.0067 | Inf | 0.0067 | 1 | 1 | endoplasmic reticulum polarization |
| GO:0061573 | 0.0067 | Inf | 0.0067 | 1 | 1 | actin filament bundle retrograde transport |
| GO:0061580 | 0.0067 | Inf | 0.0067 | 1 | 1 | colon epithelial cell migration |
| GO:0070965 | 0.0067 | Inf | 0.0067 | 1 | 1 | positive regulation of neutrophil mediated killing of fungus |
| GO:0071684 | 0.0067 | Inf | 0.0067 | 1 | 1 | organism emergence from protective structure |
| GO:1900150 | 0.0067 | Inf | 0.0067 | 1 | 1 | regulation of defense response to fungus |
| GO:1904109 | 0.0067 | Inf | 0.0067 | 1 | 1 | positive regulation of cholesterol import |
| GO:0048247 | 0.007 | 8.2672 | 0.3895 | 3 | 58 | lymphocyte chemotaxis |
| GO:0002548 | 0.0084 | 7.7048 | 0.4164 | 3 | 62 | monocyte chemotaxis |
| GO:2000114 | 0.0086 | 15.8406 | 0.141 | 2 | 21 | regulation of establishment of cell polarity |
| GOMFID | Pvalue | OddsRatio | ExpCount | Count | Size | Term |
| GO:0050900 | 2e-04 | 4.0524 | 2.9768 | 11 | 406 | leukocyte migration |
| GO:0060326 | 7e-04 | 4.5175 | 1.9137 | 8 | 261 | cell chemotaxis |
| GO:0070383 | 8e-04 | 68.8333 | 0.044 | 2 | 6 | DNA cytosine deamination |
| GO:2000503 | 8e-04 | 68.8333 | 0.044 | 2 | 6 | positive regulation of natural killer cell chemotaxis |
| GO:0042330 | 8e-04 | 3.179 | 4.1133 | 12 | 561 | taxis |
| GO:0045869 | 0.0011 | 55.0632 | 0.0513 | 2 | 7 | negative regulation of single stranded viral RNA replication via double stranded DNA intermediate |
| GO:0002548 | 0.0011 | 9.627 | 0.4546 | 4 | 62 | monocyte chemotaxis |
| GO:0032689 | 0.0014 | 15.4061 | 0.22 | 3 | 30 | negative regulation of interferon-gamma production |
| GO:0009972 | 0.0019 | 39.326 | 0.066 | 2 | 9 | cytidine deamination |
| GO:0046087 | 0.0019 | 39.326 | 0.066 | 2 | 9 | cytidine metabolic process |
| GO:0002430 | 0.0028 | 30.5831 | 0.0807 | 2 | 11 | complement receptor mediated signaling pathway |
| GO:0016553 | 0.0028 | 30.5831 | 0.0807 | 2 | 11 | base conversion or substitution editing |
| GO:0046133 | 0.0028 | 30.5831 | 0.0807 | 2 | 11 | pyrimidine ribonucleoside catabolic process |
| GO:0070098 | 0.0028 | 7.3387 | 0.5866 | 4 | 80 | chemokine-mediated signaling pathway |
| GO:0045026 | 0.0029 | 11.5481 | 0.286 | 3 | 39 | plasma membrane fusion |
| GO:0070374 | 0.0031 | 4.4972 | 1.4224 | 6 | 194 | positive regulation of ERK1 and ERK2 cascade |
| GO:0016045 | 0.0034 | 27.5231 | 0.088 | 2 | 12 | detection of bacterium |
| GO:0090197 | 0.0034 | 27.5231 | 0.088 | 2 | 12 | positive regulation of chemokine secretion |
| GO:0019835 | 0.0036 | 10.6578 | 0.3079 | 3 | 42 | cytolysis |
| GO:0048583 | 0.0038 | 1.7363 | 27.752 | 41 | 3785 | regulation of response to stimulus |
| GO:0050830 | 0.0038 | 6.7168 | 0.6379 | 4 | 87 | defense response to Gram-positive bacterium |
| GO:0030593 | 0.004 | 6.6364 | 0.6452 | 4 | 88 | neutrophil chemotaxis |
| GO:0010647 | 0.0055 | 1.9889 | 11.6434 | 21 | 1588 | positive regulation of cell communication |
| GO:0023056 | 0.0057 | 1.9805 | 11.6874 | 21 | 1594 | positive regulation of signaling |
| GO:0030214 | 0.006 | 19.6545 | 0.1173 | 2 | 16 | hyaluronan catabolic process |
| GO:0002757 | 0.0069 | 2.8345 | 3.3801 | 9 | 461 | immune response-activating signal transduction |
| GO:0048870 | 0.0073 | 1.9981 | 10.3969 | 19 | 1418 | cell motility |
| GO:0002881 | 0.0073 | Inf | 0.0073 | 1 | 1 | negative regulation of chronic inflammatory response to non-antigenic stimulus |
| GO:0019408 | 0.0073 | Inf | 0.0073 | 1 | 1 | dolichol biosynthetic process |
| GO:1902173 | 0.0073 | Inf | 0.0073 | 1 | 1 | negative regulation of keratinocyte apoptotic process |
| GO:2000474 | 0.0073 | Inf | 0.0073 | 1 | 1 | regulation of opioid receptor signaling pathway |
| GO:0050707 | 0.0076 | 4.3451 | 1.2171 | 5 | 166 | regulation of cytokine secretion |
| GO:0007096 | 0.0076 | 17.1955 | 0.132 | 2 | 18 | regulation of exit from mitosis |
| GO:0098581 | 0.0076 | 17.1955 | 0.132 | 2 | 18 | detection of external biotic stimulus |
| GO:0002688 | 0.0077 | 5.4592 | 0.7772 | 4 | 106 | regulation of leukocyte chemotaxis |
| GO:0010469 | 0.0082 | 2.5908 | 4.1133 | 10 | 561 | regulation of receptor activity |
| GO:0002684 | 0.0083 | 2.2067 | 6.8335 | 14 | 932 | positive regulation of immune system process |
| GO:0010529 | 0.0084 | 16.183 | 0.1393 | 2 | 19 | negative regulation of transposition |
| GO:0045087 | 0.0084 | 2.2724 | 6.1443 | 13 | 838 | innate immune response |
| GO:0048247 | 0.0088 | 7.5498 | 0.4253 | 3 | 58 | lymphocyte chemotaxis |
| GO:1901136 | 0.0089 | 4.1622 | 1.2685 | 5 | 173 | carbohydrate derivative catabolic process |
| GO:1902533 | 0.009 | 2.184 | 6.8995 | 14 | 941 | positive regulation of intracellular signal transduction |
| GO:0071800 | 0.0093 | 15.283 | 0.1466 | 2 | 20 | podosome assembly |
| GOMFID | Pvalue | OddsRatio | ExpCount | Count | Size | Term |
| GO:0002443 | 1e-04 | 2.7793 | 8.6861 | 22 | 712 | leukocyte mediated immunity |
| GO:0050766 | 2e-04 | 10.3575 | 0.549 | 5 | 45 | positive regulation of phagocytosis |
| GO:0032940 | 3e-04 | 2.1084 | 16.7745 | 32 | 1375 | secretion by cell |
| GO:0006955 | 4e-04 | 1.9249 | 22.5815 | 39 | 1851 | immune response |
| GO:0030198 | 7e-04 | 3.2295 | 3.9771 | 12 | 326 | extracellular matrix organization |
| GO:0002253 | 8e-04 | 2.6648 | 6.4414 | 16 | 528 | activation of immune response |
| GO:0002051 | 9e-04 | 81.7857 | 0.0488 | 2 | 4 | osteoblast fate commitment |
| GO:0002764 | 0.0011 | 2.6672 | 6.0144 | 15 | 493 | immune response-regulating signaling pathway |
| GO:0033628 | 0.0013 | 9.4239 | 0.4758 | 4 | 39 | regulation of cell adhesion mediated by integrin |
| GO:0035509 | 0.0014 | 54.5204 | 0.061 | 2 | 5 | negative regulation of myosin-light-chain-phosphatase activity |
| GO:0050705 | 0.0014 | 54.5204 | 0.061 | 2 | 5 | regulation of interleukin-1 alpha secretion |
| GO:0061302 | 0.0014 | 54.5204 | 0.061 | 2 | 5 | smooth muscle cell-matrix adhesion |
| GO:0006897 | 0.0015 | 2.4241 | 7.5028 | 17 | 615 | endocytosis |
| GO:0050900 | 0.0015 | 2.7963 | 4.953 | 13 | 406 | leukocyte migration |
| GO:0002429 | 0.0018 | 3.0231 | 3.8673 | 11 | 317 | immune response-activating cell surface receptor signaling pathway |
| GO:0007166 | 0.002 | 1.6916 | 30.3188 | 46 | 2535 | cell surface receptor signaling pathway |
| GO:0051964 | 0.0022 | 40.8878 | 0.0732 | 2 | 6 | negative regulation of synapse assembly |
| GO:0006952 | 0.0023 | 1.8527 | 18.1896 | 31 | 1491 | defense response |
| GO:0002684 | 0.0023 | 2.0772 | 11.3701 | 22 | 932 | positive regulation of immune system process |
| GO:0050995 | 0.0023 | 12.966 | 0.2684 | 3 | 22 | negative regulation of lipid catabolic process |
| GO:0002456 | 0.0026 | 5.6636 | 0.9516 | 5 | 78 | T cell mediated immunity |
| GO:0045055 | 0.0026 | 2.2235 | 8.6373 | 18 | 708 | regulated exocytosis |
| GO:0050861 | 0.003 | 32.7082 | 0.0854 | 2 | 7 | positive regulation of B cell receptor signaling pathway |
| GO:0050854 | 0.0039 | 6.7254 | 0.6466 | 4 | 53 | regulation of antigen receptor-mediated signaling pathway |
| GO:0032610 | 0.004 | 27.2551 | 0.0976 | 2 | 8 | interleukin-1 alpha production |
| GO:0050830 | 0.0042 | 5.0392 | 1.0614 | 5 | 87 | defense response to Gram-positive bacterium |
| GO:0032846 | 0.0043 | 3.2996 | 2.5619 | 8 | 210 | positive regulation of homeostatic process |
| GO:2000379 | 0.0047 | 4.9186 | 1.0858 | 5 | 89 | positive regulation of reactive oxygen species metabolic process |
| GO:0048010 | 0.0049 | 4.8604 | 1.098 | 5 | 90 | vascular endothelial growth factor receptor signaling pathway |
| GO:0002923 | 0.005 | 23.3601 | 0.1098 | 2 | 9 | regulation of humoral immune response mediated by circulating immunoglobulin |
| GO:0014049 | 0.005 | 23.3601 | 0.1098 | 2 | 9 | positive regulation of glutamate secretion |
| GO:0090322 | 0.0052 | 9.471 | 0.3538 | 3 | 29 | regulation of superoxide metabolic process |
| GO:0007229 | 0.0056 | 4.6938 | 1.1346 | 5 | 93 | integrin-mediated signaling pathway |
| GO:0030278 | 0.0059 | 3.44 | 2.1471 | 7 | 176 | regulation of ossification |
| GO:0045414 | 0.0062 | 20.4388 | 0.122 | 2 | 10 | regulation of interleukin-8 biosynthetic process |
| GO:0007204 | 0.0063 | 2.8552 | 3.3183 | 9 | 272 | positive regulation of cytosolic calcium ion concentration |
| GO:0046889 | 0.0065 | 5.7786 | 0.7442 | 4 | 61 | positive regulation of lipid biosynthetic process |
| GO:0002274 | 0.0066 | 2.1759 | 7.2832 | 15 | 597 | myeloid leukocyte activation |
| GO:0045907 | 0.0068 | 8.4897 | 0.3904 | 3 | 32 | positive regulation of vasoconstriction |
| GO:0003084 | 0.0076 | 18.1667 | 0.1342 | 2 | 11 | positive regulation of systemic arterial blood pressure |
| GO:0006105 | 0.0076 | 18.1667 | 0.1342 | 2 | 11 | succinate metabolic process |
| GO:0051248 | 0.0078 | 1.7646 | 15.7497 | 26 | 1291 | negative regulation of protein metabolic process |
| GO:1904181 | 0.009 | 16.349 | 0.1464 | 2 | 12 | positive regulation of membrane depolarization |
| GO:0046879 | 0.0092 | 2.6789 | 3.5257 | 9 | 289 | hormone secretion |
| GO:0048585 | 0.0092 | 1.7054 | 17.5675 | 28 | 1440 | negative regulation of response to stimulus |
| GO:0001937 | 0.0095 | 7.4587 | 0.4392 | 3 | 36 | negative regulation of endothelial cell proliferation |
| GO:0043029 | 0.0095 | 7.4587 | 0.4392 | 3 | 36 | T cell homeostasis |
| GO:0002526 | 0.0096 | 3.4969 | 1.8055 | 6 | 148 | acute inflammatory response |
| GO:0006810 | 0.0099 | 1.4341 | 58.3752 | 74 | 4785 | transport |
| GOMFID | Pvalue | OddsRatio | ExpCount | Count | Size | Term |
| GO:0001875 | 4e-04 | 105.1242 | 0.0321 | 2 | 5 | lipopolysaccharide receptor activity |
| GO:0031726 | 4e-04 | 105.1242 | 0.0321 | 2 | 5 | CCR1 chemokine receptor binding |
| GO:0008514 | 0.0014 | 5.2916 | 1.2204 | 6 | 190 | organic anion transmembrane transporter activity |
| GO:0008474 | 0.0018 | 39.4093 | 0.0642 | 2 | 10 | palmitoyl-(protein) hydrolase activity |
| GO:0004953 | 0.0035 | 26.2663 | 0.0899 | 2 | 14 | icosanoid receptor activity |
| GO:0008009 | 0.0036 | 10.5888 | 0.3083 | 3 | 48 | chemokine activity |
| GO:0030676 | 0.0041 | 24.2443 | 0.0963 | 2 | 15 | Rac guanyl-nucleotide exchange factor activity |
| GO:0038187 | 0.0052 | 21.0092 | 0.1092 | 2 | 17 | pattern recognition receptor activity |
| GO:0016495 | 0.0064 | Inf | 0.0064 | 1 | 1 | C-X3-C chemokine receptor activity |
| GO:0016501 | 0.0064 | Inf | 0.0064 | 1 | 1 | prostacyclin receptor activity |
| GO:0031857 | 0.0064 | Inf | 0.0064 | 1 | 1 | type 1 parathyroid hormone receptor binding |
| GO:0042356 | 0.0064 | Inf | 0.0064 | 1 | 1 | GDP-4-dehydro-D-rhamnose reductase activity |
| GO:0042497 | 0.0064 | Inf | 0.0064 | 1 | 1 | triacyl lipopeptide binding |
| GO:0050577 | 0.0064 | Inf | 0.0064 | 1 | 1 | GDP-L-fucose synthase activity |
| GO:0050785 | 0.0064 | Inf | 0.0064 | 1 | 1 | advanced glycation end-product receptor activity |
| GO:0071566 | 0.0064 | Inf | 0.0064 | 1 | 1 | UFM1 activating enzyme activity |
| GO:0086040 | 0.0064 | Inf | 0.0064 | 1 | 1 | sodium:proton antiporter activity involved in regulation of cardiac muscle cell membrane potential |
| GO:0102005 | 0.0064 | Inf | 0.0064 | 1 | 1 | 2-octaprenyl-6-methoxy-1,4-benzoquinone methylase activity |
| GO:1904599 | 0.0064 | Inf | 0.0064 | 1 | 1 | advanced glycation end-product binding |
| GO:0051428 | 0.0072 | 17.5044 | 0.1285 | 2 | 20 | peptide hormone receptor binding |
| GO:0060089 | 0.0085 | 2.0132 | 9.847 | 18 | 1533 | molecular transducer activity |
| GO:0042605 | 0.0087 | 15.752 | 0.1413 | 2 | 22 | peptide antigen binding |
| GO:0033218 | 0.0094 | 3.5334 | 1.7985 | 6 | 280 | amide binding |
| GOMFID | Pvalue | OddsRatio | ExpCount | Count | Size | Term |
| GO:0005126 | 1e-04 | 5.9891 | 1.4782 | 8 | 263 | cytokine receptor binding |
| GO:0008009 | 2e-04 | 16.7774 | 0.2698 | 4 | 48 | chemokine activity |
| GO:0098772 | 2e-04 | 2.6761 | 9.757 | 22 | 1736 | molecular function regulator |
| GO:0001875 | 3e-04 | 120.5768 | 0.0281 | 2 | 5 | lipopolysaccharide receptor activity |
| GO:0031726 | 3e-04 | 120.5768 | 0.0281 | 2 | 5 | CCR1 chemokine receptor binding |
| GO:0031730 | 5e-04 | 90.427 | 0.0337 | 2 | 6 | CCR5 chemokine receptor binding |
| GO:0015297 | 9e-04 | 10.235 | 0.4272 | 4 | 76 | antiporter activity |
| GO:0048018 | 9e-04 | 3.9432 | 2.5011 | 9 | 445 | receptor ligand activity |
| GO:0004953 | 0.0027 | 30.1273 | 0.0787 | 2 | 14 | icosanoid receptor activity |
| GO:0030676 | 0.0031 | 27.8081 | 0.0843 | 2 | 15 | Rac guanyl-nucleotide exchange factor activity |
| GO:0004697 | 0.0036 | 25.8202 | 0.0899 | 2 | 16 | protein kinase C activity |
| GO:0038187 | 0.004 | 24.0974 | 0.0955 | 2 | 17 | pattern recognition receptor activity |
| GO:0008445 | 0.0056 | Inf | 0.0056 | 1 | 1 | D-aspartate oxidase activity |
| GO:0008811 | 0.0056 | Inf | 0.0056 | 1 | 1 | chloramphenicol O-acetyltransferase activity |
| GO:0016495 | 0.0056 | Inf | 0.0056 | 1 | 1 | C-X3-C chemokine receptor activity |
| GO:0016501 | 0.0056 | Inf | 0.0056 | 1 | 1 | prostacyclin receptor activity |
| GO:0031857 | 0.0056 | Inf | 0.0056 | 1 | 1 | type 1 parathyroid hormone receptor binding |
| GO:0042356 | 0.0056 | Inf | 0.0056 | 1 | 1 | GDP-4-dehydro-D-rhamnose reductase activity |
| GO:0042497 | 0.0056 | Inf | 0.0056 | 1 | 1 | triacyl lipopeptide binding |
| GO:0043843 | 0.0056 | Inf | 0.0056 | 1 | 1 | ADP-specific glucokinase activity |
| GO:0050577 | 0.0056 | Inf | 0.0056 | 1 | 1 | GDP-L-fucose synthase activity |
| GO:0071566 | 0.0056 | Inf | 0.0056 | 1 | 1 | UFM1 activating enzyme activity |
| GO:0086040 | 0.0056 | Inf | 0.0056 | 1 | 1 | sodium:proton antiporter activity involved in regulation of cardiac muscle cell membrane potential |
| GO:0061134 | 0.0061 | 4.5988 | 1.1578 | 5 | 206 | peptidase regulator activity |
| GO:0046943 | 0.0064 | 5.7826 | 0.7363 | 4 | 131 | carboxylic acid transmembrane transporter activity |
| GO:0042605 | 0.0067 | 18.0674 | 0.1236 | 2 | 22 | peptide antigen binding |
| GOMFID | Pvalue | OddsRatio | ExpCount | Count | Size | Term |
| GO:0034186 | 9e-04 | 82.8705 | 0.0482 | 2 | 4 | apolipoprotein A-I binding |
| GO:0008157 | 0.0012 | 16.6469 | 0.2168 | 3 | 18 | protein phosphatase 1 binding |
| GO:0000268 | 0.0014 | 55.2435 | 0.0602 | 2 | 5 | peroxisome targeting sequence binding |
| GO:0016833 | 0.0021 | 41.4301 | 0.0723 | 2 | 6 | oxo-acid-lyase activity |
| GO:0003707 | 0.0049 | 6.2997 | 0.6865 | 4 | 57 | steroid hormone receptor activity |
| GO:0070016 | 0.0061 | 20.7098 | 0.1204 | 2 | 10 | armadillo repeat domain binding |
| GOMFID | Pvalue | OddsRatio | ExpCount | Count | Size | Term |
| GO:0019207 | 3e-04 | 4.1101 | 2.6209 | 10 | 205 | kinase regulator activity |
| GO:0016829 | 3e-04 | 4.4673 | 2.1734 | 9 | 170 | lyase activity |
| GO:0005087 | 0.001 | 77.961 | 0.0511 | 2 | 4 | Ran guanyl-nucleotide exchange factor activity |
| GO:0004860 | 0.0012 | 5.4545 | 1.189 | 6 | 93 | protein kinase inhibitor activity |
| GO:0016833 | 0.0024 | 38.9756 | 0.0767 | 2 | 6 | oxo-acid-lyase activity |
| GO:0098772 | 0.0076 | 1.6492 | 22.1946 | 34 | 1736 | molecular function regulator |
| GO:0004857 | 0.0097 | 2.3815 | 4.8455 | 11 | 379 | enzyme inhibitor activity |
| GOMFID | Pvalue | OddsRatio | ExpCount | Count | Size | Term |
| GO:0003909 | 0.0012 | 53.5467 | 0.0527 | 2 | 7 | DNA ligase activity |
| GO:0031402 | 0.0042 | 24.3303 | 0.098 | 2 | 13 | sodium ion binding |
| GO:0030955 | 0.0055 | 20.5846 | 0.113 | 2 | 15 | potassium ion binding |
| GO:0016501 | 0.0075 | Inf | 0.0075 | 1 | 1 | prostacyclin receptor activity |
| GO:0036220 | 0.0075 | Inf | 0.0075 | 1 | 1 | ITP diphosphatase activity |
| GO:0036222 | 0.0075 | Inf | 0.0075 | 1 | 1 | XTP diphosphatase activity |
| GO:0052869 | 0.0075 | Inf | 0.0075 | 1 | 1 | arachidonic acid omega-hydroxylase activity |
| GO:0052872 | 0.0075 | Inf | 0.0075 | 1 | 1 | tocotrienol omega-hydroxylase activity |
| GO:0102076 | 0.0075 | Inf | 0.0075 | 1 | 1 | beta,beta-carotene-9',10'-cleaving oxygenase activity |
| GOMFID | Pvalue | OddsRatio | ExpCount | Count | Size | Term |
| GO:0004984 | 0 | 5.4162 | 2.2852 | 11 | 370 | olfactory receptor activity |
| GO:0060089 | 0.001 | 2.4088 | 9.4682 | 20 | 1533 | molecular transducer activity |
| GO:0004930 | 0.001 | 2.9732 | 4.836 | 13 | 783 | G-protein coupled receptor activity |
| GO:0099600 | 0.0012 | 2.5371 | 7.5289 | 17 | 1219 | transmembrane receptor activity |
| GO:0038023 | 0.0045 | 2.2651 | 7.8148 | 16 | 1278 | signaling receptor activity |
| GO:0016501 | 0.0062 | Inf | 0.0062 | 1 | 1 | prostacyclin receptor activity |
| GO:0031857 | 0.0062 | Inf | 0.0062 | 1 | 1 | type 1 parathyroid hormone receptor binding |
| GO:0036220 | 0.0062 | Inf | 0.0062 | 1 | 1 | ITP diphosphatase activity |
| GO:0036222 | 0.0062 | Inf | 0.0062 | 1 | 1 | XTP diphosphatase activity |
| GO:0043843 | 0.0062 | Inf | 0.0062 | 1 | 1 | ADP-specific glucokinase activity |
| GO:0050785 | 0.0062 | Inf | 0.0062 | 1 | 1 | advanced glycation end-product receptor activity |
| GO:0102076 | 0.0062 | Inf | 0.0062 | 1 | 1 | beta,beta-carotene-9',10'-cleaving oxygenase activity |
| GO:1904599 | 0.0062 | Inf | 0.0062 | 1 | 1 | advanced glycation end-product binding |
| GOMFID | Pvalue | OddsRatio | ExpCount | Count | Size | Term |
| GO:0032394 | 0 | Inf | 0.0133 | 2 | 2 | MHC class Ib receptor activity |
| GO:0000253 | 3e-04 | 151.7075 | 0.0267 | 2 | 4 | 3-keto sterol reductase activity |
| GO:0099600 | 0.0011 | 2.4783 | 8.1312 | 18 | 1219 | transmembrane receptor activity |
| GO:0060089 | 0.0026 | 2.1886 | 10.2257 | 20 | 1533 | molecular transducer activity |
| GO:0038023 | 0.0047 | 2.1939 | 8.5314 | 17 | 1279 | signaling receptor activity |
| GO:0004930 | 0.0055 | 2.512 | 5.1683 | 12 | 782 | G-protein coupled receptor activity |
| GO:0001614 | 0.0056 | 20.2113 | 0.1134 | 2 | 17 | purinergic nucleotide receptor activity |
| GO:0042288 | 0.0063 | 18.9469 | 0.1201 | 2 | 18 | MHC class I protein binding |
| GO:0004347 | 0.0067 | Inf | 0.0067 | 1 | 1 | glucose-6-phosphate isomerase activity |
| GO:0004476 | 0.0067 | Inf | 0.0067 | 1 | 1 | mannose-6-phosphate isomerase activity |
| GO:0005456 | 0.0067 | Inf | 0.0067 | 1 | 1 | CMP-N-acetylneuraminate transmembrane transporter activity |
| GO:0018455 | 0.0067 | Inf | 0.0067 | 1 | 1 | alcohol dehydrogenase [NAD(P)+] activity |
| GO:0047730 | 0.0067 | Inf | 0.0067 | 1 | 1 | carnosine synthase activity |
| GO:0052798 | 0.0067 | Inf | 0.0067 | 1 | 1 | beta-galactoside alpha-2,3-sialyltransferase activity |
| GO:0102102 | 0.0067 | Inf | 0.0067 | 1 | 1 | homocarnosine synthase activity |
| GO:1990595 | 0.0067 | Inf | 0.0067 | 1 | 1 | mast cell secretagogue receptor activity |
| GOMFID | Pvalue | OddsRatio | ExpCount | Count | Size | Term |
| GO:0004957 | 6e-04 | 81.2424 | 0.0374 | 2 | 6 | prostaglandin E receptor activity |
| GO:0004954 | 0.002 | 36.0965 | 0.0686 | 2 | 11 | prostanoid receptor activity |
| GO:0015037 | 0.0029 | 29.5298 | 0.0811 | 2 | 13 | peptide disulfide oxidoreductase activity |
| GO:0004890 | 0.0044 | 23.1977 | 0.0998 | 2 | 16 | GABA-A receptor activity |
| GO:0004252 | 0.005 | 4.8201 | 1.1041 | 5 | 177 | serine-type endopeptidase activity |
| GO:0098619 | 0.0062 | Inf | 0.0062 | 1 | 1 | selenocysteine-tRNA ligase activity |
| GO:0032561 | 0.0074 | 3.3103 | 2.2519 | 7 | 361 | guanyl ribonucleotide binding |
| GO:0099600 | 0.0084 | 2.1565 | 7.6042 | 15 | 1219 | transmembrane receptor activity |
| GO:0004871 | 0.0088 | 2.0099 | 9.8873 | 18 | 1585 | signal transducer activity |
| GO:0017171 | 0.01 | 4.0559 | 1.3037 | 5 | 209 | serine hydrolase activity |
| GOMFID | Pvalue | OddsRatio | ExpCount | Count | Size | Term |
| GO:0008603 | 9e-04 | 61.2533 | 0.0463 | 2 | 7 | cAMP-dependent protein kinase regulator activity |
| GO:0004126 | 0.0012 | 51.0413 | 0.0529 | 2 | 8 | cytidine deaminase activity |
| GO:0048020 | 0.0022 | 12.859 | 0.2577 | 3 | 39 | CCR chemokine receptor binding |
| GO:0004984 | 0.0032 | 3.5096 | 2.4452 | 8 | 370 | olfactory receptor activity |
| GO:0070402 | 0.0032 | 27.832 | 0.0859 | 2 | 13 | NADPH binding |
| GO:0008009 | 0.0039 | 10.2814 | 0.3172 | 3 | 48 | chemokine activity |
| GO:0003729 | 0.0047 | 3.6214 | 2.0619 | 7 | 312 | mRNA binding |
| GO:0042288 | 0.0062 | 19.1286 | 0.119 | 2 | 18 | MHC class I protein binding |
| GO:0004252 | 0.0064 | 4.5349 | 1.1697 | 5 | 177 | serine-type endopeptidase activity |
| GO:0004420 | 0.0066 | Inf | 0.0066 | 1 | 1 | hydroxymethylglutaryl-CoA reductase (NADPH) activity |
| GO:0008829 | 0.0066 | Inf | 0.0066 | 1 | 1 | dCTP deaminase activity |
| GO:0030429 | 0.0066 | Inf | 0.0066 | 1 | 1 | kynureninase activity |
| GO:0036470 | 0.0066 | Inf | 0.0066 | 1 | 1 | tyrosine 3-monooxygenase activator activity |
| GO:0036478 | 0.0066 | Inf | 0.0066 | 1 | 1 | L-dopa decarboxylase activator activity |
| GO:0036524 | 0.0066 | Inf | 0.0066 | 1 | 1 | protein deglycase activity |
| GO:0042282 | 0.0066 | Inf | 0.0066 | 1 | 1 | hydroxymethylglutaryl-CoA reductase activity |
| GO:0045340 | 0.0066 | Inf | 0.0066 | 1 | 1 | mercury ion binding |
| GO:0023023 | 0.0076 | 17.0011 | 0.1322 | 2 | 20 | MHC protein complex binding |
| GOMFID | Pvalue | OddsRatio | ExpCount | Count | Size | Term |
| GO:0003796 | 1e-04 | 46.8204 | 0.0851 | 3 | 13 | lysozyme activity |
| GO:0016798 | 0.0011 | 6.8747 | 0.7856 | 5 | 120 | hydrolase activity, acting on glycosyl bonds |
| GO:0004930 | 0.0051 | 2.5356 | 5.1262 | 12 | 783 | G-protein coupled receptor activity |
| GO:0030414 | 0.0053 | 4.7474 | 1.1195 | 5 | 171 | peptidase inhibitor activity |
| GO:0004602 | 0.0061 | 19.3137 | 0.1178 | 2 | 18 | glutathione peroxidase activity |
| GO:0000334 | 0.0065 | Inf | 0.0065 | 1 | 1 | 3-hydroxyanthranilate 3,4-dioxygenase activity |
| GO:0004912 | 0.0065 | Inf | 0.0065 | 1 | 1 | interleukin-3 receptor activity |
| GO:0009917 | 0.0065 | Inf | 0.0065 | 1 | 1 | sterol 5-alpha reductase activity |
| GO:0030283 | 0.0065 | Inf | 0.0065 | 1 | 1 | testosterone dehydrogenase [NAD(P)] activity |
| GO:0052798 | 0.0065 | Inf | 0.0065 | 1 | 1 | beta-galactoside alpha-2,3-sialyltransferase activity |
| GO:0102339 | 0.0065 | Inf | 0.0065 | 1 | 1 | 3-oxo-arachidoyl-CoA reductase activity |
| GO:0102340 | 0.0065 | Inf | 0.0065 | 1 | 1 | 3-oxo-behenoyl-CoA reductase activity |
| GO:0102341 | 0.0065 | Inf | 0.0065 | 1 | 1 | 3-oxo-lignoceroyl-CoA reductase activity |
| GO:0102342 | 0.0065 | Inf | 0.0065 | 1 | 1 | 3-oxo-cerotoyl-CoA reductase activity |
| GO:0038023 | 0.0089 | 2.0863 | 8.3734 | 16 | 1279 | signaling receptor activity |
| GOMFID | Pvalue | OddsRatio | ExpCount | Count | Size | Term |
| GO:0004984 | 0 | 6.265 | 2.011 | 11 | 370 | olfactory receptor activity |
| GO:0004930 | 1e-04 | 3.8294 | 4.2022 | 14 | 782 | G-protein coupled receptor activity |
| GO:0099600 | 3e-04 | 2.9683 | 6.6254 | 17 | 1219 | transmembrane receptor activity |
| GO:0038023 | 5e-04 | 2.8158 | 6.9515 | 17 | 1279 | signaling receptor activity |
| GO:0060089 | 5e-04 | 2.6534 | 8.332 | 19 | 1533 | molecular transducer activity |
| GO:0019864 | 0.0013 | 46.7878 | 0.0544 | 2 | 10 | IgG binding |
| GO:0005518 | 0.0053 | 9.1315 | 0.3533 | 3 | 65 | collagen binding |
| GO:0004398 | 0.0054 | Inf | 0.0054 | 1 | 1 | histidine decarboxylase activity |
| GO:0004941 | 0.0054 | Inf | 0.0054 | 1 | 1 | beta2-adrenergic receptor activity |
| GO:0016519 | 0.0054 | Inf | 0.0054 | 1 | 1 | gastric inhibitory peptide receptor activity |
| GO:0033676 | 0.0054 | Inf | 0.0054 | 1 | 1 | double-stranded DNA-dependent ATPase activity |
| GO:0102116 | 0.0054 | Inf | 0.0054 | 1 | 1 | laurate hydroxylase activity |
| GO:0102339 | 0.0054 | Inf | 0.0054 | 1 | 1 | 3-oxo-arachidoyl-CoA reductase activity |
| GO:0102340 | 0.0054 | Inf | 0.0054 | 1 | 1 | 3-oxo-behenoyl-CoA reductase activity |
| GO:0102341 | 0.0054 | Inf | 0.0054 | 1 | 1 | 3-oxo-lignoceroyl-CoA reductase activity |
| GO:0102342 | 0.0054 | Inf | 0.0054 | 1 | 1 | 3-oxo-cerotoyl-CoA reductase activity |
| GO:0103002 | 0.0054 | Inf | 0.0054 | 1 | 1 | 16-hydroxypalmitate dehydrogenase activity |
| GO:0044877 | 0.006 | 2.5017 | 5.2612 | 12 | 968 | macromolecular complex binding |
| GOMFID | Pvalue | OddsRatio | ExpCount | Count | Size | Term |
| GO:0008131 | 4e-04 | 116.2971 | 0.0346 | 2 | 4 | primary amine oxidase activity |
| GO:0004476 | 0.0086 | Inf | 0.0086 | 1 | 1 | mannose-6-phosphate isomerase activity |
| GO:0015130 | 0.0086 | Inf | 0.0086 | 1 | 1 | mevalonate transmembrane transporter activity |
| GO:0033862 | 0.0086 | Inf | 0.0086 | 1 | 1 | UMP kinase activity |
| GO:0035757 | 0.0086 | Inf | 0.0086 | 1 | 1 | chemokine (C-C motif) ligand 19 binding |
| GO:0035758 | 0.0086 | Inf | 0.0086 | 1 | 1 | chemokine (C-C motif) ligand 21 binding |
| GO:0038117 | 0.0086 | Inf | 0.0086 | 1 | 1 | C-C motif chemokine 19 receptor activity |
| GO:0038121 | 0.0086 | Inf | 0.0086 | 1 | 1 | C-C motif chemokine 21 receptor activity |
| GO:0042947 | 0.0086 | Inf | 0.0086 | 1 | 1 | glucoside transmembrane transporter activity |
| GO:0070463 | 0.0086 | Inf | 0.0086 | 1 | 1 | tubulin-dependent ATPase activity |
| GO:0046625 | 0.0093 | 15.4937 | 0.147 | 2 | 17 | sphingolipid binding |
| GOMFID | Pvalue | OddsRatio | ExpCount | Count | Size | Term |
| GO:0001128 | 0.006 | Inf | 0.006 | 1 | 1 | RNA polymerase II transcription coactivator activity involved in preinitiation complex assembly |
| GO:0004838 | 0.006 | Inf | 0.006 | 1 | 1 | L-tyrosine:2-oxoglutarate aminotransferase activity |
| GO:0005519 | 0.006 | Inf | 0.006 | 1 | 1 | cytoskeletal regulatory protein binding |
| GO:0015105 | 0.006 | Inf | 0.006 | 1 | 1 | arsenite transmembrane transporter activity |
| GO:0036220 | 0.006 | Inf | 0.006 | 1 | 1 | ITP diphosphatase activity |
| GO:0036222 | 0.006 | Inf | 0.006 | 1 | 1 | XTP diphosphatase activity |
| GO:0046403 | 0.006 | Inf | 0.006 | 1 | 1 | polynucleotide 3'-phosphatase activity |
| GO:0017056 | 0.0063 | 18.8023 | 0.1198 | 2 | 20 | structural constituent of nuclear pore |
| GOMFID | Pvalue | OddsRatio | ExpCount | Count | Size | Term |
| GO:0008494 | 6e-04 | 75.8443 | 0.04 | 2 | 6 | translation activator activity |
| GO:0048020 | 0.0022 | 12.7357 | 0.2601 | 3 | 39 | CCR chemokine receptor binding |
| GO:0008499 | 0.0038 | 25.2689 | 0.0934 | 2 | 14 | UDP-galactose:beta-N-acetylglucosamine beta-1,3-galactosyltransferase activity |
| GO:0008009 | 0.004 | 10.1829 | 0.3202 | 3 | 48 | chemokine activity |
| GO:0003844 | 0.0067 | Inf | 0.0067 | 1 | 1 | 1,4-alpha-glucan branching enzyme activity |
| GO:0047888 | 0.0067 | Inf | 0.0067 | 1 | 1 | fatty acid peroxidase activity |
| GO:0102752 | 0.0067 | Inf | 0.0067 | 1 | 1 | 1,4-alpha-glucan branching enzyme activity (using a glucosylated glycogenin as primer for glycogen synthesis) |
| GOMFID | Pvalue | OddsRatio | ExpCount | Count | Size | Term |
| GO:0001851 | 0.001 | 77.1981 | 0.0516 | 2 | 4 | complement component C3b binding |
| GO:0004723 | 0.0024 | 38.5942 | 0.0775 | 2 | 6 | calcium-dependent protein serine/threonine phosphatase activity |
| GO:0022839 | 0.0024 | 7.7766 | 0.568 | 4 | 44 | ion gated channel activity |
| GO:0005217 | 0.0055 | 9.2953 | 0.3614 | 3 | 28 | intracellular ligand-gated ion channel activity |
| GO:0022834 | 0.0068 | 3.7799 | 1.6781 | 6 | 130 | ligand-gated channel activity |
| GO:0022838 | 0.0074 | 2.3729 | 5.3183 | 12 | 412 | substrate-specific channel activity |
| GOMFID | Pvalue | OddsRatio | ExpCount | Count | Size | Term |
| GO:0001851 | 0.0011 | 73.5945 | 0.0541 | 2 | 4 | complement component C3b binding |
| GO:0005547 | 0.0011 | 9.8865 | 0.4599 | 4 | 34 | phosphatidylinositol-3,4,5-trisphosphate binding |
| GO:0005515 | 0.0017 | 1.5882 | 145.5942 | 166 | 10764 | protein binding |
| GO:0070300 | 0.0017 | 14.775 | 0.2435 | 3 | 18 | phosphatidic acid binding |
| GO:0004723 | 0.0026 | 36.7926 | 0.0812 | 2 | 6 | calcium-dependent protein serine/threonine phosphatase activity |
| GO:0005217 | 0.0062 | 8.8594 | 0.3787 | 3 | 28 | intracellular ligand-gated ion channel activity |
| GO:0005546 | 0.0078 | 5.4842 | 0.7845 | 4 | 58 | phosphatidylinositol-4,5-bisphosphate binding |
| GO:0010314 | 0.0092 | 16.3472 | 0.1488 | 2 | 11 | phosphatidylinositol-5-phosphate binding |
| GO:0043295 | 0.0092 | 16.3472 | 0.1488 | 2 | 11 | glutathione binding |
| GOMFID | Pvalue | OddsRatio | ExpCount | Count | Size | Term |
| GO:0031726 | 5e-04 | 97.4303 | 0.0346 | 2 | 5 | CCR1 chemokine receptor binding |
| GO:0004908 | 7e-04 | 73.0682 | 0.0415 | 2 | 6 | interleukin-1 receptor activity |
| GO:0004126 | 0.0013 | 48.7061 | 0.0553 | 2 | 8 | cytidine deaminase activity |
| GO:0030545 | 0.0016 | 3.314 | 3.265 | 10 | 472 | receptor regulator activity |
| GO:0004875 | 0.0021 | 36.525 | 0.0692 | 2 | 10 | complement receptor activity |
| GO:0030548 | 0.0021 | 36.525 | 0.0692 | 2 | 10 | acetylcholine receptor regulator activity |
| GO:0004872 | 0.0029 | 2.1621 | 10.3 | 20 | 1489 | receptor activity |
| GO:0042834 | 0.0035 | 26.5587 | 0.0899 | 2 | 13 | peptidoglycan binding |
| GO:0008009 | 0.0044 | 9.8067 | 0.332 | 3 | 48 | chemokine activity |
| GO:0008201 | 0.0048 | 4.8641 | 1.093 | 5 | 158 | heparin binding |
| GO:0008289 | 0.0048 | 2.6707 | 4.4341 | 11 | 641 | lipid binding |
| GO:0008329 | 0.006 | 19.4715 | 0.1176 | 2 | 17 | signaling pattern recognition receptor activity |
| GO:0002113 | 0.0069 | Inf | 0.0069 | 1 | 1 | interleukin-33 binding |
| GO:0008829 | 0.0069 | Inf | 0.0069 | 1 | 1 | dCTP deaminase activity |
| GO:0016495 | 0.0069 | Inf | 0.0069 | 1 | 1 | C-X3-C chemokine receptor activity |
| GO:0016501 | 0.0069 | Inf | 0.0069 | 1 | 1 | prostacyclin receptor activity |
| GO:0042008 | 0.0069 | Inf | 0.0069 | 1 | 1 | interleukin-18 receptor activity |
| GO:0042356 | 0.0069 | Inf | 0.0069 | 1 | 1 | GDP-4-dehydro-D-rhamnose reductase activity |
| GO:0042497 | 0.0069 | Inf | 0.0069 | 1 | 1 | triacyl lipopeptide binding |
| GO:0050577 | 0.0069 | Inf | 0.0069 | 1 | 1 | GDP-L-fucose synthase activity |
| GO:0071566 | 0.0069 | Inf | 0.0069 | 1 | 1 | UFM1 activating enzyme activity |
| GO:0086040 | 0.0069 | Inf | 0.0069 | 1 | 1 | sodium:proton antiporter activity involved in regulation of cardiac muscle cell membrane potential |
| GO:0005546 | 0.0075 | 8.0187 | 0.4012 | 3 | 58 | phosphatidylinositol-4,5-bisphosphate binding |
| GO:0004298 | 0.0091 | 15.3684 | 0.1453 | 2 | 21 | threonine-type endopeptidase activity |
| GOMFID | Pvalue | OddsRatio | ExpCount | Count | Size | Term |
| GO:0008009 | 4e-04 | 12.5603 | 0.3558 | 4 | 48 | chemokine activity |
| GO:0031726 | 5e-04 | 90.7797 | 0.0371 | 2 | 5 | CCR1 chemokine receptor binding |
| GO:0030545 | 8e-04 | 3.4172 | 3.4982 | 11 | 472 | receptor regulator activity |
| GO:0004908 | 8e-04 | 68.0805 | 0.0445 | 2 | 6 | interleukin-1 receptor activity |
| GO:0008289 | 0.0029 | 2.7278 | 4.7508 | 12 | 641 | lipid binding |
| GO:0005126 | 0.0035 | 3.8269 | 1.9492 | 7 | 263 | cytokine receptor binding |
| GO:0023026 | 0.0061 | 19.4395 | 0.1186 | 2 | 16 | MHC class II protein complex binding |
| GO:0005125 | 0.0073 | 4.384 | 1.2072 | 5 | 168 | cytokine activity |
| GO:0002113 | 0.0074 | Inf | 0.0074 | 1 | 1 | interleukin-33 binding |
| GO:0008554 | 0.0074 | Inf | 0.0074 | 1 | 1 | sodium-exporting ATPase activity, phosphorylative mechanism |
| GO:0015126 | 0.0074 | Inf | 0.0074 | 1 | 1 | canalicular bile acid transmembrane transporter activity |
| GO:0016495 | 0.0074 | Inf | 0.0074 | 1 | 1 | C-X3-C chemokine receptor activity |
| GO:0016501 | 0.0074 | Inf | 0.0074 | 1 | 1 | prostacyclin receptor activity |
| GO:0035438 | 0.0074 | Inf | 0.0074 | 1 | 1 | cyclic-di-GMP binding |
| GO:0036470 | 0.0074 | Inf | 0.0074 | 1 | 1 | tyrosine 3-monooxygenase activator activity |
| GO:0036478 | 0.0074 | Inf | 0.0074 | 1 | 1 | L-dopa decarboxylase activator activity |
| GO:0036524 | 0.0074 | Inf | 0.0074 | 1 | 1 | protein deglycase activity |
| GO:0042008 | 0.0074 | Inf | 0.0074 | 1 | 1 | interleukin-18 receptor activity |
| GO:0042497 | 0.0074 | Inf | 0.0074 | 1 | 1 | triacyl lipopeptide binding |
| GO:0045340 | 0.0074 | Inf | 0.0074 | 1 | 1 | mercury ion binding |
| GO:0047323 | 0.0074 | Inf | 0.0074 | 1 | 1 | [3-methyl-2-oxobutanoate dehydrogenase (acetyl-transferring)] kinase activity |
| GO:0061507 | 0.0074 | Inf | 0.0074 | 1 | 1 | cyclic-GMP-AMP binding |
| GO:0071566 | 0.0074 | Inf | 0.0074 | 1 | 1 | UFM1 activating enzyme activity |
| GO:0086040 | 0.0074 | Inf | 0.0074 | 1 | 1 | sodium:proton antiporter activity involved in regulation of cardiac muscle cell membrane potential |
| GO:0005546 | 0.0091 | 7.4667 | 0.4299 | 3 | 58 | phosphatidylinositol-4,5-bisphosphate binding |
| GOMFID | Pvalue | OddsRatio | ExpCount | Count | Size | Term |
| GO:0004953 | 1e-04 | 39.1193 | 0.0994 | 3 | 14 | icosanoid receptor activity |
| GO:0004095 | 3e-04 | 142.2478 | 0.0284 | 2 | 4 | carnitine O-palmitoyltransferase activity |
| GO:0016409 | 0.0021 | 13.0219 | 0.2557 | 3 | 36 | palmitoyltransferase activity |
| GO:0016653 | 0.0032 | 28.4354 | 0.0852 | 2 | 12 | oxidoreductase activity, acting on NAD(P)H, heme protein as acceptor |
| GO:0008374 | 0.0037 | 10.4758 | 0.3125 | 3 | 44 | O-acyltransferase activity |
| GO:0030547 | 0.0063 | 18.951 | 0.1207 | 2 | 17 | receptor inhibitor activity |
| GO:0001631 | 0.0071 | Inf | 0.0071 | 1 | 1 | cysteinyl leukotriene receptor activity |
| GO:0004037 | 0.0071 | Inf | 0.0071 | 1 | 1 | allantoicase activity |
| GO:0004654 | 0.0071 | Inf | 0.0071 | 1 | 1 | polyribonucleotide nucleotidyltransferase activity |
| GO:0031768 | 0.0071 | Inf | 0.0071 | 1 | 1 | ghrelin receptor binding |
| GO:0051916 | 0.0071 | Inf | 0.0071 | 1 | 1 | granulocyte colony-stimulating factor binding |
| GO:0070463 | 0.0071 | Inf | 0.0071 | 1 | 1 | tubulin-dependent ATPase activity |
| GO:0008373 | 0.0096 | 14.9576 | 0.1492 | 2 | 21 | sialyltransferase activity |
| GOMFID | Pvalue | OddsRatio | ExpCount | Count | Size | Term |
| GO:0004984 | 0 | 8.1251 | 1.7596 | 12 | 370 | olfactory receptor activity |
| GO:0004930 | 0 | 5.2483 | 3.7237 | 16 | 783 | G-protein coupled receptor activity |
| GO:0099600 | 2e-04 | 3.2511 | 5.7972 | 16 | 1219 | transmembrane receptor activity |
| GO:0060089 | 2e-04 | 2.9399 | 7.2905 | 18 | 1533 | molecular transducer activity |
| GO:0038023 | 3e-04 | 3.0842 | 6.0826 | 16 | 1279 | signaling receptor activity |
| GO:0072341 | 0.004 | 10.1668 | 0.3186 | 3 | 67 | modified amino acid binding |
| GO:0001631 | 0.0048 | Inf | 0.0048 | 1 | 1 | cysteinyl leukotriene receptor activity |
| GO:0004489 | 0.0048 | Inf | 0.0048 | 1 | 1 | methylenetetrahydrofolate reductase (NAD(P)H) activity |
| GO:0004502 | 0.0048 | Inf | 0.0048 | 1 | 1 | kynurenine 3-monooxygenase activity |
| GO:0004503 | 0.0048 | Inf | 0.0048 | 1 | 1 | monophenol monooxygenase activity |
| GO:0045352 | 0.0048 | Inf | 0.0048 | 1 | 1 | interleukin-1 Type I receptor antagonist activity |
| GO:0045353 | 0.0048 | Inf | 0.0048 | 1 | 1 | interleukin-1 Type II receptor antagonist activity |
| GO:0050129 | 0.0048 | Inf | 0.0048 | 1 | 1 | N-formylglutamate deformylase activity |
| GO:0061609 | 0.0048 | Inf | 0.0048 | 1 | 1 | fructose-1-phosphate aldolase activity |
| GO:0070736 | 0.0048 | Inf | 0.0048 | 1 | 1 | protein-glycine ligase activity, initiating |
| GO:0004063 | 0.0095 | 212.0132 | 0.0095 | 1 | 2 | aryldialkylphosphatase activity |
| GO:0005150 | 0.0095 | 212.0132 | 0.0095 | 1 | 2 | interleukin-1, Type I receptor binding |
| GO:0005151 | 0.0095 | 212.0132 | 0.0095 | 1 | 2 | interleukin-1, Type II receptor binding |
| GO:0050252 | 0.0095 | 212.0132 | 0.0095 | 1 | 2 | retinol O-fatty-acyltransferase activity |
| GO:0061714 | 0.0095 | 212.0132 | 0.0095 | 1 | 2 | folic acid receptor activity |
| GOMFID | Pvalue | OddsRatio | ExpCount | Count | Size | Term |
| GO:0035663 | 3e-04 | 202.9114 | 0.0296 | 2 | 3 | Toll-like receptor 2 binding |
| GO:0071723 | 0.0041 | 25.3528 | 0.0988 | 2 | 10 | lipopeptide binding |
| GO:0004896 | 0.0092 | 5.1775 | 0.8202 | 4 | 83 | cytokine receptor activity |
| GO:0004476 | 0.0099 | Inf | 0.0099 | 1 | 1 | mannose-6-phosphate isomerase activity |
| GO:0004504 | 0.0099 | Inf | 0.0099 | 1 | 1 | peptidylglycine monooxygenase activity |
| GO:0004598 | 0.0099 | Inf | 0.0099 | 1 | 1 | peptidylamidoglycolate lyase activity |
| GO:0004633 | 0.0099 | Inf | 0.0099 | 1 | 1 | phosphopantothenoylcysteine decarboxylase activity |
| GO:0004876 | 0.0099 | Inf | 0.0099 | 1 | 1 | complement component C3a receptor activity |
| GO:0004997 | 0.0099 | Inf | 0.0099 | 1 | 1 | thyrotropin-releasing hormone receptor activity |
| GO:0008955 | 0.0099 | Inf | 0.0099 | 1 | 1 | peptidoglycan glycosyltransferase activity |
| GO:0030290 | 0.0099 | Inf | 0.0099 | 1 | 1 | sphingolipid activator protein activity |
| GO:0032428 | 0.0099 | Inf | 0.0099 | 1 | 1 | beta-N-acetylgalactosaminidase activity |
| GO:0035375 | 0.0099 | Inf | 0.0099 | 1 | 1 | zymogen binding |
| GO:0042356 | 0.0099 | Inf | 0.0099 | 1 | 1 | GDP-4-dehydro-D-rhamnose reductase activity |
| GO:0050577 | 0.0099 | Inf | 0.0099 | 1 | 1 | GDP-L-fucose synthase activity |
| GO:0051424 | 0.0099 | Inf | 0.0099 | 1 | 1 | corticotropin-releasing hormone binding |
| GOMFID | Pvalue | OddsRatio | ExpCount | Count | Size | Term |
| GO:0004872 | 3e-04 | 2.6913 | 8.6447 | 20 | 1489 | receptor activity |
| GO:0048020 | 0.0015 | 14.7079 | 0.2264 | 3 | 39 | CCR chemokine receptor binding |
| GO:0008009 | 0.0027 | 11.7597 | 0.2787 | 3 | 48 | chemokine activity |
| GO:0048018 | 0.0043 | 3.3335 | 2.5835 | 8 | 445 | receptor ligand activity |
| GO:0015130 | 0.0058 | Inf | 0.0058 | 1 | 1 | mevalonate transmembrane transporter activity |
| GO:0016519 | 0.0058 | Inf | 0.0058 | 1 | 1 | gastric inhibitory peptide receptor activity |
| GO:0016913 | 0.0058 | Inf | 0.0058 | 1 | 1 | follicle-stimulating hormone activity |
| GO:0017065 | 0.0058 | Inf | 0.0058 | 1 | 1 | single-strand selective uracil DNA N-glycosylase activity |
| GO:0031768 | 0.0058 | Inf | 0.0058 | 1 | 1 | ghrelin receptor binding |
| GO:0031851 | 0.0058 | Inf | 0.0058 | 1 | 1 | kappa-type opioid receptor binding |
| GO:0038051 | 0.0058 | Inf | 0.0058 | 1 | 1 | glucocorticoid-activated RNA polymerase II transcription factor binding transcription factor activity |
| GO:0050429 | 0.0058 | Inf | 0.0058 | 1 | 1 | calcium-dependent phospholipase C activity |
| GO:0004806 | 0.0059 | 19.4191 | 0.1161 | 2 | 20 | triglyceride lipase activity |
| GO:0004871 | 0.0093 | 2.0457 | 9.202 | 17 | 1585 | signal transducer activity |
| GOMFID | Pvalue | OddsRatio | ExpCount | Count | Size | Term |
| GO:0032394 | 0 | Inf | 0.0117 | 2 | 2 | MHC class Ib receptor activity |
| GO:0004468 | 5e-04 | 86.5161 | 0.0352 | 2 | 6 | lysine N-acetyltransferase activity, acting on acetyl phosphate as donor |
| GO:0030246 | 8e-04 | 4.9812 | 1.5255 | 7 | 260 | carbohydrate binding |
| GO:0060089 | 0.0013 | 2.4079 | 8.9948 | 19 | 1533 | molecular transducer activity |
| GO:0003823 | 0.0033 | 10.9022 | 0.2992 | 3 | 51 | antigen binding |
| GO:0042288 | 0.0049 | 21.6129 | 0.1056 | 2 | 18 | MHC class I protein binding |
| GO:0005353 | 0.0059 | Inf | 0.0059 | 1 | 1 | fructose transmembrane transporter activity |
| GO:0016519 | 0.0059 | Inf | 0.0059 | 1 | 1 | gastric inhibitory peptide receptor activity |
| GO:0031704 | 0.0059 | Inf | 0.0059 | 1 | 1 | apelin receptor binding |
| GO:0036393 | 0.0059 | Inf | 0.0059 | 1 | 1 | thiocyanate peroxidase activity |
| GO:0047186 | 0.0059 | Inf | 0.0059 | 1 | 1 | N-acetylneuraminate 7-O(or 9-O)-acetyltransferase activity |
| GO:0047198 | 0.0059 | Inf | 0.0059 | 1 | 1 | cysteine-S-conjugate N-acetyltransferase activity |
| GO:1990595 | 0.0059 | Inf | 0.0059 | 1 | 1 | mast cell secretagogue receptor activity |
| GO:0038023 | 0.0074 | 2.2002 | 7.5045 | 15 | 1279 | signaling receptor activity |
| GO:0052689 | 0.0078 | 5.4407 | 0.7804 | 4 | 133 | carboxylic ester hydrolase activity |
| GOMFID | Pvalue | OddsRatio | ExpCount | Count | Size | Term |
| GO:0003823 | 0.0017 | 8.554 | 0.5134 | 4 | 51 | antigen binding |
| GO:0043015 | 0.002 | 13.6415 | 0.2517 | 3 | 25 | gamma-tubulin binding |
| GO:0030881 | 0.0035 | 28.4312 | 0.0906 | 2 | 9 | beta-2-microglobulin binding |
| GO:0032395 | 0.0035 | 28.4312 | 0.0906 | 2 | 9 | MHC class II receptor activity |
| GO:0015125 | 0.0097 | 15.3034 | 0.151 | 2 | 15 | bile acid transmembrane transporter activity |
| GOMFID | Pvalue | OddsRatio | ExpCount | Count | Size | Term |
| GO:0001851 | 8e-04 | 84.6455 | 0.0472 | 2 | 4 | complement component C3b binding |
| GO:0005537 | 0.001 | 18.2211 | 0.2005 | 3 | 17 | mannose binding |
| GO:0004723 | 0.002 | 42.3175 | 0.0708 | 2 | 6 | calcium-dependent protein serine/threonine phosphatase activity |
| GO:0005516 | 0.0064 | 3.3816 | 2.1824 | 7 | 185 | calmodulin binding |
| NA. |
| n/a |
| NA. |
| n/a |
| NA. |
| n/a |
| NA. |
| n/a |
| NA. |
| n/a |
| NA. |
| n/a |
| NA. |
| n/a |
| NA. |
| n/a |
| NA. |
| n/a |
| NA. |
| n/a |
| NA. |
| n/a |
| NA. |
| n/a |
| NA. |
| n/a |
| NA. |
| n/a |
| NA. |
| n/a |
| NA. |
| n/a |
| NA. |
| n/a |
| NA. |
| n/a |
| NA. |
| n/a |
| NA. |
| n/a |
| NA. |
| n/a |
| NA. |
| n/a |
| NA. |
| n/a |
| NA. |
| n/a |
| NA. |
| n/a |
| NA. |
| n/a |
| NA. |
| n/a |
| NA. |
| n/a |
| NA. |
| n/a |
| NA. |
| n/a |
| NA. |
| n/a |
| NA. |
| n/a |
| NA. |
| n/a |
| NA. |
| n/a |
| NA. |
| n/a |
| NA. |
| n/a |
| NA. |
| n/a |
| NA. |
| n/a |
| NA. |
| n/a |
| NA. |
| n/a |
| NA. |
| n/a |
| NA. |
| n/a |
| NA. |
| n/a |
| NA. |
| n/a |
| NA. |
| n/a |
| NA. |
| n/a |
| NA. |
| n/a |
| NA. |
| n/a |
| NA. |
| n/a |
| NA. |
| n/a |
| NA. |
| n/a |
| NA. |
| n/a |
| NA. |
| n/a |
| NA. |
| n/a |
| NA. |
| n/a |
| NA. |
| n/a |
| GOMFID | Pvalue | OddsRatio | ExpCount | Count | Size | Term |
| GO:0016560 | 4e-04 | 168.9158 | 0.0355 | 2 | 3 | protein import into peroxisome matrix, docking |
| GO:0006367 | 0.0012 | 4.1097 | 2.0808 | 8 | 176 | transcription initiation from RNA polymerase II promoter |
| GO:0010032 | 0.0014 | 56.2982 | 0.0591 | 2 | 5 | meiotic chromosome condensation |
| GO:0030199 | 0.0018 | 8.5149 | 0.5202 | 4 | 44 | collagen fibril organization |
| GO:0031333 | 0.0028 | 4.5899 | 1.3951 | 6 | 118 | negative regulation of protein complex assembly |
| GO:0006363 | 0.0052 | 9.4186 | 0.3547 | 3 | 30 | termination of RNA polymerase I transcription |
| GO:0031115 | 0.0059 | 21.1053 | 0.1182 | 2 | 10 | negative regulation of microtubule polymerization |
| GO:0032488 | 0.0059 | 21.1053 | 0.1182 | 2 | 10 | Cdc42 protein signal transduction |
| GO:0006361 | 0.0063 | 8.7679 | 0.3783 | 3 | 32 | transcription initiation from RNA polymerase I promoter |
| GO:0070897 | 0.0074 | 8.2012 | 0.402 | 3 | 34 | DNA-templated transcriptional preinitiation complex assembly |
| GO:0072350 | 0.0087 | 7.7032 | 0.4256 | 3 | 36 | tricarboxylic acid metabolic process |
| GO:0006283 | 0.0099 | 5.0749 | 0.8394 | 4 | 71 | transcription-coupled nucleotide-excision repair |
| GO:0001967 | 0.01 | 15.3464 | 0.1537 | 2 | 13 | suckling behavior |
| GO:0021978 | 0.01 | 15.3464 | 0.1537 | 2 | 13 | telencephalon regionalization |
| GOMFID | Pvalue | OddsRatio | ExpCount | Count | Size | Term |
| GO:0016560 | 5e-04 | 152.6381 | 0.0392 | 2 | 3 | protein import into peroxisome matrix, docking |
| GO:0033138 | 0.0019 | 4.9906 | 1.2924 | 6 | 99 | positive regulation of peptidyl-serine phosphorylation |
| GO:0065009 | 0.0029 | 1.5715 | 41.9953 | 59 | 3217 | regulation of molecular function |
| GO:0048646 | 0.003 | 1.9645 | 13.0803 | 24 | 1002 | anatomical structure formation involved in morphogenesis |
| GO:0035987 | 0.003 | 7.3196 | 0.6005 | 4 | 46 | endodermal cell differentiation |
| GO:0008344 | 0.0032 | 5.4287 | 0.9921 | 5 | 76 | adult locomotory behavior |
| GO:0021798 | 0.0034 | 30.52 | 0.0914 | 2 | 7 | forebrain dorsal/ventral pattern formation |
| GO:1904892 | 0.0034 | 3.8201 | 1.9451 | 7 | 149 | regulation of STAT cascade |
| GO:0007492 | 0.0035 | 5.2793 | 1.0182 | 5 | 78 | endoderm development |
| GO:0046426 | 0.0038 | 6.8303 | 0.6397 | 4 | 49 | negative regulation of JAK-STAT cascade |
| GO:0051683 | 0.0045 | 25.4317 | 0.1044 | 2 | 8 | establishment of Golgi localization |
| GO:0034446 | 0.0046 | 4.9393 | 1.0835 | 5 | 83 | substrate adhesion-dependent cell spreading |
| GO:0007062 | 0.0062 | 3.8612 | 1.6448 | 6 | 126 | sister chromatid cohesion |
| GO:0007229 | 0.0074 | 4.3753 | 1.214 | 5 | 93 | integrin-mediated signaling pathway |
| GO:0001932 | 0.0078 | 1.7255 | 17.3229 | 28 | 1327 | regulation of protein phosphorylation |
| GO:0038179 | 0.0082 | 7.919 | 0.4177 | 3 | 32 | neurotrophin signaling pathway |
| GO:0010594 | 0.0086 | 3.5897 | 1.7623 | 6 | 135 | regulation of endothelial cell migration |
| GO:1903244 | 0.0086 | 16.9513 | 0.1436 | 2 | 11 | positive regulation of cardiac muscle hypertrophy in response to stress |
| GO:0032268 | 0.0087 | 1.529 | 33.4709 | 47 | 2564 | regulation of cellular protein metabolic process |
| GO:0002312 | 0.0087 | 5.2951 | 0.8094 | 4 | 62 | B cell activation involved in immune response |
| GO:0016064 | 0.0088 | 4.184 | 1.2663 | 5 | 97 | immunoglobulin mediated immune response |
| GO:0048854 | 0.009 | 7.6545 | 0.4308 | 3 | 33 | brain morphogenesis |
| GO:0010810 | 0.0097 | 3.1112 | 2.3628 | 7 | 181 | regulation of cell-substrate adhesion |
| GO:0070897 | 0.0097 | 7.4072 | 0.4438 | 3 | 34 | DNA-templated transcriptional preinitiation complex assembly |
| GOMFID | Pvalue | OddsRatio | ExpCount | Count | Size | Term |
| GO:0018149 | 0.0012 | 9.4392 | 0.4643 | 4 | 58 | peptide cross-linking |
| GO:0021766 | 0.0028 | 7.3803 | 0.5844 | 4 | 73 | hippocampus development |
| GO:0006284 | 0.004 | 10.2615 | 0.3202 | 3 | 40 | base-excision repair |
| GO:0007606 | 0.0043 | 2.8543 | 3.7383 | 10 | 467 | sensory perception of chemical stimulus |
| GO:0055078 | 0.0046 | 9.7341 | 0.3362 | 3 | 42 | sodium ion homeostasis |
| GO:0002523 | 0.0054 | 20.9609 | 0.1121 | 2 | 14 | leukocyte migration involved in inflammatory response |
| GO:0045717 | 0.0071 | 17.9643 | 0.1281 | 2 | 16 | negative regulation of fatty acid biosynthetic process |
| GO:0048385 | 0.0071 | 17.9643 | 0.1281 | 2 | 16 | regulation of retinoic acid receptor signaling pathway |
| GO:0046041 | 0.0079 | Inf | 0.0079 | 1 | 1 | ITP metabolic process |
| GO:0000920 | 0.008 | 16.7656 | 0.1361 | 2 | 17 | cell separation after cytokinesis |
| GO:0006193 | 0.008 | Inf | 0.008 | 1 | 1 | ITP catabolic process |
| GO:0009203 | 0.008 | Inf | 0.008 | 1 | 1 | ribonucleoside triphosphate catabolic process |
| GO:0010900 | 0.008 | Inf | 0.008 | 1 | 1 | negative regulation of phosphatidylcholine catabolic process |
| GO:0016108 | 0.008 | Inf | 0.008 | 1 | 1 | tetraterpenoid metabolic process |
| GO:0016121 | 0.008 | Inf | 0.008 | 1 | 1 | carotene catabolic process |
| GO:0016122 | 0.008 | Inf | 0.008 | 1 | 1 | xanthophyll metabolic process |
| GO:0046588 | 0.008 | Inf | 0.008 | 1 | 1 | negative regulation of calcium-dependent cell-cell adhesion |
| GO:0070267 | 0.008 | Inf | 0.008 | 1 | 1 | oncosis |
| GO:1903280 | 0.008 | Inf | 0.008 | 1 | 1 | negative regulation of calcium:sodium antiporter activity |
| GO:1903461 | 0.008 | Inf | 0.008 | 1 | 1 | Okazaki fragment processing involved in mitotic DNA replication |
| GO:1904155 | 0.008 | Inf | 0.008 | 1 | 1 | DN2 thymocyte differentiation |
| GO:1904156 | 0.008 | Inf | 0.008 | 1 | 1 | DN3 thymocyte differentiation |
| GO:1904877 | 0.008 | Inf | 0.008 | 1 | 1 | positive regulation of DNA ligase activity |
| GO:0009144 | 0.0091 | 3.16 | 2.3374 | 7 | 292 | purine nucleoside triphosphate metabolic process |
| GO:0006968 | 0.0092 | 7.4382 | 0.4323 | 3 | 54 | cellular defense response |
| GOMFID | Pvalue | OddsRatio | ExpCount | Count | Size | Term |
| GO:0045187 | 3e-04 | 28.2877 | 0.1267 | 3 | 21 | regulation of circadian sleep/wake cycle, sleep |
| GO:0022410 | 6e-04 | 21.2079 | 0.1629 | 3 | 27 | circadian sleep/wake cycle process |
| GO:0050795 | 7e-04 | 11.0364 | 0.3983 | 4 | 66 | regulation of behavior |
| GO:0030431 | 0.0013 | 15.4153 | 0.2172 | 3 | 36 | sleep |
| GO:0035195 | 0.0014 | 4.5563 | 1.6595 | 7 | 275 | gene silencing by miRNA |
| GO:0016441 | 0.0016 | 4.4383 | 1.7017 | 7 | 282 | posttranscriptional gene silencing |
| GO:0032754 | 0.0019 | 37.3449 | 0.0664 | 2 | 11 | positive regulation of interleukin-5 production |
| GO:0050713 | 0.0019 | 37.3449 | 0.0664 | 2 | 11 | negative regulation of interleukin-1 beta secretion |
| GO:0031047 | 0.0025 | 4.0898 | 1.8405 | 7 | 305 | gene silencing by RNA |
| GO:1905205 | 0.0027 | 30.5511 | 0.0784 | 2 | 13 | positive regulation of connective tissue replacement |
| GO:0007622 | 0.0029 | 11.5536 | 0.2836 | 3 | 47 | rhythmic behavior |
| GO:0042753 | 0.0052 | 20.9974 | 0.1086 | 2 | 18 | positive regulation of circadian rhythm |
| GO:0006193 | 0.006 | Inf | 0.006 | 1 | 1 | ITP catabolic process |
| GO:0009203 | 0.006 | Inf | 0.006 | 1 | 1 | ribonucleoside triphosphate catabolic process |
| GO:0009405 | 0.006 | Inf | 0.006 | 1 | 1 | pathogenesis |
| GO:0010729 | 0.006 | Inf | 0.006 | 1 | 1 | positive regulation of hydrogen peroxide biosynthetic process |
| GO:0030421 | 0.006 | Inf | 0.006 | 1 | 1 | defecation |
| GO:0061580 | 0.006 | Inf | 0.006 | 1 | 1 | colon epithelial cell migration |
| GO:0086024 | 0.006 | Inf | 0.006 | 1 | 1 | adrenergic receptor signaling pathway involved in positive regulation of heart rate |
| GO:0002374 | 0.0064 | 18.662 | 0.1207 | 2 | 20 | cytokine secretion involved in immune response |
| GO:0072539 | 0.0064 | 18.662 | 0.1207 | 2 | 20 | T-helper 17 cell differentiation |
| GO:0006110 | 0.0071 | 8.1902 | 0.3922 | 3 | 65 | regulation of glycolytic process |
| GO:0034249 | 0.0084 | 3.2343 | 2.3052 | 7 | 382 | negative regulation of cellular amide metabolic process |
| GOMFID | Pvalue | OddsRatio | ExpCount | Count | Size | Term |
| GO:0006112 | 3e-04 | 9.7403 | 0.5653 | 5 | 85 | energy reserve metabolic process |
| GO:0033692 | 6e-04 | 11.4516 | 0.3857 | 4 | 58 | cellular polysaccharide biosynthetic process |
| GO:0051597 | 9e-04 | 60.8566 | 0.0466 | 2 | 7 | response to methylmercury |
| GO:0016051 | 0.0016 | 5.1839 | 1.2436 | 6 | 187 | carbohydrate biosynthetic process |
| GO:0005978 | 0.0033 | 10.9456 | 0.2993 | 3 | 45 | glycogen biosynthetic process |
| GO:0005976 | 0.004 | 6.6332 | 0.6451 | 4 | 97 | polysaccharide metabolic process |
| GO:0051321 | 0.0045 | 4.14 | 1.5429 | 6 | 232 | meiotic cell cycle |
| GO:0010042 | 0.0049 | 21.7224 | 0.1064 | 2 | 16 | response to manganese ion |
| GO:0001835 | 0.0067 | Inf | 0.0067 | 1 | 1 | blastocyst hatching |
| GO:0019547 | 0.0067 | Inf | 0.0067 | 1 | 1 | arginine catabolic process to ornithine |
| GO:0061163 | 0.0067 | Inf | 0.0067 | 1 | 1 | endoplasmic reticulum polarization |
| GO:0061573 | 0.0067 | Inf | 0.0067 | 1 | 1 | actin filament bundle retrograde transport |
| GO:0061580 | 0.0067 | Inf | 0.0067 | 1 | 1 | colon epithelial cell migration |
| GO:0070965 | 0.0067 | Inf | 0.0067 | 1 | 1 | positive regulation of neutrophil mediated killing of fungus |
| GO:0071684 | 0.0067 | Inf | 0.0067 | 1 | 1 | organism emergence from protective structure |
| GO:1900150 | 0.0067 | Inf | 0.0067 | 1 | 1 | regulation of defense response to fungus |
| GO:1904109 | 0.0067 | Inf | 0.0067 | 1 | 1 | positive regulation of cholesterol import |
| GO:0048247 | 0.0068 | 8.3517 | 0.3857 | 3 | 58 | lymphocyte chemotaxis |
| GO:0002548 | 0.0081 | 7.7835 | 0.4123 | 3 | 62 | monocyte chemotaxis |
| GO:2000114 | 0.0085 | 16.001 | 0.1397 | 2 | 21 | regulation of establishment of cell polarity |
| GOMFID | Pvalue | OddsRatio | ExpCount | Count | Size | Term |
| GO:0050900 | 2e-04 | 4.0932 | 2.95 | 11 | 406 | leukocyte migration |
| GO:0060326 | 6e-04 | 4.5617 | 1.8964 | 8 | 261 | cell chemotaxis |
| GO:0070383 | 8e-04 | 69.4741 | 0.0436 | 2 | 6 | DNA cytosine deamination |
| GO:2000503 | 8e-04 | 69.4741 | 0.0436 | 2 | 6 | positive regulation of natural killer cell chemotaxis |
| GO:0042330 | 8e-04 | 3.2113 | 4.0762 | 12 | 561 | taxis |
| GO:0002548 | 0.0011 | 9.7181 | 0.4505 | 4 | 62 | monocyte chemotaxis |
| GO:0045869 | 0.0011 | 55.5759 | 0.0509 | 2 | 7 | negative regulation of single stranded viral RNA replication via double stranded DNA intermediate |
| GO:0032689 | 0.0013 | 15.5507 | 0.218 | 3 | 30 | negative regulation of interferon-gamma production |
| GO:0009972 | 0.0018 | 39.6921 | 0.0654 | 2 | 9 | cytidine deamination |
| GO:0046087 | 0.0018 | 39.6921 | 0.0654 | 2 | 9 | cytidine metabolic process |
| GO:0070098 | 0.0027 | 7.4081 | 0.5813 | 4 | 80 | chemokine-mediated signaling pathway |
| GO:0002430 | 0.0028 | 30.8678 | 0.0799 | 2 | 11 | complement receptor mediated signaling pathway |
| GO:0016553 | 0.0028 | 30.8678 | 0.0799 | 2 | 11 | base conversion or substitution editing |
| GO:0046133 | 0.0028 | 30.8678 | 0.0799 | 2 | 11 | pyrimidine ribonucleoside catabolic process |
| GO:0045026 | 0.0028 | 11.6565 | 0.2834 | 3 | 39 | plasma membrane fusion |
| GO:0070374 | 0.0029 | 4.5405 | 1.4096 | 6 | 194 | positive regulation of ERK1 and ERK2 cascade |
| GO:0048583 | 0.0031 | 1.761 | 27.4946 | 41 | 3784 | regulation of response to stimulus |
| GO:0016045 | 0.0033 | 27.7793 | 0.0872 | 2 | 12 | detection of bacterium |
| GO:0090197 | 0.0033 | 27.7793 | 0.0872 | 2 | 12 | positive regulation of chemokine secretion |
| GO:0019835 | 0.0035 | 10.7579 | 0.3052 | 3 | 42 | cytolysis |
| GO:0050830 | 0.0037 | 6.7804 | 0.6321 | 4 | 87 | defense response to Gram-positive bacterium |
| GO:0030593 | 0.0039 | 6.6992 | 0.6394 | 4 | 88 | neutrophil chemotaxis |
| GO:0010647 | 0.0049 | 2.0123 | 11.5312 | 21 | 1587 | positive regulation of cell communication |
| GO:0023056 | 0.0051 | 2.0038 | 11.5748 | 21 | 1593 | positive regulation of signaling |
| GO:0030214 | 0.0059 | 19.8374 | 0.1163 | 2 | 16 | hyaluronan catabolic process |
| GO:0002757 | 0.0065 | 2.8625 | 3.3496 | 9 | 461 | immune response-activating signal transduction |
| GO:0048870 | 0.0066 | 2.0182 | 10.3105 | 19 | 1419 | cell motility |
| GO:0002881 | 0.0073 | Inf | 0.0073 | 1 | 1 | negative regulation of chronic inflammatory response to non-antigenic stimulus |
| GO:0019408 | 0.0073 | Inf | 0.0073 | 1 | 1 | dolichol biosynthetic process |
| GO:1902173 | 0.0073 | Inf | 0.0073 | 1 | 1 | negative regulation of keratinocyte apoptotic process |
| GO:2000474 | 0.0073 | Inf | 0.0073 | 1 | 1 | regulation of opioid receptor signaling pathway |
| GO:0050707 | 0.0073 | 4.3866 | 1.2062 | 5 | 166 | regulation of cytokine secretion |
| GO:0007096 | 0.0074 | 17.3556 | 0.1308 | 2 | 18 | regulation of exit from mitosis |
| GO:0098581 | 0.0074 | 17.3556 | 0.1308 | 2 | 18 | detection of external biotic stimulus |
| GO:0002688 | 0.0074 | 5.5108 | 0.7702 | 4 | 106 | regulation of leukocyte chemotaxis |
| GO:0002684 | 0.0077 | 2.2295 | 6.7719 | 14 | 932 | positive regulation of immune system process |
| GO:0010469 | 0.0077 | 2.6166 | 4.0762 | 10 | 561 | regulation of receptor activity |
| GO:0045087 | 0.0078 | 2.2957 | 6.0889 | 13 | 838 | innate immune response |
| GO:0010529 | 0.0083 | 16.3337 | 0.1381 | 2 | 19 | negative regulation of transposition |
| GO:1902533 | 0.0083 | 2.2066 | 6.8373 | 14 | 941 | positive regulation of intracellular signal transduction |
| GO:1901136 | 0.0086 | 4.202 | 1.257 | 5 | 173 | carbohydrate derivative catabolic process |
| GO:0048247 | 0.0086 | 7.6207 | 0.4214 | 3 | 58 | lymphocyte chemotaxis |
| GO:0071800 | 0.0091 | 15.4253 | 0.1453 | 2 | 20 | podosome assembly |
| GO:0006954 | 0.0095 | 2.416 | 4.861 | 11 | 669 | inflammatory response |
| GO:0042116 | 0.0099 | 7.2252 | 0.4432 | 3 | 61 | macrophage activation |
| GOMFID | Pvalue | OddsRatio | ExpCount | Count | Size | Term |
| GO:0002548 | 0 | 15.8575 | 0.3589 | 5 | 62 | monocyte chemotaxis |
| GO:1904468 | 7e-04 | 70.1783 | 0.0405 | 2 | 7 | negative regulation of tumor necrosis factor secretion |
| GO:1904628 | 9e-04 | 58.4783 | 0.0463 | 2 | 8 | cellular response to phorbol 13-acetate 12-myristate |
| GO:0071346 | 0.0013 | 6.6629 | 0.8103 | 5 | 140 | cellular response to interferon-gamma |
| GO:0045591 | 0.0018 | 38.9783 | 0.0637 | 2 | 11 | positive regulation of regulatory T cell differentiation |
| GO:0071347 | 0.0018 | 8.2997 | 0.5209 | 4 | 90 | cellular response to interleukin-1 |
| GO:0050708 | 0.0025 | 3.6525 | 2.3674 | 8 | 409 | regulation of protein secretion |
| GO:0050852 | 0.0026 | 5.6848 | 0.9435 | 5 | 163 | T cell receptor signaling pathway |
| GO:1903556 | 0.0027 | 11.7956 | 0.2778 | 3 | 48 | negative regulation of tumor necrosis factor superfamily cytokine production |
| GO:0070228 | 0.0034 | 10.83 | 0.301 | 3 | 52 | regulation of lymphocyte apoptotic process |
| GO:0002790 | 0.0038 | 3.1443 | 3.0967 | 9 | 535 | peptide secretion |
| GO:0060326 | 0.0041 | 4.2489 | 1.5107 | 6 | 261 | cell chemotaxis |
| GO:0048247 | 0.0046 | 9.645 | 0.3357 | 3 | 58 | lymphocyte chemotaxis |
| GO:0060135 | 0.0046 | 9.645 | 0.3357 | 3 | 58 | maternal process involved in female pregnancy |
| GO:0032103 | 0.0049 | 4.086 | 1.5686 | 6 | 271 | positive regulation of response to external stimulus |
| GO:0090276 | 0.0054 | 4.7432 | 1.1229 | 5 | 194 | regulation of peptide hormone secretion |
| GO:0015728 | 0.0058 | Inf | 0.0058 | 1 | 1 | mevalonate transport |
| GO:0019408 | 0.0058 | Inf | 0.0058 | 1 | 1 | dolichol biosynthetic process |
| GO:0038192 | 0.0058 | Inf | 0.0058 | 1 | 1 | gastric inhibitory peptide signaling pathway |
| GO:0040010 | 0.0058 | Inf | 0.0058 | 1 | 1 | positive regulation of growth rate |
| GO:0045660 | 0.0058 | Inf | 0.0058 | 1 | 1 | positive regulation of neutrophil differentiation |
| GO:0051780 | 0.0058 | Inf | 0.0058 | 1 | 1 | behavioral response to nutrient |
| GO:0070241 | 0.0058 | Inf | 0.0058 | 1 | 1 | positive regulation of activated T cell autonomous cell death |
| GO:0085032 | 0.0058 | Inf | 0.0058 | 1 | 1 | modulation by symbiont of host I-kappaB kinase/NF-kappaB cascade |
| GO:1903461 | 0.0058 | Inf | 0.0058 | 1 | 1 | Okazaki fragment processing involved in mitotic DNA replication |
| GO:1904346 | 0.0058 | Inf | 0.0058 | 1 | 1 | positive regulation of gastric mucosal blood circulation |
| GO:0032691 | 0.0059 | 19.4783 | 0.1158 | 2 | 20 | negative regulation of interleukin-1 beta production |
| GO:0060046 | 0.0059 | 19.4783 | 0.1158 | 2 | 20 | regulation of acrosome reaction |
| GO:2000515 | 0.0059 | 19.4783 | 0.1158 | 2 | 20 | negative regulation of CD4-positive, alpha-beta T cell activation |
| GO:0043900 | 0.0061 | 3.4497 | 2.1706 | 7 | 375 | regulation of multi-organism process |
| GO:0051716 | 0.0066 | 1.7077 | 39.5796 | 52 | 6838 | cellular response to stimulus |
| GO:0031295 | 0.0069 | 8.284 | 0.3878 | 3 | 67 | T cell costimulation |
| GO:0051179 | 0.0076 | 1.6906 | 35.0069 | 47 | 6048 | localization |
| GO:0006297 | 0.0077 | 16.6925 | 0.1331 | 2 | 23 | nucleotide-excision repair, DNA gap filling |
| GO:1903672 | 0.0077 | 16.6925 | 0.1331 | 2 | 23 | positive regulation of sprouting angiogenesis |
| GO:1903039 | 0.0079 | 4.3048 | 1.2329 | 5 | 213 | positive regulation of leukocyte cell-cell adhesion |
| GO:0032652 | 0.0081 | 7.7948 | 0.411 | 3 | 71 | regulation of interleukin-1 production |
| GO:0006266 | 0.0084 | 15.9328 | 0.1389 | 2 | 24 | DNA ligation |
| GO:0045087 | 0.009 | 2.4549 | 4.8505 | 11 | 838 | innate immune response |
| GO:0051606 | 0.009 | 2.7245 | 3.5482 | 9 | 613 | detection of stimulus |
| GO:0050900 | 0.0092 | 3.1754 | 2.35 | 7 | 406 | leukocyte migration |
| GOMFID | Pvalue | OddsRatio | ExpCount | Count | Size | Term |
| GO:0002443 | 1e-04 | 2.7972 | 8.6369 | 22 | 712 | leukocyte mediated immunity |
| GO:0050766 | 2e-04 | 10.4186 | 0.5459 | 5 | 45 | positive regulation of phagocytosis |
| GO:0006955 | 4e-04 | 1.9386 | 22.4536 | 39 | 1851 | immune response |
| GO:0030198 | 6e-04 | 3.2492 | 3.9546 | 12 | 326 | extracellular matrix organization |
| GO:0002253 | 7e-04 | 2.6815 | 6.4049 | 16 | 528 | activation of immune response |
| GO:0002051 | 9e-04 | 82.2615 | 0.0485 | 2 | 4 | osteoblast fate commitment |
| GO:0002764 | 0.001 | 2.6837 | 5.9804 | 15 | 493 | immune response-regulating signaling pathway |
| GO:0046903 | 0.0012 | 1.9241 | 18.2079 | 32 | 1501 | secretion |
| GO:0033628 | 0.0012 | 9.4792 | 0.4731 | 4 | 39 | regulation of cell adhesion mediated by integrin |
| GO:0006897 | 0.0014 | 2.4393 | 7.4603 | 17 | 615 | endocytosis |
| GO:0050900 | 0.0014 | 2.8135 | 4.925 | 13 | 406 | leukocyte migration |
| GO:0035509 | 0.0014 | 54.8376 | 0.0607 | 2 | 5 | negative regulation of myosin-light-chain-phosphatase activity |
| GO:0050705 | 0.0014 | 54.8376 | 0.0607 | 2 | 5 | regulation of interleukin-1 alpha secretion |
| GO:0061302 | 0.0014 | 54.8376 | 0.0607 | 2 | 5 | smooth muscle cell-matrix adhesion |
| GO:0002429 | 0.0017 | 3.0414 | 3.8454 | 11 | 317 | immune response-activating cell surface receptor signaling pathway |
| GO:0007166 | 0.0018 | 1.7046 | 30.1431 | 46 | 2535 | cell surface receptor signaling pathway |
| GO:0006952 | 0.0021 | 1.8653 | 18.0866 | 31 | 1491 | defense response |
| GO:0051964 | 0.0021 | 41.1256 | 0.0728 | 2 | 6 | negative regulation of synapse assembly |
| GO:0002684 | 0.0021 | 2.0906 | 11.3057 | 22 | 932 | positive regulation of immune system process |
| GO:0050995 | 0.0023 | 13.0418 | 0.2669 | 3 | 22 | negative regulation of lipid catabolic process |
| GO:0002456 | 0.0026 | 5.6971 | 0.9462 | 5 | 78 | T cell mediated immunity |
| GO:0050861 | 0.003 | 32.8985 | 0.0849 | 2 | 7 | positive regulation of B cell receptor signaling pathway |
| GO:0050854 | 0.0039 | 6.7649 | 0.6429 | 4 | 53 | regulation of antigen receptor-mediated signaling pathway |
| GO:0032610 | 0.0039 | 27.4137 | 0.097 | 2 | 8 | interleukin-1 alpha production |
| GO:0050830 | 0.0041 | 5.0689 | 1.0554 | 5 | 87 | defense response to Gram-positive bacterium |
| GO:0032846 | 0.0042 | 3.3194 | 2.5474 | 8 | 210 | positive regulation of homeostatic process |
| GO:2000379 | 0.0046 | 4.9476 | 1.0796 | 5 | 89 | positive regulation of reactive oxygen species metabolic process |
| GO:0006887 | 0.0046 | 2.0554 | 9.8379 | 19 | 811 | exocytosis |
| GO:0048010 | 0.0048 | 4.8891 | 1.0917 | 5 | 90 | vascular endothelial growth factor receptor signaling pathway |
| GO:0002923 | 0.005 | 23.496 | 0.1092 | 2 | 9 | regulation of humoral immune response mediated by circulating immunoglobulin |
| GO:0014049 | 0.005 | 23.496 | 0.1092 | 2 | 9 | positive regulation of glutamate secretion |
| GO:0090322 | 0.0051 | 9.5264 | 0.3518 | 3 | 29 | regulation of superoxide metabolic process |
| GO:0007229 | 0.0055 | 4.7215 | 1.1281 | 5 | 93 | integrin-mediated signaling pathway |
| GO:0030278 | 0.0057 | 3.4605 | 2.135 | 7 | 176 | regulation of ossification |
| GO:0007204 | 0.0061 | 2.8723 | 3.2995 | 9 | 272 | positive regulation of cytosolic calcium ion concentration |
| GO:0045414 | 0.0062 | 20.5577 | 0.1213 | 2 | 10 | regulation of interleukin-8 biosynthetic process |
| GO:0002274 | 0.0062 | 2.1894 | 7.2419 | 15 | 597 | myeloid leukocyte activation |
| GO:0046889 | 0.0064 | 5.8126 | 0.74 | 4 | 61 | positive regulation of lipid biosynthetic process |
| GO:0045907 | 0.0067 | 8.5393 | 0.3882 | 3 | 32 | positive regulation of vasoconstriction |
| GO:0051248 | 0.0071 | 1.7793 | 15.6363 | 26 | 1289 | negative regulation of protein metabolic process |
| GO:0003084 | 0.0075 | 18.2724 | 0.1334 | 2 | 11 | positive regulation of systemic arterial blood pressure |
| GO:0006105 | 0.0075 | 18.2724 | 0.1334 | 2 | 11 | succinate metabolic process |
| GO:0048585 | 0.0085 | 1.7168 | 17.468 | 28 | 1440 | negative regulation of response to stimulus |
| GO:0046879 | 0.0089 | 2.695 | 3.5057 | 9 | 289 | hormone secretion |
| GO:1904181 | 0.0089 | 16.4441 | 0.1456 | 2 | 12 | positive regulation of membrane depolarization |
| GO:0001937 | 0.0094 | 7.5023 | 0.4367 | 3 | 36 | negative regulation of endothelial cell proliferation |
| GO:0043029 | 0.0094 | 7.5023 | 0.4367 | 3 | 36 | T cell homeostasis |
| GO:0002526 | 0.0094 | 3.5177 | 1.7953 | 6 | 148 | acute inflammatory response |
| GO:0043299 | 0.0096 | 2.2054 | 6.1987 | 13 | 511 | leukocyte degranulation |
| GO:0032675 | 0.0098 | 4.0699 | 1.298 | 5 | 107 | regulation of interleukin-6 production |
| GOMFID | Pvalue | OddsRatio | ExpCount | Count | Size | Term |
| GO:0001875 | 4e-04 | 107.3333 | 0.0315 | 2 | 5 | lipopolysaccharide receptor activity |
| GO:0031726 | 4e-04 | 107.3333 | 0.0315 | 2 | 5 | CCR1 chemokine receptor binding |
| GO:0008474 | 0.0017 | 40.2375 | 0.0629 | 2 | 10 | palmitoyl-(protein) hydrolase activity |
| GO:0004953 | 0.0034 | 26.8183 | 0.0881 | 2 | 14 | icosanoid receptor activity |
| GO:0008009 | 0.0034 | 10.8135 | 0.3021 | 3 | 48 | chemokine activity |
| GO:0030676 | 0.0039 | 24.7538 | 0.0944 | 2 | 15 | Rac guanyl-nucleotide exchange factor activity |
| GO:0038187 | 0.005 | 21.4507 | 0.107 | 2 | 17 | pattern recognition receptor activity |
| GO:0008157 | 0.0056 | 20.1088 | 0.1133 | 2 | 18 | protein phosphatase 1 binding |
| GO:0016495 | 0.0063 | Inf | 0.0063 | 1 | 1 | C-X3-C chemokine receptor activity |
| GO:0016501 | 0.0063 | Inf | 0.0063 | 1 | 1 | prostacyclin receptor activity |
| GO:0030107 | 0.0063 | Inf | 0.0063 | 1 | 1 | HLA-A specific inhibitory MHC class I receptor activity |
| GO:0031857 | 0.0063 | Inf | 0.0063 | 1 | 1 | type 1 parathyroid hormone receptor binding |
| GO:0042356 | 0.0063 | Inf | 0.0063 | 1 | 1 | GDP-4-dehydro-D-rhamnose reductase activity |
| GO:0042497 | 0.0063 | Inf | 0.0063 | 1 | 1 | triacyl lipopeptide binding |
| GO:0050577 | 0.0063 | Inf | 0.0063 | 1 | 1 | GDP-L-fucose synthase activity |
| GO:0050785 | 0.0063 | Inf | 0.0063 | 1 | 1 | advanced glycation end-product receptor activity |
| GO:0071566 | 0.0063 | Inf | 0.0063 | 1 | 1 | UFM1 activating enzyme activity |
| GO:0086040 | 0.0063 | Inf | 0.0063 | 1 | 1 | sodium:proton antiporter activity involved in regulation of cardiac muscle cell membrane potential |
| GO:0102005 | 0.0063 | Inf | 0.0063 | 1 | 1 | 2-octaprenyl-6-methoxy-1,4-benzoquinone methylase activity |
| GO:1904599 | 0.0063 | Inf | 0.0063 | 1 | 1 | advanced glycation end-product binding |
| GO:0051428 | 0.0069 | 17.8722 | 0.1259 | 2 | 20 | peptide hormone receptor binding |
| GO:0042605 | 0.0083 | 16.083 | 0.1385 | 2 | 22 | peptide antigen binding |
| GO:0033218 | 0.0087 | 3.5973 | 1.7687 | 6 | 281 | amide binding |
| GO:0046943 | 0.0094 | 5.1345 | 0.8246 | 4 | 131 | carboxylic acid transmembrane transporter activity |
| GO:0046982 | 0.0095 | 2.8877 | 2.9521 | 8 | 469 | protein heterodimerization activity |
| GOMFID | Pvalue | OddsRatio | ExpCount | Count | Size | Term |
| GO:0005126 | 1e-04 | 5.9227 | 1.4931 | 8 | 263 | cytokine receptor binding |
| GO:0008009 | 2e-04 | 16.6002 | 0.2725 | 4 | 48 | chemokine activity |
| GO:0098772 | 2e-04 | 2.6403 | 9.8557 | 22 | 1736 | molecular function regulator |
| GO:0001875 | 3e-04 | 119.3333 | 0.0284 | 2 | 5 | lipopolysaccharide receptor activity |
| GO:0031726 | 3e-04 | 119.3333 | 0.0284 | 2 | 5 | CCR1 chemokine receptor binding |
| GO:0031730 | 5e-04 | 89.4944 | 0.0341 | 2 | 6 | CCR5 chemokine receptor binding |
| GO:0015297 | 9e-04 | 10.1269 | 0.4315 | 4 | 76 | antiporter activity |
| GO:0048018 | 9e-04 | 3.8989 | 2.5264 | 9 | 445 | receptor ligand activity |
| GO:0004953 | 0.0028 | 29.8167 | 0.0795 | 2 | 14 | icosanoid receptor activity |
| GO:0030676 | 0.0032 | 27.5214 | 0.0852 | 2 | 15 | Rac guanyl-nucleotide exchange factor activity |
| GO:0004697 | 0.0036 | 25.554 | 0.0908 | 2 | 16 | protein kinase C activity |
| GO:0038187 | 0.0041 | 23.8489 | 0.0965 | 2 | 17 | pattern recognition receptor activity |
| GO:0008445 | 0.0057 | Inf | 0.0057 | 1 | 1 | D-aspartate oxidase activity |
| GO:0008811 | 0.0057 | Inf | 0.0057 | 1 | 1 | chloramphenicol O-acetyltransferase activity |
| GO:0016495 | 0.0057 | Inf | 0.0057 | 1 | 1 | C-X3-C chemokine receptor activity |
| GO:0016501 | 0.0057 | Inf | 0.0057 | 1 | 1 | prostacyclin receptor activity |
| GO:0030107 | 0.0057 | Inf | 0.0057 | 1 | 1 | HLA-A specific inhibitory MHC class I receptor activity |
| GO:0031857 | 0.0057 | Inf | 0.0057 | 1 | 1 | type 1 parathyroid hormone receptor binding |
| GO:0042356 | 0.0057 | Inf | 0.0057 | 1 | 1 | GDP-4-dehydro-D-rhamnose reductase activity |
| GO:0042497 | 0.0057 | Inf | 0.0057 | 1 | 1 | triacyl lipopeptide binding |
| GO:0043843 | 0.0057 | Inf | 0.0057 | 1 | 1 | ADP-specific glucokinase activity |
| GO:0050577 | 0.0057 | Inf | 0.0057 | 1 | 1 | GDP-L-fucose synthase activity |
| GO:0071566 | 0.0057 | Inf | 0.0057 | 1 | 1 | UFM1 activating enzyme activity |
| GO:0086040 | 0.0057 | Inf | 0.0057 | 1 | 1 | sodium:proton antiporter activity involved in regulation of cardiac muscle cell membrane potential |
| GO:0061134 | 0.0064 | 4.5497 | 1.1695 | 5 | 206 | peptidase regulator activity |
| GO:0046943 | 0.0066 | 5.7215 | 0.7437 | 4 | 131 | carboxylic acid transmembrane transporter activity |
| GO:0042605 | 0.0068 | 17.8811 | 0.1249 | 2 | 22 | peptide antigen binding |
| GOMFID | Pvalue | OddsRatio | ExpCount | Count | Size | Term |
| GO:0034186 | 8e-04 | 83.3802 | 0.0479 | 2 | 4 | apolipoprotein A-I binding |
| GO:0008157 | 0.0012 | 16.7497 | 0.2155 | 3 | 18 | protein phosphatase 1 binding |
| GO:0000268 | 0.0014 | 55.5833 | 0.0599 | 2 | 5 | peroxisome targeting sequence binding |
| GO:0016833 | 0.0021 | 41.6849 | 0.0718 | 2 | 6 | oxo-acid-lyase activity |
| GO:0003707 | 0.0048 | 6.3388 | 0.6824 | 4 | 57 | steroid hormone receptor activity |
| GO:0070016 | 0.006 | 20.8372 | 0.1197 | 2 | 10 | armadillo repeat domain binding |
| GOMFID | Pvalue | OddsRatio | ExpCount | Count | Size | Term |
| GO:0019207 | 3e-04 | 4.1565 | 2.5933 | 10 | 205 | kinase regulator activity |
| GO:0016829 | 3e-04 | 4.5174 | 2.1506 | 9 | 170 | lyase activity |
| GO:0005087 | 9e-04 | 78.8079 | 0.0506 | 2 | 4 | Ran guanyl-nucleotide exchange factor activity |
| GO:0004860 | 0.0012 | 5.5148 | 1.1765 | 6 | 93 | protein kinase inhibitor activity |
| GO:0016833 | 0.0023 | 39.399 | 0.0759 | 2 | 6 | oxo-acid-lyase activity |
| GO:0098772 | 0.0065 | 1.6703 | 21.9611 | 34 | 1736 | molecular function regulator |
| GO:0004857 | 0.009 | 2.4086 | 4.7945 | 11 | 379 | enzyme inhibitor activity |
| GOMFID | Pvalue | OddsRatio | ExpCount | Count | Size | Term |
| GO:0003909 | 0.0012 | 53.1471 | 0.0531 | 2 | 7 | DNA ligase activity |
| GO:0031402 | 0.0042 | 24.1488 | 0.0987 | 2 | 13 | sodium ion binding |
| GO:0030955 | 0.0056 | 20.431 | 0.1139 | 2 | 15 | potassium ion binding |
| GO:0016501 | 0.0076 | Inf | 0.0076 | 1 | 1 | prostacyclin receptor activity |
| GO:0036220 | 0.0076 | Inf | 0.0076 | 1 | 1 | ITP diphosphatase activity |
| GO:0036222 | 0.0076 | Inf | 0.0076 | 1 | 1 | XTP diphosphatase activity |
| GO:0052869 | 0.0076 | Inf | 0.0076 | 1 | 1 | arachidonic acid omega-hydroxylase activity |
| GO:0052872 | 0.0076 | Inf | 0.0076 | 1 | 1 | tocotrienol omega-hydroxylase activity |
| GO:0102076 | 0.0076 | Inf | 0.0076 | 1 | 1 | beta,beta-carotene-9',10'-cleaving oxygenase activity |
| GOMFID | Pvalue | OddsRatio | ExpCount | Count | Size | Term |
| GO:0004984 | 0 | 5.3604 | 2.3061 | 11 | 370 | olfactory receptor activity |
| GO:0004930 | 3e-04 | 3.209 | 4.8802 | 14 | 783 | G-protein coupled receptor activity |
| GO:0060089 | 4e-04 | 2.5333 | 9.5546 | 21 | 1533 | molecular transducer activity |
| GO:0099600 | 5e-04 | 2.6911 | 7.5976 | 18 | 1219 | transmembrane receptor activity |
| GO:0038023 | 0.002 | 2.4109 | 7.8869 | 17 | 1278 | signaling receptor activity |
| GO:0016501 | 0.0062 | Inf | 0.0062 | 1 | 1 | prostacyclin receptor activity |
| GO:0031857 | 0.0062 | Inf | 0.0062 | 1 | 1 | type 1 parathyroid hormone receptor binding |
| GO:0036220 | 0.0062 | Inf | 0.0062 | 1 | 1 | ITP diphosphatase activity |
| GO:0036222 | 0.0062 | Inf | 0.0062 | 1 | 1 | XTP diphosphatase activity |
| GO:0043843 | 0.0062 | Inf | 0.0062 | 1 | 1 | ADP-specific glucokinase activity |
| GO:0050785 | 0.0062 | Inf | 0.0062 | 1 | 1 | advanced glycation end-product receptor activity |
| GO:0102076 | 0.0062 | Inf | 0.0062 | 1 | 1 | beta,beta-carotene-9',10'-cleaving oxygenase activity |
| GO:1904599 | 0.0062 | Inf | 0.0062 | 1 | 1 | advanced glycation end-product binding |
| GOMFID | Pvalue | OddsRatio | ExpCount | Count | Size | Term |
| GO:0032394 | 0 | Inf | 0.0132 | 2 | 2 | MHC class Ib receptor activity |
| GO:0000253 | 3e-04 | 153.2952 | 0.0264 | 2 | 4 | 3-keto sterol reductase activity |
| GO:0099600 | 0.001 | 2.5086 | 8.0489 | 18 | 1219 | transmembrane receptor activity |
| GO:0060089 | 0.0023 | 2.216 | 10.1222 | 20 | 1533 | molecular transducer activity |
| GO:0038023 | 0.0042 | 2.2206 | 8.4451 | 17 | 1279 | signaling receptor activity |
| GO:0004930 | 0.005 | 2.5413 | 5.1155 | 12 | 782 | G-protein coupled receptor activity |
| GO:0001614 | 0.0055 | 20.4229 | 0.1122 | 2 | 17 | purinergic nucleotide receptor activity |
| GO:0042288 | 0.0062 | 19.1452 | 0.1189 | 2 | 18 | MHC class I protein binding |
| GO:0004347 | 0.0066 | Inf | 0.0066 | 1 | 1 | glucose-6-phosphate isomerase activity |
| GO:0004476 | 0.0066 | Inf | 0.0066 | 1 | 1 | mannose-6-phosphate isomerase activity |
| GO:0005456 | 0.0066 | Inf | 0.0066 | 1 | 1 | CMP-N-acetylneuraminate transmembrane transporter activity |
| GO:0018455 | 0.0066 | Inf | 0.0066 | 1 | 1 | alcohol dehydrogenase [NAD(P)+] activity |
| GO:0047730 | 0.0066 | Inf | 0.0066 | 1 | 1 | carnosine synthase activity |
| GO:0052798 | 0.0066 | Inf | 0.0066 | 1 | 1 | beta-galactoside alpha-2,3-sialyltransferase activity |
| GO:0102102 | 0.0066 | Inf | 0.0066 | 1 | 1 | homocarnosine synthase activity |
| GO:1990595 | 0.0066 | Inf | 0.0066 | 1 | 1 | mast cell secretagogue receptor activity |
| GOMFID | Pvalue | OddsRatio | ExpCount | Count | Size | Term |
| GO:0004957 | 6e-04 | 82.148 | 0.037 | 2 | 6 | prostaglandin E receptor activity |
| GO:0004954 | 0.002 | 36.4989 | 0.0679 | 2 | 11 | prostanoid receptor activity |
| GO:0015037 | 0.0028 | 29.859 | 0.0802 | 2 | 13 | peptide disulfide oxidoreductase activity |
| GO:0004890 | 0.0043 | 23.4563 | 0.0987 | 2 | 16 | GABA-A receptor activity |
| GO:0004252 | 0.005 | 4.8188 | 1.1046 | 5 | 179 | serine-type endopeptidase activity |
| GO:0098619 | 0.0062 | Inf | 0.0062 | 1 | 1 | selenocysteine-tRNA ligase activity |
| GO:0099600 | 0.0076 | 2.184 | 7.5224 | 15 | 1219 | transmembrane receptor activity |
| GO:0004871 | 0.0079 | 2.0365 | 9.7809 | 18 | 1585 | signal transducer activity |
| GO:0017171 | 0.0099 | 4.0621 | 1.3021 | 5 | 211 | serine hydrolase activity |
| GOMFID | Pvalue | OddsRatio | ExpCount | Count | Size | Term |
| GO:0008603 | 9e-04 | 60.7245 | 0.0467 | 2 | 7 | cAMP-dependent protein kinase regulator activity |
| GO:0004126 | 0.0012 | 50.6006 | 0.0533 | 2 | 8 | cytidine deaminase activity |
| GO:0048020 | 0.0022 | 12.7468 | 0.2599 | 3 | 39 | CCR chemokine receptor binding |
| GO:0070402 | 0.0033 | 27.5918 | 0.0866 | 2 | 13 | NADPH binding |
| GO:0004984 | 0.0033 | 3.4773 | 2.4659 | 8 | 370 | olfactory receptor activity |
| GO:0008009 | 0.004 | 10.1917 | 0.3199 | 3 | 48 | chemokine activity |
| GO:0003729 | 0.0047 | 3.6127 | 2.066 | 7 | 310 | mRNA binding |
| GO:0042288 | 0.0063 | 18.9634 | 0.12 | 2 | 18 | MHC class I protein binding |
| GO:0004420 | 0.0067 | Inf | 0.0067 | 1 | 1 | hydroxymethylglutaryl-CoA reductase (NADPH) activity |
| GO:0008829 | 0.0067 | Inf | 0.0067 | 1 | 1 | dCTP deaminase activity |
| GO:0030429 | 0.0067 | Inf | 0.0067 | 1 | 1 | kynureninase activity |
| GO:0036470 | 0.0067 | Inf | 0.0067 | 1 | 1 | tyrosine 3-monooxygenase activator activity |
| GO:0036478 | 0.0067 | Inf | 0.0067 | 1 | 1 | L-dopa decarboxylase activator activity |
| GO:0036524 | 0.0067 | Inf | 0.0067 | 1 | 1 | protein deglycase activity |
| GO:0042282 | 0.0067 | Inf | 0.0067 | 1 | 1 | hydroxymethylglutaryl-CoA reductase activity |
| GO:0045340 | 0.0067 | Inf | 0.0067 | 1 | 1 | mercury ion binding |
| GO:0004252 | 0.0069 | 4.4423 | 1.193 | 5 | 179 | serine-type endopeptidase activity |
| GO:0023023 | 0.0077 | 16.8543 | 0.1333 | 2 | 20 | MHC protein complex binding |
| GOMFID | Pvalue | OddsRatio | ExpCount | Count | Size | Term |
| GO:0003796 | 1e-04 | 46.8612 | 0.085 | 3 | 13 | lysozyme activity |
| GO:0016798 | 0.0011 | 6.8808 | 0.7849 | 5 | 120 | hydrolase activity, acting on glycosyl bonds |
| GO:0004930 | 0.0051 | 2.538 | 5.1218 | 12 | 783 | G-protein coupled receptor activity |
| GO:0030414 | 0.0053 | 4.7516 | 1.1185 | 5 | 171 | peptidase inhibitor activity |
| GO:0004602 | 0.0061 | 19.3305 | 0.1177 | 2 | 18 | glutathione peroxidase activity |
| GO:0000334 | 0.0065 | Inf | 0.0065 | 1 | 1 | 3-hydroxyanthranilate 3,4-dioxygenase activity |
| GO:0004912 | 0.0065 | Inf | 0.0065 | 1 | 1 | interleukin-3 receptor activity |
| GO:0009917 | 0.0065 | Inf | 0.0065 | 1 | 1 | sterol 5-alpha reductase activity |
| GO:0030283 | 0.0065 | Inf | 0.0065 | 1 | 1 | testosterone dehydrogenase [NAD(P)] activity |
| GO:0052798 | 0.0065 | Inf | 0.0065 | 1 | 1 | beta-galactoside alpha-2,3-sialyltransferase activity |
| GO:0102339 | 0.0065 | Inf | 0.0065 | 1 | 1 | 3-oxo-arachidoyl-CoA reductase activity |
| GO:0102340 | 0.0065 | Inf | 0.0065 | 1 | 1 | 3-oxo-behenoyl-CoA reductase activity |
| GO:0102341 | 0.0065 | Inf | 0.0065 | 1 | 1 | 3-oxo-lignoceroyl-CoA reductase activity |
| GO:0102342 | 0.0065 | Inf | 0.0065 | 1 | 1 | 3-oxo-cerotoyl-CoA reductase activity |
| GOMFID | Pvalue | OddsRatio | ExpCount | Count | Size | Term |
| GO:0004984 | 0 | 5.9594 | 2.1006 | 11 | 370 | olfactory receptor activity |
| GO:0004930 | 1e-04 | 3.6328 | 4.3916 | 14 | 782 | G-protein coupled receptor activity |
| GO:0099600 | 5e-04 | 2.8118 | 6.9206 | 17 | 1219 | transmembrane receptor activity |
| GO:0038023 | 8e-04 | 2.6674 | 7.2612 | 17 | 1279 | signaling receptor activity |
| GO:0060089 | 9e-04 | 2.5097 | 8.7032 | 19 | 1533 | molecular transducer activity |
| GO:0019864 | 0.0014 | 44.7361 | 0.0568 | 2 | 10 | IgG binding |
| GO:0004398 | 0.0057 | Inf | 0.0057 | 1 | 1 | histidine decarboxylase activity |
| GO:0004941 | 0.0057 | Inf | 0.0057 | 1 | 1 | beta2-adrenergic receptor activity |
| GO:0016519 | 0.0057 | Inf | 0.0057 | 1 | 1 | gastric inhibitory peptide receptor activity |
| GO:0033676 | 0.0057 | Inf | 0.0057 | 1 | 1 | double-stranded DNA-dependent ATPase activity |
| GO:0102116 | 0.0057 | Inf | 0.0057 | 1 | 1 | laurate hydroxylase activity |
| GO:0102339 | 0.0057 | Inf | 0.0057 | 1 | 1 | 3-oxo-arachidoyl-CoA reductase activity |
| GO:0102340 | 0.0057 | Inf | 0.0057 | 1 | 1 | 3-oxo-behenoyl-CoA reductase activity |
| GO:0102341 | 0.0057 | Inf | 0.0057 | 1 | 1 | 3-oxo-lignoceroyl-CoA reductase activity |
| GO:0102342 | 0.0057 | Inf | 0.0057 | 1 | 1 | 3-oxo-cerotoyl-CoA reductase activity |
| GO:0103002 | 0.0057 | Inf | 0.0057 | 1 | 1 | 16-hydroxypalmitate dehydrogenase activity |
| GO:0005518 | 0.006 | 8.7265 | 0.369 | 3 | 65 | collagen binding |
| GO:0044877 | 0.0085 | 2.3782 | 5.4956 | 12 | 968 | macromolecular complex binding |
| GOMFID | Pvalue | OddsRatio | ExpCount | Count | Size | Term |
| GO:0008131 | 4e-04 | 116.3986 | 0.0346 | 2 | 4 | primary amine oxidase activity |
| GO:0004476 | 0.0086 | Inf | 0.0086 | 1 | 1 | mannose-6-phosphate isomerase activity |
| GO:0015130 | 0.0086 | Inf | 0.0086 | 1 | 1 | mevalonate transmembrane transporter activity |
| GO:0033862 | 0.0086 | Inf | 0.0086 | 1 | 1 | UMP kinase activity |
| GO:0035757 | 0.0086 | Inf | 0.0086 | 1 | 1 | chemokine (C-C motif) ligand 19 binding |
| GO:0035758 | 0.0086 | Inf | 0.0086 | 1 | 1 | chemokine (C-C motif) ligand 21 binding |
| GO:0038117 | 0.0086 | Inf | 0.0086 | 1 | 1 | C-C motif chemokine 19 receptor activity |
| GO:0038121 | 0.0086 | Inf | 0.0086 | 1 | 1 | C-C motif chemokine 21 receptor activity |
| GO:0042947 | 0.0086 | Inf | 0.0086 | 1 | 1 | glucoside transmembrane transporter activity |
| GO:0070463 | 0.0086 | Inf | 0.0086 | 1 | 1 | tubulin-dependent ATPase activity |
| GO:0046625 | 0.0093 | 15.5072 | 0.1469 | 2 | 17 | sphingolipid binding |
| GOMFID | Pvalue | OddsRatio | ExpCount | Count | Size | Term |
| GO:0001128 | 0.0059 | Inf | 0.0059 | 1 | 1 | RNA polymerase II transcription coactivator activity involved in preinitiation complex assembly |
| GO:0004838 | 0.0059 | Inf | 0.0059 | 1 | 1 | L-tyrosine:2-oxoglutarate aminotransferase activity |
| GO:0005519 | 0.0059 | Inf | 0.0059 | 1 | 1 | cytoskeletal regulatory protein binding |
| GO:0015105 | 0.0059 | Inf | 0.0059 | 1 | 1 | arsenite transmembrane transporter activity |
| GO:0036220 | 0.0059 | Inf | 0.0059 | 1 | 1 | ITP diphosphatase activity |
| GO:0036222 | 0.0059 | Inf | 0.0059 | 1 | 1 | XTP diphosphatase activity |
| GO:0017056 | 0.0062 | 19.0201 | 0.1185 | 2 | 20 | structural constituent of nuclear pore |
| GOMFID | Pvalue | OddsRatio | ExpCount | Count | Size | Term |
| GO:0008494 | 6e-04 | 76.6381 | 0.0396 | 2 | 6 | translation activator activity |
| GO:0048020 | 0.0022 | 12.8702 | 0.2575 | 3 | 39 | CCR chemokine receptor binding |
| GO:0008499 | 0.0037 | 25.5333 | 0.0924 | 2 | 14 | UDP-galactose:beta-N-acetylglucosamine beta-1,3-galactosyltransferase activity |
| GO:0008009 | 0.0039 | 10.2904 | 0.3169 | 3 | 48 | chemokine activity |
| GO:0003844 | 0.0066 | Inf | 0.0066 | 1 | 1 | 1,4-alpha-glucan branching enzyme activity |
| GO:0047888 | 0.0066 | Inf | 0.0066 | 1 | 1 | fatty acid peroxidase activity |
| GO:0102752 | 0.0066 | Inf | 0.0066 | 1 | 1 | 1,4-alpha-glucan branching enzyme activity (using a glucosylated glycogenin as primer for glycogen synthesis) |
| GOMFID | Pvalue | OddsRatio | ExpCount | Count | Size | Term |
| GO:0001851 | 0.001 | 76.8894 | 0.0518 | 2 | 4 | complement component C3b binding |
| GO:0004723 | 0.0024 | 38.4399 | 0.0778 | 2 | 6 | calcium-dependent protein serine/threonine phosphatase activity |
| GO:0022839 | 0.0025 | 7.7451 | 0.5702 | 4 | 44 | ion gated channel activity |
| GO:0005217 | 0.0055 | 9.258 | 0.3629 | 3 | 28 | intracellular ligand-gated ion channel activity |
| GO:0022834 | 0.007 | 3.7645 | 1.6847 | 6 | 130 | ligand-gated channel activity |
| GO:0022838 | 0.0076 | 2.3629 | 5.3391 | 12 | 412 | substrate-specific channel activity |
| GOMFID | Pvalue | OddsRatio | ExpCount | Count | Size | Term |
| GO:0001851 | 0.0011 | 73.659 | 0.0541 | 2 | 4 | complement component C3b binding |
| GO:0005547 | 0.0011 | 9.8952 | 0.4595 | 4 | 34 | phosphatidylinositol-3,4,5-trisphosphate binding |
| GO:0005515 | 0.0016 | 1.5914 | 145.4955 | 166 | 10766 | protein binding |
| GO:0070300 | 0.0017 | 14.788 | 0.2433 | 3 | 18 | phosphatidic acid binding |
| GO:0004723 | 0.0026 | 36.8249 | 0.0811 | 2 | 6 | calcium-dependent protein serine/threonine phosphatase activity |
| GO:0005217 | 0.0062 | 8.8672 | 0.3784 | 3 | 28 | intracellular ligand-gated ion channel activity |
| GO:0005546 | 0.0078 | 5.4891 | 0.7838 | 4 | 58 | phosphatidylinositol-4,5-bisphosphate binding |
| GO:0010314 | 0.0092 | 16.3615 | 0.1487 | 2 | 11 | phosphatidylinositol-5-phosphate binding |
| GO:0043295 | 0.0092 | 16.3615 | 0.1487 | 2 | 11 | glutathione binding |
| GOMFID | Pvalue | OddsRatio | ExpCount | Count | Size | Term |
| GO:0031726 | 5e-04 | 97.5152 | 0.0346 | 2 | 5 | CCR1 chemokine receptor binding |
| GO:0004908 | 7e-04 | 73.1318 | 0.0415 | 2 | 6 | interleukin-1 receptor activity |
| GO:0004126 | 0.0013 | 48.7485 | 0.0553 | 2 | 8 | cytidine deaminase activity |
| GO:0030545 | 0.0016 | 3.317 | 3.2622 | 10 | 472 | receptor regulator activity |
| GO:0004875 | 0.0021 | 36.5568 | 0.0691 | 2 | 10 | complement receptor activity |
| GO:0030548 | 0.0021 | 36.5568 | 0.0691 | 2 | 10 | acetylcholine receptor regulator activity |
| GO:0004872 | 0.0029 | 2.1641 | 10.2911 | 20 | 1489 | receptor activity |
| GO:0042834 | 0.0035 | 26.5818 | 0.0898 | 2 | 13 | peptidoglycan binding |
| GO:0008009 | 0.0044 | 9.8153 | 0.3317 | 3 | 48 | chemokine activity |
| GO:0008289 | 0.0048 | 2.6732 | 4.4302 | 11 | 641 | lipid binding |
| GO:0008201 | 0.0048 | 4.8684 | 1.092 | 5 | 158 | heparin binding |
| GO:0008329 | 0.006 | 19.4885 | 0.1175 | 2 | 17 | signaling pattern recognition receptor activity |
| GO:0002113 | 0.0069 | Inf | 0.0069 | 1 | 1 | interleukin-33 binding |
| GO:0008829 | 0.0069 | Inf | 0.0069 | 1 | 1 | dCTP deaminase activity |
| GO:0016495 | 0.0069 | Inf | 0.0069 | 1 | 1 | C-X3-C chemokine receptor activity |
| GO:0016501 | 0.0069 | Inf | 0.0069 | 1 | 1 | prostacyclin receptor activity |
| GO:0042008 | 0.0069 | Inf | 0.0069 | 1 | 1 | interleukin-18 receptor activity |
| GO:0042356 | 0.0069 | Inf | 0.0069 | 1 | 1 | GDP-4-dehydro-D-rhamnose reductase activity |
| GO:0042497 | 0.0069 | Inf | 0.0069 | 1 | 1 | triacyl lipopeptide binding |
| GO:0050577 | 0.0069 | Inf | 0.0069 | 1 | 1 | GDP-L-fucose synthase activity |
| GO:0071566 | 0.0069 | Inf | 0.0069 | 1 | 1 | UFM1 activating enzyme activity |
| GO:0086040 | 0.0069 | Inf | 0.0069 | 1 | 1 | sodium:proton antiporter activity involved in regulation of cardiac muscle cell membrane potential |
| GO:0005546 | 0.0075 | 8.0257 | 0.4009 | 3 | 58 | phosphatidylinositol-4,5-bisphosphate binding |
| GO:0004298 | 0.0091 | 15.3818 | 0.1451 | 2 | 21 | threonine-type endopeptidase activity |
| GOMFID | Pvalue | OddsRatio | ExpCount | Count | Size | Term |
| GO:0008009 | 4e-04 | 12.9075 | 0.3466 | 4 | 48 | chemokine activity |
| GO:0031726 | 5e-04 | 93.2464 | 0.0361 | 2 | 5 | CCR1 chemokine receptor binding |
| GO:0030545 | 6e-04 | 3.5177 | 3.4078 | 11 | 472 | receptor regulator activity |
| GO:0008289 | 0.0023 | 2.8088 | 4.628 | 12 | 641 | lipid binding |
| GO:0005126 | 0.003 | 3.9355 | 1.8989 | 7 | 263 | cytokine receptor binding |
| GO:0023026 | 0.0058 | 19.9677 | 0.1155 | 2 | 16 | MHC class II protein complex binding |
| GO:0005125 | 0.0065 | 4.5106 | 1.175 | 5 | 168 | cytokine activity |
| GO:0008554 | 0.0072 | Inf | 0.0072 | 1 | 1 | sodium-exporting ATPase activity, phosphorylative mechanism |
| GO:0015126 | 0.0072 | Inf | 0.0072 | 1 | 1 | canalicular bile acid transmembrane transporter activity |
| GO:0016495 | 0.0072 | Inf | 0.0072 | 1 | 1 | C-X3-C chemokine receptor activity |
| GO:0016501 | 0.0072 | Inf | 0.0072 | 1 | 1 | prostacyclin receptor activity |
| GO:0035438 | 0.0072 | Inf | 0.0072 | 1 | 1 | cyclic-di-GMP binding |
| GO:0036470 | 0.0072 | Inf | 0.0072 | 1 | 1 | tyrosine 3-monooxygenase activator activity |
| GO:0036478 | 0.0072 | Inf | 0.0072 | 1 | 1 | L-dopa decarboxylase activator activity |
| GO:0036524 | 0.0072 | Inf | 0.0072 | 1 | 1 | protein deglycase activity |
| GO:0042497 | 0.0072 | Inf | 0.0072 | 1 | 1 | triacyl lipopeptide binding |
| GO:0045340 | 0.0072 | Inf | 0.0072 | 1 | 1 | mercury ion binding |
| GO:0047323 | 0.0072 | Inf | 0.0072 | 1 | 1 | [3-methyl-2-oxobutanoate dehydrogenase (acetyl-transferring)] kinase activity |
| GO:0061507 | 0.0072 | Inf | 0.0072 | 1 | 1 | cyclic-GMP-AMP binding |
| GO:0071566 | 0.0072 | Inf | 0.0072 | 1 | 1 | UFM1 activating enzyme activity |
| GO:0086040 | 0.0072 | Inf | 0.0072 | 1 | 1 | sodium:proton antiporter activity involved in regulation of cardiac muscle cell membrane potential |
| GO:0005546 | 0.0085 | 7.6713 | 0.4188 | 3 | 58 | phosphatidylinositol-4,5-bisphosphate binding |
| GOMFID | Pvalue | OddsRatio | ExpCount | Count | Size | Term |
| GO:0004953 | 1e-04 | 39.1534 | 0.0994 | 3 | 14 | icosanoid receptor activity |
| GO:0004095 | 3e-04 | 142.3717 | 0.0284 | 2 | 4 | carnitine O-palmitoyltransferase activity |
| GO:0016409 | 0.0021 | 13.0333 | 0.2555 | 3 | 36 | palmitoyltransferase activity |
| GO:0016653 | 0.0031 | 28.4602 | 0.0852 | 2 | 12 | oxidoreductase activity, acting on NAD(P)H, heme protein as acceptor |
| GO:0008374 | 0.0037 | 10.485 | 0.3122 | 3 | 44 | O-acyltransferase activity |
| GO:0030547 | 0.0063 | 18.9676 | 0.1206 | 2 | 17 | receptor inhibitor activity |
| GO:0001631 | 0.0071 | Inf | 0.0071 | 1 | 1 | cysteinyl leukotriene receptor activity |
| GO:0004037 | 0.0071 | Inf | 0.0071 | 1 | 1 | allantoicase activity |
| GO:0004654 | 0.0071 | Inf | 0.0071 | 1 | 1 | polyribonucleotide nucleotidyltransferase activity |
| GO:0031768 | 0.0071 | Inf | 0.0071 | 1 | 1 | ghrelin receptor binding |
| GO:0051916 | 0.0071 | Inf | 0.0071 | 1 | 1 | granulocyte colony-stimulating factor binding |
| GO:0070463 | 0.0071 | Inf | 0.0071 | 1 | 1 | tubulin-dependent ATPase activity |
| GO:0008373 | 0.0096 | 14.9707 | 0.149 | 2 | 21 | sialyltransferase activity |
| GOMFID | Pvalue | OddsRatio | ExpCount | Count | Size | Term |
| GO:0004984 | 0 | 8.3916 | 1.7124 | 12 | 370 | olfactory receptor activity |
| GO:0004930 | 0 | 5.4319 | 3.6239 | 16 | 783 | G-protein coupled receptor activity |
| GO:0099600 | 1e-04 | 3.3649 | 5.6418 | 16 | 1219 | transmembrane receptor activity |
| GO:0060089 | 2e-04 | 3.0464 | 7.095 | 18 | 1533 | molecular transducer activity |
| GO:0038023 | 2e-04 | 3.1922 | 5.9195 | 16 | 1279 | signaling receptor activity |
| GO:0072341 | 0.0038 | 10.2981 | 0.3147 | 3 | 68 | modified amino acid binding |
| GO:0001631 | 0.0046 | Inf | 0.0046 | 1 | 1 | cysteinyl leukotriene receptor activity |
| GO:0004489 | 0.0046 | Inf | 0.0046 | 1 | 1 | methylenetetrahydrofolate reductase (NAD(P)H) activity |
| GO:0004502 | 0.0046 | Inf | 0.0046 | 1 | 1 | kynurenine 3-monooxygenase activity |
| GO:0004503 | 0.0046 | Inf | 0.0046 | 1 | 1 | monophenol monooxygenase activity |
| GO:0045352 | 0.0046 | Inf | 0.0046 | 1 | 1 | interleukin-1 Type I receptor antagonist activity |
| GO:0045353 | 0.0046 | Inf | 0.0046 | 1 | 1 | interleukin-1 Type II receptor antagonist activity |
| GO:0050129 | 0.0046 | Inf | 0.0046 | 1 | 1 | N-formylglutamate deformylase activity |
| GO:0061609 | 0.0046 | Inf | 0.0046 | 1 | 1 | fructose-1-phosphate aldolase activity |
| GO:0070736 | 0.0046 | Inf | 0.0046 | 1 | 1 | protein-glycine ligase activity, initiating |
| GO:0004063 | 0.0092 | 217.9595 | 0.0093 | 1 | 2 | aryldialkylphosphatase activity |
| GO:0005150 | 0.0092 | 217.9595 | 0.0093 | 1 | 2 | interleukin-1, Type I receptor binding |
| GO:0005151 | 0.0092 | 217.9595 | 0.0093 | 1 | 2 | interleukin-1, Type II receptor binding |
| GO:0050252 | 0.0092 | 217.9595 | 0.0093 | 1 | 2 | retinol O-fatty-acyltransferase activity |
| GO:0061714 | 0.0092 | 217.9595 | 0.0093 | 1 | 2 | folic acid receptor activity |
| GOMFID | Pvalue | OddsRatio | ExpCount | Count | Size | Term |
| GO:0035663 | 3e-04 | 204.3949 | 0.0294 | 2 | 3 | Toll-like receptor 2 binding |
| GO:0071723 | 0.0041 | 25.5382 | 0.0981 | 2 | 10 | lipopeptide binding |
| GO:0004896 | 0.009 | 5.2158 | 0.8144 | 4 | 83 | cytokine receptor activity |
| GO:0004476 | 0.0098 | Inf | 0.0098 | 1 | 1 | mannose-6-phosphate isomerase activity |
| GO:0004504 | 0.0098 | Inf | 0.0098 | 1 | 1 | peptidylglycine monooxygenase activity |
| GO:0004598 | 0.0098 | Inf | 0.0098 | 1 | 1 | peptidylamidoglycolate lyase activity |
| GO:0004633 | 0.0098 | Inf | 0.0098 | 1 | 1 | phosphopantothenoylcysteine decarboxylase activity |
| GO:0004876 | 0.0098 | Inf | 0.0098 | 1 | 1 | complement component C3a receptor activity |
| GO:0004997 | 0.0098 | Inf | 0.0098 | 1 | 1 | thyrotropin-releasing hormone receptor activity |
| GO:0008955 | 0.0098 | Inf | 0.0098 | 1 | 1 | peptidoglycan glycosyltransferase activity |
| GO:0030290 | 0.0098 | Inf | 0.0098 | 1 | 1 | sphingolipid activator protein activity |
| GO:0032428 | 0.0098 | Inf | 0.0098 | 1 | 1 | beta-N-acetylgalactosaminidase activity |
| GO:0035375 | 0.0098 | Inf | 0.0098 | 1 | 1 | zymogen binding |
| GO:0042356 | 0.0098 | Inf | 0.0098 | 1 | 1 | GDP-4-dehydro-D-rhamnose reductase activity |
| GO:0050577 | 0.0098 | Inf | 0.0098 | 1 | 1 | GDP-L-fucose synthase activity |
| GO:0051424 | 0.0098 | Inf | 0.0098 | 1 | 1 | corticotropin-releasing hormone binding |
| GOMFID | Pvalue | OddsRatio | ExpCount | Count | Size | Term |
| GO:0004872 | 3e-04 | 2.6578 | 8.7291 | 20 | 1489 | receptor activity |
| GO:0048020 | 0.0015 | 14.5598 | 0.2286 | 3 | 39 | CCR chemokine receptor binding |
| GO:0008009 | 0.0028 | 11.6413 | 0.2814 | 3 | 48 | chemokine activity |
| GO:0048018 | 0.0046 | 3.2979 | 2.6088 | 8 | 445 | receptor ligand activity |
| GO:0015130 | 0.0059 | Inf | 0.0059 | 1 | 1 | mevalonate transmembrane transporter activity |
| GO:0016519 | 0.0059 | Inf | 0.0059 | 1 | 1 | gastric inhibitory peptide receptor activity |
| GO:0016913 | 0.0059 | Inf | 0.0059 | 1 | 1 | follicle-stimulating hormone activity |
| GO:0017065 | 0.0059 | Inf | 0.0059 | 1 | 1 | single-strand selective uracil DNA N-glycosylase activity |
| GO:0031768 | 0.0059 | Inf | 0.0059 | 1 | 1 | ghrelin receptor binding |
| GO:0031851 | 0.0059 | Inf | 0.0059 | 1 | 1 | kappa-type opioid receptor binding |
| GO:0038051 | 0.0059 | Inf | 0.0059 | 1 | 1 | glucocorticoid-activated RNA polymerase II transcription factor binding transcription factor activity |
| GO:0050429 | 0.0059 | Inf | 0.0059 | 1 | 1 | calcium-dependent phospholipase C activity |
| GO:0004806 | 0.006 | 19.2258 | 0.1172 | 2 | 20 | triglyceride lipase activity |
| GOMFID | Pvalue | OddsRatio | ExpCount | Count | Size | Term |
| GO:0032394 | 0 | Inf | 0.012 | 2 | 2 | MHC class Ib receptor activity |
| GO:0004468 | 5e-04 | 84.7579 | 0.0359 | 2 | 6 | lysine N-acetyltransferase activity, acting on acetyl phosphate as donor |
| GO:0060089 | 7e-04 | 2.5056 | 9.1762 | 20 | 1533 | molecular transducer activity |
| GO:0030246 | 0.001 | 4.8742 | 1.5563 | 7 | 260 | carbohydrate binding |
| GO:0003823 | 0.0035 | 10.6782 | 0.3053 | 3 | 51 | antigen binding |
| GO:0038023 | 0.0037 | 2.3217 | 7.6558 | 16 | 1279 | signaling receptor activity |
| GO:0042288 | 0.0051 | 21.1737 | 0.1077 | 2 | 18 | MHC class I protein binding |
| GO:0099600 | 0.0058 | 2.2644 | 7.2967 | 15 | 1219 | transmembrane receptor activity |
| GO:0005353 | 0.006 | Inf | 0.006 | 1 | 1 | fructose transmembrane transporter activity |
| GO:0016519 | 0.006 | Inf | 0.006 | 1 | 1 | gastric inhibitory peptide receptor activity |
| GO:0031704 | 0.006 | Inf | 0.006 | 1 | 1 | apelin receptor binding |
| GO:0036393 | 0.006 | Inf | 0.006 | 1 | 1 | thiocyanate peroxidase activity |
| GO:0047186 | 0.006 | Inf | 0.006 | 1 | 1 | N-acetylneuraminate 7-O(or 9-O)-acetyltransferase activity |
| GO:0047198 | 0.006 | Inf | 0.006 | 1 | 1 | cysteine-S-conjugate N-acetyltransferase activity |
| GO:1990595 | 0.006 | Inf | 0.006 | 1 | 1 | mast cell secretagogue receptor activity |
| GO:0052689 | 0.0083 | 5.3277 | 0.7961 | 4 | 133 | carboxylic ester hydrolase activity |
| GOMFID | Pvalue | OddsRatio | ExpCount | Count | Size | Term |
| GO:0003823 | 0.0017 | 8.5074 | 0.5161 | 4 | 51 | antigen binding |
| GO:0043015 | 0.002 | 13.5678 | 0.253 | 3 | 25 | gamma-tubulin binding |
| GO:0030881 | 0.0035 | 28.2787 | 0.0911 | 2 | 9 | beta-2-microglobulin binding |
| GO:0032395 | 0.0035 | 28.2787 | 0.0911 | 2 | 9 | MHC class II receptor activity |
| GO:0015125 | 0.0098 | 15.2213 | 0.1518 | 2 | 15 | bile acid transmembrane transporter activity |
| GOMFID | Pvalue | OddsRatio | ExpCount | Count | Size | Term |
| GO:0001851 | 8e-04 | 85.1755 | 0.0469 | 2 | 4 | complement component C3b binding |
| GO:0005537 | 0.001 | 18.3358 | 0.1993 | 3 | 17 | mannose binding |
| GO:0004723 | 0.002 | 42.5824 | 0.0703 | 2 | 6 | calcium-dependent protein serine/threonine phosphatase activity |
| GO:0005516 | 0.0062 | 3.4033 | 2.1691 | 7 | 185 | calmodulin binding |
| NA. |
| n/a |
| NA. |
| n/a |
| NA. |
| n/a |
| NA. |
| n/a |
| NA. |
| n/a |
| NA. |
| n/a |
| NA. |
| n/a |
| NA. |
| n/a |
| NA. |
| n/a |
| NA. |
| n/a |
| NA. |
| n/a |
| NA. |
| n/a |
| NA. |
| n/a |
| NA. |
| n/a |
| NA. |
| n/a |
| NA. |
| n/a |
| NA. |
| n/a |
| NA. |
| n/a |
| NA. |
| n/a |
| NA. |
| n/a |
| NA. |
| n/a |
| NA. |
| n/a |
| NA. |
| n/a |
| NA. |
| n/a |
| NA. |
| n/a |
| NA. |
| n/a |
| NA. |
| n/a |
| NA. |
| n/a |
| NA. |
| n/a |
| NA. |
| n/a |
| NA. |
| n/a |
| NA. |
| n/a |
| NA. |
| n/a |
| NA. |
| n/a |
| NA. |
| n/a |
| NA. |
| n/a |
| NA. |
| n/a |
| NA. |
| n/a |
| NA. |
| n/a |
| NA. |
| n/a |
| NA. |
| n/a |
| NA. |
| n/a |
| NA. |
| n/a |
| NA. |
| n/a |
| NA. |
| n/a |
| NA. |
| n/a |
| NA. |
| n/a |
| NA. |
| n/a |
| NA. |
| n/a |
| NA. |
| n/a |
| NA. |
| n/a |
| NA. |
| n/a |
| NA. |
| n/a |
| NA. |
| n/a |
| NA. |
| n/a |
| NA. |
| n/a |
| GOMFID | Pvalue | OddsRatio | ExpCount | Count | Size | Term |
| GO:2000473 | 2e-04 | Inf | 0.0317 | 2 | 2 | positive regulation of hematopoietic stem cell migration |
| GO:0019373 | 3e-04 | 14.8384 | 0.3326 | 4 | 21 | epoxygenase P450 pathway |
| GO:1900138 | 7e-04 | 125.2627 | 0.0475 | 2 | 3 | negative regulation of phospholipase A2 activity |
| GO:0033559 | 8e-04 | 4.9969 | 1.5202 | 7 | 96 | unsaturated fatty acid metabolic process |
| GO:0002829 | 0.0013 | 17.1378 | 0.2217 | 3 | 14 | negative regulation of type 2 immune response |
| GO:0006690 | 0.0014 | 4.5354 | 1.6628 | 7 | 105 | icosanoid metabolic process |
| GO:0097113 | 0.0015 | 62.6275 | 0.0633 | 2 | 4 | AMPA glutamate receptor clustering |
| GO:0060192 | 0.0016 | 15.7087 | 0.2375 | 3 | 15 | negative regulation of lipase activity |
| GO:1903358 | 0.0016 | 15.7087 | 0.2375 | 3 | 15 | regulation of Golgi organization |
| GO:0017144 | 0.0018 | 8.6918 | 0.5226 | 4 | 33 | drug metabolic process |
| GO:0036315 | 0.0019 | 14.4994 | 0.2534 | 3 | 16 | cellular response to sterol |
| GO:0032747 | 0.0024 | 41.749 | 0.0792 | 2 | 5 | positive regulation of interleukin-23 production |
| GO:0055059 | 0.0024 | 41.749 | 0.0792 | 2 | 5 | asymmetric neuroblast division |
| GO:0050911 | 0.0024 | 2.52 | 5.8751 | 14 | 371 | detection of chemical stimulus involved in sensory perception of smell |
| GO:0002548 | 0.003 | 5.5399 | 0.9818 | 5 | 62 | monocyte chemotaxis |
| GO:0001676 | 0.0032 | 4.4679 | 1.4411 | 6 | 91 | long-chain fatty acid metabolic process |
| GO:0050730 | 0.0036 | 2.9122 | 3.6264 | 10 | 229 | regulation of peptidyl-tyrosine phosphorylation |
| GO:0010256 | 0.0038 | 2.3897 | 6.176 | 14 | 390 | endomembrane system organization |
| GO:0071800 | 0.0042 | 10.4685 | 0.3326 | 3 | 21 | podosome assembly |
| GO:0072578 | 0.005 | 25.0463 | 0.1109 | 2 | 7 | neurotransmitter-gated ion channel clustering |
| GO:0007214 | 0.0055 | 9.4205 | 0.3642 | 3 | 23 | gamma-aminobutyric acid signaling pathway |
| GO:0010894 | 0.0055 | 9.4205 | 0.3642 | 3 | 23 | negative regulation of steroid biosynthetic process |
| GO:0009593 | 0.0055 | 2.2139 | 7.1261 | 15 | 450 | detection of chemical stimulus |
| GO:0006805 | 0.0062 | 3.872 | 1.6469 | 6 | 104 | xenobiotic metabolic process |
| GO:0007341 | 0.0066 | 20.8706 | 0.1267 | 2 | 8 | penetration of zona pellucida |
| GO:0008627 | 0.0066 | 20.8706 | 0.1267 | 2 | 8 | intrinsic apoptotic signaling pathway in response to osmotic stress |
| GO:0032933 | 0.0066 | 20.8706 | 0.1267 | 2 | 8 | SREBP signaling pathway |
| GO:0060534 | 0.0066 | 20.8706 | 0.1267 | 2 | 8 | trachea cartilage development |
| GO:1905906 | 0.0066 | 20.8706 | 0.1267 | 2 | 8 | regulation of amyloid fibril formation |
| GO:0061037 | 0.007 | 8.563 | 0.3959 | 3 | 25 | negative regulation of cartilage development |
| GO:0010469 | 0.0082 | 2.0089 | 8.8839 | 17 | 561 | regulation of receptor activity |
| GO:0045833 | 0.0083 | 4.2627 | 1.251 | 5 | 79 | negative regulation of lipid metabolic process |
| GO:0006991 | 0.0084 | 17.888 | 0.1425 | 2 | 9 | response to sterol depletion |
| GO:0010873 | 0.0084 | 17.888 | 0.1425 | 2 | 9 | positive regulation of cholesterol esterification |
| GO:0034382 | 0.0084 | 17.888 | 0.1425 | 2 | 9 | chylomicron remnant clearance |
| GO:0034447 | 0.0084 | 17.888 | 0.1425 | 2 | 9 | very-low-density lipoprotein particle clearance |
| GO:0097267 | 0.0084 | 17.888 | 0.1425 | 2 | 9 | omega-hydroxylase P450 pathway |
| GO:0061099 | 0.0087 | 7.8484 | 0.4276 | 3 | 27 | negative regulation of protein tyrosine kinase activity |
| GO:0070098 | 0.0088 | 4.2056 | 1.2669 | 5 | 80 | chemokine-mediated signaling pathway |
| GO:0046631 | 0.0092 | 3.5443 | 1.7895 | 6 | 113 | alpha-beta T cell activation |
| GO:0070555 | 0.0092 | 3.5443 | 1.7895 | 6 | 113 | response to interleukin-1 |
| GO:0009410 | 0.01 | 3.4789 | 1.8211 | 6 | 115 | response to xenobiotic stimulus |
| GOMFID | Pvalue | OddsRatio | ExpCount | Count | Size | Term |
| GO:0050911 | 1e-04 | 4.4979 | 2.6975 | 11 | 371 | detection of chemical stimulus involved in sensory perception of smell |
| GO:0032269 | 2e-04 | 2.6974 | 8.856 | 21 | 1218 | negative regulation of cellular protein metabolic process |
| GO:0009593 | 4e-04 | 3.67 | 3.2719 | 11 | 450 | detection of chemical stimulus |
| GO:0042256 | 5e-04 | 92.5747 | 0.0364 | 2 | 5 | mature ribosome assembly |
| GO:0050906 | 5e-04 | 3.5696 | 3.3592 | 11 | 462 | detection of stimulus involved in sensory perception |
| GO:0007606 | 6e-04 | 3.5214 | 3.4028 | 11 | 468 | sensory perception of chemical stimulus |
| GO:0015031 | 0.0011 | 2.1303 | 13.9093 | 26 | 1913 | protein transport |
| GO:0042886 | 0.0017 | 2.0619 | 14.3092 | 26 | 1968 | amide transport |
| GO:0016559 | 0.0018 | 39.665 | 0.0654 | 2 | 9 | peroxisome fission |
| GO:0030101 | 0.002 | 8.1576 | 0.5308 | 4 | 73 | natural killer cell activation |
| GO:0043043 | 0.002 | 2.6177 | 5.8313 | 14 | 802 | peptide biosynthetic process |
| GO:0006364 | 0.0021 | 4.2059 | 1.7814 | 7 | 245 | rRNA processing |
| GO:0019731 | 0.0026 | 11.9821 | 0.2763 | 3 | 38 | antibacterial humoral response |
| GO:0060252 | 0.0028 | 30.8467 | 0.08 | 2 | 11 | positive regulation of glial cell proliferation |
| GO:0031397 | 0.0031 | 5.4394 | 0.9816 | 5 | 135 | negative regulation of protein ubiquitination |
| GO:0090305 | 0.0038 | 3.7565 | 1.985 | 7 | 273 | nucleic acid phosphodiester bond hydrolysis |
| GO:0042100 | 0.0042 | 6.5381 | 0.6544 | 4 | 90 | B cell proliferation |
| GO:0035278 | 0.0043 | 9.9807 | 0.3272 | 3 | 45 | miRNA mediated inhibition of translation |
| GO:0045974 | 0.0043 | 9.9807 | 0.3272 | 3 | 45 | regulation of translation, ncRNA-mediated |
| GO:0000302 | 0.0044 | 4.1566 | 1.5342 | 6 | 211 | response to reactive oxygen species |
| GO:1990845 | 0.0045 | 23.1307 | 0.1018 | 2 | 14 | adaptive thermogenesis |
| GO:0002286 | 0.0049 | 6.246 | 0.6835 | 4 | 94 | T cell activation involved in immune response |
| GO:0022408 | 0.0049 | 4.8385 | 1.0979 | 5 | 151 | negative regulation of cell-cell adhesion |
| GO:0006959 | 0.0052 | 4.0176 | 1.5851 | 6 | 218 | humoral immune response |
| GO:0002520 | 0.0052 | 2.3383 | 6.4784 | 14 | 891 | immune system development |
| GO:0050868 | 0.0057 | 5.9787 | 0.7126 | 4 | 98 | negative regulation of T cell activation |
| GO:0051452 | 0.0057 | 8.9162 | 0.3635 | 3 | 50 | intracellular pH reduction |
| GO:0030097 | 0.0059 | 2.3852 | 5.8749 | 13 | 808 | hemopoiesis |
| GO:0051246 | 0.0059 | 1.7762 | 19.7988 | 31 | 2723 | regulation of protein metabolic process |
| GO:0098542 | 0.0064 | 2.867 | 3.3446 | 9 | 460 | defense response to other organism |
| GO:0007597 | 0.0066 | 18.5011 | 0.1236 | 2 | 17 | blood coagulation, intrinsic pathway |
| GO:0045727 | 0.007 | 5.6179 | 0.7562 | 4 | 104 | positive regulation of translation |
| GO:0010232 | 0.0073 | Inf | 0.0073 | 1 | 1 | vascular transport |
| GO:0010920 | 0.0073 | Inf | 0.0073 | 1 | 1 | negative regulation of inositol phosphate biosynthetic process |
| GO:0010925 | 0.0073 | Inf | 0.0073 | 1 | 1 | positive regulation of inositol-polyphosphate 5-phosphatase activity |
| GO:0030845 | 0.0073 | Inf | 0.0073 | 1 | 1 | phospholipase C-inhibiting G-protein coupled receptor signaling pathway |
| GO:0042543 | 0.0073 | Inf | 0.0073 | 1 | 1 | protein N-linked glycosylation via arginine |
| GO:0043381 | 0.0073 | Inf | 0.0073 | 1 | 1 | negative regulation of memory T cell differentiation |
| GO:0044795 | 0.0073 | Inf | 0.0073 | 1 | 1 | trans-Golgi network to recycling endosome transport |
| GO:0045660 | 0.0073 | Inf | 0.0073 | 1 | 1 | positive regulation of neutrophil differentiation |
| GO:0060305 | 0.0073 | Inf | 0.0073 | 1 | 1 | regulation of cell diameter |
| GO:0070946 | 0.0073 | Inf | 0.0073 | 1 | 1 | neutrophil mediated killing of gram-positive bacterium |
| GO:1900131 | 0.0073 | Inf | 0.0073 | 1 | 1 | negative regulation of lipid binding |
| GO:1904586 | 0.0073 | Inf | 0.0073 | 1 | 1 | cellular response to putrescine |
| GO:1990828 | 0.0073 | Inf | 0.0073 | 1 | 1 | hepatocyte dedifferentiation |
| GO:0001101 | 0.0078 | 3.2681 | 2.2685 | 7 | 312 | response to acid chemical |
| GO:0009057 | 0.008 | 2.0544 | 8.9941 | 17 | 1237 | macromolecule catabolic process |
| GO:0010608 | 0.0082 | 2.469 | 4.7625 | 11 | 655 | posttranscriptional regulation of gene expression |
| GO:0000717 | 0.0091 | 15.4148 | 0.1454 | 2 | 20 | nucleotide-excision repair, DNA duplex unwinding |
| GO:1904380 | 0.0091 | 15.4148 | 0.1454 | 2 | 20 | endoplasmic reticulum mannose trimming |
| GO:1990542 | 0.0091 | 15.4148 | 0.1454 | 2 | 20 | mitochondrial transmembrane transport |
| GOMFID | Pvalue | OddsRatio | ExpCount | Count | Size | Term |
| GO:0006333 | 1e-04 | 5.03 | 1.9434 | 9 | 166 | chromatin assembly or disassembly |
| GO:1902036 | 0.0011 | 5.5912 | 1.159 | 6 | 99 | regulation of hematopoietic stem cell differentiation |
| GO:0045653 | 0.0011 | 17.138 | 0.2107 | 3 | 18 | negative regulation of megakaryocyte differentiation |
| GO:0006342 | 0.0013 | 6.7384 | 0.8083 | 5 | 70 | chromatin silencing |
| GO:0035609 | 0.0013 | 56.8652 | 0.0585 | 2 | 5 | C-terminal protein deglutamylation |
| GO:0006323 | 0.0014 | 3.9847 | 2.1425 | 8 | 183 | DNA packaging |
| GO:0002244 | 0.0015 | 3.9618 | 2.1542 | 8 | 184 | hematopoietic progenitor cell differentiation |
| GO:0060760 | 0.0019 | 8.3913 | 0.5268 | 4 | 45 | positive regulation of response to cytokine stimulus |
| GO:0071824 | 0.0024 | 3.3296 | 2.8683 | 9 | 245 | protein-DNA complex subunit organization |
| GO:0042787 | 0.0032 | 3.4811 | 2.4351 | 8 | 208 | protein ubiquitination involved in ubiquitin-dependent protein catabolic process |
| GO:1903265 | 0.0036 | 28.4273 | 0.0937 | 2 | 8 | positive regulation of tumor necrosis factor-mediated signaling pathway |
| GO:0016233 | 0.0039 | 6.7417 | 0.6439 | 4 | 55 | telomere capping |
| GO:0006334 | 0.0041 | 5.0869 | 1.0506 | 5 | 91 | nucleosome assembly |
| GO:0006801 | 0.0053 | 6.1379 | 0.7024 | 4 | 60 | superoxide metabolic process |
| GO:0006335 | 0.0061 | 8.8567 | 0.3746 | 3 | 32 | DNA replication-dependent nucleosome assembly |
| GO:0098787 | 0.007 | 18.948 | 0.1288 | 2 | 11 | mRNA cleavage involved in mRNA processing |
| GO:0000183 | 0.0072 | 8.2843 | 0.3981 | 3 | 34 | chromatin silencing at rDNA |
| GO:1903507 | 0.0073 | 1.8434 | 13.3231 | 23 | 1138 | negative regulation of nucleic acid-templated transcription |
| GO:0006690 | 0.0078 | 4.3078 | 1.2293 | 5 | 105 | icosanoid metabolic process |
| GO:0003184 | 0.0083 | 17.0521 | 0.1405 | 2 | 12 | pulmonary valve morphogenesis |
| GO:0016572 | 0.0085 | 7.7812 | 0.4215 | 3 | 36 | histone phosphorylation |
| GO:0009617 | 0.009 | 2.2273 | 6.1464 | 13 | 525 | response to bacterium |
| GO:0030433 | 0.0096 | 5.1266 | 0.8312 | 4 | 71 | ubiquitin-dependent ERAD pathway |
| GOMFID | Pvalue | OddsRatio | ExpCount | Count | Size | Term |
| GO:0070098 | 0 | 13.6715 | 0.8725 | 10 | 80 | chemokine-mediated signaling pathway |
| GO:0097530 | 0 | 9.5165 | 1.3306 | 11 | 122 | granulocyte migration |
| GO:0035195 | 0 | 5.5645 | 2.8139 | 14 | 258 | gene silencing by miRNA |
| GO:0016441 | 0 | 5.4069 | 2.8902 | 14 | 265 | posttranscriptional gene silencing |
| GO:0034249 | 0 | 4.4715 | 3.9808 | 16 | 365 | negative regulation of cellular amide metabolic process |
| GO:0031047 | 0 | 4.9459 | 3.141 | 14 | 288 | gene silencing by RNA |
| GO:0030593 | 0 | 12.6334 | 0.6444 | 7 | 60 | neutrophil chemotaxis |
| GO:0060326 | 0 | 5.0722 | 2.8357 | 13 | 260 | cell chemotaxis |
| GO:0048247 | 0 | 10.7962 | 0.6326 | 6 | 58 | lymphocyte chemotaxis |
| GO:0002548 | 1e-04 | 10.0226 | 0.6762 | 6 | 62 | monocyte chemotaxis |
| GO:0071346 | 2e-04 | 5.7092 | 1.5269 | 8 | 140 | cellular response to interferon-gamma |
| GO:0043043 | 2e-04 | 2.6322 | 8.7469 | 21 | 802 | peptide biosynthetic process |
| GO:0016339 | 2e-04 | 15.4412 | 0.3054 | 4 | 28 | calcium-dependent cell-cell adhesion via plasma membrane cell adhesion molecules |
| GO:0050900 | 2e-04 | 3.93 | 3.0255 | 11 | 285 | leukocyte migration |
| GO:0061044 | 4e-04 | 183.44 | 0.0327 | 2 | 3 | negative regulation of vascular wound healing |
| GO:0042330 | 4e-04 | 2.8276 | 6.1185 | 16 | 561 | taxis |
| GO:0071347 | 5e-04 | 6.67 | 0.9816 | 6 | 90 | cellular response to interleukin-1 |
| GO:0050921 | 5e-04 | 5.4213 | 1.396 | 7 | 128 | positive regulation of chemotaxis |
| GO:0006417 | 7e-04 | 2.8103 | 5.7477 | 15 | 527 | regulation of translation |
| GO:0071310 | 8e-04 | 1.8405 | 25.7718 | 42 | 2363 | cellular response to organic substance |
| GO:0034097 | 8e-04 | 2.2844 | 10.4811 | 22 | 961 | response to cytokine |
| GO:0098609 | 9e-04 | 2.4163 | 8.507 | 19 | 780 | cell-cell adhesion |
| GO:0002688 | 0.0011 | 5.5972 | 1.1561 | 6 | 106 | regulation of leukocyte chemotaxis |
| GO:0022610 | 0.0011 | 2.0529 | 14.4074 | 27 | 1321 | biological adhesion |
| GO:0061302 | 0.0012 | 61.139 | 0.0545 | 2 | 5 | smooth muscle cell-matrix adhesion |
| GO:0007156 | 0.0014 | 4.5172 | 1.6578 | 7 | 152 | homophilic cell adhesion via plasma membrane adhesion molecules |
| GO:2000503 | 0.0017 | 45.8514 | 0.0654 | 2 | 6 | positive regulation of natural killer cell chemotaxis |
| GO:0042221 | 0.0021 | 1.6084 | 45.4579 | 63 | 4168 | response to chemical |
| GO:0002687 | 0.0021 | 4.8625 | 1.3197 | 6 | 121 | positive regulation of leukocyte migration |
| GO:0007186 | 0.0024 | 1.9872 | 13.6548 | 25 | 1252 | G-protein coupled receptor signaling pathway |
| GO:0030901 | 0.0025 | 5.7318 | 0.938 | 5 | 86 | midbrain development |
| GO:0006954 | 0.0027 | 2.3473 | 7.2855 | 16 | 668 | inflammatory response |
| GO:1902806 | 0.0028 | 3.9647 | 1.8759 | 7 | 172 | regulation of cell cycle G1/S phase transition |
| GO:0071356 | 0.003 | 3.2286 | 2.9556 | 9 | 271 | cellular response to tumor necrosis factor |
| GO:0006955 | 0.003 | 1.7954 | 20.1768 | 33 | 1850 | immune response |
| GO:0002480 | 0.0032 | 30.5638 | 0.0873 | 2 | 8 | antigen processing and presentation of exogenous peptide antigen via MHC class I, TAP-independent |
| GO:0010940 | 0.0032 | 30.5638 | 0.0873 | 2 | 8 | positive regulation of necrotic cell death |
| GO:1900165 | 0.0032 | 30.5638 | 0.0873 | 2 | 8 | negative regulation of interleukin-6 secretion |
| GO:0042127 | 0.0032 | 1.8491 | 17.0903 | 29 | 1567 | regulation of cell proliferation |
| GO:0007166 | 0.0033 | 1.6733 | 28.6402 | 43 | 2626 | cell surface receptor signaling pathway |
| GO:0051707 | 0.0034 | 2.1755 | 8.856 | 18 | 812 | response to other organism |
| GO:0010469 | 0.0034 | 2.4346 | 6.1185 | 14 | 561 | regulation of receptor activity |
| GO:0090023 | 0.0034 | 11.0531 | 0.3054 | 3 | 28 | positive regulation of neutrophil chemotaxis |
| GO:0019080 | 0.0041 | 3.6931 | 2.0068 | 7 | 184 | viral gene expression |
| GO:0002682 | 0.0042 | 1.8706 | 15.0399 | 26 | 1379 | regulation of immune system process |
| GO:1900087 | 0.0046 | 9.867 | 0.3381 | 3 | 31 | positive regulation of G1/S transition of mitotic cell cycle |
| GO:0006952 | 0.0049 | 2.146 | 8.484 | 17 | 820 | defense response |
| GO:0035589 | 0.005 | 22.92 | 0.1091 | 2 | 10 | G-protein coupled purinergic nucleotide receptor signaling pathway |
| GO:0046782 | 0.0052 | 6.1626 | 0.698 | 4 | 64 | regulation of viral transcription |
| GO:0009607 | 0.0058 | 2.0553 | 9.3359 | 18 | 856 | response to biotic stimulus |
| GO:0048870 | 0.0059 | 1.8148 | 15.4544 | 26 | 1417 | cell motility |
| GO:0048245 | 0.0061 | 20.3721 | 0.12 | 2 | 11 | eosinophil chemotaxis |
| GO:0048484 | 0.0061 | 20.3721 | 0.12 | 2 | 11 | enteric nervous system development |
| GO:0050713 | 0.0061 | 20.3721 | 0.12 | 2 | 11 | negative regulation of interleukin-1 beta secretion |
| GO:1902713 | 0.0061 | 20.3721 | 0.12 | 2 | 11 | regulation of interferon-gamma secretion |
| GO:1902622 | 0.0065 | 8.6315 | 0.3817 | 3 | 35 | regulation of neutrophil migration |
| GO:0031295 | 0.0065 | 5.776 | 0.7416 | 4 | 68 | T cell costimulation |
| GO:0050863 | 0.0069 | 2.8129 | 3.3701 | 9 | 309 | regulation of T cell activation |
| GO:0048536 | 0.007 | 8.3694 | 0.3926 | 3 | 36 | spleen development |
| GO:0071542 | 0.007 | 8.3694 | 0.3926 | 3 | 36 | dopaminergic neuron differentiation |
| GO:0043922 | 0.0073 | 18.3337 | 0.1309 | 2 | 12 | negative regulation by host of viral transcription |
| GO:0071280 | 0.0073 | 18.3337 | 0.1309 | 2 | 12 | cellular response to copper ion |
| GO:0044403 | 0.0075 | 2.0418 | 8.8451 | 17 | 811 | symbiosis, encompassing mutualism through parasitism |
| GO:0019722 | 0.008 | 3.6461 | 1.7341 | 6 | 159 | calcium-mediated signaling |
| GO:0071222 | 0.0092 | 3.5296 | 1.7886 | 6 | 164 | cellular response to lipopolysaccharide |
| GO:0070372 | 0.0093 | 2.8752 | 2.9229 | 8 | 268 | regulation of ERK1 and ERK2 cascade |
| GO:0099054 | 0.0099 | 15.2762 | 0.1527 | 2 | 14 | presynapse assembly |
| GO:1901989 | 0.01 | 5.061 | 0.8398 | 4 | 77 | positive regulation of cell cycle phase transition |
| GO:0002237 | 0.01 | 2.6421 | 3.5773 | 9 | 328 | response to molecule of bacterial origin |
| GOMFID | Pvalue | OddsRatio | ExpCount | Count | Size | Term |
| GO:0007186 | 0 | 2.4349 | 17.1264 | 37 | 1252 | G-protein coupled receptor signaling pathway |
| GO:0050911 | 0 | 3.6668 | 5.075 | 17 | 371 | detection of chemical stimulus involved in sensory perception of smell |
| GO:0050906 | 0 | 3.2883 | 6.3198 | 19 | 462 | detection of stimulus involved in sensory perception |
| GO:0009593 | 0 | 3.1812 | 6.1556 | 18 | 450 | detection of chemical stimulus |
| GO:0006952 | 1e-04 | 2.1411 | 20.3547 | 39 | 1488 | defense response |
| GO:0007606 | 1e-04 | 3.0504 | 6.4019 | 18 | 468 | sensory perception of chemical stimulus |
| GO:0071280 | 5e-04 | 24.3501 | 0.1642 | 3 | 12 | cellular response to copper ion |
| GO:0070098 | 8e-04 | 5.9809 | 1.0943 | 6 | 80 | chemokine-mediated signaling pathway |
| GO:0006959 | 9e-04 | 3.5829 | 2.9821 | 10 | 218 | humoral immune response |
| GO:0030183 | 9e-04 | 4.9309 | 1.5321 | 7 | 112 | B cell differentiation |
| GO:0002250 | 0.0011 | 2.8923 | 4.7877 | 13 | 350 | adaptive immune response |
| GO:0048247 | 0.0012 | 6.9359 | 0.7934 | 5 | 58 | lymphocyte chemotaxis |
| GO:0050900 | 0.0014 | 2.6811 | 5.5538 | 14 | 406 | leukocyte migration |
| GO:0009607 | 0.0016 | 2.1054 | 11.7094 | 23 | 856 | response to biotic stimulus |
| GO:0002548 | 0.0016 | 6.4476 | 0.8481 | 5 | 62 | monocyte chemotaxis |
| GO:0002521 | 0.0017 | 2.5283 | 6.3061 | 15 | 461 | leukocyte differentiation |
| GO:0051707 | 0.0018 | 2.1188 | 11.1075 | 22 | 812 | response to other organism |
| GO:0031295 | 0.0024 | 5.8313 | 0.9302 | 5 | 68 | T cell costimulation |
| GO:0019373 | 0.0028 | 12.1682 | 0.2873 | 3 | 21 | epoxygenase P450 pathway |
| GO:0033141 | 0.0028 | 12.1682 | 0.2873 | 3 | 21 | positive regulation of peptidyl-serine phosphorylation of STAT protein |
| GO:0045321 | 0.0031 | 1.8819 | 15.3754 | 27 | 1124 | leukocyte activation |
| GO:0060326 | 0.0032 | 2.973 | 3.5566 | 10 | 260 | cell chemotaxis |
| GO:0060338 | 0.0035 | 6.9747 | 0.6292 | 4 | 46 | regulation of type I interferon-mediated signaling pathway |
| GO:0050863 | 0.0036 | 2.7482 | 4.2269 | 11 | 309 | regulation of T cell activation |
| GO:0007157 | 0.0038 | 6.812 | 0.6429 | 4 | 47 | heterophilic cell-cell adhesion via plasma membrane cell adhesion molecules |
| GO:0042330 | 0.0046 | 2.2035 | 7.674 | 16 | 561 | taxis |
| GO:0071420 | 0.0049 | 24.2439 | 0.1094 | 2 | 8 | cellular response to histamine |
| GO:0090281 | 0.0063 | 20.7792 | 0.1231 | 2 | 9 | negative regulation of calcium ion import |
| GO:0097267 | 0.0063 | 20.7792 | 0.1231 | 2 | 9 | omega-hydroxylase P450 pathway |
| GO:0050690 | 0.0064 | 8.7573 | 0.383 | 3 | 28 | regulation of defense response to virus by virus |
| GO:0071357 | 0.0065 | 4.5304 | 1.1764 | 5 | 86 | cellular response to type I interferon |
| GO:0034341 | 0.0065 | 3.3737 | 2.1887 | 7 | 160 | response to interferon-gamma |
| GO:0042110 | 0.0071 | 4.4321 | 1.1998 | 5 | 92 | T cell activation |
| GO:0002323 | 0.0071 | 8.4199 | 0.3967 | 3 | 29 | natural killer cell activation involved in immune response |
| GO:0030593 | 0.0072 | 4.4206 | 1.2038 | 5 | 88 | neutrophil chemotaxis |
| GO:0002682 | 0.0075 | 1.6978 | 18.8636 | 30 | 1379 | regulation of immune system process |
| GO:0035589 | 0.0078 | 18.1807 | 0.1368 | 2 | 10 | G-protein coupled purinergic nucleotide receptor signaling pathway |
| GO:0050665 | 0.0078 | 18.1807 | 0.1368 | 2 | 10 | hydrogen peroxide biosynthetic process |
| GO:1900087 | 0.0086 | 7.8175 | 0.4241 | 3 | 31 | positive regulation of G1/S transition of mitotic cell cycle |
| GO:0050867 | 0.0088 | 2.5386 | 4.1311 | 10 | 302 | positive regulation of cell activation |
| GO:1903039 | 0.0091 | 2.8816 | 2.9137 | 8 | 213 | positive regulation of leukocyte cell-cell adhesion |
| GO:0019083 | 0.0092 | 3.1452 | 2.3391 | 7 | 171 | viral transcription |
| GO:0046651 | 0.0093 | 2.674 | 3.5292 | 9 | 258 | lymphocyte proliferation |
| GO:0002286 | 0.0094 | 4.1211 | 1.2858 | 5 | 94 | T cell activation involved in immune response |
| GO:0016074 | 0.0094 | 16.1596 | 0.1505 | 2 | 11 | snoRNA metabolic process |
| GO:0042738 | 0.0094 | 16.1596 | 0.1505 | 2 | 11 | exogenous drug catabolic process |
| GO:0051251 | 0.0097 | 2.6524 | 3.5566 | 9 | 260 | positive regulation of lymphocyte activation |
| GOMFID | Pvalue | OddsRatio | ExpCount | Count | Size | Term |
| GO:0046982 | 0 | 3.7946 | 5.562 | 19 | 469 | protein heterodimerization activity |
| GO:0003677 | 0 | 2.0418 | 27.8453 | 49 | 2348 | DNA binding |
| GO:0004082 | 8e-04 | 84.1895 | 0.0474 | 2 | 4 | bisphosphoglycerate mutase activity |
| GO:0046538 | 8e-04 | 84.1895 | 0.0474 | 2 | 4 | 2,3-bisphosphoglycerate-dependent phosphoglycerate mutase activity |
| GO:0001105 | 0.0013 | 9.4338 | 0.4744 | 4 | 40 | RNA polymerase II transcription coactivator activity |
| GO:0051082 | 0.0016 | 5.1805 | 1.2452 | 6 | 105 | unfolded protein binding |
| GO:0001106 | 0.0031 | 11.5267 | 0.2965 | 3 | 25 | RNA polymerase II transcription corepressor activity |
| GO:0016413 | 0.0037 | 28.0561 | 0.0949 | 2 | 8 | O-acetyltransferase activity |
| GO:0016208 | 0.0048 | 24.0466 | 0.1067 | 2 | 9 | AMP binding |
| GO:0070700 | 0.0048 | 24.0466 | 0.1067 | 2 | 9 | BMP receptor binding |
| GO:0019887 | 0.0062 | 3.4015 | 2.1702 | 7 | 183 | protein kinase regulator activity |
| GO:0001055 | 0.0072 | 18.7006 | 0.1305 | 2 | 11 | RNA polymerase II activity |
| GO:0005200 | 0.0076 | 4.3381 | 1.2215 | 5 | 103 | structural constituent of cytoskeleton |
| GO:0003729 | 0.0082 | 2.731 | 3.4629 | 9 | 292 | mRNA binding |
| GO:0004861 | 0.0085 | 16.8295 | 0.1423 | 2 | 12 | cyclin-dependent protein serine/threonine kinase inhibitor activity |
| GO:0001076 | 0.009 | 3.5515 | 1.7789 | 6 | 150 | transcription factor activity, RNA polymerase II transcription factor binding |
| GOMFID | Pvalue | OddsRatio | ExpCount | Count | Size | Term |
| GO:0004082 | 6e-04 | 98.3006 | 0.0408 | 2 | 4 | bisphosphoglycerate mutase activity |
| GO:0046538 | 6e-04 | 98.3006 | 0.0408 | 2 | 4 | 2,3-bisphosphoglycerate-dependent phosphoglycerate mutase activity |
| GO:0016413 | 0.0028 | 32.7587 | 0.0815 | 2 | 8 | O-acetyltransferase activity |
| GO:0070700 | 0.0035 | 28.0771 | 0.0917 | 2 | 9 | BMP receptor binding |
| GO:0001055 | 0.0053 | 21.835 | 0.1121 | 2 | 11 | RNA polymerase II activity |
| GO:1903231 | 0.0056 | 4.6931 | 1.1313 | 5 | 111 | mRNA binding involved in posttranscriptional gene silencing |
| GO:0043394 | 0.0058 | 8.9742 | 0.3669 | 3 | 36 | proteoglycan binding |
| GO:0005125 | 0.0067 | 3.3527 | 2.2014 | 7 | 216 | cytokine activity |
| GO:1904264 | 0.0075 | 17.8628 | 0.1325 | 2 | 13 | ubiquitin protein ligase activity involved in ERAD pathway |
| GO:0004953 | 0.0087 | 16.3732 | 0.1427 | 2 | 14 | icosanoid receptor activity |
| GO:0032183 | 0.0087 | 16.3732 | 0.1427 | 2 | 14 | SUMO binding |
| GO:0033612 | 0.0099 | 15.1128 | 0.1529 | 2 | 15 | receptor serine/threonine kinase binding |
| GOMFID | Pvalue | OddsRatio | ExpCount | Count | Size | Term |
| GO:0005549 | 0 | 13.0366 | 0.6152 | 7 | 83 | odorant binding |
| GO:0004930 | 1e-04 | 3.293 | 5.811 | 17 | 784 | G-protein coupled receptor activity |
| GO:0004984 | 1e-04 | 4.4039 | 2.7498 | 11 | 371 | olfactory receptor activity |
| GO:0047485 | 0.0072 | 5.5629 | 0.7634 | 4 | 103 | protein N-terminus binding |
| GO:0000210 | 0.0074 | Inf | 0.0074 | 1 | 1 | NAD+ diphosphatase activity |
| GO:0004853 | 0.0074 | Inf | 0.0074 | 1 | 1 | uroporphyrinogen decarboxylase activity |
| GO:0031859 | 0.0074 | Inf | 0.0074 | 1 | 1 | platelet activating factor receptor binding |
| GO:0042624 | 0.0074 | Inf | 0.0074 | 1 | 1 | ATPase activity, uncoupled |
| GO:0097726 | 0.0074 | Inf | 0.0074 | 1 | 1 | LEM domain binding |
| GO:0099600 | 0.0086 | 2.0361 | 9.0574 | 17 | 1222 | transmembrane receptor activity |
| GOMFID | Pvalue | OddsRatio | ExpCount | Count | Size | Term |
| GO:0004984 | 0 | 4.6251 | 3.3686 | 14 | 371 | olfactory receptor activity |
| GO:0004930 | 0 | 3.1494 | 7.1185 | 20 | 784 | G-protein coupled receptor activity |
| GO:0005549 | 1e-04 | 8.8234 | 0.7536 | 6 | 83 | odorant binding |
| GO:0099600 | 6e-04 | 2.2963 | 11.0954 | 23 | 1222 | transmembrane receptor activity |
| GO:0038023 | 0.0028 | 2.0667 | 11.6311 | 22 | 1281 | signaling receptor activity |
| GO:0004168 | 0.0091 | Inf | 0.0091 | 1 | 1 | dolichol kinase activity |
| GO:0005144 | 0.0091 | Inf | 0.0091 | 1 | 1 | interleukin-13 receptor binding |
| GO:0031859 | 0.0091 | Inf | 0.0091 | 1 | 1 | platelet activating factor receptor binding |
| GO:0042624 | 0.0091 | Inf | 0.0091 | 1 | 1 | ATPase activity, uncoupled |
| GO:0097726 | 0.0091 | Inf | 0.0091 | 1 | 1 | LEM domain binding |
| GO:0008009 | 0.0094 | 7.4065 | 0.4358 | 3 | 48 | chemokine activity |
| GOMFID | Pvalue | OddsRatio | ExpCount | Count | Size | Term |
| GO:0004792 | 0.0014 | 90.2336 | 0.0654 | 2 | 3 | thiosulfate sulfurtransferase activity |
| GO:0001055 | 0.0015 | 16.9596 | 0.2398 | 3 | 11 | RNA polymerase II activity |
| GO:0004859 | 0.0015 | 16.9596 | 0.2398 | 3 | 11 | phospholipase inhibitor activity |
| GO:0051082 | 0.0021 | 3.7627 | 2.2894 | 8 | 105 | unfolded protein binding |
| GO:0005544 | 0.0026 | 5.8201 | 0.9594 | 5 | 44 | calcium-dependent phospholipid binding |
| GO:0000339 | 0.0047 | 10.4334 | 0.3489 | 3 | 16 | RNA cap binding |
| GO:0060228 | 0.0067 | 22.5541 | 0.1308 | 2 | 6 | phosphatidylcholine-sterol O-acyltransferase activator activity |
| GO:0008327 | 0.0077 | 8.4755 | 0.4143 | 3 | 19 | methyl-CpG binding |
| GOMFID | Pvalue | OddsRatio | ExpCount | Count | Size | Term |
| GO:0004984 | 0 | 8.823 | 1.9249 | 14 | 371 | olfactory receptor activity |
| GO:0004930 | 0 | 4.6991 | 4.0677 | 16 | 784 | G-protein coupled receptor activity |
| GO:0099600 | 2e-04 | 3.1376 | 6.3402 | 17 | 1222 | transmembrane receptor activity |
| GO:0038023 | 3e-04 | 2.9793 | 6.6463 | 17 | 1281 | signaling receptor activity |
| GO:0060089 | 8e-04 | 2.6209 | 7.9694 | 18 | 1536 | molecular transducer activity |
| GO:0005549 | 9e-04 | 10.1437 | 0.4306 | 4 | 83 | odorant binding |
| GO:0005132 | 0.0034 | 26.1642 | 0.0882 | 2 | 17 | type I interferon receptor binding |
| GO:0004343 | 0.0052 | Inf | 0.0052 | 1 | 1 | glucosamine 6-phosphate N-acetyltransferase activity |
| GO:0004509 | 0.0052 | Inf | 0.0052 | 1 | 1 | steroid 21-monooxygenase activity |
| GO:0005133 | 0.0052 | Inf | 0.0052 | 1 | 1 | interferon-gamma receptor binding |
| GO:0015152 | 0.0052 | Inf | 0.0052 | 1 | 1 | glucose-6-phosphate transmembrane transporter activity |
| GO:0033897 | 0.0052 | Inf | 0.0052 | 1 | 1 | ribonuclease T2 activity |
| GO:0033981 | 0.0052 | Inf | 0.0052 | 1 | 1 | D-dopachrome decarboxylase activity |
| GO:0038164 | 0.0052 | Inf | 0.0052 | 1 | 1 | thrombopoietin receptor activity |
| GO:0043325 | 0.0063 | 18.6818 | 0.1193 | 2 | 23 | phosphatidylinositol-3,4-bisphosphate binding |
| GO:0042056 | 0.0099 | 14.5248 | 0.1505 | 2 | 29 | chemoattractant activity |
| GOMFID | Pvalue | OddsRatio | ExpCount | Count | Size | Term |
| GO:0004930 | 0 | 5.1482 | 4.2614 | 18 | 784 | G-protein coupled receptor activity |
| GO:0099600 | 0 | 3.4103 | 6.6421 | 19 | 1222 | transmembrane receptor activity |
| GO:0004984 | 0 | 5.5902 | 2.0166 | 10 | 371 | olfactory receptor activity |
| GO:0038023 | 2e-04 | 3.0212 | 6.9628 | 18 | 1281 | signaling receptor activity |
| GO:0060089 | 2e-04 | 2.8298 | 8.3489 | 20 | 1536 | molecular transducer activity |
| GO:0016493 | 0.0019 | 37.4233 | 0.0652 | 2 | 12 | C-C chemokine receptor activity |
| GO:0005132 | 0.0038 | 24.9411 | 0.0924 | 2 | 17 | type I interferon receptor binding |
| GO:0004462 | 0.0054 | Inf | 0.0054 | 1 | 1 | lactoylglutathione lyase activity |
| GO:0004603 | 0.0054 | Inf | 0.0054 | 1 | 1 | phenylethanolamine N-methyltransferase activity |
| GO:0004946 | 0.0054 | Inf | 0.0054 | 1 | 1 | bombesin receptor activity |
| GO:0001637 | 0.0081 | 16.2578 | 0.1359 | 2 | 25 | G-protein coupled chemoattractant receptor activity |
| GOMFID | Pvalue | OddsRatio | ExpCount | Count | Size | Term |
| GO:0001055 | 3e-04 | 28.9348 | 0.1427 | 3 | 11 | RNA polymerase II activity |
| GO:0000253 | 0.001 | 76.8173 | 0.0519 | 2 | 4 | 3-keto sterol reductase activity |
| GO:0004984 | 0.0034 | 2.6371 | 4.8122 | 12 | 371 | olfactory receptor activity |
| GO:0004950 | 0.004 | 10.5125 | 0.3243 | 3 | 25 | chemokine receptor activity |
| GO:0030957 | 0.007 | 19.1971 | 0.1297 | 2 | 10 | Tat protein binding |
| GOMFID | Pvalue | OddsRatio | ExpCount | Count | Size | Term |
| GO:0004984 | 0 | 10.4398 | 1.9249 | 16 | 371 | olfactory receptor activity |
| GO:0004930 | 0 | 6.2754 | 4.0677 | 20 | 784 | G-protein coupled receptor activity |
| GO:0099600 | 0 | 4.6878 | 6.3402 | 23 | 1222 | transmembrane receptor activity |
| GO:0038023 | 0 | 4.1845 | 6.6463 | 22 | 1281 | signaling receptor activity |
| GO:0060089 | 0 | 3.6367 | 7.9694 | 23 | 1536 | molecular transducer activity |
| GO:0005549 | 1e-04 | 13.0055 | 0.4306 | 5 | 83 | odorant binding |
| GO:1903231 | 3e-04 | 9.5534 | 0.5759 | 5 | 111 | mRNA binding involved in posttranscriptional gene silencing |
| GO:0033038 | 0.0048 | 21.7995 | 0.1038 | 2 | 20 | bitter taste receptor activity |
| GO:0004516 | 0.0052 | Inf | 0.0052 | 1 | 1 | nicotinate phosphoribosyltransferase activity |
| GO:0031851 | 0.0052 | Inf | 0.0052 | 1 | 1 | kappa-type opioid receptor binding |
| GO:0038164 | 0.0052 | Inf | 0.0052 | 1 | 1 | thrombopoietin receptor activity |
| GO:0048018 | 0.0083 | 3.252 | 2.3088 | 7 | 445 | receptor ligand activity |
| GO:0005184 | 0.0099 | 14.5248 | 0.1505 | 2 | 29 | neuropeptide hormone activity |
| GOMFID | Pvalue | OddsRatio | ExpCount | Count | Size | Term |
| GO:0004984 | 0 | 8.6008 | 1.5353 | 11 | 371 | olfactory receptor activity |
| GO:1903231 | 0 | 15.0052 | 0.4594 | 6 | 111 | mRNA binding involved in posttranscriptional gene silencing |
| GO:0004930 | 3e-04 | 3.9006 | 3.2445 | 11 | 784 | G-protein coupled receptor activity |
| GO:0099600 | 0.0013 | 2.9697 | 5.0571 | 13 | 1222 | transmembrane receptor activity |
| GO:0005549 | 0.0049 | 9.4002 | 0.3435 | 3 | 83 | odorant binding |
| GO:0038023 | 0.0058 | 2.5539 | 5.3012 | 12 | 1281 | signaling receptor activity |
| GO:0097718 | 0.0068 | 17.6868 | 0.1242 | 2 | 30 | disordered domain specific binding |
| GO:0019781 | 0.0083 | 244.2727 | 0.0083 | 1 | 2 | NEDD8 activating enzyme activity |
| GO:0060089 | 0.0094 | 2.3078 | 6.3565 | 13 | 1536 | molecular transducer activity |
| GOMFID | Pvalue | OddsRatio | ExpCount | Count | Size | Term |
| GO:0004984 | 1e-04 | 4.4039 | 2.7498 | 11 | 371 | olfactory receptor activity |
| GO:0017077 | 2e-04 | 272.3559 | 0.0222 | 2 | 3 | oxidative phosphorylation uncoupler activity |
| GO:0008379 | 3e-04 | 136.1695 | 0.0296 | 2 | 4 | thioredoxin peroxidase activity |
| GO:0005549 | 4e-04 | 8.9142 | 0.6152 | 5 | 83 | odorant binding |
| GO:0047485 | 0.001 | 7.0861 | 0.7634 | 5 | 103 | protein N-terminus binding |
| GO:1903231 | 0.0014 | 6.548 | 0.8227 | 5 | 111 | mRNA binding involved in posttranscriptional gene silencing |
| GO:0004930 | 0.002 | 2.6244 | 5.811 | 14 | 784 | G-protein coupled receptor activity |
| GO:0003723 | 0.0046 | 1.9901 | 12.2372 | 22 | 1651 | RNA binding |
| GO:0008308 | 0.0061 | 19.4383 | 0.1186 | 2 | 16 | voltage-gated anion channel activity |
| GO:0005132 | 0.0069 | 18.1412 | 0.126 | 2 | 17 | type I interferon receptor binding |
| GO:0031851 | 0.0074 | Inf | 0.0074 | 1 | 1 | kappa-type opioid receptor binding |
| GO:0032003 | 0.0074 | Inf | 0.0074 | 1 | 1 | interleukin-28 receptor binding |
| GO:0036105 | 0.0074 | Inf | 0.0074 | 1 | 1 | peroxisome membrane class-1 targeting sequence binding |
| GOMFID | Pvalue | OddsRatio | ExpCount | Count | Size | Term |
| GO:0004984 | 0 | 7.3994 | 1.5812 | 10 | 371 | olfactory receptor activity |
| GO:0004930 | 1e-04 | 4.1857 | 3.3413 | 12 | 784 | G-protein coupled receptor activity |
| GO:0005549 | 4e-04 | 12.4962 | 0.3537 | 4 | 83 | odorant binding |
| GO:0099600 | 0.0018 | 2.8633 | 5.208 | 13 | 1222 | transmembrane receptor activity |
| GO:0038023 | 0.0027 | 2.7193 | 5.4595 | 13 | 1281 | signaling receptor activity |
| GO:0016209 | 0.0045 | 9.7248 | 0.3324 | 3 | 78 | antioxidant activity |
| GO:0060089 | 0.0048 | 2.4416 | 6.5463 | 14 | 1536 | molecular transducer activity |
| GO:0016005 | 0.0085 | 237.0588 | 0.0085 | 1 | 2 | phospholipase A2 activator activity |
| GO:0008536 | 0.0092 | 15.0084 | 0.1449 | 2 | 34 | Ran GTPase binding |
| GOMFID | Pvalue | OddsRatio | ExpCount | Count | Size | Term |
| GO:1903231 | 0 | 19.5551 | 0.6239 | 10 | 111 | mRNA binding involved in posttranscriptional gene silencing |
| GO:0004930 | 0 | 6.0299 | 4.4067 | 21 | 784 | G-protein coupled receptor activity |
| GO:0004984 | 0 | 8.0173 | 2.0853 | 14 | 371 | olfactory receptor activity |
| GO:0099600 | 0 | 4.2033 | 6.8686 | 23 | 1222 | transmembrane receptor activity |
| GO:0060089 | 0 | 3.2607 | 8.6335 | 23 | 1536 | molecular transducer activity |
| GO:0038023 | 0 | 3.6407 | 6.2704 | 19 | 1158 | signaling receptor activity |
| GO:0001653 | 0.0051 | 6.1741 | 0.6914 | 4 | 123 | peptide receptor activity |
| GO:0015054 | 0.0056 | Inf | 0.0056 | 1 | 1 | gastrin receptor activity |
| GO:0031707 | 0.0056 | Inf | 0.0056 | 1 | 1 | endothelin A receptor binding |
| GO:0031741 | 0.0056 | Inf | 0.0056 | 1 | 1 | type B gastrin/cholecystokinin receptor binding |
| GO:0033798 | 0.0056 | Inf | 0.0056 | 1 | 1 | thyroxine 5-deiodinase activity |
| GOMFID | Pvalue | OddsRatio | ExpCount | Count | Size | Term |
| GO:0032552 | 0.0034 | 34.8268 | 0.0945 | 2 | 5 | deoxyribonucleotide binding |
| GO:1990948 | 0.0034 | 34.8268 | 0.0945 | 2 | 5 | ubiquitin ligase inhibitor activity |
| GO:0004529 | 0.0037 | 11.2235 | 0.3213 | 3 | 17 | exodeoxyribonuclease activity |
| GO:0055106 | 0.0037 | 11.2235 | 0.3213 | 3 | 17 | ubiquitin-protein transferase regulator activity |
| GO:0051082 | 0.0038 | 3.7711 | 1.9846 | 7 | 105 | unfolded protein binding |
| GO:0030544 | 0.0046 | 6.5613 | 0.6804 | 4 | 36 | Hsp70 protein binding |
| GO:0035312 | 0.0051 | 26.1184 | 0.1134 | 2 | 6 | 5'-3' exodeoxyribonuclease activity |
| GO:0005515 | 0.0056 | 1.3982 | 198.3048 | 219 | 10668 | protein binding |
| GO:0004415 | 0.0092 | 17.4101 | 0.1512 | 2 | 8 | hyalurononglucosaminidase activity |
| GO:0031748 | 0.0092 | 17.4101 | 0.1512 | 2 | 8 | D1 dopamine receptor binding |
| GOMFID | Pvalue | OddsRatio | ExpCount | Count | Size | Term |
| GO:0005515 | 5e-04 | 1.5204 | 218.2547 | 246 | 10773 | protein binding |
| GO:0032552 | 0.0039 | 32.4315 | 0.1013 | 2 | 5 | deoxyribonucleotide binding |
| GO:1990948 | 0.0039 | 32.4315 | 0.1013 | 2 | 5 | ubiquitin ligase inhibitor activity |
| GO:0016895 | 0.0045 | 10.4492 | 0.3444 | 3 | 17 | exodeoxyribonuclease activity, producing 5'-phosphomonoesters |
| GO:0055106 | 0.0045 | 10.4492 | 0.3444 | 3 | 17 | ubiquitin-protein transferase regulator activity |
| GO:0030544 | 0.0058 | 6.1073 | 0.7293 | 4 | 36 | Hsp70 protein binding |
| GOMFID | Pvalue | OddsRatio | ExpCount | Count | Size | Term |
| GO:0046982 | 2e-04 | 3.1018 | 5.5909 | 16 | 469 | protein heterodimerization activity |
| GO:0001055 | 3e-04 | 31.5572 | 0.1311 | 3 | 11 | RNA polymerase II activity |
| GO:0003677 | 7e-04 | 1.808 | 27.9904 | 45 | 2348 | DNA binding |
| GO:0015450 | 0.0038 | 27.9075 | 0.0954 | 2 | 8 | P-P-bond-hydrolysis-driven protein transmembrane transporter activity |
| GO:0008235 | 0.0044 | 6.4896 | 0.6676 | 4 | 56 | metalloexopeptidase activity |
| GO:0016803 | 0.0048 | 23.9192 | 0.1073 | 2 | 9 | ether hydrolase activity |
| GO:0015266 | 0.0072 | 18.6015 | 0.1311 | 2 | 11 | protein channel activity |
| GOMFID | Pvalue | OddsRatio | ExpCount | Count | Size | Term |
| GO:0001055 | 2e-04 | 37.5445 | 0.1107 | 3 | 11 | RNA polymerase II activity |
| GO:0061659 | 0.0018 | 3.832 | 2.225 | 8 | 221 | ubiquitin-like protein ligase activity |
| GO:0015450 | 0.0027 | 33.1698 | 0.0805 | 2 | 8 | P-P-bond-hydrolysis-driven protein transmembrane transporter activity |
| GO:0016803 | 0.0035 | 28.4295 | 0.0906 | 2 | 9 | ether hydrolase activity |
| GO:0015266 | 0.0052 | 22.109 | 0.1107 | 2 | 11 | protein channel activity |
| GO:1904264 | 0.0073 | 18.087 | 0.1309 | 2 | 13 | ubiquitin protein ligase activity involved in ERAD pathway |
| GO:0034062 | 0.0092 | 7.4939 | 0.4329 | 3 | 43 | 5'-3' RNA polymerase activity |
| GO:0005544 | 0.0098 | 7.3107 | 0.443 | 3 | 44 | calcium-dependent phospholipid binding |
| GOMFID | Pvalue | OddsRatio | ExpCount | Count | Size | Term |
| GO:1903231 | 0 | 17.5118 | 0.5416 | 8 | 111 | mRNA binding involved in posttranscriptional gene silencing |
| GO:0008009 | 1e-04 | 19.4752 | 0.2342 | 4 | 48 | chemokine activity |
| GO:0004984 | 4e-04 | 4.8882 | 1.8103 | 8 | 371 | olfactory receptor activity |
| GO:0048020 | 9e-04 | 17.6261 | 0.1903 | 3 | 39 | CCR chemokine receptor binding |
| GO:0001664 | 0.0016 | 5.1725 | 1.2589 | 6 | 258 | G-protein coupled receptor binding |
| GO:0004930 | 0.0047 | 2.8718 | 3.8256 | 10 | 784 | G-protein coupled receptor activity |
| GO:0031707 | 0.0049 | Inf | 0.0049 | 1 | 1 | endothelin A receptor binding |
| GO:0097689 | 0.0049 | Inf | 0.0049 | 1 | 1 | iron channel activity |
| GO:2001069 | 0.0049 | Inf | 0.0049 | 1 | 1 | glycogen binding |
| GO:0005549 | 0.0078 | 7.91 | 0.405 | 3 | 83 | odorant binding |
| GO:0038023 | 0.0087 | 2.3057 | 6.2507 | 13 | 1281 | signaling receptor activity |
| GO:0001632 | 0.0097 | 206.5385 | 0.0098 | 1 | 2 | leukotriene B4 receptor activity |
| GO:0005153 | 0.0097 | 206.5385 | 0.0098 | 1 | 2 | interleukin-8 receptor binding |
| GO:2001070 | 0.0097 | 206.5385 | 0.0098 | 1 | 2 | starch binding |
| GOMFID | Pvalue | OddsRatio | ExpCount | Count | Size | Term |
| GO:1903231 | 3e-04 | 9.2021 | 0.5965 | 5 | 111 | mRNA binding involved in posttranscriptional gene silencing |
| GO:0004984 | 9e-04 | 4.391 | 1.9936 | 8 | 371 | olfactory receptor activity |
| GO:0008009 | 0.0022 | 12.7444 | 0.2579 | 3 | 48 | chemokine activity |
| GO:0005132 | 0.0037 | 25.2361 | 0.0914 | 2 | 17 | type I interferon receptor binding |
| GO:0038164 | 0.0054 | Inf | 0.0054 | 1 | 1 | thrombopoietin receptor activity |
| GO:0097689 | 0.0054 | Inf | 0.0054 | 1 | 1 | iron channel activity |
| GO:2001069 | 0.0054 | Inf | 0.0054 | 1 | 1 | glycogen binding |
| GO:0004129 | 0.0067 | 18.019 | 0.1236 | 2 | 23 | cytochrome-c oxidase activity |
| GO:0016675 | 0.0073 | 17.1989 | 0.129 | 2 | 24 | oxidoreductase activity, acting on a heme group of donors |
| GOMFID | Pvalue | OddsRatio | ExpCount | Count | Size | Term |
| GO:0004984 | 0 | 19.8034 | 1.4208 | 19 | 371 | olfactory receptor activity |
| GO:0004930 | 0 | 10.3144 | 3.0023 | 21 | 784 | G-protein coupled receptor activity |
| GO:0038023 | 0 | 6.971 | 4.9056 | 23 | 1281 | signaling receptor activity |
| GO:0099600 | 0 | 6.366 | 4.6797 | 21 | 1222 | transmembrane receptor activity |
| GO:0060089 | 0 | 5.6967 | 5.8821 | 23 | 1536 | molecular transducer activity |
| GO:0005549 | 0 | 18.0499 | 0.3179 | 5 | 83 | odorant binding |
| GO:1903231 | 1e-04 | 13.2589 | 0.4251 | 5 | 111 | mRNA binding involved in posttranscriptional gene silencing |
| GO:0004522 | 1e-04 | 268.7667 | 0.0153 | 2 | 4 | ribonuclease A activity |
| GO:0004521 | 0.0011 | 16.3505 | 0.203 | 3 | 53 | endoribonuclease activity |
| GO:0016894 | 0.0032 | 26.8467 | 0.0842 | 2 | 22 | endonuclease activity, active with either ribo- or deoxyribonucleic acids and producing 3'-phosphomonoesters |
| GO:0005153 | 0.0076 | 264.377 | 0.0077 | 1 | 2 | interleukin-8 receptor binding |
| GOMFID | Pvalue | OddsRatio | ExpCount | Count | Size | Term |
| GO:0008009 | 0 | 21.4267 | 0.5366 | 9 | 48 | chemokine activity |
| GO:1903231 | 0 | 8.1602 | 1.241 | 9 | 111 | mRNA binding involved in posttranscriptional gene silencing |
| GO:0001664 | 0 | 4.5499 | 2.8844 | 12 | 258 | G-protein coupled receptor binding |
| GO:0005126 | 0 | 4.4578 | 2.9403 | 12 | 263 | cytokine receptor binding |
| GO:0048020 | 4e-04 | 13.5247 | 0.3429 | 4 | 31 | CCR chemokine receptor binding |
| GO:0045236 | 7e-04 | 20.7381 | 0.1789 | 3 | 16 | CXCR chemokine receptor binding |
| GO:0004704 | 0.0012 | 59.6127 | 0.0559 | 2 | 5 | NF-kappaB-inducing kinase activity |
| GO:0031726 | 0.0012 | 59.6127 | 0.0559 | 2 | 5 | CCR1 chemokine receptor binding |
| GO:0042605 | 0.0018 | 14.1839 | 0.246 | 3 | 22 | peptide antigen binding |
| GO:0031730 | 0.0018 | 44.7067 | 0.0671 | 2 | 6 | CCR5 chemokine receptor binding |
| GO:0016679 | 0.0042 | 25.5419 | 0.1006 | 2 | 9 | oxidoreductase activity, acting on diphenols and related substances as donors |
| GO:0048018 | 0.0044 | 2.5542 | 4.975 | 12 | 445 | receptor ligand activity |
| GO:0042803 | 0.0044 | 2.1634 | 8.3736 | 17 | 749 | protein homodimerization activity |
| GO:0004872 | 0.0045 | 1.8182 | 16.6802 | 28 | 1492 | receptor activity |
| GO:0045028 | 0.0053 | 22.3478 | 0.1118 | 2 | 10 | G-protein coupled purinergic nucleotide receptor activity |
| GO:0003735 | 0.0068 | 3.7774 | 1.677 | 6 | 150 | structural constituent of ribosome |
| GOMFID | Pvalue | OddsRatio | ExpCount | Count | Size | Term |
| GO:0004984 | 0 | 4.7303 | 2.8186 | 12 | 371 | olfactory receptor activity |
| GO:0004930 | 0 | 3.4243 | 5.9563 | 18 | 784 | G-protein coupled receptor activity |
| GO:1903231 | 2e-04 | 7.7958 | 0.8433 | 6 | 111 | mRNA binding involved in posttranscriptional gene silencing |
| GO:0038023 | 2e-04 | 2.562 | 9.7321 | 22 | 1281 | signaling receptor activity |
| GO:0099600 | 3e-04 | 2.5484 | 9.2839 | 21 | 1222 | transmembrane receptor activity |
| GO:0060089 | 5e-04 | 2.3337 | 11.6694 | 24 | 1536 | molecular transducer activity |
| GO:0042605 | 6e-04 | 21.1158 | 0.1671 | 3 | 22 | peptide antigen binding |
| GO:0030881 | 0.002 | 37.9221 | 0.0684 | 2 | 9 | beta-2-microglobulin binding |
| GO:0033798 | 0.0076 | Inf | 0.0076 | 1 | 1 | thyroxine 5-deiodinase activity |
| GO:0050683 | 0.0076 | Inf | 0.0076 | 1 | 1 | AF-1 domain binding |
| GO:0042288 | 0.0081 | 16.5816 | 0.1368 | 2 | 18 | MHC class I protein binding |
| GOMFID | Pvalue | OddsRatio | ExpCount | Count | Size | Term |
| GO:0038023 | 0 | 2.3557 | 18.1191 | 38 | 1281 | signaling receptor activity |
| GO:0004930 | 0 | 2.6846 | 11.0893 | 27 | 784 | G-protein coupled receptor activity |
| GO:0099600 | 0 | 2.3237 | 17.2846 | 36 | 1222 | transmembrane receptor activity |
| GO:0004984 | 0 | 3.5353 | 5.2476 | 17 | 371 | olfactory receptor activity |
| GO:0060089 | 1e-04 | 2.1102 | 21.726 | 41 | 1536 | molecular transducer activity |
| GO:0008009 | 6e-04 | 8.2631 | 0.6789 | 5 | 48 | chemokine activity |
| GO:0005132 | 0.0016 | 15.1204 | 0.2405 | 3 | 17 | type I interferon receptor binding |
| GO:0048020 | 0.0022 | 8.0894 | 0.5516 | 4 | 39 | CCR chemokine receptor binding |
| GO:0016712 | 0.0051 | 9.6173 | 0.3536 | 3 | 25 | oxidoreductase activity, acting on paired donors, with incorporation or reduction of molecular oxygen, reduced flavin or flavoprotein as one donor, and incorporation of one atom of oxygen |
| GO:0045028 | 0.0083 | 17.5694 | 0.1414 | 2 | 10 | G-protein coupled purinergic nucleotide receptor activity |
| GOMFID | Pvalue | OddsRatio | ExpCount | Count | Size | Term |
| GO:1903231 | 0 | 18.3139 | 0.7336 | 11 | 111 | mRNA binding involved in posttranscriptional gene silencing |
| GO:0004984 | 2e-04 | 4.4898 | 2.4519 | 10 | 371 | olfactory receptor activity |
| GO:0005549 | 0.0022 | 7.8673 | 0.5485 | 4 | 83 | odorant binding |
| GO:0003723 | 0.0024 | 2.1652 | 10.9115 | 21 | 1651 | RNA binding |
| GO:0005125 | 0.0031 | 4.4902 | 1.4275 | 6 | 216 | cytokine activity |
| GO:0047485 | 0.0048 | 6.2701 | 0.6807 | 4 | 103 | protein N-terminus binding |
| GO:0005132 | 0.0055 | 20.4038 | 0.1124 | 2 | 17 | type I interferon receptor binding |
| GO:0000254 | 0.0066 | Inf | 0.0066 | 1 | 1 | C-4 methylsterol oxidase activity |
| GO:0005307 | 0.0066 | Inf | 0.0066 | 1 | 1 | choline:sodium symporter activity |
| GO:0031851 | 0.0066 | Inf | 0.0066 | 1 | 1 | kappa-type opioid receptor binding |
| GO:0032003 | 0.0066 | Inf | 0.0066 | 1 | 1 | interleukin-28 receptor binding |
| GO:0070405 | 0.0095 | 7.3352 | 0.4362 | 3 | 66 | ammonium ion binding |
| GOMFID | Pvalue | OddsRatio | ExpCount | Count | Size | Term |
| GO:0004984 | 0 | 12.918 | 1.627 | 16 | 371 | olfactory receptor activity |
| GO:0004930 | 0 | 5.8148 | 3.4382 | 16 | 784 | G-protein coupled receptor activity |
| GO:0099600 | 1e-04 | 3.5973 | 5.359 | 16 | 1222 | transmembrane receptor activity |
| GO:0038023 | 1e-04 | 3.4159 | 5.6177 | 16 | 1281 | signaling receptor activity |
| GO:1903231 | 1e-04 | 11.4444 | 0.4868 | 5 | 111 | mRNA binding involved in posttranscriptional gene silencing |
| GO:0004468 | 3e-04 | 116.7754 | 0.0263 | 2 | 6 | lysine N-acetyltransferase activity, acting on acetyl phosphate as donor |
| GO:0005549 | 5e-04 | 12.1217 | 0.364 | 4 | 83 | odorant binding |
| GO:0060089 | 8e-04 | 2.7941 | 6.736 | 16 | 1536 | molecular transducer activity |
| GO:0019825 | 0.001 | 16.8876 | 0.1973 | 3 | 45 | oxygen binding |
| GO:0004603 | 0.0044 | Inf | 0.0044 | 1 | 1 | phenylethanolamine N-methyltransferase activity |
| GO:0005144 | 0.0044 | Inf | 0.0044 | 1 | 1 | interleukin-13 receptor binding |
| GO:0016711 | 0.0044 | Inf | 0.0044 | 1 | 1 | flavonoid 3'-monooxygenase activity |
| GO:0047198 | 0.0044 | Inf | 0.0044 | 1 | 1 | cysteine-S-conjugate N-acetyltransferase activity |
| GO:0016410 | 0.0072 | 8.1298 | 0.3947 | 3 | 90 | N-acyltransferase activity |
| GO:0016407 | 0.0075 | 8.0369 | 0.3991 | 3 | 91 | acetyltransferase activity |
| GO:0016262 | 0.0088 | 230.2571 | 0.0088 | 1 | 2 | protein N-acetylglucosaminyltransferase activity |
| GOMFID | Pvalue | OddsRatio | ExpCount | Count | Size | Term |
| GO:0004984 | 0 | 5.6064 | 3.0477 | 15 | 371 | olfactory receptor activity |
| GO:0004930 | 1e-04 | 3.1245 | 6.4405 | 18 | 784 | G-protein coupled receptor activity |
| GO:0038023 | 7e-04 | 2.3296 | 10.5233 | 22 | 1281 | signaling receptor activity |
| GO:0004468 | 0.001 | 61.271 | 0.0493 | 2 | 6 | lysine N-acetyltransferase activity, acting on acetyl phosphate as donor |
| GO:0003735 | 0.0015 | 5.2208 | 1.2322 | 6 | 150 | structural constituent of ribosome |
| GO:0003924 | 0.0016 | 3.9346 | 2.177 | 8 | 265 | GTPase activity |
| GO:0099600 | 0.0023 | 2.1874 | 10.0387 | 20 | 1222 | transmembrane receptor activity |
| GO:0060089 | 0.0069 | 1.9038 | 12.6182 | 22 | 1536 | molecular transducer activity |
| GO:0000210 | 0.0082 | Inf | 0.0082 | 1 | 1 | NAD+ diphosphatase activity |
| GO:0004476 | 0.0082 | Inf | 0.0082 | 1 | 1 | mannose-6-phosphate isomerase activity |
| GO:0005141 | 0.0082 | Inf | 0.0082 | 1 | 1 | interleukin-10 receptor binding |
| GO:0005142 | 0.0082 | Inf | 0.0082 | 1 | 1 | interleukin-11 receptor binding |
| GO:0005307 | 0.0082 | Inf | 0.0082 | 1 | 1 | choline:sodium symporter activity |
| GO:0016711 | 0.0082 | Inf | 0.0082 | 1 | 1 | flavonoid 3'-monooxygenase activity |
| GO:0019782 | 0.0082 | Inf | 0.0082 | 1 | 1 | ISG15 activating enzyme activity |
| GO:0032556 | 0.0082 | Inf | 0.0082 | 1 | 1 | pyrimidine deoxyribonucleotide binding |
| GO:0047198 | 0.0082 | Inf | 0.0082 | 1 | 1 | cysteine-S-conjugate N-acetyltransferase activity |
| GO:0047840 | 0.0082 | Inf | 0.0082 | 1 | 1 | dCTP diphosphatase activity |
| GO:0051736 | 0.0082 | Inf | 0.0082 | 1 | 1 | ATP-dependent polyribonucleotide 5'-hydroxyl-kinase activity |
| GO:0051747 | 0.0082 | Inf | 0.0082 | 1 | 1 | cytosine C-5 DNA demethylase activity |
| GO:0070180 | 0.0082 | Inf | 0.0082 | 1 | 1 | large ribosomal subunit rRNA binding |
| GO:0055106 | 0.0084 | 16.3277 | 0.1397 | 2 | 17 | ubiquitin-protein transferase regulator activity |
| GOMFID | Pvalue | OddsRatio | ExpCount | Count | Size | Term |
| GO:0005164 | 0 | 16.4689 | 0.4621 | 6 | 29 | tumor necrosis factor receptor binding |
| GO:0005125 | 7e-04 | 3.4165 | 3.4421 | 11 | 216 | cytokine activity |
| GO:0005126 | 0.0011 | 3.0475 | 4.1911 | 12 | 263 | cytokine receptor binding |
| GO:0004035 | 0.0015 | 62.2266 | 0.0637 | 2 | 4 | alkaline phosphatase activity |
| GO:0019863 | 0.0025 | 41.4818 | 0.0797 | 2 | 5 | IgE binding |
| GO:0043184 | 0.005 | 24.8859 | 0.1116 | 2 | 7 | vascular endothelial growth factor receptor 2 binding |
| GO:0008140 | 0.0066 | 20.737 | 0.1275 | 2 | 8 | cAMP response element binding protein binding |
| GO:0030545 | 0.0089 | 2.0903 | 7.5217 | 15 | 472 | receptor regulator activity |
| GO:0005070 | 0.0094 | 5.2113 | 0.8287 | 4 | 52 | SH3/SH2 adaptor activity |
| NA. |
| n/a |
| NA. |
| n/a |
| NA. |
| n/a |
| NA. |
| n/a |
| NA. |
| n/a |
| NA. |
| n/a |
| NA. |
| n/a |
| NA. |
| n/a |
| NA. |
| n/a |
| NA. |
| n/a |
| NA. |
| n/a |
| NA. |
| n/a |
| NA. |
| n/a |
| NA. |
| n/a |
| NA. |
| n/a |
| NA. |
| n/a |
| NA. |
| n/a |
| NA. |
| n/a |
| NA. |
| n/a |
| NA. |
| n/a |
| NA. |
| n/a |
| NA. |
| n/a |
| NA. |
| n/a |
| NA. |
| n/a |
| NA. |
| n/a |
| NA. |
| n/a |
| NA. |
| n/a |
| NA. |
| n/a |
| NA. |
| n/a |
| NA. |
| n/a |
| NA. |
| n/a |
| NA. |
| n/a |
| NA. |
| n/a |
| NA. |
| n/a |
| NA. |
| n/a |
| NA. |
| n/a |
| NA. |
| n/a |
| NA. |
| n/a |
| NA. |
| n/a |
| NA. |
| n/a |
| NA. |
| n/a |
| NA. |
| n/a |
| NA. |
| n/a |
| NA. |
| n/a |
| NA. |
| n/a |
| NA. |
| n/a |
| NA. |
| n/a |
| NA. |
| n/a |
| NA. |
| n/a |
| NA. |
| n/a |
| NA. |
| n/a |
| NA. |
| n/a |
| NA. |
| n/a |
| NA. |
| n/a |
| NA. |
| n/a |
| NA. |
| n/a |
| GOMFID | Pvalue | OddsRatio | ExpCount | Count | Size | Term |
| GO:0009440 | 2e-04 | Inf | 0.0315 | 2 | 2 | cyanate catabolic process |
| GO:0016119 | 2e-04 | Inf | 0.0315 | 2 | 2 | carotene metabolic process |
| GO:0046041 | 2e-04 | Inf | 0.0315 | 2 | 2 | ITP metabolic process |
| GO:0007606 | 0.0012 | 2.4538 | 7.3661 | 17 | 467 | sensory perception of chemical stimulus |
| GO:1901019 | 0.002 | 4.9549 | 1.3092 | 6 | 83 | regulation of calcium ion transmembrane transporter activity |
| GO:0009593 | 0.0021 | 2.3928 | 7.0822 | 16 | 449 | detection of chemical stimulus |
| GO:0002931 | 0.0022 | 8.1633 | 0.5521 | 4 | 35 | response to ischemia |
| GO:0022898 | 0.0022 | 3.1269 | 3.3913 | 10 | 215 | regulation of transmembrane transporter activity |
| GO:0002697 | 0.0024 | 2.6338 | 5.2209 | 13 | 331 | regulation of immune effector process |
| GO:0010959 | 0.0032 | 2.5361 | 5.4102 | 13 | 343 | regulation of metal ion transport |
| GO:0070383 | 0.0036 | 31.437 | 0.0946 | 2 | 6 | DNA cytosine deamination |
| GO:0043901 | 0.0041 | 3.3357 | 2.5395 | 8 | 161 | negative regulation of multi-organism process |
| GO:0003008 | 0.0049 | 1.5874 | 30.5528 | 45 | 1937 | system process |
| GO:0045869 | 0.0049 | 25.148 | 0.1104 | 2 | 7 | negative regulation of single stranded viral RNA replication via double stranded DNA intermediate |
| GO:2000649 | 0.0054 | 6.1684 | 0.7098 | 4 | 45 | regulation of sodium ion transmembrane transporter activity |
| GO:0039694 | 0.0054 | 9.4589 | 0.3628 | 3 | 23 | viral RNA genome replication |
| GO:0050911 | 0.006 | 2.3403 | 5.8361 | 13 | 370 | detection of chemical stimulus involved in sensory perception of smell |
| GO:0002230 | 0.0061 | 9.0079 | 0.3786 | 3 | 24 | positive regulation of defense response to virus by host |
| GO:0009199 | 0.0062 | 2.5443 | 4.5427 | 11 | 288 | ribonucleoside triphosphate metabolic process |
| GO:0010533 | 0.0065 | 20.9554 | 0.1262 | 2 | 8 | regulation of activation of Janus kinase activity |
| GO:0009144 | 0.0066 | 2.5165 | 4.59 | 11 | 291 | purine nucleoside triphosphate metabolic process |
| GO:0035725 | 0.0082 | 3.226 | 2.2871 | 7 | 145 | sodium ion transmembrane transport |
| GO:2001257 | 0.0082 | 3.226 | 2.2871 | 7 | 145 | regulation of cation channel activity |
| GO:0009972 | 0.0083 | 17.9606 | 0.142 | 2 | 9 | cytidine deamination |
| GO:0045988 | 0.0083 | 17.9606 | 0.142 | 2 | 9 | negative regulation of striated muscle contraction |
| GO:0046087 | 0.0083 | 17.9606 | 0.142 | 2 | 9 | cytidine metabolic process |
| GO:0097267 | 0.0083 | 17.9606 | 0.142 | 2 | 9 | omega-hydroxylase P450 pathway |
| GO:0071295 | 0.0095 | 7.5647 | 0.4417 | 3 | 28 | cellular response to vitamin |
| GO:0042157 | 0.0098 | 2.8465 | 2.9496 | 8 | 187 | lipoprotein metabolic process |
| GOMFID | Pvalue | OddsRatio | ExpCount | Count | Size | Term |
| GO:0009593 | 0 | 3.3728 | 5.5053 | 17 | 449 | detection of chemical stimulus |
| GO:0050911 | 1e-04 | 3.5998 | 4.5367 | 15 | 370 | detection of chemical stimulus involved in sensory perception of smell |
| GO:0007606 | 1e-04 | 3.2342 | 5.726 | 17 | 467 | sensory perception of chemical stimulus |
| GO:0016119 | 1e-04 | Inf | 0.0245 | 2 | 2 | carotene metabolic process |
| GO:0046041 | 1e-04 | Inf | 0.0245 | 2 | 2 | ITP metabolic process |
| GO:0050906 | 2e-04 | 3.0623 | 5.6524 | 16 | 461 | detection of stimulus involved in sensory perception |
| GO:0016553 | 3e-04 | 30.6562 | 0.1349 | 3 | 11 | base conversion or substitution editing |
| GO:0007186 | 3e-04 | 2.1512 | 15.3511 | 30 | 1252 | G-protein coupled receptor signaling pathway |
| GO:0070383 | 0.0022 | 40.6777 | 0.0736 | 2 | 6 | DNA cytosine deamination |
| GO:0045869 | 0.003 | 32.5401 | 0.0858 | 2 | 7 | negative regulation of single stranded viral RNA replication via double stranded DNA intermediate |
| GO:0032722 | 0.0033 | 7.1282 | 0.6131 | 4 | 50 | positive regulation of chemokine production |
| GO:0050877 | 0.0036 | 1.8846 | 14.8361 | 26 | 1210 | nervous system process |
| GO:0009259 | 0.004 | 2.3076 | 6.8908 | 15 | 562 | ribonucleotide metabolic process |
| GO:0007341 | 0.004 | 27.1151 | 0.0981 | 2 | 8 | penetration of zona pellucida |
| GO:0006163 | 0.0042 | 2.2946 | 6.9276 | 15 | 565 | purine nucleotide metabolic process |
| GO:0030816 | 0.005 | 4.8351 | 1.1035 | 5 | 90 | positive regulation of cAMP metabolic process |
| GO:0072676 | 0.005 | 4.8351 | 1.1035 | 5 | 90 | lymphocyte migration |
| GO:0009972 | 0.0051 | 23.24 | 0.1104 | 2 | 9 | cytidine deamination |
| GO:0043950 | 0.0051 | 23.24 | 0.1104 | 2 | 9 | positive regulation of cAMP-mediated signaling |
| GO:0046087 | 0.0051 | 23.24 | 0.1104 | 2 | 9 | cytidine metabolic process |
| GO:0050896 | 0.0052 | 1.4623 | 100.579 | 119 | 8203 | response to stimulus |
| GO:0018149 | 0.0056 | 6.0691 | 0.7112 | 4 | 58 | peptide cross-linking |
| GO:0019852 | 0.0063 | 20.3338 | 0.1226 | 2 | 10 | L-ascorbic acid metabolic process |
| GO:0046007 | 0.0063 | 20.3338 | 0.1226 | 2 | 10 | negative regulation of activated T cell proliferation |
| GO:1904062 | 0.0068 | 2.8182 | 3.3596 | 9 | 274 | regulation of cation transmembrane transport |
| GO:1904427 | 0.007 | 5.6492 | 0.7602 | 4 | 62 | positive regulation of calcium ion transmembrane transport |
| GO:0046133 | 0.0076 | 18.0733 | 0.1349 | 2 | 11 | pyrimidine ribonucleoside catabolic process |
| GO:0002697 | 0.0078 | 2.5895 | 4.0585 | 10 | 331 | regulation of immune effector process |
| GO:0050672 | 0.0083 | 5.3703 | 0.797 | 4 | 65 | negative regulation of lymphocyte proliferation |
| GO:0032988 | 0.0091 | 16.265 | 0.1471 | 2 | 12 | ribonucleoprotein complex disassembly |
| GO:0055086 | 0.01 | 1.972 | 9.0978 | 17 | 742 | nucleobase-containing small molecule metabolic process |
| GOMFID | Pvalue | OddsRatio | ExpCount | Count | Size | Term |
| GO:0006955 | 0 | 2.0189 | 28.512 | 51 | 1851 | immune response |
| GO:0002699 | 3e-04 | 4.1725 | 2.5878 | 10 | 168 | positive regulation of immune effector process |
| GO:0002228 | 3e-04 | 7.3896 | 0.9088 | 6 | 59 | natural killer cell mediated immunity |
| GO:0001909 | 3e-04 | 5.8729 | 1.3093 | 7 | 85 | leukocyte mediated cytotoxicity |
| GO:0060252 | 5e-04 | 24.249 | 0.1694 | 3 | 11 | positive regulation of glial cell proliferation |
| GO:2000502 | 7e-04 | 128.8629 | 0.0462 | 2 | 3 | negative regulation of natural killer cell chemotaxis |
| GO:0002703 | 7e-04 | 3.9948 | 2.4184 | 9 | 157 | regulation of leukocyte mediated immunity |
| GO:0042269 | 0.0016 | 8.9437 | 0.5083 | 4 | 33 | regulation of natural killer cell mediated cytotoxicity |
| GO:0045124 | 0.002 | 8.3656 | 0.5391 | 4 | 35 | regulation of bone resorption |
| GO:0032729 | 0.0023 | 5.9091 | 0.9242 | 5 | 60 | positive regulation of interferon-gamma production |
| GO:0070230 | 0.0029 | 12.1184 | 0.2927 | 3 | 19 | positive regulation of lymphocyte apoptotic process |
| GO:0031341 | 0.0032 | 5.415 | 1.0012 | 5 | 65 | regulation of cell killing |
| GO:0032496 | 0.0033 | 2.6443 | 4.7905 | 12 | 311 | response to lipopolysaccharide |
| GO:0033007 | 0.0034 | 32.2097 | 0.0924 | 2 | 6 | negative regulation of mast cell activation involved in immune response |
| GO:0010507 | 0.0035 | 5.3259 | 1.0166 | 5 | 66 | negative regulation of autophagy |
| GO:0031295 | 0.0037 | 5.2396 | 1.032 | 5 | 67 | T cell costimulation |
| GO:0002685 | 0.0042 | 3.3104 | 2.557 | 8 | 166 | regulation of leukocyte migration |
| GO:0032660 | 0.0045 | 10.2031 | 0.3389 | 3 | 22 | regulation of interleukin-17 production |
| GO:0002708 | 0.0057 | 4.706 | 1.1399 | 5 | 74 | positive regulation of lymphocyte mediated immunity |
| GO:0045630 | 0.0062 | 21.4704 | 0.1232 | 2 | 8 | positive regulation of T-helper 2 cell differentiation |
| GO:0051133 | 0.0062 | 21.4704 | 0.1232 | 2 | 8 | regulation of NK T cell activation |
| GO:0060677 | 0.0062 | 21.4704 | 0.1232 | 2 | 8 | ureteric bud elongation |
| GO:0046849 | 0.0071 | 4.447 | 1.2015 | 5 | 78 | bone remodeling |
| GO:0071354 | 0.0072 | 8.4265 | 0.4005 | 3 | 26 | cellular response to interleukin-6 |
| GO:0006002 | 0.0079 | 18.4021 | 0.1386 | 2 | 9 | fructose 6-phosphate metabolic process |
| GO:2000402 | 0.0079 | 18.4021 | 0.1386 | 2 | 9 | negative regulation of lymphocyte migration |
| GO:0002683 | 0.009 | 2.2219 | 6.1306 | 13 | 398 | negative regulation of immune system process |
| GO:0034103 | 0.0091 | 4.1606 | 1.2785 | 5 | 83 | regulation of tissue remodeling |
| GO:0002443 | 0.0097 | 2.0176 | 8.3217 | 16 | 555 | leukocyte mediated immunity |
| GO:0051901 | 0.0098 | 16.1008 | 0.154 | 2 | 10 | positive regulation of mitochondrial depolarization |
| GO:2001214 | 0.0098 | 16.1008 | 0.154 | 2 | 10 | positive regulation of vasculogenesis |
| GOMFID | Pvalue | OddsRatio | ExpCount | Count | Size | Term |
| GO:0007600 | 6e-04 | 2.3172 | 10.3019 | 22 | 880 | sensory perception |
| GO:0038127 | 0.0019 | 4.2523 | 1.756 | 7 | 150 | ERBB signaling pathway |
| GO:0051606 | 0.0023 | 2.3786 | 7.1762 | 16 | 613 | detection of stimulus |
| GO:0007214 | 0.0024 | 12.8503 | 0.2693 | 3 | 23 | gamma-aminobutyric acid signaling pathway |
| GO:0051026 | 0.0028 | 34.117 | 0.0819 | 2 | 7 | chiasma assembly |
| GO:0050907 | 0.0036 | 2.6158 | 4.8583 | 12 | 415 | detection of chemical stimulus involved in sensory perception |
| GO:0010591 | 0.0042 | 10.277 | 0.3278 | 3 | 28 | regulation of lamellipodium assembly |
| GO:0006621 | 0.0046 | 24.3663 | 0.1054 | 2 | 9 | protein retention in ER lumen |
| GO:0061179 | 0.0046 | 24.3663 | 0.1054 | 2 | 9 | negative regulation of insulin secretion involved in cellular response to glucose stimulus |
| GO:0008608 | 0.0056 | 9.1742 | 0.3629 | 3 | 31 | attachment of spindle microtubules to kinetochore |
| GO:0046085 | 0.0058 | 21.3191 | 0.1171 | 2 | 10 | adenosine metabolic process |
| GO:0051930 | 0.0061 | 8.8573 | 0.3746 | 3 | 32 | regulation of sensory perception of pain |
| GO:0006821 | 0.0061 | 4.5848 | 1.159 | 5 | 99 | chloride transport |
| GO:0031284 | 0.007 | 18.9492 | 0.1288 | 2 | 11 | positive regulation of guanylate cyclase activity |
| GO:0010664 | 0.0072 | 8.2848 | 0.398 | 3 | 34 | negative regulation of striated muscle cell apoptotic process |
| GO:0007186 | 0.0078 | 1.8102 | 14.1805 | 24 | 1229 | G-protein coupled receptor signaling pathway |
| GO:0032099 | 0.0083 | 17.0532 | 0.1405 | 2 | 12 | negative regulation of appetite |
| GO:0010310 | 0.0098 | 15.5019 | 0.1522 | 2 | 13 | regulation of hydrogen peroxide metabolic process |
| GOMFID | Pvalue | OddsRatio | ExpCount | Count | Size | Term |
| GO:0007186 | 0 | 2.1162 | 20.8281 | 40 | 1252 | G-protein coupled receptor signaling pathway |
| GO:0032940 | 4e-04 | 1.9052 | 22.8743 | 40 | 1375 | secretion by cell |
| GO:0002275 | 4e-04 | 2.4787 | 8.634 | 20 | 519 | myeloid cell activation involved in immune response |
| GO:0002444 | 5e-04 | 2.4634 | 8.6839 | 20 | 522 | myeloid leukocyte mediated immunity |
| GO:0050896 | 7e-04 | 1.5006 | 136.464 | 163 | 8203 | response to stimulus |
| GO:0002263 | 7e-04 | 2.2399 | 10.9797 | 23 | 660 | cell activation involved in immune response |
| GO:0050704 | 7e-04 | 7.9057 | 0.7153 | 5 | 43 | regulation of interleukin-1 secretion |
| GO:0060244 | 8e-04 | 119.097 | 0.0499 | 2 | 3 | negative regulation of cell proliferation involved in contact inhibition |
| GO:0043312 | 9e-04 | 2.4675 | 7.7689 | 18 | 467 | neutrophil degranulation |
| GO:0050718 | 0.001 | 10.4197 | 0.4492 | 4 | 27 | positive regulation of interleukin-1 beta secretion |
| GO:0042119 | 0.0011 | 2.4122 | 7.9353 | 18 | 477 | neutrophil activation |
| GO:0009617 | 0.0014 | 2.3025 | 8.7671 | 19 | 527 | response to bacterium |
| GO:0002922 | 0.0014 | 16.2911 | 0.2329 | 3 | 14 | positive regulation of humoral immune response |
| GO:0060326 | 0.0015 | 2.9347 | 4.342 | 12 | 261 | cell chemotaxis |
| GO:0045055 | 0.0017 | 2.0765 | 11.7782 | 23 | 708 | regulated exocytosis |
| GO:0016192 | 0.0026 | 1.6451 | 29.5287 | 45 | 1775 | vesicle-mediated transport |
| GO:0010972 | 0.0037 | 4.3475 | 1.4806 | 6 | 89 | negative regulation of G2/M transition of mitotic cell cycle |
| GO:0032691 | 0.0042 | 10.5373 | 0.3327 | 3 | 20 | negative regulation of interleukin-1 beta production |
| GO:1903727 | 0.0043 | 6.6516 | 0.6654 | 4 | 40 | positive regulation of phospholipid metabolic process |
| GO:0050906 | 0.0046 | 2.1962 | 7.6691 | 16 | 461 | detection of stimulus involved in sensory perception |
| GO:0032732 | 0.0047 | 6.4714 | 0.6821 | 4 | 41 | positive regulation of interleukin-1 production |
| GO:0050795 | 0.0048 | 4.9177 | 1.098 | 5 | 66 | regulation of behavior |
| GO:0019722 | 0.0054 | 3.1756 | 2.6617 | 8 | 160 | calcium-mediated signaling |
| GO:0014827 | 0.0055 | 23.8134 | 0.1165 | 2 | 7 | intestine smooth muscle contraction |
| GO:0051026 | 0.0055 | 23.8134 | 0.1165 | 2 | 7 | chiasma assembly |
| GO:0045188 | 0.0072 | 19.8433 | 0.1331 | 2 | 8 | regulation of circadian sleep/wake cycle, non-REM sleep |
| GO:0072610 | 0.0072 | 19.8433 | 0.1331 | 2 | 8 | interleukin-12 secretion |
| GO:1904628 | 0.0072 | 19.8433 | 0.1331 | 2 | 8 | cellular response to phorbol 13-acetate 12-myristate |
| GO:0002376 | 0.0078 | 1.4614 | 44.4177 | 60 | 2670 | immune system process |
| GO:0071346 | 0.009 | 3.1673 | 2.329 | 7 | 140 | cellular response to interferon-gamma |
| GO:0007614 | 0.0092 | 17.0075 | 0.1497 | 2 | 9 | short-term memory |
| GO:0070050 | 0.0092 | 17.0075 | 0.1497 | 2 | 9 | neuron cellular homeostasis |
| GO:0086023 | 0.0092 | 17.0075 | 0.1497 | 2 | 9 | adrenergic receptor signaling pathway involved in heart process |
| GO:2000510 | 0.0092 | 17.0075 | 0.1497 | 2 | 9 | positive regulation of dendritic cell chemotaxis |
| GO:0050911 | 0.0093 | 2.2108 | 6.1553 | 13 | 370 | detection of chemical stimulus involved in sensory perception of smell |
| GO:0050829 | 0.0097 | 4.1062 | 1.2976 | 5 | 78 | defense response to Gram-negative bacterium |
| GO:0042554 | 0.0099 | 7.4607 | 0.4492 | 3 | 27 | superoxide anion generation |
| GO:0008154 | 0.01 | 2.8361 | 2.9612 | 8 | 178 | actin polymerization or depolymerization |
| GOMFID | Pvalue | OddsRatio | ExpCount | Count | Size | Term |
| GO:0002548 | 2e-04 | 7.95 | 0.8442 | 6 | 62 | monocyte chemotaxis |
| GO:0070098 | 8e-04 | 6.0094 | 1.0893 | 6 | 80 | chemokine-mediated signaling pathway |
| GO:0048247 | 0.0011 | 6.9689 | 0.7898 | 5 | 58 | lymphocyte chemotaxis |
| GO:0030593 | 0.0013 | 5.4204 | 1.1983 | 6 | 88 | neutrophil chemotaxis |
| GO:0010647 | 0.0016 | 1.8127 | 21.6234 | 36 | 1588 | positive regulation of cell communication |
| GO:0023056 | 0.0017 | 1.8049 | 21.7051 | 36 | 1594 | positive regulation of signaling |
| GO:0010469 | 0.0018 | 2.369 | 7.639 | 17 | 561 | regulation of receptor activity |
| GO:0070383 | 0.0027 | 36.5411 | 0.0817 | 2 | 6 | DNA cytosine deamination |
| GO:2000503 | 0.0027 | 36.5411 | 0.0817 | 2 | 6 | positive regulation of natural killer cell chemotaxis |
| GO:0060326 | 0.0031 | 2.9754 | 3.554 | 10 | 261 | cell chemotaxis |
| GO:1904951 | 0.0035 | 2.3407 | 6.7811 | 15 | 498 | positive regulation of establishment of protein localization |
| GO:0045869 | 0.0037 | 29.2311 | 0.0953 | 2 | 7 | negative regulation of single stranded viral RNA replication via double stranded DNA intermediate |
| GO:0050900 | 0.0038 | 2.4835 | 5.5284 | 13 | 406 | leukocyte migration |
| GO:0006954 | 0.0047 | 2.0918 | 9.1096 | 18 | 669 | inflammatory response |
| GO:1902533 | 0.0048 | 1.9096 | 12.8134 | 23 | 941 | positive regulation of intracellular signal transduction |
| GO:0070374 | 0.0052 | 3.1951 | 2.6417 | 8 | 194 | positive regulation of ERK1 and ERK2 cascade |
| GO:0009972 | 0.0062 | 20.8767 | 0.1226 | 2 | 9 | cytidine deamination |
| GO:0046087 | 0.0062 | 20.8767 | 0.1226 | 2 | 9 | cytidine metabolic process |
| GO:0006955 | 0.0063 | 1.6259 | 25.2046 | 38 | 1851 | immune response |
| GO:0034341 | 0.0064 | 3.3899 | 2.1787 | 7 | 160 | response to interferon-gamma |
| GO:0097530 | 0.0065 | 3.8235 | 1.6612 | 6 | 122 | granulocyte migration |
| GO:0050830 | 0.0067 | 4.4961 | 1.1847 | 5 | 87 | defense response to Gram-positive bacterium |
| GO:0002682 | 0.0068 | 1.7125 | 18.723 | 30 | 1375 | regulation of immune system process |
| GO:0071347 | 0.0077 | 4.3366 | 1.2255 | 5 | 90 | cellular response to interleukin-1 |
| GO:0010458 | 0.0077 | 8.1458 | 0.4085 | 3 | 30 | exit from mitosis |
| GO:0032689 | 0.0077 | 8.1458 | 0.4085 | 3 | 30 | negative regulation of interferon-gamma production |
| GO:0010838 | 0.0077 | 18.266 | 0.1362 | 2 | 10 | positive regulation of keratinocyte proliferation |
| GO:0035589 | 0.0077 | 18.266 | 0.1362 | 2 | 10 | G-protein coupled purinergic nucleotide receptor signaling pathway |
| GO:1902237 | 0.0077 | 18.266 | 0.1362 | 2 | 10 | positive regulation of endoplasmic reticulum stress-induced intrinsic apoptotic signaling pathway |
| GO:1902902 | 0.0077 | 18.266 | 0.1362 | 2 | 10 | negative regulation of autophagosome assembly |
| GO:1904589 | 0.008 | 3.2402 | 2.274 | 7 | 167 | regulation of protein import |
| GO:1900182 | 0.0082 | 3.6341 | 1.7429 | 6 | 128 | positive regulation of protein localization to nucleus |
| GO:0002430 | 0.0094 | 16.2354 | 0.1498 | 2 | 11 | complement receptor mediated signaling pathway |
| GO:0016553 | 0.0094 | 16.2354 | 0.1498 | 2 | 11 | base conversion or substitution editing |
| GO:0046133 | 0.0094 | 16.2354 | 0.1498 | 2 | 11 | pyrimidine ribonucleoside catabolic process |
| GO:0048245 | 0.0094 | 16.2354 | 0.1498 | 2 | 11 | eosinophil chemotaxis |
| GO:0060525 | 0.0094 | 16.2354 | 0.1498 | 2 | 11 | prostate glandular acinus development |
| GOMFID | Pvalue | OddsRatio | ExpCount | Count | Size | Term |
| GO:0070098 | 0 | 8.7285 | 1.04 | 8 | 80 | chemokine-mediated signaling pathway |
| GO:0010469 | 0 | 2.9958 | 7.2933 | 20 | 561 | regulation of receptor activity |
| GO:0060326 | 2e-04 | 3.8191 | 3.3932 | 12 | 261 | cell chemotaxis |
| GO:0097530 | 2e-04 | 5.4982 | 1.5861 | 8 | 122 | granulocyte migration |
| GO:0032722 | 5e-04 | 8.616 | 0.65 | 5 | 50 | positive regulation of chemokine production |
| GO:0006954 | 5e-04 | 2.4799 | 8.6974 | 20 | 669 | inflammatory response |
| GO:1900544 | 5e-04 | 4.7431 | 1.8201 | 8 | 140 | positive regulation of purine nucleotide metabolic process |
| GO:0007166 | 5e-04 | 1.7513 | 34.1656 | 53 | 2628 | cell surface receptor signaling pathway |
| GO:0030801 | 6e-04 | 5.3023 | 1.4301 | 7 | 110 | positive regulation of cyclic nucleotide metabolic process |
| GO:0030802 | 7e-04 | 4.5023 | 1.9111 | 8 | 147 | regulation of cyclic nucleotide biosynthetic process |
| GO:0090317 | 9e-04 | 5.759 | 1.1311 | 6 | 87 | negative regulation of intracellular protein transport |
| GO:1900371 | 0.001 | 4.2551 | 2.0151 | 8 | 155 | regulation of purine nucleotide biosynthetic process |
| GO:0002399 | 0.001 | 76.6364 | 0.052 | 2 | 4 | MHC class II protein complex assembly |
| GO:0060011 | 0.001 | 76.6364 | 0.052 | 2 | 4 | Sertoli cell proliferation |
| GO:0070374 | 0.001 | 3.8134 | 2.5221 | 9 | 194 | positive regulation of ERK1 and ERK2 cascade |
| GO:0030593 | 0.001 | 5.6884 | 1.1441 | 6 | 88 | neutrophil chemotaxis |
| GO:0002687 | 0.001 | 4.7874 | 1.5731 | 7 | 121 | positive regulation of leukocyte migration |
| GO:0071347 | 0.0011 | 5.5523 | 1.1701 | 6 | 90 | cellular response to interleukin-1 |
| GO:0052652 | 0.0011 | 4.1413 | 2.0671 | 8 | 159 | cyclic purine nucleotide metabolic process |
| GO:0042116 | 0.0012 | 6.9188 | 0.793 | 5 | 61 | macrophage activation |
| GO:1902533 | 0.0012 | 2.1137 | 12.2336 | 24 | 941 | positive regulation of intracellular signal transduction |
| GO:0002548 | 0.0013 | 6.797 | 0.806 | 5 | 62 | monocyte chemotaxis |
| GO:0045087 | 0.0014 | 2.1687 | 10.8945 | 22 | 838 | innate immune response |
| GO:0042306 | 0.0014 | 4.0073 | 2.1321 | 8 | 164 | regulation of protein import into nucleus |
| GO:0050921 | 0.0014 | 4.5084 | 1.6641 | 7 | 128 | positive regulation of chemotaxis |
| GO:0042992 | 0.0016 | 8.8248 | 0.507 | 4 | 39 | negative regulation of transcription factor import into nucleus |
| GO:0042699 | 0.0016 | 51.0877 | 0.065 | 2 | 5 | follicle-stimulating hormone signaling pathway |
| GO:0060157 | 0.0016 | 51.0877 | 0.065 | 2 | 5 | urinary bladder development |
| GO:0060437 | 0.0016 | 51.0877 | 0.065 | 2 | 5 | lung growth |
| GO:0045937 | 0.0016 | 2.0056 | 13.9757 | 26 | 1075 | positive regulation of phosphate metabolic process |
| GO:0032101 | 0.002 | 2.2322 | 9.0874 | 19 | 699 | regulation of response to external stimulus |
| GO:0097192 | 0.002 | 6.0509 | 0.897 | 5 | 69 | extrinsic apoptotic signaling pathway in absence of ligand |
| GO:0046823 | 0.0022 | 5.9574 | 0.91 | 5 | 70 | negative regulation of nucleocytoplasmic transport |
| GO:0006140 | 0.0023 | 3.1128 | 3.4062 | 10 | 262 | regulation of nucleotide metabolic process |
| GO:0071346 | 0.0024 | 4.0986 | 1.8201 | 7 | 140 | cellular response to interferon-gamma |
| GO:1901623 | 0.0024 | 12.8213 | 0.273 | 3 | 21 | regulation of lymphocyte chemotaxis |
| GO:0051964 | 0.0024 | 38.3134 | 0.078 | 2 | 6 | negative regulation of synapse assembly |
| GO:0070383 | 0.0024 | 38.3134 | 0.078 | 2 | 6 | DNA cytosine deamination |
| GO:2000503 | 0.0024 | 38.3134 | 0.078 | 2 | 6 | positive regulation of natural killer cell chemotaxis |
| GO:0030810 | 0.0025 | 4.7066 | 1.3651 | 6 | 105 | positive regulation of nucleotide biosynthetic process |
| GO:0010647 | 0.0025 | 1.788 | 20.645 | 34 | 1588 | positive regulation of cell communication |
| GO:0023056 | 0.0027 | 1.7804 | 20.723 | 34 | 1594 | positive regulation of signaling |
| GO:0042330 | 0.0028 | 2.3297 | 7.2933 | 16 | 561 | taxis |
| GO:0030814 | 0.0028 | 3.9779 | 1.8721 | 7 | 144 | regulation of cAMP metabolic process |
| GO:0098657 | 0.003 | 2.1911 | 8.7364 | 18 | 672 | import into cell |
| GO:2000482 | 0.0032 | 11.5377 | 0.299 | 3 | 23 | regulation of interleukin-8 secretion |
| GO:0023014 | 0.0033 | 2.0098 | 11.6876 | 22 | 899 | signal transduction by protein phosphorylation |
| GO:0045869 | 0.0034 | 30.6488 | 0.091 | 2 | 7 | negative regulation of single stranded viral RNA replication via double stranded DNA intermediate |
| GO:0050715 | 0.0034 | 4.3938 | 1.4561 | 6 | 112 | positive regulation of cytokine secretion |
| GO:0002682 | 0.0035 | 1.8083 | 17.8758 | 30 | 1375 | regulation of immune system process |
| GO:0002230 | 0.0036 | 10.9876 | 0.312 | 3 | 24 | positive regulation of defense response to virus by host |
| GO:0045761 | 0.0037 | 5.2299 | 1.027 | 5 | 79 | regulation of adenylate cyclase activity |
| GO:0043408 | 0.0037 | 2.1466 | 8.9054 | 18 | 685 | regulation of MAPK cascade |
| GO:0009607 | 0.004 | 2.0048 | 11.1545 | 21 | 858 | response to biotic stimulus |
| GO:0046688 | 0.004 | 10.4875 | 0.325 | 3 | 25 | response to copper ion |
| GO:0030819 | 0.0041 | 5.0917 | 1.053 | 5 | 81 | positive regulation of cAMP biosynthetic process |
| GO:0051170 | 0.0043 | 2.8378 | 3.7182 | 10 | 286 | nuclear import |
| GO:0042742 | 0.0044 | 3.0318 | 3.1331 | 9 | 241 | defense response to bacterium |
| GO:0060638 | 0.0045 | 25.5391 | 0.104 | 2 | 8 | mesenchymal-epithelial cell signaling |
| GO:0051707 | 0.0048 | 2.0079 | 10.5825 | 20 | 814 | response to other organism |
| GO:0002053 | 0.0056 | 9.2273 | 0.364 | 3 | 28 | positive regulation of mesenchymal cell proliferation |
| GO:1902692 | 0.0056 | 9.2273 | 0.364 | 3 | 28 | regulation of neuroblast proliferation |
| GO:2000147 | 0.0057 | 2.3633 | 5.7983 | 13 | 446 | positive regulation of cell motility |
| GO:0009972 | 0.0057 | 21.8893 | 0.117 | 2 | 9 | cytidine deamination |
| GO:0046087 | 0.0057 | 21.8893 | 0.117 | 2 | 9 | cytidine metabolic process |
| GO:0060513 | 0.0057 | 21.8893 | 0.117 | 2 | 9 | prostatic bud formation |
| GO:0032879 | 0.0064 | 1.5608 | 32.9176 | 47 | 2532 | regulation of localization |
| GO:0072676 | 0.0064 | 4.55 | 1.1701 | 5 | 90 | lymphocyte migration |
| GO:0006955 | 0.0066 | 1.8892 | 12.4387 | 22 | 1013 | immune response |
| GO:0007155 | 0.0066 | 1.7514 | 17.0958 | 28 | 1315 | cell adhesion |
| GO:1902235 | 0.0068 | 8.5427 | 0.39 | 3 | 30 | regulation of endoplasmic reticulum stress-induced intrinsic apoptotic signaling pathway |
| GO:0051349 | 0.0068 | 5.713 | 0.754 | 4 | 58 | positive regulation of lyase activity |
| GO:0010838 | 0.0071 | 19.1519 | 0.13 | 2 | 10 | positive regulation of keratinocyte proliferation |
| GO:0035589 | 0.0071 | 19.1519 | 0.13 | 2 | 10 | G-protein coupled purinergic nucleotide receptor signaling pathway |
| GO:0071436 | 0.0071 | 19.1519 | 0.13 | 2 | 10 | sodium ion export |
| GO:0048584 | 0.0078 | 1.5967 | 26.4043 | 39 | 2031 | positive regulation of response to stimulus |
| GO:0051785 | 0.0081 | 5.4113 | 0.793 | 4 | 61 | positive regulation of nuclear division |
| GO:1904590 | 0.0081 | 5.4113 | 0.793 | 4 | 61 | negative regulation of protein import |
| GO:0002430 | 0.0086 | 17.0229 | 0.143 | 2 | 11 | complement receptor mediated signaling pathway |
| GO:0016553 | 0.0086 | 17.0229 | 0.143 | 2 | 11 | base conversion or substitution editing |
| GO:0046133 | 0.0086 | 17.0229 | 0.143 | 2 | 11 | pyrimidine ribonucleoside catabolic process |
| GO:0072672 | 0.0086 | 17.0229 | 0.143 | 2 | 11 | neutrophil extravasation |
| GO:1904591 | 0.0087 | 4.2019 | 1.2611 | 5 | 97 | positive regulation of protein import |
| GO:0051223 | 0.0094 | 1.9422 | 9.7765 | 18 | 752 | regulation of protein transport |
| GOMFID | Pvalue | OddsRatio | ExpCount | Count | Size | Term |
| GO:0050911 | 0 | 6.3527 | 3.488 | 19 | 370 | detection of chemical stimulus involved in sensory perception of smell |
| GO:0009593 | 0 | 5.485 | 4.2327 | 20 | 449 | detection of chemical stimulus |
| GO:0007186 | 0 | 3.5182 | 11.7168 | 34 | 1251 | G-protein coupled receptor signaling pathway |
| GO:0050906 | 0 | 5.3317 | 4.3458 | 20 | 461 | detection of stimulus involved in sensory perception |
| GO:0007606 | 0 | 5.2581 | 4.4024 | 20 | 467 | sensory perception of chemical stimulus |
| GO:0030593 | 0 | 9.4683 | 0.8296 | 7 | 88 | neutrophil chemotaxis |
| GO:0050877 | 1e-04 | 2.5751 | 11.4067 | 26 | 1210 | nervous system process |
| GO:0070098 | 1e-04 | 8.8268 | 0.7542 | 6 | 80 | chemokine-mediated signaling pathway |
| GO:0097530 | 2e-04 | 6.6548 | 1.1501 | 7 | 122 | granulocyte migration |
| GO:0006954 | 2e-04 | 2.9572 | 6.3067 | 17 | 669 | inflammatory response |
| GO:0071347 | 2e-04 | 7.7711 | 0.8484 | 6 | 90 | cellular response to interleukin-1 |
| GO:0048247 | 2e-04 | 10.2142 | 0.5468 | 5 | 58 | lymphocyte chemotaxis |
| GO:0002548 | 3e-04 | 9.495 | 0.5845 | 5 | 62 | monocyte chemotaxis |
| GO:0071346 | 4e-04 | 5.7477 | 1.3198 | 7 | 140 | cellular response to interferon-gamma |
| GO:0070613 | 5e-04 | 6.6551 | 0.9804 | 6 | 104 | regulation of protein processing |
| GO:0070374 | 5e-04 | 4.7137 | 1.8288 | 8 | 194 | positive regulation of ERK1 and ERK2 cascade |
| GO:0060326 | 8e-04 | 3.9249 | 2.4604 | 9 | 261 | cell chemotaxis |
| GO:0010675 | 8e-04 | 5.8709 | 1.103 | 6 | 117 | regulation of cellular carbohydrate metabolic process |
| GO:0070173 | 9e-04 | 70.9669 | 0.0471 | 2 | 5 | regulation of enamel mineralization |
| GO:0019319 | 9e-04 | 7.2081 | 0.7542 | 5 | 80 | hexose biosynthetic process |
| GO:0003071 | 0.0013 | 16.057 | 0.2168 | 3 | 23 | renal system process involved in regulation of systemic arterial blood pressure |
| GO:0016051 | 0.002 | 4.2344 | 1.7628 | 7 | 187 | carbohydrate biosynthetic process |
| GO:0002480 | 0.0024 | 35.4768 | 0.0754 | 2 | 8 | antigen processing and presentation of exogenous peptide antigen via MHC class I, TAP-independent |
| GO:0035865 | 0.0024 | 35.4768 | 0.0754 | 2 | 8 | cellular response to potassium ion |
| GO:0006007 | 0.0025 | 12.3469 | 0.2734 | 3 | 29 | glucose catabolic process |
| GO:0097398 | 0.003 | 30.4068 | 0.0848 | 2 | 9 | cellular response to interleukin-17 |
| GO:0006958 | 0.0033 | 11.0676 | 0.3017 | 3 | 32 | complement activation, classical pathway |
| GO:0006955 | 0.004 | 1.8298 | 17.4494 | 29 | 1851 | immune response |
| GO:0034097 | 0.0042 | 2.135 | 9.0782 | 18 | 963 | response to cytokine |
| GO:0060612 | 0.0043 | 10.0281 | 0.3299 | 3 | 35 | adipose tissue development |
| GO:0045722 | 0.0046 | 23.6468 | 0.1037 | 2 | 11 | positive regulation of gluconeogenesis |
| GO:0051593 | 0.0046 | 23.6468 | 0.1037 | 2 | 11 | response to folic acid |
| GO:0070486 | 0.0046 | 23.6468 | 0.1037 | 2 | 11 | leukocyte aggregation |
| GO:0050900 | 0.0052 | 2.7691 | 3.8274 | 10 | 406 | leukocyte migration |
| GO:0001659 | 0.0054 | 9.1669 | 0.3582 | 3 | 38 | temperature homeostasis |
| GO:0001660 | 0.0055 | 21.2808 | 0.1131 | 2 | 12 | fever generation |
| GO:0006957 | 0.0055 | 21.2808 | 0.1131 | 2 | 12 | complement activation, alternative pathway |
| GO:0010896 | 0.0055 | 21.2808 | 0.1131 | 2 | 12 | regulation of triglyceride catabolic process |
| GO:0031424 | 0.0056 | 3.4718 | 2.1305 | 7 | 226 | keratinization |
| GO:0070542 | 0.0069 | 5.6521 | 0.7542 | 4 | 80 | response to fatty acid |
| GO:0010469 | 0.0069 | 2.4072 | 5.2885 | 12 | 561 | regulation of receptor activity |
| GO:0006000 | 0.0075 | 17.7318 | 0.132 | 2 | 14 | fructose metabolic process |
| GO:0072376 | 0.0075 | 5.5065 | 0.773 | 4 | 82 | protein activation cascade |
| GO:0009812 | 0.0086 | 16.3668 | 0.1414 | 2 | 15 | flavonoid metabolic process |
| GO:0003147 | 0.0094 | Inf | 0.0094 | 1 | 1 | neural crest cell migration involved in heart formation |
| GO:0007522 | 0.0094 | Inf | 0.0094 | 1 | 1 | visceral muscle development |
| GO:0010232 | 0.0094 | Inf | 0.0094 | 1 | 1 | vascular transport |
| GO:0010920 | 0.0094 | Inf | 0.0094 | 1 | 1 | negative regulation of inositol phosphate biosynthetic process |
| GO:0010925 | 0.0094 | Inf | 0.0094 | 1 | 1 | positive regulation of inositol-polyphosphate 5-phosphatase activity |
| GO:0010987 | 0.0094 | Inf | 0.0094 | 1 | 1 | negative regulation of high-density lipoprotein particle clearance |
| GO:0030845 | 0.0094 | Inf | 0.0094 | 1 | 1 | phospholipase C-inhibiting G-protein coupled receptor signaling pathway |
| GO:0033274 | 0.0094 | Inf | 0.0094 | 1 | 1 | response to vitamin B2 |
| GO:0034337 | 0.0094 | Inf | 0.0094 | 1 | 1 | RNA folding |
| GO:0036305 | 0.0094 | Inf | 0.0094 | 1 | 1 | ameloblast differentiation |
| GO:0043251 | 0.0094 | Inf | 0.0094 | 1 | 1 | sodium-dependent organic anion transport |
| GO:0060305 | 0.0094 | Inf | 0.0094 | 1 | 1 | regulation of cell diameter |
| GO:0061713 | 0.0094 | Inf | 0.0094 | 1 | 1 | anterior neural tube closure |
| GO:0070829 | 0.0094 | Inf | 0.0094 | 1 | 1 | heterochromatin maintenance |
| GO:0071250 | 0.0094 | Inf | 0.0094 | 1 | 1 | cellular response to nitrite |
| GO:1904635 | 0.0094 | Inf | 0.0094 | 1 | 1 | positive regulation of glomerular visceral epithelial cell apoptotic process |
| GO:1905322 | 0.0094 | Inf | 0.0094 | 1 | 1 | positive regulation of mesenchymal stem cell migration |
| GO:2000119 | 0.0094 | Inf | 0.0094 | 1 | 1 | negative regulation of sodium-dependent phosphate transport |
| GO:2000184 | 0.0094 | Inf | 0.0094 | 1 | 1 | positive regulation of progesterone biosynthetic process |
| GO:0009605 | 0.0099 | 1.6839 | 19.4573 | 30 | 2064 | response to external stimulus |
| GOMFID | Pvalue | OddsRatio | ExpCount | Count | Size | Term |
| GO:0006952 | 1e-04 | 1.9614 | 27.5601 | 49 | 1491 | defense response |
| GO:1901687 | 5e-04 | 12.6494 | 0.3882 | 4 | 21 | glutathione derivative biosynthetic process |
| GO:0031953 | 9e-04 | 20.1035 | 0.2033 | 3 | 11 | negative regulation of protein autophosphorylation |
| GO:0061044 | 0.001 | 106.906 | 0.0555 | 2 | 3 | negative regulation of vascular wound healing |
| GO:0070340 | 0.001 | 106.906 | 0.0555 | 2 | 3 | detection of bacterial lipopeptide |
| GO:1903825 | 0.0011 | 4.2099 | 2.0518 | 8 | 111 | organic acid transmembrane transport |
| GO:0030157 | 0.0012 | 17.8687 | 0.2218 | 3 | 12 | pancreatic juice secretion |
| GO:0008588 | 0.002 | 53.4497 | 0.0739 | 2 | 4 | release of cytoplasmic sequestered NF-kappaB |
| GO:0014722 | 0.002 | 53.4497 | 0.0739 | 2 | 4 | regulation of skeletal muscle contraction by calcium ion signaling |
| GO:0050727 | 0.0023 | 2.5417 | 5.8226 | 14 | 315 | regulation of inflammatory response |
| GO:0008595 | 0.0024 | 13.399 | 0.2773 | 3 | 15 | anterior/posterior axis specification, embryo |
| GO:0043409 | 0.0027 | 3.2757 | 2.9205 | 9 | 158 | negative regulation of MAPK cascade |
| GO:0030198 | 0.0031 | 2.4504 | 6.0259 | 14 | 326 | extracellular matrix organization |
| GO:0051459 | 0.0033 | 35.6309 | 0.0924 | 2 | 5 | regulation of corticotropin secretion |
| GO:0061302 | 0.0033 | 35.6309 | 0.0924 | 2 | 5 | smooth muscle cell-matrix adhesion |
| GO:0007350 | 0.0042 | 10.7172 | 0.3327 | 3 | 18 | blastoderm segmentation |
| GO:0031589 | 0.0043 | 2.4429 | 5.6007 | 13 | 303 | cell-substrate adhesion |
| GO:0002376 | 0.0046 | 1.4722 | 49.353 | 67 | 2670 | immune system process |
| GO:0050776 | 0.0047 | 1.7863 | 16.5619 | 28 | 896 | regulation of immune response |
| GO:0003180 | 0.0049 | 26.7215 | 0.1109 | 2 | 6 | aortic valve morphogenesis |
| GO:0071221 | 0.0049 | 26.7215 | 0.1109 | 2 | 6 | cellular response to bacterial lipopeptide |
| GO:0010941 | 0.0059 | 1.5747 | 29.0758 | 43 | 1573 | regulation of cell death |
| GO:0019673 | 0.0067 | 21.3758 | 0.1294 | 2 | 7 | GDP-mannose metabolic process |
| GO:0032493 | 0.0067 | 21.3758 | 0.1294 | 2 | 7 | response to bacterial lipoprotein |
| GO:0070244 | 0.0067 | 21.3758 | 0.1294 | 2 | 7 | negative regulation of thymocyte apoptotic process |
| GO:0043069 | 0.0069 | 1.7667 | 15.4898 | 26 | 838 | negative regulation of programmed cell death |
| GO:0070227 | 0.0079 | 4.3379 | 1.2384 | 5 | 67 | lymphocyte apoptotic process |
| GO:0032967 | 0.0084 | 8.0354 | 0.4251 | 3 | 23 | positive regulation of collagen biosynthetic process |
| GO:0045410 | 0.0089 | 17.8121 | 0.1479 | 2 | 8 | positive regulation of interleukin-6 biosynthetic process |
| GO:0003333 | 0.0089 | 4.2018 | 1.2754 | 5 | 69 | amino acid transmembrane transport |
| GO:0080134 | 0.0091 | 1.5793 | 24.7689 | 37 | 1340 | regulation of response to stress |
| GO:0007155 | 0.0091 | 1.676 | 18.236 | 29 | 1012 | cell adhesion |
| GO:0010876 | 0.0092 | 2.1415 | 6.8392 | 14 | 370 | lipid localization |
| GO:0044253 | 0.0095 | 7.6522 | 0.4436 | 3 | 24 | positive regulation of multicellular organismal metabolic process |
| GOMFID | Pvalue | OddsRatio | ExpCount | Count | Size | Term |
| GO:0002682 | 1e-04 | 2.2303 | 16.5203 | 33 | 1375 | regulation of immune system process |
| GO:0002548 | 1e-04 | 9.0584 | 0.7449 | 6 | 62 | monocyte chemotaxis |
| GO:0007186 | 2e-04 | 2.204 | 15.0425 | 30 | 1252 | G-protein coupled receptor signaling pathway |
| GO:0060326 | 3e-04 | 3.7747 | 3.1359 | 11 | 261 | cell chemotaxis |
| GO:0050829 | 3e-04 | 7.0384 | 0.9372 | 6 | 78 | defense response to Gram-negative bacterium |
| GO:0050729 | 4e-04 | 5.7593 | 1.3216 | 7 | 110 | positive regulation of inflammatory response |
| GO:0045087 | 4e-04 | 2.4146 | 9.9087 | 22 | 833 | innate immune response |
| GO:0070098 | 4e-04 | 6.8473 | 0.9612 | 6 | 80 | chemokine-mediated signaling pathway |
| GO:0010710 | 4e-04 | 166.1554 | 0.036 | 2 | 3 | regulation of collagen catabolic process |
| GO:0050911 | 5e-04 | 3.1369 | 4.4455 | 13 | 370 | detection of chemical stimulus involved in sensory perception of smell |
| GO:0050830 | 6e-04 | 6.2528 | 1.0453 | 6 | 87 | defense response to Gram-positive bacterium |
| GO:0050852 | 8e-04 | 4.383 | 1.9584 | 8 | 163 | T cell receptor signaling pathway |
| GO:1903039 | 0.0011 | 3.755 | 2.5591 | 9 | 213 | positive regulation of leukocyte cell-cell adhesion |
| GO:0031295 | 0.0013 | 6.7797 | 0.805 | 5 | 67 | T cell costimulation |
| GO:0061760 | 0.0014 | 55.3782 | 0.0601 | 2 | 5 | antifungal innate immune response |
| GO:0007606 | 0.0016 | 2.6606 | 5.6109 | 14 | 467 | sensory perception of chemical stimulus |
| GO:0051716 | 0.0016 | 1.5459 | 82.1571 | 103 | 6838 | cellular response to stimulus |
| GO:0002688 | 0.0018 | 5.0587 | 1.2736 | 6 | 106 | regulation of leukocyte chemotaxis |
| GO:0032101 | 0.0019 | 2.2928 | 8.3983 | 18 | 699 | regulation of response to external stimulus |
| GO:0002790 | 0.0021 | 2.4864 | 6.4279 | 15 | 535 | peptide secretion |
| GO:0002583 | 0.0021 | 41.5311 | 0.0721 | 2 | 6 | regulation of antigen processing and presentation of peptide antigen |
| GO:0070383 | 0.0021 | 41.5311 | 0.0721 | 2 | 6 | DNA cytosine deamination |
| GO:0009593 | 0.0023 | 2.6512 | 5.212 | 13 | 438 | detection of chemical stimulus |
| GO:0045869 | 0.0029 | 33.2228 | 0.0841 | 2 | 7 | negative regulation of single stranded viral RNA replication via double stranded DNA intermediate |
| GO:1903012 | 0.0029 | 33.2228 | 0.0841 | 2 | 7 | positive regulation of bone development |
| GO:1904468 | 0.0029 | 33.2228 | 0.0841 | 2 | 7 | negative regulation of tumor necrosis factor secretion |
| GO:0050778 | 0.003 | 2.2497 | 8.0499 | 17 | 670 | positive regulation of immune response |
| GO:0006950 | 0.0033 | 1.5659 | 43.3133 | 60 | 3605 | response to stress |
| GO:0002687 | 0.0034 | 4.3948 | 1.4538 | 6 | 121 | positive regulation of leukocyte migration |
| GO:0009607 | 0.0035 | 2.0726 | 10.3087 | 20 | 858 | response to biotic stimulus |
| GO:0002887 | 0.0038 | 27.6839 | 0.0961 | 2 | 8 | negative regulation of myeloid leukocyte mediated immunity |
| GO:1904628 | 0.0038 | 27.6839 | 0.0961 | 2 | 8 | cellular response to phorbol 13-acetate 12-myristate |
| GO:0050906 | 0.0039 | 2.4852 | 5.5388 | 13 | 461 | detection of stimulus involved in sensory perception |
| GO:0006968 | 0.004 | 6.6953 | 0.6488 | 4 | 54 | cellular defense response |
| GO:0051251 | 0.0043 | 3.0428 | 3.1238 | 9 | 260 | positive regulation of lymphocyte activation |
| GO:0051707 | 0.0044 | 2.0695 | 9.78 | 19 | 814 | response to other organism |
| GO:0031347 | 0.0045 | 2.1566 | 8.3743 | 17 | 697 | regulation of defense response |
| GO:0050921 | 0.0045 | 4.1408 | 1.5379 | 6 | 128 | positive regulation of chemotaxis |
| GO:0033993 | 0.0047 | 2.0141 | 10.585 | 20 | 881 | response to lipid |
| GO:0008354 | 0.0049 | 23.7276 | 0.1081 | 2 | 9 | germ cell migration |
| GO:0009972 | 0.0049 | 23.7276 | 0.1081 | 2 | 9 | cytidine deamination |
| GO:0042747 | 0.0049 | 23.7276 | 0.1081 | 2 | 9 | circadian sleep/wake cycle, REM sleep |
| GO:0043301 | 0.0049 | 23.7276 | 0.1081 | 2 | 9 | negative regulation of leukocyte degranulation |
| GO:0046087 | 0.0049 | 23.7276 | 0.1081 | 2 | 9 | cytidine metabolic process |
| GO:2000510 | 0.0049 | 23.7276 | 0.1081 | 2 | 9 | positive regulation of dendritic cell chemotaxis |
| GO:0036336 | 0.005 | 9.6208 | 0.3484 | 3 | 29 | dendritic cell migration |
| GO:0042035 | 0.005 | 4.824 | 1.1054 | 5 | 92 | regulation of cytokine biosynthetic process |
| GO:0048247 | 0.0052 | 6.1978 | 0.6969 | 4 | 58 | lymphocyte chemotaxis |
| GO:0060135 | 0.0052 | 6.1978 | 0.6969 | 4 | 58 | maternal process involved in female pregnancy |
| GO:0051339 | 0.0058 | 4.6623 | 1.1414 | 5 | 95 | regulation of lyase activity |
| GO:0032677 | 0.0058 | 5.9757 | 0.7209 | 4 | 60 | regulation of interleukin-8 production |
| GO:0032729 | 0.0058 | 5.9757 | 0.7209 | 4 | 60 | positive regulation of interferon-gamma production |
| GO:0042102 | 0.006 | 4.6108 | 1.1534 | 5 | 96 | positive regulation of T cell proliferation |
| GO:0033004 | 0.0061 | 20.7604 | 0.1201 | 2 | 10 | negative regulation of mast cell activation |
| GO:0090085 | 0.0061 | 20.7604 | 0.1201 | 2 | 10 | regulation of protein deubiquitination |
| GO:0072529 | 0.0071 | 8.3359 | 0.3965 | 3 | 33 | pyrimidine-containing compound catabolic process |
| GO:0016553 | 0.0074 | 18.4525 | 0.1322 | 2 | 11 | base conversion or substitution editing |
| GO:0032490 | 0.0074 | 18.4525 | 0.1322 | 2 | 11 | detection of molecule of bacterial origin |
| GO:0045591 | 0.0074 | 18.4525 | 0.1322 | 2 | 11 | positive regulation of regulatory T cell differentiation |
| GO:0045953 | 0.0074 | 18.4525 | 0.1322 | 2 | 11 | negative regulation of natural killer cell mediated cytotoxicity |
| GO:0046133 | 0.0074 | 18.4525 | 0.1322 | 2 | 11 | pyrimidine ribonucleoside catabolic process |
| GO:0046689 | 0.0074 | 18.4525 | 0.1322 | 2 | 11 | response to mercury ion |
| GO:0023052 | 0.0074 | 1.4401 | 72.9658 | 90 | 6073 | signaling |
| GO:0007154 | 0.0083 | 1.4317 | 73.2301 | 90 | 6095 | cell communication |
| GO:0050663 | 0.0084 | 3.2076 | 2.2948 | 7 | 191 | cytokine secretion |
| GO:0002715 | 0.0084 | 7.814 | 0.4205 | 3 | 35 | regulation of natural killer cell mediated immunity |
| GO:0042107 | 0.0087 | 4.1934 | 1.2616 | 5 | 105 | cytokine metabolic process |
| GO:0090276 | 0.0091 | 3.1555 | 2.3309 | 7 | 194 | regulation of peptide hormone secretion |
| GO:0002768 | 0.0097 | 2.5028 | 4.1932 | 10 | 349 | immune response-regulating cell surface receptor signaling pathway |
| GO:0007340 | 0.0098 | 7.3534 | 0.4445 | 3 | 37 | acrosome reaction |
| GO:1901998 | 0.0098 | 7.3534 | 0.4445 | 3 | 37 | toxin transport |
| GOMFID | Pvalue | OddsRatio | ExpCount | Count | Size | Term |
| GO:0050776 | 0 | 2.3027 | 16.6171 | 35 | 896 | regulation of immune response |
| GO:0045321 | 1e-04 | 2.0405 | 20.8085 | 39 | 1122 | leukocyte activation |
| GO:0098657 | 3e-04 | 2.2367 | 12.4628 | 26 | 672 | import into cell |
| GO:0018003 | 3e-04 | Inf | 0.0371 | 2 | 2 | peptidyl-lysine N6-acetylation |
| GO:0090149 | 3e-04 | Inf | 0.0371 | 2 | 2 | mitochondrial membrane fission |
| GO:0044868 | 0.001 | 106.5418 | 0.0556 | 2 | 3 | modulation by host of viral molecular function |
| GO:2000502 | 0.001 | 106.5418 | 0.0556 | 2 | 3 | negative regulation of natural killer cell chemotaxis |
| GO:0019884 | 0.0014 | 3.3446 | 3.1899 | 10 | 172 | antigen processing and presentation of exogenous antigen |
| GO:0002252 | 0.0016 | 1.8231 | 19.9183 | 34 | 1074 | immune effector process |
| GO:0019886 | 0.0017 | 4.3862 | 1.7248 | 7 | 93 | antigen processing and presentation of exogenous peptide antigen via MHC class II |
| GO:0050863 | 0.0019 | 2.5942 | 5.7121 | 14 | 308 | regulation of T cell activation |
| GO:0006933 | 0.002 | 53.2676 | 0.0742 | 2 | 4 | negative regulation of cell adhesion involved in substrate-bound cell migration |
| GO:0070212 | 0.002 | 53.2676 | 0.0742 | 2 | 4 | protein poly-ADP-ribosylation |
| GO:0070213 | 0.002 | 53.2676 | 0.0742 | 2 | 4 | protein auto-ADP-ribosylation |
| GO:0035195 | 0.0021 | 2.6784 | 5.1372 | 13 | 277 | gene silencing by miRNA |
| GO:0070306 | 0.0022 | 8.2378 | 0.5564 | 4 | 30 | lens fiber cell differentiation |
| GO:0002504 | 0.0022 | 4.1902 | 1.799 | 7 | 97 | antigen processing and presentation of peptide or polysaccharide antigen via MHC class II |
| GO:0045123 | 0.0023 | 5.9625 | 0.9273 | 5 | 50 | cellular extravasation |
| GO:0016441 | 0.0026 | 2.6081 | 5.267 | 13 | 284 | posttranscriptional gene silencing |
| GO:0007159 | 0.0028 | 2.3975 | 6.6023 | 15 | 356 | leukocyte cell-cell adhesion |
| GO:0051351 | 0.0033 | 35.5095 | 0.0927 | 2 | 5 | positive regulation of ligase activity |
| GO:0042110 | 0.0039 | 3.3677 | 2.5236 | 8 | 140 | T cell activation |
| GO:0022407 | 0.0041 | 2.2251 | 7.5667 | 16 | 408 | regulation of cell-cell adhesion |
| GO:0034182 | 0.0049 | 26.6304 | 0.1113 | 2 | 6 | regulation of maintenance of mitotic sister chromatid cohesion |
| GO:0052428 | 0.0049 | 26.6304 | 0.1113 | 2 | 6 | modulation by host of symbiont molecular function |
| GO:0090677 | 0.0049 | 26.6304 | 0.1113 | 2 | 6 | reversible differentiation |
| GO:0031047 | 0.005 | 2.4005 | 5.6936 | 13 | 307 | gene silencing by RNA |
| GO:0060337 | 0.0053 | 4.0294 | 1.5949 | 6 | 86 | type I interferon signaling pathway |
| GO:0045087 | 0.0054 | 1.8522 | 13.6542 | 24 | 747 | innate immune response |
| GO:0006898 | 0.0054 | 2.4734 | 5.1001 | 12 | 275 | receptor-mediated endocytosis |
| GO:0002250 | 0.0056 | 2.2776 | 6.454 | 14 | 348 | adaptive immune response |
| GO:0010881 | 0.0057 | 9.4228 | 0.3709 | 3 | 20 | regulation of cardiac muscle contraction by regulation of the release of sequestered calcium ion |
| GO:0051152 | 0.0057 | 9.4228 | 0.3709 | 3 | 20 | positive regulation of smooth muscle cell differentiation |
| GO:0048002 | 0.0058 | 2.8916 | 3.2826 | 9 | 177 | antigen processing and presentation of peptide antigen |
| GO:0030219 | 0.0059 | 3.9306 | 1.632 | 6 | 88 | megakaryocyte differentiation |
| GO:0002449 | 0.0061 | 2.689 | 3.9132 | 10 | 211 | lymphocyte mediated immunity |
| GO:0006417 | 0.0065 | 1.973 | 10.1075 | 19 | 545 | regulation of translation |
| GO:0010447 | 0.0066 | 8.8988 | 0.3895 | 3 | 21 | response to acidic pH |
| GO:0051971 | 0.0068 | 21.303 | 0.1298 | 2 | 7 | positive regulation of transmission of nerve impulse |
| GO:0080009 | 0.0068 | 21.303 | 0.1298 | 2 | 7 | mRNA methylation |
| GO:0034340 | 0.0069 | 3.7912 | 1.6877 | 6 | 91 | response to type I interferon |
| GO:0019827 | 0.0069 | 3.0355 | 2.7819 | 8 | 150 | stem cell population maintenance |
| GO:0002455 | 0.0075 | 5.6321 | 0.7789 | 4 | 42 | humoral immune response mediated by circulating immunoglobulin |
| GO:0030728 | 0.0075 | 8.4299 | 0.408 | 3 | 22 | ovulation |
| GO:0006950 | 0.0079 | 1.3873 | 66.858 | 85 | 3605 | response to stress |
| GO:0050794 | 0.0081 | 1.3584 | 185.7184 | 206 | 10076 | regulation of cellular process |
| GO:0070534 | 0.0088 | 5.3498 | 0.816 | 4 | 44 | protein K63-linked ubiquitination |
| GO:0044359 | 0.0089 | 17.7514 | 0.1484 | 2 | 8 | modulation of molecular function in other organism |
| GO:1900239 | 0.0089 | 17.7514 | 0.1484 | 2 | 8 | regulation of phenotypic switching |
| GO:0032943 | 0.0092 | 2.3984 | 4.8034 | 11 | 259 | mononuclear cell proliferation |
| GO:0043330 | 0.0095 | 5.219 | 0.8346 | 4 | 45 | response to exogenous dsRNA |
| GO:0071310 | 0.0097 | 1.441 | 43.8425 | 59 | 2364 | cellular response to organic substance |
| GOMFID | Pvalue | OddsRatio | ExpCount | Count | Size | Term |
| GO:0031726 | 0 | 111.4256 | 0.0673 | 3 | 5 | CCR1 chemokine receptor binding |
| GO:0008009 | 0 | 10.7352 | 0.6463 | 6 | 48 | chemokine activity |
| GO:0005126 | 1e-04 | 3.9883 | 3.5411 | 13 | 263 | cytokine receptor binding |
| GO:0030545 | 2e-04 | 2.8845 | 6.3551 | 17 | 472 | receptor regulator activity |
| GO:0001875 | 0.0018 | 49.2901 | 0.0673 | 2 | 5 | lipopolysaccharide receptor activity |
| GO:0031730 | 0.0026 | 36.9653 | 0.0808 | 2 | 6 | CCR5 chemokine receptor binding |
| GO:0004065 | 0.0048 | 24.6404 | 0.1077 | 2 | 8 | arylsulfatase activity |
| GO:0004126 | 0.0048 | 24.6404 | 0.1077 | 2 | 8 | cytidine deaminase activity |
| GO:0001540 | 0.0049 | 6.3337 | 0.6867 | 4 | 51 | amyloid-beta binding |
| GO:0005125 | 0.0068 | 3.3446 | 2.2063 | 7 | 168 | cytokine activity |
| GO:0008474 | 0.0076 | 18.478 | 0.1346 | 2 | 10 | palmitoyl-(protein) hydrolase activity |
| GO:0048020 | 0.0079 | 8.0559 | 0.4119 | 3 | 31 | CCR chemokine receptor binding |
| GOMFID | Pvalue | OddsRatio | ExpCount | Count | Size | Term |
| GO:0005126 | 0 | 4.6809 | 3.0538 | 13 | 263 | cytokine receptor binding |
| GO:0031726 | 0 | 129.7378 | 0.0581 | 3 | 5 | CCR1 chemokine receptor binding |
| GO:0030545 | 1e-04 | 3.1716 | 5.4806 | 16 | 472 | receptor regulator activity |
| GO:0008009 | 2e-04 | 10.1411 | 0.5573 | 5 | 48 | chemokine activity |
| GO:0005125 | 7e-04 | 4.5143 | 1.9045 | 8 | 168 | cytokine activity |
| GO:0038024 | 0.0012 | 6.913 | 0.7896 | 5 | 68 | cargo receptor activity |
| GO:0001875 | 0.0013 | 57.3477 | 0.0581 | 2 | 5 | lipopolysaccharide receptor activity |
| GO:0031730 | 0.002 | 43.0081 | 0.0697 | 2 | 6 | CCR5 chemokine receptor binding |
| GO:0001540 | 0.0029 | 7.3802 | 0.5922 | 4 | 51 | amyloid-beta binding |
| GO:0004465 | 0.0036 | 28.6685 | 0.0929 | 2 | 8 | lipoprotein lipase activity |
| GO:0005164 | 0.0045 | 9.9649 | 0.3367 | 3 | 29 | tumor necrosis factor receptor binding |
| GO:0052689 | 0.0046 | 4.1211 | 1.5443 | 6 | 133 | carboxylic ester hydrolase activity |
| GO:0060089 | 0.0059 | 1.7583 | 17.8003 | 29 | 1533 | molecular transducer activity |
| GOMFID | Pvalue | OddsRatio | ExpCount | Count | Size | Term |
| GO:0008157 | 7e-04 | 11.8425 | 0.428 | 4 | 18 | protein phosphatase 1 binding |
| GO:0004860 | 0.0017 | 3.9247 | 2.2114 | 8 | 93 | protein kinase inhibitor activity |
| GO:0034186 | 0.0033 | 41.2637 | 0.0951 | 2 | 4 | apolipoprotein A-I binding |
| GO:0019207 | 0.0037 | 2.6026 | 4.8746 | 12 | 205 | kinase regulator activity |
| GO:0000268 | 0.0054 | 27.5074 | 0.1189 | 2 | 5 | peroxisome targeting sequence binding |
| GO:0016833 | 0.0079 | 20.6292 | 0.1427 | 2 | 6 | oxo-acid-lyase activity |
| GO:0042288 | 0.0083 | 8.2675 | 0.428 | 3 | 18 | MHC class I protein binding |
| GOMFID | Pvalue | OddsRatio | ExpCount | Count | Size | Term |
| GO:0019207 | 6e-04 | 2.8492 | 5.647 | 15 | 205 | kinase regulator activity |
| GO:0030366 | 8e-04 | Inf | 0.0551 | 2 | 2 | molybdopterin synthase activity |
| GO:0016773 | 0.0013 | 1.8194 | 20.3566 | 35 | 739 | phosphotransferase activity, alcohol group as acceptor |
| GO:0016301 | 0.0015 | 1.7739 | 22.0645 | 37 | 801 | kinase activity |
| GO:0001224 | 0.0022 | 70.9189 | 0.0826 | 2 | 3 | RNA polymerase II transcription cofactor binding |
| GO:0005166 | 0.0022 | 70.9189 | 0.0826 | 2 | 3 | neurotrophin p75 receptor binding |
| GO:0061649 | 0.0022 | 70.9189 | 0.0826 | 2 | 3 | ubiquitin modification-dependent histone binding |
| GO:0004860 | 0.0041 | 3.365 | 2.5618 | 8 | 93 | protein kinase inhibitor activity |
| GO:0005087 | 0.0044 | 35.4572 | 0.1102 | 2 | 4 | Ran guanyl-nucleotide exchange factor activity |
| GO:0005521 | 0.0074 | 8.8787 | 0.4132 | 3 | 15 | lamin binding |
| GO:0004674 | 0.0077 | 1.8668 | 11.7622 | 21 | 427 | protein serine/threonine kinase activity |
| GO:0032555 | 0.0087 | 1.4123 | 48.5363 | 65 | 1762 | purine ribonucleotide binding |
| GO:0004722 | 0.0089 | 3.6254 | 1.7905 | 6 | 65 | protein serine/threonine phosphatase activity |
| GOMFID | Pvalue | OddsRatio | ExpCount | Count | Size | Term |
| GO:0004792 | 7e-04 | 130.1469 | 0.0458 | 2 | 3 | thiosulfate sulfurtransferase activity |
| GO:0004984 | 0.0046 | 2.4256 | 5.6445 | 13 | 370 | olfactory receptor activity |
| GO:0003909 | 0.0046 | 26.0229 | 0.1068 | 2 | 7 | DNA ligase activity |
| GO:0004126 | 0.0061 | 21.6844 | 0.122 | 2 | 8 | cytidine deaminase activity |
| GO:0038023 | 0.0069 | 1.69 | 19.5116 | 31 | 1279 | signaling receptor activity |
| GO:0030515 | 0.0087 | 7.829 | 0.4272 | 3 | 28 | snoRNA binding |
| GO:0045028 | 0.0096 | 16.2612 | 0.1526 | 2 | 10 | G-protein coupled purinergic nucleotide receptor activity |
| GOMFID | Pvalue | OddsRatio | ExpCount | Count | Size | Term |
| GO:0060089 | 0 | 2.2553 | 18.5577 | 37 | 1533 | molecular transducer activity |
| GO:0004984 | 0 | 3.6511 | 4.479 | 15 | 370 | olfactory receptor activity |
| GO:0099600 | 1e-04 | 2.3417 | 14.7566 | 31 | 1219 | transmembrane receptor activity |
| GO:0038023 | 1e-04 | 2.3077 | 15.4829 | 32 | 1279 | signaling receptor activity |
| GO:0004930 | 1e-04 | 2.6651 | 9.4786 | 23 | 783 | G-protein coupled receptor activity |
| GO:0003909 | 0.0029 | 32.9691 | 0.0847 | 2 | 7 | DNA ligase activity |
| GO:0005549 | 0.0033 | 5.342 | 1.0048 | 5 | 83 | odorant binding |
| GO:0004126 | 0.0039 | 27.4725 | 0.0968 | 2 | 8 | cytidine deaminase activity |
| GO:0030548 | 0.0062 | 20.6018 | 0.1211 | 2 | 10 | acetylcholine receptor regulator activity |
| GO:0004062 | 0.0089 | 16.4794 | 0.1453 | 2 | 12 | aryl sulfotransferase activity |
| GOMFID | Pvalue | OddsRatio | ExpCount | Count | Size | Term |
| GO:0032394 | 2e-04 | Inf | 0.0298 | 2 | 2 | MHC class Ib receptor activity |
| GO:0000253 | 0.0013 | 66.728 | 0.0595 | 2 | 4 | 3-keto sterol reductase activity |
| GO:0030246 | 0.0057 | 2.7186 | 3.8701 | 10 | 260 | carbohydrate binding |
| GO:0016861 | 0.0058 | 22.2371 | 0.1191 | 2 | 8 | intramolecular oxidoreductase activity, interconverting aldoses and ketoses |
| GO:0052659 | 0.0058 | 22.2371 | 0.1191 | 2 | 8 | inositol-1,3,4,5-tetrakisphosphate 5-phosphatase activity |
| GO:0019864 | 0.0092 | 16.6757 | 0.1488 | 2 | 10 | IgG binding |
| GO:0046030 | 0.0092 | 16.6757 | 0.1488 | 2 | 10 | inositol trisphosphate phosphatase activity |
| GOMFID | Pvalue | OddsRatio | ExpCount | Count | Size | Term |
| GO:0015037 | 4e-04 | 25.9346 | 0.1509 | 3 | 13 | peptide disulfide oxidoreductase activity |
| GO:0004890 | 8e-04 | 19.9459 | 0.1858 | 3 | 16 | GABA-A receptor activity |
| GO:0004957 | 0.002 | 43.0081 | 0.0697 | 2 | 6 | prostaglandin E receptor activity |
| GO:0030250 | 0.0027 | 34.4043 | 0.0813 | 2 | 7 | guanylate cyclase activator activity |
| GO:0099600 | 0.0039 | 1.9023 | 14.1543 | 25 | 1219 | transmembrane receptor activity |
| GO:0010851 | 0.0046 | 24.5714 | 0.1045 | 2 | 9 | cyclase regulator activity |
| GO:0004954 | 0.0069 | 19.1087 | 0.1277 | 2 | 11 | prostanoid receptor activity |
| GO:0038023 | 0.0071 | 1.8039 | 14.851 | 25 | 1279 | signaling receptor activity |
| GO:0004930 | 0.0098 | 1.9775 | 9.0917 | 17 | 783 | G-protein coupled receptor activity |
| GOMFID | Pvalue | OddsRatio | ExpCount | Count | Size | Term |
| GO:0060089 | 1e-04 | 2.1306 | 18.3684 | 35 | 1533 | molecular transducer activity |
| GO:0099600 | 3e-04 | 2.1869 | 14.606 | 29 | 1219 | transmembrane receptor activity |
| GO:0038023 | 6e-04 | 2.0735 | 15.3249 | 29 | 1279 | signaling receptor activity |
| GO:0005223 | 8e-04 | 83.3073 | 0.0479 | 2 | 4 | intracellular cGMP activated cation channel activity |
| GO:0004930 | 0.0012 | 2.2949 | 9.3819 | 20 | 783 | G-protein coupled receptor activity |
| GO:0048020 | 0.0012 | 9.6012 | 0.4673 | 4 | 39 | CCR chemokine receptor binding |
| GO:0023023 | 0.0017 | 14.7644 | 0.2396 | 3 | 20 | MHC protein complex binding |
| GO:0004984 | 0.0017 | 2.8803 | 4.4333 | 12 | 370 | olfactory receptor activity |
| GO:0004957 | 0.0021 | 41.6484 | 0.0719 | 2 | 6 | prostaglandin E receptor activity |
| GO:0008009 | 0.0026 | 7.633 | 0.5751 | 4 | 48 | chemokine activity |
| GO:0001594 | 0.0029 | 33.3167 | 0.0839 | 2 | 7 | trace-amine receptor activity |
| GO:0008603 | 0.0029 | 33.3167 | 0.0839 | 2 | 7 | cAMP-dependent protein kinase regulator activity |
| GO:0004126 | 0.0038 | 27.7622 | 0.0959 | 2 | 8 | cytidine deaminase activity |
| GO:0032395 | 0.0049 | 23.7946 | 0.1078 | 2 | 9 | MHC class II receptor activity |
| GO:0043855 | 0.0049 | 23.7946 | 0.1078 | 2 | 9 | cyclic nucleotide-gated ion channel activity |
| GO:0035325 | 0.006 | 20.819 | 0.1198 | 2 | 10 | Toll-like receptor binding |
| GO:0004954 | 0.0073 | 18.5046 | 0.1318 | 2 | 11 | prostanoid receptor activity |
| GO:0048018 | 0.0075 | 2.37 | 5.332 | 12 | 445 | receptor ligand activity |
| GO:0030551 | 0.009 | 7.5983 | 0.4314 | 3 | 36 | cyclic nucleotide binding |
| GOMFID | Pvalue | OddsRatio | ExpCount | Count | Size | Term |
| GO:0004930 | 2e-04 | 2.4767 | 10.1073 | 23 | 783 | G-protein coupled receptor activity |
| GO:0004984 | 3e-04 | 3.1513 | 4.7761 | 14 | 370 | olfactory receptor activity |
| GO:0003796 | 6e-04 | 23.2602 | 0.1678 | 3 | 13 | lysozyme activity |
| GO:0030197 | 0.001 | 77.1981 | 0.0516 | 2 | 4 | extracellular matrix constituent, lubricant activity |
| GO:0099600 | 0.001 | 2.0027 | 15.7353 | 29 | 1219 | transmembrane receptor activity |
| GO:0038023 | 0.001 | 1.977 | 16.5099 | 30 | 1279 | signaling receptor activity |
| GO:0015232 | 0.0033 | 30.8734 | 0.0904 | 2 | 7 | heme transporter activity |
| GO:0060089 | 0.0044 | 1.7442 | 19.7886 | 32 | 1533 | molecular transducer activity |
| GO:0030414 | 0.0068 | 3.3424 | 2.2073 | 7 | 171 | peptidase inhibitor activity |
| GO:0015143 | 0.007 | 19.2923 | 0.1291 | 2 | 10 | urate transmembrane transporter activity |
| GO:0008200 | 0.0095 | 7.4934 | 0.4389 | 3 | 34 | ion channel inhibitor activity |
| GOMFID | Pvalue | OddsRatio | ExpCount | Count | Size | Term |
| GO:0004984 | 1e-04 | 3.729 | 3.7935 | 13 | 370 | olfactory receptor activity |
| GO:0004930 | 2e-04 | 2.7401 | 8.0278 | 20 | 783 | G-protein coupled receptor activity |
| GO:0060089 | 4e-04 | 2.1313 | 15.7173 | 30 | 1533 | molecular transducer activity |
| GO:0032403 | 4e-04 | 2.5925 | 7.997 | 19 | 780 | protein complex binding |
| GO:0099600 | 7e-04 | 2.2024 | 12.4979 | 25 | 1219 | transmembrane receptor activity |
| GO:0038023 | 0.0013 | 2.0885 | 13.1131 | 25 | 1279 | signaling receptor activity |
| GO:0071253 | 0.0015 | 48.8445 | 0.0615 | 2 | 6 | connexin binding |
| GO:0005549 | 0.0016 | 6.3493 | 0.851 | 5 | 83 | odorant binding |
| GO:0019864 | 0.0045 | 24.4162 | 0.1025 | 2 | 10 | IgG binding |
| GO:0004859 | 0.0054 | 21.7019 | 0.1128 | 2 | 11 | phospholipase inhibitor activity |
| GO:0030280 | 0.0088 | 16.2734 | 0.1435 | 2 | 14 | structural constituent of epidermis |
| GOMFID | Pvalue | OddsRatio | ExpCount | Count | Size | Term |
| GO:0004930 | 4e-04 | 2.2272 | 12.5737 | 26 | 783 | G-protein coupled receptor activity |
| GO:0008131 | 0.0015 | 61.7403 | 0.0642 | 2 | 4 | primary amine oxidase activity |
| GO:0016833 | 0.0037 | 30.8663 | 0.0963 | 2 | 6 | oxo-acid-lyase activity |
| GO:0099600 | 0.0041 | 1.7433 | 19.5751 | 32 | 1219 | transmembrane receptor activity |
| GO:0004984 | 0.007 | 2.296 | 5.9416 | 13 | 370 | olfactory receptor activity |
| GO:0019957 | 0.0086 | 17.6346 | 0.1445 | 2 | 9 | C-C chemokine binding |
| GOMFID | Pvalue | OddsRatio | ExpCount | Count | Size | Term |
| GO:1903231 | 0.0011 | 4.7404 | 1.5858 | 7 | 131 | mRNA binding involved in posttranscriptional gene silencing |
| GO:0016833 | 0.0021 | 41.2139 | 0.0726 | 2 | 6 | oxo-acid-lyase activity |
| GO:0004126 | 0.0039 | 27.4725 | 0.0968 | 2 | 8 | cytidine deaminase activity |
| GO:0004252 | 0.0058 | 3.4477 | 2.1427 | 7 | 177 | serine-type endopeptidase activity |
| GO:0031994 | 0.0089 | 16.4794 | 0.1453 | 2 | 12 | insulin-like growth factor I binding |
| GOMFID | Pvalue | OddsRatio | ExpCount | Count | Size | Term |
| GO:0030983 | 5e-04 | 24.6343 | 0.1623 | 3 | 12 | mismatched DNA binding |
| GO:0008494 | 0.0026 | 36.7926 | 0.0812 | 2 | 6 | translation activator activity |
| GO:0005125 | 0.0027 | 3.264 | 2.9216 | 9 | 216 | cytokine activity |
| GO:0004984 | 0.0046 | 2.5284 | 5.0046 | 12 | 370 | olfactory receptor activity |
| GO:0001968 | 0.0056 | 9.2292 | 0.3652 | 3 | 27 | fibronectin binding |
| GO:0008233 | 0.0081 | 2.0621 | 8.1697 | 16 | 604 | peptidase activity |
| GOMFID | Pvalue | OddsRatio | ExpCount | Count | Size | Term |
| GO:0005515 | 0.0014 | 1.4059 | 267.92 | 296 | 10764 | protein binding |
| GO:0043295 | 0.0022 | 14.7937 | 0.2738 | 3 | 11 | glutathione binding |
| GO:0001851 | 0.0036 | 39.3666 | 0.0996 | 2 | 4 | complement component C3b binding |
| GO:0022839 | 0.0046 | 5.0731 | 1.0952 | 5 | 44 | ion gated channel activity |
| GO:0022838 | 0.0076 | 1.9382 | 10.2548 | 19 | 412 | substrate-specific channel activity |
| GO:0022803 | 0.0076 | 1.9014 | 11.0015 | 20 | 442 | passive transmembrane transporter activity |
| GO:0004723 | 0.0087 | 19.6808 | 0.1493 | 2 | 6 | calcium-dependent protein serine/threonine phosphatase activity |
| GO:0004602 | 0.0095 | 7.8865 | 0.448 | 3 | 18 | glutathione peroxidase activity |
| GO:0031690 | 0.0095 | 7.8865 | 0.448 | 3 | 18 | adrenergic receptor binding |
| GO:0070300 | 0.0095 | 7.8865 | 0.448 | 3 | 18 | phosphatidic acid binding |
| GO:0005547 | 0.0097 | 5.2658 | 0.8463 | 4 | 34 | phosphatidylinositol-3,4,5-trisphosphate binding |
| GOMFID | Pvalue | OddsRatio | ExpCount | Count | Size | Term |
| GO:0005515 | 0.001 | 1.4206 | 269.9144 | 299 | 10764 | protein binding |
| GO:0043295 | 0.0022 | 14.6808 | 0.2758 | 3 | 11 | glutathione binding |
| GO:0030371 | 0.0024 | 8.2566 | 0.5767 | 4 | 23 | translation repressor activity |
| GO:0001851 | 0.0036 | 39.0668 | 0.1003 | 2 | 4 | complement component C3b binding |
| GO:0022839 | 0.0047 | 5.0342 | 1.1033 | 5 | 44 | ion gated channel activity |
| GO:0022838 | 0.0082 | 1.9228 | 10.3312 | 19 | 412 | substrate-specific channel activity |
| GO:0022803 | 0.0083 | 1.8863 | 11.0834 | 20 | 442 | passive transmembrane transporter activity |
| GO:0004723 | 0.0088 | 19.5309 | 0.1505 | 2 | 6 | calcium-dependent protein serine/threonine phosphatase activity |
| GO:0004602 | 0.0097 | 7.8263 | 0.4514 | 3 | 18 | glutathione peroxidase activity |
| GO:0070300 | 0.0097 | 7.8263 | 0.4514 | 3 | 18 | phosphatidic acid binding |
| GO:0005547 | 0.01 | 5.2255 | 0.8526 | 4 | 34 | phosphatidylinositol-3,4,5-trisphosphate binding |
| GOMFID | Pvalue | OddsRatio | ExpCount | Count | Size | Term |
| GO:0008009 | 5e-04 | 8.6964 | 0.6463 | 5 | 48 | chemokine activity |
| GO:0004867 | 0.0013 | 5.4183 | 1.1983 | 6 | 89 | serine-type endopeptidase inhibitor activity |
| GO:0008329 | 0.0014 | 15.906 | 0.2289 | 3 | 17 | signaling pattern recognition receptor activity |
| GO:0031726 | 0.0018 | 49.2901 | 0.0673 | 2 | 5 | CCR1 chemokine receptor binding |
| GO:0004908 | 0.0026 | 36.9653 | 0.0808 | 2 | 6 | interleukin-1 receptor activity |
| GO:0030246 | 0.0028 | 3.0237 | 3.5007 | 10 | 260 | carbohydrate binding |
| GO:0005126 | 0.0031 | 2.9872 | 3.5411 | 10 | 263 | cytokine receptor binding |
| GO:0030159 | 0.0035 | 11.13 | 0.3097 | 3 | 23 | receptor signaling complex scaffold activity |
| GO:0004126 | 0.0048 | 24.6404 | 0.1077 | 2 | 8 | cytidine deaminase activity |
| GO:0008061 | 0.0048 | 24.6404 | 0.1077 | 2 | 8 | chitin binding |
| GO:0048018 | 0.0074 | 2.2813 | 5.9916 | 13 | 445 | receptor ligand activity |
| GO:0005539 | 0.0075 | 2.9892 | 2.814 | 8 | 209 | glycosaminoglycan binding |
| GO:0004875 | 0.0076 | 18.478 | 0.1346 | 2 | 10 | complement receptor activity |
| GO:0030548 | 0.0076 | 18.478 | 0.1346 | 2 | 10 | acetylcholine receptor regulator activity |
| GO:0045028 | 0.0076 | 18.478 | 0.1346 | 2 | 10 | G-protein coupled purinergic nucleotide receptor activity |
| GO:0004872 | 0.0097 | 1.6504 | 20.0483 | 31 | 1489 | receptor activity |
| GOMFID | Pvalue | OddsRatio | ExpCount | Count | Size | Term |
| GO:0030545 | 0 | 3.1895 | 6.1511 | 18 | 472 | receptor regulator activity |
| GO:0005044 | 5e-04 | 8.5949 | 0.6516 | 5 | 50 | scavenger receptor activity |
| GO:0023026 | 0.0011 | 17.7149 | 0.2085 | 3 | 16 | MHC class II protein complex binding |
| GO:0004872 | 0.0012 | 3.7169 | 2.5912 | 9 | 210 | receptor activity |
| GO:0005125 | 0.0015 | 3.9638 | 2.1542 | 8 | 168 | cytokine activity |
| GO:0070851 | 0.0016 | 4.4237 | 1.6942 | 7 | 130 | growth factor receptor binding |
| GO:0031726 | 0.0016 | 50.9633 | 0.0652 | 2 | 5 | CCR1 chemokine receptor binding |
| GO:0008289 | 0.0019 | 2.299 | 8.3535 | 18 | 641 | lipid binding |
| GO:0005126 | 0.0024 | 3.0926 | 3.4274 | 10 | 263 | cytokine receptor binding |
| GO:0004908 | 0.0024 | 38.2201 | 0.0782 | 2 | 6 | interleukin-1 receptor activity |
| GO:0008009 | 0.0035 | 6.9987 | 0.6255 | 4 | 48 | chemokine activity |
| GO:0004950 | 0.0041 | 10.462 | 0.3258 | 3 | 25 | chemokine receptor activity |
| GO:0004126 | 0.0045 | 25.4769 | 0.1043 | 2 | 8 | cytidine deaminase activity |
| GO:0001664 | 0.0068 | 2.8148 | 3.3622 | 9 | 258 | G-protein coupled receptor binding |
| GO:0004875 | 0.0071 | 19.1053 | 0.1303 | 2 | 10 | complement receptor activity |
| GO:0045028 | 0.0071 | 19.1053 | 0.1303 | 2 | 10 | G-protein coupled purinergic nucleotide receptor activity |
| GO:0038023 | 0.0087 | 1.7262 | 16.6678 | 27 | 1279 | signaling receptor activity |
| GO:0048020 | 0.0095 | 7.4911 | 0.439 | 3 | 34 | CCR chemokine receptor binding |
| GOMFID | Pvalue | OddsRatio | ExpCount | Count | Size | Term |
| GO:0004974 | 6e-04 | 142.5357 | 0.0419 | 2 | 3 | leukotriene receptor activity |
| GO:0004095 | 0.0011 | 71.2634 | 0.0558 | 2 | 4 | carnitine O-palmitoyltransferase activity |
| GO:0042605 | 0.0034 | 11.2905 | 0.3071 | 3 | 22 | peptide antigen binding |
| GO:0019784 | 0.0039 | 28.5 | 0.0977 | 2 | 7 | NEDD8-specific protease activity |
| GO:0004984 | 0.0059 | 2.4446 | 5.1646 | 12 | 370 | olfactory receptor activity |
| GO:0000175 | 0.0083 | 7.9412 | 0.4188 | 3 | 30 | 3'-5'-exoribonuclease activity |
| GOMFID | Pvalue | OddsRatio | ExpCount | Count | Size | Term |
| GO:0001665 | 1e-04 | 59.1673 | 0.1008 | 3 | 6 | alpha-N-acetylgalactosaminide alpha-2,6-sialyltransferase activity |
| GO:0032394 | 3e-04 | Inf | 0.0336 | 2 | 2 | MHC class Ib receptor activity |
| GO:0030246 | 0.0015 | 2.9164 | 4.3679 | 12 | 260 | carbohydrate binding |
| GO:0044323 | 0.0016 | 58.9519 | 0.0672 | 2 | 4 | retinoic acid-responsive element binding |
| GO:0042288 | 0.0032 | 11.8245 | 0.3024 | 3 | 18 | MHC class I protein binding |
| GO:0070717 | 0.0043 | 10.4321 | 0.336 | 3 | 20 | poly-purine tract binding |
| GO:0019956 | 0.0057 | 9.3328 | 0.3696 | 3 | 22 | chemokine binding |
| GO:0005102 | 0.0067 | 1.6176 | 24.3424 | 37 | 1449 | receptor binding |
| GO:0052659 | 0.0074 | 19.6457 | 0.1344 | 2 | 8 | inositol-1,3,4,5-tetrakisphosphate 5-phosphatase activity |
| GOMFID | Pvalue | OddsRatio | ExpCount | Count | Size | Term |
| GO:0005534 | 0.0035 | 34.4821 | 0.0954 | 2 | 5 | galactose binding |
| GO:0008266 | 0.0053 | 9.7218 | 0.3626 | 3 | 19 | poly(U) RNA binding |
| GOMFID | Pvalue | OddsRatio | ExpCount | Count | Size | Term |
| GO:0035663 | 0.001 | 108.8767 | 0.0545 | 2 | 3 | Toll-like receptor 2 binding |
| GO:0004364 | 0.0012 | 9.953 | 0.4721 | 4 | 26 | glutathione transferase activity |
| GO:0097493 | 0.0033 | 11.6959 | 0.3087 | 3 | 17 | structural molecule activity conferring elasticity |
| GO:0004579 | 0.0086 | 18.1404 | 0.1453 | 2 | 8 | dolichyl-diphosphooligosaccharide-protein glycotransferase activity |
| GOMFID | Pvalue | OddsRatio | ExpCount | Count | Size | Term |
| GO:0099600 | 1e-04 | 2.3561 | 14.6813 | 31 | 1219 | transmembrane receptor activity |
| GO:0038023 | 1e-04 | 2.322 | 15.4039 | 32 | 1279 | signaling receptor activity |
| GO:0004930 | 1e-04 | 2.6808 | 9.4302 | 23 | 783 | G-protein coupled receptor activity |
| GO:0004984 | 6e-04 | 3.1291 | 4.4562 | 13 | 370 | olfactory receptor activity |
| GO:0048020 | 0.0012 | 9.5503 | 0.4697 | 4 | 39 | CCR chemokine receptor binding |
| GO:0005134 | 0.0014 | 55.2435 | 0.0602 | 2 | 5 | interleukin-2 receptor binding |
| GO:0004126 | 0.0039 | 27.6166 | 0.0963 | 2 | 8 | cytidine deaminase activity |
| GO:0031628 | 0.0039 | 27.6166 | 0.0963 | 2 | 8 | opioid receptor binding |
| GO:0019955 | 0.0063 | 4.5492 | 1.1682 | 5 | 97 | cytokine binding |
| GO:0016493 | 0.0088 | 16.5658 | 0.1445 | 2 | 12 | C-C chemokine receptor activity |
| GO:0004872 | 0.0097 | 3.4976 | 1.8083 | 6 | 167 | receptor activity |
| GOMFID | Pvalue | OddsRatio | ExpCount | Count | Size | Term |
| GO:0005025 | 0.0011 | 71.2634 | 0.0558 | 2 | 4 | transforming growth factor beta receptor activity, type I |
| GO:0008318 | 0.0028 | 35.6272 | 0.0838 | 2 | 6 | protein prenyltransferase activity |
| GO:0016833 | 0.0028 | 35.6272 | 0.0838 | 2 | 6 | oxo-acid-lyase activity |
| GO:0016861 | 0.0051 | 23.7485 | 0.1117 | 2 | 8 | intramolecular oxidoreductase activity, interconverting aldoses and ketoses |
| GO:0019957 | 0.0065 | 20.3546 | 0.1256 | 2 | 9 | C-C chemokine binding |
| GO:0070016 | 0.0081 | 17.8092 | 0.1396 | 2 | 10 | armadillo repeat domain binding |
| GOMFID | Pvalue | OddsRatio | ExpCount | Count | Size | Term |
| GO:0032394 | 1e-04 | Inf | 0.0224 | 2 | 2 | MHC class Ib receptor activity |
| GO:0004468 | 0.0018 | 44.7095 | 0.0671 | 2 | 6 | lysine N-acetyltransferase activity, acting on acetyl phosphate as donor |
| GO:0047134 | 0.0018 | 44.7095 | 0.0671 | 2 | 6 | protein-disulfide reductase activity |
| GO:0004872 | 0.0022 | 1.9014 | 16.6456 | 29 | 1489 | receptor activity |
| GO:0030246 | 0.0026 | 3.2853 | 2.9066 | 9 | 260 | carbohydrate binding |
| GO:0016413 | 0.0033 | 29.8026 | 0.0894 | 2 | 8 | O-acetyltransferase activity |
| GO:0042287 | 0.0041 | 10.3613 | 0.3242 | 3 | 29 | MHC protein binding |
| GO:0033691 | 0.0042 | 25.5435 | 0.1006 | 2 | 9 | sialic acid binding |
| GO:0016651 | 0.0049 | 4.8622 | 1.0955 | 5 | 98 | oxidoreductase activity, acting on NAD(P)H |
| GO:0004791 | 0.0064 | 19.8647 | 0.123 | 2 | 11 | thioredoxin-disulfide reductase activity |
| GO:0016671 | 0.0089 | 16.2509 | 0.1453 | 2 | 13 | oxidoreductase activity, acting on a sulfur group of donors, disulfide as acceptor |
| GOMFID | Pvalue | OddsRatio | ExpCount | Count | Size | Term |
| GO:0042288 | 3e-04 | 15.2727 | 0.3346 | 4 | 18 | MHC class I protein binding |
| GO:0032394 | 3e-04 | Inf | 0.0372 | 2 | 2 | MHC class Ib receptor activity |
| GO:0032395 | 5e-04 | 26.651 | 0.1673 | 3 | 9 | MHC class II receptor activity |
| GO:0003823 | 0.0025 | 5.8182 | 0.9481 | 5 | 51 | antigen binding |
| GO:0004468 | 0.0049 | 26.5652 | 0.1115 | 2 | 6 | lysine N-acetyltransferase activity, acting on acetyl phosphate as donor |
| GO:0023023 | 0.0057 | 9.3997 | 0.3718 | 3 | 20 | MHC protein complex binding |
| GO:0008174 | 0.0068 | 21.2508 | 0.1301 | 2 | 7 | mRNA methyltransferase activity |
| GOMFID | Pvalue | OddsRatio | ExpCount | Count | Size | Term |
| GO:0004908 | 2e-04 | 42.0452 | 0.1404 | 3 | 6 | interleukin-1 receptor activity |
| GO:0005185 | 5e-04 | Inf | 0.0468 | 2 | 2 | neurohypophyseal hormone activity |
| GO:0005126 | 0.0014 | 2.5862 | 6.1563 | 15 | 263 | cytokine receptor binding |
| GO:0001851 | 0.0032 | 41.9363 | 0.0936 | 2 | 4 | complement component C3b binding |
| GO:0033743 | 0.0032 | 41.9363 | 0.0936 | 2 | 4 | peptide-methionine (R)-S-oxide reductase activity |
| GO:0044736 | 0.0032 | 41.9363 | 0.0936 | 2 | 4 | acid-sensing ion channel activity |
| GO:0005164 | 0.0044 | 6.7358 | 0.6788 | 4 | 29 | tumor necrosis factor receptor binding |
| GO:0005537 | 0.0068 | 9.0034 | 0.3979 | 3 | 17 | mannose binding |
| GO:0004723 | 0.0077 | 20.9655 | 0.1404 | 2 | 6 | calcium-dependent protein serine/threonine phosphatase activity |
| NA. |
| n/a |
| NA. |
| n/a |
| NA. |
| n/a |
| NA. |
| n/a |
| NA. |
| n/a |
| NA. |
| n/a |
| NA. |
| n/a |
| NA. |
| n/a |
| NA. |
| n/a |
| NA. |
| n/a |
| NA. |
| n/a |
| NA. |
| n/a |
| NA. |
| n/a |
| NA. |
| n/a |
| NA. |
| n/a |
| NA. |
| n/a |
| NA. |
| n/a |
| NA. |
| n/a |
| NA. |
| n/a |
| NA. |
| n/a |
| NA. |
| n/a |
| NA. |
| n/a |
| NA. |
| n/a |
| NA. |
| n/a |
| NA. |
| n/a |
| NA. |
| n/a |
| NA. |
| n/a |
| NA. |
| n/a |
| NA. |
| n/a |
| NA. |
| n/a |
| NA. |
| n/a |
| NA. |
| n/a |
| NA. |
| n/a |
| NA. |
| n/a |
| NA. |
| n/a |
| NA. |
| n/a |
| NA. |
| n/a |
| NA. |
| n/a |
| NA. |
| n/a |
| NA. |
| n/a |
| NA. |
| n/a |
| NA. |
| n/a |
| NA. |
| n/a |
| NA. |
| n/a |
| NA. |
| n/a |
| NA. |
| n/a |
| NA. |
| n/a |
| NA. |
| n/a |
| NA. |
| n/a |
| NA. |
| n/a |
| NA. |
| n/a |
| NA. |
| n/a |
| NA. |
| n/a |
| NA. |
| n/a |
| NA. |
| n/a |
| NA. |
| n/a |
| GOMFID | Pvalue | OddsRatio | ExpCount | Count | Size | Term |
| GO:0009440 | 3e-04 | Inf | 0.0319 | 2 | 2 | cyanate catabolic process |
| GO:0016119 | 3e-04 | Inf | 0.0319 | 2 | 2 | carotene metabolic process |
| GO:0046041 | 3e-04 | Inf | 0.0319 | 2 | 2 | ITP metabolic process |
| GO:0007606 | 0.0014 | 2.4245 | 7.4478 | 17 | 467 | sensory perception of chemical stimulus |
| GO:1901019 | 0.0021 | 4.8983 | 1.3237 | 6 | 83 | regulation of calcium ion transmembrane transporter activity |
| GO:0002931 | 0.0022 | 8.0708 | 0.5582 | 4 | 35 | response to ischemia |
| GO:0009593 | 0.0024 | 2.3643 | 7.1608 | 16 | 449 | detection of chemical stimulus |
| GO:0022898 | 0.0024 | 3.0906 | 3.4289 | 10 | 215 | regulation of transmembrane transporter activity |
| GO:0002697 | 0.0026 | 2.6029 | 5.2789 | 13 | 331 | regulation of immune effector process |
| GO:0010959 | 0.0035 | 2.5063 | 5.4703 | 13 | 343 | regulation of metal ion transport |
| GO:0070383 | 0.0036 | 31.0837 | 0.0957 | 2 | 6 | DNA cytosine deamination |
| GO:0043901 | 0.0043 | 3.2972 | 2.5677 | 8 | 161 | negative regulation of multi-organism process |
| GO:0045869 | 0.005 | 24.8654 | 0.1116 | 2 | 7 | negative regulation of single stranded viral RNA replication via double stranded DNA intermediate |
| GO:0039694 | 0.0056 | 9.3521 | 0.3668 | 3 | 23 | viral RNA genome replication |
| GO:2000649 | 0.0056 | 6.0985 | 0.7177 | 4 | 45 | regulation of sodium ion transmembrane transporter activity |
| GO:0003008 | 0.006 | 1.5659 | 30.8918 | 45 | 1937 | system process |
| GO:0002230 | 0.0063 | 8.9062 | 0.3828 | 3 | 24 | positive regulation of defense response to virus by host |
| GO:0050911 | 0.0066 | 2.3128 | 5.9009 | 13 | 370 | detection of chemical stimulus involved in sensory perception of smell |
| GO:0010533 | 0.0067 | 20.7198 | 0.1276 | 2 | 8 | regulation of activation of Janus kinase activity |
| GO:0009199 | 0.0068 | 2.5054 | 4.6091 | 11 | 289 | ribonucleoside triphosphate metabolic process |
| GO:0009144 | 0.0074 | 2.4782 | 4.6569 | 11 | 292 | purine nucleoside triphosphate metabolic process |
| GO:0009972 | 0.0085 | 17.7588 | 0.1435 | 2 | 9 | cytidine deamination |
| GO:0045988 | 0.0085 | 17.7588 | 0.1435 | 2 | 9 | negative regulation of striated muscle contraction |
| GO:0046087 | 0.0085 | 17.7588 | 0.1435 | 2 | 9 | cytidine metabolic process |
| GO:0097267 | 0.0085 | 17.7588 | 0.1435 | 2 | 9 | omega-hydroxylase P450 pathway |
| GO:0035725 | 0.0087 | 3.189 | 2.3125 | 7 | 145 | sodium ion transmembrane transport |
| GO:2001257 | 0.0087 | 3.189 | 2.3125 | 7 | 145 | regulation of cation channel activity |
| GO:0048240 | 0.0098 | 7.4794 | 0.4466 | 3 | 28 | sperm capacitation |
| GO:0071295 | 0.0098 | 7.4794 | 0.4466 | 3 | 28 | cellular response to vitamin |
| GOMFID | Pvalue | OddsRatio | ExpCount | Count | Size | Term |
| GO:0009593 | 0 | 3.3378 | 5.5572 | 17 | 449 | detection of chemical stimulus |
| GO:0050911 | 1e-04 | 3.5629 | 4.5794 | 15 | 370 | detection of chemical stimulus involved in sensory perception of smell |
| GO:0007606 | 1e-04 | 3.2006 | 5.78 | 17 | 467 | sensory perception of chemical stimulus |
| GO:0016119 | 2e-04 | Inf | 0.0248 | 2 | 2 | carotene metabolic process |
| GO:0046041 | 2e-04 | Inf | 0.0248 | 2 | 2 | ITP metabolic process |
| GO:0007186 | 2e-04 | 2.213 | 15.4958 | 31 | 1252 | G-protein coupled receptor signaling pathway |
| GO:0050906 | 2e-04 | 3.0307 | 5.7057 | 16 | 461 | detection of stimulus involved in sensory perception |
| GO:0016553 | 3e-04 | 30.3617 | 0.1361 | 3 | 11 | base conversion or substitution editing |
| GO:0070383 | 0.0022 | 40.2889 | 0.0743 | 2 | 6 | DNA cytosine deamination |
| GO:0072678 | 0.0027 | 7.5533 | 0.5817 | 4 | 47 | T cell migration |
| GO:0045869 | 0.0031 | 32.2291 | 0.0866 | 2 | 7 | negative regulation of single stranded viral RNA replication via double stranded DNA intermediate |
| GO:0032722 | 0.0034 | 7.0594 | 0.6188 | 4 | 50 | positive regulation of chemokine production |
| GO:0007341 | 0.0041 | 26.8559 | 0.099 | 2 | 8 | penetration of zona pellucida |
| GO:0050877 | 0.0041 | 1.864 | 14.976 | 26 | 1210 | nervous system process |
| GO:0009259 | 0.0044 | 2.2797 | 6.9682 | 15 | 563 | ribonucleotide metabolic process |
| GO:0006968 | 0.0044 | 6.493 | 0.6683 | 4 | 54 | cellular defense response |
| GO:0006163 | 0.0046 | 2.2668 | 7.0053 | 15 | 566 | purine nucleotide metabolic process |
| GO:0048240 | 0.0049 | 9.7055 | 0.3466 | 3 | 28 | sperm capacitation |
| GO:0009972 | 0.0052 | 23.0179 | 0.1114 | 2 | 9 | cytidine deamination |
| GO:0043950 | 0.0052 | 23.0179 | 0.1114 | 2 | 9 | positive regulation of cAMP-mediated signaling |
| GO:0046087 | 0.0052 | 23.0179 | 0.1114 | 2 | 9 | cytidine metabolic process |
| GO:0030816 | 0.0052 | 4.7881 | 1.1139 | 5 | 90 | positive regulation of cAMP metabolic process |
| GO:0018149 | 0.0057 | 6.0105 | 0.7179 | 4 | 58 | peptide cross-linking |
| GO:0019852 | 0.0064 | 20.1394 | 0.1238 | 2 | 10 | L-ascorbic acid metabolic process |
| GO:0046007 | 0.0064 | 20.1394 | 0.1238 | 2 | 10 | negative regulation of activated T cell proliferation |
| GO:0006955 | 0.007 | 1.6513 | 22.9095 | 35 | 1851 | immune response |
| GO:1904062 | 0.0072 | 2.7902 | 3.3913 | 9 | 274 | regulation of cation transmembrane transport |
| GO:1904427 | 0.0073 | 5.5946 | 0.7674 | 4 | 62 | positive regulation of calcium ion transmembrane transport |
| GO:0046133 | 0.0078 | 17.9006 | 0.1361 | 2 | 11 | pyrimidine ribonucleoside catabolic process |
| GO:0002697 | 0.0083 | 2.5637 | 4.0967 | 10 | 331 | regulation of immune effector process |
| GO:0050672 | 0.0086 | 5.3185 | 0.8045 | 4 | 65 | negative regulation of lymphocyte proliferation |
| GO:0032988 | 0.0093 | 16.1095 | 0.1485 | 2 | 12 | ribonucleoprotein complex disassembly |
| GOMFID | Pvalue | OddsRatio | ExpCount | Count | Size | Term |
| GO:0006955 | 0 | 2.0412 | 28.2665 | 51 | 1851 | immune response |
| GO:0002699 | 3e-04 | 4.2107 | 2.5655 | 10 | 168 | positive regulation of immune effector process |
| GO:0002228 | 3e-04 | 7.4563 | 0.901 | 6 | 59 | natural killer cell mediated immunity |
| GO:0001909 | 3e-04 | 5.9261 | 1.298 | 7 | 85 | leukocyte mediated cytotoxicity |
| GO:0060252 | 5e-04 | 24.4653 | 0.168 | 3 | 11 | positive regulation of glial cell proliferation |
| GO:2000502 | 7e-04 | 130.0081 | 0.0458 | 2 | 3 | negative regulation of natural killer cell chemotaxis |
| GO:0002703 | 7e-04 | 4.0313 | 2.3975 | 9 | 157 | regulation of leukocyte mediated immunity |
| GO:0042269 | 0.0015 | 9.0237 | 0.5039 | 4 | 33 | regulation of natural killer cell mediated cytotoxicity |
| GO:0045124 | 0.0019 | 8.4405 | 0.5345 | 4 | 35 | regulation of bone resorption |
| GO:0032729 | 0.0022 | 5.9622 | 0.9163 | 5 | 60 | positive regulation of interferon-gamma production |
| GO:0070230 | 0.0028 | 12.2265 | 0.2901 | 3 | 19 | positive regulation of lymphocyte apoptotic process |
| GO:0032496 | 0.0031 | 2.6687 | 4.7493 | 12 | 311 | response to lipopolysaccharide |
| GO:0031341 | 0.0031 | 5.4636 | 0.9926 | 5 | 65 | regulation of cell killing |
| GO:0010507 | 0.0033 | 5.3737 | 1.0079 | 5 | 66 | negative regulation of autophagy |
| GO:0033007 | 0.0033 | 32.4959 | 0.0916 | 2 | 6 | negative regulation of mast cell activation involved in immune response |
| GO:0031295 | 0.0036 | 5.2867 | 1.0232 | 5 | 67 | T cell costimulation |
| GO:0002685 | 0.004 | 3.3405 | 2.535 | 8 | 166 | regulation of leukocyte migration |
| GO:0032660 | 0.0044 | 10.2941 | 0.336 | 3 | 22 | regulation of interleukin-17 production |
| GO:0002708 | 0.0055 | 4.7483 | 1.13 | 5 | 74 | positive regulation of lymphocyte mediated immunity |
| GO:0045630 | 0.0061 | 21.6612 | 0.1222 | 2 | 8 | positive regulation of T-helper 2 cell differentiation |
| GO:0051133 | 0.0061 | 21.6612 | 0.1222 | 2 | 8 | regulation of NK T cell activation |
| GO:0060677 | 0.0061 | 21.6612 | 0.1222 | 2 | 8 | ureteric bud elongation |
| GO:0046849 | 0.0068 | 4.487 | 1.1911 | 5 | 78 | bone remodeling |
| GO:0071354 | 0.0071 | 8.5017 | 0.397 | 3 | 26 | cellular response to interleukin-6 |
| GO:0006002 | 0.0078 | 18.5656 | 0.1374 | 2 | 9 | fructose 6-phosphate metabolic process |
| GO:2000402 | 0.0078 | 18.5656 | 0.1374 | 2 | 9 | negative regulation of lymphocyte migration |
| GO:0002683 | 0.0084 | 2.2425 | 6.0778 | 13 | 398 | negative regulation of immune system process |
| GO:0034103 | 0.0088 | 4.1981 | 1.2675 | 5 | 83 | regulation of tissue remodeling |
| GO:0002443 | 0.0089 | 2.0373 | 8.2475 | 16 | 555 | leukocyte mediated immunity |
| GO:0051901 | 0.0096 | 16.2439 | 0.1527 | 2 | 10 | positive regulation of mitochondrial depolarization |
| GO:2001214 | 0.0096 | 16.2439 | 0.1527 | 2 | 10 | positive regulation of vasculogenesis |
| GOMFID | Pvalue | OddsRatio | ExpCount | Count | Size | Term |
| GO:0007600 | 0.0016 | 2.1844 | 10.3498 | 21 | 880 | sensory perception |
| GO:0038127 | 0.002 | 4.2316 | 1.7642 | 7 | 150 | ERBB signaling pathway |
| GO:0007214 | 0.0024 | 12.7891 | 0.2705 | 3 | 23 | gamma-aminobutyric acid signaling pathway |
| GO:0051026 | 0.0028 | 33.9556 | 0.0823 | 2 | 7 | chiasma assembly |
| GO:0050907 | 0.0038 | 2.6027 | 4.8808 | 12 | 415 | detection of chemical stimulus involved in sensory perception |
| GO:0010591 | 0.0042 | 10.2281 | 0.3293 | 3 | 28 | regulation of lamellipodium assembly |
| GO:0006621 | 0.0047 | 24.2509 | 0.1058 | 2 | 9 | protein retention in ER lumen |
| GO:0061179 | 0.0047 | 24.2509 | 0.1058 | 2 | 9 | negative regulation of insulin secretion involved in cellular response to glucose stimulus |
| GO:0008608 | 0.0056 | 9.1305 | 0.3646 | 3 | 31 | attachment of spindle microtubules to kinetochore |
| GO:0046085 | 0.0058 | 21.2183 | 0.1176 | 2 | 10 | adenosine metabolic process |
| GO:0051606 | 0.006 | 2.2021 | 7.2095 | 15 | 613 | detection of stimulus |
| GO:0051930 | 0.0062 | 8.8151 | 0.3764 | 3 | 32 | regulation of sensory perception of pain |
| GO:0006821 | 0.0065 | 4.5144 | 1.1761 | 5 | 100 | chloride transport |
| GO:0031284 | 0.0071 | 18.8595 | 0.1294 | 2 | 11 | positive regulation of guanylate cyclase activity |
| GO:0010664 | 0.0073 | 8.2454 | 0.3999 | 3 | 34 | negative regulation of striated muscle cell apoptotic process |
| GO:0007186 | 0.0082 | 1.8003 | 14.2475 | 24 | 1229 | G-protein coupled receptor signaling pathway |
| GO:0032099 | 0.0084 | 16.9725 | 0.1411 | 2 | 12 | negative regulation of appetite |
| GO:0010310 | 0.0099 | 15.4286 | 0.1529 | 2 | 13 | regulation of hydrogen peroxide metabolic process |
| GOMFID | Pvalue | OddsRatio | ExpCount | Count | Size | Term |
| GO:0043207 | 0 | 3.12 | 9.3961 | 26 | 816 | response to external biotic stimulus |
| GO:0098542 | 0 | 3.7357 | 5.3313 | 18 | 463 | defense response to other organism |
| GO:0045087 | 0 | 2.8982 | 8.8101 | 23 | 779 | innate immune response |
| GO:0032101 | 0 | 3.0831 | 7.1512 | 20 | 632 | regulation of response to external stimulus |
| GO:0009617 | 0 | 3.2526 | 6.0683 | 18 | 527 | response to bacterium |
| GO:0007186 | 0 | 2.4139 | 14.4165 | 31 | 1252 | G-protein coupled receptor signaling pathway |
| GO:0002548 | 1e-04 | 9.4694 | 0.7139 | 6 | 62 | monocyte chemotaxis |
| GO:0050672 | 1e-04 | 8.9862 | 0.7485 | 6 | 65 | negative regulation of lymphocyte proliferation |
| GO:0070664 | 1e-04 | 8.4136 | 0.7945 | 6 | 69 | negative regulation of leukocyte proliferation |
| GO:0002698 | 2e-04 | 6.397 | 1.1975 | 7 | 104 | negative regulation of immune effector process |
| GO:0071346 | 2e-04 | 5.3906 | 1.6121 | 8 | 140 | cellular response to interferon-gamma |
| GO:1903038 | 2e-04 | 6.2039 | 1.2321 | 7 | 107 | negative regulation of leukocyte cell-cell adhesion |
| GO:0050900 | 3e-04 | 3.2331 | 4.675 | 14 | 406 | leukocyte migration |
| GO:0050829 | 3e-04 | 7.3577 | 0.8982 | 6 | 78 | defense response to Gram-negative bacterium |
| GO:0070098 | 3e-04 | 7.158 | 0.9212 | 6 | 80 | chemokine-mediated signaling pathway |
| GO:0046636 | 3e-04 | 14.0136 | 0.3339 | 4 | 29 | negative regulation of alpha-beta T cell activation |
| GO:0002682 | 5e-04 | 2.0896 | 15.8328 | 30 | 1375 | regulation of immune system process |
| GO:0050830 | 5e-04 | 6.5365 | 1.0018 | 6 | 87 | defense response to Gram-positive bacterium |
| GO:0097530 | 5e-04 | 5.3897 | 1.4048 | 7 | 122 | granulocyte migration |
| GO:0030593 | 5e-04 | 6.4564 | 1.0133 | 6 | 88 | neutrophil chemotaxis |
| GO:2000484 | 6e-04 | 21.7948 | 0.1727 | 3 | 15 | positive regulation of interleukin-8 secretion |
| GO:0032677 | 6e-04 | 7.991 | 0.6909 | 5 | 60 | regulation of interleukin-8 production |
| GO:0050777 | 7e-04 | 5.1205 | 1.4739 | 7 | 128 | negative regulation of immune response |
| GO:2000562 | 8e-04 | 86.7622 | 0.0461 | 2 | 4 | negative regulation of CD4-positive, alpha-beta T cell proliferation |
| GO:2000563 | 8e-04 | 86.7622 | 0.0461 | 2 | 4 | positive regulation of CD4-positive, alpha-beta T cell proliferation |
| GO:0060326 | 9e-04 | 3.5568 | 3.0054 | 10 | 261 | cell chemotaxis |
| GO:0050906 | 9e-04 | 2.8253 | 5.3083 | 14 | 461 | detection of stimulus involved in sensory perception |
| GO:0050911 | 0.0012 | 3.0062 | 4.2605 | 12 | 370 | detection of chemical stimulus involved in sensory perception of smell |
| GO:0070230 | 0.0013 | 16.3421 | 0.2188 | 3 | 19 | positive regulation of lymphocyte apoptotic process |
| GO:0043305 | 0.0013 | 57.8378 | 0.0576 | 2 | 5 | negative regulation of mast cell degranulation |
| GO:0050877 | 0.0015 | 2.028 | 13.9329 | 26 | 1210 | nervous system process |
| GO:0042345 | 0.0016 | 8.7503 | 0.5067 | 4 | 44 | regulation of NF-kappaB import into nucleus |
| GO:0002448 | 0.0018 | 8.5363 | 0.5182 | 4 | 45 | mast cell mediated immunity |
| GO:0070383 | 0.0019 | 43.3757 | 0.0691 | 2 | 6 | DNA cytosine deamination |
| GO:2000503 | 0.0019 | 43.3757 | 0.0691 | 2 | 6 | positive regulation of natural killer cell chemotaxis |
| GO:0006875 | 0.002 | 2.5921 | 5.7574 | 14 | 500 | cellular metal ion homeostasis |
| GO:0009593 | 0.0021 | 2.6761 | 5.1701 | 13 | 449 | detection of chemical stimulus |
| GO:0002703 | 0.0023 | 4.123 | 1.8078 | 7 | 157 | regulation of leukocyte mediated immunity |
| GO:0002793 | 0.0024 | 3.3455 | 2.8557 | 9 | 248 | positive regulation of peptide secretion |
| GO:0002230 | 0.0025 | 12.4472 | 0.2764 | 3 | 24 | positive regulation of defense response to virus by host |
| GO:0009615 | 0.0026 | 3.0602 | 3.4659 | 10 | 301 | response to virus |
| GO:0043901 | 0.0026 | 4.0149 | 1.8539 | 7 | 161 | negative regulation of multi-organism process |
| GO:0032661 | 0.0027 | 34.6984 | 0.0806 | 2 | 7 | regulation of interleukin-18 production |
| GO:0045869 | 0.0027 | 34.6984 | 0.0806 | 2 | 7 | negative regulation of single stranded viral RNA replication via double stranded DNA intermediate |
| GO:0051716 | 0.0027 | 1.5215 | 78.7381 | 98 | 6838 | cellular response to stimulus |
| GO:0051480 | 0.0028 | 3.0284 | 3.5005 | 10 | 304 | regulation of cytosolic calcium ion concentration |
| GO:0042991 | 0.0028 | 5.555 | 0.9672 | 5 | 84 | transcription factor import into nucleus |
| GO:0007606 | 0.003 | 2.5671 | 5.3774 | 13 | 467 | sensory perception of chemical stimulus |
| GO:0046633 | 0.0032 | 11.3634 | 0.2994 | 3 | 26 | alpha-beta T cell proliferation |
| GO:0031348 | 0.0032 | 3.8629 | 1.923 | 7 | 167 | negative regulation of defense response |
| GO:0055080 | 0.0033 | 2.2906 | 7.4385 | 16 | 646 | cation homeostasis |
| GO:0050866 | 0.0033 | 3.8386 | 1.9345 | 7 | 168 | negative regulation of cell activation |
| GO:0010533 | 0.0035 | 28.9135 | 0.0921 | 2 | 8 | regulation of activation of Janus kinase activity |
| GO:1900426 | 0.0035 | 28.9135 | 0.0921 | 2 | 8 | positive regulation of defense response to bacterium |
| GO:1904628 | 0.0035 | 28.9135 | 0.0921 | 2 | 8 | cellular response to phorbol 13-acetate 12-myristate |
| GO:0072503 | 0.0036 | 2.6228 | 4.8477 | 12 | 421 | cellular divalent inorganic cation homeostasis |
| GO:0050869 | 0.0036 | 10.8893 | 0.3109 | 3 | 27 | negative regulation of B cell activation |
| GO:0006873 | 0.0036 | 2.3349 | 6.8283 | 15 | 593 | cellular ion homeostasis |
| GO:0045471 | 0.0037 | 4.3287 | 1.4739 | 6 | 128 | response to ethanol |
| GO:0050921 | 0.0037 | 4.3287 | 1.4739 | 6 | 128 | positive regulation of chemotaxis |
| GO:0090087 | 0.0039 | 2.1403 | 8.97 | 18 | 779 | regulation of peptide transport |
| GO:0032733 | 0.004 | 10.453 | 0.3224 | 3 | 28 | positive regulation of interleukin-10 production |
| GO:0033006 | 0.004 | 10.453 | 0.3224 | 3 | 28 | regulation of mast cell activation involved in immune response |
| GO:0098771 | 0.0041 | 2.2388 | 7.5998 | 16 | 660 | inorganic ion homeostasis |
| GO:0009119 | 0.0044 | 4.9841 | 1.0709 | 5 | 93 | ribonucleoside metabolic process |
| GO:0050716 | 0.0044 | 10.0504 | 0.3339 | 3 | 29 | positive regulation of interleukin-1 secretion |
| GO:0048247 | 0.0044 | 6.476 | 0.6679 | 4 | 58 | lymphocyte chemotaxis |
| GO:0009972 | 0.0045 | 24.7815 | 0.1036 | 2 | 9 | cytidine deamination |
| GO:0046087 | 0.0045 | 24.7815 | 0.1036 | 2 | 9 | cytidine metabolic process |
| GO:0002228 | 0.0047 | 6.3579 | 0.6794 | 4 | 59 | natural killer cell mediated immunity |
| GO:0032689 | 0.0049 | 9.6775 | 0.3454 | 3 | 30 | negative regulation of interferon-gamma production |
| GO:0002755 | 0.0053 | 9.3313 | 0.357 | 3 | 31 | MyD88-dependent toll-like receptor signaling pathway |
| GO:0042308 | 0.0053 | 6.134 | 0.7024 | 4 | 61 | negative regulation of protein import into nucleus |
| GO:0055086 | 0.0055 | 2.1112 | 8.5555 | 17 | 743 | nucleobase-containing small molecule metabolic process |
| GO:0033004 | 0.0056 | 21.6824 | 0.1151 | 2 | 10 | negative regulation of mast cell activation |
| GO:0042178 | 0.0056 | 21.6824 | 0.1151 | 2 | 10 | xenobiotic catabolic process |
| GO:0046007 | 0.0056 | 21.6824 | 0.1151 | 2 | 10 | negative regulation of activated T cell proliferation |
| GO:0051091 | 0.0057 | 3.144 | 2.6829 | 8 | 233 | positive regulation of DNA binding transcription factor activity |
| GO:0042110 | 0.0058 | 2.4561 | 5.1586 | 12 | 448 | T cell activation |
| GO:0051170 | 0.006 | 2.8796 | 3.2932 | 9 | 286 | nuclear import |
| GO:0051249 | 0.0064 | 2.5368 | 4.5714 | 11 | 397 | regulation of lymphocyte activation |
| GO:0016553 | 0.0068 | 19.2721 | 0.1267 | 2 | 11 | base conversion or substitution editing |
| GO:0045591 | 0.0068 | 19.2721 | 0.1267 | 2 | 11 | positive regulation of regulatory T cell differentiation |
| GO:0045953 | 0.0068 | 19.2721 | 0.1267 | 2 | 11 | negative regulation of natural killer cell mediated cytotoxicity |
| GO:0046133 | 0.0068 | 19.2721 | 0.1267 | 2 | 11 | pyrimidine ribonucleoside catabolic process |
| GO:0070486 | 0.0068 | 19.2721 | 0.1267 | 2 | 11 | leukocyte aggregation |
| GO:0050896 | 0.0073 | 1.9486 | 12.9212 | 22 | 1365 | response to stimulus |
| GO:0050688 | 0.0074 | 5.5477 | 0.7715 | 4 | 67 | regulation of defense response to virus |
| GO:0002707 | 0.0075 | 8.1629 | 0.403 | 3 | 35 | negative regulation of lymphocyte mediated immunity |
| GO:0042129 | 0.0076 | 3.6881 | 1.7157 | 6 | 149 | regulation of T cell proliferation |
| GO:0002688 | 0.0076 | 4.339 | 1.2206 | 5 | 106 | regulation of leukocyte chemotaxis |
| GO:0055074 | 0.0076 | 2.4711 | 4.6865 | 11 | 407 | calcium ion homeostasis |
| GO:0022407 | 0.0078 | 2.4647 | 4.698 | 11 | 408 | regulation of cell-cell adhesion |
| GO:0030431 | 0.0081 | 7.915 | 0.4145 | 3 | 36 | sleep |
| GO:0048878 | 0.0082 | 1.8763 | 11.9178 | 21 | 1035 | chemical homeostasis |
| GO:0032944 | 0.0083 | 3.2126 | 2.2914 | 7 | 199 | regulation of mononuclear cell proliferation |
| GO:0050729 | 0.0089 | 4.1727 | 1.2666 | 5 | 110 | positive regulation of inflammatory response |
| GO:0032652 | 0.0091 | 5.2152 | 0.8175 | 4 | 71 | regulation of interleukin-1 production |
| GO:0019731 | 0.0094 | 7.4618 | 0.4376 | 3 | 38 | antibacterial humoral response |
| GO:0032941 | 0.0094 | 7.4618 | 0.4376 | 3 | 38 | secretion by tissue |
| GO:0051224 | 0.0095 | 3.1301 | 2.349 | 7 | 204 | negative regulation of protein transport |
| GO:0010310 | 0.0095 | 15.7661 | 0.1497 | 2 | 13 | regulation of hydrogen peroxide metabolic process |
| GO:0032387 | 0.0098 | 4.0624 | 1.299 | 5 | 114 | negative regulation of intracellular transport |
| GO:0070555 | 0.0099 | 4.056 | 1.3012 | 5 | 113 | response to interleukin-1 |
| GOMFID | Pvalue | OddsRatio | ExpCount | Count | Size | Term |
| GO:0007186 | 1e-04 | 2.1084 | 20.8924 | 40 | 1252 | G-protein coupled receptor signaling pathway |
| GO:0032940 | 4e-04 | 1.8981 | 22.9449 | 40 | 1375 | secretion by cell |
| GO:0002275 | 5e-04 | 2.4703 | 8.6607 | 20 | 519 | myeloid cell activation involved in immune response |
| GO:0002444 | 5e-04 | 2.455 | 8.7107 | 20 | 522 | myeloid leukocyte mediated immunity |
| GO:0050896 | 5e-04 | 1.5119 | 136.885 | 164 | 8203 | response to stimulus |
| GO:0050704 | 7e-04 | 7.8804 | 0.7175 | 5 | 43 | regulation of interleukin-1 secretion |
| GO:0002263 | 7e-04 | 2.2322 | 11.0135 | 23 | 660 | cell activation involved in immune response |
| GO:0060244 | 8e-04 | 118.7212 | 0.0501 | 2 | 3 | negative regulation of cell proliferation involved in contact inhibition |
| GO:0043312 | 9e-04 | 2.4592 | 7.7929 | 18 | 467 | neutrophil degranulation |
| GO:0050718 | 0.001 | 10.3866 | 0.4506 | 4 | 27 | positive regulation of interleukin-1 beta secretion |
| GO:0042119 | 0.0011 | 2.4041 | 7.9598 | 18 | 477 | neutrophil activation |
| GO:0009617 | 0.0014 | 2.2947 | 8.7942 | 19 | 527 | response to bacterium |
| GO:0002922 | 0.0015 | 16.2395 | 0.2336 | 3 | 14 | positive regulation of humoral immune response |
| GO:0060326 | 0.0015 | 2.9251 | 4.3554 | 12 | 261 | cell chemotaxis |
| GO:0045055 | 0.0018 | 2.0693 | 11.8145 | 23 | 708 | regulated exocytosis |
| GO:0016192 | 0.0028 | 1.6378 | 29.6365 | 45 | 1776 | vesicle-mediated transport |
| GO:0010972 | 0.0037 | 4.3335 | 1.4852 | 6 | 89 | negative regulation of G2/M transition of mitotic cell cycle |
| GO:0032691 | 0.0042 | 10.504 | 0.3337 | 3 | 20 | negative regulation of interleukin-1 beta production |
| GO:1903727 | 0.0043 | 6.6305 | 0.6675 | 4 | 40 | positive regulation of phospholipid metabolic process |
| GO:0032732 | 0.0047 | 6.4509 | 0.6842 | 4 | 41 | positive regulation of interleukin-1 production |
| GO:0050906 | 0.0047 | 2.1889 | 7.6928 | 16 | 461 | detection of stimulus involved in sensory perception |
| GO:0050795 | 0.0049 | 4.902 | 1.1014 | 5 | 66 | regulation of behavior |
| GO:0019722 | 0.0055 | 3.1653 | 2.67 | 8 | 160 | calcium-mediated signaling |
| GO:0014827 | 0.0055 | 23.7383 | 0.1168 | 2 | 7 | intestine smooth muscle contraction |
| GO:0051026 | 0.0055 | 23.7383 | 0.1168 | 2 | 7 | chiasma assembly |
| GO:0045188 | 0.0073 | 19.7807 | 0.1335 | 2 | 8 | regulation of circadian sleep/wake cycle, non-REM sleep |
| GO:0072610 | 0.0073 | 19.7807 | 0.1335 | 2 | 8 | interleukin-12 secretion |
| GO:1904628 | 0.0073 | 19.7807 | 0.1335 | 2 | 8 | cellular response to phorbol 13-acetate 12-myristate |
| GO:0002376 | 0.0084 | 1.4555 | 44.5548 | 60 | 2670 | immune system process |
| GO:0071346 | 0.0091 | 3.1571 | 2.3362 | 7 | 140 | cellular response to interferon-gamma |
| GO:0007614 | 0.0092 | 16.9538 | 0.1502 | 2 | 9 | short-term memory |
| GO:0070050 | 0.0092 | 16.9538 | 0.1502 | 2 | 9 | neuron cellular homeostasis |
| GO:0086023 | 0.0092 | 16.9538 | 0.1502 | 2 | 9 | adrenergic receptor signaling pathway involved in heart process |
| GO:2000510 | 0.0092 | 16.9538 | 0.1502 | 2 | 9 | positive regulation of dendritic cell chemotaxis |
| GO:0050911 | 0.0095 | 2.2035 | 6.1743 | 13 | 370 | detection of chemical stimulus involved in sensory perception of smell |
| GO:0050829 | 0.0098 | 4.0931 | 1.3016 | 5 | 78 | defense response to Gram-negative bacterium |
| GO:0042554 | 0.01 | 7.437 | 0.4506 | 3 | 27 | superoxide anion generation |
| GOMFID | Pvalue | OddsRatio | ExpCount | Count | Size | Term |
| GO:0006112 | 0 | 7.7393 | 1.1619 | 8 | 85 | energy reserve metabolic process |
| GO:0033692 | 1e-04 | 8.5288 | 0.7929 | 6 | 58 | cellular polysaccharide biosynthetic process |
| GO:0005978 | 4e-04 | 9.2039 | 0.6151 | 5 | 45 | glycogen biosynthetic process |
| GO:0005976 | 4e-04 | 5.7621 | 1.326 | 7 | 97 | polysaccharide metabolic process |
| GO:0006073 | 4e-04 | 6.7138 | 0.9842 | 6 | 72 | cellular glucan metabolic process |
| GO:1903046 | 8e-04 | 3.9157 | 2.4606 | 9 | 180 | meiotic cell cycle process |
| GO:0019732 | 0.0011 | 72.8 | 0.0547 | 2 | 4 | antifungal humoral response |
| GO:0040038 | 0.0018 | 48.5303 | 0.0683 | 2 | 5 | polar body extrusion after meiotic divisions |
| GO:0051534 | 0.0018 | 48.5303 | 0.0683 | 2 | 5 | negative regulation of NFAT protein import into nucleus |
| GO:0010269 | 0.0027 | 36.3955 | 0.082 | 2 | 6 | response to selenium ion |
| GO:0007140 | 0.003 | 7.3294 | 0.6015 | 4 | 44 | male meiotic nuclear division |
| GO:0051597 | 0.0037 | 29.1145 | 0.0957 | 2 | 7 | response to methylmercury |
| GO:0090306 | 0.0037 | 29.1145 | 0.0957 | 2 | 7 | spindle assembly involved in meiosis |
| GO:0031646 | 0.0041 | 10.4351 | 0.3281 | 3 | 24 | positive regulation of neurological system process |
| GO:0016051 | 0.0042 | 3.3079 | 2.5563 | 8 | 187 | carbohydrate biosynthetic process |
| GO:0007276 | 0.0047 | 2.1383 | 8.407 | 17 | 615 | gamete generation |
| GO:0050911 | 0.005 | 2.4996 | 5.0579 | 12 | 370 | detection of chemical stimulus involved in sensory perception of smell |
| GO:0016339 | 0.0064 | 8.7633 | 0.3828 | 3 | 28 | calcium-dependent cell-cell adhesion via plasma membrane cell adhesion molecules |
| GO:0032501 | 0.0067 | 1.4102 | 95.2932 | 114 | 6971 | multicellular organismal process |
| GO:1905207 | 0.0067 | 5.7446 | 0.7518 | 4 | 55 | regulation of cardiocyte differentiation |
| GO:0007186 | 0.0068 | 1.7445 | 17.1148 | 28 | 1252 | G-protein coupled receptor signaling pathway |
| GO:0006091 | 0.0069 | 2.3044 | 5.9328 | 13 | 434 | generation of precursor metabolites and energy |
| GO:0010770 | 0.0077 | 3.6801 | 1.7224 | 6 | 126 | positive regulation of cell morphogenesis involved in differentiation |
| GO:0032488 | 0.0078 | 18.1932 | 0.1367 | 2 | 10 | Cdc42 protein signal transduction |
| GO:0044703 | 0.0082 | 1.8413 | 12.6447 | 22 | 925 | multi-organism reproductive process |
| GO:0006298 | 0.0093 | 7.5527 | 0.4374 | 3 | 32 | mismatch repair |
| GO:0014808 | 0.0093 | 7.5527 | 0.4374 | 3 | 32 | release of sequestered calcium ion into cytosol by sarcoplasmic reticulum |
| GO:0007600 | 0.0093 | 1.8437 | 12.0296 | 21 | 880 | sensory perception |
| GOMFID | Pvalue | OddsRatio | ExpCount | Count | Size | Term |
| GO:0002548 | 2e-04 | 8.0307 | 0.8361 | 6 | 62 | monocyte chemotaxis |
| GO:0070098 | 7e-04 | 6.0704 | 1.0788 | 6 | 80 | chemokine-mediated signaling pathway |
| GO:0048247 | 0.0011 | 7.0393 | 0.7821 | 5 | 58 | lymphocyte chemotaxis |
| GO:0030593 | 0.0012 | 5.4754 | 1.1867 | 6 | 88 | neutrophil chemotaxis |
| GO:0010647 | 0.0013 | 1.8353 | 21.401 | 36 | 1587 | positive regulation of cell communication |
| GO:0023056 | 0.0014 | 1.8275 | 21.482 | 36 | 1593 | positive regulation of signaling |
| GO:0010469 | 0.0016 | 2.3943 | 7.5652 | 17 | 561 | regulation of receptor activity |
| GO:0070383 | 0.0026 | 36.9055 | 0.0809 | 2 | 6 | DNA cytosine deamination |
| GO:2000503 | 0.0026 | 36.9055 | 0.0809 | 2 | 6 | positive regulation of natural killer cell chemotaxis |
| GO:0060326 | 0.0029 | 3.0062 | 3.5196 | 10 | 261 | cell chemotaxis |
| GO:1904951 | 0.0032 | 2.3654 | 6.7156 | 15 | 498 | positive regulation of establishment of protein localization |
| GO:0050900 | 0.0035 | 2.5095 | 5.475 | 13 | 406 | leukocyte migration |
| GO:0045869 | 0.0036 | 29.5226 | 0.0944 | 2 | 7 | negative regulation of single stranded viral RNA replication via double stranded DNA intermediate |
| GO:1902533 | 0.0042 | 1.9306 | 12.6896 | 23 | 941 | positive regulation of intracellular signal transduction |
| GO:0006954 | 0.0042 | 2.1143 | 9.0216 | 18 | 669 | inflammatory response |
| GO:0070374 | 0.0049 | 3.2278 | 2.6161 | 8 | 194 | positive regulation of ERK1 and ERK2 cascade |
| GO:0006955 | 0.0054 | 1.6453 | 24.9611 | 38 | 1851 | immune response |
| GO:0002682 | 0.0059 | 1.732 | 18.5422 | 30 | 1375 | regulation of immune system process |
| GO:0034341 | 0.006 | 3.4245 | 2.1576 | 7 | 160 | response to interferon-gamma |
| GO:0009972 | 0.0061 | 21.0849 | 0.1214 | 2 | 9 | cytidine deamination |
| GO:0046087 | 0.0061 | 21.0849 | 0.1214 | 2 | 9 | cytidine metabolic process |
| GO:0097530 | 0.0062 | 3.8623 | 1.6452 | 6 | 122 | granulocyte migration |
| GO:0050830 | 0.0064 | 4.5415 | 1.1732 | 5 | 87 | defense response to Gram-positive bacterium |
| GO:0071347 | 0.0074 | 4.3804 | 1.2137 | 5 | 90 | cellular response to interleukin-1 |
| GO:0010458 | 0.0075 | 8.2274 | 0.4046 | 3 | 30 | exit from mitosis |
| GO:0032689 | 0.0075 | 8.2274 | 0.4046 | 3 | 30 | negative regulation of interferon-gamma production |
| GO:1904589 | 0.0076 | 3.2732 | 2.252 | 7 | 167 | regulation of protein import |
| GO:0010838 | 0.0076 | 18.4482 | 0.1349 | 2 | 10 | positive regulation of keratinocyte proliferation |
| GO:0035589 | 0.0076 | 18.4482 | 0.1349 | 2 | 10 | G-protein coupled purinergic nucleotide receptor signaling pathway |
| GO:1902237 | 0.0076 | 18.4482 | 0.1349 | 2 | 10 | positive regulation of endoplasmic reticulum stress-induced intrinsic apoptotic signaling pathway |
| GO:1902902 | 0.0076 | 18.4482 | 0.1349 | 2 | 10 | negative regulation of autophagosome assembly |
| GO:1900182 | 0.0078 | 3.671 | 1.7261 | 6 | 128 | positive regulation of protein localization to nucleus |
| GO:0002430 | 0.0092 | 16.3973 | 0.1483 | 2 | 11 | complement receptor mediated signaling pathway |
| GO:0016553 | 0.0092 | 16.3973 | 0.1483 | 2 | 11 | base conversion or substitution editing |
| GO:0046133 | 0.0092 | 16.3973 | 0.1483 | 2 | 11 | pyrimidine ribonucleoside catabolic process |
| GO:0048245 | 0.0092 | 16.3973 | 0.1483 | 2 | 11 | eosinophil chemotaxis |
| GO:0060525 | 0.0092 | 16.3973 | 0.1483 | 2 | 11 | prostate glandular acinus development |
| GOMFID | Pvalue | OddsRatio | ExpCount | Count | Size | Term |
| GO:0070098 | 0 | 8.822 | 1.0296 | 8 | 80 | chemokine-mediated signaling pathway |
| GO:0010469 | 0 | 3.0299 | 7.2198 | 20 | 561 | regulation of receptor activity |
| GO:0060326 | 1e-04 | 3.8608 | 3.3589 | 12 | 261 | cell chemotaxis |
| GO:0097530 | 2e-04 | 5.5571 | 1.5701 | 8 | 122 | granulocyte migration |
| GO:0006954 | 4e-04 | 2.5081 | 8.6097 | 20 | 669 | inflammatory response |
| GO:0007166 | 4e-04 | 1.7754 | 33.8209 | 53 | 2628 | cell surface receptor signaling pathway |
| GO:1900544 | 5e-04 | 4.7939 | 1.8017 | 8 | 140 | positive regulation of purine nucleotide metabolic process |
| GO:0030801 | 5e-04 | 5.3588 | 1.4156 | 7 | 110 | positive regulation of cyclic nucleotide metabolic process |
| GO:0030802 | 6e-04 | 4.5505 | 1.8918 | 8 | 147 | regulation of cyclic nucleotide biosynthetic process |
| GO:0090317 | 9e-04 | 5.8201 | 1.1196 | 6 | 87 | negative regulation of intracellular protein transport |
| GO:1900371 | 9e-04 | 4.3007 | 1.9948 | 8 | 155 | regulation of purine nucleotide biosynthetic process |
| GO:0070374 | 9e-04 | 3.8544 | 2.4967 | 9 | 194 | positive regulation of ERK1 and ERK2 cascade |
| GO:0030593 | 0.001 | 5.7488 | 1.1325 | 6 | 88 | neutrophil chemotaxis |
| GO:0002687 | 0.001 | 4.8384 | 1.5572 | 7 | 121 | positive regulation of leukocyte migration |
| GO:0002399 | 0.001 | 77.4348 | 0.0515 | 2 | 4 | MHC class II protein complex assembly |
| GO:0060011 | 0.001 | 77.4348 | 0.0515 | 2 | 4 | Sertoli cell proliferation |
| GO:0052652 | 0.0011 | 4.1857 | 2.0462 | 8 | 159 | cyclic purine nucleotide metabolic process |
| GO:1902533 | 0.0011 | 2.1382 | 12.1102 | 24 | 941 | positive regulation of intracellular signal transduction |
| GO:0071347 | 0.0011 | 5.6112 | 1.1583 | 6 | 90 | cellular response to interleukin-1 |
| GO:0042116 | 0.0011 | 6.9919 | 0.785 | 5 | 61 | macrophage activation |
| GO:0002548 | 0.0012 | 6.8688 | 0.7979 | 5 | 62 | monocyte chemotaxis |
| GO:0045087 | 0.0012 | 2.1936 | 10.7846 | 22 | 838 | innate immune response |
| GO:0042306 | 0.0013 | 4.0503 | 2.1106 | 8 | 164 | regulation of protein import into nucleus |
| GO:0050921 | 0.0013 | 4.5565 | 1.6473 | 7 | 128 | positive regulation of chemotaxis |
| GO:0045937 | 0.0014 | 2.0292 | 13.8347 | 26 | 1075 | positive regulation of phosphate metabolic process |
| GO:0042992 | 0.0015 | 8.9176 | 0.5019 | 4 | 39 | negative regulation of transcription factor import into nucleus |
| GO:0042699 | 0.0016 | 51.62 | 0.0643 | 2 | 5 | follicle-stimulating hormone signaling pathway |
| GO:0060157 | 0.0016 | 51.62 | 0.0643 | 2 | 5 | urinary bladder development |
| GO:0060437 | 0.0016 | 51.62 | 0.0643 | 2 | 5 | lung growth |
| GO:0032101 | 0.0018 | 2.2575 | 8.9958 | 19 | 699 | regulation of response to external stimulus |
| GO:0097192 | 0.0019 | 6.1148 | 0.888 | 5 | 69 | extrinsic apoptotic signaling pathway in absence of ligand |
| GO:0032642 | 0.0021 | 6.0204 | 0.9009 | 5 | 70 | regulation of chemokine production |
| GO:0046823 | 0.0021 | 6.0204 | 0.9009 | 5 | 70 | negative regulation of nucleocytoplasmic transport |
| GO:0006140 | 0.0021 | 3.1465 | 3.3718 | 10 | 262 | regulation of nucleotide metabolic process |
| GO:0071346 | 0.0022 | 4.1423 | 1.8017 | 7 | 140 | cellular response to interferon-gamma |
| GO:1901623 | 0.0024 | 12.9555 | 0.2703 | 3 | 21 | regulation of lymphocyte chemotaxis |
| GO:0030810 | 0.0024 | 4.7565 | 1.3513 | 6 | 105 | positive regulation of nucleotide biosynthetic process |
| GO:0051964 | 0.0024 | 38.7126 | 0.0772 | 2 | 6 | negative regulation of synapse assembly |
| GO:0070383 | 0.0024 | 38.7126 | 0.0772 | 2 | 6 | DNA cytosine deamination |
| GO:2000503 | 0.0024 | 38.7126 | 0.0772 | 2 | 6 | positive regulation of natural killer cell chemotaxis |
| GO:0042330 | 0.0025 | 2.3556 | 7.2198 | 16 | 561 | taxis |
| GO:0030814 | 0.0026 | 4.0203 | 1.8532 | 7 | 144 | regulation of cAMP metabolic process |
| GO:0023014 | 0.0029 | 2.0329 | 11.5696 | 22 | 899 | signal transduction by protein phosphorylation |
| GO:0002682 | 0.003 | 1.83 | 17.6955 | 30 | 1375 | regulation of immune system process |
| GO:2000482 | 0.0031 | 11.6585 | 0.296 | 3 | 23 | regulation of interleukin-8 secretion |
| GO:0043408 | 0.0033 | 2.1708 | 8.8156 | 18 | 685 | regulation of MAPK cascade |
| GO:0045869 | 0.0033 | 30.9681 | 0.0901 | 2 | 7 | negative regulation of single stranded viral RNA replication via double stranded DNA intermediate |
| GO:0050663 | 0.0034 | 3.4468 | 2.4581 | 8 | 191 | cytokine secretion |
| GO:0002230 | 0.0035 | 11.1026 | 0.3089 | 3 | 24 | positive regulation of defense response to virus by host |
| GO:0045761 | 0.0035 | 5.2852 | 1.0167 | 5 | 79 | regulation of adenylate cyclase activity |
| GO:0009607 | 0.0036 | 2.0277 | 11.042 | 21 | 858 | response to biotic stimulus |
| GO:0010647 | 0.0039 | 1.7467 | 20.4238 | 33 | 1587 | positive regulation of cell communication |
| GO:0030819 | 0.0039 | 5.1454 | 1.0424 | 5 | 81 | positive regulation of cAMP biosynthetic process |
| GO:0046688 | 0.0039 | 10.5973 | 0.3217 | 3 | 25 | response to copper ion |
| GO:0051170 | 0.004 | 2.8685 | 3.6807 | 10 | 286 | nuclear import |
| GO:0042742 | 0.0041 | 3.0645 | 3.1015 | 9 | 241 | defense response to bacterium |
| GO:0023056 | 0.0041 | 1.7393 | 20.501 | 33 | 1593 | positive regulation of signaling |
| GO:0051707 | 0.0043 | 2.0307 | 10.4757 | 20 | 814 | response to other organism |
| GO:0060638 | 0.0044 | 25.8052 | 0.103 | 2 | 8 | mesenchymal-epithelial cell signaling |
| GO:2000147 | 0.0052 | 2.3893 | 5.7398 | 13 | 446 | positive regulation of cell motility |
| GO:0002053 | 0.0054 | 9.3239 | 0.3603 | 3 | 28 | positive regulation of mesenchymal cell proliferation |
| GO:1902692 | 0.0054 | 9.3239 | 0.3603 | 3 | 28 | regulation of neuroblast proliferation |
| GO:0009972 | 0.0056 | 22.1173 | 0.1158 | 2 | 9 | cytidine deamination |
| GO:0046087 | 0.0056 | 22.1173 | 0.1158 | 2 | 9 | cytidine metabolic process |
| GO:0060513 | 0.0056 | 22.1173 | 0.1158 | 2 | 9 | prostatic bud formation |
| GO:0007155 | 0.0057 | 1.7722 | 16.9233 | 28 | 1315 | cell adhesion |
| GO:0006955 | 0.0058 | 1.9138 | 12.2991 | 22 | 1013 | immune response |
| GO:0072676 | 0.0061 | 4.598 | 1.1583 | 5 | 90 | lymphocyte migration |
| GO:0098657 | 0.0062 | 2.0785 | 8.6483 | 17 | 672 | import into cell |
| GO:0048584 | 0.0065 | 1.6178 | 26.125 | 39 | 2030 | positive regulation of response to stimulus |
| GO:0051349 | 0.0066 | 5.7731 | 0.7464 | 4 | 58 | positive regulation of lyase activity |
| GO:1902235 | 0.0066 | 8.6321 | 0.3861 | 3 | 30 | regulation of endoplasmic reticulum stress-induced intrinsic apoptotic signaling pathway |
| GO:0010838 | 0.0069 | 19.3514 | 0.1287 | 2 | 10 | positive regulation of keratinocyte proliferation |
| GO:0035589 | 0.0069 | 19.3514 | 0.1287 | 2 | 10 | G-protein coupled purinergic nucleotide receptor signaling pathway |
| GO:0071436 | 0.0069 | 19.3514 | 0.1287 | 2 | 10 | sodium ion export |
| GO:1904590 | 0.0079 | 5.4682 | 0.785 | 4 | 61 | negative regulation of protein import |
| GO:1904591 | 0.0083 | 4.2463 | 1.2483 | 5 | 97 | positive regulation of protein import |
| GO:0002430 | 0.0084 | 17.2002 | 0.1416 | 2 | 11 | complement receptor mediated signaling pathway |
| GO:0016553 | 0.0084 | 17.2002 | 0.1416 | 2 | 11 | base conversion or substitution editing |
| GO:0046133 | 0.0084 | 17.2002 | 0.1416 | 2 | 11 | pyrimidine ribonucleoside catabolic process |
| GO:0072672 | 0.0084 | 17.2002 | 0.1416 | 2 | 11 | neutrophil extravasation |
| GO:0032879 | 0.0085 | 1.5376 | 32.5855 | 46 | 2532 | regulation of localization |
| GO:0051223 | 0.0085 | 1.964 | 9.6778 | 18 | 752 | regulation of protein transport |
| GO:0007186 | 0.0089 | 1.742 | 15.8995 | 26 | 1247 | G-protein coupled receptor signaling pathway |
| GO:0050714 | 0.01 | 2.8343 | 2.96 | 8 | 230 | positive regulation of protein secretion |
| GO:0045836 | 0.01 | 15.4792 | 0.1544 | 2 | 12 | positive regulation of meiotic nuclear division |
| GO:0090197 | 0.01 | 15.4792 | 0.1544 | 2 | 12 | positive regulation of chemokine secretion |
| GO:1900029 | 0.01 | 15.4792 | 0.1544 | 2 | 12 | positive regulation of ruffle assembly |
| GOMFID | Pvalue | OddsRatio | ExpCount | Count | Size | Term |
| GO:0050911 | 0 | 6.405 | 3.4631 | 19 | 370 | detection of chemical stimulus involved in sensory perception of smell |
| GO:0009593 | 0 | 5.5305 | 4.2025 | 20 | 449 | detection of chemical stimulus |
| GO:0007186 | 0 | 3.5509 | 11.6326 | 34 | 1251 | G-protein coupled receptor signaling pathway |
| GO:0050906 | 0 | 5.3759 | 4.3148 | 20 | 461 | detection of stimulus involved in sensory perception |
| GO:0007606 | 0 | 5.3017 | 4.3709 | 20 | 467 | sensory perception of chemical stimulus |
| GO:0030593 | 0 | 9.5401 | 0.8236 | 7 | 88 | neutrophil chemotaxis |
| GO:0050877 | 1e-04 | 2.5975 | 11.3251 | 26 | 1210 | nervous system process |
| GO:0070098 | 1e-04 | 8.8934 | 0.7488 | 6 | 80 | chemokine-mediated signaling pathway |
| GO:0097530 | 1e-04 | 6.7053 | 1.1419 | 7 | 122 | granulocyte migration |
| GO:0006954 | 2e-04 | 2.9813 | 6.2616 | 17 | 669 | inflammatory response |
| GO:0071347 | 2e-04 | 7.8297 | 0.8424 | 6 | 90 | cellular response to interleukin-1 |
| GO:0048247 | 2e-04 | 10.2907 | 0.5429 | 5 | 58 | lymphocyte chemotaxis |
| GO:0002548 | 3e-04 | 9.5662 | 0.5803 | 5 | 62 | monocyte chemotaxis |
| GO:0071346 | 3e-04 | 5.7913 | 1.3103 | 7 | 140 | cellular response to interferon-gamma |
| GO:0070613 | 4e-04 | 6.7053 | 0.9734 | 6 | 104 | regulation of protein processing |
| GO:0070374 | 5e-04 | 4.7497 | 1.8158 | 8 | 194 | positive regulation of ERK1 and ERK2 cascade |
| GO:0060326 | 8e-04 | 3.955 | 2.4429 | 9 | 261 | cell chemotaxis |
| GO:0010675 | 8e-04 | 5.9152 | 1.0951 | 6 | 117 | regulation of cellular carbohydrate metabolic process |
| GO:0070173 | 9e-04 | 71.4889 | 0.0468 | 2 | 5 | regulation of enamel mineralization |
| GO:0019319 | 9e-04 | 7.2621 | 0.7488 | 5 | 80 | hexose biosynthetic process |
| GO:0003071 | 0.0012 | 16.1758 | 0.2153 | 3 | 23 | renal system process involved in regulation of systemic arterial blood pressure |
| GO:0016051 | 0.0019 | 4.2665 | 1.7502 | 7 | 187 | carbohydrate biosynthetic process |
| GO:0002480 | 0.0023 | 35.7378 | 0.0749 | 2 | 8 | antigen processing and presentation of exogenous peptide antigen via MHC class I, TAP-independent |
| GO:0035865 | 0.0023 | 35.7378 | 0.0749 | 2 | 8 | cellular response to potassium ion |
| GO:0006007 | 0.0025 | 12.4383 | 0.2714 | 3 | 29 | glucose catabolic process |
| GO:0097398 | 0.003 | 30.6305 | 0.0842 | 2 | 9 | cellular response to interleukin-17 |
| GO:0006958 | 0.0033 | 11.1495 | 0.2995 | 3 | 32 | complement activation, classical pathway |
| GO:0006955 | 0.0036 | 1.8461 | 17.3246 | 29 | 1851 | immune response |
| GO:0034097 | 0.0039 | 2.1525 | 9.0133 | 18 | 963 | response to cytokine |
| GO:0060612 | 0.0042 | 10.1023 | 0.3276 | 3 | 35 | adipose tissue development |
| GO:0045722 | 0.0045 | 23.8207 | 0.103 | 2 | 11 | positive regulation of gluconeogenesis |
| GO:0051593 | 0.0045 | 23.8207 | 0.103 | 2 | 11 | response to folic acid |
| GO:0070486 | 0.0045 | 23.8207 | 0.103 | 2 | 11 | leukocyte aggregation |
| GO:0050900 | 0.0049 | 2.7906 | 3.8 | 10 | 406 | leukocyte migration |
| GO:0001659 | 0.0053 | 9.2347 | 0.3557 | 3 | 38 | temperature homeostasis |
| GO:0001660 | 0.0054 | 21.4373 | 0.1123 | 2 | 12 | fever generation |
| GO:0006957 | 0.0054 | 21.4373 | 0.1123 | 2 | 12 | complement activation, alternative pathway |
| GO:0010896 | 0.0054 | 21.4373 | 0.1123 | 2 | 12 | regulation of triglyceride catabolic process |
| GO:0031424 | 0.0054 | 3.4981 | 2.1153 | 7 | 226 | keratinization |
| GO:0010469 | 0.0065 | 2.4261 | 5.2507 | 12 | 561 | regulation of receptor activity |
| GO:0070542 | 0.0067 | 5.6942 | 0.7488 | 4 | 80 | response to fatty acid |
| GO:0072376 | 0.0073 | 5.5475 | 0.7675 | 4 | 82 | protein activation cascade |
| GO:0006000 | 0.0074 | 17.8622 | 0.131 | 2 | 14 | fructose metabolic process |
| GO:0009812 | 0.0084 | 16.4872 | 0.1404 | 2 | 15 | flavonoid metabolic process |
| GO:0009605 | 0.0089 | 1.7 | 19.3089 | 30 | 2063 | response to external stimulus |
| GO:0003147 | 0.0094 | Inf | 0.0094 | 1 | 1 | neural crest cell migration involved in heart formation |
| GO:0007522 | 0.0094 | Inf | 0.0094 | 1 | 1 | visceral muscle development |
| GO:0010232 | 0.0094 | Inf | 0.0094 | 1 | 1 | vascular transport |
| GO:0010920 | 0.0094 | Inf | 0.0094 | 1 | 1 | negative regulation of inositol phosphate biosynthetic process |
| GO:0010925 | 0.0094 | Inf | 0.0094 | 1 | 1 | positive regulation of inositol-polyphosphate 5-phosphatase activity |
| GO:0010987 | 0.0094 | Inf | 0.0094 | 1 | 1 | negative regulation of high-density lipoprotein particle clearance |
| GO:0030845 | 0.0094 | Inf | 0.0094 | 1 | 1 | phospholipase C-inhibiting G-protein coupled receptor signaling pathway |
| GO:0033274 | 0.0094 | Inf | 0.0094 | 1 | 1 | response to vitamin B2 |
| GO:0034337 | 0.0094 | Inf | 0.0094 | 1 | 1 | RNA folding |
| GO:0036305 | 0.0094 | Inf | 0.0094 | 1 | 1 | ameloblast differentiation |
| GO:0043251 | 0.0094 | Inf | 0.0094 | 1 | 1 | sodium-dependent organic anion transport |
| GO:0060305 | 0.0094 | Inf | 0.0094 | 1 | 1 | regulation of cell diameter |
| GO:0061713 | 0.0094 | Inf | 0.0094 | 1 | 1 | anterior neural tube closure |
| GO:0070829 | 0.0094 | Inf | 0.0094 | 1 | 1 | heterochromatin maintenance |
| GO:0071250 | 0.0094 | Inf | 0.0094 | 1 | 1 | cellular response to nitrite |
| GO:1904635 | 0.0094 | Inf | 0.0094 | 1 | 1 | positive regulation of glomerular visceral epithelial cell apoptotic process |
| GO:1905322 | 0.0094 | Inf | 0.0094 | 1 | 1 | positive regulation of mesenchymal stem cell migration |
| GO:2000119 | 0.0094 | Inf | 0.0094 | 1 | 1 | negative regulation of sodium-dependent phosphate transport |
| GO:2000184 | 0.0094 | Inf | 0.0094 | 1 | 1 | positive regulation of progesterone biosynthetic process |
| GOMFID | Pvalue | OddsRatio | ExpCount | Count | Size | Term |
| GO:0006952 | 0 | 1.9707 | 27.4513 | 49 | 1491 | defense response |
| GO:1901687 | 5e-04 | 12.7011 | 0.3866 | 4 | 21 | glutathione derivative biosynthetic process |
| GO:0031953 | 9e-04 | 20.1854 | 0.2025 | 3 | 11 | negative regulation of protein autophosphorylation |
| GO:0061044 | 0.001 | 107.3401 | 0.0552 | 2 | 3 | negative regulation of vascular wound healing |
| GO:0070340 | 0.001 | 107.3401 | 0.0552 | 2 | 3 | detection of bacterial lipopeptide |
| GO:1903825 | 0.001 | 4.2273 | 2.0437 | 8 | 111 | organic acid transmembrane transport |
| GO:0030157 | 0.0012 | 17.9414 | 0.2209 | 3 | 12 | pancreatic juice secretion |
| GO:0008588 | 0.002 | 53.6667 | 0.0736 | 2 | 4 | release of cytoplasmic sequestered NF-kappaB |
| GO:0014722 | 0.002 | 53.6667 | 0.0736 | 2 | 4 | regulation of skeletal muscle contraction by calcium ion signaling |
| GO:0050727 | 0.0022 | 2.5524 | 5.7996 | 14 | 315 | regulation of inflammatory response |
| GO:0008595 | 0.0024 | 13.4535 | 0.2762 | 3 | 15 | anterior/posterior axis specification, embryo |
| GO:0012501 | 0.0024 | 1.5903 | 35.9942 | 53 | 1955 | programmed cell death |
| GO:0043409 | 0.0026 | 3.2892 | 2.909 | 9 | 158 | negative regulation of MAPK cascade |
| GO:0030198 | 0.003 | 2.4607 | 6.0021 | 14 | 326 | extracellular matrix organization |
| GO:0051459 | 0.0033 | 35.7755 | 0.0921 | 2 | 5 | regulation of corticotropin secretion |
| GO:0061302 | 0.0033 | 35.7755 | 0.0921 | 2 | 5 | smooth muscle cell-matrix adhesion |
| GO:0007350 | 0.0041 | 10.7608 | 0.3314 | 3 | 18 | blastoderm segmentation |
| GO:0002376 | 0.0042 | 1.4798 | 49.1583 | 67 | 2670 | immune system process |
| GO:0031589 | 0.0042 | 2.4531 | 5.5786 | 13 | 303 | cell-substrate adhesion |
| GO:0050776 | 0.0044 | 1.7942 | 16.4966 | 28 | 896 | regulation of immune response |
| GO:0003180 | 0.0048 | 26.83 | 0.1105 | 2 | 6 | aortic valve morphogenesis |
| GO:0071221 | 0.0048 | 26.83 | 0.1105 | 2 | 6 | cellular response to bacterial lipopeptide |
| GO:0060548 | 0.0061 | 1.7473 | 16.9016 | 28 | 918 | negative regulation of cell death |
| GO:0019673 | 0.0067 | 21.4626 | 0.1289 | 2 | 7 | GDP-mannose metabolic process |
| GO:0032493 | 0.0067 | 21.4626 | 0.1289 | 2 | 7 | response to bacterial lipoprotein |
| GO:0070244 | 0.0067 | 21.4626 | 0.1289 | 2 | 7 | negative regulation of thymocyte apoptotic process |
| GO:0070227 | 0.0078 | 4.3557 | 1.2336 | 5 | 67 | lymphocyte apoptotic process |
| GO:0032967 | 0.0083 | 8.0681 | 0.4235 | 3 | 23 | positive regulation of collagen biosynthetic process |
| GO:0080134 | 0.0085 | 1.5865 | 24.6712 | 37 | 1340 | regulation of response to stress |
| GO:0007155 | 0.0086 | 1.6838 | 18.161 | 29 | 1012 | cell adhesion |
| GO:0045410 | 0.0088 | 17.8844 | 0.1473 | 2 | 8 | positive regulation of interleukin-6 biosynthetic process |
| GO:0003333 | 0.0088 | 4.219 | 1.2704 | 5 | 69 | amino acid transmembrane transport |
| GO:0044253 | 0.0094 | 7.6834 | 0.4419 | 3 | 24 | positive regulation of multicellular organismal metabolic process |
| GO:0006869 | 0.0099 | 2.1909 | 6.2046 | 13 | 337 | lipid transport |
| GO:0043066 | 0.01 | 1.7291 | 15.1709 | 25 | 824 | negative regulation of apoptotic process |
| GOMFID | Pvalue | OddsRatio | ExpCount | Count | Size | Term |
| GO:0002548 | 1e-04 | 9.1128 | 0.7406 | 6 | 62 | monocyte chemotaxis |
| GO:0050829 | 3e-04 | 7.0807 | 0.9318 | 6 | 78 | defense response to Gram-negative bacterium |
| GO:0050729 | 4e-04 | 5.7941 | 1.314 | 7 | 110 | positive regulation of inflammatory response |
| GO:0045087 | 4e-04 | 2.4306 | 9.8513 | 22 | 833 | innate immune response |
| GO:0010710 | 4e-04 | 167.1354 | 0.0358 | 2 | 3 | regulation of collagen catabolic process |
| GO:0002682 | 4e-04 | 2.0804 | 16.4255 | 31 | 1375 | regulation of immune system process |
| GO:0007186 | 4e-04 | 2.1302 | 14.9562 | 29 | 1252 | G-protein coupled receptor signaling pathway |
| GO:0050911 | 5e-04 | 3.1564 | 4.42 | 13 | 370 | detection of chemical stimulus involved in sensory perception of smell |
| GO:0050830 | 6e-04 | 6.2904 | 1.0393 | 6 | 87 | defense response to Gram-positive bacterium |
| GO:0050852 | 8e-04 | 4.4096 | 1.9472 | 8 | 163 | T cell receptor signaling pathway |
| GO:1903039 | 0.0011 | 3.7779 | 2.5445 | 9 | 213 | positive regulation of leukocyte cell-cell adhesion |
| GO:0060326 | 0.0012 | 3.42 | 3.1179 | 10 | 261 | cell chemotaxis |
| GO:0050900 | 0.0012 | 2.8607 | 4.85 | 13 | 406 | leukocyte migration |
| GO:0031295 | 0.0012 | 6.8203 | 0.8004 | 5 | 67 | T cell costimulation |
| GO:0061760 | 0.0014 | 55.7049 | 0.0597 | 2 | 5 | antifungal innate immune response |
| GO:0007606 | 0.0015 | 2.6772 | 5.5787 | 14 | 467 | sensory perception of chemical stimulus |
| GO:0002790 | 0.002 | 2.502 | 6.391 | 15 | 535 | peptide secretion |
| GO:0051716 | 0.002 | 1.5324 | 81.6855 | 102 | 6838 | cellular response to stimulus |
| GO:0002583 | 0.0021 | 41.776 | 0.0717 | 2 | 6 | regulation of antigen processing and presentation of peptide antigen |
| GO:0070383 | 0.0021 | 41.776 | 0.0717 | 2 | 6 | DNA cytosine deamination |
| GO:0009593 | 0.0022 | 2.6678 | 5.1818 | 13 | 438 | detection of chemical stimulus |
| GO:0070098 | 0.0027 | 5.6335 | 0.9557 | 5 | 80 | chemokine-mediated signaling pathway |
| GO:0050778 | 0.0028 | 2.264 | 8.0037 | 17 | 670 | positive regulation of immune response |
| GO:0045869 | 0.0029 | 33.4188 | 0.0836 | 2 | 7 | negative regulation of single stranded viral RNA replication via double stranded DNA intermediate |
| GO:1903012 | 0.0029 | 33.4188 | 0.0836 | 2 | 7 | positive regulation of bone development |
| GO:1904468 | 0.0029 | 33.4188 | 0.0836 | 2 | 7 | negative regulation of tumor necrosis factor secretion |
| GO:0009607 | 0.0033 | 2.086 | 10.2495 | 20 | 858 | response to biotic stimulus |
| GO:0050906 | 0.0037 | 2.5007 | 5.507 | 13 | 461 | detection of stimulus involved in sensory perception |
| GO:0002887 | 0.0038 | 27.8472 | 0.0956 | 2 | 8 | negative regulation of myeloid leukocyte mediated immunity |
| GO:1904628 | 0.0038 | 27.8472 | 0.0956 | 2 | 8 | cellular response to phorbol 13-acetate 12-myristate |
| GO:0002690 | 0.0039 | 5.1503 | 1.0393 | 5 | 87 | positive regulation of leukocyte chemotaxis |
| GO:0051707 | 0.0041 | 2.0828 | 9.7239 | 19 | 814 | response to other organism |
| GO:0051251 | 0.0041 | 3.0614 | 3.1059 | 9 | 260 | positive regulation of lymphocyte activation |
| GO:0031347 | 0.0042 | 2.1703 | 8.3262 | 17 | 697 | regulation of defense response |
| GO:0032101 | 0.0044 | 2.1637 | 8.3501 | 17 | 699 | regulation of response to external stimulus |
| GO:0033993 | 0.0044 | 2.0297 | 10.5123 | 20 | 880 | response to lipid |
| GO:0006950 | 0.0046 | 1.5417 | 43.0408 | 59 | 3603 | response to stress |
| GO:0008354 | 0.0048 | 23.8676 | 0.1075 | 2 | 9 | germ cell migration |
| GO:0009972 | 0.0048 | 23.8676 | 0.1075 | 2 | 9 | cytidine deamination |
| GO:0042747 | 0.0048 | 23.8676 | 0.1075 | 2 | 9 | circadian sleep/wake cycle, REM sleep |
| GO:0043301 | 0.0048 | 23.8676 | 0.1075 | 2 | 9 | negative regulation of leukocyte degranulation |
| GO:0046087 | 0.0048 | 23.8676 | 0.1075 | 2 | 9 | cytidine metabolic process |
| GO:0042035 | 0.0049 | 4.8528 | 1.099 | 5 | 92 | regulation of cytokine biosynthetic process |
| GO:0048247 | 0.0051 | 6.2347 | 0.6929 | 4 | 58 | lymphocyte chemotaxis |
| GO:0060135 | 0.0051 | 6.2347 | 0.6929 | 4 | 58 | maternal process involved in female pregnancy |
| GO:0051339 | 0.0056 | 4.6902 | 1.1349 | 5 | 95 | regulation of lyase activity |
| GO:0032677 | 0.0057 | 6.0113 | 0.7167 | 4 | 60 | regulation of interleukin-8 production |
| GO:0032729 | 0.0057 | 6.0113 | 0.7167 | 4 | 60 | positive regulation of interferon-gamma production |
| GO:0042102 | 0.0059 | 4.6384 | 1.1468 | 5 | 96 | positive regulation of T cell proliferation |
| GO:0033004 | 0.006 | 20.8828 | 0.1195 | 2 | 10 | negative regulation of mast cell activation |
| GO:0090085 | 0.006 | 20.8828 | 0.1195 | 2 | 10 | regulation of protein deubiquitination |
| GO:0072529 | 0.007 | 8.3853 | 0.3942 | 3 | 33 | pyrimidine-containing compound catabolic process |
| GO:0016553 | 0.0073 | 18.5613 | 0.1314 | 2 | 11 | base conversion or substitution editing |
| GO:0032490 | 0.0073 | 18.5613 | 0.1314 | 2 | 11 | detection of molecule of bacterial origin |
| GO:0045591 | 0.0073 | 18.5613 | 0.1314 | 2 | 11 | positive regulation of regulatory T cell differentiation |
| GO:0045953 | 0.0073 | 18.5613 | 0.1314 | 2 | 11 | negative regulation of natural killer cell mediated cytotoxicity |
| GO:0046133 | 0.0073 | 18.5613 | 0.1314 | 2 | 11 | pyrimidine ribonucleoside catabolic process |
| GO:0046689 | 0.0073 | 18.5613 | 0.1314 | 2 | 11 | response to mercury ion |
| GO:0050663 | 0.0081 | 3.227 | 2.2817 | 7 | 191 | cytokine secretion |
| GO:0002715 | 0.0083 | 7.8603 | 0.4181 | 3 | 35 | regulation of natural killer cell mediated immunity |
| GO:0042107 | 0.0085 | 4.2185 | 1.2543 | 5 | 105 | cytokine metabolic process |
| GO:0090276 | 0.0088 | 3.1746 | 2.3175 | 7 | 194 | regulation of peptide hormone secretion |
| GO:0023052 | 0.0092 | 1.4253 | 72.5469 | 89 | 6073 | signaling |
| GO:0002768 | 0.0093 | 2.5181 | 4.1691 | 10 | 349 | immune response-regulating cell surface receptor signaling pathway |
| GO:0007340 | 0.0097 | 7.397 | 0.442 | 3 | 37 | acrosome reaction |
| GO:1901998 | 0.0097 | 7.397 | 0.442 | 3 | 37 | toxin transport |
| GO:0032680 | 0.0099 | 4.0553 | 1.3021 | 5 | 109 | regulation of tumor necrosis factor production |
| GOMFID | Pvalue | OddsRatio | ExpCount | Count | Size | Term |
| GO:0050776 | 1e-04 | 2.2273 | 16.6069 | 34 | 896 | regulation of immune response |
| GO:0001775 | 3e-04 | 1.8924 | 23.4832 | 41 | 1267 | cell activation |
| GO:0098657 | 3e-04 | 2.2382 | 12.4552 | 26 | 672 | import into cell |
| GO:0018003 | 3e-04 | Inf | 0.0371 | 2 | 2 | peptidyl-lysine N6-acetylation |
| GO:0090149 | 3e-04 | Inf | 0.0371 | 2 | 2 | mitochondrial membrane fission |
| GO:0045087 | 9e-04 | 1.994 | 15.5319 | 29 | 838 | innate immune response |
| GO:0044868 | 0.001 | 106.6087 | 0.0556 | 2 | 3 | modulation by host of viral molecular function |
| GO:2000502 | 0.001 | 106.6087 | 0.0556 | 2 | 3 | negative regulation of natural killer cell chemotaxis |
| GO:0019884 | 0.0014 | 3.3467 | 3.1879 | 10 | 172 | antigen processing and presentation of exogenous antigen |
| GO:0050896 | 0.0015 | 1.4271 | 152.0384 | 178 | 8203 | response to stimulus |
| GO:0019886 | 0.0017 | 4.389 | 1.7237 | 7 | 93 | antigen processing and presentation of exogenous peptide antigen via MHC class II |
| GO:0050863 | 0.0019 | 2.5958 | 5.7086 | 14 | 308 | regulation of T cell activation |
| GO:0035195 | 0.0019 | 2.7009 | 5.097 | 13 | 275 | gene silencing by miRNA |
| GO:0006933 | 0.002 | 53.301 | 0.0741 | 2 | 4 | negative regulation of cell adhesion involved in substrate-bound cell migration |
| GO:0070212 | 0.002 | 53.301 | 0.0741 | 2 | 4 | protein poly-ADP-ribosylation |
| GO:0070213 | 0.002 | 53.301 | 0.0741 | 2 | 4 | protein auto-ADP-ribosylation |
| GO:0002504 | 0.0022 | 4.1929 | 1.7978 | 7 | 97 | antigen processing and presentation of peptide or polysaccharide antigen via MHC class II |
| GO:0045123 | 0.0023 | 5.9662 | 0.9267 | 5 | 50 | cellular extravasation |
| GO:0016441 | 0.0024 | 2.6295 | 5.2267 | 13 | 282 | posttranscriptional gene silencing |
| GO:0046649 | 0.0024 | 2.0514 | 11.3431 | 22 | 612 | lymphocyte activation |
| GO:0007159 | 0.0027 | 2.3991 | 6.5983 | 15 | 356 | leukocyte cell-cell adhesion |
| GO:0002252 | 0.003 | 1.7622 | 19.906 | 33 | 1074 | immune effector process |
| GO:0051351 | 0.0033 | 35.5318 | 0.0927 | 2 | 5 | positive regulation of ligase activity |
| GO:0022407 | 0.0041 | 2.2266 | 7.5621 | 16 | 408 | regulation of cell-cell adhesion |
| GO:0031047 | 0.0047 | 2.4188 | 5.653 | 13 | 305 | gene silencing by RNA |
| GO:0034182 | 0.0049 | 26.6472 | 0.1112 | 2 | 6 | regulation of maintenance of mitotic sister chromatid cohesion |
| GO:0052428 | 0.0049 | 26.6472 | 0.1112 | 2 | 6 | modulation by host of symbiont molecular function |
| GO:0090677 | 0.0049 | 26.6472 | 0.1112 | 2 | 6 | reversible differentiation |
| GO:0006898 | 0.0054 | 2.4749 | 5.097 | 12 | 275 | receptor-mediated endocytosis |
| GO:0006281 | 0.0054 | 2.0529 | 9.2116 | 18 | 497 | DNA repair |
| GO:0010881 | 0.0057 | 9.4287 | 0.3707 | 3 | 20 | regulation of cardiac muscle contraction by regulation of the release of sequestered calcium ion |
| GO:0051152 | 0.0057 | 9.4287 | 0.3707 | 3 | 20 | positive regulation of smooth muscle cell differentiation |
| GO:0048002 | 0.0058 | 2.8934 | 3.2806 | 9 | 177 | antigen processing and presentation of peptide antigen |
| GO:0030219 | 0.0059 | 3.9331 | 1.631 | 6 | 88 | megakaryocyte differentiation |
| GO:0002449 | 0.0061 | 2.6907 | 3.9108 | 10 | 211 | lymphocyte mediated immunity |
| GO:0006417 | 0.0062 | 1.9821 | 10.0642 | 19 | 543 | regulation of translation |
| GO:0010447 | 0.0065 | 8.9044 | 0.3892 | 3 | 21 | response to acidic pH |
| GO:0051971 | 0.0068 | 21.3164 | 0.1297 | 2 | 7 | positive regulation of transmission of nerve impulse |
| GO:0080009 | 0.0068 | 21.3164 | 0.1297 | 2 | 7 | mRNA methylation |
| GO:0019827 | 0.0069 | 3.0374 | 2.7802 | 8 | 150 | stem cell population maintenance |
| GO:0002455 | 0.0074 | 5.6357 | 0.7784 | 4 | 42 | humoral immune response mediated by circulating immunoglobulin |
| GO:0030728 | 0.0075 | 8.4352 | 0.4078 | 3 | 22 | ovulation |
| GO:0050794 | 0.0077 | 1.361 | 185.5856 | 206 | 10075 | regulation of cellular process |
| GO:0070534 | 0.0088 | 5.3532 | 0.8155 | 4 | 44 | protein K63-linked ubiquitination |
| GO:0044359 | 0.0089 | 17.7625 | 0.1483 | 2 | 8 | modulation of molecular function in other organism |
| GO:1900239 | 0.0089 | 17.7625 | 0.1483 | 2 | 8 | regulation of phenotypic switching |
| GOMFID | Pvalue | OddsRatio | ExpCount | Count | Size | Term |
| GO:0031726 | 0 | 112.0514 | 0.067 | 3 | 5 | CCR1 chemokine receptor binding |
| GO:0008009 | 0 | 10.7962 | 0.6428 | 6 | 48 | chemokine activity |
| GO:0005126 | 1e-04 | 4.0116 | 3.5218 | 13 | 263 | cytokine receptor binding |
| GO:0030545 | 2e-04 | 2.9018 | 6.3205 | 17 | 472 | receptor regulator activity |
| GO:0008157 | 0.0017 | 14.928 | 0.241 | 3 | 18 | protein phosphatase 1 binding |
| GO:0001875 | 0.0017 | 49.5659 | 0.067 | 2 | 5 | lipopolysaccharide receptor activity |
| GO:0031730 | 0.0026 | 37.1721 | 0.0803 | 2 | 6 | CCR5 chemokine receptor binding |
| GO:0004065 | 0.0047 | 24.7783 | 0.1071 | 2 | 8 | arylsulfatase activity |
| GO:0004126 | 0.0047 | 24.7783 | 0.1071 | 2 | 8 | cytidine deaminase activity |
| GO:0001540 | 0.0048 | 6.3694 | 0.6829 | 4 | 51 | amyloid-beta binding |
| GO:0005125 | 0.0066 | 3.3642 | 2.194 | 7 | 168 | cytokine activity |
| GO:0008474 | 0.0075 | 18.5814 | 0.1339 | 2 | 10 | palmitoyl-(protein) hydrolase activity |
| GO:0048020 | 0.0078 | 8.1017 | 0.4096 | 3 | 31 | CCR chemokine receptor binding |
| GOMFID | Pvalue | OddsRatio | ExpCount | Count | Size | Term |
| GO:0005126 | 0 | 4.7677 | 3.0025 | 13 | 263 | cytokine receptor binding |
| GO:0031726 | 0 | 132.0165 | 0.0571 | 3 | 5 | CCR1 chemokine receptor binding |
| GO:0030545 | 1e-04 | 3.2314 | 5.3885 | 16 | 472 | receptor regulator activity |
| GO:0008009 | 2e-04 | 10.3211 | 0.548 | 5 | 48 | chemokine activity |
| GO:0005125 | 6e-04 | 4.598 | 1.8716 | 8 | 168 | cytokine activity |
| GO:0038024 | 0.0011 | 7.0357 | 0.7763 | 5 | 68 | cargo receptor activity |
| GO:0001875 | 0.0013 | 58.3497 | 0.0571 | 2 | 5 | lipopolysaccharide receptor activity |
| GO:0031730 | 0.0019 | 43.7596 | 0.0685 | 2 | 6 | CCR5 chemokine receptor binding |
| GO:0060089 | 0.0024 | 1.8694 | 17.5011 | 30 | 1533 | molecular transducer activity |
| GO:0001540 | 0.0027 | 7.5105 | 0.5822 | 4 | 51 | amyloid-beta binding |
| GO:0004465 | 0.0035 | 29.1694 | 0.0913 | 2 | 8 | lipoprotein lipase activity |
| GO:0005164 | 0.0043 | 10.1399 | 0.3311 | 3 | 29 | tumor necrosis factor receptor binding |
| GO:0061134 | 0.0095 | 3.1265 | 2.3517 | 7 | 206 | peptidase regulator activity |
| GOMFID | Pvalue | OddsRatio | ExpCount | Count | Size | Term |
| GO:0004860 | 0.0016 | 3.9714 | 2.1865 | 8 | 93 | protein kinase inhibitor activity |
| GO:0034186 | 0.0032 | 41.7467 | 0.094 | 2 | 4 | apolipoprotein A-I binding |
| GO:0019207 | 0.0034 | 2.6338 | 4.8198 | 12 | 205 | kinase regulator activity |
| GO:0000268 | 0.0053 | 27.8294 | 0.1176 | 2 | 5 | peroxisome targeting sequence binding |
| GO:0016833 | 0.0078 | 20.8707 | 0.1411 | 2 | 6 | oxo-acid-lyase activity |
| GO:0008157 | 0.0081 | 8.3646 | 0.4232 | 3 | 18 | protein phosphatase 1 binding |
| GOMFID | Pvalue | OddsRatio | ExpCount | Count | Size | Term |
| GO:0019207 | 5e-04 | 2.8793 | 5.5915 | 15 | 205 | kinase regulator activity |
| GO:0016773 | 6e-04 | 1.8995 | 20.1566 | 36 | 739 | phosphotransferase activity, alcohol group as acceptor |
| GO:0016301 | 7e-04 | 1.8491 | 21.8477 | 38 | 801 | kinase activity |
| GO:0030366 | 7e-04 | Inf | 0.0546 | 2 | 2 | molybdopterin synthase activity |
| GO:0001224 | 0.0022 | 71.6455 | 0.0818 | 2 | 3 | RNA polymerase II transcription cofactor binding |
| GO:0005166 | 0.0022 | 71.6455 | 0.0818 | 2 | 3 | neurotrophin p75 receptor binding |
| GO:0061649 | 0.0022 | 71.6455 | 0.0818 | 2 | 3 | ubiquitin modification-dependent histone binding |
| GO:0004860 | 0.0039 | 3.3999 | 2.5366 | 8 | 93 | protein kinase inhibitor activity |
| GO:0005087 | 0.0043 | 35.8205 | 0.1091 | 2 | 4 | Ran guanyl-nucleotide exchange factor activity |
| GO:0004674 | 0.007 | 1.8868 | 11.6467 | 21 | 427 | protein serine/threonine kinase activity |
| GO:0032555 | 0.007 | 1.4291 | 48.0595 | 65 | 1762 | purine ribonucleotide binding |
| GO:0005521 | 0.0072 | 8.9698 | 0.4091 | 3 | 15 | lamin binding |
| GO:0004722 | 0.0085 | 3.6629 | 1.7729 | 6 | 65 | protein serine/threonine phosphatase activity |
| GO:0035639 | 0.0092 | 1.4151 | 46.9139 | 63 | 1720 | purine ribonucleoside triphosphate binding |
| GOMFID | Pvalue | OddsRatio | ExpCount | Count | Size | Term |
| GO:0004792 | 7e-04 | 128.1365 | 0.0465 | 2 | 3 | thiosulfate sulfurtransferase activity |
| GO:0003909 | 0.0048 | 25.6209 | 0.1084 | 2 | 7 | DNA ligase activity |
| GO:0038023 | 0.0048 | 1.7233 | 19.8105 | 32 | 1279 | signaling receptor activity |
| GO:0004984 | 0.0052 | 2.3864 | 5.7309 | 13 | 370 | olfactory receptor activity |
| GO:0004126 | 0.0063 | 21.3494 | 0.1239 | 2 | 8 | cytidine deaminase activity |
| GO:0015297 | 0.0065 | 4.5468 | 1.1772 | 5 | 76 | antiporter activity |
| GO:0060089 | 0.0076 | 1.617 | 23.7447 | 36 | 1533 | molecular transducer activity |
| GO:0030515 | 0.009 | 7.7076 | 0.4337 | 3 | 28 | snoRNA binding |
| GO:0045028 | 0.0099 | 16.01 | 0.1549 | 2 | 10 | G-protein coupled purinergic nucleotide receptor activity |
| GOMFID | Pvalue | OddsRatio | ExpCount | Count | Size | Term |
| GO:0060089 | 0 | 2.3054 | 18.7309 | 38 | 1533 | molecular transducer activity |
| GO:0099600 | 0 | 2.4068 | 14.8943 | 32 | 1219 | transmembrane receptor activity |
| GO:0004930 | 0 | 2.771 | 9.567 | 24 | 783 | G-protein coupled receptor activity |
| GO:0038023 | 0 | 2.3693 | 15.6274 | 33 | 1279 | signaling receptor activity |
| GO:0004984 | 1e-04 | 3.6139 | 4.5208 | 15 | 370 | olfactory receptor activity |
| GO:0003909 | 0.003 | 32.6571 | 0.0855 | 2 | 7 | DNA ligase activity |
| GO:0005549 | 0.0035 | 5.2906 | 1.0141 | 5 | 83 | odorant binding |
| GO:0004126 | 0.004 | 27.2126 | 0.0977 | 2 | 8 | cytidine deaminase activity |
| GO:0030548 | 0.0063 | 20.4069 | 0.1222 | 2 | 10 | acetylcholine receptor regulator activity |
| GO:0004062 | 0.009 | 16.3235 | 0.1466 | 2 | 12 | aryl sulfotransferase activity |
| GOMFID | Pvalue | OddsRatio | ExpCount | Count | Size | Term |
| GO:0032394 | 2e-04 | Inf | 0.0295 | 2 | 2 | MHC class Ib receptor activity |
| GO:0000253 | 0.0013 | 67.3586 | 0.059 | 2 | 4 | 3-keto sterol reductase activity |
| GO:0030246 | 0.0053 | 2.7452 | 3.8346 | 10 | 260 | carbohydrate binding |
| GO:0016861 | 0.0057 | 22.4473 | 0.118 | 2 | 8 | intramolecular oxidoreductase activity, interconverting aldoses and ketoses |
| GO:0052659 | 0.0057 | 22.4473 | 0.118 | 2 | 8 | inositol-1,3,4,5-tetrakisphosphate 5-phosphatase activity |
| GO:0019864 | 0.009 | 16.8333 | 0.1475 | 2 | 10 | IgG binding |
| GO:0046030 | 0.009 | 16.8333 | 0.1475 | 2 | 10 | inositol trisphosphate phosphatase activity |
| GOMFID | Pvalue | OddsRatio | ExpCount | Count | Size | Term |
| GO:0015037 | 4e-04 | 25.9573 | 0.1508 | 3 | 13 | peptide disulfide oxidoreductase activity |
| GO:0004890 | 8e-04 | 19.9634 | 0.1856 | 3 | 16 | GABA-A receptor activity |
| GO:0004957 | 0.0019 | 43.0457 | 0.0696 | 2 | 6 | prostaglandin E receptor activity |
| GO:0030250 | 0.0027 | 34.4344 | 0.0812 | 2 | 7 | guanylate cyclase activator activity |
| GO:0099600 | 0.0038 | 1.9041 | 14.1421 | 25 | 1219 | transmembrane receptor activity |
| GO:0010851 | 0.0046 | 24.5929 | 0.1044 | 2 | 9 | cyclase regulator activity |
| GO:0004954 | 0.0069 | 19.1254 | 0.1276 | 2 | 11 | prostanoid receptor activity |
| GO:0038023 | 0.007 | 1.8056 | 14.8381 | 25 | 1279 | signaling receptor activity |
| GO:0004930 | 0.0097 | 1.9793 | 9.0839 | 17 | 783 | G-protein coupled receptor activity |
| GOMFID | Pvalue | OddsRatio | ExpCount | Count | Size | Term |
| GO:0060089 | 2e-04 | 2.1059 | 18.5417 | 35 | 1533 | molecular transducer activity |
| GO:0099600 | 3e-04 | 2.1625 | 14.7438 | 29 | 1219 | transmembrane receptor activity |
| GO:0038023 | 7e-04 | 2.0504 | 15.4695 | 29 | 1279 | signaling receptor activity |
| GO:0005223 | 9e-04 | 82.5103 | 0.0484 | 2 | 4 | intracellular cGMP activated cation channel activity |
| GO:0048020 | 0.0012 | 9.5083 | 0.4717 | 4 | 39 | CCR chemokine receptor binding |
| GO:0004930 | 0.0013 | 2.2706 | 9.4704 | 20 | 783 | G-protein coupled receptor activity |
| GO:0023023 | 0.0017 | 14.6224 | 0.2419 | 3 | 20 | MHC protein complex binding |
| GO:0004984 | 0.0019 | 2.8512 | 4.4752 | 12 | 370 | olfactory receptor activity |
| GO:0004957 | 0.0021 | 41.25 | 0.0726 | 2 | 6 | prostaglandin E receptor activity |
| GO:0008009 | 0.0027 | 7.5592 | 0.5806 | 4 | 48 | chemokine activity |
| GO:0001594 | 0.0029 | 32.9979 | 0.0847 | 2 | 7 | trace-amine receptor activity |
| GO:0008603 | 0.0029 | 32.9979 | 0.0847 | 2 | 7 | cAMP-dependent protein kinase regulator activity |
| GO:0004126 | 0.0039 | 27.4966 | 0.0968 | 2 | 8 | cytidine deaminase activity |
| GO:0032395 | 0.005 | 23.567 | 0.1089 | 2 | 9 | MHC class II receptor activity |
| GO:0043855 | 0.005 | 23.567 | 0.1089 | 2 | 9 | cyclic nucleotide-gated ion channel activity |
| GO:0035325 | 0.0061 | 20.6198 | 0.121 | 2 | 10 | Toll-like receptor binding |
| GO:0004954 | 0.0075 | 18.3276 | 0.133 | 2 | 11 | prostanoid receptor activity |
| GO:0048018 | 0.0081 | 2.346 | 5.3823 | 12 | 445 | receptor ligand activity |
| GO:0030551 | 0.0093 | 7.5252 | 0.4354 | 3 | 36 | cyclic nucleotide binding |
| GOMFID | Pvalue | OddsRatio | ExpCount | Count | Size | Term |
| GO:0004930 | 2e-04 | 2.479 | 10.0985 | 23 | 783 | G-protein coupled receptor activity |
| GO:0004984 | 3e-04 | 3.1541 | 4.772 | 14 | 370 | olfactory receptor activity |
| GO:0003796 | 5e-04 | 23.2806 | 0.1677 | 3 | 13 | lysozyme activity |
| GO:0030197 | 0.001 | 77.2657 | 0.0516 | 2 | 4 | extracellular matrix constituent, lubricant activity |
| GO:0099600 | 0.0021 | 1.923 | 15.7218 | 28 | 1219 | transmembrane receptor activity |
| GO:0038023 | 0.0021 | 1.9006 | 16.4956 | 29 | 1279 | signaling receptor activity |
| GO:0015232 | 0.0033 | 30.9005 | 0.0903 | 2 | 7 | heme transporter activity |
| GO:0030414 | 0.0068 | 3.3453 | 2.2054 | 7 | 171 | peptidase inhibitor activity |
| GO:0015143 | 0.007 | 19.3092 | 0.129 | 2 | 10 | urate transmembrane transporter activity |
| GO:0060089 | 0.0079 | 1.6806 | 19.7715 | 31 | 1533 | molecular transducer activity |
| GO:0008200 | 0.0094 | 7.5 | 0.4385 | 3 | 34 | ion channel inhibitor activity |
| GOMFID | Pvalue | OddsRatio | ExpCount | Count | Size | Term |
| GO:0004984 | 1e-04 | 3.6837 | 3.8359 | 13 | 370 | olfactory receptor activity |
| GO:0004930 | 2e-04 | 2.7052 | 8.1175 | 20 | 783 | G-protein coupled receptor activity |
| GO:0032403 | 5e-04 | 2.5597 | 8.0864 | 19 | 780 | protein complex binding |
| GO:0060089 | 5e-04 | 2.1022 | 15.8929 | 30 | 1533 | molecular transducer activity |
| GO:0099600 | 8e-04 | 2.1733 | 12.6376 | 25 | 1219 | transmembrane receptor activity |
| GO:0038023 | 0.0015 | 2.061 | 13.2596 | 25 | 1279 | signaling receptor activity |
| GO:0071253 | 0.0016 | 48.2922 | 0.0622 | 2 | 6 | connexin binding |
| GO:0005549 | 0.0017 | 6.2762 | 0.8605 | 5 | 83 | odorant binding |
| GO:0019864 | 0.0046 | 24.1401 | 0.1037 | 2 | 10 | IgG binding |
| GO:0004859 | 0.0055 | 21.4565 | 0.114 | 2 | 11 | phospholipase inhibitor activity |
| GO:0030280 | 0.009 | 16.0894 | 0.1451 | 2 | 14 | structural constituent of epidermis |
| GOMFID | Pvalue | OddsRatio | ExpCount | Count | Size | Term |
| GO:0004930 | 4e-04 | 2.2196 | 12.6111 | 26 | 783 | G-protein coupled receptor activity |
| GO:0008131 | 0.0015 | 61.5521 | 0.0644 | 2 | 4 | primary amine oxidase activity |
| GO:0016833 | 0.0037 | 30.7722 | 0.0966 | 2 | 6 | oxo-acid-lyase activity |
| GO:0099600 | 0.0043 | 1.7372 | 19.6334 | 32 | 1219 | transmembrane receptor activity |
| GO:0004984 | 0.0072 | 2.2887 | 5.9593 | 13 | 370 | olfactory receptor activity |
| GO:0019957 | 0.0086 | 17.5808 | 0.145 | 2 | 9 | C-C chemokine binding |
| GOMFID | Pvalue | OddsRatio | ExpCount | Count | Size | Term |
| GO:1903231 | 9e-04 | 4.8752 | 1.5443 | 7 | 129 | mRNA binding involved in posttranscriptional gene silencing |
| GO:0016833 | 0.0021 | 41.6849 | 0.0718 | 2 | 6 | oxo-acid-lyase activity |
| GO:0004126 | 0.0038 | 27.7865 | 0.0958 | 2 | 8 | cytidine deaminase activity |
| GO:0004252 | 0.0058 | 3.4471 | 2.1429 | 7 | 179 | serine-type endopeptidase activity |
| GO:0031994 | 0.0087 | 16.6677 | 0.1437 | 2 | 12 | insulin-like growth factor I binding |
| GO:0015197 | 0.0096 | 4.0859 | 1.2929 | 5 | 108 | peptide transporter activity |
| GOMFID | Pvalue | OddsRatio | ExpCount | Count | Size | Term |
| GO:0030983 | 5e-04 | 25.0078 | 0.16 | 3 | 12 | mismatched DNA binding |
| GO:0005125 | 0.0025 | 3.3148 | 2.8791 | 9 | 216 | cytokine activity |
| GO:0008494 | 0.0026 | 37.3481 | 0.08 | 2 | 6 | translation activator activity |
| GO:0004984 | 0.0041 | 2.5684 | 4.9318 | 12 | 370 | olfactory receptor activity |
| GO:0001968 | 0.0054 | 9.3691 | 0.3599 | 3 | 27 | fibronectin binding |
| GO:0008233 | 0.0073 | 2.088 | 8.0775 | 16 | 606 | peptidase activity |
| GO:0004930 | 0.0087 | 1.922 | 10.4368 | 19 | 783 | G-protein coupled receptor activity |
| GOMFID | Pvalue | OddsRatio | ExpCount | Count | Size | Term |
| GO:0005515 | 0.0016 | 1.399 | 266.4095 | 294 | 10766 | protein binding |
| GO:0043295 | 0.0021 | 14.8832 | 0.2722 | 3 | 11 | glutathione binding |
| GO:0001851 | 0.0035 | 39.604 | 0.099 | 2 | 4 | complement component C3b binding |
| GO:0022839 | 0.0044 | 5.1039 | 1.0888 | 5 | 44 | ion gated channel activity |
| GO:0022838 | 0.0071 | 1.9504 | 10.1951 | 19 | 412 | substrate-specific channel activity |
| GO:0022803 | 0.0072 | 1.9134 | 10.9375 | 20 | 442 | passive transmembrane transporter activity |
| GO:0004723 | 0.0086 | 19.7995 | 0.1485 | 2 | 6 | calcium-dependent protein serine/threonine phosphatase activity |
| GO:0004602 | 0.0093 | 7.9342 | 0.4454 | 3 | 18 | glutathione peroxidase activity |
| GO:0031690 | 0.0093 | 7.9342 | 0.4454 | 3 | 18 | adrenergic receptor binding |
| GO:0070300 | 0.0093 | 7.9342 | 0.4454 | 3 | 18 | phosphatidic acid binding |
| GO:0005547 | 0.0095 | 5.2977 | 0.8413 | 4 | 34 | phosphatidylinositol-3,4,5-trisphosphate binding |
| GOMFID | Pvalue | OddsRatio | ExpCount | Count | Size | Term |
| GO:0005515 | 5e-04 | 1.4561 | 269.067 | 300 | 10766 | protein binding |
| GO:0043295 | 0.0022 | 14.7313 | 0.2749 | 3 | 11 | glutathione binding |
| GO:0030371 | 0.0023 | 8.2851 | 0.5748 | 4 | 23 | translation repressor activity |
| GO:0001851 | 0.0036 | 39.201 | 0.1 | 2 | 4 | complement component C3b binding |
| GO:0022839 | 0.0046 | 5.0516 | 1.0997 | 5 | 44 | ion gated channel activity |
| GO:0022838 | 0.0079 | 1.9297 | 10.2968 | 19 | 412 | substrate-specific channel activity |
| GO:0022803 | 0.008 | 1.893 | 11.0466 | 20 | 442 | passive transmembrane transporter activity |
| GO:0004723 | 0.0087 | 19.598 | 0.15 | 2 | 6 | calcium-dependent protein serine/threonine phosphatase activity |
| GO:0004602 | 0.0096 | 7.8532 | 0.4499 | 3 | 18 | glutathione peroxidase activity |
| GO:0070300 | 0.0096 | 7.8532 | 0.4499 | 3 | 18 | phosphatidic acid binding |
| GO:0005547 | 0.0099 | 5.2436 | 0.8497 | 4 | 34 | phosphatidylinositol-3,4,5-trisphosphate binding |
| GOMFID | Pvalue | OddsRatio | ExpCount | Count | Size | Term |
| GO:0008009 | 4e-04 | 8.7456 | 0.6428 | 5 | 48 | chemokine activity |
| GO:0004867 | 0.0012 | 5.4491 | 1.1918 | 6 | 89 | serine-type endopeptidase inhibitor activity |
| GO:0008329 | 0.0014 | 15.9953 | 0.2276 | 3 | 17 | signaling pattern recognition receptor activity |
| GO:0031726 | 0.0017 | 49.5659 | 0.067 | 2 | 5 | CCR1 chemokine receptor binding |
| GO:0004908 | 0.0026 | 37.1721 | 0.0803 | 2 | 6 | interleukin-1 receptor activity |
| GO:0030246 | 0.0027 | 3.0412 | 3.4816 | 10 | 260 | carbohydrate binding |
| GO:0005126 | 0.0029 | 3.0045 | 3.5218 | 10 | 263 | cytokine receptor binding |
| GO:0030159 | 0.0034 | 11.1925 | 0.308 | 3 | 23 | receptor signaling complex scaffold activity |
| GO:0004126 | 0.0047 | 24.7783 | 0.1071 | 2 | 8 | cytidine deaminase activity |
| GO:0008061 | 0.0047 | 24.7783 | 0.1071 | 2 | 8 | chitin binding |
| GO:0048018 | 0.0071 | 2.2947 | 5.959 | 13 | 445 | receptor ligand activity |
| GO:0005539 | 0.0072 | 3.0064 | 2.7987 | 8 | 209 | glycosaminoglycan binding |
| GO:0004875 | 0.0075 | 18.5814 | 0.1339 | 2 | 10 | complement receptor activity |
| GO:0030548 | 0.0075 | 18.5814 | 0.1339 | 2 | 10 | acetylcholine receptor regulator activity |
| GO:0045028 | 0.0075 | 18.5814 | 0.1339 | 2 | 10 | G-protein coupled purinergic nucleotide receptor activity |
| GO:0004872 | 0.009 | 1.661 | 19.9391 | 31 | 1489 | receptor activity |
| GOMFID | Pvalue | OddsRatio | ExpCount | Count | Size | Term |
| GO:0030545 | 0 | 3.2092 | 6.1166 | 18 | 472 | receptor regulator activity |
| GO:0005044 | 5e-04 | 8.645 | 0.6479 | 5 | 50 | scavenger receptor activity |
| GO:0023026 | 0.0011 | 17.8172 | 0.2073 | 3 | 16 | MHC class II protein complex binding |
| GO:0004872 | 0.0011 | 3.7422 | 2.5747 | 9 | 210 | receptor activity |
| GO:0005125 | 0.0014 | 3.9876 | 2.142 | 8 | 168 | cytokine activity |
| GO:0070851 | 0.0015 | 4.4497 | 1.6847 | 7 | 130 | growth factor receptor binding |
| GO:0031726 | 0.0016 | 51.2564 | 0.0648 | 2 | 5 | CCR1 chemokine receptor binding |
| GO:0008289 | 0.0018 | 2.3132 | 8.3067 | 18 | 641 | lipid binding |
| GO:0005126 | 0.0023 | 3.1111 | 3.4082 | 10 | 263 | cytokine receptor binding |
| GO:0004908 | 0.0024 | 38.4399 | 0.0778 | 2 | 6 | interleukin-1 receptor activity |
| GO:0008009 | 0.0034 | 7.0393 | 0.622 | 4 | 48 | chemokine activity |
| GO:0004950 | 0.004 | 10.5224 | 0.324 | 3 | 25 | chemokine receptor activity |
| GO:0004126 | 0.0044 | 25.6234 | 0.1037 | 2 | 8 | cytidine deaminase activity |
| GO:0001664 | 0.0066 | 2.8315 | 3.3434 | 9 | 258 | G-protein coupled receptor binding |
| GO:0004875 | 0.007 | 19.2151 | 0.1296 | 2 | 10 | complement receptor activity |
| GO:0045028 | 0.007 | 19.2151 | 0.1296 | 2 | 10 | G-protein coupled purinergic nucleotide receptor activity |
| GO:0038023 | 0.0081 | 1.7374 | 16.5745 | 27 | 1279 | signaling receptor activity |
| GO:0048020 | 0.0093 | 7.5347 | 0.4365 | 3 | 34 | CCR chemokine receptor binding |
| GOMFID | Pvalue | OddsRatio | ExpCount | Count | Size | Term |
| GO:0004974 | 6e-04 | 142.0178 | 0.042 | 2 | 3 | leukotriene receptor activity |
| GO:0004095 | 0.0012 | 71.0044 | 0.056 | 2 | 4 | carnitine O-palmitoyltransferase activity |
| GO:0042605 | 0.0034 | 11.2493 | 0.3082 | 3 | 22 | peptide antigen binding |
| GO:0019784 | 0.0039 | 28.3964 | 0.0981 | 2 | 7 | NEDD8-specific protease activity |
| GO:0004984 | 0.0061 | 2.4352 | 5.183 | 12 | 370 | olfactory receptor activity |
| GO:0004871 | 0.0079 | 1.6386 | 22.2027 | 34 | 1585 | signal transducer activity |
| GO:0000175 | 0.0083 | 7.9122 | 0.4202 | 3 | 30 | 3'-5'-exoribonuclease activity |
| GOMFID | Pvalue | OddsRatio | ExpCount | Count | Size | Term |
| GO:0001665 | 1e-04 | 60.1283 | 0.0992 | 3 | 6 | alpha-N-acetylgalactosaminide alpha-2,6-sialyltransferase activity |
| GO:0032394 | 3e-04 | Inf | 0.0331 | 2 | 2 | MHC class Ib receptor activity |
| GO:0030246 | 0.0013 | 2.9654 | 4.2999 | 12 | 260 | carbohydrate binding |
| GO:0044323 | 0.0016 | 59.906 | 0.0662 | 2 | 4 | retinoic acid-responsive element binding |
| GO:0042288 | 0.003 | 12.0166 | 0.2977 | 3 | 18 | MHC class I protein binding |
| GO:0070717 | 0.0041 | 10.6016 | 0.3308 | 3 | 20 | poly-purine tract binding |
| GO:0019956 | 0.0055 | 9.4844 | 0.3638 | 3 | 22 | chemokine binding |
| GO:0052659 | 0.0071 | 19.9637 | 0.1323 | 2 | 8 | inositol-1,3,4,5-tetrakisphosphate 5-phosphatase activity |
| GO:0005102 | 0.0088 | 1.5962 | 23.9472 | 36 | 1448 | receptor binding |
| GOMFID | Pvalue | OddsRatio | ExpCount | Count | Size | Term |
| GO:0005534 | 0.0036 | 34.172 | 0.0963 | 2 | 5 | galactose binding |
| GO:0008266 | 0.0054 | 9.6341 | 0.3658 | 3 | 19 | poly(U) RNA binding |
| GOMFID | Pvalue | OddsRatio | ExpCount | Count | Size | Term |
| GO:0035663 | 0.001 | 109.354 | 0.0542 | 2 | 3 | Toll-like receptor 2 binding |
| GO:0004364 | 0.0011 | 9.9969 | 0.4701 | 4 | 26 | glutathione transferase activity |
| GO:0097493 | 0.0033 | 11.7473 | 0.3074 | 3 | 17 | structural molecule activity conferring elasticity |
| GO:0004579 | 0.0085 | 18.2199 | 0.1446 | 2 | 8 | dolichyl-diphosphooligosaccharide-protein glycotransferase activity |
| GOMFID | Pvalue | OddsRatio | ExpCount | Count | Size | Term |
| GO:0099600 | 1e-04 | 2.2664 | 14.6686 | 30 | 1219 | transmembrane receptor activity |
| GO:0038023 | 1e-04 | 2.2359 | 15.3906 | 31 | 1279 | signaling receptor activity |
| GO:0004930 | 2e-04 | 2.5482 | 9.4221 | 22 | 783 | G-protein coupled receptor activity |
| GO:0004984 | 6e-04 | 3.1319 | 4.4523 | 13 | 370 | olfactory receptor activity |
| GO:0048020 | 0.0012 | 9.5587 | 0.4693 | 4 | 39 | CCR chemokine receptor binding |
| GO:0005134 | 0.0014 | 55.2919 | 0.0602 | 2 | 5 | interleukin-2 receptor binding |
| GO:0004126 | 0.0038 | 27.6408 | 0.0963 | 2 | 8 | cytidine deaminase activity |
| GO:0031628 | 0.0038 | 27.6408 | 0.0963 | 2 | 8 | opioid receptor binding |
| GO:0004872 | 0.0099 | 3.4783 | 1.8178 | 6 | 167 | receptor activity |
| GOMFID | Pvalue | OddsRatio | ExpCount | Count | Size | Term |
| GO:0005025 | 0.0012 | 71.0044 | 0.056 | 2 | 4 | transforming growth factor beta receptor activity, type I |
| GO:0008318 | 0.0028 | 35.4978 | 0.084 | 2 | 6 | protein prenyltransferase activity |
| GO:0016833 | 0.0028 | 35.4978 | 0.084 | 2 | 6 | oxo-acid-lyase activity |
| GO:0016861 | 0.0052 | 23.6622 | 0.1121 | 2 | 8 | intramolecular oxidoreductase activity, interconverting aldoses and ketoses |
| GO:0019957 | 0.0066 | 20.2806 | 0.1261 | 2 | 9 | C-C chemokine binding |
| GO:0070016 | 0.0082 | 17.7444 | 0.1401 | 2 | 10 | armadillo repeat domain binding |
| GOMFID | Pvalue | OddsRatio | ExpCount | Count | Size | Term |
| GO:0032394 | 1e-04 | Inf | 0.0227 | 2 | 2 | MHC class Ib receptor activity |
| GO:0004872 | 7e-04 | 2.0238 | 16.9069 | 31 | 1489 | receptor activity |
| GO:0004468 | 0.0019 | 44.0027 | 0.0681 | 2 | 6 | lysine N-acetyltransferase activity, acting on acetyl phosphate as donor |
| GO:0047134 | 0.0019 | 44.0027 | 0.0681 | 2 | 6 | protein-disulfide reductase activity |
| GO:0030246 | 0.0029 | 3.2312 | 2.9522 | 9 | 260 | carbohydrate binding |
| GO:0016413 | 0.0034 | 29.3315 | 0.0908 | 2 | 8 | O-acetyltransferase activity |
| GO:0042287 | 0.0042 | 10.1966 | 0.3293 | 3 | 29 | MHC protein binding |
| GO:0033691 | 0.0044 | 25.1397 | 0.1022 | 2 | 9 | sialic acid binding |
| GO:0016651 | 0.0052 | 4.784 | 1.1127 | 5 | 98 | oxidoreductase activity, acting on NAD(P)H |
| GO:0004791 | 0.0066 | 19.5507 | 0.1249 | 2 | 11 | thioredoxin-disulfide reductase activity |
| GO:0016671 | 0.0092 | 15.994 | 0.1476 | 2 | 13 | oxidoreductase activity, acting on a sulfur group of donors, disulfide as acceptor |
| GOMFID | Pvalue | OddsRatio | ExpCount | Count | Size | Term |
| GO:0042288 | 3e-04 | 15.3388 | 0.3332 | 4 | 18 | MHC class I protein binding |
| GO:0032394 | 3e-04 | Inf | 0.037 | 2 | 2 | MHC class Ib receptor activity |
| GO:0032395 | 5e-04 | 26.766 | 0.1666 | 3 | 9 | MHC class II receptor activity |
| GO:0003823 | 0.0025 | 5.8434 | 0.9442 | 5 | 51 | antigen binding |
| GO:0004468 | 0.0049 | 26.6795 | 0.1111 | 2 | 6 | lysine N-acetyltransferase activity, acting on acetyl phosphate as donor |
| GO:0023023 | 0.0057 | 9.4403 | 0.3703 | 3 | 20 | MHC protein complex binding |
| GO:0008174 | 0.0067 | 21.3423 | 0.1296 | 2 | 7 | mRNA methyltransferase activity |
| GOMFID | Pvalue | OddsRatio | ExpCount | Count | Size | Term |
| GO:0004908 | 2e-04 | 41.8545 | 0.1411 | 3 | 6 | interleukin-1 receptor activity |
| GO:0005185 | 6e-04 | Inf | 0.047 | 2 | 2 | neurohypophyseal hormone activity |
| GO:0005126 | 0.0015 | 2.574 | 6.1835 | 15 | 263 | cytokine receptor binding |
| GO:0001851 | 0.0032 | 41.7467 | 0.094 | 2 | 4 | complement component C3b binding |
| GO:0033743 | 0.0032 | 41.7467 | 0.094 | 2 | 4 | peptide-methionine (R)-S-oxide reductase activity |
| GO:0044736 | 0.0032 | 41.7467 | 0.094 | 2 | 4 | acid-sensing ion channel activity |
| GO:0005164 | 0.0045 | 6.7051 | 0.6818 | 4 | 29 | tumor necrosis factor receptor binding |
| GO:0005537 | 0.0069 | 8.9626 | 0.3997 | 3 | 17 | mannose binding |
| GO:0004723 | 0.0078 | 20.8707 | 0.1411 | 2 | 6 | calcium-dependent protein serine/threonine phosphatase activity |
| NA. |
| n/a |
| NA. |
| n/a |
| NA. |
| n/a |
| NA. |
| n/a |
| NA. |
| n/a |
| NA. |
| n/a |
| NA. |
| n/a |
| NA. |
| n/a |
| NA. |
| n/a |
| NA. |
| n/a |
| NA. |
| n/a |
| NA. |
| n/a |
| NA. |
| n/a |
| NA. |
| n/a |
| NA. |
| n/a |
| NA. |
| n/a |
| NA. |
| n/a |
| NA. |
| n/a |
| NA. |
| n/a |
| NA. |
| n/a |
| NA. |
| n/a |
| NA. |
| n/a |
| NA. |
| n/a |
| NA. |
| n/a |
| NA. |
| n/a |
| NA. |
| n/a |
| NA. |
| n/a |
| NA. |
| n/a |
| NA. |
| n/a |
| NA. |
| n/a |
| NA. |
| n/a |
| NA. |
| n/a |
| NA. |
| n/a |
| NA. |
| n/a |
| NA. |
| n/a |
| NA. |
| n/a |
| NA. |
| n/a |
| NA. |
| n/a |
| NA. |
| n/a |
| NA. |
| n/a |
| NA. |
| n/a |
| NA. |
| n/a |
| NA. |
| n/a |
| NA. |
| n/a |
| NA. |
| n/a |
| NA. |
| n/a |
| NA. |
| n/a |
| NA. |
| n/a |
| NA. |
| n/a |
| NA. |
| n/a |
| NA. |
| n/a |
| NA. |
| n/a |
| NA. |
| n/a |
| NA. |
| n/a |
| NA. |
| n/a |
| NA. |
| n/a |
| NA. |
| n/a |
| NA. |
| n/a |
| NA. |
| n/a |
| NA. |
| n/a |
| NA. |
| n/a |
| NA. |
| n/a |
| NA. |
| n/a |
| NA. |
| n/a |
| NA. |
| n/a |
| NA. |
| n/a |
| NA. |
| n/a |
| NA. |
| n/a |
| NA. |
| n/a |
| NA. |
| n/a |
| NA. |
| n/a |
| NA. |
| n/a |
| NA. |
| n/a |
| NA. |
| n/a |
| NA. |
| n/a |
| NA. |
| n/a |
| NA. |
| n/a |
| NA. |
| n/a |
| NA. |
| n/a |
| NA. |
| n/a |
| NA. |
| n/a |
| NA. |
| n/a |
| NA. |
| n/a |
| NA. |
| n/a |
| NA. |
| n/a |
| NA. |
| n/a |
| NA. |
| n/a |
| NA. |
| n/a |
| NA. |
| n/a |
| NA. |
| n/a |
| NA. |
| n/a |
| NA. |
| n/a |
| NA. |
| n/a |
| NA. |
| n/a |
| NA. |
| n/a |
| NA. |
| n/a |
| NA. |
| n/a |
| NA. |
| n/a |
| NA. |
| n/a |
| NA. |
| n/a |
| NA. |
| n/a |
| NA. |
| n/a |
| NA. |
| n/a |
| NA. |
| n/a |
| NA. |
| n/a |
| NA. |
| n/a |
| NA. |
| n/a |
| NA. |
| n/a |
| NA. |
| n/a |
| NA. |
| n/a |
| NA. |
| n/a |
| NA. |
| n/a |
| NA. |
| n/a |
| NA. |
| n/a |
| NA. |
| n/a |
| NA. |
| n/a |
| NA. |
| n/a |
| NA. |
| n/a |
| NA. |
| n/a |
| NA. |
| n/a |
| NA. |
| n/a |
| NA. |
| n/a |
| NA. |
| n/a |
| NA. |
| n/a |
| NA. |
| n/a |
| NA. |
| n/a |
| NA. |
| n/a |
| NA. |
| n/a |
| NA. |
| n/a |
| NA. |
| n/a |
| NA. |
| n/a |
| NA. |
| n/a |
| NA. |
| n/a |
| NA. |
| n/a |
| NA. |
| n/a |
| NA. |
| n/a |
| NA. |
| n/a |
| NA. |
| n/a |
| NA. |
| n/a |
| NA. |
| n/a |
| NA. |
| n/a |
| NA. |
| n/a |
| NA. |
| n/a |
| NA. |
| n/a |
| NA. |
| n/a |
| NA. |
| n/a |
| NA. |
| n/a |
| NA. |
| n/a |
| NA. |
| n/a |
| NA. |
| n/a |
| NA. |
| n/a |
| NA. |
| n/a |
| NA. |
| n/a |
| NA. |
| n/a |
| NA. |
| n/a |
| NA. |
| n/a |
| NA. |
| n/a |
| NA. |
| n/a |
| NA. |
| n/a |
| NA. |
| n/a |
| NA. |
| n/a |
| NA. |
| n/a |
| NA. |
| n/a |
| NA. |
| n/a |
| NA. |
| n/a |
| NA. |
| n/a |
| NA. |
| n/a |
| NA. |
| n/a |
| NA. |
| n/a |
| NA. |
| n/a |
| NA. |
| n/a |
| NA. |
| n/a |
| NA. |
| n/a |
| NA. |
| n/a |
| NA. |
| n/a |
| NA. |
| n/a |
| NA. |
| n/a |
| NA. |
| n/a |
| NA. |
| n/a |
| NA. |
| n/a |
| NA. |
| n/a |
| NA. |
| n/a |
| NA. |
| n/a |
| NA. |
| n/a |
| NA. |
| n/a |
| NA. |
| n/a |
| NA. |
| n/a |
| NA. |
| n/a |
| NA. |
| n/a |
| NA. |
| n/a |
| NA. |
| n/a |
| NA. |
| n/a |
| NA. |
| n/a |
| NA. |
| n/a |
| NA. |
| n/a |
| NA. |
| n/a |
| NA. |
| n/a |
| NA. |
| n/a |
| NA. |
| n/a |
| NA. |
| n/a |
| NA. |
| n/a |
| NA. |
| n/a |
| NA. |
| n/a |
| NA. |
| n/a |
| NA. |
| n/a |
| NA. |
| n/a |
| NA. |
| n/a |
| NA. |
| n/a |
| NA. |
| n/a |
| NA. |
| n/a |
| NA. |
| n/a |
| NA. |
| n/a |
| NA. |
| n/a |
| NA. |
| n/a |
| NA. |
| n/a |
| NA. |
| n/a |
| NA. |
| n/a |
| NA. |
| n/a |
| NA. |
| n/a |
| NA. |
| n/a |
| NA. |
| n/a |
| NA. |
| n/a |
| NA. |
| n/a |
| NA. |
| n/a |
| NA. |
| n/a |
| NA. |
| n/a |
| NA. |
| n/a |
| NA. |
| n/a |
| NA. |
| n/a |
| NA. |
| n/a |
| NA. |
| n/a |
| NA. |
| n/a |
| NA. |
| n/a |
| NA. |
| n/a |
| NA. |
| n/a |
| NA. |
| n/a |
| NA. |
| n/a |
| NA. |
| n/a |
| NA. |
| n/a |
| NA. |
| n/a |
| NA. |
| n/a |
| NA. |
| n/a |
| NA. |
| n/a |
| NA. |
| n/a |
| NA. |
| n/a |
| NA. |
| n/a |
| NA. |
| n/a |
| NA. |
| n/a |
| NA. |
| n/a |
| NA. |
| n/a |
| NA. |
| n/a |
| NA. |
| n/a |
| NA. |
| n/a |
| NA. |
| n/a |
| NA. |
| n/a |
| NA. |
| n/a |
| NA. |
| n/a |
| NA. |
| n/a |
| NA. |
| n/a |
| NA. |
| n/a |
| NA. |
| n/a |
| NA. |
| n/a |
| NA. |
| n/a |
| NA. |
| n/a |
| NA. |
| n/a |
| NA. |
| n/a |
| NA. |
| n/a |
| NA. |
| n/a |
| NA. |
| n/a |
| NA. |
| n/a |
| NA. |
| n/a |
| NA. |
| n/a |
| NA. |
| n/a |
| NA. |
| n/a |
| NA. |
| n/a |
| NA. |
| n/a |
| NA. |
| n/a |
| NA. |
| n/a |
| NA. |
| n/a |
| NA. |
| n/a |
| NA. |
| n/a |
| NA. |
| n/a |
| NA. |
| n/a |
| NA. |
| n/a |
| NA. |
| n/a |
| NA. |
| n/a |
| NA. |
| n/a |
| NA. |
| n/a |
| NA. |
| n/a |
| NA. |
| n/a |
| NA. |
| n/a |
| NA. |
| n/a |
| NA. |
| n/a |
| NA. |
| n/a |
| NA. |
| n/a |
| NA. |
| n/a |
| NA. |
| n/a |
| NA. |
| n/a |
| NA. |
| n/a |
| NA. |
| n/a |
| NA. |
| n/a |
| NA. |
| n/a |
| NA. |
| n/a |
| NA. |
| n/a |
| NA. |
| n/a |
| NA. |
| n/a |
| NA. |
| n/a |
| NA. |
| n/a |
| NA. |
| n/a |
| NA. |
| n/a |
| NA. |
| n/a |
| NA. |
| n/a |
| NA. |
| n/a |
| NA. |
| n/a |
| NA. |
| n/a |
| NA. |
| n/a |
| NA. |
| n/a |
| NA. |
| n/a |
| NA. |
| n/a |
| NA. |
| n/a |
| NA. |
| n/a |
| NA. |
| n/a |
| NA. |
| n/a |
| NA. |
| n/a |
| NA. |
| n/a |
| NA. |
| n/a |
| NA. |
| n/a |
| NA. |
| n/a |
| NA. |
| n/a |
| NA. |
| n/a |
| NA. |
| n/a |
| NA. |
| n/a |
| NA. |
| n/a |
| NA. |
| n/a |
| NA. |
| n/a |
| NA. |
| n/a |
| NA. |
| n/a |
| NA. |
| n/a |
| NA. |
| n/a |
| NA. |
| n/a |
| NA. |
| n/a |
| NA. |
| n/a |
| NA. |
| n/a |
| NA. |
| n/a |
| NA. |
| n/a |
| NA. |
| n/a |
| NA. |
| n/a |
| NA. |
| n/a |
| NA. |
| n/a |
| NA. |
| n/a |
| NA. |
| n/a |
| NA. |
| n/a |
| NA. |
| n/a |
| NA. |
| n/a |
| NA. |
| n/a |
| NA. |
| n/a |
| NA. |
| n/a |
| NA. |
| n/a |
| NA. |
| n/a |
| NA. |
| n/a |
| NA. |
| n/a |
| NA. |
| n/a |
| NA. |
| n/a |
| NA. |
| n/a |
| NA. |
| n/a |
| NA. |
| n/a |
| NA. |
| n/a |
| NA. |
| n/a |
| NA. |
| n/a |
| NA. |
| n/a |
| NA. |
| n/a |
| NA. |
| n/a |
| NA. |
| n/a |
| NA. |
| n/a |
| NA. |
| n/a |
| NA. |
| n/a |
| NA. |
| n/a |
| NA. |
| n/a |
| NA. |
| n/a |
| NA. |
| n/a |
| NA. |
| n/a |
| NA. |
| n/a |
| NA. |
| n/a |
| NA. |
| n/a |
| NA. |
| n/a |
| NA. |
| n/a |
| NA. |
| n/a |
| NA. |
| n/a |
| NA. |
| n/a |
| NA. |
| n/a |
| NA. |
| n/a |
| NA. |
| n/a |
LOLA Enrichment Analysis
LOLA Enrichment Analysis [2] was conducted. The plots and tables below show enrichments across annotations in the supplied LOLA reference databases for the following collections:
- cistrome_cistrome
- cistrome_cistrome
- cistrome_epigenome
- cistrome_epigenome
- codex
- codex
- encode_tfbs
- encode_tfbs
- sheffield_dnase
- sheffield_dnase
- ucsc_features
- ucsc_features
- jaspar_motifs
- roadmap_epigenomics
| comparison | |
| Hypermethylation/hypomethylation | |
| regions | |
| differential methylation measure | |
| color |
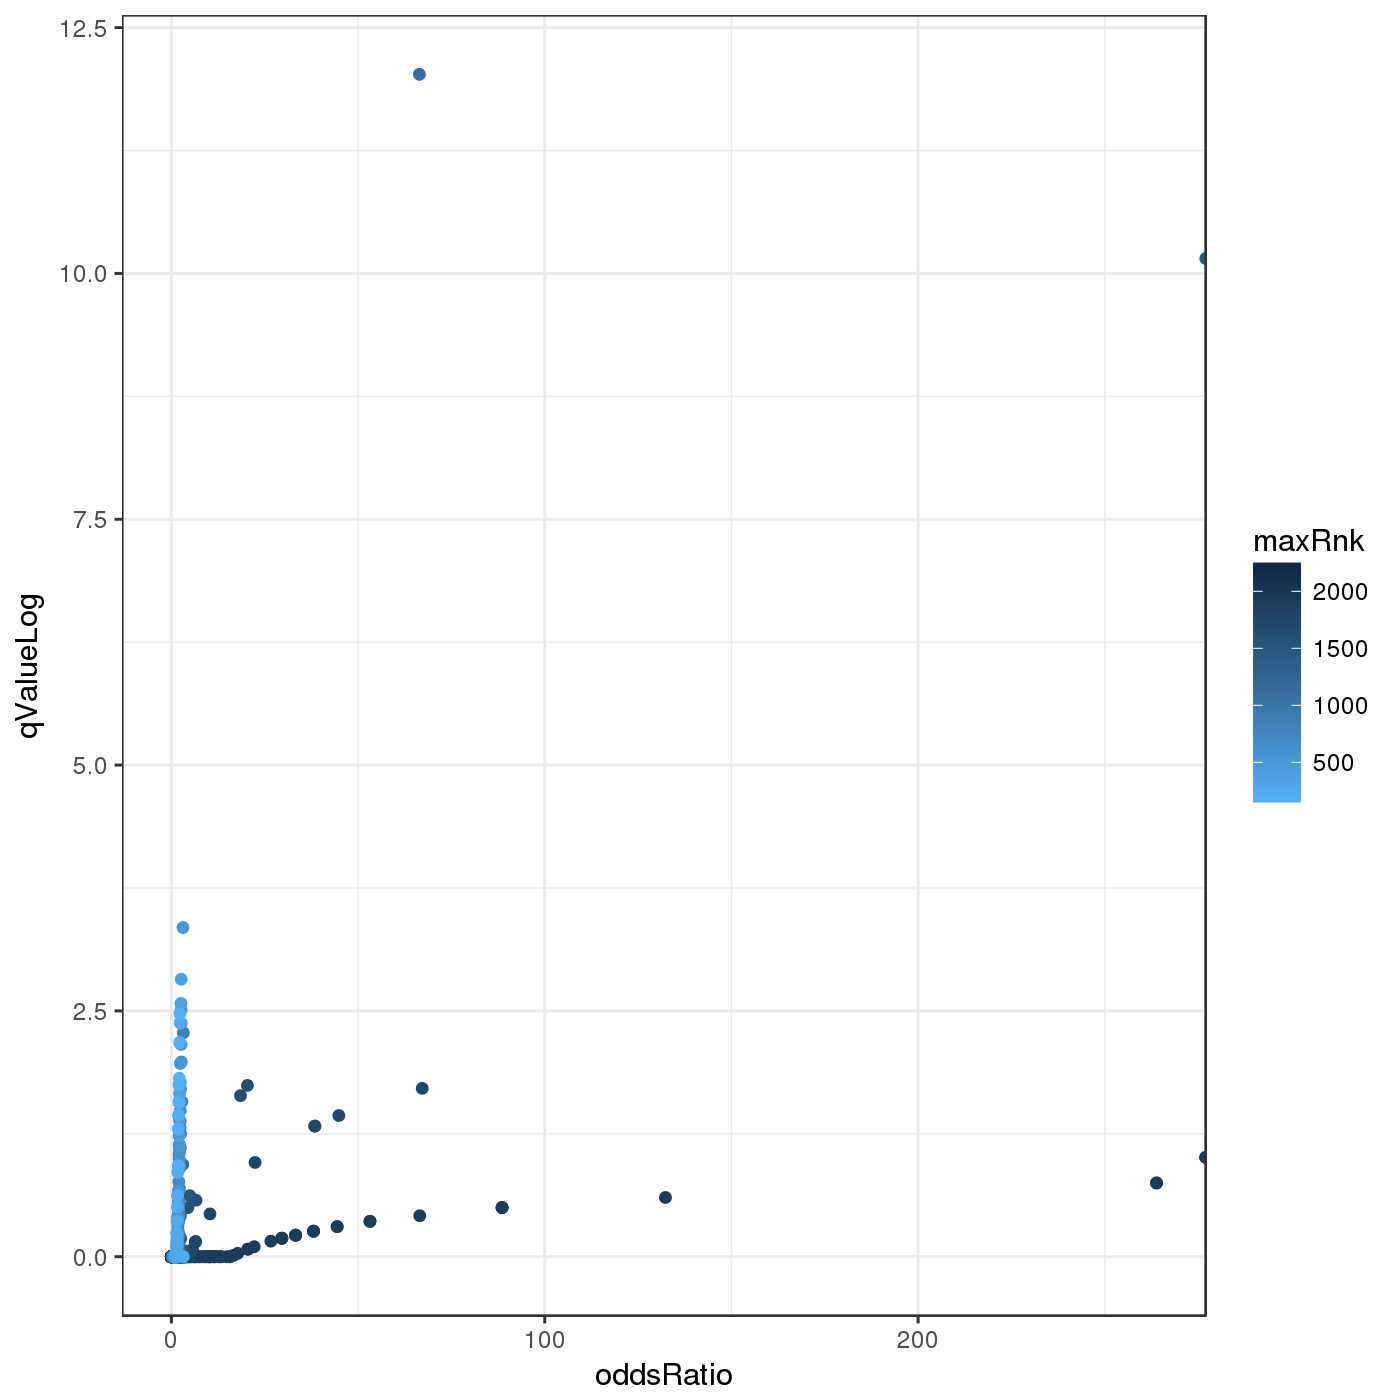
Scatter plot showing the effect size (log-odds ratio) vs. the significance (-log10(q-value)), similar to a 'volcano plot' as it is called in other contexts.
| comparison | |
| Hypermethylation/hypomethylation | |
| regions | |
| differential methylation measure |
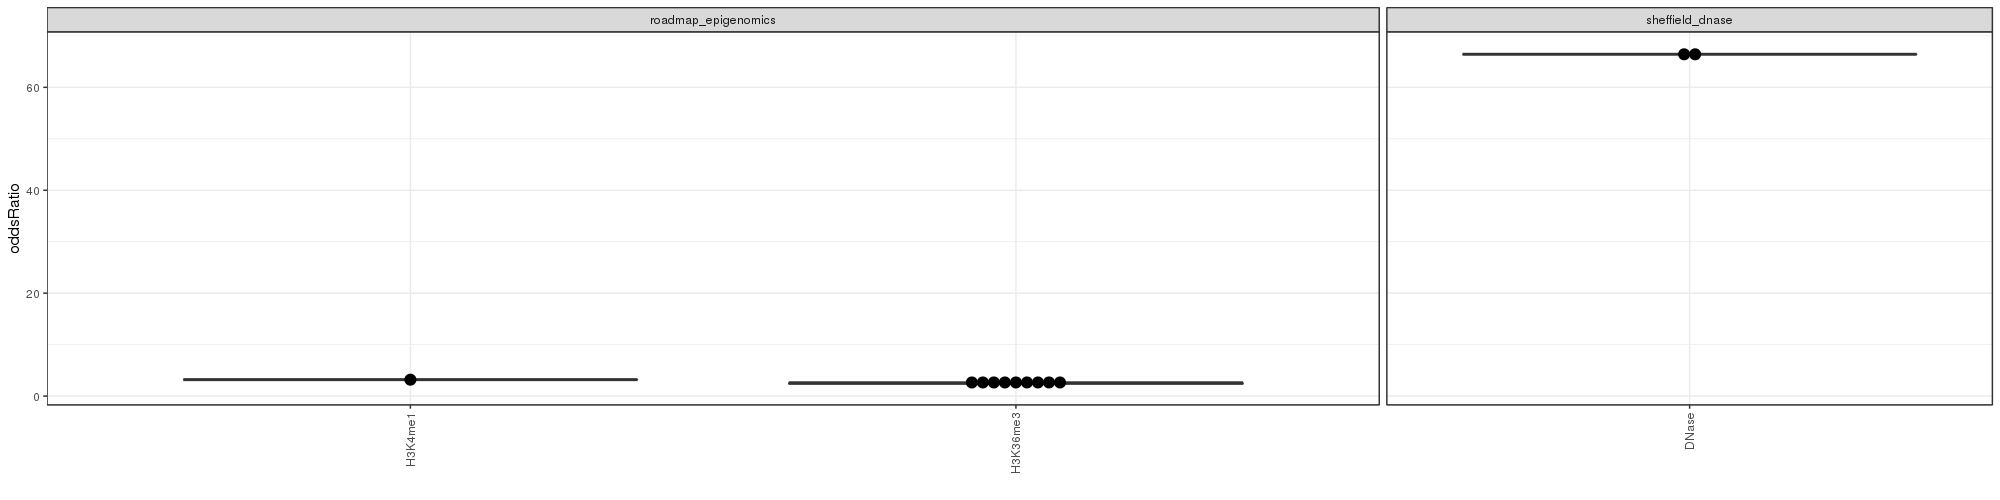
Boxplots showing log-odds ratios from LOLA enrichment analysis. Shown are those groups of terms per category that share the same putative target. Only terms that exhibit statistical significance (p-value < 0.01) are included. If more than 100 terms are enriched, the 100 terms receiving the highest joined LOLA ranks are shown. Coloring of the bars reflects the putative targets of the terms.
| comparison | |
| Hypermethylation/hypomethylation | |
| regions | |
| differential methylation measure |
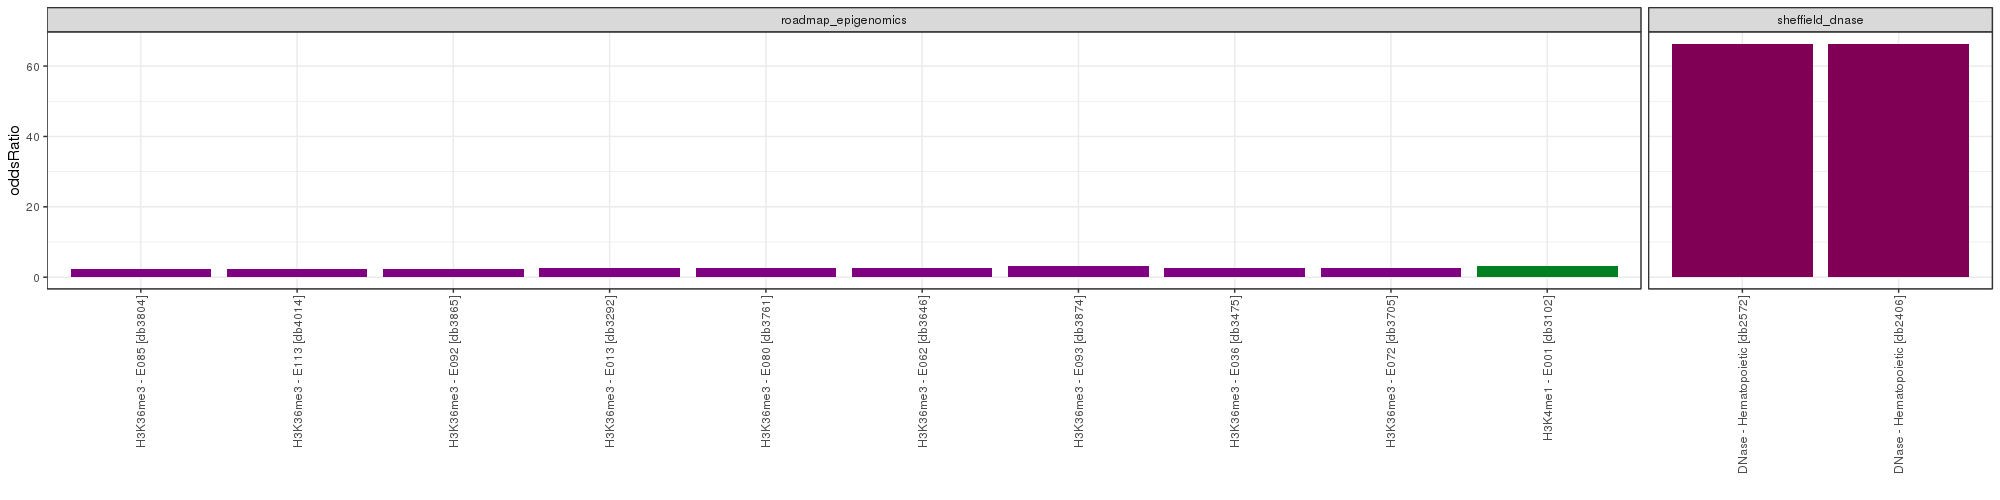
Barplots showing log-odds ratios from LOLA enrichment analysis. Shown are those terms that exhibit statistical significance (p-value < 0.01). If more than 100 terms are enriched, the 100 terms receiving the highest joined LOLA ranks are shown. Coloring of the bars reflects the putative targets of the terms.
Differential Variability
LOLA enrichment analysis was also conducted for differentially variable regions.
| comparison | |
| Hypermethylation/hypomethylation | |
| regions | |
| differential methylation measure | |
| color |
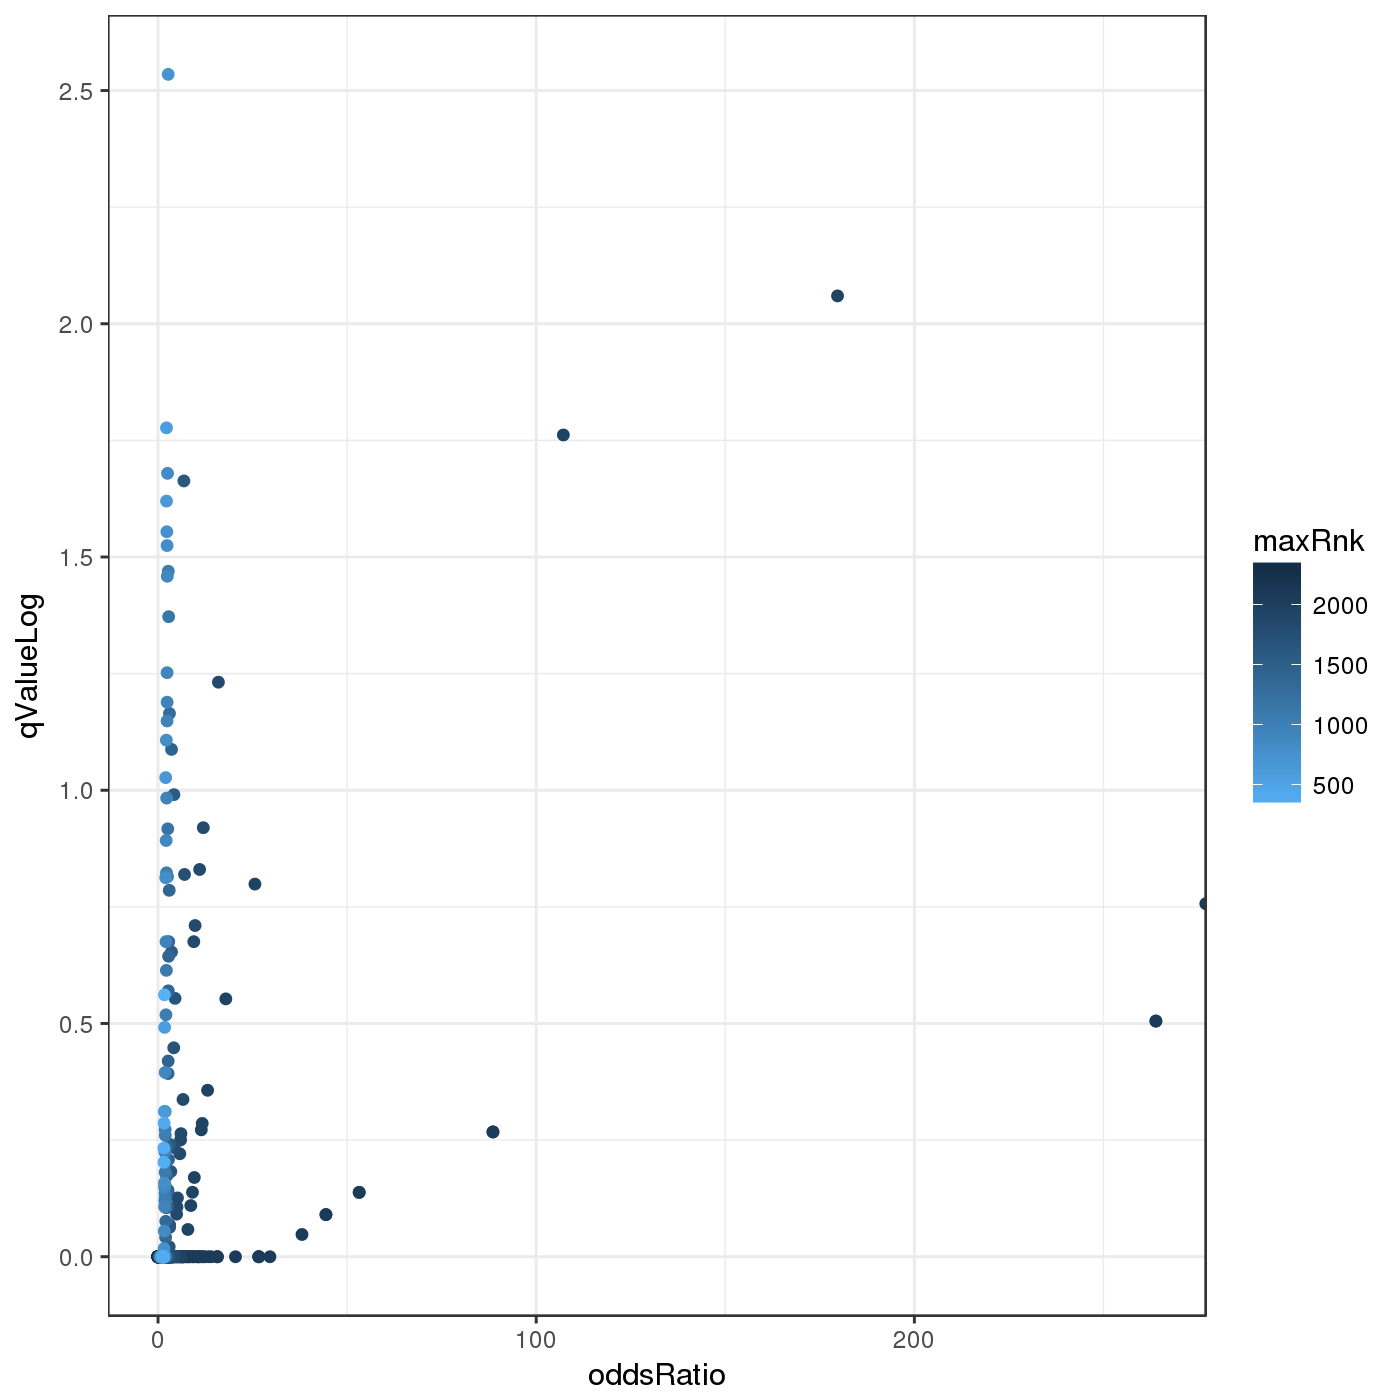
Barplots showing log-odds ratios from LOLA enrichment analysis. Shown are those terms that exhibit statistical significance (p-value < 0.01). If more than 100 terms are enriched, the 100 terms receiving the highest joined LOLA ranks are shown. Coloring of the bars reflects the putative targets of the terms.
| comparison | |
| Hypermethylation/hypomethylation | |
| regions | |
| differential methylation measure |
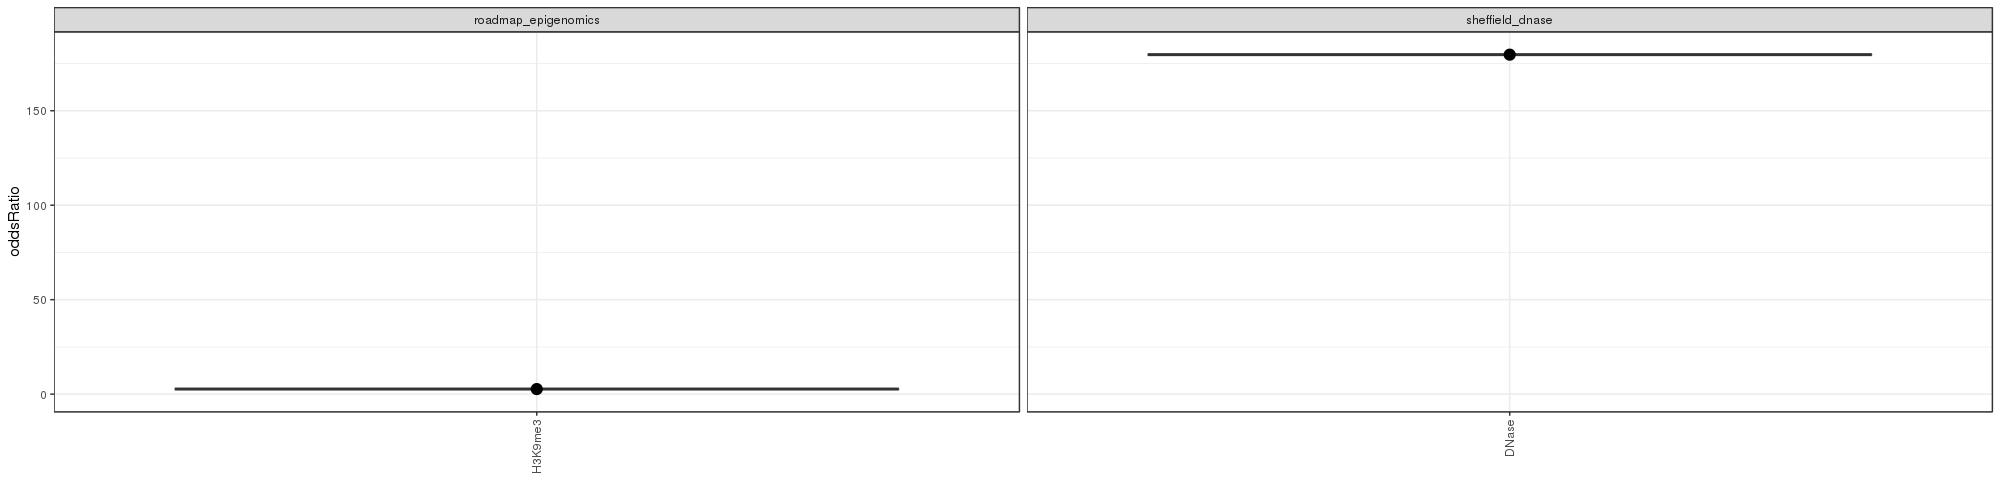
Barplots showing log-odds ratios from LOLA enrichment analysis. Shown are those terms that exhibit statistical significance (p-value < 0.01). If more than 100 terms are enriched, the 100 terms receiving the highest joined LOLA ranks are shown. Coloring of the bars reflects the putative targets of the terms.
| comparison | |
| Hypermethylation/hypomethylation | |
| regions | |
| differential methylation measure |
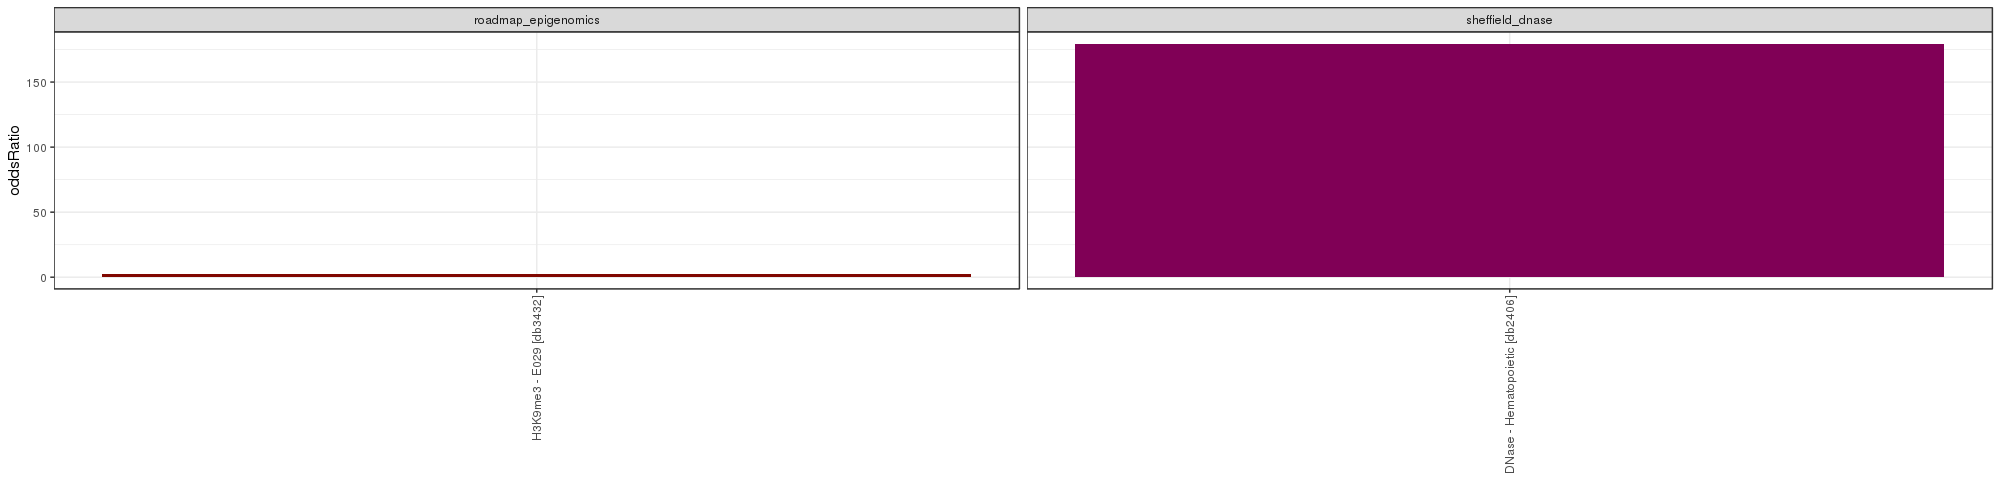
Barplots showing log-odds ratios from LOLA enrichment analysis. Shown are those terms that exhibit statistical significance (p-value < 0.01). If more than 100 terms are enriched, the 100 terms receiving the highest joined LOLA ranks are shown. Coloring of the bars reflects the putative targets of the terms.