Preprocessing
Parameter Overview
The table below lists the options of the executed module.
| Option |
Value |
| filtering.whitelist |
|
| filtering.blacklist |
|
| filtering.snp |
3 |
| filtering.greedycut |
no |
| filtering.coverage.threshold |
5 |
| filtering.greedycut.rc.ties |
row |
| imputation.method |
none |
| filtering.high.coverage.outliers |
yes |
| filtering.low.coverage.masking |
yes |
| normalization.method |
none |
| normalization.background.method |
none |
| normalization.plot.shifts |
yes |
| filtering.context.removal |
CC, CAG, CAH, CTG, CTH, Other |
| filtering.missing.value.quantile |
0.5 |
| filtering.sex.chromosomes.removal |
yes |
| filtering.deviation.threshold |
0 |
| distribution.subsample |
1000000 |
Removal of SNP-enriched Sites
39069 sites were removed because they overlap with SNPs. The list of removed sites is available in a dedicated table accompanying this report.
Removal of High Coverage Outlier Sites
564 sites were detected as high coverage outlier in at least one sample and removed at this step. An outlier site is defined as one whose coverage exceeds 50 times the 0.95-quantile of coverage values in its sample. The list of removed sites is available in a dedicated table accompanying this report.
Masking of Sites with Low Coverage
A total of 332590187 sites with coverage less than 5 were masked by NA in the methylation table The numbers of masked sites per sample are available in a dedicated table accompanying this report.
Removal of Sites on Sex Chromosomes
213329 sites on sex chromosomes were removed at this step. The list of removed sites is available in a dedicated table accompanying this report.
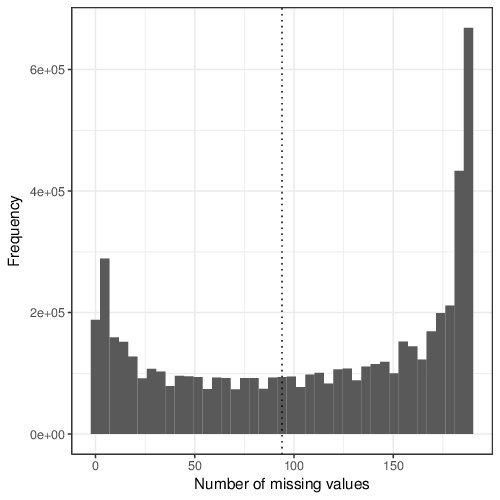
Removal of Sites with (Many) Missing Values
3187950 sites were removed because they contain more than 94 missing values in the methylation table. This threshold corresponds to 50% of all samples. The total number of missing values in the methylation table before this filtering step was 614666920. A dedicated table of all removed sites is attached to this report.
The figure below shows the distribution of missing values per site.
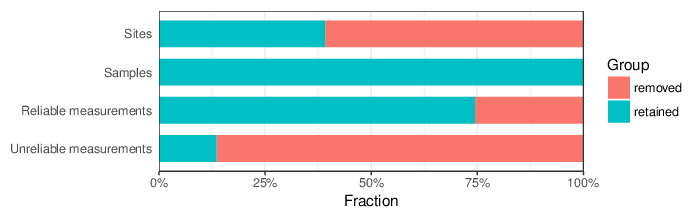
Filtering Summary
As a final outcome of the filtering procedures, 3440912 sites and 0 samples were removed (188 samples and 2217786 sites were retained). These statistics are presented in a dedicated table that accompanies this report and visualized in the figure below.
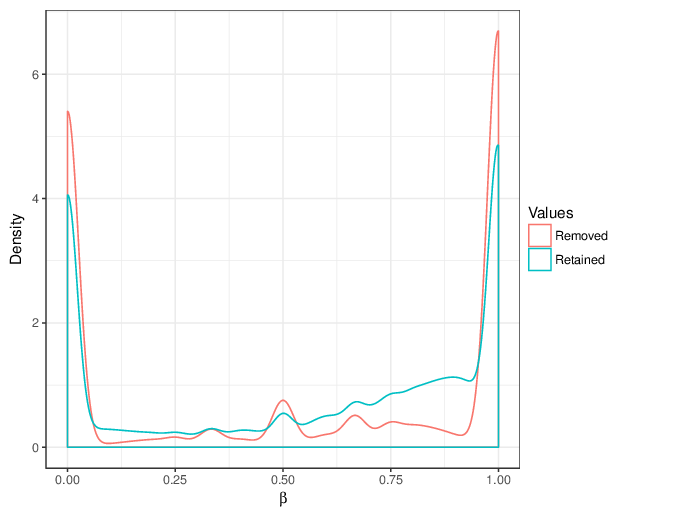
The figure below compares the distributions of the removed methylation β values and of the retained ones.
This report was generated on 2018-03-20 by
RnBeads version 1.11.8.