Differential methylation on the region level was computed based on a variety of metrics. Of particular interest for the following plots and analyses are the following quantities for each region: the mean methylation difference in a region of the two groups being and of quotient of mean methylation levelsas well as a p-value obtained from statistical testing (limma or t-test; depending on parameter settings). Additionally each region was assigned a rank based on each of these three criteria. A combined rank is computed as the maximum (i.e. worst) value among the three ranks. The smaller the combined rank for a region, the more evidence for differential methylation it exhibits. Regions were defined based on the region types specified in the analysis. This section includes scatterplots of the region group means as well as volcano plots of each pairwise comparison colored according to the combined rank of a given region.
The following rank cutfoffs have been automatically selected for the analysis of differentially methylated regions:
| tiling | cpgislands | genes | promoters | ensembleRegBuildBPall | ensembleRegBuildBPallMerged | |
| 1 vs. 5 (based on cmp_cellnum) | 0 | 0 | 0 | 0 | 0 | 0 |
| 02I vs. GNN (based on cmp_donor_02I_vs_GNN) | 0 | 0 | 0 | 0 | 0 | 0 |
| 02I vs. GPJ (based on cmp_donor_02I_vs_GPJ) | 0 | 0 | 0 | 0 | 0 | 0 |
| 02I vs. 2I_ (based on cmp_donor_02I_vs_2I_) | 0 | 0 | 0 | 0 | 0 | 0 |
| GNN vs. GPJ (based on cmp_donor_GNN_vs_GPJ) | 0 | 0 | 0 | 0 | 0 | 0 |
| 2I_ vs. GNN (based on cmp_donor_GNN_vs_2I_) | 0 | 0 | 0 | 0 | 0 | 0 |
| 2I_ vs. GPJ (based on cmp_donor_GPJ_vs_2I_) | 0 | 0 | 0 | 0 | 0 | 0 |
| 2N vs. 4N (based on cmp_ploidy_2N_vs_4N) | 0 | 0 | 0 | 0 | 0 | 0 |
| 2N vs. 8N (based on cmp_ploidy_2N_vs_8N) | 0 | 0 | 0 | 0 | 0 | 0 |
| 16N vs. 2N (based on cmp_ploidy_2N_vs_16N) | 0 | 0 | 0 | 0 | 0 | 0 |
| 2N vs. 32N (based on cmp_ploidy_2N_vs_32N) | 0 | 0 | 0 | 0 | 0 | 0 |
| 4N vs. 8N (based on cmp_ploidy_4N_vs_8N) | 0 | 0 | 0 | 0 | 0 | 0 |
| 16N vs. 8N (based on cmp_ploidy_8N_vs_16N) | 0 | 0 | 0 | 0 | 0 | 0 |
| 16N vs. 32N (based on cmp_ploidy_16N_vs_32N) | 0 | 0 | 0 | 0 | 0 | 0 |
| comparison | |
| regions | |
| differential methylation measure |

Scatterplot for differential methylation (regions). If the selected criterion is not rankGradient:
The transparency corresponds to point density. The 1% of the points in the sparsest populated plot regions are drawn explicitly.
Additionally, the colored points represent differentially methylated regions (according to the selected criterion).
If the selected criterion is rankGradient: median combined ranks accross hexagonal bins are shown
as a gradient according to the color legend.
| comparison | |
| regions | |
| difference metric | |
| significance metric |
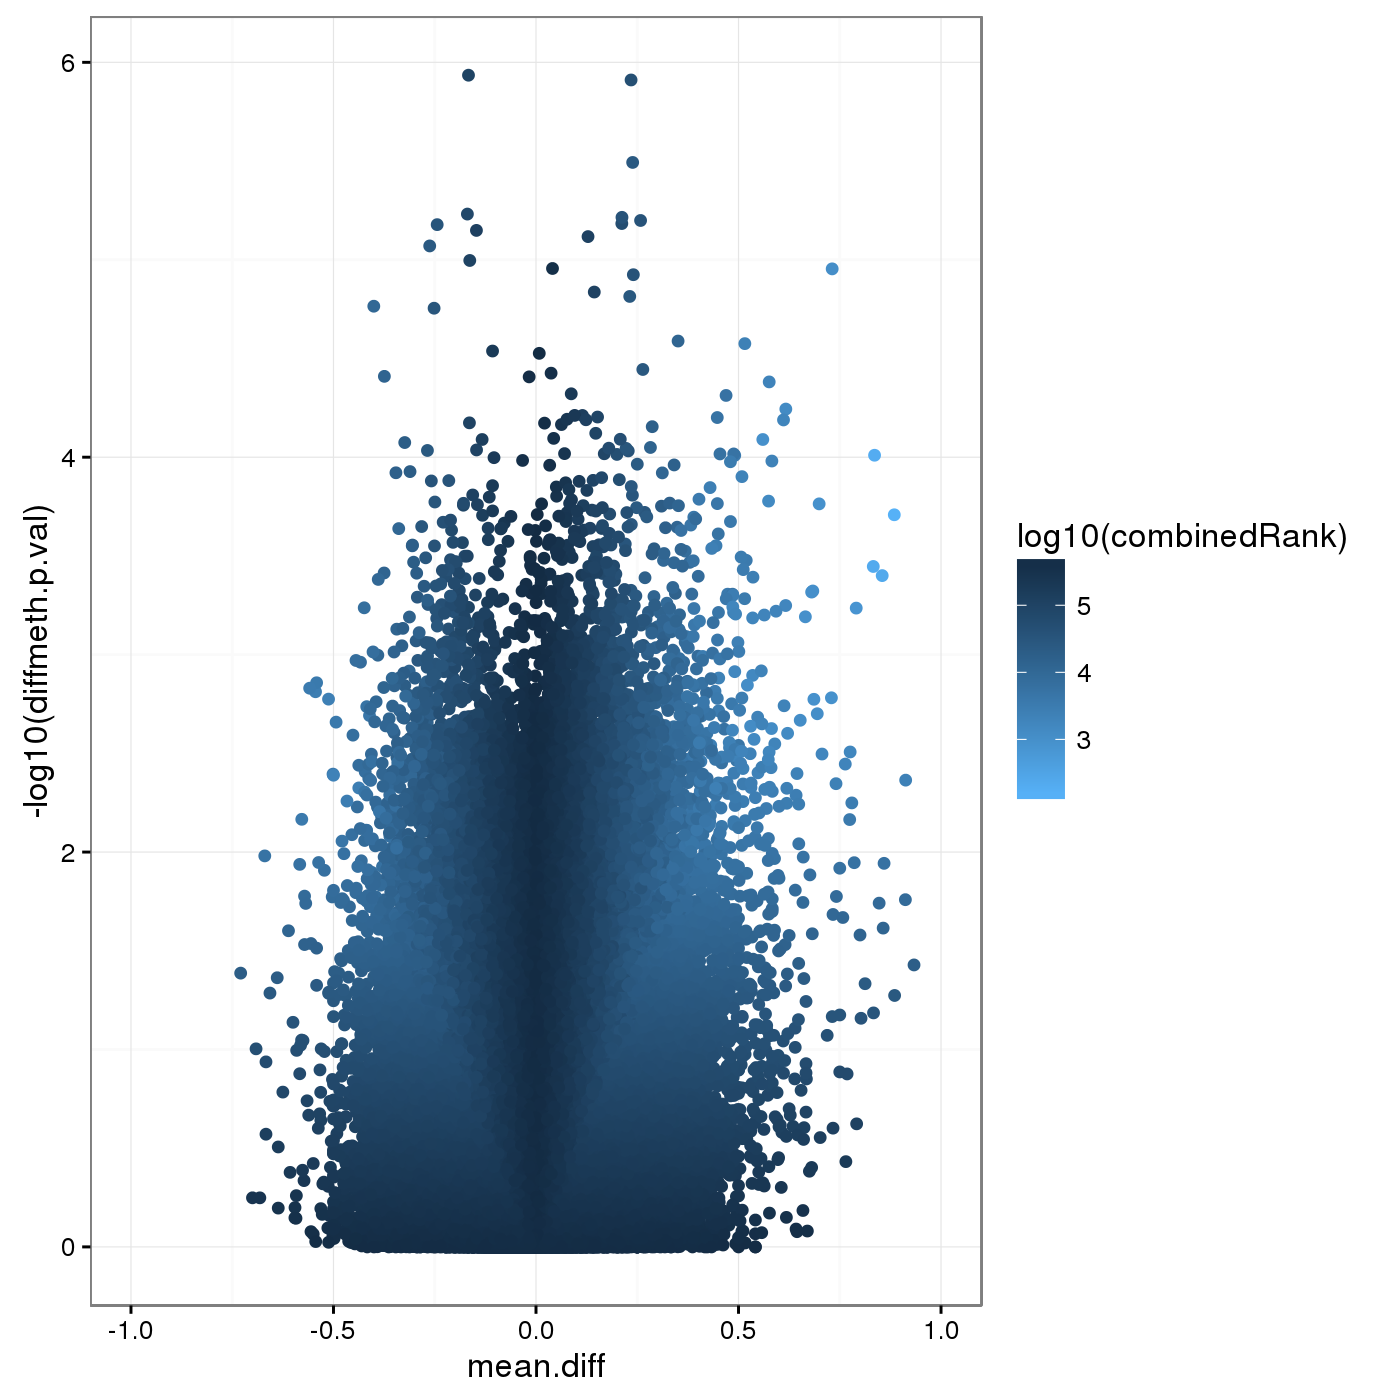
Volcano plot for differential methylation quantified by various metrics. Color scale according to combined ranking.
Differential Methylation Tables
A tabular overview of measures for differential methylation on the region level for the individual comparisons are provided in this section.
- id: region id
- Chromosome: chromosome of the region
- Start: start coordinate of the region
- End: end coordinate of the region
- mean.g1,mean.g2: (where g1 and g2 is replaced by the respective group names in the table) mean methylation in each of the two groups
- mean.diff: difference in methylation means between the two groups: mean.g1-mean.g2. In case of paired analysis, it is the mean of the pairwise differences.
- mean.quot.log2: log2 of the quotient in methylation: log2((mean.g1+epsilon)/(mean.g2+epsilon)), where epsilon:=0.01. In case of paired analysis, it is the mean of the pairwise quotients.
- diffmeth.p.val: p-value obtained from linear models employed in the limma package (or alternatively from a two-sided Welch t-test; which type of p-value is computed is specified in the differential.site.test.method option).
- max.g1,max.g2: maximum methylation level in group 1 and 2 respectively
- min.g1,min.g2: minimum methylation level in group 1 and 2 respectively
- sd.g1,sd.g2: standard deviation of methylation levels
- min.diff: Minimum of 0 and the smallest pairwise difference between samples of the two groups
- diffmeth.p.adj.fdr: FDR adjusted p-value of all sites
- combinedRank: mean.diff, mean.quot.log2 and diffmeth.p.val are ranked for all regions. This aggregates them using the maximum, i.e. worst rank of a site among the three measures
- num.na.g1,num.na.g2: number of NA methylation values for groups 1 and 2 respectively
- mean.covg.g1,mean.covg.g2: mean coverage of groups 1 and 2 respectively (In case of Infinium array methylation data, coverage is defined as combined beadcount.)
- min.covg.g1,min.covg.g2: minimum coverage of groups 1 and 2 respectively
- max.covg.g1,max.covg.g2: maximum coverage of groups 1 and 2 respectively
- covg.thresh.nsamples.g1,covg.thresh.nsamples.g2: number of samples in group 1 and 2 respectively exceeding the coverage threshold (1) for this region.
The tables for the individual comparisons can be found here:
| tiling | cpgislands | genes | promoters | ensembleRegBuildBPall | ensembleRegBuildBPallMerged | |
| 1 vs. 5 (based on cmp_cellnum) | csv | csv | csv | csv | csv | csv |
| 02I vs. GNN (based on cmp_donor_02I_vs_GNN) | csv | csv | csv | csv | csv | csv |
| 02I vs. GPJ (based on cmp_donor_02I_vs_GPJ) | csv | csv | csv | csv | csv | csv |
| 02I vs. 2I_ (based on cmp_donor_02I_vs_2I_) | csv | csv | csv | csv | csv | csv |
| GNN vs. GPJ (based on cmp_donor_GNN_vs_GPJ) | csv | csv | csv | csv | csv | csv |
| 2I_ vs. GNN (based on cmp_donor_GNN_vs_2I_) | csv | csv | csv | csv | csv | csv |
| 2I_ vs. GPJ (based on cmp_donor_GPJ_vs_2I_) | csv | csv | csv | csv | csv | csv |
| 2N vs. 4N (based on cmp_ploidy_2N_vs_4N) | csv | csv | csv | csv | csv | csv |
| 2N vs. 8N (based on cmp_ploidy_2N_vs_8N) | csv | csv | csv | csv | csv | csv |
| 16N vs. 2N (based on cmp_ploidy_2N_vs_16N) | csv | csv | csv | csv | csv | csv |
| 2N vs. 32N (based on cmp_ploidy_2N_vs_32N) | csv | csv | csv | csv | csv | csv |
| 4N vs. 8N (based on cmp_ploidy_4N_vs_8N) | csv | csv | csv | csv | csv | csv |
| 16N vs. 8N (based on cmp_ploidy_8N_vs_16N) | csv | csv | csv | csv | csv | csv |
| 16N vs. 32N (based on cmp_ploidy_16N_vs_32N) | csv | csv | csv | csv | csv | csv |
Enrichment Analysis
Enrichment Analysis was conducted. The wordclouds and tables below contains significant GO terms as determined by a hypergeometric test.
| comparison | |
| Hypermethylation/hypomethylation | |
| ontology | |
| regions | |
| differential methylation measure |
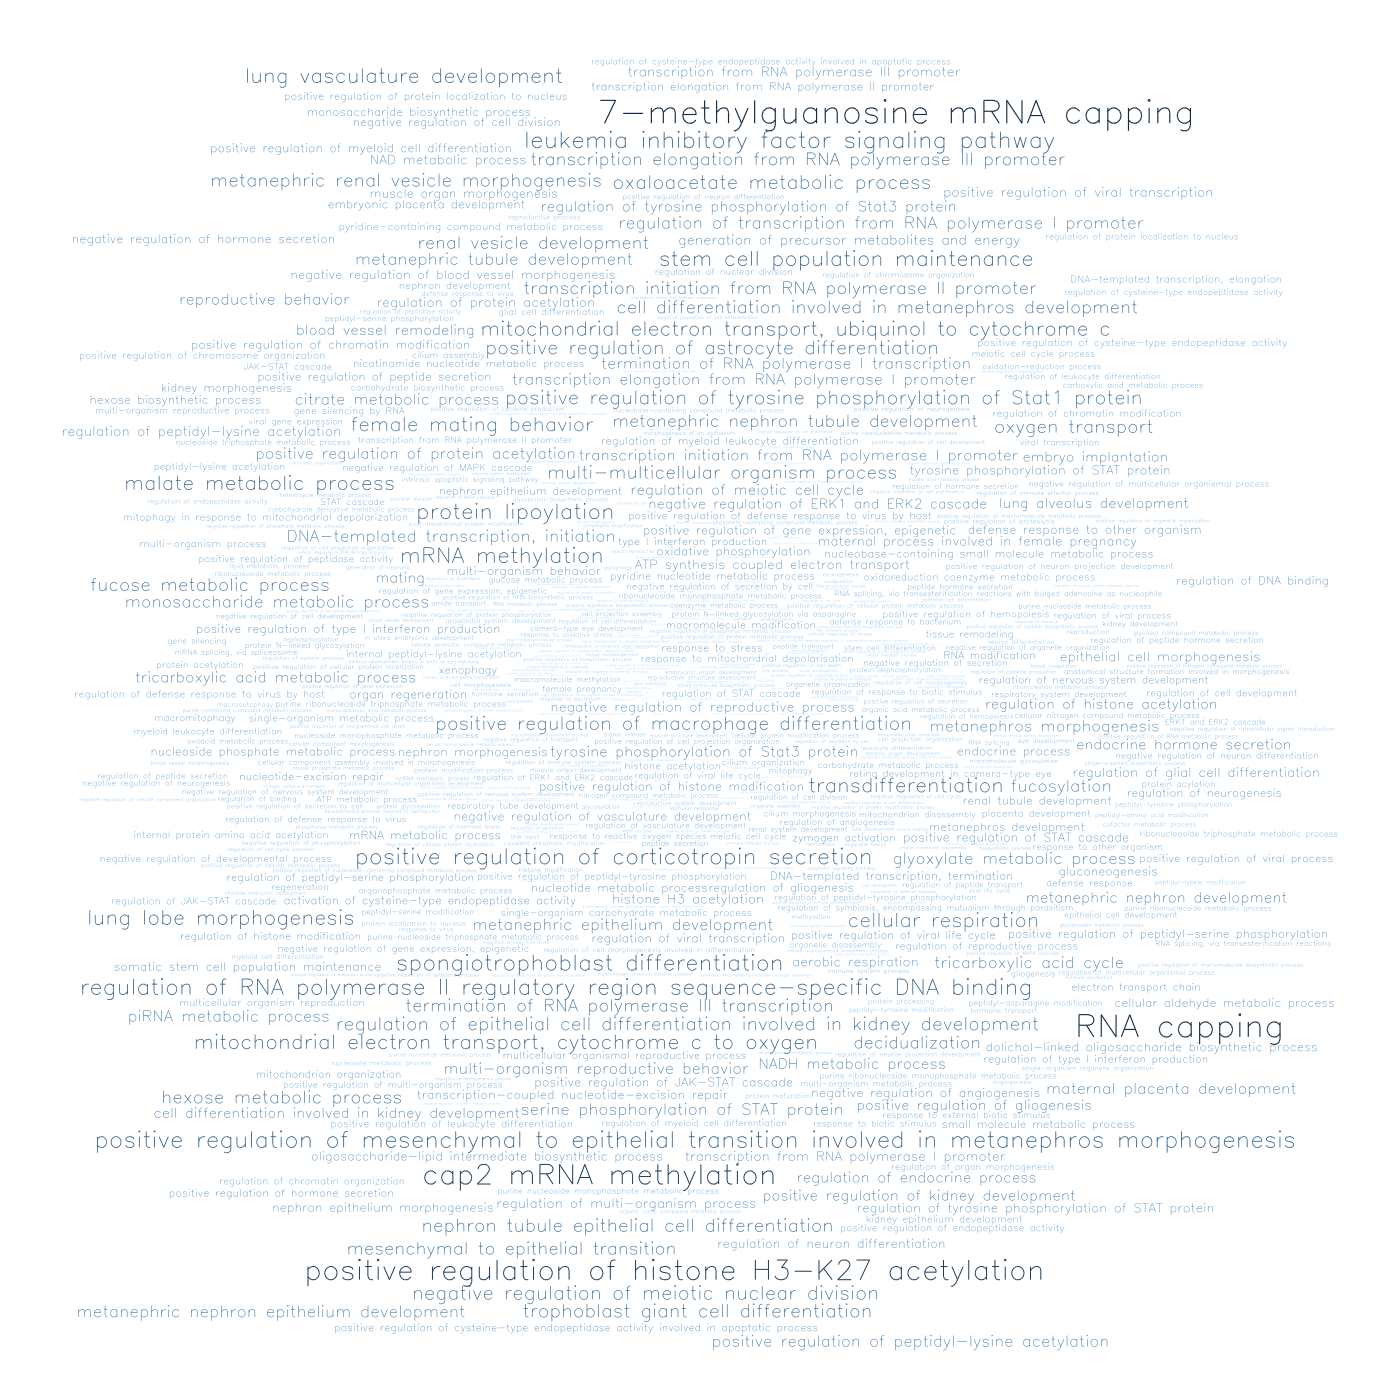
Wordclouds for GO enrichment terms.
| comparison | |
| Hypermethylation/hypomethylation | |
| ontology | |
| regions | |
| differential methylation measure |
| GOMFID | Pvalue | OddsRatio | ExpCount | Count | Size | Term |
| GO:0034660 | 1e-04 | 99.9781 | 0.1173 | 3 | 460 | ncRNA metabolic process |
| GO:0006364 | 5e-04 | 107.1862 | 0.0375 | 2 | 147 | rRNA processing |
| GO:0070940 | 0.0013 | 1306.9167 | 0.0013 | 1 | 5 | dephosphorylation of RNA polymerase II C-terminal domain |
| GO:0009301 | 0.0025 | 580.6667 | 0.0025 | 1 | 10 | snRNA transcription |
| GO:0022613 | 0.003 | 43.1887 | 0.091 | 2 | 357 | ribonucleoprotein complex biogenesis |
| GO:0000028 | 0.0041 | 348.2667 | 0.0041 | 1 | 16 | ribosomal small subunit assembly |
| GO:0000462 | 0.0064 | 217.5417 | 0.0064 | 1 | 25 | maturation of SSU-rRNA from tricistronic rRNA transcript (SSU-rRNA, 5.8S rRNA, LSU-rRNA) |
| GOMFID | Pvalue | OddsRatio | ExpCount | Count | Size | Term |
| GO:0007186 | 0.0015 | 37.8516 | 0.2944 | 3 | 1155 | G-protein coupled receptor signaling pathway |
| GO:0050911 | 0.0031 | 42.2149 | 0.093 | 2 | 365 | detection of chemical stimulus involved in sensory perception of smell |
| GO:0009593 | 0.0047 | 34.3311 | 0.1137 | 2 | 446 | detection of chemical stimulus |
| GO:0007606 | 0.0049 | 33.326 | 0.117 | 2 | 459 | sensory perception of chemical stimulus |
| GO:0050906 | 0.0049 | 33.326 | 0.117 | 2 | 459 | detection of stimulus involved in sensory perception |
| GO:0071377 | 0.0097 | 140.991 | 0.0097 | 1 | 38 | cellular response to glucagon stimulus |
| GOMFID | Pvalue | OddsRatio | ExpCount | Count | Size | Term |
| GO:0030185 | 0.001 | 1960.5 | 0.001 | 1 | 3 | nitric oxide transport |
| GO:0018298 | 0.0032 | 435.4722 | 0.0032 | 1 | 10 | protein-chromophore linkage |
| GO:0015671 | 0.0048 | 279.8571 | 0.0048 | 1 | 15 | oxygen transport |
| GO:0070293 | 0.0051 | 261.1833 | 0.0051 | 1 | 16 | renal absorption |
| GO:0042744 | 0.0073 | 178 | 0.0073 | 1 | 23 | hydrogen peroxide catabolic process |
| GO:0034109 | 0.0095 | 20.2899 | 0.1596 | 2 | 501 | homotypic cell-cell adhesion |
| NA. |
| n/a |
| NA. |
| n/a |
| GOMFID | Pvalue | OddsRatio | ExpCount | Count | Size | Term |
| GO:0016260 | 0.0011 | Inf | 0.0011 | 1 | 1 | selenocysteine biosynthetic process |
| GO:0043624 | 0.0029 | 12.2716 | 0.2947 | 3 | 272 | cellular protein complex disassembly |
| GO:0060112 | 0.0032 | 489.75 | 0.0033 | 1 | 3 | generation of ovulation cycle rhythm |
| GO:0032984 | 0.0044 | 10.5854 | 0.3402 | 3 | 314 | macromolecular complex disassembly |
| GO:0001887 | 0.0062 | 19.2173 | 0.1192 | 2 | 110 | selenium compound metabolic process |
| GO:0014050 | 0.0065 | 195.8625 | 0.0065 | 1 | 6 | negative regulation of glutamate secretion |
| GO:0009069 | 0.0074 | 17.4286 | 0.1311 | 2 | 121 | serine family amino acid metabolic process |
| GO:0032229 | 0.0076 | 163.2083 | 0.0076 | 1 | 7 | negative regulation of synaptic transmission, GABAergic |
| GO:0021891 | 0.0086 | 139.8839 | 0.0087 | 1 | 8 | olfactory bulb interneuron development |
| GOMFID | Pvalue | OddsRatio | ExpCount | Count | Size | Term |
| GO:0007525 | 0.0059 | 237.3485 | 0.0059 | 1 | 4 | somatic muscle development |
| GO:0090191 | 0.0059 | 237.3485 | 0.0059 | 1 | 4 | negative regulation of branching involved in ureteric bud morphogenesis |
| GO:0061370 | 0.0073 | 178 | 0.0073 | 1 | 5 | testosterone biosynthetic process |
| GO:0071799 | 0.0073 | 178 | 0.0073 | 1 | 5 | cellular response to prostaglandin D stimulus |
| GO:1900028 | 0.0088 | 142.3909 | 0.0088 | 1 | 6 | negative regulation of ruffle assembly |
| GOMFID | Pvalue | OddsRatio | ExpCount | Count | Size | Term |
| GO:0006612 | 0 | 16.1059 | 0.3732 | 5 | 183 | protein targeting to membrane |
| GO:0006364 | 2e-04 | 15.5005 | 0.2998 | 4 | 147 | rRNA processing |
| GO:0022613 | 7e-04 | 8.0529 | 0.7281 | 5 | 357 | ribonucleoprotein complex biogenesis |
| GO:1901566 | 0.001 | 4.2683 | 2.7001 | 9 | 1324 | organonitrogen compound biosynthetic process |
| GO:0006614 | 0.0012 | 16.2591 | 0.208 | 3 | 102 | SRP-dependent cotranslational protein targeting to membrane |
| GO:0006412 | 0.0012 | 5.7919 | 1.2359 | 6 | 606 | translation |
| GO:0014861 | 0.002 | Inf | 0.002 | 1 | 1 | regulation of skeletal muscle contraction via regulation of action potential |
| GO:0033552 | 0.002 | Inf | 0.002 | 1 | 1 | response to vitamin B3 |
| GO:0035684 | 0.002 | Inf | 0.002 | 1 | 1 | helper T cell extravasation |
| GO:0001912 | 0.0022 | 32.5562 | 0.0693 | 2 | 34 | positive regulation of leukocyte mediated cytotoxicity |
| GO:0034660 | 0.0022 | 6.188 | 0.9381 | 5 | 460 | ncRNA metabolic process |
| GO:0043604 | 0.0027 | 4.9315 | 1.4398 | 6 | 706 | amide biosynthetic process |
| GO:0006518 | 0.0036 | 4.6328 | 1.5275 | 6 | 749 | peptide metabolic process |
| GO:0002434 | 0.0041 | 505.0968 | 0.0041 | 1 | 2 | immune complex clearance |
| GO:0006542 | 0.0041 | 505.0968 | 0.0041 | 1 | 2 | glutamine biosynthetic process |
| GO:0071403 | 0.0041 | 505.0968 | 0.0041 | 1 | 2 | cellular response to high density lipoprotein particle stimulus |
| GO:0090076 | 0.0041 | 505.0968 | 0.0041 | 1 | 2 | relaxation of skeletal muscle |
| GO:0090265 | 0.0041 | 505.0968 | 0.0041 | 1 | 2 | positive regulation of immune complex clearance by monocytes and macrophages |
| GO:0042255 | 0.0043 | 22.6275 | 0.0979 | 2 | 48 | ribosome assembly |
| GO:0045085 | 0.0061 | 252.5323 | 0.0061 | 1 | 3 | negative regulation of interleukin-2 biosynthetic process |
| GO:2000502 | 0.0061 | 252.5323 | 0.0061 | 1 | 3 | negative regulation of natural killer cell chemotaxis |
| GO:0031341 | 0.0062 | 18.575 | 0.1183 | 2 | 58 | regulation of cell killing |
| GO:0044802 | 0.0072 | 3.9809 | 1.762 | 6 | 864 | single-organism membrane organization |
| GO:0045047 | 0.0074 | 185.2024 | 0.0074 | 1 | 4 | protein targeting to ER |
| GO:0045039 | 0.0081 | 168.3441 | 0.0082 | 1 | 4 | protein import into mitochondrial inner membrane |
| GO:0072594 | 0.0087 | 4.4104 | 1.297 | 5 | 636 | establishment of protein localization to organelle |
| GOMFID | Pvalue | OddsRatio | ExpCount | Count | Size | Term |
| GO:0006414 | 0 | 21.8147 | 0.2961 | 5 | 202 | translational elongation |
| GO:0072599 | 0 | 30.9076 | 0.1612 | 4 | 110 | establishment of protein localization to endoplasmic reticulum |
| GO:0006415 | 1e-04 | 19.4236 | 0.2521 | 4 | 172 | translational termination |
| GO:0043043 | 2e-04 | 8.509 | 0.9235 | 6 | 630 | peptide biosynthetic process |
| GO:0016259 | 2e-04 | 28.8648 | 0.1231 | 3 | 84 | selenocysteine metabolic process |
| GO:0006614 | 4e-04 | 23.5894 | 0.1495 | 3 | 102 | SRP-dependent cotranslational protein targeting to membrane |
| GO:0006413 | 5e-04 | 12.8789 | 0.3752 | 4 | 256 | translational initiation |
| GO:0000184 | 6e-04 | 21.023 | 0.1671 | 3 | 114 | nuclear-transcribed mRNA catabolic process, nonsense-mediated decay |
| GO:0043241 | 9e-04 | 10.7846 | 0.4456 | 4 | 304 | protein complex disassembly |
| GO:0071584 | 0.0015 | Inf | 0.0015 | 1 | 1 | negative regulation of zinc ion transmembrane import |
| GO:0071585 | 0.0015 | Inf | 0.0015 | 1 | 1 | detoxification of cadmium ion |
| GO:2000872 | 0.0015 | Inf | 0.0015 | 1 | 1 | positive regulation of progesterone secretion |
| GO:0043603 | 0.0016 | 5.7507 | 1.3368 | 6 | 912 | cellular amide metabolic process |
| GO:0010324 | 0.0018 | 36.2997 | 0.063 | 2 | 43 | membrane invagination |
| GO:0050911 | 0.0018 | 8.9267 | 0.535 | 4 | 365 | detection of chemical stimulus involved in sensory perception of smell |
| GO:0006612 | 0.0019 | 14.0554 | 0.2483 | 3 | 177 | protein targeting to membrane |
| GO:0019083 | 0.0024 | 12.6926 | 0.2726 | 3 | 186 | viral transcription |
| GO:0071580 | 0.0029 | 712.1364 | 0.0029 | 1 | 2 | regulation of zinc ion transmembrane transport |
| GO:0071582 | 0.0029 | 712.1364 | 0.0029 | 1 | 2 | negative regulation of zinc ion transport |
| GO:0097501 | 0.0029 | 712.1364 | 0.0029 | 1 | 2 | stress response to metal ion |
| GO:0006402 | 0.0031 | 11.6601 | 0.2961 | 3 | 202 | mRNA catabolic process |
| GO:0044033 | 0.0033 | 11.3706 | 0.3034 | 3 | 207 | multi-organism metabolic process |
| GO:0019058 | 0.0034 | 7.425 | 0.6391 | 4 | 436 | viral life cycle |
| GO:0009593 | 0.0037 | 7.2522 | 0.6538 | 4 | 446 | detection of chemical stimulus |
| GO:0007606 | 0.0041 | 7.039 | 0.6728 | 4 | 459 | sensory perception of chemical stimulus |
| GO:0050906 | 0.0041 | 7.039 | 0.6728 | 4 | 459 | detection of stimulus involved in sensory perception |
| GO:0006407 | 0.0044 | 356.0455 | 0.0044 | 1 | 3 | rRNA export from nucleus |
| GO:0070574 | 0.0059 | 237.3485 | 0.0059 | 1 | 4 | cadmium ion transmembrane transport |
| GO:0044802 | 0.0073 | 4.7888 | 1.2665 | 5 | 864 | single-organism membrane organization |
| GO:0006620 | 0.0088 | 142.3909 | 0.0088 | 1 | 6 | posttranslational protein targeting to membrane |
| GOMFID | Pvalue | OddsRatio | ExpCount | Count | Size | Term |
| GO:0048208 | 2e-04 | 29.3492 | 0.1183 | 3 | 58 | COPII vesicle coating |
| GO:0043241 | 3e-04 | 9.5132 | 0.62 | 5 | 304 | protein complex disassembly |
| GO:0048199 | 4e-04 | 23.3733 | 0.1468 | 3 | 72 | vesicle targeting, to, from or within Golgi |
| GO:1902591 | 6e-04 | 20.6645 | 0.1652 | 3 | 81 | single-organism membrane budding |
| GO:1903020 | 7e-04 | 61.3412 | 0.0387 | 2 | 19 | positive regulation of glycoprotein metabolic process |
| GO:0051668 | 8e-04 | 18.7326 | 0.1815 | 3 | 89 | localization within membrane |
| GO:0010509 | 0.002 | Inf | 0.002 | 1 | 1 | polyamine homeostasis |
| GO:0018153 | 0.002 | Inf | 0.002 | 1 | 1 | isopeptide cross-linking via N6-(L-isoglutamyl)-L-lysine |
| GO:2000872 | 0.002 | Inf | 0.002 | 1 | 1 | positive regulation of progesterone secretion |
| GO:0019068 | 0.0028 | 28.1477 | 0.0795 | 2 | 39 | virion assembly |
| GO:0022411 | 0.0035 | 4.6591 | 1.5193 | 6 | 745 | cellular component disassembly |
| GO:0000964 | 0.0041 | 505.0968 | 0.0041 | 1 | 2 | mitochondrial RNA 5'-end processing |
| GO:0042418 | 0.0041 | 505.0968 | 0.0041 | 1 | 2 | epinephrine biosynthetic process |
| GO:0006888 | 0.0043 | 10.0846 | 0.3304 | 3 | 162 | ER to Golgi vesicle-mediated transport |
| GO:0006415 | 0.0044 | 9.9985 | 0.3339 | 3 | 169 | translational termination |
| GO:0001510 | 0.0045 | 22.1447 | 0.0999 | 2 | 49 | RNA methylation |
| GO:0031424 | 0.0045 | 22.1447 | 0.0999 | 2 | 49 | keratinization |
| GO:0018149 | 0.0056 | 19.6302 | 0.1122 | 2 | 55 | peptide cross-linking |
| GO:0009913 | 0.006 | 8.896 | 0.3732 | 3 | 183 | epidermal cell differentiation |
| GO:0006452 | 0.0061 | 252.5323 | 0.0061 | 1 | 3 | translational frameshifting |
| GO:0045905 | 0.0061 | 252.5323 | 0.0061 | 1 | 3 | positive regulation of translational termination |
| GO:0060061 | 0.0061 | 252.5323 | 0.0061 | 1 | 3 | Spemann organizer formation |
| GO:0060715 | 0.0061 | 252.5323 | 0.0061 | 1 | 3 | syncytiotrophoblast cell differentiation involved in labyrinthine layer development |
| GO:1901382 | 0.0061 | 252.5323 | 0.0061 | 1 | 3 | regulation of chorionic trophoblast cell proliferation |
| GO:0006414 | 0.0069 | 8.4951 | 0.3913 | 3 | 198 | translational elongation |
| GO:0043933 | 0.0074 | 2.8159 | 5.0312 | 11 | 2467 | macromolecular complex subunit organization |
| GO:0000045 | 0.008 | 16.2448 | 0.1346 | 2 | 66 | autophagosome assembly |
| GO:0008612 | 0.0081 | 168.3441 | 0.0082 | 1 | 4 | peptidyl-lysine modification to peptidyl-hypusine |
| GO:0045901 | 0.0081 | 168.3441 | 0.0082 | 1 | 4 | positive regulation of translational elongation |
| GO:0090646 | 0.0081 | 168.3441 | 0.0082 | 1 | 4 | mitochondrial tRNA processing |
| GO:1903251 | 0.0081 | 168.3441 | 0.0082 | 1 | 4 | multi-ciliated epithelial cell differentiation |
| GO:0043043 | 0.0084 | 4.4545 | 1.2848 | 5 | 630 | peptide biosynthetic process |
| GO:0051650 | 0.0089 | 7.6845 | 0.4303 | 3 | 211 | establishment of vesicle localization |
| GOMFID | Pvalue | OddsRatio | ExpCount | Count | Size | Term |
| GO:0072594 | 5e-04 | 15.8745 | 0.4053 | 4 | 636 | establishment of protein localization to organelle |
| GO:0006605 | 6e-04 | 15.0773 | 0.4257 | 4 | 668 | protein targeting |
| GO:0043105 | 6e-04 | Inf | 6e-04 | 1 | 1 | negative regulation of GTP cyclohydrolase I activity |
| GO:0097214 | 6e-04 | Inf | 6e-04 | 1 | 1 | positive regulation of lysosomal membrane permeability |
| GO:2000376 | 6e-04 | Inf | 6e-04 | 1 | 1 | positive regulation of oxygen metabolic process |
| GO:0051341 | 0.0012 | 47.5579 | 0.0535 | 2 | 84 | regulation of oxidoreductase activity |
| GO:0055073 | 0.0013 | 1742.2222 | 0.0013 | 1 | 2 | cadmium ion homeostasis |
| GO:0097212 | 0.0013 | 1742.2222 | 0.0013 | 1 | 2 | lysosomal membrane organization |
| GO:2000296 | 0.0013 | 1742.2222 | 0.0013 | 1 | 2 | negative regulation of hydrogen peroxide catabolic process |
| GO:0000056 | 0.0025 | 580.6667 | 0.0025 | 1 | 4 | ribosomal small subunit export from nucleus |
| GO:0036091 | 0.0025 | 580.6667 | 0.0025 | 1 | 4 | positive regulation of transcription from RNA polymerase II promoter in response to oxidative stress |
| GO:0006914 | 0.0032 | 13.1481 | 0.3174 | 3 | 498 | autophagy |
| GO:0010940 | 0.0038 | 348.3556 | 0.0038 | 1 | 6 | positive regulation of necrotic cell death |
| GO:0045040 | 0.0038 | 348.3556 | 0.0038 | 1 | 6 | protein import into mitochondrial outer membrane |
| GO:0000423 | 0.004 | 25.885 | 0.0969 | 2 | 152 | macromitophagy |
| GO:0033753 | 0.0051 | 248.7937 | 0.0051 | 1 | 8 | establishment of ribosome localization |
| GO:0033210 | 0.0057 | 217.6806 | 0.0057 | 1 | 9 | leptin-mediated signaling pathway |
| GO:0006707 | 0.007 | 174.1222 | 0.007 | 1 | 11 | cholesterol catabolic process |
| GO:0071428 | 0.007 | 174.1222 | 0.007 | 1 | 11 | rRNA-containing ribonucleoprotein complex export from nucleus |
| GO:0061726 | 0.0074 | 18.6884 | 0.1332 | 2 | 209 | mitochondrion disassembly |
| GO:0010310 | 0.0089 | 133.9145 | 0.0089 | 1 | 14 | regulation of hydrogen peroxide metabolic process |
| GO:0030150 | 0.0089 | 133.9145 | 0.0089 | 1 | 14 | protein import into mitochondrial matrix |
| GO:0060049 | 0.0089 | 133.9145 | 0.0089 | 1 | 14 | regulation of protein glycosylation |
| GO:0060547 | 0.0089 | 133.9145 | 0.0089 | 1 | 14 | negative regulation of necrotic cell death |
| GO:0072593 | 0.0091 | 16.7208 | 0.1485 | 2 | 233 | reactive oxygen species metabolic process |
| GO:0007005 | 0.0092 | 8.9054 | 0.4608 | 3 | 723 | mitochondrion organization |
| GO:0071276 | 0.0095 | 124.3413 | 0.0096 | 1 | 15 | cellular response to cadmium ion |
| GO:0022411 | 0.01 | 8.6286 | 0.4748 | 3 | 745 | cellular component disassembly |
| GO:0034613 | 0.01 | 6.5034 | 0.9317 | 4 | 1462 | cellular protein localization |
| GOMFID | Pvalue | OddsRatio | ExpCount | Count | Size | Term |
| GO:0036031 | 6e-04 | Inf | 6e-04 | 1 | 1 | recruitment of mRNA capping enzyme to RNA polymerase II holoenzyme complex |
| GO:0016558 | 0.0083 | 145.0833 | 0.0083 | 1 | 13 | protein import into peroxisome matrix |
| GOMFID | Pvalue | OddsRatio | ExpCount | Count | Size | Term |
| GO:0050911 | 4e-04 | 31.7445 | 0.1628 | 3 | 365 | detection of chemical stimulus involved in sensory perception of smell |
| GO:0009593 | 7e-04 | 25.803 | 0.199 | 3 | 446 | detection of chemical stimulus |
| GO:0007606 | 8e-04 | 25.0461 | 0.2048 | 3 | 459 | sensory perception of chemical stimulus |
| GO:0050906 | 8e-04 | 25.0461 | 0.2048 | 3 | 459 | detection of stimulus involved in sensory perception |
| GO:0007186 | 9e-04 | 16.8352 | 0.5153 | 4 | 1155 | G-protein coupled receptor signaling pathway |
| GO:0050877 | 0.001 | 16.021 | 0.5394 | 4 | 1209 | neurological system process |
| GO:0018298 | 0.0045 | 290.2778 | 0.0045 | 1 | 10 | protein-chromophore linkage |
| GOMFID | Pvalue | OddsRatio | ExpCount | Count | Size | Term |
| GO:1900005 | 0.001 | 1960.5 | 0.001 | 1 | 3 | positive regulation of serine-type endopeptidase activity |
| GO:0019236 | 0.0022 | 653.3333 | 0.0022 | 1 | 7 | response to pheromone |
| GO:0007186 | 0.0036 | 18.9245 | 0.368 | 3 | 1155 | G-protein coupled receptor signaling pathway |
| GO:1902571 | 0.0041 | 326.5417 | 0.0041 | 1 | 13 | regulation of serine-type peptidase activity |
| GO:0050911 | 0.0052 | 28.1414 | 0.1163 | 2 | 365 | detection of chemical stimulus involved in sensory perception of smell |
| GO:0009593 | 0.0076 | 22.8859 | 0.1421 | 2 | 446 | detection of chemical stimulus |
| GO:0007606 | 0.0081 | 22.2159 | 0.1463 | 2 | 459 | sensory perception of chemical stimulus |
| GO:0050906 | 0.0081 | 22.2159 | 0.1463 | 2 | 459 | detection of stimulus involved in sensory perception |
| GOMFID | Pvalue | OddsRatio | ExpCount | Count | Size | Term |
| GO:0070942 | 0 | 329.7895 | 0.0094 | 2 | 7 | neutrophil mediated cytotoxicity |
| GO:0051873 | 1e-04 | 235.5338 | 0.012 | 2 | 9 | killing by host of symbiont cells |
| GO:0051818 | 2e-04 | 137.3509 | 0.0187 | 2 | 14 | disruption of cells of other organism involved in symbiotic interaction |
| GO:0019439 | 2e-04 | 11.1021 | 0.5808 | 5 | 434 | aromatic compound catabolic process |
| GO:1901361 | 3e-04 | 10.3561 | 0.621 | 5 | 464 | organic cyclic compound catabolic process |
| GO:0043114 | 7e-04 | 58.8045 | 0.0402 | 2 | 30 | regulation of vascular permeability |
| GO:0031640 | 8e-04 | 54.8772 | 0.0428 | 2 | 32 | killing of cells of other organism |
| GO:0050832 | 0.0013 | 43.3019 | 0.0535 | 2 | 40 | defense response to fungus |
| GO:0032644 | 0.0013 | Inf | 0.0013 | 1 | 1 | regulation of fractalkine production |
| GO:0042404 | 0.0013 | Inf | 0.0013 | 1 | 1 | thyroid hormone catabolic process |
| GO:0050725 | 0.0013 | Inf | 0.0013 | 1 | 1 | positive regulation of interleukin-1 beta biosynthetic process |
| GO:0050754 | 0.0013 | Inf | 0.0013 | 1 | 1 | positive regulation of fractalkine biosynthetic process |
| GO:0050756 | 0.0013 | Inf | 0.0013 | 1 | 1 | fractalkine metabolic process |
| GO:0030595 | 0.0016 | 14.8429 | 0.2369 | 3 | 177 | leukocyte chemotaxis |
| GO:0033762 | 0.0018 | 36.5497 | 0.0629 | 2 | 47 | response to glucagon |
| GO:0051851 | 0.002 | 34.2588 | 0.0669 | 2 | 50 | modification by host of symbiont morphology or physiology |
| GO:0006518 | 0.0026 | 6.2693 | 1.0024 | 5 | 749 | peptide metabolic process |
| GO:0033030 | 0.0027 | 783.45 | 0.0027 | 1 | 2 | negative regulation of neutrophil apoptotic process |
| GO:0038112 | 0.0027 | 783.45 | 0.0027 | 1 | 2 | interleukin-8-mediated signaling pathway |
| GO:0045360 | 0.0027 | 783.45 | 0.0027 | 1 | 2 | regulation of interleukin-1 biosynthetic process |
| GO:0070488 | 0.0027 | 783.45 | 0.0027 | 1 | 2 | neutrophil aggregation |
| GO:0070946 | 0.0027 | 783.45 | 0.0027 | 1 | 2 | neutrophil mediated killing of gram-positive bacterium |
| GO:0098758 | 0.0027 | 783.45 | 0.0027 | 1 | 2 | response to interleukin-8 |
| GO:0006401 | 0.0034 | 11.288 | 0.3092 | 3 | 231 | RNA catabolic process |
| GO:0032602 | 0.0038 | 24.5137 | 0.0923 | 2 | 69 | chemokine production |
| GO:0002444 | 0.0043 | 22.8041 | 0.099 | 2 | 74 | myeloid leukocyte mediated immunity |
| GO:0070944 | 0.0051 | 274.8421 | 0.0051 | 1 | 4 | neutrophil mediated killing of bacterium |
| GO:0030593 | 0.0058 | 19.5313 | 0.1151 | 2 | 86 | neutrophil chemotaxis |
| GO:0032103 | 0.0062 | 9.0618 | 0.3828 | 3 | 286 | positive regulation of response to external stimulus |
| GO:1901566 | 0.0064 | 4.3557 | 1.772 | 6 | 1324 | organonitrogen compound biosynthetic process |
| GO:0006412 | 0.0078 | 5.8894 | 0.811 | 4 | 606 | translation |
| GO:0016485 | 0.0079 | 8.2853 | 0.4176 | 3 | 312 | protein processing |
| GO:0006729 | 0.0093 | 130.5333 | 0.0094 | 1 | 7 | tetrahydrobiopterin biosynthetic process |
| GO:0097530 | 0.0094 | 15.1676 | 0.1472 | 2 | 110 | granulocyte migration |
| GOMFID | Pvalue | OddsRatio | ExpCount | Count | Size | Term |
| GO:0030422 | 1e-04 | 205.8816 | 0.0153 | 2 | 6 | production of siRNA involved in RNA interference |
| GO:0008088 | 1e-04 | 35.1689 | 0.0994 | 3 | 39 | axo-dendritic transport |
| GO:0044267 | 4e-04 | 3.0705 | 12.2618 | 23 | 4810 | cellular protein metabolic process |
| GO:0031054 | 6e-04 | 68.5921 | 0.0357 | 2 | 14 | pre-miRNA processing |
| GO:0048490 | 7e-04 | 58.7857 | 0.0408 | 2 | 16 | anterograde synaptic vesicle transport |
| GO:0099514 | 7e-04 | 58.7857 | 0.0408 | 2 | 16 | synaptic vesicle cytoskeletal transport |
| GO:0032438 | 0.0013 | 43.3019 | 0.0535 | 2 | 21 | melanosome organization |
| GO:0031050 | 0.0018 | 35.762 | 0.0637 | 2 | 25 | dsRNA fragmentation |
| GO:0019391 | 0.0025 | Inf | 0.0025 | 1 | 1 | glucuronoside catabolic process |
| GO:0033577 | 0.0025 | Inf | 0.0025 | 1 | 1 | protein glycosylation in endoplasmic reticulum |
| GO:0048006 | 0.0025 | Inf | 0.0025 | 1 | 1 | antigen processing and presentation, endogenous lipid antigen via MHC class Ib |
| GO:0047496 | 0.0034 | 25.6891 | 0.0867 | 2 | 34 | vesicle transport along microtubule |
| GO:0006413 | 0.004 | 6.7897 | 0.6526 | 4 | 256 | translational initiation |
| GO:0000461 | 0.0051 | 401.2821 | 0.0051 | 1 | 2 | endonucleolytic cleavage to generate mature 3'-end of SSU-rRNA from (SSU-rRNA, 5.8S rRNA, LSU-rRNA) |
| GO:0030328 | 0.0051 | 401.2821 | 0.0051 | 1 | 2 | prenylcysteine catabolic process |
| GO:0033686 | 0.0051 | 401.2821 | 0.0051 | 1 | 2 | positive regulation of luteinizing hormone secretion |
| GO:1902824 | 0.0051 | 401.2821 | 0.0051 | 1 | 2 | positive regulation of late endosome to lysosome transport |
| GO:0035195 | 0.0054 | 20.0385 | 0.1096 | 2 | 43 | gene silencing by miRNA |
| GO:0033059 | 0.0061 | 18.6687 | 0.1173 | 2 | 46 | cellular pigmentation |
| GO:0016441 | 0.0064 | 18.2526 | 0.1198 | 2 | 47 | posttranscriptional gene silencing |
| GO:0006626 | 0.0068 | 8.4357 | 0.3875 | 3 | 152 | protein targeting to mitochondrion |
| GO:0006513 | 0.0072 | 17.1086 | 0.1275 | 2 | 50 | protein monoubiquitination |
| GO:0006203 | 0.0076 | 200.6282 | 0.0076 | 1 | 3 | dGTP catabolic process |
| GO:0030327 | 0.0076 | 200.6282 | 0.0076 | 1 | 3 | prenylated protein catabolic process |
| GO:0060112 | 0.0076 | 200.6282 | 0.0076 | 1 | 3 | generation of ovulation cycle rhythm |
| GO:0006417 | 0.0082 | 5.4805 | 0.803 | 4 | 315 | regulation of translation |
| GO:0045055 | 0.0086 | 7.7042 | 0.4232 | 3 | 166 | regulated exocytosis |
| GO:0090502 | 0.0093 | 14.9244 | 0.1453 | 2 | 57 | RNA phosphodiester bond hydrolysis, endonucleolytic |
| GOMFID | Pvalue | OddsRatio | ExpCount | Count | Size | Term |
| GO:0042255 | 6e-04 | 67.9696 | 0.0367 | 2 | 48 | ribosome assembly |
| GO:0003421 | 8e-04 | Inf | 8e-04 | 1 | 1 | growth plate cartilage axis specification |
| GO:0060735 | 8e-04 | Inf | 8e-04 | 1 | 1 | regulation of eIF2 alpha phosphorylation by dsRNA |
| GO:0072303 | 8e-04 | Inf | 8e-04 | 1 | 1 | positive regulation of glomerular metanephric mesangial cell proliferation |
| GO:1903403 | 8e-04 | Inf | 8e-04 | 1 | 1 | negative regulation of renal phosphate excretion |
| GO:0006413 | 8e-04 | 20.3241 | 0.1958 | 3 | 256 | translational initiation |
| GO:0071506 | 0.0015 | 1425.2727 | 0.0015 | 1 | 2 | cellular response to mycophenolic acid |
| GO:1902626 | 0.0015 | 1425.2727 | 0.0015 | 1 | 2 | assembly of large subunit precursor of preribosome |
| GO:0070252 | 0.002 | 35.8437 | 0.0681 | 2 | 89 | actin-mediated cell contraction |
| GO:0007517 | 0.0021 | 14.8155 | 0.2661 | 3 | 348 | muscle organ development |
| GO:0060537 | 0.0021 | 14.8155 | 0.2661 | 3 | 348 | muscle tissue development |
| GO:0060112 | 0.0023 | 712.5909 | 0.0023 | 1 | 3 | generation of ovulation cycle rhythm |
| GO:0060699 | 0.0023 | 712.5909 | 0.0023 | 1 | 3 | regulation of endoribonuclease activity |
| GO:0003206 | 0.0028 | 30.2447 | 0.0803 | 2 | 105 | cardiac chamber morphogenesis |
| GO:0003231 | 0.0031 | 28.5688 | 0.0849 | 2 | 111 | cardiac ventricle development |
| GO:0043271 | 0.0037 | 26.1513 | 0.0925 | 2 | 121 | negative regulation of ion transport |
| GO:0071504 | 0.0038 | 356.25 | 0.0038 | 1 | 5 | cellular response to heparin |
| GO:0072223 | 0.0038 | 356.25 | 0.0038 | 1 | 5 | metanephric glomerular mesangium development |
| GO:0072298 | 0.0038 | 356.25 | 0.0038 | 1 | 5 | regulation of metanephric glomerulus development |
| GO:0044070 | 0.0039 | 25.2943 | 0.0956 | 2 | 125 | regulation of anion transport |
| GO:0071456 | 0.0044 | 23.9215 | 0.1009 | 2 | 132 | cellular response to hypoxia |
| GO:0014050 | 0.0046 | 284.9818 | 0.0046 | 1 | 6 | negative regulation of glutamate secretion |
| GO:0035265 | 0.0047 | 23.0281 | 0.1048 | 2 | 137 | organ growth |
| GO:0071453 | 0.0053 | 21.7287 | 0.1109 | 2 | 145 | cellular response to oxygen levels |
| GO:0032071 | 0.0053 | 237.4697 | 0.0054 | 1 | 7 | regulation of endodeoxyribonuclease activity |
| GO:0032229 | 0.0053 | 237.4697 | 0.0054 | 1 | 7 | negative regulation of synaptic transmission, GABAergic |
| GO:1901724 | 0.0053 | 237.4697 | 0.0054 | 1 | 7 | positive regulation of cell proliferation involved in kidney development |
| GO:0044387 | 0.0061 | 203.5325 | 0.0061 | 1 | 8 | negative regulation of protein kinase activity by regulation of protein phosphorylation |
| GO:0072124 | 0.0061 | 203.5325 | 0.0061 | 1 | 8 | regulation of glomerular mesangial cell proliferation |
| GO:0007519 | 0.0063 | 19.7732 | 0.1216 | 2 | 159 | skeletal muscle tissue development |
| GO:0072203 | 0.0069 | 178.0795 | 0.0069 | 1 | 9 | cell proliferation involved in metanephros development |
| GO:0090193 | 0.0069 | 178.0795 | 0.0069 | 1 | 9 | positive regulation of glomerulus development |
| GO:0006415 | 0.0073 | 18.2459 | 0.1315 | 2 | 172 | translational termination |
| GO:0010826 | 0.0076 | 158.2828 | 0.0076 | 1 | 10 | negative regulation of centrosome duplication |
| GO:0021554 | 0.0076 | 158.2828 | 0.0076 | 1 | 10 | optic nerve development |
| GO:0048242 | 0.0076 | 158.2828 | 0.0076 | 1 | 10 | epinephrine secretion |
| GO:0001886 | 0.0084 | 142.4455 | 0.0084 | 1 | 11 | endothelial cell morphogenesis |
| GO:0042415 | 0.0084 | 142.4455 | 0.0084 | 1 | 11 | norepinephrine metabolic process |
| GO:0060394 | 0.0084 | 142.4455 | 0.0084 | 1 | 11 | negative regulation of pathway-restricted SMAD protein phosphorylation |
| GO:0003214 | 0.0091 | 129.4876 | 0.0092 | 1 | 12 | cardiac left ventricle morphogenesis |
| GO:0060536 | 0.0091 | 129.4876 | 0.0092 | 1 | 12 | cartilage morphogenesis |
| GO:0071826 | 0.0096 | 15.799 | 0.1514 | 2 | 198 | ribonucleoprotein complex subunit organization |
| GO:0046599 | 0.0099 | 118.6894 | 0.0099 | 1 | 13 | regulation of centriole replication |
| GO:0072216 | 0.0099 | 118.6894 | 0.0099 | 1 | 13 | positive regulation of metanephros development |
| GO:0006414 | 0.01 | 15.479 | 0.1545 | 2 | 202 | translational elongation |
| GOMFID | Pvalue | OddsRatio | ExpCount | Count | Size | Term |
| GO:0008420 | 0.0019 | 786.5 | 0.0019 | 1 | 6 | CTD phosphatase activity |
| GO:0030515 | 0.0079 | 163.6562 | 0.0079 | 1 | 25 | snoRNA binding |
| GOMFID | Pvalue | OddsRatio | ExpCount | Count | Size | Term |
| GO:0004871 | 0.001 | Inf | 0.2994 | 3 | 1571 | signal transducer activity |
| GO:0004984 | 0.0016 | 84.7052 | 0.0696 | 2 | 365 | olfactory receptor activity |
| GO:0031702 | 0.0019 | 873.7778 | 0.0019 | 1 | 10 | type 1 angiotensin receptor binding |
| GO:0004930 | 0.007 | 38.6641 | 0.1479 | 2 | 776 | G-protein coupled receptor activity |
| GOMFID | Pvalue | OddsRatio | ExpCount | Count | Size | Term |
| GO:0031720 | 0.0013 | 1310.9167 | 0.0013 | 1 | 3 | haptoglobin binding |
| GO:0030492 | 0.0022 | 655.375 | 0.0022 | 1 | 5 | hemoglobin binding |
| GO:0032395 | 0.0044 | 291.1852 | 0.0044 | 1 | 10 | MHC class II receptor activity |
| GO:0009881 | 0.0049 | 262.05 | 0.0049 | 1 | 11 | photoreceptor activity |
| GO:0005344 | 0.0062 | 201.5385 | 0.0062 | 1 | 14 | oxygen transporter activity |
| NA. |
| n/a |
| NA. |
| n/a |
| GOMFID | Pvalue | OddsRatio | ExpCount | Count | Size | Term |
| GO:0004756 | 0.002 | 1048.2 | 0.002 | 1 | 2 | selenide, water dikinase activity |
| GO:0008853 | 0.003 | 524.0667 | 0.003 | 1 | 3 | exodeoxyribonuclease III activity |
| GO:0001601 | 0.0041 | 349.3556 | 0.0041 | 1 | 4 | peptide YY receptor activity |
| GO:0001602 | 0.0041 | 349.3556 | 0.0041 | 1 | 4 | pancreatic polypeptide receptor activity |
| GO:0032405 | 0.0051 | 262 | 0.0051 | 1 | 5 | MutLalpha complex binding |
| GO:0032407 | 0.0051 | 262 | 0.0051 | 1 | 5 | MutSalpha complex binding |
| GO:0008296 | 0.0061 | 209.5867 | 0.0061 | 1 | 6 | 3'-5'-exodeoxyribonuclease activity |
| GOMFID | Pvalue | OddsRatio | ExpCount | Count | Size | Term |
| GO:0033862 | 0.0021 | Inf | 0.0021 | 1 | 1 | UMP kinase activity |
| GO:0036317 | 0.0021 | Inf | 0.0021 | 1 | 1 | tyrosyl-RNA phosphodiesterase activity |
| GO:0050124 | 0.0021 | Inf | 0.0021 | 1 | 1 | N-acylneuraminate-9-phosphatase activity |
| GO:0070260 | 0.0021 | Inf | 0.0021 | 1 | 1 | 5'-tyrosyl-DNA phosphodiesterase activity |
| GO:0004798 | 0.0042 | 490.8125 | 0.0042 | 1 | 2 | thymidylate kinase activity |
| GO:0008781 | 0.0042 | 490.8125 | 0.0042 | 1 | 2 | N-acylneuraminate cytidylyltransferase activity |
| GO:0034513 | 0.0063 | 245.3906 | 0.0063 | 1 | 3 | box H/ACA snoRNA binding |
| GO:0001601 | 0.0084 | 163.5833 | 0.0084 | 1 | 4 | peptide YY receptor activity |
| GO:0001602 | 0.0084 | 163.5833 | 0.0084 | 1 | 4 | pancreatic polypeptide receptor activity |
| GO:0004127 | 0.0084 | 163.5833 | 0.0084 | 1 | 4 | cytidylate kinase activity |
| GOMFID | Pvalue | OddsRatio | ExpCount | Count | Size | Term |
| GO:0008353 | 9e-04 | 54.6446 | 0.0437 | 2 | 16 | RNA polymerase II carboxy-terminal domain kinase activity |
| GO:0033862 | 0.0027 | Inf | 0.0027 | 1 | 1 | UMP kinase activity |
| GO:0047220 | 0.0027 | Inf | 0.0027 | 1 | 1 | galactosylxylosylprotein 3-beta-galactosyltransferase activity |
| GO:0097655 | 0.0027 | Inf | 0.0027 | 1 | 1 | serpin family protein binding |
| GO:0030544 | 0.0028 | 28.3107 | 0.0792 | 2 | 29 | Hsp70 protein binding |
| GO:0004693 | 0.003 | 27.2979 | 0.082 | 2 | 30 | cyclin-dependent protein serine/threonine kinase activity |
| GO:0008378 | 0.0036 | 24.6515 | 0.0902 | 2 | 33 | galactosyltransferase activity |
| GO:0004321 | 0.0055 | 373.7143 | 0.0055 | 1 | 2 | fatty-acyl-CoA synthase activity |
| GO:0004649 | 0.0055 | 373.7143 | 0.0055 | 1 | 2 | poly(ADP-ribose) glycohydrolase activity |
| GO:0004798 | 0.0055 | 373.7143 | 0.0055 | 1 | 2 | thymidylate kinase activity |
| GO:0008413 | 0.0055 | 373.7143 | 0.0055 | 1 | 2 | 8-oxo-7,8-dihydroguanosine triphosphate pyrophosphatase activity |
| GO:0035539 | 0.0055 | 373.7143 | 0.0055 | 1 | 2 | 8-oxo-7,8-dihydrodeoxyguanosine triphosphate pyrophosphatase activity |
| GO:0004461 | 0.0082 | 186.8452 | 0.0082 | 1 | 3 | lactose synthase activity |
| GOMFID | Pvalue | OddsRatio | ExpCount | Count | Size | Term |
| GO:0001785 | 0.003 | 683.2609 | 0.003 | 1 | 2 | prostaglandin J receptor activity |
| GO:0004956 | 0.003 | 683.2609 | 0.003 | 1 | 2 | prostaglandin D receptor activity |
| GO:0008124 | 0.003 | 683.2609 | 0.003 | 1 | 2 | 4-alpha-hydroxytetrahydrobiopterin dehydratase activity |
| GO:0071567 | 0.003 | 683.2609 | 0.003 | 1 | 2 | UFM1 hydrolase activity |
| GO:0004505 | 0.0046 | 341.6087 | 0.0046 | 1 | 3 | phenylalanine 4-monooxygenase activity |
| GO:0004873 | 0.0046 | 341.6087 | 0.0046 | 1 | 3 | asialoglycoprotein receptor activity |
| GO:1990050 | 0.0076 | 170.7826 | 0.0076 | 1 | 5 | phosphatidic acid transporter activity |
| GO:0047035 | 0.0091 | 136.6174 | 0.0091 | 1 | 6 | testosterone dehydrogenase (NAD+) activity |
| GOMFID | Pvalue | OddsRatio | ExpCount | Count | Size | Term |
| GO:0031996 | 8e-04 | 55.8859 | 0.0438 | 2 | 13 | thioesterase binding |
| GO:0000215 | 0.0034 | Inf | 0.0034 | 1 | 1 | tRNA 2'-phosphotransferase activity |
| GO:0033862 | 0.0034 | Inf | 0.0034 | 1 | 1 | UMP kinase activity |
| GO:0036317 | 0.0034 | Inf | 0.0034 | 1 | 1 | tyrosyl-RNA phosphodiesterase activity |
| GO:0070260 | 0.0034 | Inf | 0.0034 | 1 | 1 | 5'-tyrosyl-DNA phosphodiesterase activity |
| GO:0097655 | 0.0034 | Inf | 0.0034 | 1 | 1 | serpin family protein binding |
| GO:0003735 | 0.0042 | 6.6229 | 0.6566 | 4 | 195 | structural constituent of ribosome |
| GO:0004583 | 0.0067 | 301.6538 | 0.0067 | 1 | 2 | dolichyl-phosphate-glucose-glycolipid alpha-glucosyltransferase activity |
| GO:0004798 | 0.0067 | 301.6538 | 0.0067 | 1 | 2 | thymidylate kinase activity |
| GOMFID | Pvalue | OddsRatio | ExpCount | Count | Size | Term |
| GO:0042586 | 0.0022 | Inf | 0.0022 | 1 | 1 | peptide deformylase activity |
| GO:0045503 | 0.0022 | Inf | 0.0022 | 1 | 1 | dynein light chain binding |
| GO:0047220 | 0.0022 | Inf | 0.0022 | 1 | 1 | galactosylxylosylprotein 3-beta-galactosyltransferase activity |
| GO:0070042 | 0.0022 | Inf | 0.0022 | 1 | 1 | rRNA (uridine-N3-)-methyltransferase activity |
| GO:0004356 | 0.0044 | 461.8824 | 0.0044 | 1 | 2 | glutamate-ammonia ligase activity |
| GO:0016880 | 0.0044 | 461.8824 | 0.0044 | 1 | 2 | acid-ammonia (or amide) ligase activity |
| GO:0033883 | 0.0044 | 461.8824 | 0.0044 | 1 | 2 | pyridoxal phosphatase activity |
| GO:0004351 | 0.0067 | 230.9265 | 0.0067 | 1 | 3 | glutamate decarboxylase activity |
| GO:0030942 | 0.0067 | 230.9265 | 0.0067 | 1 | 3 | endoplasmic reticulum signal peptide binding |
| GO:0004966 | 0.0089 | 153.9412 | 0.0089 | 1 | 4 | galanin receptor activity |
| GO:0008097 | 0.0089 | 153.9412 | 0.0089 | 1 | 4 | 5S rRNA binding |
| GO:0031727 | 0.0089 | 153.9412 | 0.0089 | 1 | 4 | CCR2 chemokine receptor binding |
| GO:0003735 | 0.0092 | 7.5747 | 0.4336 | 3 | 195 | structural constituent of ribosome |
| GOMFID | Pvalue | OddsRatio | ExpCount | Count | Size | Term |
| GO:0003735 | 1e-04 | 18.0652 | 0.2726 | 4 | 195 | structural constituent of ribosome |
| GO:0005549 | 2e-04 | 30.8645 | 0.116 | 3 | 83 | odorant binding |
| GO:0047220 | 0.0014 | Inf | 0.0014 | 1 | 1 | galactosylxylosylprotein 3-beta-galactosyltransferase activity |
| GO:0004984 | 0.0015 | 9.4534 | 0.5102 | 4 | 365 | olfactory receptor activity |
| GO:0019843 | 0.0021 | 33.3426 | 0.0685 | 2 | 49 | rRNA binding |
| GO:0008499 | 0.0097 | 124.6984 | 0.0098 | 1 | 7 | UDP-galactose:beta-N-acetylglucosamine beta-1,3-galactosyltransferase activity |
| GOMFID | Pvalue | OddsRatio | ExpCount | Count | Size | Term |
| GO:0019843 | 1e-04 | 34.0457 | 0.1027 | 3 | 49 | rRNA binding |
| GO:0003735 | 7e-04 | 11.2049 | 0.4088 | 4 | 195 | structural constituent of ribosome |
| GO:0004603 | 0.0021 | Inf | 0.0021 | 1 | 1 | phenylethanolamine N-methyltransferase activity |
| GO:0070037 | 0.0021 | Inf | 0.0021 | 1 | 1 | rRNA (pseudouridine) methyltransferase activity |
| GO:0008173 | 0.0035 | 25.2694 | 0.0881 | 2 | 42 | RNA methyltransferase activity |
| GO:0009019 | 0.0042 | 490.8125 | 0.0042 | 1 | 2 | tRNA (guanine-N1-)-methyltransferase activity |
| GO:0016429 | 0.0063 | 245.3906 | 0.0063 | 1 | 3 | tRNA (adenine-N1-)-methyltransferase activity |
| GO:0016741 | 0.0098 | 7.4153 | 0.4445 | 3 | 212 | transferase activity, transferring one-carbon groups |
| GOMFID | Pvalue | OddsRatio | ExpCount | Count | Size | Term |
| GO:0044549 | 6e-04 | Inf | 6e-04 | 1 | 1 | GTP cyclohydrolase binding |
| GO:0046870 | 0.0032 | 436.8333 | 0.0032 | 1 | 5 | cadmium ion binding |
| GO:0015266 | 0.007 | 174.6667 | 0.007 | 1 | 11 | protein channel activity |
| GOMFID | Pvalue | OddsRatio | ExpCount | Count | Size | Term |
| GO:0005087 | 0.0032 | 436.8333 | 0.0032 | 1 | 5 | Ran guanyl-nucleotide exchange factor activity |
| GOMFID | Pvalue | OddsRatio | ExpCount | Count | Size | Term |
| GO:0052856 | 6e-04 | Inf | 6e-04 | 1 | 1 | NADHX epimerase activity |
| GO:0052857 | 6e-04 | Inf | 6e-04 | 1 | 1 | NADPHX epimerase activity |
| GO:0008379 | 0.0019 | 873.7778 | 0.0019 | 1 | 3 | thioredoxin peroxidase activity |
| GO:0016175 | 0.0051 | 249.5714 | 0.0051 | 1 | 8 | superoxide-generating NADPH oxidase activity |
| GOMFID | Pvalue | OddsRatio | ExpCount | Count | Size | Term |
| GO:0042292 | 0.0016 | Inf | 0.0016 | 1 | 1 | URM1 activating enzyme activity |
| GO:0052856 | 0.0016 | Inf | 0.0016 | 1 | 1 | NADHX epimerase activity |
| GO:0052857 | 0.0016 | Inf | 0.0016 | 1 | 1 | NADPHX epimerase activity |
| GO:0061604 | 0.0016 | Inf | 0.0016 | 1 | 1 | molybdopterin-synthase sulfurtransferase activity |
| GO:0061605 | 0.0016 | Inf | 0.0016 | 1 | 1 | molybdopterin-synthase adenylyltransferase activity |
| GO:0004756 | 0.0032 | 654.75 | 0.0032 | 1 | 2 | selenide, water dikinase activity |
| GO:0070733 | 0.0032 | 654.75 | 0.0032 | 1 | 2 | protein adenylyltransferase activity |
| GO:0004792 | 0.0048 | 327.3542 | 0.0048 | 1 | 3 | thiosulfate sulfurtransferase activity |
| GO:0008853 | 0.0048 | 327.3542 | 0.0048 | 1 | 3 | exodeoxyribonuclease III activity |
| GO:0051430 | 0.0063 | 218.2222 | 0.0064 | 1 | 4 | corticotropin-releasing hormone receptor 1 binding |
| GO:0051431 | 0.0063 | 218.2222 | 0.0064 | 1 | 4 | corticotropin-releasing hormone receptor 2 binding |
| GO:0031072 | 0.0078 | 16.5779 | 0.1334 | 2 | 84 | heat shock protein binding |
| GO:0032405 | 0.0079 | 163.6562 | 0.0079 | 1 | 5 | MutLalpha complex binding |
| GO:0032407 | 0.0079 | 163.6562 | 0.0079 | 1 | 5 | MutSalpha complex binding |
| GO:0008296 | 0.0095 | 130.9167 | 0.0095 | 1 | 6 | 3'-5'-exodeoxyribonuclease activity |
| GO:0051082 | 0.0097 | 14.7665 | 0.1493 | 2 | 94 | unfolded protein binding |
| GOMFID | Pvalue | OddsRatio | ExpCount | Count | Size | Term |
| GO:0042605 | 1e-04 | 238.0303 | 0.0122 | 2 | 24 | peptide antigen binding |
| GO:0008420 | 0.003 | 449.3429 | 0.003 | 1 | 6 | CTD phosphatase activity |
| GO:0032395 | 0.0051 | 249.5714 | 0.0051 | 1 | 10 | MHC class II receptor activity |
| GO:0051787 | 0.0061 | 204.1688 | 0.0061 | 1 | 12 | misfolded protein binding |
| GO:0033218 | 0.0069 | 20.3939 | 0.1296 | 2 | 255 | amide binding |
| GO:0023026 | 0.0081 | 149.6857 | 0.0081 | 1 | 16 | MHC class II protein complex binding |
| GOMFID | Pvalue | OddsRatio | ExpCount | Count | Size | Term |
| GO:0004930 | 0 | 77.5285 | 0.2465 | 4 | 776 | G-protein coupled receptor activity |
| GO:0004984 | 1e-04 | 63.7003 | 0.1159 | 3 | 365 | olfactory receptor activity |
| GO:0099600 | 2e-04 | 48.1458 | 0.3847 | 4 | 1211 | transmembrane receptor activity |
| GO:0060089 | 4e-04 | 38.0722 | 0.4765 | 4 | 1500 | molecular transducer activity |
| GO:0038023 | 0.0019 | 34.74 | 0.3186 | 3 | 1253 | signaling receptor activity |
| GO:0009881 | 0.0035 | 393.125 | 0.0035 | 1 | 11 | photoreceptor activity |
| GOMFID | Pvalue | OddsRatio | ExpCount | Count | Size | Term |
| GO:0016503 | 8e-04 | 2622.3333 | 8e-04 | 1 | 3 | pheromone receptor activity |
| GO:0099600 | 0.0017 | 36.0795 | 0.3078 | 3 | 1211 | transmembrane receptor activity |
| GO:0038023 | 0.0019 | 34.437 | 0.3212 | 3 | 1264 | signaling receptor activity |
| GO:0004984 | 0.0031 | 42.3499 | 0.0928 | 2 | 365 | olfactory receptor activity |
| GO:0060089 | 0.0032 | 28.5351 | 0.3812 | 3 | 1500 | molecular transducer activity |
| GO:0004930 | 0.007 | 38.8145 | 0.1474 | 2 | 773 | G-protein coupled receptor activity |
| GOMFID | Pvalue | OddsRatio | ExpCount | Count | Size | Term |
| GO:0005102 | 0.0015 | 4.0054 | 2.8605 | 9 | 1407 | receptor binding |
| GO:0017024 | 0.002 | Inf | 0.002 | 1 | 1 | myosin I binding |
| GO:0016504 | 0.0024 | 30.7333 | 0.0732 | 2 | 36 | peptidase activator activity |
| GO:0032090 | 0.0041 | 506.6774 | 0.0041 | 1 | 2 | Pyrin domain binding |
| GO:0070653 | 0.0061 | 253.3226 | 0.0061 | 1 | 3 | high-density lipoprotein particle receptor binding |
| GO:0034191 | 0.0081 | 168.871 | 0.0081 | 1 | 4 | apolipoprotein A-I receptor binding |
| GOMFID | Pvalue | OddsRatio | ExpCount | Count | Size | Term |
| GO:0052856 | 9e-04 | Inf | 9e-04 | 1 | 1 | NADHX epimerase activity |
| GO:0052857 | 9e-04 | Inf | 9e-04 | 1 | 1 | NADPHX epimerase activity |
| GOMFID | Pvalue | OddsRatio | ExpCount | Count | Size | Term |
| GO:0001601 | 0.003 | 476.5152 | 0.003 | 1 | 4 | peptide YY receptor activity |
| GO:0001602 | 0.003 | 476.5152 | 0.003 | 1 | 4 | pancreatic polypeptide receptor activity |
| GO:0043023 | 0.0053 | 238.2121 | 0.0053 | 1 | 7 | ribosomal large subunit binding |
| GO:0030957 | 0.0061 | 204.1688 | 0.0061 | 1 | 8 | Tat protein binding |
| GO:0034713 | 0.0068 | 178.6364 | 0.0069 | 1 | 9 | type I transforming growth factor beta receptor binding |
| GO:0043024 | 0.0068 | 178.6364 | 0.0069 | 1 | 9 | ribosomal small subunit binding |
| GO:0003735 | 0.0093 | 16.0984 | 0.1487 | 2 | 195 | structural constituent of ribosome |
| GO:0030898 | 0.0099 | 119.0606 | 0.0099 | 1 | 13 | actin-dependent ATPase activity |
| GOMFID | Pvalue | OddsRatio | ExpCount | Count | Size | Term |
| GO:0005484 | 0.0012 | 44.8086 | 0.0517 | 2 | 37 | SNAP receptor activity |
| GO:0004853 | 0.0014 | Inf | 0.0014 | 1 | 1 | uroporphyrinogen decarboxylase activity |
| GO:0003735 | 0.0024 | 12.7681 | 0.2726 | 3 | 195 | structural constituent of ribosome |
| GO:0051033 | 0.0042 | 374.1905 | 0.0042 | 1 | 3 | RNA transmembrane transporter activity |
| GO:0017150 | 0.0056 | 249.4444 | 0.0056 | 1 | 4 | tRNA dihydrouridine synthase activity |
| GOMFID | Pvalue | OddsRatio | ExpCount | Count | Size | Term |
| GO:0004129 | 2e-04 | 124.6429 | 0.0205 | 2 | 23 | cytochrome-c oxidase activity |
| GO:0016675 | 2e-04 | 118.9697 | 0.0213 | 2 | 24 | oxidoreductase activity, acting on a heme group of donors |
| NA. |
| n/a |
| NA. |
| n/a |
| NA. |
| n/a |
| NA. |
| n/a |
| NA. |
| n/a |
| NA. |
| n/a |
| NA. |
| n/a |
| NA. |
| n/a |
| NA. |
| n/a |
| NA. |
| n/a |
| NA. |
| n/a |
| NA. |
| n/a |
| NA. |
| n/a |
| NA. |
| n/a |
| NA. |
| n/a |
| NA. |
| n/a |
| NA. |
| n/a |
| NA. |
| n/a |
| NA. |
| n/a |
| NA. |
| n/a |
| NA. |
| n/a |
| NA. |
| n/a |
| NA. |
| n/a |
| NA. |
| n/a |
| NA. |
| n/a |
| NA. |
| n/a |
| NA. |
| n/a |
| NA. |
| n/a |
| NA. |
| n/a |
| NA. |
| n/a |
| NA. |
| n/a |
| NA. |
| n/a |
| NA. |
| n/a |
| NA. |
| n/a |
| NA. |
| n/a |
| NA. |
| n/a |
| NA. |
| n/a |
| NA. |
| n/a |
| NA. |
| n/a |
| NA. |
| n/a |
| NA. |
| n/a |
| NA. |
| n/a |
| NA. |
| n/a |
| NA. |
| n/a |
| NA. |
| n/a |
| NA. |
| n/a |
| NA. |
| n/a |
| NA. |
| n/a |
| NA. |
| n/a |
| NA. |
| n/a |
| NA. |
| n/a |
| NA. |
| n/a |
| NA. |
| n/a |
| NA. |
| n/a |
| NA. |
| n/a |
| NA. |
| n/a |
| NA. |
| n/a |
| NA. |
| n/a |
| NA. |
| n/a |
| NA. |
| n/a |
| NA. |
| n/a |
| NA. |
| n/a |
| NA. |
| n/a |
| NA. |
| n/a |
| NA. |
| n/a |
| NA. |
| n/a |
| NA. |
| n/a |
| NA. |
| n/a |
| NA. |
| n/a |
| NA. |
| n/a |
| NA. |
| n/a |
| NA. |
| n/a |
| NA. |
| n/a |
| NA. |
| n/a |
| NA. |
| n/a |
| NA. |
| n/a |
| NA. |
| n/a |
| NA. |
| n/a |
| NA. |
| n/a |
| NA. |
| n/a |
| NA. |
| n/a |
| NA. |
| n/a |
| NA. |
| n/a |
| NA. |
| n/a |
| NA. |
| n/a |
| NA. |
| n/a |
| NA. |
| n/a |
| NA. |
| n/a |
| NA. |
| n/a |
| NA. |
| n/a |
| NA. |
| n/a |
| NA. |
| n/a |
| NA. |
| n/a |
| NA. |
| n/a |
| NA. |
| n/a |
| NA. |
| n/a |
| NA. |
| n/a |
| NA. |
| n/a |
| NA. |
| n/a |
| NA. |
| n/a |
| NA. |
| n/a |
| NA. |
| n/a |
| NA. |
| n/a |
| NA. |
| n/a |
| NA. |
| n/a |
| NA. |
| n/a |
| NA. |
| n/a |
| NA. |
| n/a |
| NA. |
| n/a |
| NA. |
| n/a |
| NA. |
| n/a |
| NA. |
| n/a |
| GOMFID | Pvalue | OddsRatio | ExpCount | Count | Size | Term |
| GO:0000086 | 0.0023 | 7.8978 | 0.5575 | 4 | 186 | G2/M transition of mitotic cell cycle |
| GO:0009443 | 0.003 | Inf | 0.003 | 1 | 1 | pyridoxal 5'-phosphate salvage |
| GO:0048685 | 0.003 | Inf | 0.003 | 1 | 1 | negative regulation of collateral sprouting of intact axon in response to injury |
| GO:0097310 | 0.003 | Inf | 0.003 | 1 | 1 | cap2 mRNA methylation |
| GO:1903047 | 0.003 | 3.6868 | 2.4937 | 8 | 832 | mitotic cell cycle process |
| GO:0044770 | 0.0031 | 4.6301 | 1.4537 | 6 | 485 | cell cycle phase transition |
| GO:0045862 | 0.0038 | 5.2914 | 1.046 | 5 | 349 | positive regulation of proteolysis |
| GO:0010977 | 0.0049 | 9.4493 | 0.3447 | 3 | 115 | negative regulation of neuron projection development |
| GO:0030705 | 0.0049 | 9.4493 | 0.3447 | 3 | 115 | cytoskeleton-dependent intracellular transport |
| GO:0002314 | 0.006 | 339.8478 | 0.006 | 1 | 2 | germinal center B cell differentiation |
| GO:0006212 | 0.006 | 339.8478 | 0.006 | 1 | 2 | uracil catabolic process |
| GO:0006423 | 0.006 | 339.8478 | 0.006 | 1 | 2 | cysteinyl-tRNA aminoacylation |
| GO:0006210 | 0.009 | 169.913 | 0.009 | 1 | 3 | thymine catabolic process |
| GO:0042822 | 0.009 | 169.913 | 0.009 | 1 | 3 | pyridoxal phosphate metabolic process |
| GOMFID | Pvalue | OddsRatio | ExpCount | Count | Size | Term |
| GO:0001696 | 0.0018 | 36.7341 | 0.063 | 2 | 19 | gastric acid secretion |
| GO:0051043 | 0.002 | 34.6911 | 0.0663 | 2 | 20 | regulation of membrane protein ectodomain proteolysis |
| GO:0005985 | 0.0033 | Inf | 0.0033 | 1 | 1 | sucrose metabolic process |
| GO:0010808 | 0.0033 | Inf | 0.0033 | 1 | 1 | positive regulation of synaptic vesicle priming |
| GO:0010967 | 0.0033 | Inf | 0.0033 | 1 | 1 | regulation of polyamine biosynthetic process |
| GO:0036335 | 0.0033 | Inf | 0.0033 | 1 | 1 | intestinal stem cell homeostasis |
| GO:0043181 | 0.0033 | Inf | 0.0033 | 1 | 1 | vacuolar sequestering |
| GO:1901307 | 0.0033 | Inf | 0.0033 | 1 | 1 | positive regulation of spermidine biosynthetic process |
| GO:0006414 | 0.0045 | 6.4945 | 0.6699 | 4 | 202 | translational elongation |
| GO:0009447 | 0.0066 | 306.4314 | 0.0066 | 1 | 2 | putrescine catabolic process |
| GO:0046203 | 0.0066 | 306.4314 | 0.0066 | 1 | 2 | spermidine catabolic process |
| GO:0046208 | 0.0066 | 306.4314 | 0.0066 | 1 | 2 | spermine catabolic process |
| GO:0060995 | 0.0066 | 306.4314 | 0.0066 | 1 | 2 | cell-cell signaling involved in kidney development |
| GO:0061290 | 0.0066 | 306.4314 | 0.0066 | 1 | 2 | canonical Wnt signaling pathway involved in metanephric kidney development |
| GO:0072318 | 0.0066 | 306.4314 | 0.0066 | 1 | 2 | clathrin coat disassembly |
| GO:0030431 | 0.007 | 17.3256 | 0.126 | 2 | 38 | sleep |
| GO:0000023 | 0.0099 | 153.2059 | 0.0099 | 1 | 3 | maltose metabolic process |
| GO:0002086 | 0.0099 | 153.2059 | 0.0099 | 1 | 3 | diaphragm contraction |
| GO:0032487 | 0.0099 | 153.2059 | 0.0099 | 1 | 3 | regulation of Rap protein signal transduction |
| GO:0033512 | 0.0099 | 153.2059 | 0.0099 | 1 | 3 | L-lysine catabolic process to acetyl-CoA via saccharopine |
| GO:0042322 | 0.0099 | 153.2059 | 0.0099 | 1 | 3 | negative regulation of circadian sleep/wake cycle, REM sleep |
| GO:0060399 | 0.0099 | 153.2059 | 0.0099 | 1 | 3 | positive regulation of growth hormone receptor signaling pathway |
| GOMFID | Pvalue | OddsRatio | ExpCount | Count | Size | Term |
| GO:0006554 | 7e-04 | 62.476 | 0.0398 | 2 | 12 | lysine catabolic process |
| GO:0044849 | 0.0018 | 36.7341 | 0.063 | 2 | 19 | estrous cycle |
| GO:0036250 | 0.0033 | Inf | 0.0033 | 1 | 1 | peroxisome transport along microtubule |
| GO:0038111 | 0.0033 | Inf | 0.0033 | 1 | 1 | interleukin-7-mediated signaling pathway |
| GO:0044721 | 0.0033 | Inf | 0.0033 | 1 | 1 | protein import into peroxisome matrix, substrate release |
| GO:0055108 | 0.0033 | Inf | 0.0033 | 1 | 1 | Golgi to transport vesicle transport |
| GO:0070142 | 0.0033 | Inf | 0.0033 | 1 | 1 | synaptic vesicle budding |
| GO:0098760 | 0.0033 | Inf | 0.0033 | 1 | 1 | response to interleukin-7 |
| GO:1904373 | 0.0033 | Inf | 0.0033 | 1 | 1 | response to kainic acid |
| GO:1904389 | 0.0033 | Inf | 0.0033 | 1 | 1 | rod bipolar cell differentiation |
| GO:1904391 | 0.0033 | Inf | 0.0033 | 1 | 1 | response to ciliary neurotrophic factor |
| GO:1904397 | 0.0033 | Inf | 0.0033 | 1 | 1 | negative regulation of neuromuscular junction development |
| GO:1904779 | 0.0033 | Inf | 0.0033 | 1 | 1 | regulation of protein localization to centrosome |
| GO:1901606 | 0.0038 | 10.3396 | 0.315 | 3 | 95 | alpha-amino acid catabolic process |
| GO:0016320 | 0.0066 | 306.4314 | 0.0066 | 1 | 2 | endoplasmic reticulum membrane fusion |
| GO:0019255 | 0.0066 | 306.4314 | 0.0066 | 1 | 2 | glucose 1-phosphate metabolic process |
| GO:0019442 | 0.0066 | 306.4314 | 0.0066 | 1 | 2 | tryptophan catabolic process to acetyl-CoA |
| GO:0032425 | 0.0066 | 306.4314 | 0.0066 | 1 | 2 | positive regulation of mismatch repair |
| GO:0034342 | 0.0066 | 306.4314 | 0.0066 | 1 | 2 | response to type III interferon |
| GO:0042361 | 0.0066 | 306.4314 | 0.0066 | 1 | 2 | menaquinone catabolic process |
| GO:0042377 | 0.0066 | 306.4314 | 0.0066 | 1 | 2 | vitamin K catabolic process |
| GO:0097212 | 0.0066 | 306.4314 | 0.0066 | 1 | 2 | lysosomal membrane organization |
| GO:1901090 | 0.0066 | 306.4314 | 0.0066 | 1 | 2 | regulation of protein tetramerization |
| GO:1901094 | 0.0066 | 306.4314 | 0.0066 | 1 | 2 | negative regulation of protein homotetramerization |
| GO:1902824 | 0.0066 | 306.4314 | 0.0066 | 1 | 2 | positive regulation of late endosome to lysosome transport |
| GO:1904395 | 0.0066 | 306.4314 | 0.0066 | 1 | 2 | positive regulation of skeletal muscle acetylcholine-gated channel clustering |
| GO:0007029 | 0.0074 | 16.8562 | 0.1293 | 2 | 39 | endoplasmic reticulum organization |
| GO:0046580 | 0.0081 | 15.9897 | 0.136 | 2 | 41 | negative regulation of Ras protein signal transduction |
| GO:0032570 | 0.0085 | 15.589 | 0.1393 | 2 | 42 | response to progesterone |
| GO:0006065 | 0.0099 | 153.2059 | 0.0099 | 1 | 3 | UDP-glucuronate biosynthetic process |
| GO:0016561 | 0.0099 | 153.2059 | 0.0099 | 1 | 3 | protein import into peroxisome matrix, translocation |
| GO:0032487 | 0.0099 | 153.2059 | 0.0099 | 1 | 3 | regulation of Rap protein signal transduction |
| GO:0033512 | 0.0099 | 153.2059 | 0.0099 | 1 | 3 | L-lysine catabolic process to acetyl-CoA via saccharopine |
| GO:0033566 | 0.0099 | 153.2059 | 0.0099 | 1 | 3 | gamma-tubulin complex localization |
| GO:0042376 | 0.0099 | 153.2059 | 0.0099 | 1 | 3 | phylloquinone catabolic process |
| GOMFID | Pvalue | OddsRatio | ExpCount | Count | Size | Term |
| GO:0090116 | 1e-04 | 240.1846 | 0.0171 | 2 | 4 | C-5 methylation of cytosine |
| GO:0042053 | 0.0018 | 36.9254 | 0.0641 | 2 | 15 | regulation of dopamine metabolic process |
| GO:0035269 | 0.0021 | 34.2857 | 0.0684 | 2 | 16 | protein O-linked mannosylation |
| GO:0007064 | 0.0023 | 31.9979 | 0.0726 | 2 | 17 | mitotic sister chromatid cohesion |
| GO:0030488 | 0.0036 | 25.2551 | 0.0897 | 2 | 21 | tRNA methylation |
| GO:0048199 | 0.0036 | 10.5605 | 0.3076 | 3 | 72 | vesicle targeting, to, from or within Golgi |
| GO:0046177 | 0.0043 | Inf | 0.0043 | 1 | 1 | D-gluconate catabolic process |
| GO:1902722 | 0.0043 | Inf | 0.0043 | 1 | 1 | positive regulation of prolactin secretion |
| GO:1904450 | 0.0043 | Inf | 0.0043 | 1 | 1 | positive regulation of aspartate secretion |
| GO:0006901 | 0.005 | 9.3365 | 0.3461 | 3 | 81 | vesicle coating |
| GO:1902591 | 0.005 | 9.3365 | 0.3461 | 3 | 81 | single-organism membrane budding |
| GO:0015800 | 0.0051 | 20.8575 | 0.1068 | 2 | 25 | acidic amino acid transport |
| GO:0006688 | 0.0055 | 19.9872 | 0.1111 | 2 | 26 | glycosphingolipid biosynthetic process |
| GO:0097164 | 0.0058 | 5.9814 | 0.7178 | 4 | 168 | ammonium ion metabolic process |
| GO:0051783 | 0.0059 | 5.9448 | 0.7221 | 4 | 169 | regulation of nuclear division |
| GO:0051668 | 0.0065 | 8.4637 | 0.3803 | 3 | 89 | localization within membrane |
| GO:0018958 | 0.0071 | 8.1768 | 0.3931 | 3 | 92 | phenol-containing compound metabolic process |
| GO:0005975 | 0.0073 | 2.705 | 4.1061 | 10 | 961 | carbohydrate metabolic process |
| GO:0006486 | 0.0079 | 3.7126 | 1.7475 | 6 | 409 | protein glycosylation |
| GO:0009450 | 0.0085 | 236.5606 | 0.0085 | 1 | 2 | gamma-aminobutyric acid catabolic process |
| GO:0014053 | 0.0085 | 236.5606 | 0.0085 | 1 | 2 | negative regulation of gamma-aminobutyric acid secretion |
| GO:0019520 | 0.0085 | 236.5606 | 0.0085 | 1 | 2 | aldonic acid metabolic process |
| GO:0019836 | 0.0085 | 236.5606 | 0.0085 | 1 | 2 | hemolysis by symbiont of host erythrocytes |
| GO:0044179 | 0.0085 | 236.5606 | 0.0085 | 1 | 2 | hemolysis in other organism |
| GO:0048822 | 0.0085 | 236.5606 | 0.0085 | 1 | 2 | enucleate erythrocyte development |
| GO:0051801 | 0.0085 | 236.5606 | 0.0085 | 1 | 2 | cytolysis in other organism involved in symbiotic interaction |
| GO:0097156 | 0.0085 | 236.5606 | 0.0085 | 1 | 2 | fasciculation of motor neuron axon |
| GO:1904379 | 0.0085 | 236.5606 | 0.0085 | 1 | 2 | protein localization to cytosolic proteasome complex involved in ERAD pathway |
| GO:0018193 | 0.0088 | 2.4084 | 5.5929 | 12 | 1309 | peptidyl-amino acid modification |
| GO:0097502 | 0.0092 | 14.9827 | 0.1453 | 2 | 34 | mannosylation |
| GOMFID | Pvalue | OddsRatio | ExpCount | Count | Size | Term |
| GO:0051668 | 0.0029 | 11.5376 | 0.2838 | 3 | 89 | localization within membrane |
| GO:0021506 | 0.0032 | Inf | 0.0032 | 1 | 1 | anterior neuropore closure |
| GO:0033274 | 0.0032 | Inf | 0.0032 | 1 | 1 | response to vitamin B2 |
| GO:0035048 | 0.0032 | Inf | 0.0032 | 1 | 1 | splicing factor protein import into nucleus |
| GO:0040040 | 0.0032 | Inf | 0.0032 | 1 | 1 | thermosensory behavior |
| GO:1903621 | 0.0032 | Inf | 0.0032 | 1 | 1 | protein localization to photoreceptor connecting cilium |
| GO:0044723 | 0.0032 | 3.6315 | 2.5094 | 8 | 787 | single-organism carbohydrate metabolic process |
| GO:0035335 | 0.0033 | 10.9002 | 0.2997 | 3 | 94 | peptidyl-tyrosine dephosphorylation |
| GO:0034314 | 0.0044 | 22.4167 | 0.0988 | 2 | 31 | Arp2/3 complex-mediated actin nucleation |
| GO:0006529 | 0.0064 | 318.9796 | 0.0064 | 1 | 2 | asparagine biosynthetic process |
| GO:0006682 | 0.0064 | 318.9796 | 0.0064 | 1 | 2 | galactosylceramide biosynthetic process |
| GO:0010730 | 0.0064 | 318.9796 | 0.0064 | 1 | 2 | negative regulation of hydrogen peroxide biosynthetic process |
| GO:0070829 | 0.0064 | 318.9796 | 0.0064 | 1 | 2 | heterochromatin maintenance |
| GO:2000473 | 0.0064 | 318.9796 | 0.0064 | 1 | 2 | positive regulation of hematopoietic stem cell migration |
| GO:0018279 | 0.0074 | 5.6001 | 0.7748 | 4 | 243 | protein N-linked glycosylation via asparagine |
| GO:0002378 | 0.0095 | 159.4796 | 0.0096 | 1 | 3 | immunoglobulin biosynthetic process |
| GOMFID | Pvalue | OddsRatio | ExpCount | Count | Size | Term |
| GO:0008655 | 9e-04 | 56.529 | 0.0453 | 2 | 10 | pyrimidine-containing compound salvage |
| GO:0038061 | 0.0012 | 9.3538 | 0.4664 | 4 | 103 | NIK/NF-kappaB signaling |
| GO:0007252 | 0.0013 | 45.2174 | 0.0543 | 2 | 12 | I-kappaB phosphorylation |
| GO:0044774 | 0.0014 | 9.077 | 0.4799 | 4 | 106 | mitotic DNA integrity checkpoint |
| GO:0043174 | 0.0015 | 41.1041 | 0.0589 | 2 | 13 | nucleoside salvage |
| GO:0032508 | 0.0018 | 13.7294 | 0.24 | 3 | 53 | DNA duplex unwinding |
| GO:0006238 | 0.0045 | Inf | 0.0045 | 1 | 1 | CMP salvage |
| GO:0009645 | 0.0045 | Inf | 0.0045 | 1 | 1 | response to low light intensity stimulus |
| GO:0046035 | 0.0045 | Inf | 0.0045 | 1 | 1 | CMP metabolic process |
| GO:0046092 | 0.0045 | Inf | 0.0045 | 1 | 1 | deoxycytidine metabolic process |
| GO:0046690 | 0.0045 | Inf | 0.0045 | 1 | 1 | response to tellurium ion |
| GO:0070367 | 0.0045 | Inf | 0.0045 | 1 | 1 | negative regulation of hepatocyte differentiation |
| GO:0031571 | 0.0048 | 9.5208 | 0.3396 | 3 | 75 | mitotic G1 DNA damage checkpoint |
| GO:0071840 | 0.0052 | 1.8941 | 26.895 | 38 | 5940 | cellular component organization or biogenesis |
| GO:0006595 | 0.0053 | 9.1382 | 0.3532 | 3 | 78 | polyamine metabolic process |
| GO:0022613 | 0.0055 | 4.0129 | 1.6164 | 6 | 357 | ribonucleoprotein complex biogenesis |
| GO:1901566 | 0.006 | 2.4426 | 5.9993 | 13 | 1325 | organonitrogen compound biosynthetic process |
| GO:0033209 | 0.0061 | 5.8762 | 0.729 | 4 | 161 | tumor necrosis factor-mediated signaling pathway |
| GO:0008299 | 0.0061 | 18.8237 | 0.1177 | 2 | 26 | isoprenoid biosynthetic process |
| GO:0009124 | 0.0063 | 8.5643 | 0.3758 | 3 | 83 | nucleoside monophosphate biosynthetic process |
| GO:1901991 | 0.0069 | 5.6577 | 0.7561 | 4 | 167 | negative regulation of mitotic cell cycle phase transition |
| GO:0046134 | 0.0071 | 17.3735 | 0.1268 | 2 | 28 | pyrimidine nucleoside biosynthetic process |
| GO:0034612 | 0.0078 | 4.3534 | 1.2316 | 5 | 272 | response to tumor necrosis factor |
| GO:0002758 | 0.0079 | 4.3368 | 1.2361 | 5 | 273 | innate immune response-activating signal transduction |
| GO:0009107 | 0.009 | 222.9857 | 0.0091 | 1 | 2 | lipoate biosynthetic process |
| GO:0035494 | 0.009 | 222.9857 | 0.0091 | 1 | 2 | SNARE complex disassembly |
| GO:0043335 | 0.009 | 222.9857 | 0.0091 | 1 | 2 | protein unfolding |
| GO:0060545 | 0.009 | 222.9857 | 0.0091 | 1 | 2 | positive regulation of necroptotic process |
| GO:1902443 | 0.009 | 222.9857 | 0.0091 | 1 | 2 | negative regulation of ripoptosome assembly involved in necroptotic process |
| GO:2000452 | 0.009 | 222.9857 | 0.0091 | 1 | 2 | regulation of CD8-positive, alpha-beta cytotoxic T cell extravasation |
| GO:0006206 | 0.0092 | 15.0531 | 0.1449 | 2 | 32 | pyrimidine nucleobase metabolic process |
| GO:0006270 | 0.0092 | 15.0531 | 0.1449 | 2 | 32 | DNA replication initiation |
| GO:0010939 | 0.0092 | 15.0531 | 0.1449 | 2 | 32 | regulation of necrotic cell death |
| GO:0051351 | 0.0094 | 7.361 | 0.4347 | 3 | 96 | positive regulation of ligase activity |
| GOMFID | Pvalue | OddsRatio | ExpCount | Count | Size | Term |
| GO:0008039 | 0.0018 | Inf | 0.0018 | 1 | 1 | synaptic target recognition |
| GO:0090090 | 0.0029 | 11.6936 | 0.2893 | 3 | 162 | negative regulation of canonical Wnt signaling pathway |
| GO:0002478 | 0.0032 | 11.3334 | 0.2982 | 3 | 167 | antigen processing and presentation of exogenous peptide antigen |
| GO:0030070 | 0.0053 | 289.8333 | 0.0054 | 1 | 3 | insulin processing |
| GO:0016055 | 0.0063 | 6.0895 | 0.7517 | 4 | 421 | Wnt signaling pathway |
| GO:0010499 | 0.0071 | 193.2099 | 0.0071 | 1 | 4 | proteasomal ubiquitin-independent protein catabolic process |
| GO:0035093 | 0.0071 | 193.2099 | 0.0071 | 1 | 4 | spermatogenesis, exchange of chromosomal proteins |
| GO:0019882 | 0.0073 | 8.3411 | 0.4018 | 3 | 225 | antigen processing and presentation |
| GO:1901026 | 0.0089 | 144.8981 | 0.0089 | 1 | 5 | ripoptosome assembly involved in necroptotic process |
| GO:0060333 | 0.0098 | 14.6069 | 0.15 | 2 | 84 | interferon-gamma-mediated signaling pathway |
| GOMFID | Pvalue | OddsRatio | ExpCount | Count | Size | Term |
| GO:0015826 | 0.0034 | Inf | 0.0034 | 1 | 1 | threonine transport |
| GO:0021642 | 0.0034 | Inf | 0.0034 | 1 | 1 | trochlear nerve formation |
| GO:0021703 | 0.0034 | Inf | 0.0034 | 1 | 1 | locus ceruleus development |
| GO:0034589 | 0.0034 | Inf | 0.0034 | 1 | 1 | hydroxyproline transport |
| GO:0046105 | 0.0034 | Inf | 0.0034 | 1 | 1 | thymidine biosynthetic process |
| GO:0046120 | 0.0034 | Inf | 0.0034 | 1 | 1 | deoxyribonucleoside biosynthetic process |
| GO:0051086 | 0.0034 | Inf | 0.0034 | 1 | 1 | chaperone mediated protein folding independent of cofactor |
| GO:0051296 | 0.0034 | Inf | 0.0034 | 1 | 1 | establishment of meiotic spindle orientation |
| GO:0071765 | 0.0034 | Inf | 0.0034 | 1 | 1 | nuclear inner membrane organization |
| GO:1901194 | 0.0034 | Inf | 0.0034 | 1 | 1 | negative regulation of formation of translation preinitiation complex |
| GO:1902103 | 0.0034 | Inf | 0.0034 | 1 | 1 | negative regulation of metaphase/anaphase transition of meiotic cell cycle |
| GO:1901661 | 0.0045 | 22.2222 | 0.0999 | 2 | 29 | quinone metabolic process |
| GO:0006624 | 0.0069 | 294.8302 | 0.0069 | 1 | 2 | vacuolar protein processing |
| GO:0021623 | 0.0069 | 294.8302 | 0.0069 | 1 | 2 | oculomotor nerve formation |
| GO:0030264 | 0.0069 | 294.8302 | 0.0069 | 1 | 2 | nuclear fragmentation involved in apoptotic nuclear change |
| GO:0034970 | 0.0069 | 294.8302 | 0.0069 | 1 | 2 | histone H3-R2 methylation |
| GO:0042309 | 0.0069 | 294.8302 | 0.0069 | 1 | 2 | homoiothermy |
| GO:1990569 | 0.0069 | 294.8302 | 0.0069 | 1 | 2 | UDP-N-acetylglucosamine transmembrane transport |
| GOMFID | Pvalue | OddsRatio | ExpCount | Count | Size | Term |
| GO:1901538 | 2e-04 | 153.1765 | 0.0203 | 2 | 6 | changes to DNA methylation involved in embryo development |
| GO:0034379 | 4e-04 | 87.5126 | 0.0304 | 2 | 9 | very-low-density lipoprotein particle assembly |
| GO:0060137 | 5e-04 | 76.5686 | 0.0338 | 2 | 10 | maternal process involved in parturition |
| GO:0071397 | 7e-04 | 61.2471 | 0.0406 | 2 | 12 | cellular response to cholesterol |
| GO:0043084 | 9e-04 | 55.6756 | 0.0439 | 2 | 13 | penile erection |
| GO:0006921 | 0.0013 | 15.568 | 0.2129 | 3 | 63 | cellular component disassembly involved in execution phase of apoptosis |
| GO:0003094 | 0.002 | 34.0087 | 0.0676 | 2 | 20 | glomerular filtration |
| GO:0035510 | 0.0025 | 30.6039 | 0.0744 | 2 | 22 | DNA dealkylation |
| GO:0036314 | 0.0029 | 27.8182 | 0.0811 | 2 | 24 | response to sterol |
| GO:0065005 | 0.0029 | 27.8182 | 0.0811 | 2 | 24 | protein-lipid complex assembly |
| GO:0035383 | 0.0032 | 11.1029 | 0.2941 | 3 | 87 | thioester metabolic process |
| GO:0043304 | 0.0032 | 26.607 | 0.0845 | 2 | 25 | regulation of mast cell degranulation |
| GO:0046487 | 0.0032 | 26.607 | 0.0845 | 2 | 25 | glyoxylate metabolic process |
| GO:0000494 | 0.0034 | Inf | 0.0034 | 1 | 1 | box C/D snoRNA 3'-end processing |
| GO:0009645 | 0.0034 | Inf | 0.0034 | 1 | 1 | response to low light intensity stimulus |
| GO:0033967 | 0.0034 | Inf | 0.0034 | 1 | 1 | box C/D snoRNA metabolic process |
| GO:0036343 | 0.0034 | Inf | 0.0034 | 1 | 1 | psychomotor behavior |
| GO:0044727 | 0.0034 | Inf | 0.0034 | 1 | 1 | DNA demethylation of male pronucleus |
| GO:0045903 | 0.0034 | Inf | 0.0034 | 1 | 1 | positive regulation of translational fidelity |
| GO:0046690 | 0.0034 | Inf | 0.0034 | 1 | 1 | response to tellurium ion |
| GO:0055108 | 0.0034 | Inf | 0.0034 | 1 | 1 | Golgi to transport vesicle transport |
| GO:0060566 | 0.0034 | Inf | 0.0034 | 1 | 1 | positive regulation of DNA-templated transcription, termination |
| GO:0070142 | 0.0034 | Inf | 0.0034 | 1 | 1 | synaptic vesicle budding |
| GO:0070859 | 0.0034 | Inf | 0.0034 | 1 | 1 | positive regulation of bile acid biosynthetic process |
| GO:1904594 | 0.0034 | Inf | 0.0034 | 1 | 1 | regulation of termination of RNA polymerase II transcription |
| GO:1990258 | 0.0034 | Inf | 0.0034 | 1 | 1 | histone glutamine methylation |
| GO:1990744 | 0.0034 | Inf | 0.0034 | 1 | 1 | primary miRNA methylation |
| GO:2000806 | 0.0034 | Inf | 0.0034 | 1 | 1 | positive regulation of termination of RNA polymerase II transcription, poly(A)-coupled |
| GO:0006099 | 0.0037 | 24.4753 | 0.0913 | 2 | 27 | tricarboxylic acid cycle |
| GO:1903305 | 0.0038 | 10.3587 | 0.3143 | 3 | 93 | regulation of regulated secretory pathway |
| GO:0006084 | 0.0046 | 21.8487 | 0.1014 | 2 | 30 | acetyl-CoA metabolic process |
| GO:0006414 | 0.0048 | 6.3616 | 0.6827 | 4 | 202 | translational elongation |
| GO:0006939 | 0.0048 | 9.5082 | 0.3414 | 3 | 101 | smooth muscle contraction |
| GO:0033003 | 0.0059 | 19.1127 | 0.1149 | 2 | 34 | regulation of mast cell activation |
| GO:0032388 | 0.0062 | 4.6558 | 1.1728 | 5 | 347 | positive regulation of intracellular transport |
| GO:0071827 | 0.0062 | 18.5324 | 0.1183 | 2 | 35 | plasma lipoprotein particle organization |
| GO:0072350 | 0.0062 | 18.5324 | 0.1183 | 2 | 35 | tricarboxylic acid metabolic process |
| GO:0014846 | 0.0067 | 300.5192 | 0.0068 | 1 | 2 | esophagus smooth muscle contraction |
| GO:0019255 | 0.0067 | 300.5192 | 0.0068 | 1 | 2 | glucose 1-phosphate metabolic process |
| GO:0060086 | 0.0067 | 300.5192 | 0.0068 | 1 | 2 | circadian temperature homeostasis |
| GO:0086100 | 0.0067 | 300.5192 | 0.0068 | 1 | 2 | endothelin receptor signaling pathway |
| GO:0097212 | 0.0067 | 300.5192 | 0.0068 | 1 | 2 | lysosomal membrane organization |
| GO:1901536 | 0.0067 | 300.5192 | 0.0068 | 1 | 2 | negative regulation of DNA demethylation |
| GO:1902824 | 0.0067 | 300.5192 | 0.0068 | 1 | 2 | positive regulation of late endosome to lysosome transport |
| GO:2000312 | 0.0067 | 300.5192 | 0.0068 | 1 | 2 | regulation of kainate selective glutamate receptor activity |
| GO:0002279 | 0.0081 | 16.0888 | 0.1352 | 2 | 40 | mast cell activation involved in immune response |
| GO:0044706 | 0.0087 | 5.3241 | 0.8112 | 4 | 240 | multi-multicellular organism process |
| GO:0002448 | 0.0089 | 15.2824 | 0.142 | 2 | 42 | mast cell mediated immunity |
| GO:0002684 | 0.0094 | 2.983 | 2.998 | 8 | 887 | positive regulation of immune system process |
| GO:0007618 | 0.0097 | 14.5528 | 0.1487 | 2 | 44 | mating |
| GOMFID | Pvalue | OddsRatio | ExpCount | Count | Size | Term |
| GO:0009749 | 2e-04 | 15.4723 | 0.3065 | 4 | 178 | response to glucose |
| GO:0034284 | 3e-04 | 14.4628 | 0.3271 | 4 | 190 | response to monosaccharide |
| GO:0046618 | 0.0017 | Inf | 0.0017 | 1 | 1 | drug export |
| GO:0006436 | 0.0034 | 602.0385 | 0.0034 | 1 | 2 | tryptophanyl-tRNA aminoacylation |
| GO:0006542 | 0.0034 | 602.0385 | 0.0034 | 1 | 2 | glutamine biosynthetic process |
| GO:0046452 | 0.0034 | 602.0385 | 0.0034 | 1 | 2 | dihydrofolate metabolic process |
| GO:0097369 | 0.0034 | 602.0385 | 0.0034 | 1 | 2 | sodium ion import |
| GO:1900110 | 0.0034 | 602.0385 | 0.0034 | 1 | 2 | negative regulation of histone H3-K9 dimethylation |
| GO:0071310 | 0.0036 | 3.4119 | 3.9809 | 10 | 2312 | cellular response to organic substance |
| GO:0048747 | 0.0037 | 24.4753 | 0.0913 | 2 | 53 | muscle fiber development |
| GO:0003331 | 0.0052 | 301 | 0.0052 | 1 | 3 | positive regulation of extracellular matrix constituent secretion |
| GO:0031914 | 0.0052 | 301 | 0.0052 | 1 | 3 | negative regulation of synaptic plasticity |
| GO:1902661 | 0.0052 | 301 | 0.0052 | 1 | 3 | positive regulation of glucose mediated signaling pathway |
| GO:1904263 | 0.0052 | 301 | 0.0052 | 1 | 3 | positive regulation of TORC1 signaling |
| GO:2000346 | 0.0052 | 301 | 0.0052 | 1 | 3 | negative regulation of hepatocyte proliferation |
| GO:1901607 | 0.0068 | 17.8103 | 0.124 | 2 | 72 | alpha-amino acid biosynthetic process |
| GO:0000492 | 0.0069 | 200.6538 | 0.0069 | 1 | 4 | box C/D snoRNP assembly |
| GO:0000707 | 0.0069 | 200.6538 | 0.0069 | 1 | 4 | meiotic DNA recombinase assembly |
| GO:0009757 | 0.0069 | 200.6538 | 0.0069 | 1 | 4 | hexose mediated signaling |
| GO:0048254 | 0.0069 | 200.6538 | 0.0069 | 1 | 4 | snoRNA localization |
| GO:0060024 | 0.0069 | 200.6538 | 0.0069 | 1 | 4 | rhythmic synaptic transmission |
| GO:1900113 | 0.0069 | 200.6538 | 0.0069 | 1 | 4 | negative regulation of histone H3-K9 trimethylation |
| GO:2000619 | 0.0069 | 200.6538 | 0.0069 | 1 | 4 | negative regulation of histone H4-K16 acetylation |
| GO:0030004 | 0.007 | 17.5583 | 0.1257 | 2 | 73 | cellular monovalent inorganic cation homeostasis |
| GO:1901701 | 0.0079 | 3.9902 | 1.8114 | 6 | 1052 | cellular response to oxygen-containing compound |
| GO:0010757 | 0.0086 | 150.4808 | 0.0086 | 1 | 5 | negative regulation of plasminogen activation |
| GO:0031427 | 0.0086 | 150.4808 | 0.0086 | 1 | 5 | response to methotrexate |
| GO:0042908 | 0.0086 | 150.4808 | 0.0086 | 1 | 5 | xenobiotic transport |
| GO:0098735 | 0.0086 | 150.4808 | 0.0086 | 1 | 5 | positive regulation of the force of heart contraction |
| GO:1901660 | 0.0086 | 150.4808 | 0.0086 | 1 | 5 | calcium ion export |
| GO:2001268 | 0.0086 | 150.4808 | 0.0086 | 1 | 5 | negative regulation of cysteine-type endopeptidase activity involved in apoptotic signaling pathway |
| GOMFID | Pvalue | OddsRatio | ExpCount | Count | Size | Term |
| GO:0051125 | 9e-04 | 52.1 | 0.0448 | 2 | 26 | regulation of actin nucleation |
| GO:0042269 | 0.0015 | 40.3174 | 0.0568 | 2 | 33 | regulation of natural killer cell mediated cytotoxicity |
| GO:0032970 | 0.0016 | 9.0861 | 0.5131 | 4 | 298 | regulation of actin filament-based process |
| GO:0033388 | 0.0017 | Inf | 0.0017 | 1 | 1 | putrescine biosynthetic process from arginine |
| GO:0071449 | 0.0017 | Inf | 0.0017 | 1 | 1 | cellular response to lipid hydroperoxide |
| GO:0008064 | 0.0022 | 13.0963 | 0.26 | 3 | 151 | regulation of actin polymerization or depolymerization |
| GO:0032271 | 0.003 | 11.6627 | 0.291 | 3 | 169 | regulation of protein polymerization |
| GO:0043323 | 0.0034 | 602.0385 | 0.0034 | 1 | 2 | positive regulation of natural killer cell degranulation |
| GO:0090204 | 0.0034 | 602.0385 | 0.0034 | 1 | 2 | protein localization to nuclear pore |
| GO:0097055 | 0.0034 | 602.0385 | 0.0034 | 1 | 2 | agmatine biosynthetic process |
| GO:0090257 | 0.0043 | 10.1737 | 0.3323 | 3 | 193 | regulation of muscle system process |
| GO:0031334 | 0.0044 | 10.1198 | 0.334 | 3 | 194 | positive regulation of protein complex assembly |
| GO:0031341 | 0.0044 | 22.2829 | 0.0999 | 2 | 58 | regulation of cell killing |
| GO:0002228 | 0.0046 | 21.8905 | 0.1016 | 2 | 59 | natural killer cell mediated immunity |
| GO:0035633 | 0.0052 | 301 | 0.0052 | 1 | 3 | maintenance of blood-brain barrier |
| GO:0090160 | 0.0052 | 301 | 0.0052 | 1 | 3 | Golgi to lysosome transport |
| GO:1901896 | 0.0052 | 301 | 0.0052 | 1 | 3 | positive regulation of calcium-transporting ATPase activity |
| GO:0044087 | 0.0061 | 4.914 | 1.2001 | 5 | 697 | regulation of cellular component biogenesis |
| GO:0015850 | 0.0064 | 8.8099 | 0.3822 | 3 | 222 | organic hydroxy compound transport |
| GO:0090066 | 0.0066 | 6.0134 | 0.7645 | 4 | 444 | regulation of anatomical structure size |
| GO:0008295 | 0.0069 | 200.6538 | 0.0069 | 1 | 4 | spermidine biosynthetic process |
| GO:0030321 | 0.0069 | 200.6538 | 0.0069 | 1 | 4 | transepithelial chloride transport |
| GO:0034316 | 0.0069 | 200.6538 | 0.0069 | 1 | 4 | negative regulation of Arp2/3 complex-mediated actin nucleation |
| GO:0072429 | 0.0069 | 200.6538 | 0.0069 | 1 | 4 | response to intra-S DNA damage checkpoint signaling |
| GO:2000812 | 0.0069 | 200.6538 | 0.0069 | 1 | 4 | regulation of barbed-end actin filament capping |
| GO:0098869 | 0.0071 | 17.3133 | 0.1274 | 2 | 74 | cellular oxidant detoxification |
| GO:0070542 | 0.0081 | 16.1839 | 0.136 | 2 | 79 | response to fatty acid |
| GO:0045833 | 0.0083 | 15.9754 | 0.1377 | 2 | 80 | negative regulation of lipid metabolic process |
| GO:0098754 | 0.0083 | 15.9754 | 0.1377 | 2 | 80 | detoxification |
| GO:0006172 | 0.0086 | 150.4808 | 0.0086 | 1 | 5 | ADP biosynthetic process |
| GO:0030578 | 0.0086 | 150.4808 | 0.0086 | 1 | 5 | PML body organization |
| GO:0001909 | 0.0091 | 15.1922 | 0.1446 | 2 | 84 | leukocyte mediated cytotoxicity |
| GO:0030838 | 0.0098 | 14.6532 | 0.1498 | 2 | 87 | positive regulation of actin filament polymerization |
| GOMFID | Pvalue | OddsRatio | ExpCount | Count | Size | Term |
| GO:0002058 | 0.003 | Inf | 0.003 | 1 | 1 | uracil binding |
| GO:0002059 | 0.003 | Inf | 0.003 | 1 | 1 | thymine binding |
| GO:0008478 | 0.003 | Inf | 0.003 | 1 | 1 | pyridoxal kinase activity |
| GO:0004020 | 0.006 | 340.7826 | 0.006 | 1 | 2 | adenylylsulfate kinase activity |
| GO:0004157 | 0.006 | 340.7826 | 0.006 | 1 | 2 | dihydropyrimidinase activity |
| GO:0004483 | 0.006 | 340.7826 | 0.006 | 1 | 2 | mRNA (nucleoside-2'-O-)-methyltransferase activity |
| GO:0004781 | 0.006 | 340.7826 | 0.006 | 1 | 2 | sulfate adenylyltransferase (ATP) activity |
| GO:0004817 | 0.006 | 340.7826 | 0.006 | 1 | 2 | cysteine-tRNA ligase activity |
| GO:0031403 | 0.006 | 340.7826 | 0.006 | 1 | 2 | lithium ion binding |
| GO:0035727 | 0.0089 | 170.3804 | 0.009 | 1 | 3 | lysophosphatidic acid binding |
| GOMFID | Pvalue | OddsRatio | ExpCount | Count | Size | Term |
| GO:0050512 | 0.002 | Inf | 0.002 | 1 | 1 | lactosylceramide 4-alpha-galactosyltransferase activity |
| GO:0072572 | 0.002 | Inf | 0.002 | 1 | 1 | poly-ADP-D-ribose binding |
| GO:0005152 | 0.0059 | 261.5167 | 0.0059 | 1 | 3 | interleukin-1 receptor antagonist activity |
| GO:0032396 | 0.0059 | 261.5167 | 0.0059 | 1 | 3 | inhibitory MHC class I receptor activity |
| GO:0035727 | 0.0059 | 261.5167 | 0.0059 | 1 | 3 | lysophosphatidic acid binding |
| GO:0003684 | 0.0062 | 18.591 | 0.1183 | 2 | 60 | damaged DNA binding |
| GO:0023029 | 0.0079 | 174.3333 | 0.0079 | 1 | 4 | MHC class Ib protein binding |
| GO:0042609 | 0.0098 | 130.7417 | 0.0099 | 1 | 5 | CD4 receptor binding |
| GOMFID | Pvalue | OddsRatio | ExpCount | Count | Size | Term |
| GO:1990631 | 0.0022 | Inf | 0.0022 | 1 | 1 | ErbB-4 class receptor binding |
| GO:0004667 | 0.0044 | 461.4118 | 0.0045 | 1 | 2 | prostaglandin-D synthase activity |
| GO:0005462 | 0.0044 | 461.4118 | 0.0045 | 1 | 2 | UDP-N-acetylglucosamine transmembrane transporter activity |
| GO:0004060 | 0.0067 | 230.6912 | 0.0067 | 1 | 3 | arylamine N-acetyltransferase activity |
| GO:0005290 | 0.0067 | 230.6912 | 0.0067 | 1 | 3 | L-histidine transmembrane transporter activity |
| GO:0015182 | 0.0067 | 230.6912 | 0.0067 | 1 | 3 | L-asparagine transmembrane transporter activity |
| GO:0035368 | 0.0089 | 153.7843 | 0.0089 | 1 | 4 | selenocysteine insertion sequence binding |
| GO:0042134 | 0.0089 | 153.7843 | 0.0089 | 1 | 4 | rRNA primary transcript binding |
| GO:0098519 | 0.0089 | 153.7843 | 0.0089 | 1 | 4 | nucleotide phosphatase activity, acting on free nucleotides |
| GOMFID | Pvalue | OddsRatio | ExpCount | Count | Size | Term |
| GO:0008811 | 8e-04 | Inf | 8e-04 | 1 | 1 | chloramphenicol O-acetyltransferase activity |
| GO:0008892 | 8e-04 | Inf | 8e-04 | 1 | 1 | guanine deaminase activity |
| GO:0019826 | 0.0025 | 654.5417 | 0.0025 | 1 | 3 | oxygen sensor activity |
| GO:0008745 | 0.0033 | 436.3333 | 0.0033 | 1 | 4 | N-acetylmuramoyl-L-alanine amidase activity |
| GO:0016019 | 0.0041 | 327.2292 | 0.0041 | 1 | 5 | peptidoglycan receptor activity |
| GO:0016174 | 0.0041 | 327.2292 | 0.0041 | 1 | 5 | NAD(P)H oxidase activity |
| GO:0016810 | 0.0042 | 24.2331 | 0.0984 | 2 | 119 | hydrolase activity, acting on carbon-nitrogen (but not peptide) bonds |
| GO:0016175 | 0.0066 | 186.9524 | 0.0066 | 1 | 8 | superoxide-generating NADPH oxidase activity |
| GO:0042834 | 0.0091 | 130.8417 | 0.0091 | 1 | 11 | peptidoglycan binding |
| GO:0019864 | 0.0099 | 118.9394 | 0.0099 | 1 | 12 | IgG binding |
| GOMFID | Pvalue | OddsRatio | ExpCount | Count | Size | Term |
| GO:0035730 | 0.0021 | Inf | 0.0021 | 1 | 1 | S-nitrosoglutathione binding |
| GO:0035731 | 0.0021 | Inf | 0.0021 | 1 | 1 | dinitrosyl-iron complex binding |
| GO:1990631 | 0.0021 | Inf | 0.0021 | 1 | 1 | ErbB-4 class receptor binding |
| GO:0015293 | 0.0025 | 12.2551 | 0.2728 | 3 | 130 | symporter activity |
| GO:0005462 | 0.0042 | 490.3125 | 0.0042 | 1 | 2 | UDP-N-acetylglucosamine transmembrane transporter activity |
| GO:0070026 | 0.0042 | 490.3125 | 0.0042 | 1 | 2 | nitric oxide binding |
| GO:0004060 | 0.0063 | 245.1406 | 0.0063 | 1 | 3 | arylamine N-acetyltransferase activity |
| GO:0005290 | 0.0063 | 245.1406 | 0.0063 | 1 | 3 | L-histidine transmembrane transporter activity |
| GO:0015182 | 0.0063 | 245.1406 | 0.0063 | 1 | 3 | L-asparagine transmembrane transporter activity |
| GO:0070728 | 0.0063 | 245.1406 | 0.0063 | 1 | 3 | leucine binding |
| GO:0072345 | 0.0063 | 245.1406 | 0.0063 | 1 | 3 | NAADP-sensitive calcium-release channel activity |
| GO:0022891 | 0.0072 | 3.9788 | 1.7545 | 6 | 836 | substrate-specific transmembrane transporter activity |
| GO:0005216 | 0.0083 | 5.5426 | 0.808 | 4 | 385 | ion channel activity |
| GO:0035368 | 0.0084 | 163.4167 | 0.0084 | 1 | 4 | selenocysteine insertion sequence binding |
| GO:0042134 | 0.0084 | 163.4167 | 0.0084 | 1 | 4 | rRNA primary transcript binding |
| GO:0002039 | 0.0084 | 15.753 | 0.1385 | 2 | 66 | p53 binding |
| GO:0046873 | 0.0085 | 5.4982 | 0.8143 | 4 | 388 | metal ion transmembrane transporter activity |
| GOMFID | Pvalue | OddsRatio | ExpCount | Count | Size | Term |
| GO:0019206 | 7e-04 | 67.7446 | 0.0389 | 2 | 9 | nucleoside kinase activity |
| GO:0004584 | 0.0043 | Inf | 0.0043 | 1 | 1 | dolichyl-phosphate-mannose-glycolipid alpha-mannosyltransferase activity |
| GO:0046570 | 0.0043 | Inf | 0.0043 | 1 | 1 | methylthioribulose 1-phosphate dehydratase activity |
| GO:0086059 | 0.0043 | Inf | 0.0043 | 1 | 1 | voltage-gated calcium channel activity involved SA node cell action potential |
| GO:0019905 | 0.0052 | 9.2178 | 0.3503 | 3 | 81 | syntaxin binding |
| GO:0000010 | 0.0086 | 233.6567 | 0.0086 | 1 | 2 | trans-hexaprenyltranstransferase activity |
| GO:0003977 | 0.0086 | 233.6567 | 0.0086 | 1 | 2 | UDP-N-acetylglucosamine diphosphorylase activity |
| GO:0004137 | 0.0086 | 233.6567 | 0.0086 | 1 | 2 | deoxycytidine kinase activity |
| GO:0004421 | 0.0086 | 233.6567 | 0.0086 | 1 | 2 | hydroxymethylglutaryl-CoA synthase activity |
| GO:0004797 | 0.0086 | 233.6567 | 0.0086 | 1 | 2 | thymidine kinase activity |
| GO:0008147 | 0.0086 | 233.6567 | 0.0086 | 1 | 2 | structural constituent of bone |
| GO:0016603 | 0.0086 | 233.6567 | 0.0086 | 1 | 2 | glutaminyl-peptide cyclotransferase activity |
| GO:0034189 | 0.0086 | 233.6567 | 0.0086 | 1 | 2 | very-low-density lipoprotein particle binding |
| GO:0034437 | 0.0086 | 233.6567 | 0.0086 | 1 | 2 | glycoprotein transporter activity |
| GO:0038025 | 0.0086 | 233.6567 | 0.0086 | 1 | 2 | reelin receptor activity |
| GO:0050347 | 0.0086 | 233.6567 | 0.0086 | 1 | 2 | trans-octaprenyltranstransferase activity |
| GOMFID | Pvalue | OddsRatio | ExpCount | Count | Size | Term |
| GO:0004402 | 0.0013 | 15.1927 | 0.2181 | 3 | 49 | histone acetyltransferase activity |
| GO:0034212 | 0.0021 | 12.9353 | 0.2538 | 3 | 57 | peptide N-acetyltransferase activity |
| GO:0016746 | 0.0032 | 5.4215 | 0.9972 | 5 | 224 | transferase activity, transferring acyl groups |
| GO:0046983 | 0.0033 | 2.7536 | 4.9237 | 12 | 1106 | protein dimerization activity |
| GO:0004584 | 0.0045 | Inf | 0.0045 | 1 | 1 | dolichyl-phosphate-mannose-glycolipid alpha-mannosyltransferase activity |
| GO:0004766 | 0.0045 | Inf | 0.0045 | 1 | 1 | spermidine synthase activity |
| GO:0032427 | 0.0045 | Inf | 0.0045 | 1 | 1 | GBD domain binding |
| GO:0047545 | 0.0045 | Inf | 0.0045 | 1 | 1 | 2-hydroxyglutarate dehydrogenase activity |
| GO:0016407 | 0.0075 | 8.0118 | 0.4007 | 3 | 90 | acetyltransferase activity |
| GO:0016410 | 0.0075 | 8.0118 | 0.4007 | 3 | 90 | N-acyltransferase activity |
| GO:0004019 | 0.0089 | 226.8551 | 0.0089 | 1 | 2 | adenylosuccinate synthase activity |
| GO:0004137 | 0.0089 | 226.8551 | 0.0089 | 1 | 2 | deoxycytidine kinase activity |
| GO:0004667 | 0.0089 | 226.8551 | 0.0089 | 1 | 2 | prostaglandin-D synthase activity |
| GO:0004797 | 0.0089 | 226.8551 | 0.0089 | 1 | 2 | thymidine kinase activity |
| GO:0016603 | 0.0089 | 226.8551 | 0.0089 | 1 | 2 | glutaminyl-peptide cyclotransferase activity |
| GO:0034189 | 0.0089 | 226.8551 | 0.0089 | 1 | 2 | very-low-density lipoprotein particle binding |
| GO:0034437 | 0.0089 | 226.8551 | 0.0089 | 1 | 2 | glycoprotein transporter activity |
| GO:0038025 | 0.0089 | 226.8551 | 0.0089 | 1 | 2 | reelin receptor activity |
| GOMFID | Pvalue | OddsRatio | ExpCount | Count | Size | Term |
| GO:0004843 | 0.0015 | 14.7617 | 0.2239 | 3 | 64 | thiol-dependent ubiquitin-specific protease activity |
| GO:0004197 | 0.0022 | 12.6744 | 0.2588 | 3 | 74 | cysteine-type endopeptidase activity |
| GO:0042393 | 0.0025 | 7.6997 | 0.5666 | 4 | 162 | histone binding |
| GO:0070011 | 0.0034 | 3.9419 | 1.9798 | 7 | 566 | peptidase activity, acting on L-amino acid peptides |
| GO:0008962 | 0.0035 | Inf | 0.0035 | 1 | 1 | phosphatidylglycerophosphatase activity |
| GO:0009673 | 0.0035 | Inf | 0.0035 | 1 | 1 | low-affinity phosphate transmembrane transporter activity |
| GO:0030626 | 0.0035 | Inf | 0.0035 | 1 | 1 | U12 snRNA binding |
| GO:0070611 | 0.0035 | Inf | 0.0035 | 1 | 1 | histone methyltransferase activity (H3-R2 specific) |
| GO:0070612 | 0.0035 | Inf | 0.0035 | 1 | 1 | histone methyltransferase activity (H2A-R3 specific) |
| GO:0101005 | 0.0043 | 9.8762 | 0.3288 | 3 | 94 | ubiquitinyl hydrolase activity |
| GO:0019783 | 0.0059 | 8.8049 | 0.3673 | 3 | 105 | ubiquitin-like protein-specific protease activity |
| GO:0004416 | 0.007 | 290.1481 | 0.007 | 1 | 2 | hydroxyacylglutathione hydrolase activity |
| GO:0004830 | 0.007 | 290.1481 | 0.007 | 1 | 2 | tryptophan-tRNA ligase activity |
| GO:0008193 | 0.007 | 290.1481 | 0.007 | 1 | 2 | tRNA guanylyltransferase activity |
| GO:0030627 | 0.007 | 290.1481 | 0.007 | 1 | 2 | pre-mRNA 5'-splice site binding |
| GO:0034701 | 0.007 | 290.1481 | 0.007 | 1 | 2 | tripeptidase activity |
| GOMFID | Pvalue | OddsRatio | ExpCount | Count | Size | Term |
| GO:0045236 | 0.0023 | 32.5896 | 0.0714 | 2 | 17 | CXCR chemokine receptor binding |
| GO:0030372 | 0.0042 | Inf | 0.0042 | 1 | 1 | high molecular weight B cell growth factor receptor binding |
| GO:0047290 | 0.0042 | Inf | 0.0042 | 1 | 1 | (alpha-N-acetylneuraminyl-2,3-beta-galactosyl-1,3)-N-acetyl-galactosaminide 6-alpha-sialyltransferase activity |
| GO:0019905 | 0.0048 | 9.5116 | 0.34 | 3 | 81 | syntaxin binding |
| GO:0015616 | 0.0084 | 240.8769 | 0.0084 | 1 | 2 | DNA translocase activity |
| GO:0019894 | 0.0089 | 15.2598 | 0.1427 | 2 | 34 | kinesin binding |
| GOMFID | Pvalue | OddsRatio | ExpCount | Count | Size | Term |
| GO:0035877 | 1e-04 | 265.4407 | 0.0155 | 2 | 4 | death effector domain binding |
| GO:0004917 | 0.0039 | Inf | 0.0039 | 1 | 1 | interleukin-7 receptor activity |
| GO:0008241 | 0.0039 | Inf | 0.0039 | 1 | 1 | peptidyl-dipeptidase activity |
| GO:0033737 | 0.0039 | Inf | 0.0039 | 1 | 1 | 1-pyrroline dehydrogenase activity |
| GO:0051736 | 0.0039 | Inf | 0.0039 | 1 | 1 | ATP-dependent polyribonucleotide 5'-hydroxyl-kinase activity |
| GO:0004531 | 0.0077 | 261.0333 | 0.0078 | 1 | 2 | deoxyribonuclease II activity |
| GO:0005006 | 0.0077 | 261.0333 | 0.0078 | 1 | 2 | epidermal growth factor-activated receptor activity |
| GO:0016230 | 0.0077 | 261.0333 | 0.0078 | 1 | 2 | sphingomyelin phosphodiesterase activator activity |
| GO:0034701 | 0.0077 | 261.0333 | 0.0078 | 1 | 2 | tripeptidase activity |
| GO:0097199 | 0.0077 | 261.0333 | 0.0078 | 1 | 2 | cysteine-type endopeptidase activity involved in apoptotic signaling pathway |
| GO:1901981 | 0.0079 | 7.891 | 0.4073 | 3 | 105 | phosphatidylinositol phosphate binding |
| GO:0004180 | 0.0095 | 14.7147 | 0.1474 | 2 | 38 | carboxypeptidase activity |
| GOMFID | Pvalue | OddsRatio | ExpCount | Count | Size | Term |
| GO:0016740 | 0 | 3.1181 | 9.099 | 22 | 2104 | transferase activity |
| GO:0003886 | 1e-04 | 237.1818 | 0.0173 | 2 | 4 | DNA (cytosine-5-)-methyltransferase activity |
| GO:1990381 | 0.0012 | 47.4121 | 0.0519 | 2 | 12 | ubiquitin-specific protease binding |
| GO:0010181 | 0.0019 | 36.4639 | 0.0649 | 2 | 15 | FMN binding |
| GO:0008175 | 0.0027 | 29.6212 | 0.0778 | 2 | 18 | tRNA methyltransferase activity |
| GO:0003867 | 0.0043 | Inf | 0.0043 | 1 | 1 | 4-aminobutyrate transaminase activity |
| GO:0004139 | 0.0043 | Inf | 0.0043 | 1 | 1 | deoxyribose-phosphate aldolase activity |
| GO:0004588 | 0.0043 | Inf | 0.0043 | 1 | 1 | orotate phosphoribosyltransferase activity |
| GO:0004590 | 0.0043 | Inf | 0.0043 | 1 | 1 | orotidine-5'-phosphate decarboxylase activity |
| GO:0008995 | 0.0043 | Inf | 0.0043 | 1 | 1 | ribonuclease E activity |
| GO:0032145 | 0.0043 | Inf | 0.0043 | 1 | 1 | succinate-semialdehyde dehydrogenase binding |
| GO:0046316 | 0.0043 | Inf | 0.0043 | 1 | 1 | gluconokinase activity |
| GO:0047298 | 0.0043 | Inf | 0.0043 | 1 | 1 | (S)-3-amino-2-methylpropionate transaminase activity |
| GO:0050518 | 0.0043 | Inf | 0.0043 | 1 | 1 | 2-C-methyl-D-erythritol 4-phosphate cytidylyltransferase activity |
| GO:0051736 | 0.0043 | Inf | 0.0043 | 1 | 1 | ATP-dependent polyribonucleotide 5'-hydroxyl-kinase activity |
| GO:0019199 | 0.0052 | 9.2178 | 0.3503 | 3 | 81 | transmembrane receptor protein kinase activity |
| GO:0004416 | 0.0086 | 233.6567 | 0.0086 | 1 | 2 | hydroxyacylglutathione hydrolase activity |
| GO:0005006 | 0.0086 | 233.6567 | 0.0086 | 1 | 2 | epidermal growth factor-activated receptor activity |
| GO:0005147 | 0.0086 | 233.6567 | 0.0086 | 1 | 2 | oncostatin-M receptor binding |
| GO:0032093 | 0.0086 | 233.6567 | 0.0086 | 1 | 2 | SAM domain binding |
| GO:0045174 | 0.0086 | 233.6567 | 0.0086 | 1 | 2 | glutathione dehydrogenase (ascorbate) activity |
| GO:0050610 | 0.0086 | 233.6567 | 0.0086 | 1 | 2 | methylarsonate reductase activity |
| GOMFID | Pvalue | OddsRatio | ExpCount | Count | Size | Term |
| GO:0031769 | 0.0033 | Inf | 0.0033 | 1 | 1 | glucagon receptor binding |
| GO:0032427 | 0.0033 | Inf | 0.0033 | 1 | 1 | GBD domain binding |
| GO:0043136 | 0.0033 | Inf | 0.0033 | 1 | 1 | glycerol-3-phosphatase activity |
| GO:0008967 | 0.0066 | 307.2745 | 0.0066 | 1 | 2 | phosphoglycolate phosphatase activity |
| GO:0061676 | 0.0066 | 307.2745 | 0.0066 | 1 | 2 | importin-alpha family protein binding |
| GO:0015018 | 0.0099 | 153.6275 | 0.0099 | 1 | 3 | galactosylgalactosylxylosylprotein 3-beta-glucuronosyltransferase activity |
| GO:0016309 | 0.0099 | 153.6275 | 0.0099 | 1 | 3 | 1-phosphatidylinositol-5-phosphate 4-kinase activity |
| GO:0071209 | 0.0099 | 153.6275 | 0.0099 | 1 | 3 | U7 snRNA binding |
| GOMFID | Pvalue | OddsRatio | ExpCount | Count | Size | Term |
| GO:0004725 | 0.0029 | 11.5501 | 0.284 | 3 | 95 | protein tyrosine phosphatase activity |
| GO:0003851 | 0.003 | Inf | 0.003 | 1 | 1 | 2-hydroxyacylsphingosine 1-beta-galactosyltransferase activity |
| GO:0004489 | 0.003 | Inf | 0.003 | 1 | 1 | methylenetetrahydrofolate reductase (NAD(P)H) activity |
| GO:0008466 | 0.003 | Inf | 0.003 | 1 | 1 | glycogenin glucosyltransferase activity |
| GO:0008489 | 0.003 | Inf | 0.003 | 1 | 1 | UDP-galactose:glucosylceramide beta-1,4-galactosyltransferase activity |
| GO:0004693 | 0.0036 | 24.8397 | 0.0897 | 2 | 30 | cyclin-dependent protein serine/threonine kinase activity |
| GO:0004066 | 0.006 | 340.7826 | 0.006 | 1 | 2 | asparagine synthase (glutamine-hydrolyzing) activity |
| GOMFID | Pvalue | OddsRatio | ExpCount | Count | Size | Term |
| GO:0004489 | 0.0029 | Inf | 0.0029 | 1 | 1 | methylenetetrahydrofolate reductase (NAD(P)H) activity |
| GO:0019782 | 0.0029 | Inf | 0.0029 | 1 | 1 | ISG15 activating enzyme activity |
| GO:0031707 | 0.0029 | Inf | 0.0029 | 1 | 1 | endothelin A receptor binding |
| GO:0004066 | 0.0057 | 356.3182 | 0.0057 | 1 | 2 | asparagine synthase (glutamine-hydrolyzing) activity |
| GO:0008670 | 0.0057 | 356.3182 | 0.0057 | 1 | 2 | 2,4-dienoyl-CoA reductase (NADPH) activity |
| GO:0050661 | 0.0061 | 18.6524 | 0.1173 | 2 | 41 | NADP binding |
| GO:0008502 | 0.0086 | 178.1477 | 0.0086 | 1 | 3 | melatonin receptor activity |
| GO:0031708 | 0.0086 | 178.1477 | 0.0086 | 1 | 3 | endothelin B receptor binding |
| GO:0061578 | 0.0086 | 178.1477 | 0.0086 | 1 | 3 | Lys63-specific deubiquitinase activity |
| GOMFID | Pvalue | OddsRatio | ExpCount | Count | Size | Term |
| GO:0008502 | 0.0057 | 270.5517 | 0.0057 | 1 | 3 | melatonin receptor activity |
| GO:0061578 | 0.0057 | 270.5517 | 0.0057 | 1 | 3 | Lys63-specific deubiquitinase activity |
| GO:0015467 | 0.0076 | 180.3563 | 0.0076 | 1 | 4 | G-protein activated inward rectifier potassium channel activity |
| GOMFID | Pvalue | OddsRatio | ExpCount | Count | Size | Term |
| GO:0070699 | 0.0011 | 1571.6 | 0.0011 | 1 | 3 | type II activin receptor binding |
| GO:0034711 | 0.0019 | 785.7 | 0.0019 | 1 | 5 | inhibin binding |
| GO:0019870 | 0.003 | 448.8857 | 0.0031 | 1 | 8 | potassium channel inhibitor activity |
| GO:0015271 | 0.0034 | 392.75 | 0.0034 | 1 | 9 | outward rectifier potassium channel activity |
| GO:0070696 | 0.0053 | 241.6154 | 0.0053 | 1 | 14 | transmembrane receptor protein serine/threonine kinase binding |
| GO:0022841 | 0.0061 | 209.3733 | 0.0061 | 1 | 16 | potassium ion leak channel activity |
| GO:0022842 | 0.0065 | 196.275 | 0.0065 | 1 | 17 | narrow pore channel activity |
| GOMFID | Pvalue | OddsRatio | ExpCount | Count | Size | Term |
| GO:0008811 | 9e-04 | Inf | 9e-04 | 1 | 1 | chloramphenicol O-acetyltransferase activity |
| GO:0033040 | 0.0018 | 1208.3846 | 0.0018 | 1 | 2 | sour taste receptor activity |
| GO:0070538 | 0.0018 | 1208.3846 | 0.0018 | 1 | 2 | oleic acid binding |
| GO:0005324 | 0.0027 | 604.1538 | 0.0027 | 1 | 3 | long-chain fatty acid transporter activity |
| GO:0070699 | 0.0027 | 604.1538 | 0.0027 | 1 | 3 | type II activin receptor binding |
| GO:0004222 | 0.0038 | 25.254 | 0.0935 | 2 | 105 | metalloendopeptidase activity |
| GO:0034711 | 0.0044 | 302.0385 | 0.0045 | 1 | 5 | inhibin binding |
| GO:0050543 | 0.0053 | 241.6154 | 0.0053 | 1 | 6 | icosatetraenoic acid binding |
| GOMFID | Pvalue | OddsRatio | ExpCount | Count | Size | Term |
| GO:0016645 | 0.0029 | 27.75 | 0.081 | 2 | 26 | oxidoreductase activity, acting on the CH-NH group of donors |
| GO:0004486 | 0.0031 | Inf | 0.0031 | 1 | 1 | methylenetetrahydrofolate dehydrogenase [NAD(P)+] activity |
| GO:0004642 | 0.0031 | Inf | 0.0031 | 1 | 1 | phosphoribosylformylglycinamidine synthase activity |
| GO:0008721 | 0.0031 | Inf | 0.0031 | 1 | 1 | D-serine ammonia-lyase activity |
| GO:0018114 | 0.0031 | Inf | 0.0031 | 1 | 1 | threonine racemase activity |
| GO:0030378 | 0.0031 | Inf | 0.0031 | 1 | 1 | serine racemase activity |
| GO:0031751 | 0.0031 | Inf | 0.0031 | 1 | 1 | D4 dopamine receptor binding |
| GO:0036361 | 0.0031 | Inf | 0.0031 | 1 | 1 | racemase activity, acting on amino acids and derivatives |
| GO:0045503 | 0.0031 | Inf | 0.0031 | 1 | 1 | dynein light chain binding |
| GO:0047598 | 0.0031 | Inf | 0.0031 | 1 | 1 | 7-dehydrocholesterol reductase activity |
| GO:0097573 | 0.0031 | Inf | 0.0031 | 1 | 1 | glutathione oxidoreductase activity |
| GO:0015144 | 0.0053 | 20.1702 | 0.1091 | 2 | 35 | carbohydrate transmembrane transporter activity |
| GO:0004109 | 0.0062 | 326.5417 | 0.0062 | 1 | 2 | coproporphyrinogen oxidase activity |
| GO:0004146 | 0.0062 | 326.5417 | 0.0062 | 1 | 2 | dihydrofolate reductase activity |
| GO:0004329 | 0.0062 | 326.5417 | 0.0062 | 1 | 2 | formate-tetrahydrofolate ligase activity |
| GO:0004356 | 0.0062 | 326.5417 | 0.0062 | 1 | 2 | glutamate-ammonia ligase activity |
| GO:0005462 | 0.0062 | 326.5417 | 0.0062 | 1 | 2 | UDP-N-acetylglucosamine transmembrane transporter activity |
| GO:0016880 | 0.0062 | 326.5417 | 0.0062 | 1 | 2 | acid-ammonia (or amide) ligase activity |
| GO:0038025 | 0.0062 | 326.5417 | 0.0062 | 1 | 2 | reelin receptor activity |
| GO:0003941 | 0.0093 | 163.2604 | 0.0093 | 1 | 3 | L-serine ammonia-lyase activity |
| GO:0004351 | 0.0093 | 163.2604 | 0.0093 | 1 | 3 | glutamate decarboxylase activity |
| GO:0004477 | 0.0093 | 163.2604 | 0.0093 | 1 | 3 | methenyltetrahydrofolate cyclohydrolase activity |
| GO:0004487 | 0.0093 | 163.2604 | 0.0093 | 1 | 3 | methylenetetrahydrofolate dehydrogenase (NAD+) activity |
| GO:0004488 | 0.0093 | 163.2604 | 0.0093 | 1 | 3 | methylenetetrahydrofolate dehydrogenase (NADP+) activity |
| GO:0005290 | 0.0093 | 163.2604 | 0.0093 | 1 | 3 | L-histidine transmembrane transporter activity |
| GO:0015182 | 0.0093 | 163.2604 | 0.0093 | 1 | 3 | L-asparagine transmembrane transporter activity |
| GO:0031749 | 0.0093 | 163.2604 | 0.0093 | 1 | 3 | D2 dopamine receptor binding |
| GO:0031750 | 0.0093 | 163.2604 | 0.0093 | 1 | 3 | D3 dopamine receptor binding |
| GO:0031752 | 0.0093 | 163.2604 | 0.0093 | 1 | 3 | D5 dopamine receptor binding |
| GO:0050897 | 0.0093 | 163.2604 | 0.0093 | 1 | 3 | cobalt ion binding |
| GOMFID | Pvalue | OddsRatio | ExpCount | Count | Size | Term |
| GO:0019843 | 8e-04 | 18.5217 | 0.1807 | 3 | 49 | rRNA binding |
| GO:0004252 | 0.0021 | 8.0409 | 0.5422 | 4 | 147 | serine-type endopeptidase activity |
| GO:0003983 | 0.0037 | Inf | 0.0037 | 1 | 1 | UTP:glucose-1-phosphate uridylyltransferase activity |
| GO:0004149 | 0.0037 | Inf | 0.0037 | 1 | 1 | dihydrolipoyllysine-residue succinyltransferase activity |
| GO:0004990 | 0.0037 | Inf | 0.0037 | 1 | 1 | oxytocin receptor activity |
| GO:0030348 | 0.0037 | Inf | 0.0037 | 1 | 1 | syntaxin-3 binding |
| GO:0035851 | 0.0037 | Inf | 0.0037 | 1 | 1 | Krueppel-associated box domain binding |
| GO:1990259 | 0.0037 | Inf | 0.0037 | 1 | 1 | histone-glutamine methyltransferase activity |
| GO:1990583 | 0.0037 | Inf | 0.0037 | 1 | 1 | phospholipase D activator activity |
| GO:0017171 | 0.0038 | 6.7925 | 0.6381 | 4 | 173 | serine hydrolase activity |
| GO:0001147 | 0.0074 | 274.8246 | 0.0074 | 1 | 2 | transcription termination site sequence-specific DNA binding |
| GO:0004421 | 0.0074 | 274.8246 | 0.0074 | 1 | 2 | hydroxymethylglutaryl-CoA synthase activity |
| GO:0004739 | 0.0074 | 274.8246 | 0.0074 | 1 | 2 | pyruvate dehydrogenase (acetyl-transferring) activity |
| GO:0004962 | 0.0074 | 274.8246 | 0.0074 | 1 | 2 | endothelin receptor activity |
| GO:0016422 | 0.0074 | 274.8246 | 0.0074 | 1 | 2 | mRNA (2'-O-methyladenosine-N6-)-methyltransferase activity |
| GO:0016748 | 0.0074 | 274.8246 | 0.0074 | 1 | 2 | succinyltransferase activity |
| GO:0048257 | 0.0074 | 274.8246 | 0.0074 | 1 | 2 | 3'-flap endonuclease activity |
| GO:0050252 | 0.0074 | 274.8246 | 0.0074 | 1 | 2 | retinol O-fatty-acyltransferase activity |
| GO:0044822 | 0.0074 | 2.7293 | 4.135 | 10 | 1121 | poly(A) RNA binding |
| GOMFID | Pvalue | OddsRatio | ExpCount | Count | Size | Term |
| GO:0045503 | 0.0017 | Inf | 0.0017 | 1 | 1 | dynein light chain binding |
| GO:0004146 | 0.0034 | 603.6923 | 0.0034 | 1 | 2 | dihydrofolate reductase activity |
| GO:0004356 | 0.0034 | 603.6923 | 0.0034 | 1 | 2 | glutamate-ammonia ligase activity |
| GO:0004830 | 0.0034 | 603.6923 | 0.0034 | 1 | 2 | tryptophan-tRNA ligase activity |
| GO:0016880 | 0.0034 | 603.6923 | 0.0034 | 1 | 2 | acid-ammonia (or amide) ligase activity |
| GO:0004351 | 0.0051 | 301.8269 | 0.0052 | 1 | 3 | glutamate decarboxylase activity |
| GO:0051870 | 0.0051 | 301.8269 | 0.0052 | 1 | 3 | methotrexate binding |
| GO:0015016 | 0.0069 | 201.2051 | 0.0069 | 1 | 4 | [heparan sulfate]-glucosamine N-sulfotransferase activity |
| GO:0005432 | 0.0086 | 150.8942 | 0.0086 | 1 | 5 | calcium:sodium antiporter activity |
| GOMFID | Pvalue | OddsRatio | ExpCount | Count | Size | Term |
| GO:0004061 | 0.003 | Inf | 0.003 | 1 | 1 | arylformamidase activity |
| GO:0004671 | 0.003 | Inf | 0.003 | 1 | 1 | protein C-terminal S-isoprenylcysteine carboxyl O-methyltransferase activity |
| GO:0016517 | 0.003 | Inf | 0.003 | 1 | 1 | interleukin-12 receptor activity |
| GO:0031768 | 0.003 | Inf | 0.003 | 1 | 1 | ghrelin receptor binding |
| GO:0045503 | 0.003 | Inf | 0.003 | 1 | 1 | dynein light chain binding |
| GO:0001631 | 0.006 | 340.7826 | 0.006 | 1 | 2 | cysteinyl leukotriene receptor activity |
| GO:0004356 | 0.006 | 340.7826 | 0.006 | 1 | 2 | glutamate-ammonia ligase activity |
| GO:0004449 | 0.006 | 340.7826 | 0.006 | 1 | 2 | isocitrate dehydrogenase (NAD+) activity |
| GO:0015501 | 0.006 | 340.7826 | 0.006 | 1 | 2 | glutamate:sodium symporter activity |
| GO:0016608 | 0.006 | 340.7826 | 0.006 | 1 | 2 | growth hormone-releasing hormone activity |
| GO:0016880 | 0.006 | 340.7826 | 0.006 | 1 | 2 | acid-ammonia (or amide) ligase activity |
| GO:0042019 | 0.006 | 340.7826 | 0.006 | 1 | 2 | interleukin-23 binding |
| GO:0042020 | 0.006 | 340.7826 | 0.006 | 1 | 2 | interleukin-23 receptor activity |
| GO:0032813 | 0.0076 | 16.545 | 0.1315 | 2 | 44 | tumor necrosis factor receptor superfamily binding |
| GO:0004351 | 0.0089 | 170.3804 | 0.009 | 1 | 3 | glutamate decarboxylase activity |
| GO:0031871 | 0.0089 | 170.3804 | 0.009 | 1 | 3 | proteinase activated receptor binding |
| GO:0050897 | 0.0089 | 170.3804 | 0.009 | 1 | 3 | cobalt ion binding |
| GOMFID | Pvalue | OddsRatio | ExpCount | Count | Size | Term |
| GO:0008783 | 0.0019 | Inf | 0.0019 | 1 | 1 | agmatinase activity |
| GO:0004601 | 0.0021 | 32.8992 | 0.0687 | 2 | 36 | peroxidase activity |
| GO:0004666 | 0.0038 | 541.1379 | 0.0038 | 1 | 2 | prostaglandin-endoperoxide synthase activity |
| GO:0045029 | 0.0038 | 541.1379 | 0.0038 | 1 | 2 | UDP-activated nucleotide receptor activity |
| GO:0046899 | 0.0038 | 541.1379 | 0.0038 | 1 | 2 | nucleoside triphosphate adenylate kinase activity |
| GO:0048257 | 0.0038 | 541.1379 | 0.0038 | 1 | 2 | 3'-flap endonuclease activity |
| GO:0060002 | 0.0057 | 270.5517 | 0.0057 | 1 | 3 | plus-end directed microfilament motor activity |
| GO:0071553 | 0.0057 | 270.5517 | 0.0057 | 1 | 3 | G-protein coupled pyrimidinergic nucleotide receptor activity |
| NA. |
| n/a |
| NA. |
| n/a |
| NA. |
| n/a |
| NA. |
| n/a |
| NA. |
| n/a |
| NA. |
| n/a |
| NA. |
| n/a |
| NA. |
| n/a |
| NA. |
| n/a |
| NA. |
| n/a |
| NA. |
| n/a |
| NA. |
| n/a |
| NA. |
| n/a |
| NA. |
| n/a |
| NA. |
| n/a |
| NA. |
| n/a |
| NA. |
| n/a |
| NA. |
| n/a |
| NA. |
| n/a |
| NA. |
| n/a |
| NA. |
| n/a |
| NA. |
| n/a |
| NA. |
| n/a |
| NA. |
| n/a |
| NA. |
| n/a |
| NA. |
| n/a |
| NA. |
| n/a |
| NA. |
| n/a |
| NA. |
| n/a |
| NA. |
| n/a |
| NA. |
| n/a |
| NA. |
| n/a |
| NA. |
| n/a |
| NA. |
| n/a |
| NA. |
| n/a |
| NA. |
| n/a |
| NA. |
| n/a |
| NA. |
| n/a |
| NA. |
| n/a |
| NA. |
| n/a |
| NA. |
| n/a |
| NA. |
| n/a |
| NA. |
| n/a |
| NA. |
| n/a |
| NA. |
| n/a |
| NA. |
| n/a |
| NA. |
| n/a |
| NA. |
| n/a |
| NA. |
| n/a |
| NA. |
| n/a |
| NA. |
| n/a |
| NA. |
| n/a |
| NA. |
| n/a |
| NA. |
| n/a |
| NA. |
| n/a |
| NA. |
| n/a |
| NA. |
| n/a |
| NA. |
| n/a |
| NA. |
| n/a |
| NA. |
| n/a |
| NA. |
| n/a |
| NA. |
| n/a |
| NA. |
| n/a |
| NA. |
| n/a |
| NA. |
| n/a |
| NA. |
| n/a |
| NA. |
| n/a |
| NA. |
| n/a |
| NA. |
| n/a |
| NA. |
| n/a |
| NA. |
| n/a |
| NA. |
| n/a |
| NA. |
| n/a |
| NA. |
| n/a |
| NA. |
| n/a |
| NA. |
| n/a |
| NA. |
| n/a |
| NA. |
| n/a |
| NA. |
| n/a |
| NA. |
| n/a |
| NA. |
| n/a |
| NA. |
| n/a |
| NA. |
| n/a |
| NA. |
| n/a |
| NA. |
| n/a |
| NA. |
| n/a |
| NA. |
| n/a |
| NA. |
| n/a |
| NA. |
| n/a |
| NA. |
| n/a |
| NA. |
| n/a |
| NA. |
| n/a |
| NA. |
| n/a |
| NA. |
| n/a |
| NA. |
| n/a |
| NA. |
| n/a |
| NA. |
| n/a |
| NA. |
| n/a |
| NA. |
| n/a |
| NA. |
| n/a |
| NA. |
| n/a |
| NA. |
| n/a |
| NA. |
| n/a |
| NA. |
| n/a |
| NA. |
| n/a |
| NA. |
| n/a |
| NA. |
| n/a |
| NA. |
| n/a |
| NA. |
| n/a |
| NA. |
| n/a |
| NA. |
| n/a |
| NA. |
| n/a |
| GOMFID | Pvalue | OddsRatio | ExpCount | Count | Size | Term |
| GO:0000184 | 0 | 8.8737 | 0.8791 | 7 | 114 | nuclear-transcribed mRNA catabolic process, nonsense-mediated decay |
| GO:0019083 | 1e-04 | 6.1219 | 1.4343 | 8 | 186 | viral transcription |
| GO:0044033 | 2e-04 | 5.4684 | 1.5963 | 8 | 207 | multi-organism metabolic process |
| GO:0016259 | 5e-04 | 8.4521 | 0.6478 | 5 | 84 | selenocysteine metabolic process |
| GO:0006612 | 5e-04 | 5.3707 | 1.4112 | 7 | 183 | protein targeting to membrane |
| GO:0061087 | 6e-04 | 87.2101 | 0.0386 | 2 | 5 | positive regulation of histone H3-K27 methylation |
| GO:0006402 | 0.001 | 4.8414 | 1.5577 | 7 | 202 | mRNA catabolic process |
| GO:0048024 | 0.001 | 10.0094 | 0.4396 | 4 | 57 | regulation of mRNA splicing, via spliceosome |
| GO:0006614 | 0.0012 | 6.8757 | 0.7866 | 5 | 102 | SRP-dependent cotranslational protein targeting to membrane |
| GO:0072599 | 0.0016 | 6.3485 | 0.8483 | 5 | 110 | establishment of protein localization to endoplasmic reticulum |
| GO:0008380 | 0.0016 | 3.5673 | 2.7144 | 9 | 352 | RNA splicing |
| GO:0016482 | 0.002 | 2.28 | 9.2152 | 19 | 1195 | cytoplasmic transport |
| GO:0019058 | 0.002 | 3.2026 | 3.3622 | 10 | 436 | viral life cycle |
| GO:0006370 | 0.0021 | 13.1695 | 0.2545 | 3 | 33 | 7-methylguanosine mRNA capping |
| GO:0006406 | 0.0024 | 7.6804 | 0.5629 | 4 | 73 | mRNA export from nucleus |
| GO:0031058 | 0.0028 | 7.359 | 0.5861 | 4 | 76 | positive regulation of histone modification |
| GO:0036260 | 0.0029 | 11.6171 | 0.2853 | 3 | 37 | RNA capping |
| GO:0044764 | 0.003 | 2.5046 | 6.0689 | 14 | 787 | multi-organism cellular process |
| GO:0044403 | 0.0039 | 2.422 | 6.2617 | 14 | 812 | symbiosis, encompassing mutualism through parasitism |
| GO:0071426 | 0.0042 | 6.5375 | 0.6555 | 4 | 85 | ribonucleoprotein complex export from nucleus |
| GO:0051770 | 0.0044 | 23.7723 | 0.1002 | 2 | 13 | positive regulation of nitric-oxide synthase biosynthetic process |
| GO:0000377 | 0.0044 | 3.6586 | 2.0358 | 7 | 264 | RNA splicing, via transesterification reactions with bulged adenosine as nucleophile |
| GO:0006414 | 0.0048 | 4.0925 | 1.5577 | 6 | 202 | translational elongation |
| GO:0006369 | 0.005 | 9.3995 | 0.347 | 3 | 45 | termination of RNA polymerase II transcription |
| GO:0006364 | 0.0056 | 4.6831 | 1.1336 | 5 | 147 | rRNA processing |
| GO:0042274 | 0.0057 | 8.9711 | 0.3624 | 3 | 47 | ribosomal small subunit biogenesis |
| GO:0016070 | 0.0058 | 1.6534 | 32.843 | 46 | 4259 | RNA metabolic process |
| GO:0006450 | 0.0058 | 20.1125 | 0.1157 | 2 | 15 | regulation of translational fidelity |
| GO:0045725 | 0.0058 | 20.1125 | 0.1157 | 2 | 15 | positive regulation of glycogen biosynthetic process |
| GO:0030195 | 0.0067 | 8.3969 | 0.3856 | 3 | 50 | negative regulation of blood coagulation |
| GO:0009059 | 0.0069 | 1.6133 | 37.7474 | 51 | 4895 | macromolecule biosynthetic process |
| GO:0009372 | 0.0077 | Inf | 0.0077 | 1 | 1 | quorum sensing |
| GO:0018395 | 0.0077 | Inf | 0.0077 | 1 | 1 | peptidyl-lysine hydroxylation to 5-hydroxy-L-lysine |
| GO:0021512 | 0.0077 | Inf | 0.0077 | 1 | 1 | spinal cord anterior/posterior patterning |
| GO:0033552 | 0.0077 | Inf | 0.0077 | 1 | 1 | response to vitamin B3 |
| GO:0035684 | 0.0077 | Inf | 0.0077 | 1 | 1 | helper T cell extravasation |
| GO:0052106 | 0.0077 | Inf | 0.0077 | 1 | 1 | quorum sensing involved in interaction with host |
| GO:0060731 | 0.0077 | Inf | 0.0077 | 1 | 1 | positive regulation of intestinal epithelial structure maintenance |
| GO:0070078 | 0.0077 | Inf | 0.0077 | 1 | 1 | histone H3-R2 demethylation |
| GO:0070079 | 0.0077 | Inf | 0.0077 | 1 | 1 | histone H4-R3 demethylation |
| GO:0070084 | 0.0077 | Inf | 0.0077 | 1 | 1 | protein initiator methionine removal |
| GO:0070715 | 0.0077 | Inf | 0.0077 | 1 | 1 | sodium-dependent organic cation transport |
| GO:0097310 | 0.0077 | Inf | 0.0077 | 1 | 1 | cap2 mRNA methylation |
| GO:1901608 | 0.0077 | Inf | 0.0077 | 1 | 1 | regulation of vesicle transport along microtubule |
| GO:1901676 | 0.0077 | Inf | 0.0077 | 1 | 1 | positive regulation of histone H3-K27 acetylation |
| GO:1902684 | 0.0077 | Inf | 0.0077 | 1 | 1 | negative regulation of receptor localization to synapse |
| GO:1903743 | 0.0077 | Inf | 0.0077 | 1 | 1 | negative regulation of anterograde synaptic vesicle transport |
| GO:0006385 | 0.0083 | 16.3382 | 0.1388 | 2 | 18 | transcription elongation from RNA polymerase III promoter |
| GO:0006386 | 0.0083 | 16.3382 | 0.1388 | 2 | 18 | termination of RNA polymerase III transcription |
| GO:0019359 | 0.0083 | 16.3382 | 0.1388 | 2 | 18 | nicotinamide nucleotide biosynthetic process |
| GO:0031060 | 0.0083 | 7.7363 | 0.4164 | 3 | 54 | regulation of histone methylation |
| GO:0006397 | 0.0091 | 2.9014 | 2.924 | 8 | 388 | mRNA processing |
| GO:0098792 | 0.0091 | 5.1845 | 0.8174 | 4 | 106 | xenophagy |
| GO:0034655 | 0.0094 | 2.8844 | 2.9381 | 8 | 381 | nucleobase-containing compound catabolic process |
| GO:0007259 | 0.0097 | 4.0742 | 1.2955 | 5 | 168 | JAK-STAT cascade |
| GOMFID | Pvalue | OddsRatio | ExpCount | Count | Size | Term |
| GO:0018153 | 0.0027 | Inf | 0.0027 | 1 | 1 | isopeptide cross-linking via N6-(L-isoglutamyl)-L-lysine |
| GO:0072334 | 0.0027 | Inf | 0.0027 | 1 | 1 | UDP-galactose transmembrane transport |
| GO:1903488 | 0.0027 | Inf | 0.0027 | 1 | 1 | negative regulation of lactation |
| GO:0007608 | 0.0037 | 5.3434 | 1.0466 | 5 | 391 | sensory perception of smell |
| GO:0071377 | 0.0046 | 21.6847 | 0.1017 | 2 | 38 | cellular response to glucagon stimulus |
| GO:0050976 | 0.0053 | 381.6585 | 0.0054 | 1 | 2 | detection of mechanical stimulus involved in sensory perception of touch |
| GO:1902626 | 0.0053 | 381.6585 | 0.0054 | 1 | 2 | assembly of large subunit precursor of preribosome |
| GO:0050906 | 0.0073 | 4.5229 | 1.2286 | 5 | 459 | detection of stimulus involved in sensory perception |
| GO:0046013 | 0.008 | 190.8171 | 0.008 | 1 | 3 | regulation of T cell homeostatic proliferation |
| GOMFID | Pvalue | OddsRatio | ExpCount | Count | Size | Term |
| GO:0007186 | 0 | 3.6369 | 5.9623 | 18 | 1155 | G-protein coupled receptor signaling pathway |
| GO:0007631 | 2e-04 | 10.1023 | 0.5472 | 5 | 106 | feeding behavior |
| GO:2000503 | 4e-04 | 98.7722 | 0.031 | 2 | 6 | positive regulation of natural killer cell chemotaxis |
| GO:0060455 | 5e-04 | 79.0127 | 0.0361 | 2 | 7 | negative regulation of gastric acid secretion |
| GO:1903901 | 0.001 | 9.8372 | 0.4439 | 4 | 86 | negative regulation of viral life cycle |
| GO:0043922 | 0.0017 | 39.4937 | 0.0619 | 2 | 12 | negative regulation by host of viral transcription |
| GO:0060456 | 0.002 | 35.901 | 0.0671 | 2 | 13 | positive regulation of digestive system process |
| GO:0050729 | 0.0027 | 7.4565 | 0.5782 | 4 | 112 | positive regulation of inflammatory response |
| GO:0002548 | 0.0035 | 10.6827 | 0.3046 | 3 | 59 | monocyte chemotaxis |
| GO:0007625 | 0.0038 | 24.6741 | 0.0929 | 2 | 18 | grooming behavior |
| GO:0007608 | 0.004 | 3.7508 | 2.0184 | 7 | 391 | sensory perception of smell |
| GO:1901623 | 0.0047 | 21.9297 | 0.1032 | 2 | 20 | regulation of lymphocyte chemotaxis |
| GO:0030500 | 0.0048 | 9.4915 | 0.3407 | 3 | 66 | regulation of bone mineralization |
| GO:0050907 | 0.0051 | 3.5878 | 2.1062 | 7 | 408 | detection of chemical stimulus involved in sensory perception |
| GO:0010053 | 0.0052 | Inf | 0.0052 | 1 | 1 | root epidermal cell differentiation |
| GO:0016260 | 0.0052 | Inf | 0.0052 | 1 | 1 | selenocysteine biosynthetic process |
| GO:0018192 | 0.0052 | Inf | 0.0052 | 1 | 1 | enzyme active site formation via cysteine modification to L-cysteine persulfide |
| GO:0034157 | 0.0052 | Inf | 0.0052 | 1 | 1 | positive regulation of toll-like receptor 7 signaling pathway |
| GO:0048364 | 0.0052 | Inf | 0.0052 | 1 | 1 | root development |
| GO:0048764 | 0.0052 | Inf | 0.0052 | 1 | 1 | trichoblast maturation |
| GO:0051355 | 0.0052 | Inf | 0.0052 | 1 | 1 | proprioception involved in equilibrioception |
| GO:0080147 | 0.0052 | Inf | 0.0052 | 1 | 1 | root hair cell development |
| GO:1902891 | 0.0052 | Inf | 0.0052 | 1 | 1 | negative regulation of root hair elongation |
| GO:1903888 | 0.0052 | Inf | 0.0052 | 1 | 1 | regulation of plant epidermal cell differentiation |
| GO:2000067 | 0.0052 | Inf | 0.0052 | 1 | 1 | regulation of root morphogenesis |
| GO:2001208 | 0.0052 | Inf | 0.0052 | 1 | 1 | negative regulation of transcription elongation from RNA polymerase I promoter |
| GO:0009651 | 0.0052 | 20.7742 | 0.1084 | 2 | 21 | response to salt stress |
| GO:0052472 | 0.0052 | 20.7742 | 0.1084 | 2 | 21 | modulation by host of symbiont transcription |
| GO:0071346 | 0.0054 | 6.0913 | 0.7021 | 4 | 136 | cellular response to interferon-gamma |
| GO:0030819 | 0.0066 | 8.4177 | 0.382 | 3 | 74 | positive regulation of cAMP biosynthetic process |
| GO:0072676 | 0.0069 | 8.3002 | 0.3872 | 3 | 75 | lymphocyte migration |
| GO:0006401 | 0.0069 | 4.4783 | 1.1925 | 5 | 231 | RNA catabolic process |
| GO:0043901 | 0.0076 | 5.5022 | 0.7743 | 4 | 150 | negative regulation of multi-organism process |
| GO:0070098 | 0.0079 | 7.8613 | 0.4078 | 3 | 79 | chemokine-mediated signaling pathway |
| GO:0055123 | 0.0085 | 5.3183 | 0.8001 | 4 | 155 | digestive system development |
| GO:0050877 | 0.0087 | 2.304 | 6.2411 | 13 | 1209 | neurological system process |
| GO:0060337 | 0.0088 | 7.5613 | 0.4233 | 3 | 82 | type I interferon signaling pathway |
| GO:0050706 | 0.0098 | 14.6113 | 0.1497 | 2 | 29 | regulation of interleukin-1 beta secretion |
| GO:0030593 | 0.01 | 7.1951 | 0.4439 | 3 | 86 | neutrophil chemotaxis |
| GO:0034340 | 0.01 | 7.1951 | 0.4439 | 3 | 86 | response to type I interferon |
| GOMFID | Pvalue | OddsRatio | ExpCount | Count | Size | Term |
| GO:0006054 | 1e-04 | 45.0786 | 0.1066 | 3 | 8 | N-acetylneuraminate metabolic process |
| GO:0006412 | 2e-04 | 2.6899 | 8.0718 | 20 | 606 | translation |
| GO:1901844 | 2e-04 | 37.5631 | 0.1199 | 3 | 9 | regulation of cell communication by electrical coupling involved in cardiac conduction |
| GO:0006518 | 4e-04 | 2.3877 | 9.9765 | 22 | 749 | peptide metabolic process |
| GO:0043604 | 5e-04 | 2.4129 | 9.4037 | 21 | 706 | amide biosynthetic process |
| GO:0001933 | 6e-04 | 2.9819 | 5.0349 | 14 | 378 | negative regulation of protein phosphorylation |
| GO:1904874 | 8e-04 | 20.4823 | 0.1865 | 3 | 14 | positive regulation of telomerase RNA localization to Cajal body |
| GO:0050685 | 9e-04 | 10.3973 | 0.4396 | 4 | 33 | positive regulation of mRNA processing |
| GO:0090670 | 9e-04 | 18.7743 | 0.1998 | 3 | 15 | RNA localization to Cajal body |
| GO:0090672 | 9e-04 | 18.7743 | 0.1998 | 3 | 15 | telomerase RNA localization |
| GO:0061312 | 0.0017 | 49.8519 | 0.0666 | 2 | 5 | BMP signaling pathway involved in heart development |
| GO:0010608 | 0.002 | 2.581 | 5.7674 | 14 | 433 | posttranscriptional regulation of gene expression |
| GO:0031119 | 0.0026 | 37.3865 | 0.0799 | 2 | 6 | tRNA pseudouridine synthesis |
| GO:0000398 | 0.0029 | 3.0127 | 3.5164 | 10 | 264 | mRNA splicing, via spliceosome |
| GO:0002221 | 0.003 | 3.522 | 2.4109 | 8 | 181 | pattern recognition receptor signaling pathway |
| GO:0000375 | 0.0032 | 2.9652 | 3.5697 | 10 | 268 | RNA splicing, via transesterification reactions |
| GO:0006396 | 0.0035 | 2.0728 | 10.2828 | 20 | 772 | RNA processing |
| GO:0031584 | 0.0035 | 29.9072 | 0.0932 | 2 | 7 | activation of phospholipase D activity |
| GO:0018107 | 0.0036 | 5.2458 | 1.0256 | 5 | 77 | peptidyl-threonine phosphorylation |
| GO:0060317 | 0.0038 | 10.7219 | 0.3197 | 3 | 24 | cardiac epithelial to mesenchymal transition |
| GO:0006446 | 0.0041 | 5.1033 | 1.0523 | 5 | 79 | regulation of translational initiation |
| GO:0045089 | 0.0041 | 2.7012 | 4.3023 | 11 | 323 | positive regulation of innate immune response |
| GO:0072321 | 0.0047 | 24.9211 | 0.1066 | 2 | 8 | chaperone-mediated protein transport |
| GO:0000188 | 0.0048 | 9.7883 | 0.3463 | 3 | 26 | inactivation of MAPK activity |
| GO:0010644 | 0.0048 | 9.7883 | 0.3463 | 3 | 26 | cell communication by electrical coupling |
| GO:0032655 | 0.005 | 6.274 | 0.6926 | 4 | 52 | regulation of interleukin-12 production |
| GO:0045936 | 0.0054 | 2.2247 | 7.1261 | 15 | 535 | negative regulation of phosphate metabolic process |
| GO:0016071 | 0.0056 | 2.157 | 7.8453 | 16 | 589 | mRNA metabolic process |
| GO:0031440 | 0.006 | 9.0041 | 0.373 | 3 | 28 | regulation of mRNA 3'-end processing |
| GO:0034248 | 0.0061 | 2.5508 | 4.542 | 11 | 341 | regulation of cellular amide metabolic process |
| GO:0071901 | 0.0063 | 3.8484 | 1.6516 | 6 | 124 | negative regulation of protein serine/threonine kinase activity |
| GO:0032268 | 0.0068 | 1.567 | 31.328 | 45 | 2352 | regulation of cellular protein metabolic process |
| GO:0043393 | 0.0071 | 3.3185 | 2.2244 | 7 | 167 | regulation of protein binding |
| GO:0001522 | 0.0073 | 18.8659 | 0.132 | 2 | 10 | pseudouridine synthesis |
| GO:0051085 | 0.0074 | 18.6884 | 0.1332 | 2 | 10 | chaperone mediated protein folding requiring cofactor |
| GO:0044260 | 0.008 | 1.4168 | 106.2649 | 124 | 7978 | cellular macromolecule metabolic process |
| GO:0043549 | 0.0084 | 1.867 | 11.9212 | 21 | 895 | regulation of kinase activity |
| GO:0034660 | 0.0088 | 2.2309 | 6.1271 | 13 | 460 | ncRNA metabolic process |
| GO:0051481 | 0.009 | 16.6108 | 0.1465 | 2 | 11 | negative regulation of cytosolic calcium ion concentration |
| GO:0060213 | 0.009 | 16.6108 | 0.1465 | 2 | 11 | positive regulation of nuclear-transcribed mRNA poly(A) tail shortening |
| GO:0071888 | 0.009 | 16.6108 | 0.1465 | 2 | 11 | macrophage apoptotic process |
| GO:0061097 | 0.0093 | 5.1889 | 0.8258 | 4 | 62 | regulation of protein tyrosine kinase activity |
| GO:1901566 | 0.0098 | 1.6933 | 17.6353 | 28 | 1324 | organonitrogen compound biosynthetic process |
| GOMFID | Pvalue | OddsRatio | ExpCount | Count | Size | Term |
| GO:0043604 | 0 | 2.9 | 9.9437 | 26 | 706 | amide biosynthetic process |
| GO:0006518 | 0 | 2.7196 | 10.5493 | 26 | 749 | peptide metabolic process |
| GO:0070124 | 0 | 7.6076 | 1.1831 | 8 | 84 | mitochondrial translational initiation |
| GO:0070125 | 0 | 7.6076 | 1.1831 | 8 | 84 | mitochondrial translational elongation |
| GO:0070126 | 0 | 7.4116 | 1.2113 | 8 | 86 | mitochondrial translational termination |
| GO:0006412 | 1e-04 | 2.8637 | 7.2043 | 19 | 523 | translation |
| GO:0043624 | 1e-04 | 3.6706 | 3.831 | 13 | 272 | cellular protein complex disassembly |
| GO:0034248 | 4e-04 | 3.132 | 4.8028 | 14 | 341 | regulation of cellular amide metabolic process |
| GO:1901566 | 4e-04 | 1.9986 | 18.6479 | 34 | 1324 | organonitrogen compound biosynthetic process |
| GO:0032984 | 5e-04 | 3.1497 | 4.4225 | 13 | 314 | macromolecular complex disassembly |
| GO:0007005 | 0.001 | 2.267 | 9.9444 | 21 | 712 | mitochondrion organization |
| GO:0045727 | 0.0011 | 5.5789 | 1.169 | 6 | 83 | positive regulation of translation |
| GO:0010608 | 0.0013 | 2.6221 | 6.0986 | 15 | 433 | posttranscriptional regulation of gene expression |
| GO:0022602 | 0.0022 | 4.8229 | 1.338 | 6 | 95 | ovulation cycle process |
| GO:0042276 | 0.0023 | 13.2919 | 0.2676 | 3 | 19 | error-prone translesion synthesis |
| GO:0044712 | 0.0023 | 1.9271 | 15.0563 | 27 | 1069 | single-organism catabolic process |
| GO:0000387 | 0.0024 | 7.9027 | 0.5634 | 4 | 40 | spliceosomal snRNP assembly |
| GO:0006302 | 0.0043 | 3.0409 | 3.1268 | 9 | 222 | double-strand break repair |
| GO:0008380 | 0.0043 | 2.555 | 4.9577 | 12 | 352 | RNA splicing |
| GO:0000377 | 0.0043 | 2.8391 | 3.7183 | 10 | 264 | RNA splicing, via transesterification reactions with bulged adenosine as nucleophile |
| GO:0008585 | 0.0044 | 4.1636 | 1.5352 | 6 | 109 | female gonad development |
| GO:1903322 | 0.0049 | 3.2267 | 2.6197 | 8 | 186 | positive regulation of protein modification by small protein conjugation or removal |
| GO:0006446 | 0.0051 | 4.8161 | 1.1127 | 5 | 79 | regulation of translational initiation |
| GO:0000423 | 0.0058 | 3.4571 | 2.1408 | 7 | 152 | macromitophagy |
| GO:1902175 | 0.0063 | 8.8567 | 0.3803 | 3 | 27 | regulation of oxidative stress-induced intrinsic apoptotic signaling pathway |
| GO:0018202 | 0.0082 | 17.6507 | 0.1408 | 2 | 10 | peptidyl-histidine modification |
| GO:0033182 | 0.0082 | 17.6507 | 0.1408 | 2 | 10 | regulation of histone ubiquitination |
| GO:0019585 | 0.0085 | 7.871 | 0.4225 | 3 | 30 | glucuronate metabolic process |
| GO:0007050 | 0.0087 | 2.7054 | 3.493 | 9 | 248 | cell cycle arrest |
| GO:0034138 | 0.0088 | 4.1898 | 1.2676 | 5 | 90 | toll-like receptor 3 signaling pathway |
| GO:0034641 | 0.0089 | 1.3942 | 86.2958 | 104 | 6127 | cellular nitrogen compound metabolic process |
| GO:0006301 | 0.009 | 5.2623 | 0.8169 | 4 | 58 | postreplication repair |
| GO:0036473 | 0.009 | 5.2623 | 0.8169 | 4 | 58 | cell death in response to oxidative stress |
| GO:0046660 | 0.0095 | 3.5108 | 1.8028 | 6 | 128 | female sex differentiation |
| GO:0051403 | 0.0096 | 2.6602 | 3.5493 | 9 | 252 | stress-activated MAPK cascade |
| GO:0061726 | 0.0096 | 2.8532 | 2.9437 | 8 | 209 | mitochondrion disassembly |
| GO:0006390 | 0.01 | 15.6885 | 0.1549 | 2 | 11 | transcription from mitochondrial promoter |
| GO:0034501 | 0.01 | 15.6885 | 0.1549 | 2 | 11 | protein localization to kinetochore |
| GOMFID | Pvalue | OddsRatio | ExpCount | Count | Size | Term |
| GO:0043043 | 0 | 2.8005 | 9.7967 | 25 | 630 | peptide biosynthetic process |
| GO:0043241 | 0 | 3.6937 | 4.7273 | 16 | 304 | protein complex disassembly |
| GO:0070124 | 0 | 6.8559 | 1.3062 | 8 | 84 | mitochondrial translational initiation |
| GO:0070125 | 0 | 6.8559 | 1.3062 | 8 | 84 | mitochondrial translational elongation |
| GO:0070126 | 1e-04 | 6.6793 | 1.3373 | 8 | 86 | mitochondrial translational termination |
| GO:0022411 | 3e-04 | 2.335 | 11.585 | 25 | 745 | cellular component disassembly |
| GO:0044260 | 8e-04 | 1.5262 | 124.0604 | 149 | 7978 | cellular macromolecule metabolic process |
| GO:0007005 | 9e-04 | 2.1925 | 11.2429 | 23 | 723 | mitochondrion organization |
| GO:0008380 | 0.0013 | 2.7209 | 5.4737 | 14 | 352 | RNA splicing |
| GO:0044238 | 0.0013 | 1.5336 | 151.2579 | 174 | 9727 | primary metabolic process |
| GO:0003415 | 0.0014 | 63.8223 | 0.0622 | 2 | 4 | chondrocyte hypertrophy |
| GO:0071704 | 0.0016 | 1.5321 | 155.9541 | 178 | 10029 | organic substance metabolic process |
| GO:0010467 | 0.0016 | 1.4921 | 77.8449 | 100 | 5006 | gene expression |
| GO:0043603 | 0.0021 | 1.9601 | 14.1819 | 26 | 912 | cellular amide metabolic process |
| GO:0003418 | 0.0023 | 42.5455 | 0.0778 | 2 | 5 | growth plate cartilage chondrocyte differentiation |
| GO:0003433 | 0.0023 | 42.5455 | 0.0778 | 2 | 5 | chondrocyte development involved in endochondral bone morphogenesis |
| GO:0009446 | 0.0023 | 42.5455 | 0.0778 | 2 | 5 | putrescine biosynthetic process |
| GO:0051188 | 0.0028 | 3.5526 | 2.3947 | 8 | 154 | cofactor biosynthetic process |
| GO:0006498 | 0.0035 | 31.907 | 0.0933 | 2 | 6 | N-terminal protein lipidation |
| GO:0031098 | 0.0037 | 2.7362 | 4.2452 | 11 | 273 | stress-activated protein kinase signaling cascade |
| GO:0042273 | 0.004 | 6.7583 | 0.6531 | 4 | 42 | ribosomal large subunit biogenesis |
| GO:0045786 | 0.0041 | 2.2264 | 7.5886 | 16 | 488 | negative regulation of cell cycle |
| GO:1901298 | 0.0048 | 25.524 | 0.1089 | 2 | 7 | regulation of hydrogen peroxide-mediated programmed cell death |
| GO:0006614 | 0.0052 | 4.0312 | 1.5861 | 6 | 102 | SRP-dependent cotranslational protein targeting to membrane |
| GO:0007093 | 0.0055 | 3.1589 | 2.6747 | 8 | 172 | mitotic cell cycle checkpoint |
| GO:0016482 | 0.0063 | 1.7186 | 18.5826 | 30 | 1195 | cytoplasmic transport |
| GO:0034641 | 0.0063 | 1.7368 | 19.6766 | 31 | 1401 | cellular nitrogen compound metabolic process |
| GO:0051342 | 0.0063 | 21.2686 | 0.1244 | 2 | 8 | regulation of cyclic-nucleotide phosphodiesterase activity |
| GO:0033365 | 0.0063 | 1.8564 | 13.1089 | 23 | 843 | protein localization to organelle |
| GO:0044271 | 0.007 | 1.41 | 70.8939 | 89 | 4559 | cellular nitrogen compound biosynthetic process |
| GO:0072599 | 0.0074 | 3.7192 | 1.7105 | 6 | 110 | establishment of protein localization to endoplasmic reticulum |
| GO:0097468 | 0.0081 | 18.229 | 0.14 | 2 | 9 | programmed cell death in response to reactive oxygen species |
| GO:0032481 | 0.009 | 4.1759 | 1.2751 | 5 | 82 | positive regulation of type I interferon production |
| GO:0006414 | 0.0091 | 3.5541 | 1.7843 | 6 | 118 | translational elongation |
| GO:0032872 | 0.0093 | 2.8751 | 2.9235 | 8 | 188 | regulation of stress-activated MAPK cascade |
| GO:0006415 | 0.0098 | 4.0853 | 1.3006 | 5 | 86 | translational termination |
| GO:0016259 | 0.01 | 4.0697 | 1.3062 | 5 | 84 | selenocysteine metabolic process |
| GO:0006388 | 0.01 | 15.9494 | 0.1555 | 2 | 10 | tRNA splicing, via endonucleolytic cleavage and ligation |
| GOMFID | Pvalue | OddsRatio | ExpCount | Count | Size | Term |
| GO:0043241 | 0 | 5.2371 | 3.2161 | 15 | 304 | protein complex disassembly |
| GO:0043043 | 0 | 3.1549 | 6.665 | 19 | 630 | peptide biosynthetic process |
| GO:0043933 | 1e-04 | 2.012 | 26.0992 | 45 | 2467 | macromolecular complex subunit organization |
| GO:0006612 | 1e-04 | 5.0574 | 1.936 | 9 | 183 | protein targeting to membrane |
| GO:0072599 | 2e-04 | 6.5918 | 1.1637 | 7 | 110 | establishment of protein localization to endoplasmic reticulum |
| GO:0000184 | 2e-04 | 6.3437 | 1.206 | 7 | 114 | nuclear-transcribed mRNA catabolic process, nonsense-mediated decay |
| GO:0006414 | 2e-04 | 6.2797 | 1.2173 | 7 | 118 | translational elongation |
| GO:0006415 | 3e-04 | 7.4342 | 0.8873 | 6 | 86 | translational termination |
| GO:0022411 | 3e-04 | 2.6347 | 7.8816 | 19 | 745 | cellular component disassembly |
| GO:0008612 | 7e-04 | 94.6524 | 0.0423 | 2 | 4 | peptidyl-lysine modification to peptidyl-hypusine |
| GO:0019068 | 7e-04 | 10.9277 | 0.4126 | 4 | 39 | virion assembly |
| GO:0006614 | 7e-04 | 6.027 | 1.0791 | 6 | 102 | SRP-dependent cotranslational protein targeting to membrane |
| GO:0007088 | 9e-04 | 4.8732 | 1.5446 | 7 | 146 | regulation of mitotic nuclear division |
| GO:0006364 | 0.001 | 4.8381 | 1.5552 | 7 | 147 | rRNA processing |
| GO:0008284 | 0.001 | 2.4012 | 8.5904 | 19 | 812 | positive regulation of cell proliferation |
| GO:0051437 | 0.001 | 7.0593 | 0.7723 | 5 | 73 | positive regulation of ubiquitin-protein ligase activity involved in regulation of mitotic cell cycle transition |
| GO:0098734 | 0.0011 | 63.0976 | 0.0529 | 2 | 5 | macromolecule depalmitoylation |
| GO:0006402 | 0.0014 | 4.0013 | 2.137 | 8 | 202 | mRNA catabolic process |
| GO:0044267 | 0.0018 | 1.618 | 50.8865 | 69 | 4810 | cellular protein metabolic process |
| GO:0016259 | 0.002 | 6.072 | 0.8887 | 5 | 84 | selenocysteine metabolic process |
| GO:0070124 | 0.002 | 6.072 | 0.8887 | 5 | 84 | mitochondrial translational initiation |
| GO:0070125 | 0.002 | 6.072 | 0.8887 | 5 | 84 | mitochondrial translational elongation |
| GO:0031145 | 0.0021 | 5.9957 | 0.8992 | 5 | 85 | anaphase-promoting complex-dependent proteasomal ubiquitin-dependent protein catabolic process |
| GO:0070126 | 0.0022 | 5.9213 | 0.9098 | 5 | 86 | mitochondrial translational termination |
| GO:0000070 | 0.0023 | 4.774 | 1.3436 | 6 | 127 | mitotic sister chromatid segregation |
| GO:0031398 | 0.0024 | 4.0983 | 1.8196 | 7 | 172 | positive regulation of protein ubiquitination |
| GO:0051302 | 0.0025 | 3.3138 | 2.8882 | 9 | 273 | regulation of cell division |
| GO:0051436 | 0.0027 | 5.6412 | 0.9521 | 5 | 90 | negative regulation of ubiquitin-protein ligase activity involved in mitotic cell cycle |
| GO:0006091 | 0.0029 | 2.6967 | 4.7395 | 12 | 448 | generation of precursor metabolites and energy |
| GO:2000058 | 0.0034 | 5.3261 | 1.005 | 5 | 95 | regulation of protein ubiquitination involved in ubiquitin-dependent protein catabolic process |
| GO:0000381 | 0.0035 | 10.9714 | 0.3068 | 3 | 29 | regulation of alternative mRNA splicing, via spliceosome |
| GO:0051289 | 0.0035 | 6.945 | 0.6242 | 4 | 59 | protein homotetramerization |
| GO:0043603 | 0.0036 | 2.1178 | 9.6483 | 19 | 912 | cellular amide metabolic process |
| GO:0045333 | 0.0037 | 3.7744 | 1.9678 | 7 | 186 | cellular respiration |
| GO:0051351 | 0.0037 | 5.2096 | 1.0262 | 5 | 97 | positive regulation of ligase activity |
| GO:0016482 | 0.0037 | 1.9697 | 12.6423 | 23 | 1195 | cytoplasmic transport |
| GO:0050686 | 0.0038 | 10.5644 | 0.3174 | 3 | 30 | negative regulation of mRNA processing |
| GO:0051352 | 0.0038 | 5.1533 | 1.0368 | 5 | 98 | negative regulation of ligase activity |
| GO:1902582 | 0.004 | 1.8232 | 17.3924 | 29 | 1644 | single-organism intracellular transport |
| GO:0007005 | 0.0042 | 2.2356 | 7.6488 | 16 | 723 | mitochondrion organization |
| GO:0033692 | 0.0044 | 6.4725 | 0.6665 | 4 | 63 | cellular polysaccharide biosynthetic process |
| GO:0010939 | 0.0046 | 9.8346 | 0.3385 | 3 | 32 | regulation of necrotic cell death |
| GO:0009059 | 0.0047 | 1.5378 | 51.7857 | 68 | 4895 | macromolecule biosynthetic process |
| GO:0019043 | 0.0047 | 23.654 | 0.1058 | 2 | 10 | establishment of viral latency |
| GO:0022613 | 0.0047 | 2.8039 | 3.7768 | 10 | 357 | ribonucleoprotein complex biogenesis |
| GO:0070423 | 0.005 | 9.5061 | 0.3491 | 3 | 33 | nucleotide-binding oligomerization domain containing signaling pathway |
| GO:0075733 | 0.005 | 9.5061 | 0.3491 | 3 | 33 | intracellular transport of virus |
| GO:0050657 | 0.0051 | 4.0337 | 1.5763 | 6 | 149 | nucleic acid transport |
| GO:0051348 | 0.0052 | 2.7631 | 3.8297 | 10 | 362 | negative regulation of transferase activity |
| GO:0045184 | 0.0054 | 1.7353 | 20.2065 | 32 | 1910 | establishment of protein localization |
| GO:0001912 | 0.0055 | 9.1989 | 0.3597 | 3 | 34 | positive regulation of leukocyte mediated cytotoxicity |
| GO:0051236 | 0.0056 | 3.9501 | 1.6081 | 6 | 152 | establishment of RNA localization |
| GO:0044270 | 0.0057 | 2.5839 | 4.5068 | 11 | 426 | cellular nitrogen compound catabolic process |
| GO:0045835 | 0.0057 | 21.0244 | 0.1164 | 2 | 11 | negative regulation of meiotic nuclear division |
| GO:0045786 | 0.0058 | 2.4635 | 5.1627 | 12 | 488 | negative regulation of cell cycle |
| GO:0070266 | 0.0059 | 8.9109 | 0.3703 | 3 | 35 | necroptotic process |
| GO:0044033 | 0.0065 | 3.3734 | 2.1899 | 7 | 207 | multi-organism metabolic process |
| GO:0044272 | 0.0067 | 3.3564 | 2.2005 | 7 | 208 | sulfur compound biosynthetic process |
| GO:0019082 | 0.0068 | 18.9207 | 0.127 | 2 | 12 | viral protein processing |
| GO:0071318 | 0.0068 | 18.9207 | 0.127 | 2 | 12 | cellular response to ATP |
| GO:0044766 | 0.0069 | 8.3856 | 0.3914 | 3 | 37 | multi-organism transport |
| GO:1903311 | 0.007 | 4.4332 | 1.1955 | 5 | 113 | regulation of mRNA metabolic process |
| GO:0006886 | 0.007 | 1.9786 | 10.2725 | 19 | 971 | intracellular protein transport |
| GO:0051259 | 0.0086 | 2.4331 | 4.7713 | 11 | 451 | protein oligomerization |
| GO:0035666 | 0.0086 | 5.2994 | 0.804 | 4 | 76 | TRIF-dependent toll-like receptor signaling pathway |
| GO:0035338 | 0.0086 | 7.7042 | 0.4232 | 3 | 40 | long-chain fatty-acyl-CoA biosynthetic process |
| GO:0051445 | 0.0086 | 7.7042 | 0.4232 | 3 | 40 | regulation of meiotic cell cycle |
| GO:1900024 | 0.0092 | 7.501 | 0.4338 | 3 | 41 | regulation of substrate adhesion-dependent cell spreading |
| GO:0044764 | 0.0093 | 2.0412 | 8.3259 | 16 | 787 | multi-organism cellular process |
| GO:0009058 | 0.0095 | 1.4631 | 62.7882 | 78 | 5935 | biosynthetic process |
| GO:0051028 | 0.0099 | 4.0549 | 1.3013 | 5 | 123 | mRNA transport |
| GOMFID | Pvalue | OddsRatio | ExpCount | Count | Size | Term |
| GO:0050911 | 0 | 9.3404 | 1.9772 | 15 | 365 | detection of chemical stimulus involved in sensory perception of smell |
| GO:0009593 | 0 | 7.5447 | 2.416 | 15 | 446 | detection of chemical stimulus |
| GO:0007606 | 0 | 7.3176 | 2.4865 | 15 | 459 | sensory perception of chemical stimulus |
| GO:0050906 | 0 | 7.3176 | 2.4865 | 15 | 459 | detection of stimulus involved in sensory perception |
| GO:0050877 | 0 | 4.242 | 6.5493 | 22 | 1209 | neurological system process |
| GO:0031622 | 0 | 81.5279 | 0.0542 | 3 | 10 | positive regulation of fever generation |
| GO:0007186 | 0 | 3.4739 | 6.1782 | 18 | 1154 | G-protein coupled receptor signaling pathway |
| GO:0031650 | 1e-04 | 51.8681 | 0.0758 | 3 | 14 | regulation of heat generation |
| GO:0042255 | 1e-04 | 17.4658 | 0.26 | 4 | 48 | ribosome assembly |
| GO:0002437 | 2e-04 | 15.6785 | 0.2871 | 4 | 53 | inflammatory response to antigenic stimulus |
| GO:0010193 | 6e-04 | 75.1855 | 0.0379 | 2 | 7 | response to ozone |
| GO:0070542 | 9e-04 | 10.2262 | 0.428 | 4 | 79 | response to fatty acid |
| GO:0001659 | 0.0012 | 15.8232 | 0.2113 | 3 | 39 | temperature homeostasis |
| GO:0009301 | 0.0013 | 46.9819 | 0.0542 | 2 | 10 | snRNA transcription |
| GO:2001179 | 0.0013 | 46.9819 | 0.0542 | 2 | 10 | regulation of interleukin-10 secretion |
| GO:0045429 | 0.0016 | 14.2372 | 0.2329 | 3 | 43 | positive regulation of nitric oxide biosynthetic process |
| GO:0032308 | 0.0018 | 37.5807 | 0.065 | 2 | 12 | positive regulation of prostaglandin secretion |
| GO:0015833 | 0.0019 | 4.3284 | 1.7551 | 7 | 324 | peptide transport |
| GO:0032846 | 0.0023 | 5.8462 | 0.9219 | 5 | 174 | positive regulation of homeostatic process |
| GO:0015791 | 0.0025 | 31.3133 | 0.0758 | 2 | 14 | polyol transport |
| GO:0030072 | 0.0028 | 4.6089 | 1.403 | 6 | 259 | peptide hormone secretion |
| GO:0071236 | 0.0029 | 28.9027 | 0.0813 | 2 | 15 | cellular response to antibiotic |
| GO:0006953 | 0.003 | 11.3824 | 0.2871 | 3 | 53 | acute-phase response |
| GO:0046887 | 0.0032 | 7.0864 | 0.6067 | 4 | 112 | positive regulation of hormone secretion |
| GO:0050796 | 0.0036 | 5.2385 | 1.0238 | 5 | 189 | regulation of insulin secretion |
| GO:0010042 | 0.0037 | 25.0458 | 0.0921 | 2 | 17 | response to manganese ion |
| GO:0016045 | 0.0037 | 25.0458 | 0.0921 | 2 | 17 | detection of bacterium |
| GO:0015732 | 0.0042 | 23.4789 | 0.0975 | 2 | 18 | prostaglandin transport |
| GO:0032303 | 0.0042 | 23.4789 | 0.0975 | 2 | 18 | regulation of icosanoid secretion |
| GO:2000193 | 0.0042 | 23.4789 | 0.0975 | 2 | 18 | positive regulation of fatty acid transport |
| GO:0071826 | 0.0044 | 4.9913 | 1.0726 | 5 | 198 | ribonucleoprotein complex subunit organization |
| GO:0036499 | 0.0047 | 22.0964 | 0.1029 | 2 | 19 | PERK-mediated unfolded protein response |
| GO:0050714 | 0.0049 | 4.8636 | 1.0997 | 5 | 203 | positive regulation of protein secretion |
| GO:1903426 | 0.0053 | 9.1723 | 0.3521 | 3 | 65 | regulation of reactive oxygen species biosynthetic process |
| GO:0006529 | 0.0054 | Inf | 0.0054 | 1 | 1 | asparagine biosynthetic process |
| GO:0010836 | 0.0054 | Inf | 0.0054 | 1 | 1 | negative regulation of protein ADP-ribosylation |
| GO:0018885 | 0.0054 | Inf | 0.0054 | 1 | 1 | carbon tetrachloride metabolic process |
| GO:0031583 | 0.0054 | Inf | 0.0054 | 1 | 1 | phospholipase D-activating G-protein coupled receptor signaling pathway |
| GO:0032223 | 0.0054 | Inf | 0.0054 | 1 | 1 | negative regulation of synaptic transmission, cholinergic |
| GO:0035505 | 0.0054 | Inf | 0.0054 | 1 | 1 | positive regulation of myosin light chain kinase activity |
| GO:0042313 | 0.0054 | Inf | 0.0054 | 1 | 1 | protein kinase C deactivation |
| GO:0043179 | 0.0054 | Inf | 0.0054 | 1 | 1 | rhythmic excitation |
| GO:0045212 | 0.0054 | Inf | 0.0054 | 1 | 1 | neurotransmitter receptor biosynthetic process |
| GO:0060904 | 0.0054 | Inf | 0.0054 | 1 | 1 | regulation of protein folding in endoplasmic reticulum |
| GO:0070981 | 0.0054 | Inf | 0.0054 | 1 | 1 | L-asparagine biosynthetic process |
| GO:0071414 | 0.0054 | Inf | 0.0054 | 1 | 1 | cellular response to methotrexate |
| GO:0009612 | 0.0056 | 4.6954 | 1.1376 | 5 | 210 | response to mechanical stimulus |
| GO:0050995 | 0.0057 | 19.7679 | 0.1138 | 2 | 21 | negative regulation of lipid catabolic process |
| GO:0000288 | 0.006 | 8.7473 | 0.3684 | 3 | 68 | nuclear-transcribed mRNA catabolic process, deadenylation-dependent decay |
| GO:0002673 | 0.0062 | 8.6142 | 0.3738 | 3 | 69 | regulation of acute inflammatory response |
| GO:0006541 | 0.0062 | 18.7783 | 0.1192 | 2 | 22 | glutamine metabolic process |
| GO:0042593 | 0.0065 | 4.5383 | 1.1755 | 5 | 217 | glucose homeostasis |
| GO:0051953 | 0.0068 | 17.883 | 0.1246 | 2 | 23 | negative regulation of amine transport |
| GO:0061014 | 0.0068 | 17.883 | 0.1246 | 2 | 23 | positive regulation of mRNA catabolic process |
| GO:0098581 | 0.0068 | 17.883 | 0.1246 | 2 | 23 | detection of external biotic stimulus |
| GO:0002791 | 0.007 | 4.4531 | 1.1972 | 5 | 221 | regulation of peptide secretion |
| GO:0030728 | 0.0074 | 17.069 | 0.13 | 2 | 24 | ovulation |
| GO:2000178 | 0.0074 | 17.069 | 0.13 | 2 | 24 | negative regulation of neural precursor cell proliferation |
| GO:0009914 | 0.0075 | 3.7352 | 1.7172 | 6 | 317 | hormone transport |
| GO:0010575 | 0.008 | 16.3258 | 0.1354 | 2 | 25 | positive regulation of vascular endothelial growth factor production |
| GO:0032673 | 0.008 | 16.3258 | 0.1354 | 2 | 25 | regulation of interleukin-4 production |
| GO:0042346 | 0.008 | 16.3258 | 0.1354 | 2 | 25 | positive regulation of NF-kappaB import into nucleus |
| GO:0090023 | 0.008 | 16.3258 | 0.1354 | 2 | 25 | positive regulation of neutrophil chemotaxis |
| GO:0023061 | 0.0082 | 3.2608 | 2.3023 | 7 | 425 | signal release |
| GO:0006401 | 0.0084 | 4.2533 | 1.2514 | 5 | 231 | RNA catabolic process |
| GO:0035774 | 0.0087 | 15.6446 | 0.1408 | 2 | 26 | positive regulation of insulin secretion involved in cellular response to glucose stimulus |
| GO:0046209 | 0.009 | 7.4759 | 0.428 | 3 | 79 | nitric oxide metabolic process |
| GO:0009636 | 0.0098 | 4.088 | 1.3001 | 5 | 240 | response to toxic substance |
| GOMFID | Pvalue | OddsRatio | ExpCount | Count | Size | Term |
| GO:0009593 | 0 | 10.6832 | 1.3359 | 11 | 446 | detection of chemical stimulus |
| GO:0007606 | 0 | 10.3643 | 1.3749 | 11 | 459 | sensory perception of chemical stimulus |
| GO:0050906 | 0 | 10.3643 | 1.3749 | 11 | 459 | detection of stimulus involved in sensory perception |
| GO:0050911 | 0 | 11.6399 | 1.0933 | 10 | 365 | detection of chemical stimulus involved in sensory perception of smell |
| GO:0007186 | 0 | 4.8554 | 3.4596 | 13 | 1155 | G-protein coupled receptor signaling pathway |
| GO:0050877 | 0 | 4.6189 | 3.6214 | 13 | 1209 | neurological system process |
| GO:0046888 | 0.0014 | 15.1695 | 0.2187 | 3 | 73 | negative regulation of hormone secretion |
| GO:0009648 | 0.0023 | 31.5596 | 0.0719 | 2 | 24 | photoperiodism |
| GO:1990079 | 0.003 | Inf | 0.003 | 1 | 1 | cartilage homeostasis |
| GO:0052548 | 0.0042 | 5.1568 | 1.0723 | 5 | 358 | regulation of endopeptidase activity |
| GO:0042269 | 0.0044 | 22.3842 | 0.0988 | 2 | 33 | regulation of natural killer cell mediated cytotoxicity |
| GO:0033574 | 0.0052 | 20.4052 | 0.1078 | 2 | 36 | response to testosterone |
| GO:0015853 | 0.006 | 340.0652 | 0.006 | 1 | 2 | adenine transport |
| GO:0015701 | 0.0061 | 18.7471 | 0.1168 | 2 | 39 | bicarbonate transport |
| GO:0046676 | 0.0067 | 17.7835 | 0.1228 | 2 | 41 | negative regulation of insulin secretion |
| GO:0030185 | 0.009 | 170.0217 | 0.009 | 1 | 3 | nitric oxide transport |
| GO:1900005 | 0.009 | 170.0217 | 0.009 | 1 | 3 | positive regulation of serine-type endopeptidase activity |
| GO:0002792 | 0.0091 | 15.0705 | 0.1438 | 2 | 48 | negative regulation of peptide secretion |
| GOMFID | Pvalue | OddsRatio | ExpCount | Count | Size | Term |
| GO:0006457 | 2e-04 | 3.732 | 3.4701 | 12 | 225 | protein folding |
| GO:0031053 | 3e-04 | 32.3075 | 0.1388 | 3 | 9 | primary miRNA processing |
| GO:0043043 | 3e-04 | 2.441 | 9.7164 | 22 | 630 | peptide biosynthetic process |
| GO:0031050 | 5e-04 | 12.3473 | 0.3856 | 4 | 25 | dsRNA fragmentation |
| GO:0006413 | 6e-04 | 3.2512 | 3.9483 | 12 | 256 | translational initiation |
| GO:0006488 | 9e-04 | 5.8368 | 1.1259 | 6 | 73 | dolichol-linked oligosaccharide biosynthetic process |
| GO:0035337 | 0.001 | 7.2218 | 0.7711 | 5 | 50 | fatty-acyl-CoA metabolic process |
| GO:0006417 | 0.0012 | 2.8473 | 4.8582 | 13 | 315 | regulation of translation |
| GO:0044237 | 0.0017 | 1.5329 | 140.2799 | 162 | 9414 | cellular metabolic process |
| GO:0071616 | 0.002 | 6.1285 | 0.8945 | 5 | 58 | acyl-CoA biosynthetic process |
| GO:0043687 | 0.002 | 2.4093 | 7.0482 | 16 | 457 | post-translational protein modification |
| GO:0016032 | 0.002 | 2.0554 | 11.9373 | 23 | 774 | viral process |
| GO:0035383 | 0.0023 | 4.8236 | 1.3418 | 6 | 87 | thioester metabolic process |
| GO:0043280 | 0.0024 | 4.116 | 1.8199 | 7 | 118 | positive regulation of cysteine-type endopeptidase activity involved in apoptotic process |
| GO:0051188 | 0.0027 | 3.5834 | 2.3751 | 8 | 154 | cofactor biosynthetic process |
| GO:0048284 | 0.0028 | 3.9718 | 1.8816 | 7 | 122 | organelle fusion |
| GO:0071901 | 0.0031 | 3.9034 | 1.9124 | 7 | 124 | negative regulation of protein serine/threonine kinase activity |
| GO:0035338 | 0.0033 | 7.1956 | 0.6169 | 4 | 40 | long-chain fatty-acyl-CoA biosynthetic process |
| GO:0008380 | 0.0033 | 2.5303 | 5.4288 | 13 | 352 | RNA splicing |
| GO:0030422 | 0.0034 | 32.1771 | 0.0925 | 2 | 6 | production of siRNA involved in RNA interference |
| GO:0044419 | 0.0037 | 1.9514 | 12.5234 | 23 | 812 | interspecies interaction between organisms |
| GO:0044267 | 0.0038 | 1.4455 | 74.1839 | 94 | 4810 | cellular protein metabolic process |
| GO:0035195 | 0.0043 | 6.6408 | 0.6632 | 4 | 43 | gene silencing by miRNA |
| GO:0018279 | 0.0045 | 2.8149 | 3.7478 | 10 | 243 | protein N-linked glycosylation via asparagine |
| GO:0016071 | 0.0046 | 2.0938 | 9.0841 | 18 | 589 | mRNA metabolic process |
| GO:0002190 | 0.0047 | 25.74 | 0.108 | 2 | 7 | cap-independent translational initiation |
| GO:0032790 | 0.0047 | 25.74 | 0.108 | 2 | 7 | ribosome disassembly |
| GO:0034656 | 0.0047 | 25.74 | 0.108 | 2 | 7 | nucleobase-containing small molecule catabolic process |
| GO:0032897 | 0.0051 | 9.6835 | 0.3547 | 3 | 23 | negative regulation of viral transcription |
| GO:0034645 | 0.0056 | 1.4226 | 73.1969 | 92 | 4746 | cellular macromolecule biosynthetic process |
| GO:0016441 | 0.0059 | 6.0215 | 0.7249 | 4 | 47 | posttranscriptional gene silencing |
| GO:0010467 | 0.0061 | 1.4114 | 77.2068 | 96 | 5006 | gene expression |
| GO:0018193 | 0.0062 | 1.6911 | 20.1885 | 32 | 1309 | peptidyl-amino acid modification |
| GO:0008635 | 0.0062 | 21.4486 | 0.1234 | 2 | 8 | activation of cysteine-type endopeptidase activity involved in apoptotic process by cytochrome c |
| GO:0009186 | 0.0062 | 21.4486 | 0.1234 | 2 | 8 | deoxyribonucleoside diphosphate metabolic process |
| GO:0060155 | 0.0062 | 21.4486 | 0.1234 | 2 | 8 | platelet dense granule organization |
| GO:0010950 | 0.0063 | 3.4044 | 2.1746 | 7 | 141 | positive regulation of endopeptidase activity |
| GO:0043603 | 0.0074 | 1.8052 | 14.0656 | 24 | 912 | cellular amide metabolic process |
| GO:0051084 | 0.0078 | 5.5076 | 0.7866 | 4 | 51 | 'de novo' posttranslational protein folding |
| GO:0009155 | 0.0079 | 18.3833 | 0.1388 | 2 | 9 | purine deoxyribonucleotide catabolic process |
| GO:0046688 | 0.0081 | 8.0675 | 0.4164 | 3 | 27 | response to copper ion |
| GO:0009058 | 0.0087 | 1.3768 | 91.5346 | 110 | 5935 | biosynthetic process |
| GO:0071704 | 0.0089 | 1.414 | 150.3661 | 168 | 9942 | organic substance metabolic process |
| GO:0044238 | 0.0091 | 1.3989 | 150.0181 | 168 | 9727 | primary metabolic process |
| GO:0006626 | 0.0093 | 3.1439 | 2.3443 | 7 | 152 | protein targeting to mitochondrion |
| GO:0006020 | 0.0098 | 16.0844 | 0.1542 | 2 | 10 | inositol metabolic process |
| GO:0045955 | 0.0098 | 16.0844 | 0.1542 | 2 | 10 | negative regulation of calcium ion-dependent exocytosis |
| GO:0036230 | 0.0098 | 7.4459 | 0.4473 | 3 | 29 | granulocyte activation |
| GOMFID | Pvalue | OddsRatio | ExpCount | Count | Size | Term |
| GO:0004984 | 0 | 8.9832 | 1.4841 | 11 | 365 | olfactory receptor activity |
| GO:0004930 | 1e-04 | 4.5042 | 3.1553 | 12 | 776 | G-protein coupled receptor activity |
| GO:0004556 | 2e-04 | 168.5269 | 0.0203 | 2 | 5 | alpha-amylase activity |
| GO:0099600 | 0.001 | 3.0805 | 4.924 | 13 | 1211 | transmembrane receptor activity |
| GO:0038023 | 0.0015 | 2.9392 | 5.1395 | 13 | 1264 | signaling receptor activity |
| GO:0004584 | 0.0041 | Inf | 0.0041 | 1 | 1 | dolichyl-phosphate-mannose-glycolipid alpha-mannosyltransferase activity |
| GO:0030549 | 0.0041 | Inf | 0.0041 | 1 | 1 | acetylcholine receptor activator activity |
| GO:0005549 | 0.0047 | 9.5877 | 0.3375 | 3 | 83 | odorant binding |
| GO:0060089 | 0.0066 | 2.4323 | 6.0991 | 13 | 1500 | molecular transducer activity |
| GO:0004066 | 0.0081 | 248.8095 | 0.0081 | 1 | 2 | asparagine synthase (glutamine-hydrolyzing) activity |
| GO:0008263 | 0.0081 | 248.8095 | 0.0081 | 1 | 2 | pyrimidine-specific mismatch base pair DNA N-glycosylase activity |
| GO:0017077 | 0.0081 | 248.8095 | 0.0081 | 1 | 2 | oxidative phosphorylation uncoupler activity |
| GO:0003735 | 0.0081 | 5.4049 | 0.7929 | 4 | 195 | structural constituent of ribosome |
| GOMFID | Pvalue | OddsRatio | ExpCount | Count | Size | Term |
| GO:0005459 | 0.0026 | Inf | 0.0026 | 1 | 1 | UDP-galactose transmembrane transporter activity |
| GO:0031851 | 0.0026 | Inf | 0.0026 | 1 | 1 | kappa-type opioid receptor binding |
| GO:0043136 | 0.0026 | Inf | 0.0026 | 1 | 1 | glycerol-3-phosphatase activity |
| GO:0008967 | 0.0052 | 392.45 | 0.0052 | 1 | 2 | phosphoglycolate phosphatase activity |
| GO:0004873 | 0.0078 | 196.2125 | 0.0078 | 1 | 3 | asialoglycoprotein receptor activity |
| GOMFID | Pvalue | OddsRatio | ExpCount | Count | Size | Term |
| GO:0004984 | 2e-04 | 5.6258 | 1.6001 | 8 | 365 | olfactory receptor activity |
| GO:0005184 | 2e-04 | 30.9249 | 0.114 | 3 | 26 | neuropeptide hormone activity |
| GO:0004778 | 0.0044 | Inf | 0.0044 | 1 | 1 | succinyl-CoA hydrolase activity |
| GO:0031710 | 0.0044 | Inf | 0.0044 | 1 | 1 | neuromedin B receptor binding |
| GO:0042163 | 0.0044 | Inf | 0.0044 | 1 | 1 | interleukin-12 beta subunit binding |
| GO:0042586 | 0.0044 | Inf | 0.0044 | 1 | 1 | peptide deformylase activity |
| GO:0045513 | 0.0044 | Inf | 0.0044 | 1 | 1 | interleukin-27 binding |
| GO:0004930 | 0.0066 | 2.9147 | 3.4018 | 9 | 776 | G-protein coupled receptor activity |
| GO:0004867 | 0.007 | 8.2373 | 0.3902 | 3 | 89 | serine-type endopeptidase inhibitor activity |
| GO:0009019 | 0.0087 | 230.4412 | 0.0088 | 1 | 2 | tRNA (guanine-N1-)-methyltransferase activity |
| GO:0010698 | 0.0087 | 230.4412 | 0.0088 | 1 | 2 | acetyltransferase activator activity |
| GO:0047179 | 0.0087 | 230.4412 | 0.0088 | 1 | 2 | platelet-activating factor acetyltransferase activity |
| GOMFID | Pvalue | OddsRatio | ExpCount | Count | Size | Term |
| GO:0004984 | 4e-04 | 6.9283 | 0.9971 | 6 | 365 | olfactory receptor activity |
| GO:0005549 | 0.0015 | 14.6409 | 0.2267 | 3 | 83 | odorant binding |
| GO:0005459 | 0.0027 | Inf | 0.0027 | 1 | 1 | UDP-galactose transmembrane transporter activity |
| GO:0008962 | 0.0027 | Inf | 0.0027 | 1 | 1 | phosphatidylglycerophosphatase activity |
| GO:0048020 | 0.0041 | 23.1545 | 0.0956 | 2 | 35 | CCR chemokine receptor binding |
| GO:0004930 | 0.0047 | 3.7746 | 2.1199 | 7 | 776 | G-protein coupled receptor activity |
| GO:0008009 | 0.0076 | 16.597 | 0.1311 | 2 | 48 | chemokine activity |
| GOMFID | Pvalue | OddsRatio | ExpCount | Count | Size | Term |
| GO:0003735 | 0.0012 | 5.5131 | 1.1769 | 6 | 195 | structural constituent of ribosome |
| GO:0034353 | 0.006 | Inf | 0.006 | 1 | 1 | RNA pyrophosphohydrolase activity |
| GO:0042292 | 0.006 | Inf | 0.006 | 1 | 1 | URM1 activating enzyme activity |
| GO:0052856 | 0.006 | Inf | 0.006 | 1 | 1 | NADHX epimerase activity |
| GO:0052857 | 0.006 | Inf | 0.006 | 1 | 1 | NADPHX epimerase activity |
| GO:0052906 | 0.006 | Inf | 0.006 | 1 | 1 | tRNA (guanine(37)-N(1))-methyltransferase activity |
| GO:0061604 | 0.006 | Inf | 0.006 | 1 | 1 | molybdopterin-synthase sulfurtransferase activity |
| GO:0061605 | 0.006 | Inf | 0.006 | 1 | 1 | molybdopterin-synthase adenylyltransferase activity |
| GO:0004984 | 0.0066 | 3.3967 | 2.203 | 7 | 365 | olfactory receptor activity |
| GOMFID | Pvalue | OddsRatio | ExpCount | Count | Size | Term |
| GO:0008147 | 0 | Inf | 0.0112 | 2 | 2 | structural constituent of bone |
| GO:0031726 | 5e-04 | 90.9767 | 0.0335 | 2 | 6 | CCR1 chemokine receptor binding |
| GO:0031730 | 5e-04 | 90.9767 | 0.0335 | 2 | 6 | CCR5 chemokine receptor binding |
| GO:0008009 | 0.0024 | 12.2408 | 0.2684 | 3 | 48 | chemokine activity |
| GO:0004930 | 0.0039 | 2.78 | 4.3385 | 11 | 776 | G-protein coupled receptor activity |
| GO:0002135 | 0.0056 | Inf | 0.0056 | 1 | 1 | CTP binding |
| GO:0031764 | 0.0056 | Inf | 0.0056 | 1 | 1 | type 1 galanin receptor binding |
| GO:0031855 | 0.0056 | Inf | 0.0056 | 1 | 1 | oxytocin receptor binding |
| GO:0033819 | 0.0056 | Inf | 0.0056 | 1 | 1 | lipoyl(octanoyl) transferase activity |
| GO:0034353 | 0.0056 | Inf | 0.0056 | 1 | 1 | RNA pyrophosphohydrolase activity |
| GO:0042292 | 0.0056 | Inf | 0.0056 | 1 | 1 | URM1 activating enzyme activity |
| GO:0061604 | 0.0056 | Inf | 0.0056 | 1 | 1 | molybdopterin-synthase sulfurtransferase activity |
| GO:0061605 | 0.0056 | Inf | 0.0056 | 1 | 1 | molybdopterin-synthase adenylyltransferase activity |
| GO:0001965 | 0.0061 | 19.1346 | 0.1174 | 2 | 21 | G-protein alpha-subunit binding |
| GO:0005184 | 0.0092 | 15.1434 | 0.1454 | 2 | 26 | neuropeptide hormone activity |
| GO:0016538 | 0.0092 | 15.1434 | 0.1454 | 2 | 26 | cyclin-dependent protein serine/threonine kinase regulator activity |
| GO:0001205 | 0.0099 | 14.5367 | 0.151 | 2 | 27 | transcriptional activator activity, RNA polymerase II distal enhancer sequence-specific binding |
| GOMFID | Pvalue | OddsRatio | ExpCount | Count | Size | Term |
| GO:0070259 | 2e-04 | Inf | 0.0272 | 2 | 2 | tyrosyl-DNA phosphodiesterase activity |
| GO:0031694 | 0.0018 | 48.8145 | 0.068 | 2 | 5 | alpha-2A adrenergic receptor binding |
| GO:0015037 | 0.0037 | 29.2849 | 0.0952 | 2 | 7 | peptide disulfide oxidoreductase activity |
| GO:0017070 | 0.0077 | 18.2995 | 0.136 | 2 | 10 | U6 snRNA binding |
| GO:0015631 | 0.0085 | 2.7157 | 3.4806 | 9 | 256 | tubulin binding |
| GO:0051082 | 0.0092 | 4.1495 | 1.278 | 5 | 94 | unfolded protein binding |
| GO:0019211 | 0.0093 | 16.2652 | 0.1496 | 2 | 11 | phosphatase activator activity |
| GOMFID | Pvalue | OddsRatio | ExpCount | Count | Size | Term |
| GO:0003735 | 5e-04 | 3.8542 | 2.7875 | 10 | 195 | structural constituent of ribosome |
| GO:0003697 | 0.0014 | 5.3532 | 1.2151 | 6 | 85 | single-stranded DNA binding |
| GO:0008432 | 0.0029 | 34.778 | 0.0858 | 2 | 6 | JUN kinase binding |
| GO:0003676 | 0.005 | 1.4818 | 52.805 | 70 | 3694 | nucleic acid binding |
| GO:0004693 | 0.0088 | 7.7518 | 0.4288 | 3 | 30 | cyclin-dependent protein serine/threonine kinase activity |
| GOMFID | Pvalue | OddsRatio | ExpCount | Count | Size | Term |
| GO:0046978 | 4e-04 | 130.1333 | 0.031 | 2 | 4 | TAP1 binding |
| GO:0036402 | 9e-04 | 65.0583 | 0.0465 | 2 | 6 | proteasome-activating ATPase activity |
| GO:0004953 | 0.0051 | 21.675 | 0.1085 | 2 | 14 | icosanoid receptor activity |
| GO:0008311 | 0.0078 | Inf | 0.0078 | 1 | 1 | double-stranded DNA 3'-5' exodeoxyribonuclease activity |
| GO:0044549 | 0.0078 | Inf | 0.0078 | 1 | 1 | GTP cyclohydrolase binding |
| GO:0047750 | 0.0078 | Inf | 0.0078 | 1 | 1 | cholestenol delta-isomerase activity |
| GO:0072541 | 0.0078 | Inf | 0.0078 | 1 | 1 | peroxynitrite reductase activity |
| GO:0003746 | 0.0084 | 16.2521 | 0.1395 | 2 | 18 | translation elongation factor activity |
| GO:0017025 | 0.0093 | 15.2951 | 0.1473 | 2 | 19 | TBP-class protein binding |
| GOMFID | Pvalue | OddsRatio | ExpCount | Count | Size | Term |
| GO:0003735 | 0 | 4.8707 | 3.1839 | 14 | 195 | structural constituent of ribosome |
| GO:0004983 | 5e-04 | 26.1125 | 0.1633 | 3 | 10 | neuropeptide Y receptor activity |
| GO:0035259 | 0.0011 | 18.2752 | 0.2123 | 3 | 13 | glucocorticoid receptor binding |
| GO:0016717 | 0.0026 | 40.4706 | 0.0816 | 2 | 5 | oxidoreductase activity, acting on paired donors, with oxidation of a pair of donors resulting in the reduction of molecular oxygen to two molecules of water |
| GO:0003676 | 0.0028 | 1.4844 | 60.315 | 80 | 3694 | nucleic acid binding |
| GO:0008432 | 0.0038 | 30.351 | 0.098 | 2 | 6 | JUN kinase binding |
| GO:0044822 | 0.0054 | 1.7382 | 18.3525 | 30 | 1124 | poly(A) RNA binding |
| GO:0016783 | 0.007 | 20.2314 | 0.1306 | 2 | 8 | sulfurtransferase activity |
| GOMFID | Pvalue | OddsRatio | ExpCount | Count | Size | Term |
| GO:0003735 | 0 | 5.4379 | 2.0194 | 10 | 195 | structural constituent of ribosome |
| GO:0033883 | 1e-04 | Inf | 0.0207 | 2 | 2 | pyridoxal phosphatase activity |
| GO:0008097 | 6e-04 | 96.7391 | 0.0414 | 2 | 4 | 5S rRNA binding |
| GO:0008474 | 0.001 | 64.4886 | 0.0518 | 2 | 5 | palmitoyl-(protein) hydrolase activity |
| GO:0003723 | 0.0034 | 2.9617 | 3.6044 | 10 | 371 | RNA binding |
| GO:0008140 | 0.0045 | 24.1755 | 0.1036 | 2 | 10 | cAMP response element binding protein binding |
| GO:0008378 | 0.0047 | 9.7169 | 0.3417 | 3 | 33 | galactosyltransferase activity |
| GO:0044822 | 0.0061 | 1.9406 | 11.6399 | 21 | 1124 | poly(A) RNA binding |
| GOMFID | Pvalue | OddsRatio | ExpCount | Count | Size | Term |
| GO:0003735 | 0 | 7.7755 | 1.7592 | 12 | 195 | structural constituent of ribosome |
| GO:0019843 | 0.001 | 10.018 | 0.4421 | 4 | 49 | rRNA binding |
| GO:0019855 | 0.0028 | 31.8184 | 0.0812 | 2 | 9 | calcium channel inhibitor activity |
| GO:0005549 | 0.0067 | 5.694 | 0.7488 | 4 | 83 | odorant binding |
| GO:0003723 | 0.0077 | 1.8818 | 12.7174 | 22 | 1446 | RNA binding |
| GO:0001604 | 0.009 | Inf | 0.009 | 1 | 1 | urotensin II receptor activity |
| GO:0047220 | 0.009 | Inf | 0.009 | 1 | 1 | galactosylxylosylprotein 3-beta-galactosyltransferase activity |
| GO:0052829 | 0.009 | Inf | 0.009 | 1 | 1 | inositol-1,3,4-trisphosphate 1-phosphatase activity |
| GO:0070037 | 0.009 | Inf | 0.009 | 1 | 1 | rRNA (pseudouridine) methyltransferase activity |
| GO:0070042 | 0.009 | Inf | 0.009 | 1 | 1 | rRNA (uridine-N3-)-methyltransferase activity |
| GO:0071796 | 0.009 | Inf | 0.009 | 1 | 1 | K6-linked polyubiquitin binding |
| GO:0043130 | 0.01 | 5.051 | 0.839 | 4 | 93 | ubiquitin binding |
| GOMFID | Pvalue | OddsRatio | ExpCount | Count | Size | Term |
| GO:0003735 | 0 | 6.0947 | 2.007 | 11 | 195 | structural constituent of ribosome |
| GO:0019843 | 0 | 13.8953 | 0.5043 | 6 | 49 | rRNA binding |
| GO:0004984 | 0.0046 | 2.8212 | 3.7567 | 10 | 365 | olfactory receptor activity |
| GO:0005126 | 0.0063 | 3.0847 | 2.7377 | 8 | 266 | cytokine receptor binding |
| GO:0005125 | 0.0069 | 3.3372 | 2.2128 | 7 | 215 | cytokine activity |
| GO:0046625 | 0.0076 | 17.6898 | 0.1338 | 2 | 13 | sphingolipid binding |
| GO:0043022 | 0.008 | 7.925 | 0.4117 | 3 | 40 | ribosome binding |
| GO:0004659 | 0.0088 | 16.2146 | 0.1441 | 2 | 14 | prenyltransferase activity |
| GOMFID | Pvalue | OddsRatio | ExpCount | Count | Size | Term |
| GO:0004984 | 0 | 8.2622 | 1.7392 | 12 | 365 | olfactory receptor activity |
| GO:0004930 | 1e-04 | 4.0952 | 3.6976 | 13 | 776 | G-protein coupled receptor activity |
| GO:0099600 | 0.0016 | 2.774 | 5.7703 | 14 | 1211 | transmembrane receptor activity |
| GO:0038023 | 0.0023 | 2.6467 | 6.0229 | 14 | 1264 | signaling receptor activity |
| GO:0060089 | 0.0043 | 2.3872 | 7.1474 | 15 | 1500 | molecular transducer activity |
| GO:0001965 | 0.0044 | 22.5609 | 0.1001 | 2 | 21 | G-protein alpha-subunit binding |
| GO:0005140 | 0.0048 | Inf | 0.0048 | 1 | 1 | interleukin-9 receptor binding |
| GO:0015152 | 0.0048 | Inf | 0.0048 | 1 | 1 | glucose-6-phosphate transmembrane transporter activity |
| GO:0044549 | 0.0048 | Inf | 0.0048 | 1 | 1 | GTP cyclohydrolase binding |
| GO:0005549 | 0.0073 | 8.1172 | 0.3955 | 3 | 83 | odorant binding |
| GO:1901505 | 0.0078 | 16.4795 | 0.1334 | 2 | 28 | carbohydrate derivative transporter activity |
| GOMFID | Pvalue | OddsRatio | ExpCount | Count | Size | Term |
| GO:0031996 | 0.0023 | 33.4588 | 0.0719 | 2 | 13 | thioesterase binding |
| GO:0018773 | 0.0055 | Inf | 0.0055 | 1 | 1 | acetylpyruvate hydrolase activity |
| GO:0034545 | 0.0055 | Inf | 0.0055 | 1 | 1 | fumarylpyruvate hydrolase activity |
| GO:0047621 | 0.0055 | Inf | 0.0055 | 1 | 1 | acylpyruvate hydrolase activity |
| GO:0070191 | 0.0055 | Inf | 0.0055 | 1 | 1 | methionine-R-sulfoxide reductase activity |
| GO:0070363 | 0.0055 | Inf | 0.0055 | 1 | 1 | mitochondrial light strand promoter sense binding |
| GOMFID | Pvalue | OddsRatio | ExpCount | Count | Size | Term |
| GO:0004984 | 6e-04 | 4.1098 | 2.3885 | 9 | 365 | olfactory receptor activity |
| GO:0004930 | 0.0016 | 2.8158 | 5.078 | 13 | 776 | G-protein coupled receptor activity |
| GO:0005549 | 0.0021 | 7.957 | 0.5431 | 4 | 83 | odorant binding |
| GO:0050811 | 0.0042 | 23.7989 | 0.0982 | 2 | 15 | GABA receptor binding |
| GO:0099600 | 0.0053 | 2.2226 | 7.9246 | 16 | 1211 | transmembrane receptor activity |
| GO:0000994 | 0.0065 | Inf | 0.0065 | 1 | 1 | RNA polymerase III core binding |
| GO:0003948 | 0.0065 | Inf | 0.0065 | 1 | 1 | N4-(beta-N-acetylglucosaminyl)-L-asparaginase activity |
| GO:0031707 | 0.0065 | Inf | 0.0065 | 1 | 1 | endothelin A receptor binding |
| GO:0033862 | 0.0065 | Inf | 0.0065 | 1 | 1 | UMP kinase activity |
| GO:0052856 | 0.0065 | Inf | 0.0065 | 1 | 1 | NADHX epimerase activity |
| GO:0052857 | 0.0065 | Inf | 0.0065 | 1 | 1 | NADPHX epimerase activity |
| GO:0052858 | 0.0065 | Inf | 0.0065 | 1 | 1 | peptidyl-lysine N-acetyltransferase activity, acting on acetyl phosphate as donor |
| GO:0090450 | 0.0065 | Inf | 0.0065 | 1 | 1 | inosine-diphosphatase activity |
| GO:0097383 | 0.0065 | Inf | 0.0065 | 1 | 1 | dIDP diphosphatase activity |
| GO:1901640 | 0.0065 | Inf | 0.0065 | 1 | 1 | XTP binding |
| GO:1901641 | 0.0065 | Inf | 0.0065 | 1 | 1 | ITP binding |
| GO:0019201 | 0.0075 | 17.1826 | 0.1309 | 2 | 20 | nucleotide kinase activity |
| GO:0038023 | 0.0079 | 2.1204 | 8.2714 | 16 | 1264 | signaling receptor activity |
| GOMFID | Pvalue | OddsRatio | ExpCount | Count | Size | Term |
| GO:0044822 | 5e-04 | 2.5036 | 8.9263 | 20 | 1124 | poly(A) RNA binding |
| GO:0004984 | 7e-04 | 3.7379 | 2.8987 | 10 | 365 | olfactory receptor activity |
| GO:0048020 | 0.0027 | 11.9746 | 0.278 | 3 | 35 | CCR chemokine receptor binding |
| GO:0008009 | 0.0065 | 8.5082 | 0.3812 | 3 | 48 | chemokine activity |
| GO:0005130 | 0.0079 | Inf | 0.0079 | 1 | 1 | granulocyte colony-stimulating factor receptor binding |
| GO:0015195 | 0.0079 | Inf | 0.0079 | 1 | 1 | L-threonine transmembrane transporter activity |
| GO:0018738 | 0.0079 | Inf | 0.0079 | 1 | 1 | S-formylglutathione hydrolase activity |
| GO:0034353 | 0.0079 | Inf | 0.0079 | 1 | 1 | RNA pyrophosphohydrolase activity |
| GO:0034590 | 0.0079 | Inf | 0.0079 | 1 | 1 | L-hydroxyproline transmembrane transporter activity |
| GO:0042292 | 0.0079 | Inf | 0.0079 | 1 | 1 | URM1 activating enzyme activity |
| GO:0052856 | 0.0079 | Inf | 0.0079 | 1 | 1 | NADHX epimerase activity |
| GO:0052857 | 0.0079 | Inf | 0.0079 | 1 | 1 | NADPHX epimerase activity |
| GO:0052906 | 0.0079 | Inf | 0.0079 | 1 | 1 | tRNA (guanine(37)-N(1))-methyltransferase activity |
| GO:0061604 | 0.0079 | Inf | 0.0079 | 1 | 1 | molybdopterin-synthase sulfurtransferase activity |
| GO:0061605 | 0.0079 | Inf | 0.0079 | 1 | 1 | molybdopterin-synthase adenylyltransferase activity |
| GO:0070180 | 0.0079 | Inf | 0.0079 | 1 | 1 | large ribosomal subunit rRNA binding |
| GO:0098782 | 0.0079 | Inf | 0.0079 | 1 | 1 | mechanically-gated potassium channel activity |
| GOMFID | Pvalue | OddsRatio | ExpCount | Count | Size | Term |
| GO:0004984 | 0 | 9.6473 | 1.9247 | 15 | 365 | olfactory receptor activity |
| GO:0004930 | 0 | 5.0558 | 4.092 | 17 | 776 | G-protein coupled receptor activity |
| GO:0099600 | 0 | 3.6026 | 6.3858 | 19 | 1211 | transmembrane receptor activity |
| GO:0038023 | 0 | 3.4366 | 6.6653 | 19 | 1264 | signaling receptor activity |
| GO:0004066 | 0 | Inf | 0.0105 | 2 | 2 | asparagine synthase (glutamine-hydrolyzing) activity |
| GO:0060089 | 2e-04 | 2.8417 | 7.9098 | 19 | 1500 | molecular transducer activity |
| GO:0005549 | 0.001 | 9.9843 | 0.4377 | 4 | 83 | odorant binding |
| GO:0016879 | 0.0021 | 13.01 | 0.2531 | 3 | 48 | ligase activity, forming carbon-nitrogen bonds |
| GO:0031707 | 0.0053 | Inf | 0.0053 | 1 | 1 | endothelin A receptor binding |
| GO:0033867 | 0.0053 | Inf | 0.0053 | 1 | 1 | Fas-activated serine/threonine kinase activity |
| GO:0042605 | 0.007 | 17.5477 | 0.1266 | 2 | 24 | peptide antigen binding |
| GOMFID | Pvalue | OddsRatio | ExpCount | Count | Size | Term |
| GO:0004984 | 0 | 10.5352 | 1.1827 | 10 | 365 | olfactory receptor activity |
| GO:0004930 | 0 | 5.3648 | 2.5144 | 11 | 776 | G-protein coupled receptor activity |
| GO:0099600 | 1e-04 | 4.1381 | 3.9238 | 13 | 1211 | transmembrane receptor activity |
| GO:0038023 | 6e-04 | 3.548 | 4.0956 | 12 | 1264 | signaling receptor activity |
| GO:0060089 | 8e-04 | 3.2674 | 4.8602 | 13 | 1500 | molecular transducer activity |
| GO:0015207 | 0.0032 | Inf | 0.0032 | 1 | 1 | adenine transmembrane transporter activity |
| GO:0031710 | 0.0032 | Inf | 0.0032 | 1 | 1 | neuromedin B receptor binding |
| GO:0042163 | 0.0032 | Inf | 0.0032 | 1 | 1 | interleukin-12 beta subunit binding |
| GO:0045513 | 0.0032 | Inf | 0.0032 | 1 | 1 | interleukin-27 binding |
| GO:0047280 | 0.0032 | Inf | 0.0032 | 1 | 1 | nicotinamide phosphoribosyltransferase activity |
| GO:0008260 | 0.0065 | 313.76 | 0.0065 | 1 | 2 | 3-oxoacid CoA-transferase activity |
| GO:0004514 | 0.0097 | 156.87 | 0.0097 | 1 | 3 | nicotinate-nucleotide diphosphorylase (carboxylating) activity |
| GO:0031720 | 0.0097 | 156.87 | 0.0097 | 1 | 3 | haptoglobin binding |
| GOMFID | Pvalue | OddsRatio | ExpCount | Count | Size | Term |
| GO:0004984 | 0 | 10.7188 | 1.6464 | 14 | 365 | olfactory receptor activity |
| GO:0004930 | 0 | 6.1843 | 3.5004 | 17 | 776 | G-protein coupled receptor activity |
| GO:0099600 | 0 | 4.121 | 5.4626 | 18 | 1211 | transmembrane receptor activity |
| GO:0038023 | 0 | 3.9313 | 5.7017 | 18 | 1264 | signaling receptor activity |
| GO:0060089 | 1e-04 | 3.2512 | 6.7662 | 18 | 1500 | molecular transducer activity |
| GO:0030492 | 2e-04 | 151.3623 | 0.0226 | 2 | 5 | hemoglobin binding |
| GO:0005549 | 5e-04 | 11.7816 | 0.3744 | 4 | 83 | odorant binding |
| GO:0004145 | 0.0045 | Inf | 0.0045 | 1 | 1 | diamine N-acetyltransferase activity |
| GO:0042163 | 0.0045 | Inf | 0.0045 | 1 | 1 | interleukin-12 beta subunit binding |
| GO:0042586 | 0.0045 | Inf | 0.0045 | 1 | 1 | peptide deformylase activity |
| GO:0045513 | 0.0045 | Inf | 0.0045 | 1 | 1 | interleukin-27 binding |
| GO:0005184 | 0.0061 | 18.8949 | 0.1173 | 2 | 26 | neuropeptide hormone activity |
| GOMFID | Pvalue | OddsRatio | ExpCount | Count | Size | Term |
| GO:0036402 | 0.0019 | 43.2056 | 0.0694 | 2 | 6 | proteasome-activating ATPase activity |
| GO:0008134 | 0.0023 | 2.5518 | 5.8508 | 14 | 506 | transcription factor binding |
| GO:0008649 | 0.0095 | 15.704 | 0.1503 | 2 | 13 | rRNA methyltransferase activity |
| GOMFID | Pvalue | OddsRatio | ExpCount | Count | Size | Term |
| GO:0005125 | 4e-04 | 4.8394 | 1.7894 | 8 | 215 | cytokine activity |
| GO:0005164 | 0.0016 | 14.61 | 0.233 | 3 | 28 | tumor necrosis factor receptor binding |
| GO:0050786 | 0.0036 | 26.8734 | 0.0916 | 2 | 11 | RAGE receptor binding |
| GO:0005243 | 0.0067 | 18.5999 | 0.1248 | 2 | 15 | gap junction channel activity |
| GO:0005130 | 0.0083 | Inf | 0.0083 | 1 | 1 | granulocyte colony-stimulating factor receptor binding |
| GO:0033798 | 0.0083 | Inf | 0.0083 | 1 | 1 | thyroxine 5-deiodinase activity |
| GO:1990829 | 0.0083 | Inf | 0.0083 | 1 | 1 | C-rich single-stranded DNA binding |
| GOMFID | Pvalue | OddsRatio | ExpCount | Count | Size | Term |
| GO:0051879 | 4e-04 | 13.8697 | 0.3492 | 4 | 23 | Hsp90 protein binding |
| GO:0016790 | 0.001 | 10.1309 | 0.4555 | 4 | 30 | thiolester hydrolase activity |
| GO:0051087 | 0.0013 | 5.4423 | 1.1996 | 6 | 79 | chaperone binding |
| GO:0016853 | 0.0018 | 3.8554 | 2.2169 | 8 | 146 | isomerase activity |
| GO:0008432 | 0.0033 | 32.6941 | 0.0911 | 2 | 6 | JUN kinase binding |
| GO:0003676 | 0.0046 | 1.4719 | 56.0906 | 74 | 3694 | nucleic acid binding |
| GO:0044822 | 0.0058 | 1.826 | 14.5502 | 25 | 978 | poly(A) RNA binding |
| GO:0003729 | 0.007 | 3.3346 | 2.2169 | 7 | 146 | mRNA binding |
| GO:0030881 | 0.0077 | 18.6787 | 0.1367 | 2 | 9 | beta-2-microglobulin binding |
| GO:0005198 | 0.008 | 1.9359 | 10.3405 | 19 | 681 | structural molecule activity |
| GOMFID | Pvalue | OddsRatio | ExpCount | Count | Size | Term |
| GO:0050786 | 0.0016 | 40.8993 | 0.0608 | 2 | 11 | RAGE receptor binding |
| GO:0004930 | 0.0036 | 2.8168 | 4.2892 | 11 | 776 | G-protein coupled receptor activity |
| GO:0004984 | 0.0041 | 3.7383 | 2.0175 | 7 | 365 | olfactory receptor activity |
| GO:0033038 | 0.0044 | 22.9956 | 0.0995 | 2 | 18 | bitter taste receptor activity |
| GO:0004941 | 0.0055 | Inf | 0.0055 | 1 | 1 | beta2-adrenergic receptor activity |
| GO:0016913 | 0.0055 | Inf | 0.0055 | 1 | 1 | follicle-stimulating hormone activity |
| GO:0031713 | 0.0055 | Inf | 0.0055 | 1 | 1 | B2 bradykinin receptor binding |
| GO:0052856 | 0.0055 | Inf | 0.0055 | 1 | 1 | NADHX epimerase activity |
| GO:0052857 | 0.0055 | Inf | 0.0055 | 1 | 1 | NADPHX epimerase activity |
| GO:0004129 | 0.0071 | 17.5148 | 0.1271 | 2 | 23 | cytochrome-c oxidase activity |
| GO:0019865 | 0.0071 | 17.5148 | 0.1271 | 2 | 23 | immunoglobulin binding |
| GO:0016675 | 0.0077 | 16.7176 | 0.1327 | 2 | 24 | oxidoreductase activity, acting on a heme group of donors |
| GOMFID | Pvalue | OddsRatio | ExpCount | Count | Size | Term |
| GO:0004984 | 3e-04 | 4.1362 | 2.6436 | 10 | 365 | olfactory receptor activity |
| GO:0004930 | 0.0014 | 2.7309 | 5.6203 | 14 | 776 | G-protein coupled receptor activity |
| GO:0015631 | 0.0026 | 4.04 | 1.8541 | 7 | 256 | tubulin binding |
| GO:0099600 | 0.0062 | 2.1184 | 8.7709 | 17 | 1211 | transmembrane receptor activity |
| GO:0004306 | 0.0072 | Inf | 0.0072 | 1 | 1 | ethanolamine-phosphate cytidylyltransferase activity |
| GO:0004418 | 0.0072 | Inf | 0.0072 | 1 | 1 | hydroxymethylbilane synthase activity |
| GO:0008108 | 0.0072 | Inf | 0.0072 | 1 | 1 | UDP-glucose:hexose-1-phosphate uridylyltransferase activity |
| GO:0008460 | 0.0072 | Inf | 0.0072 | 1 | 1 | dTDP-glucose 4,6-dehydratase activity |
| GO:0034353 | 0.0072 | Inf | 0.0072 | 1 | 1 | RNA pyrophosphohydrolase activity |
| GO:0050124 | 0.0072 | Inf | 0.0072 | 1 | 1 | N-acylneuraminate-9-phosphatase activity |
| GO:0038023 | 0.0094 | 2.0209 | 9.1548 | 17 | 1264 | signaling receptor activity |
| GOMFID | Pvalue | OddsRatio | ExpCount | Count | Size | Term |
| GO:0003735 | 3e-04 | 5.1527 | 1.6849 | 8 | 195 | structural constituent of ribosome |
| GO:0016491 | 7e-04 | 2.8393 | 5.7726 | 15 | 673 | oxidoreductase activity |
| GO:0015078 | 0.0011 | 6.8871 | 0.7863 | 5 | 91 | hydrogen ion transmembrane transporter activity |
| GO:0004726 | 0.002 | 38.801 | 0.0691 | 2 | 8 | non-membrane spanning protein tyrosine phosphatase activity |
| GO:0003954 | 0.004 | 10.3295 | 0.3197 | 3 | 37 | NADH dehydrogenase activity |
| GO:0008137 | 0.004 | 10.3295 | 0.3197 | 3 | 37 | NADH dehydrogenase (ubiquinone) activity |
| GO:0051087 | 0.0049 | 6.2743 | 0.6826 | 4 | 79 | chaperone binding |
| GO:0003676 | 0.0066 | 1.6201 | 31.9177 | 45 | 3694 | nucleic acid binding |
| GO:0004168 | 0.0086 | Inf | 0.0086 | 1 | 1 | dolichol kinase activity |
| GO:0004506 | 0.0086 | Inf | 0.0086 | 1 | 1 | squalene monooxygenase activity |
| GO:0004638 | 0.0086 | Inf | 0.0086 | 1 | 1 | phosphoribosylaminoimidazole carboxylase activity |
| GO:0004639 | 0.0086 | Inf | 0.0086 | 1 | 1 | phosphoribosylaminoimidazolesuccinocarboxamide synthase activity |
| GO:0004853 | 0.0086 | Inf | 0.0086 | 1 | 1 | uroporphyrinogen decarboxylase activity |
| GO:0017172 | 0.0086 | Inf | 0.0086 | 1 | 1 | cysteine dioxygenase activity |
| GO:0019119 | 0.0086 | Inf | 0.0086 | 1 | 1 | phenanthrene-9,10-epoxide hydrolase activity |
| GO:0032427 | 0.0086 | Inf | 0.0086 | 1 | 1 | GBD domain binding |
| GO:0032542 | 0.0086 | Inf | 0.0086 | 1 | 1 | sulfiredoxin activity |
| GO:0033798 | 0.0086 | Inf | 0.0086 | 1 | 1 | thyroxine 5-deiodinase activity |
| GO:0050613 | 0.0086 | Inf | 0.0086 | 1 | 1 | delta14-sterol reductase activity |
| GO:0097162 | 0.0086 | Inf | 0.0086 | 1 | 1 | MADS box domain binding |
| GO:0019843 | 0.0087 | 7.629 | 0.4234 | 3 | 49 | rRNA binding |
| GO:0042826 | 0.0096 | 5.1094 | 0.8295 | 4 | 96 | histone deacetylase binding |
| GO:0016655 | 0.0097 | 7.3102 | 0.4407 | 3 | 51 | oxidoreductase activity, acting on NAD(P)H, quinone or similar compound as acceptor |
| GOMFID | Pvalue | OddsRatio | ExpCount | Count | Size | Term |
| GO:0017046 | 0.0019 | 13.5056 | 0.247 | 3 | 36 | peptide hormone binding |
| GO:0051428 | 0.0059 | 19.644 | 0.1166 | 2 | 17 | peptide hormone receptor binding |
| GO:0001616 | 0.0069 | Inf | 0.0069 | 1 | 1 | growth hormone secretagogue receptor activity |
| GO:0004475 | 0.0069 | Inf | 0.0069 | 1 | 1 | mannose-1-phosphate guanylyltransferase activity |
| GO:0004512 | 0.0069 | Inf | 0.0069 | 1 | 1 | inositol-3-phosphate synthase activity |
| GO:0004990 | 0.0069 | Inf | 0.0069 | 1 | 1 | oxytocin receptor activity |
| GO:0017065 | 0.0069 | Inf | 0.0069 | 1 | 1 | single-strand selective uracil DNA N-glycosylase activity |
| GO:0017172 | 0.0069 | Inf | 0.0069 | 1 | 1 | cysteine dioxygenase activity |
| GO:0030735 | 0.0069 | Inf | 0.0069 | 1 | 1 | carnosine N-methyltransferase activity |
| GO:0032542 | 0.0069 | Inf | 0.0069 | 1 | 1 | sulfiredoxin activity |
| GO:0050038 | 0.0069 | Inf | 0.0069 | 1 | 1 | L-xylulose reductase (NADP+) activity |
| GO:0070191 | 0.0069 | Inf | 0.0069 | 1 | 1 | methionine-R-sulfoxide reductase activity |
| GO:0070976 | 0.0069 | Inf | 0.0069 | 1 | 1 | TIR domain binding |
| GO:0004722 | 0.007 | 8.2423 | 0.3911 | 3 | 57 | protein serine/threonine phosphatase activity |
| NA. |
| n/a |
| NA. |
| n/a |
| NA. |
| n/a |
| NA. |
| n/a |
| NA. |
| n/a |
| NA. |
| n/a |
| NA. |
| n/a |
| NA. |
| n/a |
| NA. |
| n/a |
| NA. |
| n/a |
| NA. |
| n/a |
| NA. |
| n/a |
| NA. |
| n/a |
| NA. |
| n/a |
| NA. |
| n/a |
| NA. |
| n/a |
| NA. |
| n/a |
| NA. |
| n/a |
| NA. |
| n/a |
| NA. |
| n/a |
| NA. |
| n/a |
| NA. |
| n/a |
| NA. |
| n/a |
| NA. |
| n/a |
| NA. |
| n/a |
| NA. |
| n/a |
| NA. |
| n/a |
| NA. |
| n/a |
| NA. |
| n/a |
| NA. |
| n/a |
| NA. |
| n/a |
| NA. |
| n/a |
| NA. |
| n/a |
| NA. |
| n/a |
| NA. |
| n/a |
| NA. |
| n/a |
| NA. |
| n/a |
| NA. |
| n/a |
| NA. |
| n/a |
| NA. |
| n/a |
| NA. |
| n/a |
| NA. |
| n/a |
| NA. |
| n/a |
| NA. |
| n/a |
| NA. |
| n/a |
| NA. |
| n/a |
| NA. |
| n/a |
| NA. |
| n/a |
| NA. |
| n/a |
| NA. |
| n/a |
| NA. |
| n/a |
| NA. |
| n/a |
| NA. |
| n/a |
| NA. |
| n/a |
| NA. |
| n/a |
| NA. |
| n/a |
| NA. |
| n/a |
| NA. |
| n/a |
| NA. |
| n/a |
| NA. |
| n/a |
| NA. |
| n/a |
| NA. |
| n/a |
| NA. |
| n/a |
| NA. |
| n/a |
| NA. |
| n/a |
| NA. |
| n/a |
| NA. |
| n/a |
| NA. |
| n/a |
| NA. |
| n/a |
| NA. |
| n/a |
| NA. |
| n/a |
| NA. |
| n/a |
| NA. |
| n/a |
| NA. |
| n/a |
| NA. |
| n/a |
| NA. |
| n/a |
| NA. |
| n/a |
| NA. |
| n/a |
| NA. |
| n/a |
| NA. |
| n/a |
| NA. |
| n/a |
| NA. |
| n/a |
| NA. |
| n/a |
| NA. |
| n/a |
| NA. |
| n/a |
| NA. |
| n/a |
| NA. |
| n/a |
| NA. |
| n/a |
| NA. |
| n/a |
| NA. |
| n/a |
| NA. |
| n/a |
| NA. |
| n/a |
| NA. |
| n/a |
| NA. |
| n/a |
| NA. |
| n/a |
| NA. |
| n/a |
| NA. |
| n/a |
| NA. |
| n/a |
| NA. |
| n/a |
| NA. |
| n/a |
| NA. |
| n/a |
| NA. |
| n/a |
| NA. |
| n/a |
| NA. |
| n/a |
| NA. |
| n/a |
| NA. |
| n/a |
| NA. |
| n/a |
| NA. |
| n/a |
| NA. |
| n/a |
| NA. |
| n/a |
| NA. |
| n/a |
| NA. |
| n/a |
| GOMFID | Pvalue | OddsRatio | ExpCount | Count | Size | Term |
| GO:0006084 | 0.0082 | 7.9773 | 0.4171 | 3 | 30 | acetyl-CoA metabolic process |
| GOMFID | Pvalue | OddsRatio | ExpCount | Count | Size | Term |
| GO:0070537 | 1e-04 | Inf | 0.021 | 2 | 2 | histone H2A K63-linked deubiquitination |
| GO:0032715 | 3e-04 | 13.7427 | 0.3367 | 4 | 32 | negative regulation of interleukin-6 production |
| GO:0032720 | 0.0011 | 9.8595 | 0.4525 | 4 | 43 | negative regulation of tumor necrosis factor production |
| GO:0046148 | 0.0014 | 9.1535 | 0.484 | 4 | 46 | pigment biosynthetic process |
| GO:0016198 | 0.0016 | 47.5828 | 0.0631 | 2 | 6 | axon choice point recognition |
| GO:0050862 | 0.0022 | 38.0638 | 0.0737 | 2 | 7 | positive regulation of T cell receptor signaling pathway |
| GO:0035587 | 0.0028 | 11.9537 | 0.2841 | 3 | 27 | purinergic receptor signaling pathway |
| GO:0042445 | 0.0031 | 3.9064 | 1.9045 | 7 | 181 | hormone metabolic process |
| GO:0042363 | 0.0038 | 27.1849 | 0.0947 | 2 | 9 | fat-soluble vitamin catabolic process |
| GO:0046501 | 0.0038 | 27.1849 | 0.0947 | 2 | 9 | protoporphyrinogen IX metabolic process |
| GO:0044802 | 0.0043 | 2.126 | 9.0807 | 18 | 863 | single-organism membrane organization |
| GO:0002003 | 0.0047 | 23.7853 | 0.1052 | 2 | 10 | angiotensin maturation |
| GO:0006414 | 0.0056 | 3.4809 | 2.1255 | 7 | 202 | translational elongation |
| GO:0032700 | 0.0057 | 21.1411 | 0.1157 | 2 | 11 | negative regulation of interleukin-17 production |
| GO:0006413 | 0.0058 | 3.137 | 2.6937 | 8 | 256 | translational initiation |
| GO:0007628 | 0.0058 | 8.9606 | 0.3683 | 3 | 35 | adult walking behavior |
| GO:0060177 | 0.0068 | 19.0258 | 0.1263 | 2 | 12 | regulation of angiotensin metabolic process |
| GO:0060119 | 0.0068 | 8.4325 | 0.3893 | 3 | 37 | inner ear receptor cell development |
| GO:0016043 | 0.0072 | 1.4894 | 61.2292 | 77 | 5819 | cellular component organization |
| GO:0050850 | 0.0085 | 7.7472 | 0.4209 | 3 | 40 | positive regulation of calcium-mediated signaling |
| GO:0001505 | 0.0095 | 3.5108 | 1.7993 | 6 | 171 | regulation of neurotransmitter levels |
| GO:0006415 | 0.0097 | 3.4894 | 1.8098 | 6 | 172 | translational termination |
| GO:0006836 | 0.0097 | 3.4894 | 1.8098 | 6 | 172 | neurotransmitter transport |
| GOMFID | Pvalue | OddsRatio | ExpCount | Count | Size | Term |
| GO:0048247 | 4e-04 | 9.0782 | 0.6186 | 5 | 50 | lymphocyte chemotaxis |
| GO:0034316 | 9e-04 | 80.651 | 0.0495 | 2 | 4 | negative regulation of Arp2/3 complex-mediated actin nucleation |
| GO:0035021 | 9e-04 | 80.651 | 0.0495 | 2 | 4 | negative regulation of Rac protein signal transduction |
| GO:0031122 | 0.0012 | 9.5684 | 0.4701 | 4 | 38 | cytoplasmic microtubule organization |
| GO:0070303 | 0.0015 | 9.0357 | 0.4949 | 4 | 40 | negative regulation of stress-activated protein kinase signaling cascade |
| GO:0051665 | 0.0015 | 53.7639 | 0.0619 | 2 | 5 | membrane raft localization |
| GO:0045859 | 0.0019 | 2.1546 | 10.4788 | 21 | 847 | regulation of protein kinase activity |
| GO:0045010 | 0.0019 | 8.339 | 0.532 | 4 | 43 | actin nucleation |
| GO:0006612 | 0.0019 | 3.7852 | 2.2516 | 8 | 182 | protein targeting to membrane |
| GO:0044774 | 0.002 | 4.9107 | 1.3114 | 6 | 106 | mitotic DNA integrity checkpoint |
| GO:0006942 | 0.0021 | 5.9987 | 0.9031 | 5 | 73 | regulation of striated muscle contraction |
| GO:0042552 | 0.0021 | 4.8618 | 1.3238 | 6 | 107 | myelination |
| GO:0000186 | 0.0022 | 3.376 | 2.8331 | 9 | 229 | activation of MAPKK activity |
| GO:0032273 | 0.0022 | 4.8138 | 1.3361 | 6 | 108 | positive regulation of protein polymerization |
| GO:0001887 | 0.0025 | 4.7206 | 1.3609 | 6 | 110 | selenium compound metabolic process |
| GO:0007272 | 0.0025 | 4.7206 | 1.3609 | 6 | 110 | ensheathment of neurons |
| GO:0072599 | 0.0025 | 4.7206 | 1.3609 | 6 | 110 | establishment of protein localization to endoplasmic reticulum |
| GO:0006418 | 0.0025 | 7.7419 | 0.5691 | 4 | 46 | tRNA aminoacylation for protein translation |
| GO:0000077 | 0.0026 | 4.0166 | 1.8557 | 7 | 150 | DNA damage checkpoint |
| GO:0090224 | 0.0028 | 12.1469 | 0.2845 | 3 | 23 | regulation of spindle organization |
| GO:0030913 | 0.0031 | 32.2542 | 0.0866 | 2 | 7 | paranodal junction assembly |
| GO:0097459 | 0.0031 | 32.2542 | 0.0866 | 2 | 7 | iron ion import into cell |
| GO:0043038 | 0.0031 | 7.2243 | 0.6062 | 4 | 49 | amino acid activation |
| GO:0034220 | 0.0033 | 2.0136 | 11.716 | 22 | 947 | ion transmembrane transport |
| GO:0015031 | 0.0033 | 1.747 | 21.8731 | 35 | 1768 | protein transport |
| GO:0086004 | 0.0035 | 11.0412 | 0.3093 | 3 | 25 | regulation of cardiac muscle cell contraction |
| GO:0070588 | 0.0037 | 3.117 | 3.0558 | 9 | 247 | calcium ion transmembrane transport |
| GO:0006888 | 0.0041 | 3.7027 | 2.0042 | 7 | 162 | ER to Golgi vesicle-mediated transport |
| GO:0019740 | 0.0041 | 26.8767 | 0.099 | 2 | 8 | nitrogen utilization |
| GO:1901841 | 0.0041 | 26.8767 | 0.099 | 2 | 8 | regulation of high voltage-gated calcium channel activity |
| GO:0006900 | 0.0041 | 4.229 | 1.5093 | 6 | 122 | membrane budding |
| GO:0009642 | 0.0052 | 23.0357 | 0.1113 | 2 | 9 | response to light intensity |
| GO:0006461 | 0.0057 | 1.796 | 16.1574 | 27 | 1306 | protein complex assembly |
| GO:0044765 | 0.0057 | 1.5118 | 46.1834 | 62 | 3733 | single-organism transport |
| GO:1990266 | 0.0059 | 4.6293 | 1.1506 | 5 | 93 | neutrophil migration |
| GO:0042325 | 0.006 | 1.7533 | 17.8152 | 29 | 1440 | regulation of phosphorylation |
| GO:0022607 | 0.0065 | 1.5997 | 28.7394 | 42 | 2323 | cellular component assembly |
| GO:0030490 | 0.0065 | 8.6718 | 0.3835 | 3 | 31 | maturation of SSU-rRNA |
| GO:0046329 | 0.0077 | 8.0927 | 0.4083 | 3 | 33 | negative regulation of JNK cascade |
| GO:0032530 | 0.0078 | 17.9144 | 0.1361 | 2 | 11 | regulation of microvillus organization |
| GO:1901673 | 0.0078 | 17.9144 | 0.1361 | 2 | 11 | regulation of mitotic spindle assembly |
| GO:0043409 | 0.0079 | 3.6566 | 1.732 | 6 | 140 | negative regulation of MAPK cascade |
| GO:0043507 | 0.0081 | 5.413 | 0.7918 | 4 | 64 | positive regulation of JUN kinase activity |
| GO:0090307 | 0.0082 | 7.9094 | 0.4166 | 3 | 34 | mitotic spindle assembly |
| GO:0070997 | 0.0082 | 2.7315 | 3.4641 | 9 | 280 | neuron death |
| GO:0071621 | 0.0084 | 4.2413 | 1.2495 | 5 | 101 | granulocyte chemotaxis |
| GO:0071902 | 0.0084 | 2.7213 | 3.4764 | 9 | 281 | positive regulation of protein serine/threonine kinase activity |
| GO:0072593 | 0.0086 | 2.9175 | 2.8826 | 8 | 233 | reactive oxygen species metabolic process |
| GO:0006614 | 0.0087 | 4.1973 | 1.2619 | 5 | 102 | SRP-dependent cotranslational protein targeting to membrane |
| GO:0032872 | 0.009 | 3.1655 | 2.3259 | 7 | 188 | regulation of stress-activated MAPK cascade |
| GO:0042769 | 0.0091 | 7.5859 | 0.433 | 3 | 35 | DNA damage response, detection of DNA damage |
| GO:0006468 | 0.0092 | 1.6406 | 21.6875 | 33 | 1753 | protein phosphorylation |
| GO:0000165 | 0.0092 | 2.0386 | 8.2986 | 16 | 686 | MAPK cascade |
| GO:0003376 | 0.0093 | 16.1219 | 0.1485 | 2 | 12 | sphingosine-1-phosphate signaling pathway |
| GO:0031573 | 0.0093 | 16.1219 | 0.1485 | 2 | 12 | intra-S DNA damage checkpoint |
| GO:0051597 | 0.0093 | 16.1219 | 0.1485 | 2 | 12 | response to methylmercury |
| GOMFID | Pvalue | OddsRatio | ExpCount | Count | Size | Term |
| GO:0060421 | 2e-04 | 11.4758 | 0.532 | 5 | 27 | positive regulation of heart growth |
| GO:0055025 | 2e-04 | 10.5181 | 0.5715 | 5 | 29 | positive regulation of cardiac muscle tissue development |
| GO:0032108 | 6e-04 | 8.4112 | 0.6897 | 5 | 35 | negative regulation of response to nutrient levels |
| GO:0022607 | 7e-04 | 1.6096 | 45.7756 | 67 | 2323 | cellular component assembly |
| GO:0044281 | 7e-04 | 1.5854 | 50.1305 | 72 | 2544 | small molecule metabolic process |
| GO:0055021 | 0.001 | 7.4197 | 0.7685 | 5 | 39 | regulation of cardiac muscle tissue growth |
| GO:0060252 | 0.0011 | 18.8284 | 0.2168 | 3 | 11 | positive regulation of glial cell proliferation |
| GO:0044774 | 0.0012 | 4.1424 | 2.0888 | 8 | 106 | mitotic DNA integrity checkpoint |
| GO:0034605 | 0.0013 | 4.059 | 2.1282 | 8 | 108 | cellular response to heat |
| GO:1901991 | 0.0018 | 3.2412 | 3.2908 | 10 | 167 | negative regulation of mitotic cell cycle phase transition |
| GO:0022613 | 0.002 | 2.4071 | 7.0348 | 16 | 357 | ribonucleoprotein complex biogenesis |
| GO:0061051 | 0.0023 | 50.0651 | 0.0788 | 2 | 4 | positive regulation of cell growth involved in cardiac muscle cell development |
| GO:0060999 | 0.0027 | 7.7407 | 0.5912 | 4 | 30 | positive regulation of dendritic spine development |
| GO:2000249 | 0.0027 | 7.7407 | 0.5912 | 4 | 30 | regulation of actin cytoskeleton reorganization |
| GO:2000377 | 0.0028 | 3.264 | 2.9361 | 9 | 149 | regulation of reactive oxygen species metabolic process |
| GO:0000075 | 0.003 | 2.6837 | 4.7293 | 12 | 240 | cell cycle checkpoint |
| GO:0048732 | 0.0032 | 2.1702 | 8.7492 | 18 | 444 | gland development |
| GO:0016925 | 0.0033 | 3.4654 | 2.4632 | 8 | 125 | protein sumoylation |
| GO:0044770 | 0.0036 | 2.0957 | 9.5571 | 19 | 485 | cell cycle phase transition |
| GO:0031571 | 0.0036 | 4.3917 | 1.4779 | 6 | 75 | mitotic G1 DNA damage checkpoint |
| GO:1903147 | 0.0037 | 33.3746 | 0.0985 | 2 | 5 | negative regulation of mitophagy |
| GO:0045428 | 0.0038 | 5.2508 | 1.0444 | 5 | 53 | regulation of nitric oxide biosynthetic process |
| GO:0048636 | 0.0038 | 5.2508 | 1.0444 | 5 | 53 | positive regulation of muscle organ development |
| GO:0010948 | 0.0038 | 2.5913 | 4.8869 | 12 | 248 | negative regulation of cell cycle process |
| GO:0051340 | 0.004 | 3.3499 | 2.542 | 8 | 129 | regulation of ligase activity |
| GO:1901863 | 0.0041 | 5.1433 | 1.0641 | 5 | 54 | positive regulation of muscle tissue development |
| GO:0031442 | 0.0042 | 10.7549 | 0.335 | 3 | 17 | positive regulation of mRNA 3'-end processing |
| GO:1901566 | 0.0044 | 1.6301 | 26.1096 | 40 | 1325 | organonitrogen compound biosynthetic process |
| GO:0031123 | 0.0045 | 3.6501 | 2.0494 | 7 | 104 | RNA 3'-end processing |
| GO:0046209 | 0.0046 | 4.15 | 1.5567 | 6 | 79 | nitric oxide metabolic process |
| GO:0006413 | 0.0049 | 2.5051 | 5.0446 | 12 | 256 | translational initiation |
| GO:0051900 | 0.005 | 10.0373 | 0.3547 | 3 | 18 | regulation of mitochondrial depolarization |
| GO:0008286 | 0.0051 | 2.3058 | 6.3845 | 14 | 324 | insulin receptor signaling pathway |
| GO:0007626 | 0.0052 | 2.7607 | 3.8228 | 10 | 194 | locomotory behavior |
| GO:0033554 | 0.0053 | 1.5432 | 33.9792 | 49 | 1758 | cellular response to stress |
| GO:0009249 | 0.0055 | 25.0293 | 0.1182 | 2 | 6 | protein lipoylation |
| GO:0010940 | 0.0055 | 25.0293 | 0.1182 | 2 | 6 | positive regulation of necrotic cell death |
| GO:0051029 | 0.0055 | 25.0293 | 0.1182 | 2 | 6 | rRNA transport |
| GO:1990000 | 0.0055 | 25.0293 | 0.1182 | 2 | 6 | amyloid fibril formation |
| GO:0060045 | 0.0058 | 9.4093 | 0.3744 | 3 | 19 | positive regulation of cardiac muscle cell proliferation |
| GO:0070884 | 0.0058 | 9.4093 | 0.3744 | 3 | 19 | regulation of calcineurin-NFAT signaling cascade |
| GO:0008152 | 0.0058 | 1.4154 | 220.0302 | 240 | 11166 | metabolic process |
| GO:0032868 | 0.006 | 2.0777 | 8.5915 | 17 | 436 | response to insulin |
| GO:0009894 | 0.0061 | 1.8572 | 13.0253 | 23 | 661 | regulation of catabolic process |
| GO:0031396 | 0.0061 | 2.4341 | 5.1825 | 12 | 263 | regulation of protein ubiquitination |
| GO:0051341 | 0.0063 | 3.8827 | 1.6553 | 6 | 84 | regulation of oxidoreductase activity |
| GO:0055012 | 0.0067 | 8.8552 | 0.3941 | 3 | 20 | ventricular cardiac muscle cell differentiation |
| GO:0043604 | 0.0069 | 1.8111 | 13.9317 | 24 | 707 | amide biosynthetic process |
| GO:0034641 | 0.0074 | 1.3351 | 120.656 | 142 | 6123 | cellular nitrogen compound metabolic process |
| GO:2001242 | 0.0074 | 2.9998 | 2.8179 | 8 | 143 | regulation of intrinsic apoptotic signaling pathway |
| GO:0014745 | 0.0076 | 20.0221 | 0.1379 | 2 | 7 | negative regulation of muscle adaptation |
| GO:0006359 | 0.0077 | 8.3627 | 0.4138 | 3 | 21 | regulation of transcription from RNA polymerase III promoter |
| GO:0010996 | 0.0077 | 8.3627 | 0.4138 | 3 | 21 | response to auditory stimulus |
| GO:0034622 | 0.0079 | 1.728 | 16.4343 | 27 | 834 | cellular macromolecular complex assembly |
| GO:0071375 | 0.0081 | 1.9655 | 9.5965 | 18 | 487 | cellular response to peptide hormone stimulus |
| GO:0031330 | 0.0082 | 2.7314 | 3.4681 | 9 | 176 | negative regulation of cellular catabolic process |
| GO:0071822 | 0.0083 | 1.4998 | 34.78 | 49 | 1765 | protein complex subunit organization |
| GO:0097300 | 0.0084 | 5.4355 | 0.8079 | 4 | 41 | programmed necrotic cell death |
| GO:0006520 | 0.0086 | 1.9526 | 9.6556 | 18 | 490 | cellular amino acid metabolic process |
| GO:0014013 | 0.0087 | 3.604 | 1.7735 | 6 | 90 | regulation of gliogenesis |
| GO:0006364 | 0.0087 | 2.9127 | 2.8967 | 8 | 147 | rRNA processing |
| GO:2000725 | 0.0088 | 7.9221 | 0.4335 | 3 | 22 | regulation of cardiac muscle cell differentiation |
| GO:0006977 | 0.0091 | 4.1974 | 1.2808 | 5 | 65 | DNA damage response, signal transduction by p53 class mediator resulting in cell cycle arrest |
| GO:0097061 | 0.0092 | 5.2921 | 0.8276 | 4 | 42 | dendritic spine organization |
| GO:1902806 | 0.0094 | 2.871 | 2.9361 | 8 | 149 | regulation of cell cycle G1/S phase transition |
| GO:1902400 | 0.0096 | 4.1283 | 1.3006 | 5 | 66 | intracellular signal transduction involved in G1 DNA damage checkpoint |
| GO:0051443 | 0.0097 | 3.5197 | 1.8129 | 6 | 92 | positive regulation of ubiquitin-protein transferase activity |
| GO:0000077 | 0.0098 | 2.8506 | 2.9558 | 8 | 150 | DNA damage checkpoint |
| GO:0034660 | 0.01 | 1.962 | 9.0645 | 17 | 460 | ncRNA metabolic process |
| GOMFID | Pvalue | OddsRatio | ExpCount | Count | Size | Term |
| GO:0050884 | 0.0013 | 17.0261 | 0.2232 | 3 | 14 | neuromuscular process controlling posture |
| GO:0003011 | 0.0015 | 62.2137 | 0.0638 | 2 | 4 | involuntary skeletal muscle contraction |
| GO:0009060 | 0.0023 | 5.9214 | 0.9247 | 5 | 58 | aerobic respiration |
| GO:0010807 | 0.0025 | 41.4731 | 0.0797 | 2 | 5 | regulation of synaptic vesicle priming |
| GO:0040018 | 0.0025 | 7.8247 | 0.5739 | 4 | 36 | positive regulation of multicellular organism growth |
| GO:1902774 | 0.0036 | 31.1028 | 0.0957 | 2 | 6 | late endosome to lysosome transport |
| GO:0035335 | 0.0039 | 4.2874 | 1.4986 | 6 | 94 | peptidyl-tyrosine dephosphorylation |
| GO:0035511 | 0.005 | 24.8806 | 0.1116 | 2 | 7 | oxidative DNA demethylation |
| GO:0016081 | 0.0067 | 20.7325 | 0.1275 | 2 | 8 | synaptic vesicle docking |
| GO:1900364 | 0.0067 | 20.7325 | 0.1275 | 2 | 8 | negative regulation of mRNA polyadenylation |
| GO:0006595 | 0.0081 | 4.2935 | 1.2435 | 5 | 78 | polyamine metabolic process |
| GOMFID | Pvalue | OddsRatio | ExpCount | Count | Size | Term |
| GO:0001514 | 3e-04 | 31.4949 | 0.151 | 3 | 8 | selenocysteine incorporation |
| GO:0002523 | 7e-04 | 22.4934 | 0.1888 | 3 | 10 | leukocyte migration involved in inflammatory response |
| GO:1903679 | 0.0011 | 104.6531 | 0.0566 | 2 | 3 | positive regulation of cap-independent translational initiation |
| GO:1904688 | 0.0011 | 104.6531 | 0.0566 | 2 | 3 | regulation of cytoplasmic translational initiation |
| GO:0042953 | 0.0013 | 17.4926 | 0.2265 | 3 | 12 | lipoprotein transport |
| GO:0007596 | 0.0017 | 2.153 | 10.3442 | 21 | 548 | blood coagulation |
| GO:0003011 | 0.0021 | 52.3231 | 0.0755 | 2 | 4 | involuntary skeletal muscle contraction |
| GO:0006382 | 0.0021 | 52.3231 | 0.0755 | 2 | 4 | adenosine to inosine editing |
| GO:0061669 | 0.0021 | 52.3231 | 0.0755 | 2 | 4 | spontaneous neurotransmitter secretion |
| GO:0008152 | 0.003 | 1.4757 | 210.7733 | 232 | 11166 | metabolic process |
| GO:0045345 | 0.0034 | 34.8798 | 0.0944 | 2 | 5 | positive regulation of MHC class I biosynthetic process |
| GO:0097039 | 0.0034 | 34.8798 | 0.0944 | 2 | 5 | protein linear polyubiquitination |
| GO:2000676 | 0.0034 | 34.8798 | 0.0944 | 2 | 5 | positive regulation of type B pancreatic cell apoptotic process |
| GO:2000767 | 0.0034 | 34.8798 | 0.0944 | 2 | 5 | positive regulation of cytoplasmic translation |
| GO:1902254 | 0.0037 | 11.2416 | 0.3209 | 3 | 17 | negative regulation of intrinsic apoptotic signaling pathway by p53 class mediator |
| GO:0043123 | 0.0049 | 2.984 | 3.1901 | 9 | 169 | positive regulation of I-kappaB kinase/NF-kappaB signaling |
| GO:0018103 | 0.0051 | 26.1582 | 0.1133 | 2 | 6 | protein C-linked glycosylation |
| GO:0018211 | 0.0051 | 26.1582 | 0.1133 | 2 | 6 | peptidyl-tryptophan modification |
| GO:0018406 | 0.0051 | 26.1582 | 0.1133 | 2 | 6 | protein C-linked glycosylation via 2'-alpha-mannosyl-L-tryptophan |
| GO:0042373 | 0.0051 | 26.1582 | 0.1133 | 2 | 6 | vitamin K metabolic process |
| GO:1904396 | 0.007 | 20.9252 | 0.1321 | 2 | 7 | regulation of neuromuscular junction development |
| GO:0022411 | 0.0077 | 1.7946 | 14.0629 | 24 | 745 | cellular component disassembly |
| GO:0043043 | 0.0087 | 1.8496 | 11.911 | 21 | 631 | peptide biosynthetic process |
| GO:1901606 | 0.0092 | 3.5558 | 1.7933 | 6 | 95 | alpha-amino acid catabolic process |
| GO:0000054 | 0.0092 | 17.4365 | 0.151 | 2 | 8 | ribosomal subunit export from nucleus |
| GO:0033750 | 0.0092 | 17.4365 | 0.151 | 2 | 8 | ribosome localization |
| GO:0045008 | 0.0092 | 17.4365 | 0.151 | 2 | 8 | depyrimidination |
| GO:0070262 | 0.0092 | 17.4365 | 0.151 | 2 | 8 | peptidyl-serine dephosphorylation |
| GO:0086013 | 0.0092 | 17.4365 | 0.151 | 2 | 8 | membrane repolarization during cardiac muscle cell action potential |
| GOMFID | Pvalue | OddsRatio | ExpCount | Count | Size | Term |
| GO:0032984 | 1e-04 | 3.0075 | 6.0874 | 17 | 314 | macromolecular complex disassembly |
| GO:0070125 | 2e-04 | 5.4413 | 1.6285 | 8 | 84 | mitochondrial translational elongation |
| GO:0006600 | 8e-04 | 21.8842 | 0.1939 | 3 | 10 | creatine metabolic process |
| GO:0043624 | 9e-04 | 2.829 | 5.2731 | 14 | 272 | cellular protein complex disassembly |
| GO:0033512 | 0.0011 | 101.8278 | 0.0582 | 2 | 3 | L-lysine catabolic process to acetyl-CoA via saccharopine |
| GO:0044861 | 0.0011 | 101.8278 | 0.0582 | 2 | 3 | protein transport into plasma membrane raft |
| GO:0070124 | 0.0012 | 4.6832 | 1.6285 | 7 | 84 | mitochondrial translational initiation |
| GO:0070126 | 0.0014 | 4.564 | 1.6672 | 7 | 86 | mitochondrial translational termination |
| GO:0035383 | 0.0015 | 4.5067 | 1.6866 | 7 | 87 | thioester metabolic process |
| GO:0051593 | 0.0018 | 15.3159 | 0.252 | 3 | 13 | response to folic acid |
| GO:0003011 | 0.0022 | 50.9106 | 0.0775 | 2 | 4 | involuntary skeletal muscle contraction |
| GO:0006549 | 0.0022 | 50.9106 | 0.0775 | 2 | 4 | isoleucine metabolic process |
| GO:0010572 | 0.0022 | 50.9106 | 0.0775 | 2 | 4 | positive regulation of platelet activation |
| GO:0019477 | 0.0022 | 50.9106 | 0.0775 | 2 | 4 | L-lysine catabolic process |
| GO:0046449 | 0.0022 | 50.9106 | 0.0775 | 2 | 4 | creatinine metabolic process |
| GO:0006084 | 0.0025 | 7.8723 | 0.5816 | 4 | 30 | acetyl-CoA metabolic process |
| GO:0000422 | 0.0026 | 2.8781 | 4.0518 | 11 | 209 | mitophagy |
| GO:0000255 | 0.0036 | 33.9382 | 0.0969 | 2 | 5 | allantoin metabolic process |
| GO:0008078 | 0.0036 | 33.9382 | 0.0969 | 2 | 5 | mesodermal cell migration |
| GO:0071494 | 0.0036 | 33.9382 | 0.0969 | 2 | 5 | cellular response to UV-C |
| GO:0090315 | 0.0036 | 33.9382 | 0.0969 | 2 | 5 | negative regulation of protein targeting to membrane |
| GO:0097039 | 0.0036 | 33.9382 | 0.0969 | 2 | 5 | protein linear polyubiquitination |
| GO:0098779 | 0.0042 | 3.3245 | 2.559 | 8 | 132 | mitophagy in response to mitochondrial depolarization |
| GO:1903008 | 0.0047 | 2.6475 | 4.3814 | 11 | 226 | organelle disassembly |
| GO:0040018 | 0.005 | 6.3937 | 0.6979 | 4 | 36 | positive regulation of multicellular organism growth |
| GO:2000653 | 0.0053 | 25.452 | 0.1163 | 2 | 6 | regulation of genetic imprinting |
| GO:0006103 | 0.0056 | 9.5687 | 0.3683 | 3 | 19 | 2-oxoglutarate metabolic process |
| GO:0019530 | 0.0074 | 20.3603 | 0.1357 | 2 | 7 | taurine metabolic process |
| GO:0007005 | 0.0091 | 1.9417 | 9.7149 | 18 | 513 | mitochondrion organization |
| GO:0060384 | 0.0096 | 7.653 | 0.4459 | 3 | 23 | innervation |
| GO:0006573 | 0.0097 | 16.9658 | 0.1551 | 2 | 8 | valine metabolic process |
| GO:0032594 | 0.0097 | 16.9658 | 0.1551 | 2 | 8 | protein transport within lipid bilayer |
| GO:0042268 | 0.0097 | 16.9658 | 0.1551 | 2 | 8 | regulation of cytolysis |
| GOMFID | Pvalue | OddsRatio | ExpCount | Count | Size | Term |
| GO:0042487 | 0.0018 | 14.9873 | 0.2527 | 3 | 14 | regulation of odontogenesis of dentin-containing tooth |
| GO:0043570 | 0.0019 | 54.79 | 0.0722 | 2 | 4 | maintenance of DNA repeat elements |
| GO:0045077 | 0.0019 | 54.79 | 0.0722 | 2 | 4 | negative regulation of interferon-gamma biosynthetic process |
| GO:0070830 | 0.0031 | 5.5209 | 0.9926 | 5 | 55 | bicellular tight junction assembly |
| GO:0048625 | 0.0031 | 36.5243 | 0.0902 | 2 | 5 | myoblast fate commitment |
| GO:0051295 | 0.0031 | 36.5243 | 0.0902 | 2 | 5 | establishment of meiotic spindle localization |
| GO:0051902 | 0.0031 | 36.5243 | 0.0902 | 2 | 5 | negative regulation of mitochondrial depolarization |
| GO:0035542 | 0.0046 | 27.3915 | 0.1083 | 2 | 6 | regulation of SNARE complex assembly |
| GO:0048304 | 0.0046 | 27.3915 | 0.1083 | 2 | 6 | positive regulation of isotype switching to IgG isotypes |
| GO:0031122 | 0.0047 | 6.4786 | 0.6858 | 4 | 38 | cytoplasmic microtubule organization |
| GO:0006312 | 0.0057 | 6.1179 | 0.7219 | 4 | 40 | mitotic recombination |
| GO:0032224 | 0.0064 | 21.9117 | 0.1263 | 2 | 7 | positive regulation of synaptic transmission, cholinergic |
| GO:2000020 | 0.0064 | 21.9117 | 0.1263 | 2 | 7 | positive regulation of male gonad development |
| GO:0006396 | 0.0067 | 1.8174 | 13.9145 | 24 | 771 | RNA processing |
| GO:0097581 | 0.0076 | 4.3779 | 1.2272 | 5 | 68 | lamellipodium organization |
| GO:0010970 | 0.0078 | 3.6842 | 1.7325 | 6 | 96 | establishment of localization by movement along microtubule |
| GO:0045191 | 0.0079 | 8.2382 | 0.4151 | 3 | 23 | regulation of isotype switching |
| GO:0008104 | 0.0081 | 1.4677 | 41.7795 | 57 | 2315 | protein localization |
| GO:0001514 | 0.0085 | 18.2586 | 0.1444 | 2 | 8 | selenocysteine incorporation |
| GO:0017183 | 0.0085 | 18.2586 | 0.1444 | 2 | 8 | peptidyl-diphthamide biosynthetic process from peptidyl-histidine |
| GO:0045008 | 0.0085 | 18.2586 | 0.1444 | 2 | 8 | depyrimidination |
| GO:0051297 | 0.0086 | 3.6037 | 1.7686 | 6 | 98 | centrosome organization |
| GO:1904037 | 0.0089 | 7.8454 | 0.4331 | 3 | 24 | positive regulation of epithelial cell apoptotic process |
| GOMFID | Pvalue | OddsRatio | ExpCount | Count | Size | Term |
| GO:0045053 | 3e-04 | Inf | 0.0357 | 2 | 2 | protein retention in Golgi apparatus |
| GO:0071704 | 4e-04 | 1.6156 | 132.3693 | 157 | 7913 | organic substance metabolic process |
| GO:0050435 | 8e-04 | 11.1457 | 0.4285 | 4 | 24 | beta-amyloid metabolic process |
| GO:0006790 | 8e-04 | 2.6293 | 6.4817 | 16 | 363 | sulfur compound metabolic process |
| GO:0044238 | 0.0013 | 1.4908 | 173.5604 | 198 | 9720 | primary metabolic process |
| GO:0032727 | 0.0018 | 15.1526 | 0.25 | 3 | 14 | positive regulation of interferon-alpha production |
| GO:0032735 | 0.003 | 7.4256 | 0.6071 | 4 | 34 | positive regulation of interleukin-12 production |
| GO:0044249 | 0.0037 | 1.3973 | 102.8684 | 125 | 5761 | cellular biosynthetic process |
| GO:0048194 | 0.0038 | 11.109 | 0.3214 | 3 | 18 | Golgi vesicle budding |
| GO:0008625 | 0.0039 | 4.3018 | 1.4999 | 6 | 84 | extrinsic apoptotic signaling pathway via death domain receptors |
| GO:0032729 | 0.004 | 5.1673 | 1.0535 | 5 | 59 | positive regulation of interferon-gamma production |
| GO:0019509 | 0.0045 | 27.6924 | 0.1071 | 2 | 6 | L-methionine biosynthetic process from methylthioadenosine |
| GO:0097527 | 0.0045 | 27.6924 | 0.1071 | 2 | 6 | necroptotic signaling pathway |
| GO:0009264 | 0.0051 | 9.8008 | 0.3571 | 3 | 20 | deoxyribonucleotide catabolic process |
| GO:0042987 | 0.0051 | 9.8008 | 0.3571 | 3 | 20 | amyloid precursor protein catabolic process |
| GO:0045185 | 0.0052 | 4.0413 | 1.5892 | 6 | 89 | maintenance of protein location |
| GO:1901137 | 0.0052 | 1.8132 | 15.1597 | 26 | 849 | carbohydrate derivative biosynthetic process |
| GO:0046386 | 0.0059 | 9.2557 | 0.375 | 3 | 21 | deoxyribose phosphate catabolic process |
| GO:1901564 | 0.006 | 1.5138 | 37.694 | 53 | 2111 | organonitrogen compound metabolic process |
| GO:0014012 | 0.0063 | 22.1525 | 0.125 | 2 | 7 | peripheral nervous system axon regeneration |
| GO:0030913 | 0.0063 | 22.1525 | 0.125 | 2 | 7 | paranodal junction assembly |
| GO:0048050 | 0.0063 | 22.1525 | 0.125 | 2 | 7 | post-embryonic eye morphogenesis |
| GO:1902033 | 0.0063 | 22.1525 | 0.125 | 2 | 7 | regulation of hematopoietic stem cell proliferation |
| GO:0051651 | 0.0067 | 3.8105 | 1.6785 | 6 | 94 | maintenance of location in cell |
| GO:0001914 | 0.0067 | 8.768 | 0.3928 | 3 | 22 | regulation of T cell mediated cytotoxicity |
| GO:0030206 | 0.0077 | 8.3291 | 0.4107 | 3 | 23 | chondroitin sulfate biosynthetic process |
| GO:0043102 | 0.0083 | 18.4592 | 0.1428 | 2 | 8 | amino acid salvage |
| GO:0045008 | 0.0083 | 18.4592 | 0.1428 | 2 | 8 | depyrimidination |
| GO:0071265 | 0.0083 | 18.4592 | 0.1428 | 2 | 8 | L-methionine biosynthetic process |
| GO:0044281 | 0.0085 | 1.4491 | 45.4257 | 61 | 2544 | small molecule metabolic process |
| GO:0032786 | 0.0086 | 7.9319 | 0.4285 | 3 | 24 | positive regulation of DNA-templated transcription, elongation |
| GOMFID | Pvalue | OddsRatio | ExpCount | Count | Size | Term |
| GO:0061182 | 8e-04 | 122.9243 | 0.0484 | 2 | 3 | negative regulation of chondrocyte development |
| GO:0043044 | 9e-04 | 5.9244 | 1.1133 | 6 | 69 | ATP-dependent chromatin remodeling |
| GO:0070936 | 0.001 | 7.2135 | 0.7744 | 5 | 48 | protein K48-linked ubiquitination |
| GO:0006655 | 0.0011 | 18.5016 | 0.2097 | 3 | 13 | phosphatidylglycerol biosynthetic process |
| GO:1903010 | 0.0013 | 16.8185 | 0.2259 | 3 | 14 | regulation of bone development |
| GO:1900158 | 0.0015 | 61.4582 | 0.0645 | 2 | 4 | negative regulation of bone mineralization involved in bone maturation |
| GO:0007212 | 0.0017 | 8.8353 | 0.5163 | 4 | 32 | dopamine receptor signaling pathway |
| GO:0044058 | 0.0029 | 7.4942 | 0.597 | 4 | 37 | regulation of digestive system process |
| GO:0001696 | 0.0033 | 11.559 | 0.3065 | 3 | 19 | gastric acid secretion |
| GO:0043414 | 0.0037 | 2.7374 | 4.2433 | 11 | 263 | macromolecule methylation |
| GO:0003105 | 0.0037 | 30.7251 | 0.0968 | 2 | 6 | negative regulation of glomerular filtration |
| GO:0019395 | 0.0039 | 4.2834 | 1.5005 | 6 | 93 | fatty acid oxidation |
| GO:0007589 | 0.0041 | 4.2344 | 1.5166 | 6 | 94 | body fluid secretion |
| GO:0022406 | 0.0042 | 5.079 | 1.0649 | 5 | 66 | membrane docking |
| GO:0010460 | 0.0051 | 9.732 | 0.355 | 3 | 22 | positive regulation of heart rate |
| GO:0008217 | 0.0052 | 3.1967 | 2.646 | 8 | 164 | regulation of blood pressure |
| GO:0032480 | 0.0054 | 6.1799 | 0.7099 | 4 | 44 | negative regulation of type I interferon production |
| GO:0051046 | 0.0058 | 1.9642 | 10.7454 | 20 | 666 | regulation of secretion |
| GO:0002478 | 0.0058 | 3.1357 | 2.6944 | 8 | 167 | antigen processing and presentation of exogenous peptide antigen |
| GO:0061037 | 0.0082 | 8.0374 | 0.4195 | 3 | 26 | negative regulation of cartilage development |
| GO:0044242 | 0.0089 | 2.8963 | 2.9042 | 8 | 180 | cellular lipid catabolic process |
| GO:0050994 | 0.0098 | 5.1473 | 0.839 | 4 | 52 | regulation of lipid catabolic process |
| GOMFID | Pvalue | OddsRatio | ExpCount | Count | Size | Term |
| GO:0008630 | 3e-04 | 4.4997 | 2.1921 | 9 | 102 | intrinsic apoptotic signaling pathway in response to DNA damage |
| GO:0009215 | 0.0011 | 19.6796 | 0.2149 | 3 | 10 | purine deoxyribonucleoside triphosphate metabolic process |
| GO:0006203 | 0.0014 | 91.6 | 0.0645 | 2 | 3 | dGTP catabolic process |
| GO:0009106 | 0.0014 | 91.6 | 0.0645 | 2 | 3 | lipoate metabolic process |
| GO:0010266 | 0.0014 | 91.6 | 0.0645 | 2 | 3 | response to vitamin B1 |
| GO:0046061 | 0.0014 | 91.6 | 0.0645 | 2 | 3 | dATP catabolic process |
| GO:0060252 | 0.0014 | 17.2186 | 0.2364 | 3 | 11 | positive regulation of glial cell proliferation |
| GO:0008299 | 0.0022 | 8.3658 | 0.5588 | 4 | 26 | isoprenoid biosynthetic process |
| GO:0007264 | 0.0023 | 1.8093 | 18.7616 | 32 | 873 | small GTPase mediated signal transduction |
| GO:0044085 | 0.0023 | 1.4924 | 53.8994 | 74 | 2508 | cellular component biogenesis |
| GO:0032480 | 0.0024 | 5.9102 | 0.9456 | 5 | 44 | negative regulation of type I interferon production |
| GO:0007049 | 0.0026 | 1.5708 | 36.8785 | 54 | 1716 | cell cycle |
| GO:0007079 | 0.0027 | 45.797 | 0.086 | 2 | 4 | mitotic chromosome movement towards spindle pole |
| GO:0061051 | 0.0027 | 45.797 | 0.086 | 2 | 4 | positive regulation of cell growth involved in cardiac muscle cell development |
| GO:0071284 | 0.0027 | 45.797 | 0.086 | 2 | 4 | cellular response to lead ion |
| GO:0006807 | 0.0029 | 1.3649 | 137.7142 | 163 | 6408 | nitrogen compound metabolic process |
| GO:0006501 | 0.0037 | 7.0769 | 0.6447 | 4 | 30 | C-terminal protein lipidation |
| GO:0009151 | 0.0037 | 11.476 | 0.3224 | 3 | 15 | purine deoxyribonucleotide metabolic process |
| GO:1902850 | 0.0043 | 5.1201 | 1.0745 | 5 | 50 | microtubule cytoskeleton organization involved in mitosis |
| GO:1901990 | 0.0044 | 2.4424 | 5.6091 | 13 | 261 | regulation of mitotic cell cycle phase transition |
| GO:0031339 | 0.0044 | 30.5294 | 0.1075 | 2 | 5 | negative regulation of vesicle fusion |
| GO:1901621 | 0.0044 | 30.5294 | 0.1075 | 2 | 5 | negative regulation of smoothened signaling pathway involved in dorsal/ventral neural tube patterning |
| GO:1903147 | 0.0044 | 30.5294 | 0.1075 | 2 | 5 | negative regulation of mitophagy |
| GO:0006506 | 0.0047 | 6.5706 | 0.6877 | 4 | 32 | GPI anchor biosynthetic process |
| GO:0006488 | 0.0048 | 4.1332 | 1.5688 | 6 | 73 | dolichol-linked oligosaccharide biosynthetic process |
| GO:0000077 | 0.0052 | 2.9585 | 3.2236 | 9 | 150 | DNA damage checkpoint |
| GO:0000082 | 0.0053 | 2.4811 | 5.0934 | 12 | 237 | G1/S transition of mitotic cell cycle |
| GO:0000075 | 0.0059 | 2.4479 | 5.1578 | 12 | 240 | cell cycle checkpoint |
| GO:0006139 | 0.006 | 1.3377 | 113.6873 | 136 | 5290 | nucleobase-containing compound metabolic process |
| GO:0009987 | 0.0062 | 1.8031 | 306.1604 | 319 | 14246 | cellular process |
| GO:0016310 | 0.0063 | 1.4637 | 44.5723 | 61 | 2074 | phosphorylation |
| GO:0009262 | 0.0065 | 5.9335 | 0.7522 | 4 | 35 | deoxyribonucleotide metabolic process |
| GO:0009146 | 0.0065 | 22.8955 | 0.1289 | 2 | 6 | purine nucleoside triphosphate catabolic process |
| GO:0009249 | 0.0065 | 22.8955 | 0.1289 | 2 | 6 | protein lipoylation |
| GO:0010940 | 0.0065 | 22.8955 | 0.1289 | 2 | 6 | positive regulation of necrotic cell death |
| GO:0033314 | 0.0065 | 22.8955 | 0.1289 | 2 | 6 | mitotic DNA replication checkpoint |
| GO:0097211 | 0.0065 | 22.8955 | 0.1289 | 2 | 6 | cellular response to gonadotropin-releasing hormone |
| GO:1990000 | 0.0065 | 22.8955 | 0.1289 | 2 | 6 | amyloid fibril formation |
| GO:0038061 | 0.0068 | 3.3692 | 2.2136 | 7 | 103 | NIK/NF-kappaB signaling |
| GO:0000910 | 0.0071 | 3.0339 | 2.7938 | 8 | 130 | cytokinesis |
| GO:0072528 | 0.0079 | 5.5732 | 0.7952 | 4 | 37 | pyrimidine-containing compound biosynthetic process |
| GO:0065003 | 0.0087 | 1.5036 | 33.0961 | 47 | 1540 | macromolecular complex assembly |
| GO:0044770 | 0.0089 | 1.9076 | 10.4231 | 19 | 485 | cell cycle phase transition |
| GO:0001768 | 0.009 | 18.3152 | 0.1504 | 2 | 7 | establishment of T cell polarity |
| GO:0007256 | 0.009 | 18.3152 | 0.1504 | 2 | 7 | activation of JNKK activity |
| GO:0009204 | 0.009 | 18.3152 | 0.1504 | 2 | 7 | deoxyribonucleoside triphosphate catabolic process |
| GO:1901576 | 0.0098 | 1.3061 | 125.8297 | 147 | 5855 | organic substance biosynthetic process |
| GOMFID | Pvalue | OddsRatio | ExpCount | Count | Size | Term |
| GO:0022900 | 0.001 | 4.2083 | 2.0473 | 8 | 123 | electron transport chain |
| GO:0034643 | 0.0012 | 17.9186 | 0.2164 | 3 | 13 | establishment of mitochondrion localization, microtubule-mediated |
| GO:2000852 | 0.0016 | 59.529 | 0.0666 | 2 | 4 | regulation of corticosterone secretion |
| GO:0006119 | 0.0023 | 4.8141 | 1.3482 | 6 | 81 | oxidative phosphorylation |
| GO:0019896 | 0.0027 | 39.6834 | 0.0832 | 2 | 5 | axon transport of mitochondrion |
| GO:0009060 | 0.0027 | 5.663 | 0.9654 | 5 | 58 | aerobic respiration |
| GO:0070125 | 0.0028 | 4.6281 | 1.3981 | 6 | 84 | mitochondrial translational elongation |
| GO:0006103 | 0.0036 | 11.1948 | 0.3162 | 3 | 19 | 2-oxoglutarate metabolic process |
| GO:0010447 | 0.0036 | 11.1948 | 0.3162 | 3 | 19 | response to acidic pH |
| GO:0006868 | 0.004 | 29.7606 | 0.0999 | 2 | 6 | glutamine transport |
| GO:2000573 | 0.0047 | 6.4709 | 0.6824 | 4 | 41 | positive regulation of DNA biosynthetic process |
| GO:1902589 | 0.0049 | 1.5118 | 41.7607 | 58 | 2509 | single-organism organelle organization |
| GO:0007015 | 0.0049 | 2.5055 | 5.0432 | 12 | 303 | actin filament organization |
| GO:0015808 | 0.0055 | 23.8069 | 0.1165 | 2 | 7 | L-alanine transport |
| GO:0019919 | 0.0055 | 23.8069 | 0.1165 | 2 | 7 | peptidyl-arginine methylation, to asymmetrical-dimethyl arginine |
| GO:1901533 | 0.0056 | 9.4253 | 0.3662 | 3 | 22 | negative regulation of hematopoietic progenitor cell differentiation |
| GO:0009116 | 0.0062 | 2.332 | 5.8588 | 13 | 352 | nucleoside metabolic process |
| GO:0032909 | 0.0072 | 19.8378 | 0.1332 | 2 | 8 | regulation of transforming growth factor beta2 production |
| GO:0060452 | 0.0072 | 19.8378 | 0.1332 | 2 | 8 | positive regulation of cardiac muscle contraction |
| GO:0006688 | 0.0089 | 7.7841 | 0.4328 | 3 | 26 | glycosphingolipid biosynthetic process |
| GO:0051304 | 0.0092 | 4.1634 | 1.2816 | 5 | 77 | chromosome separation |
| GO:0006122 | 0.0092 | 17.0028 | 0.1498 | 2 | 9 | mitochondrial electron transport, ubiquinol to cytochrome c |
| GO:0035246 | 0.0092 | 17.0028 | 0.1498 | 2 | 9 | peptidyl-arginine N-methylation |
| GO:0035933 | 0.0092 | 17.0028 | 0.1498 | 2 | 9 | glucocorticoid secretion |
| GO:0060638 | 0.0092 | 17.0028 | 0.1498 | 2 | 9 | mesenchymal-epithelial cell signaling |
| GO:0009205 | 0.0095 | 2.6639 | 3.5452 | 9 | 213 | purine ribonucleoside triphosphate metabolic process |
| GO:0042775 | 0.0099 | 5.1284 | 0.8428 | 4 | 51 | mitochondrial ATP synthesis coupled electron transport |
| GOMFID | Pvalue | OddsRatio | ExpCount | Count | Size | Term |
| GO:1900226 | 4e-04 | 179.2486 | 0.0335 | 2 | 3 | negative regulation of NLRP3 inflammasome complex assembly |
| GO:2000619 | 7e-04 | 89.6185 | 0.0446 | 2 | 4 | negative regulation of histone H4-K16 acetylation |
| GO:0021603 | 0.0012 | 59.7418 | 0.0558 | 2 | 5 | cranial nerve formation |
| GO:0001824 | 0.0014 | 6.5801 | 0.8258 | 5 | 74 | blastocyst development |
| GO:0006545 | 0.0018 | 44.8035 | 0.067 | 2 | 6 | glycine biosynthetic process |
| GO:0046654 | 0.0018 | 44.8035 | 0.067 | 2 | 6 | tetrahydrofolate biosynthetic process |
| GO:0050878 | 0.0021 | 2.3423 | 7.7897 | 17 | 698 | regulation of body fluid levels |
| GO:0030210 | 0.0033 | 29.8651 | 0.0893 | 2 | 8 | heparin biosynthetic process |
| GO:0048227 | 0.0033 | 29.8651 | 0.0893 | 2 | 8 | plasma membrane to endosome transport |
| GO:0042493 | 0.0034 | 2.6379 | 4.8323 | 12 | 433 | response to drug |
| GO:0000289 | 0.0053 | 9.3085 | 0.3571 | 3 | 32 | nuclear-transcribed mRNA poly(A) tail shortening |
| GO:0045132 | 0.0063 | 5.8268 | 0.7366 | 4 | 66 | meiotic chromosome segregation |
| GO:0000280 | 0.0068 | 2.3173 | 5.9371 | 13 | 532 | nuclear division |
| GO:0090239 | 0.0076 | 17.9145 | 0.1339 | 2 | 12 | regulation of histone H4 acetylation |
| GO:0007596 | 0.0086 | 2.2456 | 6.1157 | 13 | 548 | blood coagulation |
| GO:0032691 | 0.0089 | 16.2848 | 0.1451 | 2 | 13 | negative regulation of interleukin-1 beta production |
| GO:0007268 | 0.0096 | 2.0824 | 7.6223 | 15 | 683 | synaptic transmission |
| GO:0099536 | 0.0096 | 2.0824 | 7.6223 | 15 | 683 | synaptic signaling |
| GOMFID | Pvalue | OddsRatio | ExpCount | Count | Size | Term |
| GO:0030259 | 6e-04 | 136.7434 | 0.0436 | 2 | 3 | lipid glycosylation |
| GO:0097694 | 6e-04 | 136.7434 | 0.0436 | 2 | 3 | establishment of RNA localization to telomere |
| GO:0097695 | 6e-04 | 136.7434 | 0.0436 | 2 | 3 | establishment of macromolecular complex localization to telomere |
| GO:0046579 | 0.0011 | 9.8374 | 0.4653 | 4 | 32 | positive regulation of Ras protein signal transduction |
| GO:0051092 | 0.0019 | 4.2998 | 1.7448 | 7 | 120 | positive regulation of NF-kappaB transcription factor activity |
| GO:2000328 | 0.002 | 45.5752 | 0.0727 | 2 | 5 | regulation of T-helper 17 cell lineage commitment |
| GO:0048702 | 0.0042 | 27.3416 | 0.1018 | 2 | 7 | embryonic neurocranium morphogenesis |
| GO:0048260 | 0.0044 | 6.5523 | 0.6688 | 4 | 46 | positive regulation of receptor-mediated endocytosis |
| GO:0035556 | 0.0047 | 1.556 | 36.6114 | 52 | 2518 | intracellular signal transduction |
| GO:0070198 | 0.0049 | 9.7981 | 0.349 | 3 | 24 | protein localization to chromosome, telomeric region |
| GO:0006612 | 0.0052 | 3.1931 | 2.6463 | 8 | 182 | protein targeting to membrane |
| GO:0030210 | 0.0056 | 22.7832 | 0.1163 | 2 | 8 | heparin biosynthetic process |
| GO:0006897 | 0.0056 | 2.0999 | 8.5495 | 17 | 588 | endocytosis |
| GO:0072583 | 0.0059 | 5.981 | 0.727 | 4 | 50 | clathrin-mediated endocytosis |
| GO:0008298 | 0.0071 | 19.5272 | 0.1309 | 2 | 9 | intracellular mRNA localization |
| GO:0046855 | 0.0071 | 19.5272 | 0.1309 | 2 | 9 | inositol phosphate dephosphorylation |
| GO:2000316 | 0.0071 | 19.5272 | 0.1309 | 2 | 9 | regulation of T-helper 17 type immune response |
| GO:2000508 | 0.0071 | 19.5272 | 0.1309 | 2 | 9 | regulation of dendritic cell chemotaxis |
| GO:0001525 | 0.008 | 2.2581 | 6.0486 | 13 | 416 | angiogenesis |
| GO:0046474 | 0.0083 | 2.9368 | 2.8644 | 8 | 197 | glycerophospholipid biosynthetic process |
| GO:0050706 | 0.0084 | 7.9113 | 0.4217 | 3 | 29 | regulation of interleukin-1 beta secretion |
| GO:1902475 | 0.0084 | 7.9113 | 0.4217 | 3 | 29 | L-alpha-amino acid transmembrane transport |
| GO:0050806 | 0.0085 | 3.6047 | 1.7593 | 6 | 121 | positive regulation of synaptic transmission |
| GO:0045760 | 0.0088 | 17.0852 | 0.1454 | 2 | 10 | positive regulation of action potential |
| GO:0045838 | 0.0088 | 17.0852 | 0.1454 | 2 | 10 | positive regulation of membrane potential |
| GO:2001198 | 0.0088 | 17.0852 | 0.1454 | 2 | 10 | regulation of dendritic cell differentiation |
| GO:0050821 | 0.0088 | 3.5734 | 1.7739 | 6 | 122 | protein stabilization |
| GO:0097178 | 0.0092 | 7.6178 | 0.4362 | 3 | 30 | ruffle assembly |
| GO:0032652 | 0.0094 | 5.1887 | 0.8288 | 4 | 57 | regulation of interleukin-1 production |
| GOMFID | Pvalue | OddsRatio | ExpCount | Count | Size | Term |
| GO:1901605 | 1e-04 | 3.1891 | 5.4165 | 16 | 324 | alpha-amino acid metabolic process |
| GO:0048870 | 3e-04 | 1.9428 | 21.3139 | 38 | 1266 | cell motility |
| GO:0044281 | 5e-04 | 1.6693 | 42.8299 | 64 | 2544 | small molecule metabolic process |
| GO:0042060 | 5e-04 | 3.8276 | 2.8123 | 10 | 173 | wound healing |
| GO:0010243 | 6e-04 | 2.0343 | 15.8929 | 30 | 944 | response to organonitrogen compound |
| GO:0048864 | 7e-04 | 3.6617 | 2.9294 | 10 | 174 | stem cell development |
| GO:0048762 | 0.001 | 3.4895 | 3.0641 | 10 | 182 | mesenchymal cell differentiation |
| GO:0060412 | 0.0012 | 9.8673 | 0.4714 | 4 | 28 | ventricular septum morphogenesis |
| GO:0070986 | 0.0012 | 17.7092 | 0.2189 | 3 | 13 | left/right axis specification |
| GO:0000902 | 0.0013 | 1.7787 | 23.7046 | 39 | 1408 | cell morphogenesis |
| GO:0046021 | 0.0017 | 58.8359 | 0.0673 | 2 | 4 | regulation of transcription from RNA polymerase II promoter, mitotic |
| GO:0007264 | 0.0017 | 1.9622 | 14.6975 | 27 | 873 | small GTPase mediated signal transduction |
| GO:0014855 | 0.0019 | 6.1812 | 0.8923 | 5 | 53 | striated muscle cell proliferation |
| GO:0001837 | 0.0021 | 4.2144 | 1.7846 | 7 | 106 | epithelial to mesenchymal transition |
| GO:0006672 | 0.0023 | 4.8218 | 1.3469 | 6 | 80 | ceramide metabolic process |
| GO:1901576 | 0.0027 | 1.4289 | 98.5728 | 121 | 5855 | organic substance biosynthetic process |
| GO:0006681 | 0.0027 | 39.2214 | 0.0842 | 2 | 5 | galactosylceramide metabolic process |
| GO:0060126 | 0.0027 | 39.2214 | 0.0842 | 2 | 5 | somatotropin secreting cell differentiation |
| GO:0060754 | 0.0027 | 39.2214 | 0.0842 | 2 | 5 | positive regulation of mast cell chemotaxis |
| GO:1903772 | 0.0027 | 39.2214 | 0.0842 | 2 | 5 | regulation of viral budding via host ESCRT complex |
| GO:0050730 | 0.0034 | 2.936 | 3.6028 | 10 | 214 | regulation of peptidyl-tyrosine phosphorylation |
| GO:0060045 | 0.0037 | 11.0639 | 0.3199 | 3 | 19 | positive regulation of cardiac muscle cell proliferation |
| GO:0014068 | 0.0039 | 5.2022 | 1.0438 | 5 | 62 | positive regulation of phosphatidylinositol 3-kinase signaling |
| GO:0019323 | 0.0041 | 29.4141 | 0.101 | 2 | 6 | pentose catabolic process |
| GO:0055021 | 0.0041 | 6.7613 | 0.6566 | 4 | 39 | regulation of cardiac muscle tissue growth |
| GO:0032870 | 0.0043 | 1.8944 | 13.418 | 24 | 797 | cellular response to hormone stimulus |
| GO:0045859 | 0.0046 | 1.8573 | 14.2598 | 25 | 847 | regulation of protein kinase activity |
| GO:0001525 | 0.0047 | 2.2558 | 7.0036 | 15 | 416 | angiogenesis |
| GO:0006687 | 0.0047 | 4.9411 | 1.0943 | 5 | 65 | glycosphingolipid metabolic process |
| GO:0022607 | 0.0049 | 1.5257 | 39.1092 | 55 | 2323 | cellular component assembly |
| GO:0034641 | 0.005 | 1.3905 | 103.0848 | 124 | 6123 | cellular nitrogen compound metabolic process |
| GO:0003171 | 0.005 | 9.8333 | 0.3535 | 3 | 21 | atrioventricular valve development |
| GO:0007398 | 0.005 | 9.8333 | 0.3535 | 3 | 21 | ectoderm development |
| GO:0006575 | 0.0051 | 2.4927 | 5.0675 | 12 | 301 | cellular modified amino acid metabolic process |
| GO:0016071 | 0.0052 | 2.0237 | 9.8994 | 19 | 588 | mRNA metabolic process |
| GO:0016055 | 0.0053 | 2.2273 | 7.0878 | 15 | 421 | Wnt signaling pathway |
| GO:0007596 | 0.0054 | 2.0553 | 9.2259 | 18 | 548 | blood coagulation |
| GO:0006729 | 0.0056 | 23.5298 | 0.1178 | 2 | 7 | tetrahydrobiopterin biosynthetic process |
| GO:0043615 | 0.0056 | 23.5298 | 0.1178 | 2 | 7 | astrocyte cell migration |
| GO:0072201 | 0.0056 | 23.5298 | 0.1178 | 2 | 7 | negative regulation of mesenchymal cell proliferation |
| GO:0000278 | 0.0057 | 1.7632 | 16.8357 | 28 | 1000 | mitotic cell cycle |
| GO:0006541 | 0.0057 | 9.3152 | 0.3704 | 3 | 22 | glutamine metabolic process |
| GO:0016049 | 0.0058 | 2.1409 | 7.8623 | 16 | 467 | cell growth |
| GO:0030334 | 0.0062 | 1.9497 | 10.8085 | 20 | 642 | regulation of cell migration |
| GO:0051270 | 0.0066 | 1.8748 | 12.3742 | 22 | 735 | regulation of cellular component movement |
| GO:0071840 | 0.0067 | 1.3741 | 100.0038 | 120 | 5940 | cellular component organization or biogenesis |
| GO:0038084 | 0.0074 | 8.4269 | 0.4041 | 3 | 24 | vascular endothelial growth factor signaling pathway |
| GO:0040016 | 0.0074 | 19.6069 | 0.1347 | 2 | 8 | embryonic cleavage |
| GO:0043497 | 0.0074 | 19.6069 | 0.1347 | 2 | 8 | regulation of protein heterodimerization activity |
| GO:0061101 | 0.0074 | 19.6069 | 0.1347 | 2 | 8 | neuroendocrine cell differentiation |
| GO:0009966 | 0.0077 | 1.4723 | 42.6447 | 58 | 2533 | regulation of signal transduction |
| GO:0030325 | 0.0083 | 8.0434 | 0.4209 | 3 | 25 | adrenal gland development |
| GO:0043550 | 0.0086 | 5.3752 | 0.8081 | 4 | 48 | regulation of lipid kinase activity |
| GO:0040008 | 0.0086 | 1.9184 | 10.4044 | 19 | 618 | regulation of growth |
| GO:0072028 | 0.0086 | 4.2325 | 1.2627 | 5 | 75 | nephron morphogenesis |
| GO:0009791 | 0.0086 | 3.5983 | 1.7677 | 6 | 105 | post-embryonic development |
| GO:0046620 | 0.0091 | 4.1726 | 1.2795 | 5 | 76 | regulation of organ growth |
| GO:1900034 | 0.0091 | 4.1726 | 1.2795 | 5 | 76 | regulation of cellular response to heat |
| GO:0001964 | 0.0092 | 7.6932 | 0.4377 | 3 | 26 | startle response |
| GO:0042559 | 0.0093 | 16.9286 | 0.1504 | 2 | 9 | pteridine-containing compound biosynthetic process |
| GO:0034645 | 0.0093 | 1.3695 | 79.8347 | 98 | 4742 | cellular macromolecule biosynthetic process |
| GO:0002645 | 0.0094 | 16.8048 | 0.1515 | 2 | 9 | positive regulation of tolerance induction |
| GO:0003184 | 0.0094 | 16.8048 | 0.1515 | 2 | 9 | pulmonary valve morphogenesis |
| GO:0006547 | 0.0094 | 16.8048 | 0.1515 | 2 | 9 | histidine metabolic process |
| GO:0001568 | 0.0098 | 1.927 | 9.7984 | 18 | 582 | blood vessel development |
| GO:0051179 | 0.0099 | 1.356 | 90.4748 | 109 | 5374 | localization |
| GOMFID | Pvalue | OddsRatio | ExpCount | Count | Size | Term |
| GO:0004298 | 0.003 | 11.8387 | 0.2952 | 3 | 21 | threonine-type endopeptidase activity |
| GO:0097367 | 0.0072 | 1.5703 | 29.6559 | 43 | 2110 | carbohydrate derivative binding |
| GO:0043531 | 0.0084 | 7.8879 | 0.4216 | 3 | 30 | ADP binding |
| GOMFID | Pvalue | OddsRatio | ExpCount | Count | Size | Term |
| GO:0005509 | 0.0017 | 2.3951 | 7.6161 | 17 | 658 | calcium ion binding |
| GO:0008429 | 0.0036 | 28.7704 | 0.0926 | 2 | 8 | phosphatidylethanolamine binding |
| GO:0042301 | 0.0056 | 21.575 | 0.1157 | 2 | 10 | phosphate ion binding |
| GO:0005351 | 0.0068 | 19.1765 | 0.1273 | 2 | 11 | sugar:proton symporter activity |
| GO:0005536 | 0.0068 | 19.1765 | 0.1273 | 2 | 11 | glucose binding |
| GO:0016004 | 0.0068 | 19.1765 | 0.1273 | 2 | 11 | phospholipase activator activity |
| GO:0002039 | 0.0072 | 5.6107 | 0.7639 | 4 | 66 | p53 binding |
| GO:0044548 | 0.0096 | 15.6879 | 0.1505 | 2 | 13 | S100 protein binding |
| GOMFID | Pvalue | OddsRatio | ExpCount | Count | Size | Term |
| GO:0005044 | 0.0017 | 13.9277 | 0.2375 | 3 | 45 | scavenger receptor activity |
| GO:0015643 | 0.0018 | 38.5951 | 0.0633 | 2 | 12 | toxic substance binding |
| GO:0008811 | 0.0053 | Inf | 0.0053 | 1 | 1 | chloramphenicol O-acetyltransferase activity |
| GO:0008892 | 0.0053 | Inf | 0.0053 | 1 | 1 | guanine deaminase activity |
| GO:0047150 | 0.0053 | Inf | 0.0053 | 1 | 1 | betaine-homocysteine S-methyltransferase activity |
| GO:0050512 | 0.0053 | Inf | 0.0053 | 1 | 1 | lactosylceramide 4-alpha-galactosyltransferase activity |
| GO:0019865 | 0.0065 | 18.3657 | 0.1214 | 2 | 23 | immunoglobulin binding |
| GOMFID | Pvalue | OddsRatio | ExpCount | Count | Size | Term |
| GO:0030544 | 5e-04 | 12.7179 | 0.367 | 4 | 29 | Hsp70 protein binding |
| GO:0008273 | 0.0016 | 52.5279 | 0.0633 | 2 | 5 | calcium, potassium:sodium antiporter activity |
| GO:0004812 | 0.0017 | 8.5866 | 0.5189 | 4 | 41 | aminoacyl-tRNA ligase activity |
| GO:0016875 | 0.0017 | 8.5866 | 0.5189 | 4 | 41 | ligase activity, forming carbon-oxygen bonds |
| GO:0071933 | 0.0032 | 31.5127 | 0.0886 | 2 | 7 | Arp2/3 complex binding |
| GO:0019207 | 0.0076 | 3.2736 | 2.2527 | 7 | 178 | kinase regulator activity |
| GO:0019900 | 0.0078 | 2.1311 | 7.429 | 15 | 587 | kinase binding |
| GO:0043295 | 0.0081 | 17.5025 | 0.1392 | 2 | 11 | glutathione binding |
| GO:0005515 | 0.0094 | 1.46 | 127.9629 | 144 | 10111 | protein binding |
| GO:0048020 | 0.0097 | 7.4106 | 0.443 | 3 | 35 | CCR chemokine receptor binding |
| GOMFID | Pvalue | OddsRatio | ExpCount | Count | Size | Term |
| GO:0005546 | 3e-04 | 7.4854 | 0.9186 | 6 | 46 | phosphatidylinositol-4,5-bisphosphate binding |
| GO:0043168 | 0.0011 | 1.5592 | 49.9836 | 71 | 2503 | anion binding |
| GO:0005547 | 0.0028 | 7.6347 | 0.5991 | 4 | 30 | phosphatidylinositol-3,4,5-trisphosphate binding |
| GO:1901363 | 0.0031 | 1.3853 | 109.3129 | 133 | 5474 | heterocyclic compound binding |
| GO:0097367 | 0.0043 | 1.507 | 42.1356 | 59 | 2110 | carbohydrate derivative binding |
| GO:0036094 | 0.005 | 1.4625 | 49.4844 | 67 | 2478 | small molecule binding |
| GO:0080025 | 0.0052 | 9.9003 | 0.3595 | 3 | 18 | phosphatidylinositol-3,5-bisphosphate binding |
| GO:0097159 | 0.0054 | 1.3544 | 110.8905 | 133 | 5553 | organic cyclic compound binding |
| GO:0015288 | 0.0057 | 24.6891 | 0.1198 | 2 | 6 | porin activity |
| GO:0015925 | 0.0057 | 24.6891 | 0.1198 | 2 | 6 | galactosidase activity |
| GO:0032555 | 0.0058 | 1.5274 | 34.9466 | 50 | 1750 | purine ribonucleotide binding |
| GO:0043325 | 0.006 | 9.2809 | 0.3794 | 3 | 19 | phosphatidylinositol-3,4-bisphosphate binding |
| GO:0001883 | 0.0068 | 1.5183 | 34.3874 | 49 | 1722 | purine nucleoside binding |
| GO:0032549 | 0.0068 | 1.5183 | 34.3874 | 49 | 1722 | ribonucleoside binding |
| GO:0008603 | 0.0078 | 19.75 | 0.1398 | 2 | 7 | cAMP-dependent protein kinase regulator activity |
| GO:0030554 | 0.0082 | 1.5464 | 28.776 | 42 | 1441 | adenyl nucleotide binding |
| GO:0005524 | 0.0082 | 1.554 | 27.9373 | 41 | 1399 | ATP binding |
| GO:0032403 | 0.0084 | 1.6842 | 18.1123 | 29 | 907 | protein complex binding |
| GO:0016772 | 0.0089 | 1.6917 | 17.3934 | 28 | 871 | transferase activity, transferring phosphorus-containing groups |
| GOMFID | Pvalue | OddsRatio | ExpCount | Count | Size | Term |
| GO:0030544 | 0.0026 | 7.8887 | 0.5828 | 4 | 29 | Hsp70 protein binding |
| GO:0016740 | 0.0072 | 1.4682 | 42.2834 | 58 | 2104 | transferase activity |
| GO:0043168 | 0.0074 | 1.4329 | 50.302 | 67 | 2503 | anion binding |
| GO:0097159 | 0.0095 | 1.3216 | 111.5968 | 132 | 5553 | organic cyclic compound binding |
| GO:1902936 | 0.0098 | 4.1125 | 1.3063 | 5 | 65 | phosphatidylinositol bisphosphate binding |
| GOMFID | Pvalue | OddsRatio | ExpCount | Count | Size | Term |
| GO:0032557 | 7e-04 | 130.1092 | 0.0458 | 2 | 3 | pyrimidine ribonucleotide binding |
| GO:0009055 | 0.0013 | 4.6218 | 1.6332 | 7 | 107 | electron carrier activity |
| GO:0004725 | 0.0033 | 4.4353 | 1.45 | 6 | 95 | protein tyrosine phosphatase activity |
| GO:0005518 | 0.0036 | 5.2924 | 1.0226 | 5 | 67 | collagen binding |
| GO:1901981 | 0.0054 | 3.9847 | 1.6026 | 6 | 105 | phosphatidylinositol phosphate binding |
| GO:0016645 | 0.007 | 8.5091 | 0.3968 | 3 | 26 | oxidoreductase activity, acting on the CH-NH group of donors |
| GOMFID | Pvalue | OddsRatio | ExpCount | Count | Size | Term |
| GO:0005086 | 7e-04 | 11.606 | 0.4183 | 4 | 22 | ARF guanyl-nucleotide exchange factor activity |
| GO:0030158 | 0.0011 | 103.8653 | 0.057 | 2 | 3 | protein xylosyltransferase activity |
| GO:0034483 | 0.0017 | 15.6233 | 0.2472 | 3 | 13 | heparan sulfate sulfotransferase activity |
| GO:0031406 | 0.0028 | 3.0329 | 3.4989 | 10 | 184 | carboxylic acid binding |
| GO:0017069 | 0.003 | 7.4562 | 0.6085 | 4 | 32 | snRNA binding |
| GO:0023026 | 0.0032 | 12.0156 | 0.3042 | 3 | 16 | MHC class II protein complex binding |
| GO:0050543 | 0.0051 | 25.9613 | 0.1141 | 2 | 6 | icosatetraenoic acid binding |
| GO:0042285 | 0.0071 | 20.7677 | 0.1331 | 2 | 7 | xylosyltransferase activity |
| GO:0043023 | 0.0071 | 20.7677 | 0.1331 | 2 | 7 | ribosomal large subunit binding |
| GOMFID | Pvalue | OddsRatio | ExpCount | Count | Size | Term |
| GO:0015433 | 2e-04 | Inf | 0.0314 | 2 | 2 | peptide antigen-transporting ATPase activity |
| GO:0031749 | 7e-04 | 126.3347 | 0.0471 | 2 | 3 | D2 dopamine receptor binding |
| GO:0046978 | 0.0014 | 63.1633 | 0.0628 | 2 | 4 | TAP1 binding |
| GO:0004439 | 0.0024 | 42.1061 | 0.0785 | 2 | 5 | phosphatidylinositol-4,5-bisphosphate 5-phosphatase activity |
| GO:0008273 | 0.0024 | 42.1061 | 0.0785 | 2 | 5 | calcium, potassium:sodium antiporter activity |
| GO:0046923 | 0.0024 | 42.1061 | 0.0785 | 2 | 5 | ER retention sequence binding |
| GO:0005488 | 0.0025 | 1.8148 | 208.4514 | 224 | 13270 | binding |
| GO:1901474 | 0.0035 | 31.5776 | 0.0943 | 2 | 6 | azole transmembrane transporter activity |
| GO:0042393 | 0.0041 | 3.3305 | 2.5448 | 8 | 162 | histone binding |
| GO:0052866 | 0.0047 | 10.003 | 0.3456 | 3 | 22 | phosphatidylinositol phosphate phosphatase activity |
| GO:1904680 | 0.0049 | 25.2604 | 0.11 | 2 | 7 | peptide transmembrane transporter activity |
| GO:0004865 | 0.0065 | 21.049 | 0.1257 | 2 | 8 | protein serine/threonine phosphatase inhibitor activity |
| GO:0016765 | 0.0095 | 5.1828 | 0.8325 | 4 | 53 | transferase activity, transferring alkyl or aryl (other than methyl) groups |
| GOMFID | Pvalue | OddsRatio | ExpCount | Count | Size | Term |
| GO:0097602 | 0.001 | 19.3319 | 0.2113 | 3 | 11 | cullin family protein binding |
| GO:0070300 | 0.0014 | 17.1828 | 0.2305 | 3 | 12 | phosphatidic acid binding |
| GO:0004659 | 0.0022 | 14.0569 | 0.2689 | 3 | 14 | prenyltransferase activity |
| GO:0045236 | 0.0039 | 11.0425 | 0.3265 | 3 | 17 | CXCR chemokine receptor binding |
| GO:0004415 | 0.0095 | 17.1289 | 0.1537 | 2 | 8 | hyalurononglucosaminidase activity |
| GO:0030957 | 0.0095 | 17.1289 | 0.1537 | 2 | 8 | Tat protein binding |
| GOMFID | Pvalue | OddsRatio | ExpCount | Count | Size | Term |
| GO:0003845 | 3e-04 | Inf | 0.0359 | 2 | 2 | 11-beta-hydroxysteroid dehydrogenase [NAD(P)] activity |
| GO:0005031 | 7e-04 | 11.6797 | 0.4125 | 4 | 23 | tumor necrosis factor-activated receptor activity |
| GO:0070016 | 0.0014 | 16.5935 | 0.2331 | 3 | 13 | armadillo repeat domain binding |
| GO:0001665 | 0.0031 | 36.7595 | 0.0897 | 2 | 5 | alpha-N-acetylgalactosaminide alpha-2,6-sialyltransferase activity |
| GO:0030331 | 0.0046 | 6.5205 | 0.6815 | 4 | 38 | estrogen receptor binding |
| GO:0031625 | 0.005 | 2.6266 | 4.4119 | 11 | 246 | ubiquitin protein ligase binding |
| GO:0043995 | 0.0063 | 22.0529 | 0.1255 | 2 | 7 | histone acetyltransferase activity (H4-K5 specific) |
| GO:0043996 | 0.0063 | 22.0529 | 0.1255 | 2 | 7 | histone acetyltransferase activity (H4-K8 specific) |
| GO:0046972 | 0.0063 | 22.0529 | 0.1255 | 2 | 7 | histone acetyltransferase activity (H4-K16 specific) |
| GOMFID | Pvalue | OddsRatio | ExpCount | Count | Size | Term |
| GO:0035877 | 0.0019 | 54.7447 | 0.0722 | 2 | 4 | death effector domain binding |
| GO:0042887 | 0.0027 | 12.6693 | 0.289 | 3 | 16 | amide transmembrane transporter activity |
| GO:0004519 | 0.0042 | 3.6907 | 2.0229 | 7 | 112 | endonuclease activity |
| GO:0070063 | 0.0043 | 6.6697 | 0.6683 | 4 | 37 | RNA polymerase binding |
| GO:0005201 | 0.0048 | 4.9232 | 1.1018 | 5 | 61 | extracellular matrix structural constituent |
| GO:0050662 | 0.0049 | 2.9751 | 3.1969 | 9 | 177 | coenzyme binding |
| GO:0008499 | 0.0064 | 21.8936 | 0.1264 | 2 | 7 | UDP-galactose:beta-N-acetylglucosamine beta-1,3-galactosyltransferase activity |
| GO:0070567 | 0.0085 | 18.2435 | 0.1445 | 2 | 8 | cytidylyltransferase activity |
| GOMFID | Pvalue | OddsRatio | ExpCount | Count | Size | Term |
| GO:0031749 | 0.001 | 105.3106 | 0.0563 | 2 | 3 | D2 dopamine receptor binding |
| GO:0003886 | 0.0021 | 52.6519 | 0.075 | 2 | 4 | DNA (cytosine-5-)-methyltransferase activity |
| GO:0003777 | 0.0026 | 4.6899 | 1.3883 | 6 | 74 | microtubule motor activity |
| GO:0016740 | 0.0063 | 1.4965 | 39.4734 | 55 | 2104 | transferase activity |
| GO:0016791 | 0.0084 | 2.4307 | 4.7466 | 11 | 253 | phosphatase activity |
| GOMFID | Pvalue | OddsRatio | ExpCount | Count | Size | Term |
| GO:0043208 | 0.0067 | 20.7055 | 0.1277 | 2 | 8 | glycosphingolipid binding |
| GOMFID | Pvalue | OddsRatio | ExpCount | Count | Size | Term |
| GO:0031996 | 8e-04 | 20.4634 | 0.1902 | 3 | 13 | thioesterase binding |
| GO:0034604 | 0.0013 | 67.9474 | 0.0585 | 2 | 4 | pyruvate dehydrogenase (NAD+) activity |
| GO:0004738 | 0.0021 | 45.2953 | 0.0731 | 2 | 5 | pyruvate dehydrogenase activity |
| GO:0050750 | 0.0021 | 13.6379 | 0.2633 | 3 | 18 | low-density lipoprotein particle receptor binding |
| GO:0086083 | 0.0031 | 33.9693 | 0.0878 | 2 | 6 | cell adhesive protein binding involved in bundle of His cell-Purkinje myocyte communication |
| GO:0030881 | 0.0072 | 19.4073 | 0.1316 | 2 | 9 | beta-2-microglobulin binding |
| GO:0004722 | 0.0096 | 5.1565 | 0.8338 | 4 | 57 | protein serine/threonine phosphatase activity |
| GOMFID | Pvalue | OddsRatio | ExpCount | Count | Size | Term |
| GO:0004630 | 1e-04 | 62.1245 | 0.0962 | 3 | 6 | phospholipase D activity |
| GO:1901981 | 0.0015 | 4.4822 | 1.6828 | 7 | 105 | phosphatidylinositol phosphate binding |
| GO:0015379 | 0.0015 | 61.88 | 0.0641 | 2 | 4 | potassium:chloride symporter activity |
| GO:0022820 | 0.0015 | 61.88 | 0.0641 | 2 | 4 | potassium ion symporter activity |
| GO:0008378 | 0.0018 | 8.589 | 0.5289 | 4 | 33 | galactosyltransferase activity |
| GO:0070577 | 0.0023 | 13.3029 | 0.2724 | 3 | 17 | lysine-acetylated histone binding |
| GO:0003956 | 0.0025 | 41.2507 | 0.0801 | 2 | 5 | NAD(P)+-protein-arginine ADP-ribosyltransferase activity |
| GO:0070290 | 0.0025 | 41.2507 | 0.0801 | 2 | 5 | N-acylphosphatidylethanolamine-specific phospholipase D activity |
| GO:0050681 | 0.0034 | 7.1138 | 0.625 | 4 | 39 | androgen receptor binding |
| GO:0005338 | 0.0051 | 24.7472 | 0.1122 | 2 | 7 | nucleotide-sugar transmembrane transporter activity |
| GO:0030274 | 0.0051 | 24.7472 | 0.1122 | 2 | 7 | LIM domain binding |
| GO:0016628 | 0.0057 | 9.3084 | 0.3686 | 3 | 23 | oxidoreductase activity, acting on the CH-CH group of donors, NAD or NADP as acceptor |
| GOMFID | Pvalue | OddsRatio | ExpCount | Count | Size | Term |
| GO:0097159 | 1e-04 | 1.5432 | 121.132 | 156 | 5553 | organic cyclic compound binding |
| GO:1901363 | 1e-04 | 1.5224 | 119.4087 | 153 | 5474 | heterocyclic compound binding |
| GO:0000166 | 2e-04 | 1.6683 | 47.6631 | 72 | 2185 | nucleotide binding |
| GO:0001883 | 3e-04 | 1.7137 | 37.5633 | 59 | 1722 | purine nucleoside binding |
| GO:0032549 | 3e-04 | 1.7137 | 37.5633 | 59 | 1722 | ribonucleoside binding |
| GO:0032555 | 4e-04 | 1.6819 | 38.1741 | 59 | 1750 | purine ribonucleotide binding |
| GO:0005546 | 5e-04 | 6.8283 | 1.0034 | 6 | 46 | phosphatidylinositol-4,5-bisphosphate binding |
| GO:0097367 | 5e-04 | 1.6153 | 46.0271 | 68 | 2110 | carbohydrate derivative binding |
| GO:0005524 | 6e-04 | 1.7322 | 30.5175 | 49 | 1399 | ATP binding |
| GO:0043168 | 0.001 | 1.5767 | 46.3733 | 67 | 2177 | anion binding |
| GO:0030554 | 0.0012 | 1.6749 | 31.4337 | 49 | 1441 | adenyl nucleotide binding |
| GO:0005497 | 0.0014 | 90.2053 | 0.0654 | 2 | 3 | androgen binding |
| GO:0046983 | 0.002 | 1.721 | 24.126 | 39 | 1106 | protein dimerization activity |
| GO:0019205 | 0.0023 | 5.9728 | 0.938 | 5 | 43 | nucleobase-containing compound kinase activity |
| GO:0016773 | 0.0034 | 1.8738 | 14.6371 | 26 | 671 | phosphotransferase activity, alcohol group as acceptor |
| GO:0016301 | 0.004 | 1.8481 | 14.8297 | 26 | 688 | kinase activity |
| GO:0005543 | 0.0055 | 2.216 | 7.1113 | 15 | 326 | phospholipid binding |
| GO:0080025 | 0.0066 | 9.0388 | 0.3926 | 3 | 18 | phosphatidylinositol-3,5-bisphosphate binding |
| GO:0005488 | 0.0078 | 1.6138 | 135.993 | 150 | 7415 | binding |
| GO:0016740 | 0.0078 | 1.4413 | 45.8962 | 62 | 2104 | transferase activity |
| GO:1901981 | 0.0081 | 3.2489 | 2.2904 | 7 | 105 | phosphatidylinositol phosphate binding |
| GOMFID | Pvalue | OddsRatio | ExpCount | Count | Size | Term |
| GO:0070064 | 0.0015 | 15.2297 | 0.2344 | 3 | 19 | proline-rich region binding |
| GO:0051059 | 0.0048 | 9.7414 | 0.3455 | 3 | 28 | NF-kappaB binding |
| GO:0005068 | 0.0051 | 23.0997 | 0.111 | 2 | 9 | transmembrane receptor protein tyrosine kinase adaptor activity |
| GO:0019864 | 0.0092 | 16.1667 | 0.1481 | 2 | 12 | IgG binding |
| GOMFID | Pvalue | OddsRatio | ExpCount | Count | Size | Term |
| GO:0005132 | 0.0023 | 32.5896 | 0.0714 | 2 | 17 | type I interferon receptor binding |
| GO:0004504 | 0.0042 | Inf | 0.0042 | 1 | 1 | peptidylglycine monooxygenase activity |
| GO:0004595 | 0.0042 | Inf | 0.0042 | 1 | 1 | pantetheine-phosphate adenylyltransferase activity |
| GO:0004598 | 0.0042 | Inf | 0.0042 | 1 | 1 | peptidylamidoglycolate lyase activity |
| GO:0004963 | 0.0042 | Inf | 0.0042 | 1 | 1 | follicle-stimulating hormone receptor activity |
| GO:0008892 | 0.0042 | Inf | 0.0042 | 1 | 1 | guanine deaminase activity |
| GO:0034899 | 0.0042 | Inf | 0.0042 | 1 | 1 | trimethylamine monooxygenase activity |
| GO:0004140 | 0.0084 | 240.8769 | 0.0084 | 1 | 2 | dephospho-CoA kinase activity |
| GO:0008068 | 0.0084 | 240.8769 | 0.0084 | 1 | 2 | extracellular-glutamate-gated chloride channel activity |
| GO:0033040 | 0.0084 | 240.8769 | 0.0084 | 1 | 2 | sour taste receptor activity |
| GOMFID | Pvalue | OddsRatio | ExpCount | Count | Size | Term |
| GO:0005132 | 1e-04 | 46.5327 | 0.0811 | 3 | 17 | type I interferon receptor binding |
| GO:0050543 | 3e-04 | 107.1575 | 0.0286 | 2 | 6 | icosatetraenoic acid binding |
| GO:0005125 | 0.0036 | 5.2514 | 1.0255 | 5 | 215 | cytokine activity |
| GO:0004504 | 0.0048 | Inf | 0.0048 | 1 | 1 | peptidylglycine monooxygenase activity |
| GO:0004595 | 0.0048 | Inf | 0.0048 | 1 | 1 | pantetheine-phosphate adenylyltransferase activity |
| GO:0004598 | 0.0048 | Inf | 0.0048 | 1 | 1 | peptidylamidoglycolate lyase activity |
| GO:0008811 | 0.0048 | Inf | 0.0048 | 1 | 1 | chloramphenicol O-acetyltransferase activity |
| GO:0038164 | 0.0048 | Inf | 0.0048 | 1 | 1 | thrombopoietin receptor activity |
| GO:0050290 | 0.0048 | Inf | 0.0048 | 1 | 1 | sphingomyelin phosphodiesterase D activity |
| GO:0070330 | 0.0049 | 21.4096 | 0.1049 | 2 | 22 | aromatase activity |
| GO:0008083 | 0.006 | 5.9006 | 0.725 | 4 | 152 | growth factor activity |
| GO:0005504 | 0.0078 | 16.4626 | 0.1336 | 2 | 28 | fatty acid binding |
| GO:0045296 | 0.0078 | 16.4626 | 0.1336 | 2 | 28 | cadherin binding |
| GO:0005154 | 0.009 | 15.2847 | 0.1431 | 2 | 30 | epidermal growth factor receptor binding |
| GO:0030246 | 0.0092 | 4.1626 | 1.2831 | 5 | 269 | carbohydrate binding |
| GO:0004140 | 0.0095 | 211.4595 | 0.0095 | 1 | 2 | dephospho-CoA kinase activity |
| GO:0004724 | 0.0095 | 211.4595 | 0.0095 | 1 | 2 | magnesium-dependent protein serine/threonine phosphatase activity |
| GO:0004741 | 0.0095 | 211.4595 | 0.0095 | 1 | 2 | [pyruvate dehydrogenase (lipoamide)] phosphatase activity |
| GO:0008068 | 0.0095 | 211.4595 | 0.0095 | 1 | 2 | extracellular-glutamate-gated chloride channel activity |
| GO:0033040 | 0.0095 | 211.4595 | 0.0095 | 1 | 2 | sour taste receptor activity |
| GO:0070538 | 0.0095 | 211.4595 | 0.0095 | 1 | 2 | oleic acid binding |
| GO:0004497 | 0.0097 | 7.2846 | 0.4388 | 3 | 92 | monooxygenase activity |
| GOMFID | Pvalue | OddsRatio | ExpCount | Count | Size | Term |
| GO:0001665 | 0.0029 | 38.29 | 0.0862 | 2 | 5 | alpha-N-acetylgalactosaminide alpha-2,6-sialyltransferase activity |
| GO:0015186 | 0.0029 | 38.29 | 0.0862 | 2 | 5 | L-glutamine transmembrane transporter activity |
| GO:0015180 | 0.0059 | 22.971 | 0.1206 | 2 | 7 | L-alanine transmembrane transporter activity |
| GO:0035242 | 0.0059 | 22.971 | 0.1206 | 2 | 7 | protein-arginine omega-N asymmetric methyltransferase activity |
| GO:0051879 | 0.0069 | 8.6379 | 0.3964 | 3 | 23 | Hsp90 protein binding |
| GO:0005200 | 0.007 | 3.7804 | 1.689 | 6 | 98 | structural constituent of cytoskeleton |
| GO:0008469 | 0.0077 | 19.1413 | 0.1379 | 2 | 8 | histone-arginine N-methyltransferase activity |
| GO:0044325 | 0.0096 | 3.5115 | 1.8097 | 6 | 105 | ion channel binding |
| GO:0015174 | 0.0098 | 16.4057 | 0.1551 | 2 | 9 | basic amino acid transmembrane transporter activity |
| GO:0016273 | 0.0098 | 16.4057 | 0.1551 | 2 | 9 | arginine N-methyltransferase activity |
| GOMFID | Pvalue | OddsRatio | ExpCount | Count | Size | Term |
| GO:0004477 | 7e-04 | 131.7957 | 0.0452 | 2 | 3 | methenyltetrahydrofolate cyclohydrolase activity |
| GO:0004487 | 7e-04 | 131.7957 | 0.0452 | 2 | 3 | methylenetetrahydrofolate dehydrogenase (NAD+) activity |
| GO:0004488 | 7e-04 | 131.7957 | 0.0452 | 2 | 3 | methylenetetrahydrofolate dehydrogenase (NADP+) activity |
| GO:0051537 | 0.0042 | 10.4372 | 0.3316 | 3 | 22 | 2 iron, 2 sulfur cluster binding |
| GO:0005488 | 0.0053 | 1.7325 | 200.0121 | 214 | 13270 | binding |
| GO:0016879 | 0.0058 | 6.0254 | 0.7235 | 4 | 48 | ligase activity, forming carbon-nitrogen bonds |
| GO:0016645 | 0.0068 | 8.6198 | 0.3919 | 3 | 26 | oxidoreductase activity, acting on the CH-NH group of donors |
| GO:0016655 | 0.0072 | 5.6397 | 0.7687 | 4 | 51 | oxidoreductase activity, acting on NAD(P)H, quinone or similar compound as acceptor |
| GO:0042301 | 0.0094 | 16.467 | 0.1507 | 2 | 10 | phosphate ion binding |
| GOMFID | Pvalue | OddsRatio | ExpCount | Count | Size | Term |
| GO:0019843 | 0.0019 | 6.2253 | 0.8912 | 5 | 49 | rRNA binding |
| GO:0008174 | 0.0032 | 36.2324 | 0.0909 | 2 | 5 | mRNA methyltransferase activity |
| GO:0003676 | 0.0039 | 1.435 | 67.1529 | 87 | 3692 | nucleic acid binding |
| GO:0044822 | 0.0042 | 1.7203 | 20.3896 | 33 | 1121 | poly(A) RNA binding |
| GOMFID | Pvalue | OddsRatio | ExpCount | Count | Size | Term |
| GO:0004146 | 1e-04 | Inf | 0.022 | 2 | 2 | dihydrofolate reductase activity |
| GO:0004181 | 0.0022 | 13.0504 | 0.2641 | 3 | 24 | metallocarboxypeptidase activity |
| GO:0050662 | 0.0035 | 3.8153 | 1.9474 | 7 | 177 | coenzyme binding |
| GO:0004843 | 0.0054 | 6.1108 | 0.7041 | 4 | 64 | thiol-dependent ubiquitin-specific protease activity |
| GO:0019894 | 0.0061 | 8.8349 | 0.3741 | 3 | 34 | kinesin binding |
| GO:0017124 | 0.0074 | 4.3781 | 1.2103 | 5 | 110 | SH3 domain binding |
| GO:0036041 | 0.0087 | 16.5231 | 0.143 | 2 | 13 | long-chain fatty acid binding |
| GO:0004197 | 0.009 | 5.2345 | 0.8142 | 4 | 74 | cysteine-type endopeptidase activity |
| GOMFID | Pvalue | OddsRatio | ExpCount | Count | Size | Term |
| GO:0035368 | 0.0013 | 67.3478 | 0.059 | 2 | 4 | selenocysteine insertion sequence binding |
| GO:0048030 | 0.0013 | 67.3478 | 0.059 | 2 | 4 | disaccharide binding |
| GO:0035254 | 0.0015 | 9.0421 | 0.5017 | 4 | 34 | glutamate receptor binding |
| GO:0004439 | 0.0021 | 44.8957 | 0.0738 | 2 | 5 | phosphatidylinositol-4,5-bisphosphate 5-phosphatase activity |
| GO:0004445 | 0.0031 | 33.6696 | 0.0885 | 2 | 6 | inositol-polyphosphate 5-phosphatase activity |
| GO:0051998 | 0.0031 | 33.6696 | 0.0885 | 2 | 6 | protein carboxyl O-methyltransferase activity |
| GO:0005488 | 0.0077 | 1.6913 | 195.7924 | 209 | 13270 | binding |
| GOMFID | Pvalue | OddsRatio | ExpCount | Count | Size | Term |
| GO:0004477 | 8e-04 | 120.8203 | 0.0492 | 2 | 3 | methenyltetrahydrofolate cyclohydrolase activity |
| GO:0004487 | 8e-04 | 120.8203 | 0.0492 | 2 | 3 | methylenetetrahydrofolate dehydrogenase (NAD+) activity |
| GO:0004488 | 8e-04 | 120.8203 | 0.0492 | 2 | 3 | methylenetetrahydrofolate dehydrogenase (NADP+) activity |
| GO:0016814 | 0.002 | 8.3828 | 0.5415 | 4 | 33 | hydrolase activity, acting on carbon-nitrogen (but not peptide) bonds, in cyclic amidines |
| GO:0005487 | 0.004 | 10.6913 | 0.3282 | 3 | 20 | nucleocytoplasmic transporter activity |
| GO:0033130 | 0.007 | 20.1302 | 0.1313 | 2 | 8 | acetylcholine receptor binding |
| GO:0047498 | 0.007 | 20.1302 | 0.1313 | 2 | 8 | calcium-dependent phospholipase A2 activity |
| GO:0017016 | 0.0082 | 2.7312 | 3.4621 | 9 | 211 | Ras GTPase binding |
| GO:0005388 | 0.0089 | 17.2533 | 0.1477 | 2 | 9 | calcium-transporting ATPase activity |
| GOMFID | Pvalue | OddsRatio | ExpCount | Count | Size | Term |
| GO:0016765 | 0.0051 | 6.2514 | 0.6944 | 4 | 53 | transferase activity, transferring alkyl or aryl (other than methyl) groups |
| GO:0042623 | 0.0052 | 2.7565 | 3.8255 | 10 | 292 | ATPase activity, coupled |
| GO:1901363 | 0.0073 | 1.4314 | 71.7148 | 89 | 5474 | heterocyclic compound binding |
| GO:0016462 | 0.0093 | 1.9451 | 9.7733 | 18 | 746 | pyrophosphatase activity |
| GO:0016817 | 0.0098 | 1.934 | 9.8257 | 18 | 750 | hydrolase activity, acting on acid anhydrides |
| NA. |
| n/a |
| NA. |
| n/a |
| NA. |
| n/a |
| NA. |
| n/a |
| NA. |
| n/a |
| NA. |
| n/a |
| NA. |
| n/a |
| NA. |
| n/a |
| NA. |
| n/a |
| NA. |
| n/a |
| NA. |
| n/a |
| NA. |
| n/a |
| NA. |
| n/a |
| NA. |
| n/a |
| NA. |
| n/a |
| NA. |
| n/a |
| NA. |
| n/a |
| NA. |
| n/a |
| NA. |
| n/a |
| NA. |
| n/a |
| NA. |
| n/a |
| NA. |
| n/a |
| NA. |
| n/a |
| NA. |
| n/a |
| NA. |
| n/a |
| NA. |
| n/a |
| NA. |
| n/a |
| NA. |
| n/a |
| NA. |
| n/a |
| NA. |
| n/a |
| NA. |
| n/a |
| NA. |
| n/a |
| NA. |
| n/a |
| NA. |
| n/a |
| NA. |
| n/a |
| NA. |
| n/a |
| NA. |
| n/a |
| NA. |
| n/a |
| NA. |
| n/a |
| NA. |
| n/a |
| NA. |
| n/a |
| NA. |
| n/a |
| NA. |
| n/a |
| NA. |
| n/a |
| NA. |
| n/a |
| NA. |
| n/a |
| NA. |
| n/a |
| NA. |
| n/a |
| NA. |
| n/a |
| NA. |
| n/a |
| NA. |
| n/a |
| NA. |
| n/a |
| NA. |
| n/a |
| NA. |
| n/a |
| NA. |
| n/a |
| NA. |
| n/a |
| NA. |
| n/a |
| NA. |
| n/a |
| NA. |
| n/a |
| NA. |
| n/a |
| NA. |
| n/a |
| NA. |
| n/a |
| NA. |
| n/a |
| NA. |
| n/a |
| NA. |
| n/a |
| NA. |
| n/a |
| NA. |
| n/a |
| NA. |
| n/a |
| NA. |
| n/a |
| NA. |
| n/a |
| NA. |
| n/a |
| NA. |
| n/a |
| NA. |
| n/a |
| NA. |
| n/a |
| NA. |
| n/a |
| NA. |
| n/a |
| NA. |
| n/a |
| NA. |
| n/a |
| NA. |
| n/a |
| NA. |
| n/a |
| NA. |
| n/a |
| NA. |
| n/a |
| NA. |
| n/a |
| NA. |
| n/a |
| NA. |
| n/a |
| NA. |
| n/a |
| NA. |
| n/a |
| NA. |
| n/a |
| NA. |
| n/a |
| NA. |
| n/a |
| NA. |
| n/a |
| NA. |
| n/a |
| NA. |
| n/a |
| NA. |
| n/a |
| NA. |
| n/a |
| NA. |
| n/a |
| NA. |
| n/a |
| NA. |
| n/a |
| NA. |
| n/a |
| NA. |
| n/a |
| NA. |
| n/a |
| NA. |
| n/a |
| NA. |
| n/a |
| NA. |
| n/a |
| NA. |
| n/a |
| NA. |
| n/a |
| NA. |
| n/a |
| NA. |
| n/a |
| NA. |
| n/a |
| NA. |
| n/a |
| NA. |
| n/a |
| NA. |
| n/a |
| GOMFID | Pvalue | OddsRatio | ExpCount | Count | Size | Term |
| GO:0006364 | 0 | 5.367 | 2.9323 | 14 | 147 | rRNA processing |
| GO:0006414 | 0 | 4.4001 | 4.0294 | 16 | 202 | translational elongation |
| GO:0006415 | 0 | 4.5104 | 3.431 | 14 | 172 | translational termination |
| GO:0000184 | 0 | 5.4017 | 2.274 | 11 | 114 | nuclear-transcribed mRNA catabolic process, nonsense-mediated decay |
| GO:0044033 | 0 | 3.9812 | 4.1292 | 15 | 207 | multi-organism metabolic process |
| GO:0034660 | 0 | 2.846 | 9.176 | 24 | 460 | ncRNA metabolic process |
| GO:0019083 | 0 | 4.1395 | 3.7103 | 14 | 186 | viral transcription |
| GO:0016259 | 0 | 6.0407 | 1.6756 | 9 | 84 | selenocysteine metabolic process |
| GO:0006396 | 2e-04 | 2.1714 | 15.3997 | 31 | 772 | RNA processing |
| GO:0006413 | 2e-04 | 3.1615 | 5.1066 | 15 | 256 | translational initiation |
| GO:0006614 | 2e-04 | 4.8658 | 2.0347 | 9 | 102 | SRP-dependent cotranslational protein targeting to membrane |
| GO:0006402 | 2e-04 | 3.4825 | 4.0294 | 13 | 202 | mRNA catabolic process |
| GO:0006612 | 3e-04 | 3.5454 | 3.6504 | 12 | 183 | protein targeting to membrane |
| GO:0072599 | 4e-04 | 4.478 | 2.1943 | 9 | 110 | establishment of protein localization to endoplasmic reticulum |
| GO:0006353 | 6e-04 | 4.664 | 1.8751 | 8 | 94 | DNA-templated transcription, termination |
| GO:0006520 | 9e-04 | 2.2862 | 9.7744 | 21 | 490 | cellular amino acid metabolic process |
| GO:0022411 | 0.001 | 2.0089 | 14.8611 | 28 | 745 | cellular component disassembly |
| GO:0043241 | 0.0012 | 2.6281 | 6.0641 | 15 | 304 | protein complex disassembly |
| GO:0043603 | 0.0014 | 1.8762 | 18.1923 | 32 | 912 | cellular amide metabolic process |
| GO:0043043 | 0.0019 | 2.0243 | 12.5671 | 24 | 630 | peptide biosynthetic process |
| GO:0009059 | 0.0019 | 1.4192 | 97.6442 | 122 | 4895 | macromolecule biosynthetic process |
| GO:0046016 | 0.0023 | 49.4405 | 0.0798 | 2 | 4 | positive regulation of transcription by glucose |
| GO:0042274 | 0.0024 | 5.9276 | 0.9375 | 5 | 47 | ribosomal small subunit biogenesis |
| GO:0044249 | 0.0029 | 1.3855 | 114.9588 | 139 | 5763 | cellular biosynthetic process |
| GO:0030195 | 0.0031 | 5.5314 | 0.9974 | 5 | 50 | negative regulation of blood coagulation |
| GO:0044710 | 0.0031 | 1.3871 | 105.5634 | 129 | 5292 | single-organism metabolic process |
| GO:0006807 | 0.0032 | 1.3751 | 127.9049 | 152 | 6412 | nitrogen compound metabolic process |
| GO:0006406 | 0.0033 | 4.4662 | 1.4562 | 6 | 73 | mRNA export from nucleus |
| GO:0022613 | 0.0034 | 2.4196 | 6.1033 | 14 | 310 | ribonucleoprotein complex biogenesis |
| GO:0061087 | 0.0038 | 32.9582 | 0.0997 | 2 | 5 | positive regulation of histone H3-K27 methylation |
| GO:1903035 | 0.0043 | 3.0465 | 3.1318 | 9 | 157 | negative regulation of response to wounding |
| GO:0044764 | 0.0044 | 1.8158 | 15.6989 | 27 | 787 | multi-organism cellular process |
| GO:0016482 | 0.005 | 1.6462 | 23.8376 | 37 | 1195 | cytoplasmic transport |
| GO:0043436 | 0.0056 | 1.645 | 23.1793 | 36 | 1162 | oxoacid metabolic process |
| GO:0045990 | 0.0056 | 24.717 | 0.1197 | 2 | 6 | carbon catabolite regulation of transcription |
| GO:0044403 | 0.0066 | 1.755 | 16.1976 | 27 | 812 | symbiosis, encompassing mutualism through parasitism |
| GO:0019058 | 0.0067 | 2.0504 | 8.6972 | 17 | 436 | viral life cycle |
| GO:0071426 | 0.007 | 3.7849 | 1.6956 | 6 | 85 | ribonucleoprotein complex export from nucleus |
| GO:0002069 | 0.0078 | 19.7723 | 0.1396 | 2 | 7 | columnar/cuboidal epithelial cell maturation |
| GO:0043484 | 0.0079 | 3.6909 | 1.7355 | 6 | 87 | regulation of RNA splicing |
| GO:0048821 | 0.008 | 8.2581 | 0.4189 | 3 | 21 | erythrocyte development |
| GO:0043297 | 0.0084 | 4.288 | 1.2567 | 5 | 63 | apical junction assembly |
| GO:0010501 | 0.0088 | 5.3673 | 0.8179 | 4 | 41 | RNA secondary structure unwinding |
| GO:0032543 | 0.009 | 3.1752 | 2.3339 | 7 | 117 | mitochondrial translation |
| GO:0044260 | 0.0099 | 1.3155 | 159.1431 | 180 | 7978 | cellular macromolecule metabolic process |
| GOMFID | Pvalue | OddsRatio | ExpCount | Count | Size | Term |
| GO:0050911 | 0 | 4.7373 | 4.2802 | 18 | 365 | detection of chemical stimulus involved in sensory perception of smell |
| GO:0009593 | 0 | 4.0667 | 5.23 | 19 | 446 | detection of chemical stimulus |
| GO:0000042 | 0 | 33.2918 | 0.2111 | 5 | 18 | protein targeting to Golgi |
| GO:0007606 | 0 | 3.9432 | 5.3824 | 19 | 459 | sensory perception of chemical stimulus |
| GO:0050906 | 0 | 3.7045 | 5.3824 | 18 | 459 | detection of stimulus involved in sensory perception |
| GO:2000503 | 0 | 85.6575 | 0.0704 | 3 | 6 | positive regulation of natural killer cell chemotaxis |
| GO:0050729 | 1e-04 | 6.7321 | 1.3134 | 8 | 112 | positive regulation of inflammatory response |
| GO:0043207 | 1e-04 | 2.5267 | 10.4717 | 24 | 893 | response to external biotic stimulus |
| GO:0006891 | 1e-04 | 11.3709 | 0.5042 | 5 | 43 | intra-Golgi vesicle-mediated transport |
| GO:0050877 | 2e-04 | 2.2716 | 14.1773 | 29 | 1209 | neurological system process |
| GO:0007186 | 2e-04 | 2.2902 | 13.5441 | 28 | 1155 | G-protein coupled receptor signaling pathway |
| GO:0031640 | 5e-04 | 12.2849 | 0.3752 | 4 | 32 | killing of cells of other organism |
| GO:0006402 | 6e-04 | 4.0807 | 2.3687 | 9 | 202 | mRNA catabolic process |
| GO:0002251 | 6e-04 | 11.4644 | 0.3987 | 4 | 34 | organ or tissue specific immune response |
| GO:0010818 | 8e-04 | 19.7544 | 0.1876 | 3 | 16 | T cell chemotaxis |
| GO:0051464 | 8e-04 | 85.1923 | 0.0469 | 2 | 4 | positive regulation of cortisol secretion |
| GO:0035821 | 0.001 | 4.7894 | 1.5713 | 7 | 134 | modification of morphology or physiology of other organism |
| GO:0071346 | 0.0011 | 4.7145 | 1.5948 | 7 | 136 | cellular response to interferon-gamma |
| GO:0050832 | 0.0012 | 9.55 | 0.4691 | 4 | 40 | defense response to fungus |
| GO:0009617 | 0.0013 | 2.626 | 6.1212 | 15 | 522 | response to bacterium |
| GO:0002322 | 0.0013 | 56.7912 | 0.0586 | 2 | 5 | B cell proliferation involved in immune response |
| GO:1901623 | 0.0016 | 15.1024 | 0.2345 | 3 | 20 | regulation of lymphocyte chemotaxis |
| GO:0050995 | 0.0018 | 14.2624 | 0.2463 | 3 | 21 | negative regulation of lipid catabolic process |
| GO:0052472 | 0.0018 | 14.2624 | 0.2463 | 3 | 21 | modulation by host of symbiont transcription |
| GO:0072676 | 0.0019 | 6.16 | 0.8795 | 5 | 75 | lymphocyte migration |
| GO:0014050 | 0.002 | 42.5907 | 0.0704 | 2 | 6 | negative regulation of glutamate secretion |
| GO:0097211 | 0.002 | 42.5907 | 0.0704 | 2 | 6 | cellular response to gonadotropin-releasing hormone |
| GO:0002227 | 0.0021 | 13.5109 | 0.258 | 3 | 22 | innate immune response in mucosa |
| GO:0042026 | 0.0021 | 13.5109 | 0.258 | 3 | 22 | protein refolding |
| GO:0071222 | 0.0021 | 4.1899 | 1.7824 | 7 | 152 | cellular response to lipopolysaccharide |
| GO:0000184 | 0.0022 | 4.8062 | 1.3368 | 6 | 114 | nuclear-transcribed mRNA catabolic process, nonsense-mediated decay |
| GO:0051953 | 0.0024 | 12.8345 | 0.2697 | 3 | 23 | negative regulation of amine transport |
| GO:0019731 | 0.0024 | 7.8096 | 0.5629 | 4 | 48 | antibacterial humoral response |
| GO:0019218 | 0.0025 | 5.7475 | 0.9381 | 5 | 80 | regulation of steroid metabolic process |
| GO:0008211 | 0.0027 | 12.2226 | 0.2814 | 3 | 24 | glucocorticoid metabolic process |
| GO:0051256 | 0.0028 | 34.0703 | 0.0821 | 2 | 7 | mitotic spindle midzone assembly |
| GO:0060558 | 0.0028 | 34.0703 | 0.0821 | 2 | 7 | regulation of calcidiol 1-monooxygenase activity |
| GO:2000848 | 0.0028 | 34.0703 | 0.0821 | 2 | 7 | positive regulation of corticosteroid hormone secretion |
| GO:0032370 | 0.003 | 7.3097 | 0.598 | 4 | 51 | positive regulation of lipid transport |
| GO:0042346 | 0.003 | 11.6662 | 0.2932 | 3 | 25 | positive regulation of NF-kappaB import into nucleus |
| GO:0016259 | 0.0031 | 5.4551 | 0.985 | 5 | 84 | selenocysteine metabolic process |
| GO:0030593 | 0.0034 | 5.3197 | 1.0085 | 5 | 86 | neutrophil chemotaxis |
| GO:0070374 | 0.0038 | 3.7461 | 1.9818 | 7 | 169 | positive regulation of ERK1 and ERK2 cascade |
| GO:0018149 | 0.0039 | 6.7346 | 0.645 | 4 | 55 | peptide cross-linking |
| GO:0043627 | 0.0041 | 3.3271 | 2.5446 | 8 | 217 | response to estrogen |
| GO:0071347 | 0.0041 | 5.068 | 1.0554 | 5 | 90 | cellular response to interleukin-1 |
| GO:0046890 | 0.0041 | 4.2159 | 1.5127 | 6 | 129 | regulation of lipid biosynthetic process |
| GO:0045075 | 0.0047 | 24.3328 | 0.1055 | 2 | 9 | regulation of interleukin-12 biosynthetic process |
| GO:0051231 | 0.0047 | 24.3328 | 0.1055 | 2 | 9 | spindle elongation |
| GO:2000849 | 0.0047 | 24.3328 | 0.1055 | 2 | 9 | regulation of glucocorticoid secretion |
| GO:0071216 | 0.0049 | 3.5679 | 2.0756 | 7 | 177 | cellular response to biotic stimulus |
| GO:0043270 | 0.005 | 3.2178 | 2.6267 | 8 | 224 | positive regulation of ion transport |
| GO:0002548 | 0.005 | 6.2432 | 0.6919 | 4 | 59 | monocyte chemotaxis |
| GO:0051607 | 0.0052 | 2.7628 | 3.8228 | 10 | 326 | defense response to virus |
| GO:0034655 | 0.0054 | 2.6013 | 4.4678 | 11 | 381 | nucleobase-containing compound catabolic process |
| GO:0010876 | 0.0054 | 2.7451 | 3.8463 | 10 | 328 | lipid localization |
| GO:0045670 | 0.0057 | 6.0234 | 0.7153 | 4 | 61 | regulation of osteoclast differentiation |
| GO:0031622 | 0.0058 | 21.2898 | 0.1173 | 2 | 10 | positive regulation of fever generation |
| GO:0042747 | 0.0058 | 21.2898 | 0.1173 | 2 | 10 | circadian sleep/wake cycle, REM sleep |
| GO:0071548 | 0.0061 | 8.8463 | 0.3752 | 3 | 32 | response to dexamethasone |
| GO:0019083 | 0.0064 | 3.3865 | 2.1811 | 7 | 186 | viral transcription |
| GO:0006614 | 0.007 | 4.4376 | 1.1961 | 5 | 102 | SRP-dependent cotranslational protein targeting to membrane |
| GO:0042368 | 0.007 | 18.9231 | 0.129 | 2 | 11 | vitamin D biosynthetic process |
| GO:0045472 | 0.007 | 18.9231 | 0.129 | 2 | 11 | response to ether |
| GO:0071312 | 0.0073 | 8.2745 | 0.3987 | 3 | 34 | cellular response to alkaloid |
| GO:1990267 | 0.0075 | 3.6999 | 1.7121 | 6 | 146 | response to transition metal nanoparticle |
| GO:0019233 | 0.0079 | 4.3036 | 1.2313 | 5 | 105 | sensory perception of pain |
| GO:0002726 | 0.0084 | 17.0297 | 0.1407 | 2 | 12 | positive regulation of T cell cytokine production |
| GO:0030656 | 0.0084 | 17.0297 | 0.1407 | 2 | 12 | regulation of vitamin metabolic process |
| GO:0032308 | 0.0084 | 17.0297 | 0.1407 | 2 | 12 | positive regulation of prostaglandin secretion |
| GO:0032375 | 0.0084 | 17.0297 | 0.1407 | 2 | 12 | negative regulation of cholesterol transport |
| GO:0043922 | 0.0084 | 17.0297 | 0.1407 | 2 | 12 | negative regulation by host of viral transcription |
| GO:0080184 | 0.0084 | 17.0297 | 0.1407 | 2 | 12 | response to phenylpropanoid |
| GO:0072599 | 0.0095 | 4.0974 | 1.2899 | 5 | 110 | establishment of protein localization to endoplasmic reticulum |
| GO:0097530 | 0.0095 | 4.0974 | 1.2899 | 5 | 110 | granulocyte migration |
| GO:0046651 | 0.0096 | 2.8552 | 2.9433 | 8 | 251 | lymphocyte proliferation |
| GO:0060456 | 0.0098 | 15.4805 | 0.1524 | 2 | 13 | positive regulation of digestive system process |
| GO:0030431 | 0.0099 | 7.3269 | 0.4456 | 3 | 38 | sleep |
| GO:0033280 | 0.0099 | 7.3269 | 0.4456 | 3 | 38 | response to vitamin D |
| GOMFID | Pvalue | OddsRatio | ExpCount | Count | Size | Term |
| GO:0050832 | 0 | 14.8341 | 0.4844 | 6 | 40 | defense response to fungus |
| GO:0007186 | 0 | 2.4938 | 13.9857 | 31 | 1155 | G-protein coupled receptor signaling pathway |
| GO:2000503 | 0 | 82.877 | 0.0727 | 3 | 6 | positive regulation of natural killer cell chemotaxis |
| GO:0031640 | 0 | 15.4895 | 0.3875 | 5 | 32 | killing of cells of other organism |
| GO:0035821 | 2e-04 | 5.3637 | 1.6226 | 8 | 134 | modification of morphology or physiology of other organism |
| GO:0071346 | 3e-04 | 5.2792 | 1.6468 | 8 | 136 | cellular response to interferon-gamma |
| GO:0009593 | 4e-04 | 2.997 | 5.4005 | 15 | 446 | detection of chemical stimulus |
| GO:0050729 | 4e-04 | 5.6087 | 1.3562 | 7 | 112 | positive regulation of inflammatory response |
| GO:0007606 | 5e-04 | 2.9068 | 5.558 | 15 | 459 | sensory perception of chemical stimulus |
| GO:0050911 | 5e-04 | 3.1609 | 4.4197 | 13 | 365 | detection of chemical stimulus involved in sensory perception of smell |
| GO:0002251 | 7e-04 | 11.0903 | 0.4117 | 4 | 34 | organ or tissue specific immune response |
| GO:0002548 | 7e-04 | 7.7312 | 0.7144 | 5 | 59 | monocyte chemotaxis |
| GO:1904431 | 9e-04 | 82.4415 | 0.0484 | 2 | 4 | positive regulation of t-circle formation |
| GO:2000553 | 9e-04 | 82.4415 | 0.0484 | 2 | 4 | positive regulation of T-helper 2 cell cytokine production |
| GO:0051970 | 0.0014 | 54.9574 | 0.0605 | 2 | 5 | negative regulation of transmission of nerve impulse |
| GO:0050906 | 0.0014 | 2.6913 | 5.558 | 14 | 459 | detection of stimulus involved in sensory perception |
| GO:1901623 | 0.0017 | 14.6121 | 0.2422 | 3 | 20 | regulation of lymphocyte chemotaxis |
| GO:0052472 | 0.002 | 13.7995 | 0.2543 | 3 | 21 | modulation by host of symbiont transcription |
| GO:0010792 | 0.0021 | 41.2154 | 0.0727 | 2 | 6 | DNA double-strand break processing involved in repair via single-strand annealing |
| GO:0060696 | 0.0021 | 41.2154 | 0.0727 | 2 | 6 | regulation of phospholipid catabolic process |
| GO:0072676 | 0.0021 | 5.9579 | 0.9082 | 5 | 75 | lymphocyte migration |
| GO:0002227 | 0.0023 | 13.0723 | 0.2664 | 3 | 22 | innate immune response in mucosa |
| GO:0046782 | 0.0026 | 5.712 | 0.9445 | 5 | 78 | regulation of viral transcription |
| GO:0070098 | 0.0027 | 5.6344 | 0.9566 | 5 | 79 | chemokine-mediated signaling pathway |
| GO:0043207 | 0.0027 | 2.0846 | 10.8132 | 21 | 893 | response to external biotic stimulus |
| GO:0019080 | 0.0028 | 3.5611 | 2.3854 | 8 | 197 | viral gene expression |
| GO:0090305 | 0.0029 | 3.2442 | 2.9425 | 9 | 243 | nucleic acid phosphodiester bond hydrolysis |
| GO:0006685 | 0.0029 | 32.9702 | 0.0848 | 2 | 7 | sphingomyelin catabolic process |
| GO:0060455 | 0.0029 | 32.9702 | 0.0848 | 2 | 7 | negative regulation of gastric acid secretion |
| GO:0051702 | 0.0036 | 6.9234 | 0.6297 | 4 | 52 | interaction with symbiont |
| GO:0021559 | 0.0039 | 27.4734 | 0.0969 | 2 | 8 | trigeminal nerve development |
| GO:0051971 | 0.0039 | 27.4734 | 0.0969 | 2 | 8 | positive regulation of transmission of nerve impulse |
| GO:0030593 | 0.0039 | 5.1451 | 1.0414 | 5 | 86 | neutrophil chemotaxis |
| GO:0019730 | 0.0041 | 6.6456 | 0.6539 | 4 | 54 | antimicrobial humoral response |
| GO:0018149 | 0.0044 | 6.5149 | 0.666 | 4 | 55 | peptide cross-linking |
| GO:0071347 | 0.0047 | 4.9017 | 1.0898 | 5 | 90 | cellular response to interleukin-1 |
| GO:0097119 | 0.005 | 23.5471 | 0.109 | 2 | 9 | postsynaptic density protein 95 clustering |
| GO:1900225 | 0.005 | 23.5471 | 0.109 | 2 | 9 | regulation of NLRP3 inflammasome complex assembly |
| GO:0016071 | 0.0054 | 2.229 | 7.1321 | 15 | 589 | mRNA metabolic process |
| GO:0043903 | 0.0059 | 3.1252 | 2.7003 | 8 | 223 | regulation of symbiosis, encompassing mutualism through parasitism |
| GO:0002720 | 0.0061 | 8.8654 | 0.3754 | 3 | 31 | positive regulation of cytokine production involved in immune response |
| GO:0042755 | 0.0061 | 8.8654 | 0.3754 | 3 | 31 | eating behavior |
| GO:0035743 | 0.0062 | 20.6024 | 0.1211 | 2 | 10 | CD4-positive, alpha-beta T cell cytokine production |
| GO:0042742 | 0.0062 | 3.096 | 2.7245 | 8 | 225 | defense response to bacterium |
| GO:0051607 | 0.0065 | 2.6697 | 3.9475 | 10 | 326 | defense response to virus |
| GO:0006401 | 0.0072 | 3.0115 | 2.7971 | 8 | 231 | RNA catabolic process |
| GO:0007610 | 0.0072 | 2.0471 | 8.8031 | 17 | 727 | behavior |
| GO:0032689 | 0.0073 | 8.2733 | 0.3996 | 3 | 33 | negative regulation of interferon-gamma production |
| GO:0031125 | 0.0075 | 18.3121 | 0.1332 | 2 | 11 | rRNA 3'-end processing |
| GO:0032700 | 0.0075 | 18.3121 | 0.1332 | 2 | 11 | negative regulation of interleukin-17 production |
| GO:0031644 | 0.0088 | 5.2698 | 0.8113 | 4 | 67 | regulation of neurological system process |
| GO:0043922 | 0.0089 | 16.4798 | 0.1453 | 2 | 12 | negative regulation by host of viral transcription |
| GO:0071028 | 0.0089 | 16.4798 | 0.1453 | 2 | 12 | nuclear mRNA surveillance |
| GO:0050702 | 0.0093 | 7.5197 | 0.4359 | 3 | 36 | interleukin-1 beta secretion |
| GOMFID | Pvalue | OddsRatio | ExpCount | Count | Size | Term |
| GO:0070124 | 0 | 5.6787 | 2.4465 | 12 | 84 | mitochondrial translational initiation |
| GO:0070125 | 0 | 5.6787 | 2.4465 | 12 | 84 | mitochondrial translational elongation |
| GO:0070126 | 0 | 5.5244 | 2.5047 | 12 | 86 | mitochondrial translational termination |
| GO:0043604 | 0 | 2.2207 | 20.5622 | 42 | 706 | amide biosynthetic process |
| GO:0006518 | 0 | 2.1373 | 21.8146 | 43 | 749 | peptide metabolic process |
| GO:0000398 | 0 | 2.9714 | 7.689 | 21 | 264 | mRNA splicing, via spliceosome |
| GO:0000375 | 0 | 2.9225 | 7.8055 | 21 | 268 | RNA splicing, via transesterification reactions |
| GO:0006268 | 0 | 33.6203 | 0.233 | 4 | 8 | DNA unwinding involved in DNA replication |
| GO:0043624 | 0 | 2.8751 | 7.922 | 21 | 272 | cellular protein complex disassembly |
| GO:0006412 | 1e-04 | 2.2925 | 15.0453 | 32 | 523 | translation |
| GO:0032984 | 1e-04 | 2.588 | 9.1452 | 22 | 314 | macromolecular complex disassembly |
| GO:0034248 | 2e-04 | 2.4858 | 9.9316 | 23 | 341 | regulation of cellular amide metabolic process |
| GO:0007005 | 3e-04 | 1.9262 | 21.0574 | 38 | 723 | mitochondrion organization |
| GO:1903320 | 7e-04 | 2.4503 | 8.2715 | 19 | 284 | regulation of protein modification by small protein conjugation or removal |
| GO:0010608 | 9e-04 | 2.1029 | 12.6111 | 25 | 433 | posttranscriptional regulation of gene expression |
| GO:0006396 | 0.0011 | 1.7916 | 22.4845 | 38 | 772 | RNA processing |
| GO:0070302 | 0.0013 | 2.7195 | 5.5046 | 14 | 189 | regulation of stress-activated protein kinase signaling cascade |
| GO:0034641 | 0.0014 | 1.3387 | 178.4487 | 210 | 6127 | cellular nitrogen compound metabolic process |
| GO:0044249 | 0.0014 | 1.3405 | 167.8472 | 199 | 5763 | cellular biosynthetic process |
| GO:0044238 | 0.0014 | 1.3579 | 283.2986 | 314 | 9727 | primary metabolic process |
| GO:0006301 | 0.0014 | 4.631 | 1.6892 | 7 | 58 | postreplication repair |
| GO:0044711 | 0.0015 | 1.519 | 49.2503 | 70 | 1691 | single-organism biosynthetic process |
| GO:1901566 | 0.0018 | 1.5709 | 38.5615 | 57 | 1324 | organonitrogen compound biosynthetic process |
| GO:0042276 | 0.0019 | 8.9589 | 0.5534 | 4 | 19 | error-prone translesion synthesis |
| GO:0070987 | 0.0019 | 8.9589 | 0.5534 | 4 | 19 | error-free translesion synthesis |
| GO:0006302 | 0.0022 | 2.4636 | 6.4657 | 15 | 222 | double-strand break repair |
| GO:0060319 | 0.0025 | 66.9582 | 0.0874 | 2 | 3 | primitive erythrocyte differentiation |
| GO:0033182 | 0.0025 | 14.3741 | 0.2912 | 3 | 10 | regulation of histone ubiquitination |
| GO:0032481 | 0.0026 | 3.6502 | 2.3882 | 8 | 82 | positive regulation of type I interferon production |
| GO:0044260 | 0.0028 | 1.3091 | 232.3591 | 262 | 7978 | cellular macromolecule metabolic process |
| GO:0045727 | 0.0028 | 3.6012 | 2.4174 | 8 | 83 | positive regulation of translation |
| GO:1903902 | 0.0031 | 3.2357 | 2.9999 | 9 | 103 | positive regulation of viral life cycle |
| GO:0009059 | 0.0032 | 1.3174 | 142.5668 | 170 | 4895 | macromolecule biosynthetic process |
| GO:1903312 | 0.0032 | 5.6062 | 1.0194 | 5 | 35 | negative regulation of mRNA metabolic process |
| GO:0007220 | 0.0034 | 7.4643 | 0.6407 | 4 | 22 | Notch receptor processing |
| GO:0044237 | 0.0039 | 1.9531 | 13.5341 | 24 | 568 | cellular metabolic process |
| GO:0009263 | 0.0044 | 11.1784 | 0.3495 | 3 | 12 | deoxyribonucleotide biosynthetic process |
| GO:0097067 | 0.0044 | 11.1784 | 0.3495 | 3 | 12 | cellular response to thyroid hormone stimulus |
| GO:0031398 | 0.0046 | 2.5406 | 5.0095 | 12 | 172 | positive regulation of protein ubiquitination |
| GO:0032874 | 0.0047 | 2.8177 | 3.7862 | 10 | 130 | positive regulation of stress-activated MAPK cascade |
| GO:0001757 | 0.0049 | 33.4769 | 0.1165 | 2 | 4 | somite specification |
| GO:0009189 | 0.0049 | 33.4769 | 0.1165 | 2 | 4 | deoxyribonucleoside diphosphate biosynthetic process |
| GO:0090086 | 0.0049 | 33.4769 | 0.1165 | 2 | 4 | negative regulation of protein deubiquitination |
| GO:2000564 | 0.0049 | 33.4769 | 0.1165 | 2 | 4 | regulation of CD8-positive, alpha-beta T cell proliferation |
| GO:0006283 | 0.0049 | 3.6302 | 2.097 | 7 | 72 | transcription-coupled nucleotide-excision repair |
| GO:0045605 | 0.0056 | 10.0599 | 0.3786 | 3 | 13 | negative regulation of epidermal cell differentiation |
| GO:0042711 | 0.007 | 9.1448 | 0.4077 | 3 | 14 | maternal behavior |
| GO:1901576 | 0.0071 | 1.868 | 12.4927 | 22 | 468 | organic substance biosynthetic process |
| GO:0097009 | 0.0073 | 5.8397 | 0.7864 | 4 | 27 | energy homeostasis |
| GO:0046782 | 0.0076 | 3.3221 | 2.2717 | 7 | 78 | regulation of viral transcription |
| GO:0033554 | 0.0079 | 1.3966 | 54.4928 | 72 | 1871 | cellular response to stress |
| GO:0008631 | 0.0079 | 4.4236 | 1.2524 | 5 | 43 | intrinsic apoptotic signaling pathway in response to oxidative stress |
| GO:0060075 | 0.008 | 22.3165 | 0.1456 | 2 | 5 | regulation of resting membrane potential |
| GO:2001171 | 0.008 | 22.3165 | 0.1456 | 2 | 5 | positive regulation of ATP biosynthetic process |
| GO:0002755 | 0.0081 | 3.2757 | 2.3009 | 7 | 79 | MyD88-dependent toll-like receptor signaling pathway |
| GO:0006446 | 0.0081 | 3.2757 | 2.3009 | 7 | 79 | regulation of translational initiation |
| GO:0030261 | 0.0084 | 5.596 | 0.8155 | 4 | 28 | chromosome condensation |
| GO:1902187 | 0.0086 | 8.3822 | 0.4369 | 3 | 15 | negative regulation of viral release from host cell |
| GO:0048511 | 0.009 | 1.9419 | 9.6986 | 18 | 333 | rhythmic process |
| GO:0051091 | 0.0097 | 2.2009 | 6.2036 | 13 | 213 | positive regulation of sequence-specific DNA binding transcription factor activity |
| GOMFID | Pvalue | OddsRatio | ExpCount | Count | Size | Term |
| GO:0034641 | 0 | 1.7351 | 185.4773 | 248 | 6127 | cellular nitrogen compound metabolic process |
| GO:0044260 | 0 | 1.7147 | 241.5111 | 302 | 7978 | cellular macromolecule metabolic process |
| GO:0006518 | 0 | 2.3276 | 22.6738 | 48 | 749 | peptide metabolic process |
| GO:0046483 | 0 | 1.5675 | 165.5886 | 215 | 5470 | heterocycle metabolic process |
| GO:0006725 | 0 | 1.5593 | 166.1335 | 215 | 5488 | cellular aromatic compound metabolic process |
| GO:0043604 | 0 | 2.3044 | 21.3721 | 45 | 706 | amide biosynthetic process |
| GO:0009059 | 0 | 1.5442 | 148.1821 | 194 | 4895 | macromolecule biosynthetic process |
| GO:0090304 | 0 | 1.5332 | 143.5807 | 188 | 4743 | nucleic acid metabolic process |
| GO:0044249 | 0 | 1.5219 | 167.5083 | 213 | 5609 | cellular biosynthetic process |
| GO:1901360 | 0 | 1.5057 | 172.5814 | 218 | 5701 | organic cyclic compound metabolic process |
| GO:0070125 | 0 | 4.9177 | 2.5429 | 11 | 84 | mitochondrial translational elongation |
| GO:0007005 | 1e-04 | 2.0132 | 21.8868 | 41 | 723 | mitochondrion organization |
| GO:0043241 | 2e-04 | 2.5719 | 9.2027 | 22 | 304 | protein complex disassembly |
| GO:0071704 | 2e-04 | 1.5843 | 111.3409 | 140 | 4328 | organic substance metabolic process |
| GO:1901566 | 2e-04 | 1.6922 | 40.0803 | 63 | 1324 | organonitrogen compound biosynthetic process |
| GO:0070124 | 2e-04 | 4.4005 | 2.5429 | 10 | 84 | mitochondrial translational initiation |
| GO:0070126 | 3e-04 | 4.2841 | 2.6034 | 10 | 86 | mitochondrial translational termination |
| GO:0022411 | 3e-04 | 1.8927 | 22.5527 | 40 | 745 | cellular component disassembly |
| GO:0019538 | 5e-04 | 1.379 | 162.3192 | 197 | 5362 | protein metabolic process |
| GO:0016071 | 5e-04 | 1.9686 | 17.8303 | 33 | 589 | mRNA metabolic process |
| GO:0002358 | 9e-04 | Inf | 0.0605 | 2 | 2 | B cell homeostatic proliferation |
| GO:1902512 | 9e-04 | Inf | 0.0605 | 2 | 2 | positive regulation of apoptotic DNA fragmentation |
| GO:0006614 | 0.001 | 3.5353 | 3.0878 | 10 | 102 | SRP-dependent cotranslational protein targeting to membrane |
| GO:0051171 | 0.0015 | 1.3598 | 122.148 | 151 | 4035 | regulation of nitrogen compound metabolic process |
| GO:0006412 | 0.0016 | 2.125 | 10.9594 | 22 | 374 | translation |
| GO:0045333 | 0.0016 | 2.6562 | 5.6306 | 14 | 186 | cellular respiration |
| GO:0072599 | 0.0018 | 3.2508 | 3.3299 | 10 | 110 | establishment of protein localization to endoplasmic reticulum |
| GO:0022602 | 0.0023 | 3.3978 | 2.8759 | 9 | 95 | ovulation cycle process |
| GO:0044238 | 0.0024 | 1.5885 | 46.4973 | 64 | 1946 | primary metabolic process |
| GO:0010467 | 0.0024 | 1.811 | 18.9043 | 32 | 711 | gene expression |
| GO:0000398 | 0.0029 | 2.2495 | 7.9918 | 17 | 264 | mRNA splicing, via spliceosome |
| GO:0009889 | 0.0031 | 1.3309 | 120.4831 | 147 | 3980 | regulation of biosynthetic process |
| GO:0000375 | 0.0034 | 2.213 | 8.1129 | 17 | 268 | RNA splicing, via transesterification reactions |
| GO:0034654 | 0.0034 | 1.3268 | 120.7555 | 147 | 3989 | nucleobase-containing compound biosynthetic process |
| GO:0008380 | 0.0034 | 3.4828 | 2.4945 | 8 | 84 | RNA splicing |
| GO:0031323 | 0.0035 | 1.2993 | 168.525 | 197 | 5567 | regulation of cellular metabolic process |
| GO:0016259 | 0.0039 | 3.4126 | 2.5429 | 8 | 84 | selenocysteine metabolic process |
| GO:2000036 | 0.0039 | 7.1706 | 0.666 | 4 | 22 | regulation of stem cell population maintenance |
| GO:0006415 | 0.0041 | 3.3804 | 2.5626 | 8 | 86 | translational termination |
| GO:0002181 | 0.0043 | 5.2111 | 1.0898 | 5 | 36 | cytoplasmic translation |
| GO:0003415 | 0.0053 | 32.1649 | 0.1211 | 2 | 4 | chondrocyte hypertrophy |
| GO:0097056 | 0.0053 | 32.1649 | 0.1211 | 2 | 4 | selenocysteinyl-tRNA(Sec) biosynthetic process |
| GO:0006352 | 0.0055 | 2.0488 | 9.233 | 18 | 305 | DNA-templated transcription, initiation |
| GO:0097659 | 0.0059 | 1.3161 | 105.5892 | 129 | 3488 | nucleic acid-templated transcription |
| GO:0051281 | 0.0061 | 4.7503 | 1.1806 | 5 | 39 | positive regulation of release of sequestered calcium ion into cytosol |
| GO:0051412 | 0.0063 | 6.145 | 0.7568 | 4 | 25 | response to corticosterone |
| GO:0080090 | 0.007 | 1.2708 | 166.1335 | 192 | 5488 | regulation of primary metabolic process |
| GO:0051188 | 0.0072 | 2.4988 | 4.6619 | 11 | 154 | cofactor biosynthetic process |
| GO:0050820 | 0.0073 | 5.8653 | 0.7871 | 4 | 26 | positive regulation of coagulation |
| GO:0031400 | 0.0074 | 1.6801 | 18.6779 | 30 | 617 | negative regulation of protein modification process |
| GO:0031365 | 0.0084 | 5.6099 | 0.8173 | 4 | 27 | N-terminal protein amino acid modification |
| GO:0006366 | 0.0084 | 1.3804 | 58.1528 | 76 | 1921 | transcription from RNA polymerase II promoter |
| GO:0042273 | 0.0084 | 4.3643 | 1.2714 | 5 | 42 | ribosomal large subunit biogenesis |
| GO:0003418 | 0.0086 | 21.4419 | 0.1514 | 2 | 5 | growth plate cartilage chondrocyte differentiation |
| GO:0003433 | 0.0086 | 21.4419 | 0.1514 | 2 | 5 | chondrocyte development involved in endochondral bone morphogenesis |
| GO:0009446 | 0.0086 | 21.4419 | 0.1514 | 2 | 5 | putrescine biosynthetic process |
| GO:0006414 | 0.0086 | 2.7282 | 3.5082 | 9 | 118 | translational elongation |
| GO:0044711 | 0.0089 | 1.3993 | 51.1902 | 68 | 1691 | single-organism biosynthetic process |
| GO:0051252 | 0.0091 | 1.2961 | 104.1664 | 126 | 3441 | regulation of RNA metabolic process |
| GO:2000112 | 0.0093 | 1.2888 | 110.796 | 133 | 3660 | regulation of cellular macromolecule biosynthetic process |
| GO:0042775 | 0.0094 | 3.592 | 1.8163 | 6 | 60 | mitochondrial ATP synthesis coupled electron transport |
| GO:0010468 | 0.0098 | 1.2781 | 121.3307 | 144 | 4008 | regulation of gene expression |
| GO:0006091 | 0.0098 | 1.7709 | 13.5619 | 23 | 448 | generation of precursor metabolites and energy |
| GO:0006612 | 0.0099 | 2.2803 | 5.5398 | 12 | 183 | protein targeting to membrane |
| GO:0072655 | 0.0099 | 2.2803 | 5.5398 | 12 | 183 | establishment of protein localization to mitochondrion |
| GOMFID | Pvalue | OddsRatio | ExpCount | Count | Size | Term |
| GO:0043241 | 0 | 3.2948 | 6.626 | 20 | 304 | protein complex disassembly |
| GO:0006415 | 1e-04 | 3.7749 | 3.7489 | 13 | 172 | translational termination |
| GO:0006414 | 1e-04 | 3.4421 | 4.4028 | 14 | 202 | translational elongation |
| GO:0072599 | 1e-04 | 4.5931 | 2.3976 | 10 | 110 | establishment of protein localization to endoplasmic reticulum |
| GO:0043043 | 3e-04 | 2.1844 | 13.7314 | 28 | 630 | peptide biosynthetic process |
| GO:0006614 | 4e-04 | 4.4336 | 2.2232 | 9 | 102 | SRP-dependent cotranslational protein targeting to membrane |
| GO:0033692 | 4e-04 | 5.7063 | 1.3731 | 7 | 63 | cellular polysaccharide biosynthetic process |
| GO:0006413 | 5e-04 | 2.8756 | 5.5798 | 15 | 256 | translational initiation |
| GO:0005978 | 7e-04 | 6.3563 | 1.068 | 6 | 49 | glycogen biosynthetic process |
| GO:0006612 | 7e-04 | 3.2276 | 3.9887 | 12 | 183 | protein targeting to membrane |
| GO:0045333 | 8e-04 | 3.1714 | 4.054 | 12 | 186 | cellular respiration |
| GO:0000184 | 9e-04 | 3.9238 | 2.4847 | 9 | 114 | nuclear-transcribed mRNA catabolic process, nonsense-mediated decay |
| GO:0032981 | 9e-04 | 5.9406 | 1.1334 | 6 | 52 | mitochondrial respiratory chain complex I assembly |
| GO:0006091 | 0.002 | 2.1654 | 9.7646 | 20 | 448 | generation of precursor metabolites and energy |
| GO:0043933 | 0.0022 | 1.4949 | 53.7706 | 74 | 2467 | macromolecular complex subunit organization |
| GO:0043086 | 0.0022 | 1.8297 | 17.9598 | 31 | 824 | negative regulation of catalytic activity |
| GO:0016259 | 0.0024 | 4.1444 | 1.8309 | 7 | 84 | selenocysteine metabolic process |
| GO:0016482 | 0.0025 | 1.6755 | 26.0461 | 41 | 1195 | cytoplasmic transport |
| GO:0002084 | 0.0028 | 45.1382 | 0.0872 | 2 | 4 | protein depalmitoylation |
| GO:0006990 | 0.0028 | 45.1382 | 0.0872 | 2 | 4 | positive regulation of transcription from RNA polymerase II promoter involved in unfolded protein response |
| GO:0008612 | 0.0028 | 45.1382 | 0.0872 | 2 | 4 | peptidyl-lysine modification to peptidyl-hypusine |
| GO:0061428 | 0.0028 | 45.1382 | 0.0872 | 2 | 4 | negative regulation of transcription from RNA polymerase II promoter in response to hypoxia |
| GO:0008284 | 0.0034 | 1.7911 | 17.6983 | 30 | 812 | positive regulation of cell proliferation |
| GO:2000785 | 0.0034 | 7.254 | 0.6321 | 4 | 29 | regulation of autophagosome assembly |
| GO:0007218 | 0.004 | 3.7523 | 2.0052 | 7 | 92 | neuropeptide signaling pathway |
| GO:0044267 | 0.0041 | 1.3627 | 104.8384 | 128 | 4810 | cellular protein metabolic process |
| GO:0042149 | 0.0044 | 6.7158 | 0.6757 | 4 | 31 | cellular response to glucose starvation |
| GO:0031398 | 0.0045 | 2.8237 | 3.7489 | 10 | 172 | positive regulation of protein ubiquitination |
| GO:0006402 | 0.0049 | 2.6374 | 4.4028 | 11 | 202 | mRNA catabolic process |
| GO:0006364 | 0.005 | 2.979 | 3.204 | 9 | 147 | rRNA processing |
| GO:0010564 | 0.0051 | 1.9469 | 11.3339 | 21 | 520 | regulation of cell cycle process |
| GO:0070423 | 0.0055 | 6.2518 | 0.7193 | 4 | 33 | nucleotide-binding oligomerization domain containing signaling pathway |
| GO:0036120 | 0.0056 | 9.6934 | 0.3705 | 3 | 17 | cellular response to platelet-derived growth factor stimulus |
| GO:2000241 | 0.0064 | 3.0916 | 2.7463 | 8 | 126 | regulation of reproductive process |
| GO:0010587 | 0.0067 | 22.5662 | 0.1308 | 2 | 6 | miRNA catabolic process |
| GO:1903071 | 0.0067 | 22.5662 | 0.1308 | 2 | 6 | positive regulation of ER-associated ubiquitin-dependent protein catabolic process |
| GO:0051302 | 0.0071 | 2.2932 | 5.9503 | 13 | 273 | regulation of cell division |
| GO:0006073 | 0.0071 | 3.7889 | 1.7001 | 6 | 78 | cellular glucan metabolic process |
| GO:0042594 | 0.0075 | 2.7759 | 3.422 | 9 | 157 | response to starvation |
| GO:0044085 | 0.0076 | 1.4115 | 54.7296 | 72 | 2511 | cellular component biogenesis |
| GO:0070987 | 0.0077 | 8.4806 | 0.4141 | 3 | 19 | error-free translesion synthesis |
| GO:0016311 | 0.0082 | 2.0063 | 8.8709 | 17 | 407 | dephosphorylation |
| GO:0022618 | 0.0083 | 2.5672 | 4.0976 | 10 | 188 | ribonucleoprotein complex assembly |
| GO:0005976 | 0.0085 | 3.2188 | 2.3104 | 7 | 106 | polysaccharide metabolic process |
| GO:0044321 | 0.0089 | 7.9813 | 0.4359 | 3 | 20 | response to leptin |
| GO:0051289 | 0.0091 | 4.2024 | 1.286 | 5 | 59 | protein homotetramerization |
| GO:0061469 | 0.0093 | 18.0518 | 0.1526 | 2 | 7 | regulation of type B pancreatic cell proliferation |
| GOMFID | Pvalue | OddsRatio | ExpCount | Count | Size | Term |
| GO:0043241 | 2e-04 | 2.9193 | 6.2579 | 17 | 304 | protein complex disassembly |
| GO:0006415 | 4e-04 | 5.0485 | 1.747 | 8 | 86 | translational termination |
| GO:0009593 | 4e-04 | 2.4449 | 9.1809 | 21 | 446 | detection of chemical stimulus |
| GO:2000870 | 4e-04 | Inf | 0.0412 | 2 | 2 | regulation of progesterone secretion |
| GO:0043043 | 6e-04 | 2.1399 | 12.9686 | 26 | 630 | peptide biosynthetic process |
| GO:0006414 | 7e-04 | 4.0697 | 2.3967 | 9 | 118 | translational elongation |
| GO:0009059 | 7e-04 | 1.4597 | 100.7638 | 128 | 4895 | macromolecule biosynthetic process |
| GO:0060392 | 0.0013 | 95.7445 | 0.0618 | 2 | 3 | negative regulation of SMAD protein import into nucleus |
| GO:0010467 | 0.0013 | 1.4304 | 103.0488 | 129 | 5006 | gene expression |
| GO:0007606 | 0.0014 | 2.2447 | 9.4485 | 20 | 459 | sensory perception of chemical stimulus |
| GO:0097028 | 0.0015 | 6.6964 | 0.844 | 5 | 41 | dendritic cell differentiation |
| GO:0050911 | 0.0015 | 2.3978 | 7.5135 | 17 | 365 | detection of chemical stimulus involved in sensory perception of smell |
| GO:0001553 | 0.0017 | 15.999 | 0.247 | 3 | 12 | luteinization |
| GO:0051205 | 0.0018 | 6.3431 | 0.8852 | 5 | 43 | protein insertion into membrane |
| GO:0035990 | 0.0025 | 47.8692 | 0.0823 | 2 | 4 | tendon cell differentiation |
| GO:0048597 | 0.0025 | 47.8692 | 0.0823 | 2 | 4 | post-embryonic camera-type eye morphogenesis |
| GO:1901976 | 0.0028 | 7.6955 | 0.597 | 4 | 29 | regulation of cell cycle checkpoint |
| GO:0050906 | 0.0032 | 2.1205 | 9.4485 | 19 | 459 | detection of stimulus involved in sensory perception |
| GO:0044271 | 0.0042 | 1.3779 | 93.8472 | 116 | 4559 | cellular nitrogen compound biosynthetic process |
| GO:0043603 | 0.0042 | 1.7457 | 18.7736 | 31 | 912 | cellular amide metabolic process |
| GO:0034694 | 0.0045 | 6.6324 | 0.6793 | 4 | 33 | response to prostaglandin |
| GO:0032434 | 0.0046 | 3.0092 | 3.1701 | 9 | 154 | regulation of proteasomal ubiquitin-dependent protein catabolic process |
| GO:0009226 | 0.0047 | 10.2817 | 0.3499 | 3 | 17 | nucleotide-sugar biosynthetic process |
| GO:0006614 | 0.0051 | 3.5613 | 2.0997 | 7 | 102 | SRP-dependent cotranslational protein targeting to membrane |
| GO:0048569 | 0.0056 | 9.5956 | 0.3705 | 3 | 18 | post-embryonic organ development |
| GO:0023035 | 0.006 | 23.9315 | 0.1235 | 2 | 6 | CD40 signaling pathway |
| GO:0035989 | 0.006 | 23.9315 | 0.1235 | 2 | 6 | tendon development |
| GO:0051029 | 0.006 | 23.9315 | 0.1235 | 2 | 6 | rRNA transport |
| GO:1903020 | 0.0066 | 8.9953 | 0.3911 | 3 | 19 | positive regulation of glycoprotein metabolic process |
| GO:2000514 | 0.0068 | 5.8269 | 0.7616 | 4 | 37 | regulation of CD4-positive, alpha-beta T cell activation |
| GO:0009058 | 0.0071 | 1.3304 | 122.1723 | 144 | 5935 | biosynthetic process |
| GO:0060393 | 0.0072 | 4.459 | 1.2145 | 5 | 59 | regulation of pathway-restricted SMAD protein phosphorylation |
| GO:0072599 | 0.0077 | 3.283 | 2.2644 | 7 | 110 | establishment of protein localization to endoplasmic reticulum |
| GO:0016259 | 0.0077 | 3.7103 | 1.7291 | 6 | 84 | selenocysteine metabolic process |
| GO:0060333 | 0.0077 | 3.7103 | 1.7291 | 6 | 84 | interferon-gamma-mediated signaling pathway |
| GO:0070124 | 0.0077 | 3.7103 | 1.7291 | 6 | 84 | mitochondrial translational initiation |
| GO:0070125 | 0.0077 | 3.7103 | 1.7291 | 6 | 84 | mitochondrial translational elongation |
| GO:0070126 | 0.0086 | 3.617 | 1.7703 | 6 | 86 | mitochondrial translational termination |
| GO:0000027 | 0.0087 | 7.9948 | 0.4323 | 3 | 21 | ribosomal large subunit assembly |
| GO:0030488 | 0.0087 | 7.9948 | 0.4323 | 3 | 21 | tRNA methylation |
| GO:0035929 | 0.0087 | 7.9948 | 0.4323 | 3 | 21 | steroid hormone secretion |
| GO:0046545 | 0.0088 | 3.1895 | 2.3261 | 7 | 113 | development of primary female sexual characteristics |
| GO:0008284 | 0.0098 | 1.6945 | 16.7151 | 27 | 812 | positive regulation of cell proliferation |
| GOMFID | Pvalue | OddsRatio | ExpCount | Count | Size | Term |
| GO:0043043 | 1e-04 | 2.6564 | 8.5922 | 21 | 630 | peptide biosynthetic process |
| GO:0006415 | 6e-04 | 4.1247 | 2.3458 | 9 | 172 | translational termination |
| GO:0072599 | 8e-04 | 5.0475 | 1.5002 | 7 | 110 | establishment of protein localization to endoplasmic reticulum |
| GO:0006413 | 8e-04 | 3.3689 | 3.4914 | 11 | 256 | translational initiation |
| GO:0043241 | 0.001 | 3.0893 | 4.1461 | 12 | 304 | protein complex disassembly |
| GO:0016259 | 0.001 | 5.6949 | 1.1456 | 6 | 84 | selenocysteine metabolic process |
| GO:0006414 | 0.0011 | 4.7725 | 1.5802 | 7 | 118 | translational elongation |
| GO:1902410 | 0.0011 | 72.9953 | 0.0546 | 2 | 4 | mitotic cytokinetic process |
| GO:0034551 | 0.0027 | 36.4929 | 0.0818 | 2 | 6 | mitochondrial respiratory chain complex III assembly |
| GO:0097527 | 0.0027 | 36.4929 | 0.0818 | 2 | 6 | necroptotic signaling pathway |
| GO:0006614 | 0.0027 | 4.6217 | 1.3911 | 6 | 102 | SRP-dependent cotranslational protein targeting to membrane |
| GO:0006352 | 0.0032 | 2.7984 | 4.1597 | 11 | 305 | DNA-templated transcription, initiation |
| GO:0006356 | 0.0032 | 11.5675 | 0.3 | 3 | 22 | regulation of transcription from RNA polymerase I promoter |
| GO:0043603 | 0.0033 | 1.976 | 12.4382 | 23 | 912 | cellular amide metabolic process |
| GO:0017004 | 0.0036 | 10.9884 | 0.3137 | 3 | 23 | cytochrome complex assembly |
| GO:0000184 | 0.0047 | 4.105 | 1.5548 | 6 | 114 | nuclear-transcribed mRNA catabolic process, nonsense-mediated decay |
| GO:0019080 | 0.0057 | 3.1413 | 2.6868 | 8 | 197 | viral gene expression |
| GO:0070125 | 0.0058 | 4.663 | 1.1456 | 5 | 84 | mitochondrial translational elongation |
| GO:0002679 | 0.0063 | 20.8491 | 0.1227 | 2 | 9 | respiratory burst involved in defense response |
| GO:0009133 | 0.0063 | 20.8491 | 0.1227 | 2 | 9 | nucleoside diphosphate biosynthetic process |
| GO:1901844 | 0.0063 | 20.8491 | 0.1227 | 2 | 9 | regulation of cell communication by electrical coupling involved in cardiac conduction |
| GO:0016071 | 0.007 | 2.1019 | 8.033 | 16 | 589 | mRNA metabolic process |
| GO:0031987 | 0.0078 | 18.2417 | 0.1364 | 2 | 10 | locomotion involved in locomotory behavior |
| GO:0009593 | 0.0083 | 2.2471 | 6.0827 | 13 | 446 | detection of chemical stimulus |
| GO:0000910 | 0.0088 | 3.5716 | 1.773 | 6 | 130 | cytokinesis |
| GO:0007589 | 0.0093 | 4.1363 | 1.282 | 5 | 94 | body fluid secretion |
| GO:0000302 | 0.0097 | 2.8508 | 2.9459 | 8 | 216 | response to reactive oxygen species |
| GOMFID | Pvalue | OddsRatio | ExpCount | Count | Size | Term |
| GO:0009593 | 0 | 4.4103 | 4.6047 | 18 | 446 | detection of chemical stimulus |
| GO:0050911 | 0 | 4.7667 | 3.7684 | 16 | 365 | detection of chemical stimulus involved in sensory perception of smell |
| GO:0007606 | 0 | 4.2766 | 4.7389 | 18 | 459 | sensory perception of chemical stimulus |
| GO:0050906 | 0 | 4.2766 | 4.7389 | 18 | 459 | detection of stimulus involved in sensory perception |
| GO:0007186 | 1e-04 | 2.5534 | 11.9247 | 27 | 1155 | G-protein coupled receptor signaling pathway |
| GO:0031146 | 0.0016 | 14.6311 | 0.2375 | 3 | 23 | SCF-dependent proteasomal ubiquitin-dependent protein catabolic process |
| GO:0006513 | 0.0017 | 8.5212 | 0.5162 | 4 | 50 | protein monoubiquitination |
| GO:0050877 | 0.0032 | 2.0011 | 12.4822 | 23 | 1209 | neurological system process |
| GO:0006364 | 0.0042 | 4.1975 | 1.5177 | 6 | 147 | rRNA processing |
| GO:0042118 | 0.0045 | 24.2516 | 0.1032 | 2 | 10 | endothelial cell activation |
| GO:0036498 | 0.0045 | 6.4196 | 0.6711 | 4 | 65 | IRE1-mediated unfolded protein response |
| GO:0043620 | 0.0045 | 6.4196 | 0.6711 | 4 | 65 | regulation of DNA-templated transcription in response to stress |
| GO:0015701 | 0.0075 | 8.12 | 0.4027 | 3 | 39 | bicarbonate transport |
| GO:0006986 | 0.0076 | 3.6945 | 1.7138 | 6 | 166 | response to unfolded protein |
| GO:0045116 | 0.0077 | 17.6341 | 0.1342 | 2 | 13 | protein neddylation |
| GO:0051770 | 0.0077 | 17.6341 | 0.1342 | 2 | 13 | positive regulation of nitric-oxide synthase biosynthetic process |
| GO:2001212 | 0.0077 | 17.6341 | 0.1342 | 2 | 13 | regulation of vasculogenesis |
| GO:0035924 | 0.0081 | 7.9001 | 0.413 | 3 | 40 | cellular response to vascular endothelial growth factor stimulus |
| GO:0090382 | 0.0089 | 16.1635 | 0.1445 | 2 | 14 | phagosome maturation |
| GO:0051028 | 0.009 | 4.1593 | 1.2699 | 5 | 123 | mRNA transport |
| GO:0034248 | 0.009 | 2.6926 | 3.5206 | 9 | 341 | regulation of cellular amide metabolic process |
| GO:0032570 | 0.0092 | 7.494 | 0.4336 | 3 | 42 | response to progesterone |
| GOMFID | Pvalue | OddsRatio | ExpCount | Count | Size | Term |
| GO:0050911 | 0 | 4.5703 | 4.4197 | 18 | 365 | detection of chemical stimulus involved in sensory perception of smell |
| GO:0009593 | 0 | 4.1632 | 5.4005 | 20 | 446 | detection of chemical stimulus |
| GO:0007606 | 0 | 4.0364 | 5.558 | 20 | 459 | sensory perception of chemical stimulus |
| GO:0050906 | 0 | 4.0364 | 5.558 | 20 | 459 | detection of stimulus involved in sensory perception |
| GO:0006452 | 4e-04 | 164.8936 | 0.0363 | 2 | 3 | translational frameshifting |
| GO:0045905 | 4e-04 | 164.8936 | 0.0363 | 2 | 3 | positive regulation of translational termination |
| GO:0007186 | 7e-04 | 2.1106 | 13.9857 | 27 | 1155 | G-protein coupled receptor signaling pathway |
| GO:0045901 | 9e-04 | 82.4415 | 0.0484 | 2 | 4 | positive regulation of translational elongation |
| GO:0015931 | 0.0015 | 3.9406 | 2.1675 | 8 | 179 | nucleobase-containing compound transport |
| GO:0006403 | 0.0016 | 3.8946 | 2.1917 | 8 | 181 | RNA localization |
| GO:0050658 | 0.0023 | 4.1373 | 1.8042 | 7 | 149 | RNA transport |
| GO:0050877 | 0.003 | 1.9188 | 14.6396 | 26 | 1209 | neurological system process |
| GO:0032329 | 0.005 | 23.5471 | 0.109 | 2 | 9 | serine transport |
| GO:0006397 | 0.0053 | 2.4876 | 5.0978 | 12 | 421 | mRNA processing |
| GO:0060135 | 0.0064 | 5.8268 | 0.7386 | 4 | 61 | maternal process involved in female pregnancy |
| GO:0006412 | 0.007 | 2.1624 | 7.338 | 15 | 606 | translation |
| GOMFID | Pvalue | OddsRatio | ExpCount | Count | Size | Term |
| GO:0007218 | 1e-04 | 5.0961 | 1.9583 | 9 | 92 | neuropeptide signaling pathway |
| GO:0043144 | 2e-04 | 46.3867 | 0.1277 | 3 | 6 | snoRNA processing |
| GO:0043628 | 5e-04 | 13.284 | 0.3831 | 4 | 18 | ncRNA 3'-end processing |
| GO:0006414 | 0.0013 | 2.9749 | 4.2998 | 12 | 202 | translational elongation |
| GO:0002583 | 0.0018 | 15.4562 | 0.2554 | 3 | 12 | regulation of antigen processing and presentation of peptide antigen |
| GO:0002317 | 0.0026 | 46.25 | 0.0851 | 2 | 4 | plasma cell differentiation |
| GO:0006990 | 0.0026 | 46.25 | 0.0851 | 2 | 4 | positive regulation of transcription from RNA polymerase II promoter involved in unfolded protein response |
| GO:0042701 | 0.0026 | 46.25 | 0.0851 | 2 | 4 | progesterone secretion |
| GO:0032651 | 0.0034 | 5.4125 | 1.0217 | 5 | 48 | regulation of interleukin-1 beta production |
| GO:0043534 | 0.0035 | 4.4408 | 1.4687 | 6 | 69 | blood vessel endothelial cell migration |
| GO:0006415 | 0.0038 | 2.8949 | 3.6612 | 10 | 172 | translational termination |
| GO:0050713 | 0.0043 | 30.8313 | 0.1064 | 2 | 5 | negative regulation of interleukin-1 beta secretion |
| GO:0071051 | 0.0043 | 30.8313 | 0.1064 | 2 | 5 | polyadenylation-dependent snoRNA 3'-end processing |
| GO:0044270 | 0.0046 | 2.0871 | 9.0679 | 18 | 426 | cellular nitrogen compound catabolic process |
| GO:0044788 | 0.0062 | 9.2701 | 0.3831 | 3 | 18 | modulation by host of viral process |
| GO:0009249 | 0.0064 | 23.122 | 0.1277 | 2 | 6 | protein lipoylation |
| GO:0033211 | 0.0064 | 23.122 | 0.1277 | 2 | 6 | adiponectin-activated signaling pathway |
| GO:0022407 | 0.0071 | 2.0901 | 8.0249 | 16 | 377 | regulation of cell-cell adhesion |
| GO:0051048 | 0.0074 | 2.6171 | 4.0231 | 10 | 189 | negative regulation of secretion |
| GO:0042254 | 0.0079 | 2.4564 | 4.7042 | 11 | 221 | ribosome biogenesis |
| GO:0030300 | 0.0088 | 18.4964 | 0.149 | 2 | 7 | regulation of intestinal cholesterol absorption |
| GO:0034115 | 0.0088 | 18.4964 | 0.149 | 2 | 7 | negative regulation of heterotypic cell-cell adhesion |
| GO:0002687 | 0.0091 | 3.1703 | 2.3415 | 7 | 110 | positive regulation of leukocyte migration |
| GOMFID | Pvalue | OddsRatio | ExpCount | Count | Size | Term |
| GO:0006614 | 0 | 6.0778 | 2.0477 | 11 | 102 | SRP-dependent cotranslational protein targeting to membrane |
| GO:0016259 | 0 | 6.7798 | 1.6863 | 10 | 84 | selenocysteine metabolic process |
| GO:0072599 | 0 | 5.5837 | 2.2083 | 11 | 110 | establishment of protein localization to endoplasmic reticulum |
| GO:0042776 | 0 | 20.6505 | 0.3413 | 5 | 17 | mitochondrial ATP synthesis coupled proton transport |
| GO:0022904 | 0 | 5.0217 | 2.4291 | 11 | 121 | respiratory electron transport chain |
| GO:1901360 | 1e-04 | 1.5677 | 114.4487 | 148 | 5701 | organic cyclic compound metabolic process |
| GO:0046483 | 1e-04 | 1.5684 | 109.8114 | 143 | 5470 | heterocycle metabolic process |
| GO:0015985 | 1e-04 | 13.7616 | 0.4617 | 5 | 23 | energy coupled proton transport, down electrochemical gradient |
| GO:0006612 | 1e-04 | 3.8504 | 3.6738 | 13 | 183 | protein targeting to membrane |
| GO:0034641 | 1e-04 | 1.5454 | 123.0008 | 156 | 6127 | cellular nitrogen compound metabolic process |
| GO:0000184 | 1e-04 | 4.8146 | 2.2886 | 10 | 114 | nuclear-transcribed mRNA catabolic process, nonsense-mediated decay |
| GO:0051788 | 1e-04 | 19.7633 | 0.2811 | 4 | 14 | response to misfolded protein |
| GO:0015980 | 1e-04 | 2.8049 | 7.2873 | 19 | 363 | energy derivation by oxidation of organic compounds |
| GO:0034654 | 2e-04 | 1.5677 | 80.08 | 109 | 3989 | nucleobase-containing compound biosynthetic process |
| GO:0006725 | 2e-04 | 1.5335 | 98.7148 | 128 | 5054 | cellular aromatic compound metabolic process |
| GO:0006402 | 2e-04 | 3.459 | 4.0552 | 13 | 202 | mRNA catabolic process |
| GO:0019083 | 4e-04 | 3.4601 | 3.734 | 12 | 186 | viral transcription |
| GO:0015992 | 4e-04 | 3.9683 | 2.7302 | 10 | 136 | proton transport |
| GO:0031943 | 6e-04 | 24.6314 | 0.1807 | 3 | 9 | regulation of glucocorticoid metabolic process |
| GO:0006415 | 7e-04 | 3.4195 | 3.4529 | 11 | 172 | translational termination |
| GO:0006414 | 8e-04 | 3.1654 | 4.0552 | 12 | 202 | translational elongation |
| GO:1901576 | 0.001 | 1.4893 | 86.451 | 111 | 4533 | organic substance biosynthetic process |
| GO:0044033 | 0.001 | 3.0832 | 4.1556 | 12 | 207 | multi-organism metabolic process |
| GO:0002541 | 0.0012 | 98.2428 | 0.0602 | 2 | 3 | activation of plasma proteins involved in acute inflammatory response |
| GO:0006754 | 0.0013 | 6.8728 | 0.8231 | 5 | 41 | ATP biosynthetic process |
| GO:0019058 | 0.0013 | 2.3027 | 8.7528 | 19 | 436 | viral life cycle |
| GO:0000083 | 0.0014 | 9.4044 | 0.5019 | 4 | 25 | regulation of transcription involved in G1/S transition of mitotic cell cycle |
| GO:0009127 | 0.0018 | 5.1282 | 1.2848 | 6 | 64 | purine nucleoside monophosphate biosynthetic process |
| GO:0055114 | 0.0022 | 2.0005 | 12.726 | 24 | 659 | oxidation-reduction process |
| GO:1901659 | 0.0026 | 3.6165 | 2.3689 | 8 | 118 | glycosyl compound biosynthetic process |
| GO:0016070 | 0.0029 | 1.4109 | 85.5003 | 108 | 4259 | RNA metabolic process |
| GO:0034645 | 0.0034 | 1.4023 | 88.891 | 111 | 4544 | cellular macromolecule biosynthetic process |
| GO:0009145 | 0.0035 | 5.3752 | 1.0238 | 5 | 51 | purine nucleoside triphosphate biosynthetic process |
| GO:1901566 | 0.0035 | 1.6437 | 26.5796 | 41 | 1324 | organonitrogen compound biosynthetic process |
| GO:2001199 | 0.0039 | 32.7433 | 0.1004 | 2 | 5 | negative regulation of dendritic cell differentiation |
| GO:0009156 | 0.0039 | 4.3076 | 1.5056 | 6 | 75 | ribonucleoside monophosphate biosynthetic process |
| GO:0051188 | 0.0039 | 3.0895 | 3.0916 | 9 | 154 | cofactor biosynthetic process |
| GO:0010467 | 0.004 | 1.3766 | 100.4965 | 123 | 5006 | gene expression |
| GO:0044238 | 0.0042 | 1.3866 | 195.2715 | 218 | 9727 | primary metabolic process |
| GO:2001244 | 0.0045 | 5.0451 | 1.0841 | 5 | 54 | positive regulation of intrinsic apoptotic signaling pathway |
| GO:0044281 | 0.0047 | 1.4613 | 51.0914 | 69 | 2545 | small molecule metabolic process |
| GO:0044764 | 0.0047 | 1.803 | 15.7992 | 27 | 787 | multi-organism cellular process |
| GO:0009201 | 0.0048 | 4.9439 | 1.1041 | 5 | 55 | ribonucleoside triphosphate biosynthetic process |
| GO:0000042 | 0.0052 | 9.8468 | 0.3614 | 3 | 18 | protein targeting to Golgi |
| GO:0006413 | 0.0057 | 2.4561 | 5.1393 | 12 | 256 | translational initiation |
| GO:0006489 | 0.0057 | 24.5559 | 0.1205 | 2 | 6 | dolichyl diphosphate biosynthetic process |
| GO:0019348 | 0.0057 | 24.5559 | 0.1205 | 2 | 6 | dolichol metabolic process |
| GO:0006974 | 0.0065 | 1.7768 | 15.3977 | 26 | 767 | cellular response to DNA damage stimulus |
| GO:0016575 | 0.0065 | 4.5765 | 1.1844 | 5 | 59 | histone deacetylation |
| GO:0019439 | 0.0069 | 2.0464 | 8.7126 | 17 | 434 | aromatic compound catabolic process |
| GO:0044403 | 0.0071 | 1.7426 | 16.3011 | 27 | 812 | symbiosis, encompassing mutualism through parasitism |
| GO:1901605 | 0.0076 | 2.1954 | 6.685 | 14 | 333 | alpha-amino acid metabolic process |
| GO:0006782 | 0.0079 | 19.6435 | 0.1405 | 2 | 7 | protoporphyrinogen IX biosynthetic process |
| GO:0090394 | 0.0079 | 19.6435 | 0.1405 | 2 | 7 | negative regulation of excitatory postsynaptic potential |
| GO:0044265 | 0.008 | 1.6907 | 18.0476 | 29 | 899 | cellular macromolecule catabolic process |
| GO:0000132 | 0.0082 | 8.2041 | 0.4216 | 3 | 21 | establishment of mitotic spindle orientation |
| GO:0018345 | 0.0082 | 8.2041 | 0.4216 | 3 | 21 | protein palmitoylation |
| GO:0003002 | 0.0084 | 2.1676 | 6.7653 | 14 | 337 | regionalization |
| GO:0043241 | 0.0087 | 2.2315 | 6.1029 | 13 | 304 | protein complex disassembly |
| GO:0035268 | 0.0093 | 7.7718 | 0.4417 | 3 | 22 | protein mannosylation |
| GO:0042451 | 0.0095 | 3.5349 | 1.8068 | 6 | 90 | purine nucleoside biosynthetic process |
| GOMFID | Pvalue | OddsRatio | ExpCount | Count | Size | Term |
| GO:0000042 | 0 | 19.51 | 0.3533 | 5 | 18 | protein targeting to Golgi |
| GO:1902268 | 0.0011 | 100.5359 | 0.0589 | 2 | 3 | negative regulation of polyamine transmembrane transport |
| GO:0019083 | 0.0011 | 3.2186 | 3.651 | 11 | 186 | viral transcription |
| GO:0016071 | 0.0014 | 2.1126 | 11.5615 | 23 | 589 | mRNA metabolic process |
| GO:0006598 | 0.0022 | 50.2647 | 0.0785 | 2 | 4 | polyamine catabolic process |
| GO:0031064 | 0.0022 | 50.2647 | 0.0785 | 2 | 4 | negative regulation of histone deacetylation |
| GO:0044033 | 0.0027 | 2.8698 | 4.0632 | 11 | 207 | multi-organism metabolic process |
| GO:0000301 | 0.0036 | 34.0354 | 0.0967 | 2 | 5 | retrograde transport, vesicle recycling within Golgi |
| GO:0098732 | 0.0038 | 4.3462 | 1.4918 | 6 | 76 | macromolecule deacylation |
| GO:0006614 | 0.004 | 3.7425 | 2.0022 | 7 | 102 | SRP-dependent cotranslational protein targeting to membrane |
| GO:1990542 | 0.0051 | 4.8651 | 1.1189 | 5 | 57 | mitochondrial transmembrane transport |
| GO:0008216 | 0.0055 | 25.1291 | 0.1178 | 2 | 6 | spermidine metabolic process |
| GO:0015846 | 0.0055 | 25.1291 | 0.1178 | 2 | 6 | polyamine transport |
| GO:0019058 | 0.0058 | 2.0864 | 8.5583 | 17 | 436 | viral life cycle |
| GO:0072599 | 0.006 | 3.45 | 2.1592 | 7 | 110 | establishment of protein localization to endoplasmic reticulum |
| GO:0000398 | 0.0061 | 2.4342 | 5.1821 | 12 | 264 | mRNA splicing, via spliceosome |
| GO:0016259 | 0.0062 | 3.8984 | 1.6488 | 6 | 84 | selenocysteine metabolic process |
| GO:0000375 | 0.0068 | 2.3955 | 5.2606 | 12 | 268 | RNA splicing, via transesterification reactions |
| GO:0000184 | 0.0072 | 3.3201 | 2.2377 | 7 | 114 | nuclear-transcribed mRNA catabolic process, nonsense-mediated decay |
| GO:0060406 | 0.0076 | 20.102 | 0.1374 | 2 | 7 | positive regulation of penile erection |
| GO:0060455 | 0.0076 | 20.102 | 0.1374 | 2 | 7 | negative regulation of gastric acid secretion |
| GO:0034622 | 0.0078 | 1.7287 | 16.4295 | 27 | 837 | cellular macromolecular complex assembly |
| GO:0034728 | 0.0079 | 2.9676 | 2.8462 | 8 | 145 | nucleosome organization |
| GO:0044272 | 0.0081 | 2.5736 | 4.0829 | 10 | 208 | sulfur compound biosynthetic process |
| GO:0007005 | 0.0086 | 1.7753 | 14.1918 | 24 | 723 | mitochondrion organization |
| GO:0048263 | 0.0099 | 16.7505 | 0.157 | 2 | 8 | determination of dorsal identity |
| GO:0060452 | 0.0099 | 16.7505 | 0.157 | 2 | 8 | positive regulation of cardiac muscle contraction |
| GO:0090037 | 0.0099 | 16.7505 | 0.157 | 2 | 8 | positive regulation of protein kinase C signaling |
| GO:1904851 | 0.0099 | 16.7505 | 0.157 | 2 | 8 | positive regulation of establishment of protein localization to telomere |
| GO:1904871 | 0.0099 | 16.7505 | 0.157 | 2 | 8 | positive regulation of protein localization to Cajal body |
| GOMFID | Pvalue | OddsRatio | ExpCount | Count | Size | Term |
| GO:0003735 | 2e-04 | 3.522 | 3.9892 | 13 | 195 | structural constituent of ribosome |
| GO:0044822 | 2e-04 | 1.9313 | 22.9942 | 41 | 1124 | poly(A) RNA binding |
| GO:0016884 | 0.0012 | 18.1152 | 0.225 | 3 | 11 | carbon-nitrogen ligase activity, with glutamine as amido-N-donor |
| GO:0030492 | 0.004 | 32.1146 | 0.1023 | 2 | 5 | hemoglobin binding |
| GO:0008171 | 0.0047 | 10.3475 | 0.3478 | 3 | 17 | O-methyltransferase activity |
| GO:0030371 | 0.0064 | 9.0529 | 0.3887 | 3 | 19 | translation repressor activity |
| GOMFID | Pvalue | OddsRatio | ExpCount | Count | Size | Term |
| GO:0004984 | 0 | 5.3937 | 3.5943 | 17 | 365 | olfactory receptor activity |
| GO:0004930 | 0 | 3.4321 | 7.6417 | 23 | 776 | G-protein coupled receptor activity |
| GO:0099600 | 1e-04 | 2.4492 | 11.9253 | 26 | 1211 | transmembrane receptor activity |
| GO:0038023 | 3e-04 | 2.3357 | 12.4473 | 26 | 1264 | signaling receptor activity |
| GO:0004556 | 9e-04 | 67.8954 | 0.0492 | 2 | 5 | alpha-amylase activity |
| GO:0060089 | 0.0015 | 2.0209 | 14.7713 | 27 | 1500 | molecular transducer activity |
| GO:0003735 | 0.0032 | 3.8736 | 1.9203 | 7 | 195 | structural constituent of ribosome |
| GO:0001054 | 0.006 | 20.3595 | 0.1182 | 2 | 12 | RNA polymerase I activity |
| GO:0005344 | 0.0081 | 16.9641 | 0.1379 | 2 | 14 | oxygen transporter activity |
| GO:0019956 | 0.0081 | 16.9641 | 0.1379 | 2 | 14 | chemokine binding |
| GO:0004574 | 0.0098 | Inf | 0.0098 | 1 | 1 | oligo-1,6-glucosidase activity |
| GO:0004575 | 0.0098 | Inf | 0.0098 | 1 | 1 | sucrose alpha-glucosidase activity |
| GO:0004584 | 0.0098 | Inf | 0.0098 | 1 | 1 | dolichyl-phosphate-mannose-glycolipid alpha-mannosyltransferase activity |
| GO:0008460 | 0.0098 | Inf | 0.0098 | 1 | 1 | dTDP-glucose 4,6-dehydratase activity |
| GO:0030549 | 0.0098 | Inf | 0.0098 | 1 | 1 | acetylcholine receptor activator activity |
| GO:0031857 | 0.0098 | Inf | 0.0098 | 1 | 1 | type 1 parathyroid hormone receptor binding |
| GOMFID | Pvalue | OddsRatio | ExpCount | Count | Size | Term |
| GO:0004984 | 0 | 6.6672 | 2.8059 | 16 | 365 | olfactory receptor activity |
| GO:0004930 | 0 | 3.8931 | 5.9654 | 20 | 776 | G-protein coupled receptor activity |
| GO:0048020 | 1e-04 | 17.1911 | 0.2691 | 4 | 35 | CCR chemokine receptor binding |
| GO:0008009 | 5e-04 | 12.1018 | 0.369 | 4 | 48 | chemokine activity |
| GO:0003735 | 8e-04 | 5.04 | 1.499 | 7 | 195 | structural constituent of ribosome |
| GO:0099600 | 9e-04 | 2.3988 | 9.3095 | 20 | 1211 | transmembrane receptor activity |
| GO:0038023 | 0.0015 | 2.2882 | 9.7169 | 20 | 1264 | signaling receptor activity |
| GO:0001664 | 0.0032 | 3.8854 | 1.9219 | 7 | 250 | G-protein coupled receptor binding |
| GO:0005549 | 0.0038 | 6.7251 | 0.6381 | 4 | 83 | odorant binding |
| GO:0060089 | 0.0049 | 2.0077 | 11.5311 | 21 | 1500 | molecular transducer activity |
| GO:0019843 | 0.0063 | 8.607 | 0.3767 | 3 | 49 | rRNA binding |
| GO:0000215 | 0.0077 | Inf | 0.0077 | 1 | 1 | tRNA 2'-phosphotransferase activity |
| GO:0004310 | 0.0077 | Inf | 0.0077 | 1 | 1 | farnesyl-diphosphate farnesyltransferase activity |
| GO:0005459 | 0.0077 | Inf | 0.0077 | 1 | 1 | UDP-galactose transmembrane transporter activity |
| GO:0008995 | 0.0077 | Inf | 0.0077 | 1 | 1 | ribonuclease E activity |
| GO:0031771 | 0.0077 | Inf | 0.0077 | 1 | 1 | type 1 hypocretin receptor binding |
| GO:0031772 | 0.0077 | Inf | 0.0077 | 1 | 1 | type 2 hypocretin receptor binding |
| GO:0031851 | 0.0077 | Inf | 0.0077 | 1 | 1 | kappa-type opioid receptor binding |
| GO:0032003 | 0.0077 | Inf | 0.0077 | 1 | 1 | interleukin-28 receptor binding |
| GO:0043136 | 0.0077 | Inf | 0.0077 | 1 | 1 | glycerol-3-phosphatase activity |
| GO:0051996 | 0.0077 | Inf | 0.0077 | 1 | 1 | squalene synthase activity |
| GO:0070320 | 0.0077 | Inf | 0.0077 | 1 | 1 | inward rectifier potassium channel inhibitor activity |
| GOMFID | Pvalue | OddsRatio | ExpCount | Count | Size | Term |
| GO:0005184 | 5e-04 | 12.4602 | 0.3799 | 4 | 26 | neuropeptide hormone activity |
| GO:0016453 | 0.0013 | 68.0175 | 0.0584 | 2 | 4 | C-acetyltransferase activity |
| GO:0034597 | 0.0013 | 68.0175 | 0.0584 | 2 | 4 | phosphatidylinositol-4,5-bisphosphate 4-phosphatase activity |
| GO:0008508 | 0.0021 | 45.3421 | 0.0731 | 2 | 5 | bile acid:sodium symporter activity |
| GO:0008312 | 0.0043 | 27.2018 | 0.1023 | 2 | 7 | 7S RNA binding |
| GO:0004540 | 0.0074 | 4.3966 | 1.2128 | 5 | 83 | ribonuclease activity |
| GO:0004984 | 0.0076 | 2.3635 | 5.3335 | 12 | 365 | olfactory receptor activity |
| GOMFID | Pvalue | OddsRatio | ExpCount | Count | Size | Term |
| GO:0004984 | 0 | 4.5508 | 2.9219 | 12 | 365 | olfactory receptor activity |
| GO:0004930 | 0 | 3.2665 | 6.2119 | 18 | 776 | G-protein coupled receptor activity |
| GO:0099600 | 0.0035 | 2.1484 | 9.6942 | 19 | 1211 | transmembrane receptor activity |
| GO:0005549 | 0.0044 | 6.4474 | 0.6644 | 4 | 83 | odorant binding |
| GO:0038023 | 0.0056 | 2.0494 | 10.1184 | 19 | 1264 | signaling receptor activity |
| GO:0016667 | 0.0071 | 8.2545 | 0.3922 | 3 | 49 | oxidoreductase activity, acting on a sulfur group of donors |
| GO:0004475 | 0.008 | Inf | 0.008 | 1 | 1 | mannose-1-phosphate guanylyltransferase activity |
| GO:0004799 | 0.008 | Inf | 0.008 | 1 | 1 | thymidylate synthase activity |
| GO:0005459 | 0.008 | Inf | 0.008 | 1 | 1 | UDP-galactose transmembrane transporter activity |
| GO:0008962 | 0.008 | Inf | 0.008 | 1 | 1 | phosphatidylglycerophosphatase activity |
| GO:0016807 | 0.008 | Inf | 0.008 | 1 | 1 | cysteine-type carboxypeptidase activity |
| GO:0030735 | 0.008 | Inf | 0.008 | 1 | 1 | carnosine N-methyltransferase activity |
| GO:0031686 | 0.008 | Inf | 0.008 | 1 | 1 | A1 adenosine receptor binding |
| GO:0031851 | 0.008 | Inf | 0.008 | 1 | 1 | kappa-type opioid receptor binding |
| GO:0032003 | 0.008 | Inf | 0.008 | 1 | 1 | interleukin-28 receptor binding |
| GO:0033737 | 0.008 | Inf | 0.008 | 1 | 1 | 1-pyrroline dehydrogenase activity |
| GO:0045032 | 0.008 | Inf | 0.008 | 1 | 1 | ADP-activated adenosine receptor activity |
| GO:0070191 | 0.008 | Inf | 0.008 | 1 | 1 | methionine-R-sulfoxide reductase activity |
| GOMFID | Pvalue | OddsRatio | ExpCount | Count | Size | Term |
| GO:0004984 | 0 | 4.6396 | 4.3596 | 18 | 365 | olfactory receptor activity |
| GO:0008009 | 3e-04 | 9.8545 | 0.5733 | 5 | 48 | chemokine activity |
| GO:0001205 | 3e-04 | 14.6777 | 0.3225 | 4 | 27 | transcriptional activator activity, RNA polymerase II distal enhancer sequence-specific binding |
| GO:0004792 | 4e-04 | 167.2151 | 0.0358 | 2 | 3 | thiosulfate sulfurtransferase activity |
| GO:0004930 | 0.001 | 2.3299 | 9.2686 | 20 | 776 | G-protein coupled receptor activity |
| GO:0031726 | 0.0021 | 41.7957 | 0.0717 | 2 | 6 | CCR1 chemokine receptor binding |
| GO:0031730 | 0.0021 | 41.7957 | 0.0717 | 2 | 6 | CCR5 chemokine receptor binding |
| GO:0038023 | 0.0022 | 1.9407 | 15.0973 | 27 | 1264 | signaling receptor activity |
| GO:0099600 | 0.0025 | 1.9458 | 14.4643 | 26 | 1211 | transmembrane receptor activity |
| GO:0031072 | 0.0033 | 5.3514 | 1.0033 | 5 | 84 | heat shock protein binding |
| GO:0005184 | 0.0036 | 10.9488 | 0.3105 | 3 | 26 | neuropeptide hormone activity |
| GO:0005126 | 0.0047 | 2.9923 | 3.1771 | 9 | 266 | cytokine receptor binding |
| GO:0003735 | 0.009 | 3.1606 | 2.3291 | 7 | 195 | structural constituent of ribosome |
| GOMFID | Pvalue | OddsRatio | ExpCount | Count | Size | Term |
| GO:0035870 | 8e-04 | Inf | 0.0554 | 2 | 2 | dITP diphosphatase activity |
| GO:0070259 | 8e-04 | Inf | 0.0554 | 2 | 2 | tyrosyl-DNA phosphodiesterase activity |
| GO:0003735 | 0.0011 | 2.7719 | 5.4015 | 14 | 195 | structural constituent of ribosome |
| GO:0017070 | 0.0022 | 15.1405 | 0.277 | 3 | 10 | U6 snRNA binding |
| GO:0030614 | 0.0023 | 70.5207 | 0.0831 | 2 | 3 | oxidoreductase activity, acting on phosphorus or arsenic in donors, disulfide as acceptor |
| GO:0034513 | 0.0023 | 70.5207 | 0.0831 | 2 | 3 | box H/ACA snoRNA binding |
| GO:0044822 | 0.003 | 1.596 | 31.1349 | 47 | 1124 | poly(A) RNA binding |
| GO:0070051 | 0.0044 | 35.2581 | 0.1108 | 2 | 4 | fibrinogen binding |
| GO:0070034 | 0.0049 | 10.5963 | 0.3601 | 3 | 13 | telomerase RNA binding |
| GO:1901505 | 0.007 | 5.8951 | 0.7756 | 4 | 28 | carbohydrate derivative transporter activity |
| GO:0005047 | 0.0072 | 23.5038 | 0.1385 | 2 | 5 | signal recognition particle binding |
| GO:0015038 | 0.0072 | 23.5038 | 0.1385 | 2 | 5 | glutathione disulfide oxidoreductase activity |
| GO:0031694 | 0.0072 | 23.5038 | 0.1385 | 2 | 5 | alpha-2A adrenergic receptor binding |
| GOMFID | Pvalue | OddsRatio | ExpCount | Count | Size | Term |
| GO:0003735 | 1e-04 | 3.3018 | 5.6245 | 17 | 195 | structural constituent of ribosome |
| GO:0003697 | 8e-04 | 4.0476 | 2.4517 | 9 | 85 | single-stranded DNA binding |
| GO:0003676 | 0.0015 | 1.3793 | 106.5487 | 134 | 3694 | nucleic acid binding |
| GO:0019864 | 0.0043 | 11.2912 | 0.3461 | 3 | 12 | IgG binding |
| GO:0070182 | 0.0043 | 11.2912 | 0.3461 | 3 | 12 | DNA polymerase binding |
| GO:0019789 | 0.0055 | 10.1614 | 0.375 | 3 | 13 | SUMO transferase activity |
| GO:0001968 | 0.0092 | 5.4261 | 0.8365 | 4 | 29 | fibronectin binding |
| GOMFID | Pvalue | OddsRatio | ExpCount | Count | Size | Term |
| GO:0008009 | 0 | 9.5012 | 0.8661 | 7 | 48 | chemokine activity |
| GO:0005126 | 1e-04 | 3.3779 | 4.7995 | 15 | 266 | cytokine receptor binding |
| GO:0042056 | 8e-04 | 11.0257 | 0.433 | 4 | 24 | chemoattractant activity |
| GO:0019841 | 0.0015 | 16.4904 | 0.2346 | 3 | 13 | retinol binding |
| GO:0016918 | 0.0018 | 14.9903 | 0.2526 | 3 | 14 | retinal binding |
| GO:0031727 | 0.0019 | 54.8014 | 0.0722 | 2 | 4 | CCR2 chemokine receptor binding |
| GO:0046978 | 0.0019 | 54.8014 | 0.0722 | 2 | 4 | TAP1 binding |
| GO:0019863 | 0.0031 | 36.5319 | 0.0902 | 2 | 5 | IgE binding |
| GO:0031726 | 0.0046 | 27.3972 | 0.1083 | 2 | 6 | CCR1 chemokine receptor binding |
| GO:0036402 | 0.0046 | 27.3972 | 0.1083 | 2 | 6 | proteasome-activating ATPase activity |
| GO:0005179 | 0.0053 | 3.5255 | 2.1111 | 7 | 117 | hormone activity |
| GO:0005125 | 0.0097 | 2.8535 | 2.9479 | 8 | 167 | cytokine activity |
| GOMFID | Pvalue | OddsRatio | ExpCount | Count | Size | Term |
| GO:0008474 | 1e-04 | 66.5187 | 0.1112 | 3 | 5 | palmitoyl-(protein) hydrolase activity |
| GO:0003735 | 4e-04 | 3.2234 | 4.3361 | 13 | 195 | structural constituent of ribosome |
| GO:0033883 | 5e-04 | Inf | 0.0445 | 2 | 2 | pyridoxal phosphatase activity |
| GO:0008097 | 0.0029 | 44.2184 | 0.0889 | 2 | 4 | 5S rRNA binding |
| GO:0043548 | 0.0042 | 6.8315 | 0.6671 | 4 | 30 | phosphatidylinositol 3-kinase binding |
| GO:0008378 | 0.0059 | 6.1236 | 0.7338 | 4 | 33 | galactosyltransferase activity |
| GO:0005112 | 0.0081 | 8.3073 | 0.4225 | 3 | 19 | Notch binding |
| GO:0003723 | 0.0095 | 1.4935 | 33.2433 | 47 | 1495 | RNA binding |
| GO:0008499 | 0.0096 | 17.6839 | 0.1557 | 2 | 7 | UDP-galactose:beta-N-acetylglucosamine beta-1,3-galactosyltransferase activity |
| GO:0016670 | 0.0096 | 17.6839 | 0.1557 | 2 | 7 | oxidoreductase activity, acting on a sulfur group of donors, oxygen as acceptor |
| GOMFID | Pvalue | OddsRatio | ExpCount | Count | Size | Term |
| GO:0003735 | 0 | 4.1268 | 3.7166 | 14 | 195 | structural constituent of ribosome |
| GO:0008378 | 0.0034 | 7.1813 | 0.629 | 4 | 33 | galactosyltransferase activity |
| GO:0032182 | 0.0056 | 3.4892 | 2.1347 | 7 | 112 | ubiquitin-like protein binding |
| GO:0031593 | 0.0069 | 5.7823 | 0.7624 | 4 | 40 | polyubiquitin binding |
| GO:0004022 | 0.0094 | 17.264 | 0.1525 | 2 | 8 | alcohol dehydrogenase (NAD) activity |
| GOMFID | Pvalue | OddsRatio | ExpCount | Count | Size | Term |
| GO:0003735 | 0 | 4.0554 | 4.0635 | 15 | 195 | structural constituent of ribosome |
| GO:0019843 | 5e-04 | 6.66 | 1.0211 | 6 | 49 | rRNA binding |
| GO:0042605 | 0.0014 | 9.5012 | 0.5001 | 4 | 24 | peptide antigen binding |
| GO:0004984 | 0.0018 | 2.3662 | 7.6061 | 17 | 365 | olfactory receptor activity |
| GO:0005134 | 0.0042 | 31.5112 | 0.1042 | 2 | 5 | interleukin-2 receptor binding |
| GO:0034711 | 0.0042 | 31.5112 | 0.1042 | 2 | 5 | inhibin binding |
| GO:0031849 | 0.0061 | 23.6319 | 0.125 | 2 | 6 | olfactory receptor binding |
| GO:0070063 | 0.0071 | 5.7535 | 0.771 | 4 | 37 | RNA polymerase binding |
| GO:0016423 | 0.0085 | 18.9043 | 0.1459 | 2 | 7 | tRNA (guanine) methyltransferase activity |
| GO:0046977 | 0.0085 | 18.9043 | 0.1459 | 2 | 7 | TAP binding |
| GOMFID | Pvalue | OddsRatio | ExpCount | Count | Size | Term |
| GO:0004984 | 0 | 5.7279 | 3.8262 | 19 | 365 | olfactory receptor activity |
| GO:0004930 | 0 | 3.8728 | 8.1347 | 27 | 776 | G-protein coupled receptor activity |
| GO:0038023 | 0 | 2.4759 | 13.2503 | 29 | 1264 | signaling receptor activity |
| GO:0099600 | 1e-04 | 2.4864 | 12.6947 | 28 | 1211 | transmembrane receptor activity |
| GO:0060089 | 4e-04 | 2.1323 | 15.7243 | 30 | 1500 | molecular transducer activity |
| GO:0030883 | 0.0011 | 63.6892 | 0.0524 | 2 | 5 | endogenous lipid antigen binding |
| GO:0030884 | 0.0011 | 63.6892 | 0.0524 | 2 | 5 | exogenous lipid antigen binding |
| GO:0005549 | 0.0018 | 6.2087 | 0.8701 | 5 | 83 | odorant binding |
| GO:0004952 | 0.0022 | 38.2086 | 0.0734 | 2 | 7 | dopamine neurotransmitter receptor activity |
| GO:0071723 | 0.0022 | 38.2086 | 0.0734 | 2 | 7 | lipopeptide binding |
| GO:0030881 | 0.0037 | 27.2883 | 0.0943 | 2 | 9 | beta-2-microglobulin binding |
| GO:0035240 | 0.0047 | 23.8758 | 0.1048 | 2 | 10 | dopamine binding |
| GOMFID | Pvalue | OddsRatio | ExpCount | Count | Size | Term |
| GO:0003735 | 4e-04 | 3.9283 | 2.7379 | 10 | 195 | structural constituent of ribosome |
| GO:0004062 | 0.0028 | 35.4224 | 0.0842 | 2 | 6 | aryl sulfotransferase activity |
| GO:0005164 | 0.0069 | 8.5288 | 0.3931 | 3 | 28 | tumor necrosis factor receptor binding |
| GOMFID | Pvalue | OddsRatio | ExpCount | Count | Size | Term |
| GO:0004984 | 0 | 3.4616 | 5.6814 | 18 | 365 | olfactory receptor activity |
| GO:0004930 | 2e-04 | 2.3341 | 12.0788 | 26 | 776 | G-protein coupled receptor activity |
| GO:0005549 | 3e-04 | 5.9671 | 1.2919 | 7 | 83 | odorant binding |
| GO:0008379 | 7e-04 | 127.5226 | 0.0467 | 2 | 3 | thioredoxin peroxidase activity |
| GO:0004090 | 0.0014 | 63.7572 | 0.0623 | 2 | 4 | carbonyl reductase (NADPH) activity |
| GO:0050811 | 0.0015 | 15.9948 | 0.2335 | 3 | 15 | GABA receptor binding |
| GO:0099600 | 0.0022 | 1.8242 | 18.8497 | 32 | 1211 | transmembrane receptor activity |
| GO:0038023 | 0.0023 | 1.8037 | 19.6747 | 33 | 1264 | signaling receptor activity |
| GO:0060089 | 0.0058 | 1.6508 | 23.3482 | 36 | 1500 | molecular transducer activity |
| GO:0042605 | 0.0059 | 9.1346 | 0.3736 | 3 | 24 | peptide antigen binding |
| GO:0046933 | 0.0081 | 18.2105 | 0.1401 | 2 | 9 | proton-transporting ATP synthase activity, rotational mechanism |
| GO:0032395 | 0.01 | 15.9331 | 0.1557 | 2 | 10 | MHC class II receptor activity |
| GOMFID | Pvalue | OddsRatio | ExpCount | Count | Size | Term |
| GO:0004984 | 1e-04 | 3.231 | 5.7046 | 17 | 365 | olfactory receptor activity |
| GO:0044822 | 3e-04 | 2.0453 | 17.567 | 33 | 1124 | poly(A) RNA binding |
| GO:0005549 | 0.0019 | 5.0055 | 1.2972 | 6 | 83 | odorant binding |
| GO:0005125 | 0.0021 | 3.1602 | 3.3602 | 10 | 215 | cytokine activity |
| GO:0015186 | 0.0024 | 42.3251 | 0.0781 | 2 | 5 | L-glutamine transmembrane transporter activity |
| GO:0060228 | 0.0035 | 31.7418 | 0.0938 | 2 | 6 | phosphatidylcholine-sterol O-acyltransferase activator activity |
| GO:0070325 | 0.0053 | 9.5519 | 0.3595 | 3 | 23 | lipoprotein particle receptor binding |
| GO:0001205 | 0.0084 | 7.9578 | 0.422 | 3 | 27 | transcriptional activator activity, RNA polymerase II distal enhancer sequence-specific binding |
| GOMFID | Pvalue | OddsRatio | ExpCount | Count | Size | Term |
| GO:0004984 | 0 | 4.1945 | 4.4987 | 17 | 365 | olfactory receptor activity |
| GO:0004066 | 2e-04 | Inf | 0.0247 | 2 | 2 | asparagine synthase (glutamine-hydrolyzing) activity |
| GO:0042605 | 2e-04 | 16.3432 | 0.2958 | 4 | 24 | peptide antigen binding |
| GO:0004930 | 6e-04 | 2.3781 | 9.5644 | 21 | 776 | G-protein coupled receptor activity |
| GO:0005549 | 0.0036 | 5.2462 | 1.023 | 5 | 83 | odorant binding |
| GO:0031995 | 0.004 | 26.9792 | 0.0986 | 2 | 8 | insulin-like growth factor II binding |
| GO:0031994 | 0.0051 | 23.1235 | 0.1109 | 2 | 9 | insulin-like growth factor I binding |
| GO:0015926 | 0.0064 | 20.2318 | 0.1233 | 2 | 10 | glucosidase activity |
| GO:0032395 | 0.0064 | 20.2318 | 0.1233 | 2 | 10 | MHC class II receptor activity |
| GO:0099600 | 0.0076 | 1.7911 | 14.9259 | 25 | 1211 | transmembrane receptor activity |
| GO:0009982 | 0.0092 | 16.1833 | 0.1479 | 2 | 12 | pseudouridine synthase activity |
| GOMFID | Pvalue | OddsRatio | ExpCount | Count | Size | Term |
| GO:0004984 | 0 | 4.5017 | 3.9654 | 16 | 365 | olfactory receptor activity |
| GO:0004930 | 3e-04 | 2.5952 | 8.4305 | 20 | 776 | G-protein coupled receptor activity |
| GO:0019788 | 7e-04 | 92.1124 | 0.0435 | 2 | 4 | NEDD8 transferase activity |
| GO:0030515 | 0.0024 | 12.6193 | 0.2716 | 3 | 25 | snoRNA binding |
| GO:0005184 | 0.0027 | 12.0699 | 0.2825 | 3 | 26 | neuropeptide hormone activity |
| GO:0002020 | 0.0053 | 4.755 | 1.119 | 5 | 103 | protease binding |
| GO:0097602 | 0.0061 | 20.4602 | 0.1195 | 2 | 11 | cullin family protein binding |
| GOMFID | Pvalue | OddsRatio | ExpCount | Count | Size | Term |
| GO:0004984 | 0 | 4.3545 | 4.6147 | 18 | 365 | olfactory receptor activity |
| GO:0005184 | 3e-04 | 14.4699 | 0.3287 | 4 | 26 | neuropeptide hormone activity |
| GO:0004930 | 3e-04 | 2.4376 | 9.8109 | 22 | 776 | G-protein coupled receptor activity |
| GO:0003746 | 0.0014 | 15.8429 | 0.2276 | 3 | 18 | translation elongation factor activity |
| GO:0030492 | 0.0016 | 52.5821 | 0.0632 | 2 | 5 | hemoglobin binding |
| GO:0044822 | 0.0041 | 1.8881 | 14.2107 | 25 | 1124 | poly(A) RNA binding |
| GOMFID | Pvalue | OddsRatio | ExpCount | Count | Size | Term |
| GO:0030984 | 0.0014 | 90.8437 | 0.065 | 2 | 3 | kininogen binding |
| GO:0071855 | 0.0026 | 7.935 | 0.5849 | 4 | 27 | neuropeptide receptor binding |
| GO:0046978 | 0.0027 | 45.4189 | 0.0867 | 2 | 4 | TAP1 binding |
| GO:0005179 | 0.0039 | 3.37 | 2.5348 | 8 | 117 | hormone activity |
| GO:0003723 | 0.0059 | 1.5402 | 32.3885 | 47 | 1495 | RNA binding |
| GO:0036402 | 0.0066 | 22.7065 | 0.13 | 2 | 6 | proteasome-activating ATPase activity |
| GOMFID | Pvalue | OddsRatio | ExpCount | Count | Size | Term |
| GO:0003847 | 0.0031 | 36.7976 | 0.0896 | 2 | 5 | 1-alkyl-2-acetylglycerophosphocholine esterase activity |
| GO:0019763 | 0.0031 | 36.7976 | 0.0896 | 2 | 5 | immunoglobulin receptor activity |
| GO:0004930 | 0.0034 | 1.905 | 13.9029 | 25 | 776 | G-protein coupled receptor activity |
| GO:0005125 | 0.0055 | 2.7355 | 3.852 | 10 | 215 | cytokine activity |
| GO:0005198 | 0.0056 | 1.9002 | 12.2009 | 22 | 681 | structural molecule activity |
| GO:0016714 | 0.0063 | 22.0757 | 0.1254 | 2 | 7 | oxidoreductase activity, acting on paired donors, with incorporation or reduction of molecular oxygen, reduced pteridine as one donor, and incorporation of one atom of oxygen |
| GO:0019865 | 0.0077 | 8.3 | 0.4121 | 3 | 23 | immunoglobulin binding |
| GO:0004871 | 0.009 | 1.5487 | 28.1463 | 41 | 1571 | signal transducer activity |
| GOMFID | Pvalue | OddsRatio | ExpCount | Count | Size | Term |
| GO:0003676 | 1e-04 | 1.4521 | 119.9259 | 156 | 3694 | nucleic acid binding |
| GO:0030881 | 0.0025 | 14.9833 | 0.2922 | 3 | 9 | beta-2-microglobulin binding |
| GO:0003729 | 0.0029 | 2.709 | 4.7399 | 12 | 146 | mRNA binding |
| GO:0080019 | 0.0031 | 59.835 | 0.0974 | 2 | 3 | fatty-acyl-CoA reductase (alcohol-forming) activity |
| GO:0044822 | 0.0034 | 1.582 | 31.2955 | 47 | 978 | poly(A) RNA binding |
| GO:0004983 | 0.0034 | 12.842 | 0.3247 | 3 | 10 | neuropeptide Y receptor activity |
| GO:0043422 | 0.0034 | 12.842 | 0.3247 | 3 | 10 | protein kinase B binding |
| GO:0017069 | 0.0034 | 5.5636 | 1.0389 | 5 | 32 | snRNA binding |
| GO:0003743 | 0.0035 | 4.5116 | 1.4934 | 6 | 46 | translation initiation factor activity |
| GO:0017017 | 0.0046 | 11.236 | 0.3571 | 3 | 11 | MAP kinase tyrosine/serine/threonine phosphatase activity |
| GO:0051879 | 0.006 | 6.3158 | 0.7467 | 4 | 23 | Hsp90 protein binding |
| GO:0005198 | 0.0086 | 1.6065 | 22.1087 | 34 | 681 | structural molecule activity |
| GO:0016717 | 0.0099 | 19.9424 | 0.1623 | 2 | 5 | oxidoreductase activity, acting on paired donors, with oxidation of a pair of donors resulting in the reduction of molecular oxygen to two molecules of water |
| GO:0030883 | 0.0099 | 19.9424 | 0.1623 | 2 | 5 | endogenous lipid antigen binding |
| GO:0030884 | 0.0099 | 19.9424 | 0.1623 | 2 | 5 | exogenous lipid antigen binding |
| GO:0042015 | 0.0099 | 19.9424 | 0.1623 | 2 | 5 | interleukin-20 binding |
| GOMFID | Pvalue | OddsRatio | ExpCount | Count | Size | Term |
| GO:0004930 | 0 | 3.1805 | 8.8742 | 25 | 776 | G-protein coupled receptor activity |
| GO:0004984 | 1e-04 | 3.6544 | 4.1741 | 14 | 365 | olfactory receptor activity |
| GO:0099600 | 1e-04 | 2.3362 | 13.8488 | 29 | 1211 | transmembrane receptor activity |
| GO:0038023 | 2e-04 | 2.2277 | 14.4549 | 29 | 1264 | signaling receptor activity |
| GO:0033038 | 0.0011 | 17.565 | 0.2058 | 3 | 18 | bitter taste receptor activity |
| GO:0060089 | 0.0017 | 1.917 | 17.1537 | 30 | 1500 | molecular transducer activity |
| GO:0004523 | 0.0026 | 34.9551 | 0.0801 | 2 | 7 | RNA-DNA hybrid ribonuclease activity |
| GO:0008081 | 0.0031 | 5.46 | 0.9835 | 5 | 86 | phosphoric diester hydrolase activity |
| GO:0005184 | 0.0032 | 11.4495 | 0.2973 | 3 | 26 | neuropeptide hormone activity |
| GO:0046920 | 0.0035 | 29.1273 | 0.0915 | 2 | 8 | alpha-(1->3)-fucosyltransferase activity |
| GO:0004435 | 0.0039 | 10.5322 | 0.3202 | 3 | 28 | phosphatidylinositol phospholipase C activity |
| GO:0050786 | 0.0067 | 19.4145 | 0.1258 | 2 | 11 | RAGE receptor binding |
| GO:0016893 | 0.0086 | 7.7398 | 0.4231 | 3 | 37 | endonuclease activity, active with either ribo- or deoxyribonucleic acids and producing 5'-phosphomonoesters |
| GOMFID | Pvalue | OddsRatio | ExpCount | Count | Size | Term |
| GO:0003735 | 0 | 4.0872 | 3.4689 | 13 | 195 | structural constituent of ribosome |
| GO:0004984 | 3e-04 | 2.807 | 6.493 | 17 | 365 | olfactory receptor activity |
| GO:0032394 | 3e-04 | Inf | 0.0356 | 2 | 2 | MHC class Ib receptor activity |
| GO:0047708 | 3e-04 | Inf | 0.0356 | 2 | 2 | biotinidase activity |
| GO:0016779 | 0.0014 | 3.9945 | 2.1525 | 8 | 121 | nucleotidyltransferase activity |
| GO:0019863 | 0.003 | 37.0671 | 0.0889 | 2 | 5 | IgE binding |
| GO:0032407 | 0.003 | 37.0671 | 0.0889 | 2 | 5 | MutSalpha complex binding |
| GO:0019957 | 0.0062 | 22.2374 | 0.1245 | 2 | 7 | C-C chemokine binding |
| GO:0071933 | 0.0062 | 22.2374 | 0.1245 | 2 | 7 | Arp2/3 complex binding |
| GO:0030957 | 0.0082 | 18.53 | 0.1423 | 2 | 8 | Tat protein binding |
| GOMFID | Pvalue | OddsRatio | ExpCount | Count | Size | Term |
| GO:0046933 | 0 | 39.407 | 0.1813 | 4 | 9 | proton-transporting ATP synthase activity, rotational mechanism |
| GO:0016491 | 2e-04 | 2.2162 | 13.5742 | 28 | 674 | oxidoreductase activity |
| GO:0003735 | 6e-04 | 3.2765 | 3.9273 | 12 | 195 | structural constituent of ribosome |
| GO:0051787 | 0.0016 | 16.3631 | 0.2417 | 3 | 12 | misfolded protein binding |
| GO:0015078 | 0.0023 | 4.8362 | 1.3542 | 6 | 68 | hydrogen ion transmembrane transporter activity |
| GO:0042015 | 0.0039 | 32.6349 | 0.1007 | 2 | 5 | interleukin-20 binding |
| GO:0008198 | 0.0082 | 8.1768 | 0.4229 | 3 | 21 | ferrous iron binding |
| GO:0046961 | 0.0082 | 8.1768 | 0.4229 | 3 | 21 | proton-transporting ATPase activity, rotational mechanism |
| GOMFID | Pvalue | OddsRatio | ExpCount | Count | Size | Term |
| GO:0008073 | 0.0011 | 100.5212 | 0.0589 | 2 | 3 | ornithine decarboxylase inhibitor activity |
| GO:0044822 | 0.0014 | 1.795 | 22.0658 | 37 | 1124 | poly(A) RNA binding |
| GO:0003676 | 0.0028 | 1.4368 | 72.5188 | 94 | 3694 | nucleic acid binding |
| GO:0016881 | 0.0049 | 10.0758 | 0.3534 | 3 | 18 | acid-amino acid ligase activity |
| GO:0033038 | 0.0049 | 10.0758 | 0.3534 | 3 | 18 | bitter taste receptor activity |
| GO:0003727 | 0.0059 | 4.6835 | 1.1583 | 5 | 59 | single-stranded RNA binding |
| GO:0004129 | 0.0099 | 7.5544 | 0.4515 | 3 | 23 | cytochrome-c oxidase activity |
| NA. |
| n/a |
| NA. |
| n/a |
| NA. |
| n/a |
| NA. |
| n/a |
| NA. |
| n/a |
| NA. |
| n/a |
| NA. |
| n/a |
| NA. |
| n/a |
| NA. |
| n/a |
| NA. |
| n/a |
| NA. |
| n/a |
| NA. |
| n/a |
| NA. |
| n/a |
| NA. |
| n/a |
| NA. |
| n/a |
| NA. |
| n/a |
| NA. |
| n/a |
| NA. |
| n/a |
| NA. |
| n/a |
| NA. |
| n/a |
| NA. |
| n/a |
| NA. |
| n/a |
| NA. |
| n/a |
| NA. |
| n/a |
| NA. |
| n/a |
| NA. |
| n/a |
| NA. |
| n/a |
| NA. |
| n/a |
| NA. |
| n/a |
| NA. |
| n/a |
| NA. |
| n/a |
| NA. |
| n/a |
| NA. |
| n/a |
| NA. |
| n/a |
| NA. |
| n/a |
| NA. |
| n/a |
| NA. |
| n/a |
| NA. |
| n/a |
| NA. |
| n/a |
| NA. |
| n/a |
| NA. |
| n/a |
| NA. |
| n/a |
| NA. |
| n/a |
| NA. |
| n/a |
| NA. |
| n/a |
| NA. |
| n/a |
| NA. |
| n/a |
| NA. |
| n/a |
| NA. |
| n/a |
| NA. |
| n/a |
| NA. |
| n/a |
| NA. |
| n/a |
| NA. |
| n/a |
| NA. |
| n/a |
| NA. |
| n/a |
| NA. |
| n/a |
| NA. |
| n/a |
| NA. |
| n/a |
| NA. |
| n/a |
| NA. |
| n/a |
| NA. |
| n/a |
| NA. |
| n/a |
| NA. |
| n/a |
| NA. |
| n/a |
| NA. |
| n/a |
| NA. |
| n/a |
| NA. |
| n/a |
| NA. |
| n/a |
| NA. |
| n/a |
| NA. |
| n/a |
| NA. |
| n/a |
| NA. |
| n/a |
| NA. |
| n/a |
| NA. |
| n/a |
| NA. |
| n/a |
| NA. |
| n/a |
| NA. |
| n/a |
| NA. |
| n/a |
| NA. |
| n/a |
| NA. |
| n/a |
| NA. |
| n/a |
| NA. |
| n/a |
| NA. |
| n/a |
| NA. |
| n/a |
| NA. |
| n/a |
| NA. |
| n/a |
| NA. |
| n/a |
| NA. |
| n/a |
| NA. |
| n/a |
| NA. |
| n/a |
| NA. |
| n/a |
| NA. |
| n/a |
| NA. |
| n/a |
| NA. |
| n/a |
| NA. |
| n/a |
| NA. |
| n/a |
| NA. |
| n/a |
| NA. |
| n/a |
| NA. |
| n/a |
| NA. |
| n/a |
| NA. |
| n/a |
| NA. |
| n/a |
| NA. |
| n/a |
| NA. |
| n/a |
| NA. |
| n/a |
| NA. |
| n/a |
| NA. |
| n/a |
| NA. |
| n/a |
| NA. |
| n/a |
| NA. |
| n/a |
| NA. |
| n/a |
| NA. |
| n/a |
| GOMFID | Pvalue | OddsRatio | ExpCount | Count | Size | Term |
| GO:1902475 | 0.001 | 7.4823 | 0.7934 | 5 | 29 | L-alpha-amino acid transmembrane transport |
| GO:0060585 | 0.0022 | 71.4333 | 0.0821 | 2 | 3 | positive regulation of prostaglandin-endoperoxide synthase activity |
| GO:0070889 | 0.0022 | 71.4333 | 0.0821 | 2 | 3 | platelet alpha granule organization |
| GO:0043171 | 0.0038 | 7.168 | 0.6566 | 4 | 24 | peptide catabolic process |
| GO:0006528 | 0.0043 | 35.7143 | 0.1094 | 2 | 4 | asparagine metabolic process |
| GO:0014826 | 0.0043 | 35.7143 | 0.1094 | 2 | 4 | vein smooth muscle contraction |
| GO:0048681 | 0.0043 | 35.7143 | 0.1094 | 2 | 4 | negative regulation of axon regeneration |
| GO:1903753 | 0.0043 | 35.7143 | 0.1094 | 2 | 4 | negative regulation of p38MAPK cascade |
| GO:0007032 | 0.0068 | 3.849 | 1.6962 | 6 | 62 | endosome organization |
| GO:0003100 | 0.0071 | 23.808 | 0.1368 | 2 | 5 | regulation of systemic arterial blood pressure by endothelin |
| GO:0035519 | 0.0071 | 23.808 | 0.1368 | 2 | 5 | protein K29-linked ubiquitination |
| GO:0044314 | 0.0071 | 23.808 | 0.1368 | 2 | 5 | protein K27-linked ubiquitination |
| GO:1990822 | 0.0071 | 23.808 | 0.1368 | 2 | 5 | basic amino acid transmembrane transport |
| GO:0098751 | 0.0076 | 5.7325 | 0.7934 | 4 | 29 | bone cell development |
| GO:0006521 | 0.008 | 3.7158 | 1.7509 | 6 | 64 | regulation of cellular amino acid metabolic process |
| GO:0043507 | 0.008 | 3.7158 | 1.7509 | 6 | 64 | positive regulation of JUN kinase activity |
| GO:0006084 | 0.0086 | 5.5117 | 0.8207 | 4 | 30 | acetyl-CoA metabolic process |
| GO:0061515 | 0.0098 | 4.171 | 1.3132 | 5 | 48 | myeloid cell development |
| GOMFID | Pvalue | OddsRatio | ExpCount | Count | Size | Term |
| GO:0070537 | 4e-04 | Inf | 0.0425 | 2 | 2 | histone H2A K63-linked deubiquitination |
| GO:0010821 | 5e-04 | 3.1569 | 4.4171 | 13 | 208 | regulation of mitochondrion organization |
| GO:0032715 | 5e-04 | 8.6501 | 0.6795 | 5 | 32 | negative regulation of interleukin-6 production |
| GO:0003095 | 0.0013 | 92.7311 | 0.0637 | 2 | 3 | pressure natriuresis |
| GO:0060167 | 0.0013 | 92.7311 | 0.0637 | 2 | 3 | regulation of adenosine receptor signaling pathway |
| GO:0044458 | 0.0018 | 15.4939 | 0.2548 | 3 | 12 | motile cilium assembly |
| GO:0030104 | 0.0022 | 4.9223 | 1.3379 | 6 | 63 | water homeostasis |
| GO:0060271 | 0.0023 | 2.7752 | 4.587 | 12 | 216 | cilium morphogenesis |
| GO:1902589 | 0.0026 | 1.4882 | 53.2808 | 73 | 2509 | single-organism organelle organization |
| GO:0036101 | 0.0026 | 46.3625 | 0.0849 | 2 | 4 | leukotriene B4 catabolic process |
| GO:1901523 | 0.0026 | 46.3625 | 0.0849 | 2 | 4 | icosanoid catabolic process |
| GO:0051923 | 0.0036 | 11.6182 | 0.3185 | 3 | 15 | sulfation |
| GO:0046928 | 0.0041 | 5.1839 | 1.0618 | 5 | 50 | regulation of neurotransmitter secretion |
| GO:0010637 | 0.0043 | 30.9063 | 0.1062 | 2 | 5 | negative regulation of mitochondrial fusion |
| GO:0006839 | 0.0051 | 2.395 | 5.7125 | 13 | 269 | mitochondrial transport |
| GO:0003091 | 0.0056 | 6.2079 | 0.722 | 4 | 34 | renal water homeostasis |
| GO:0007628 | 0.0062 | 6.0073 | 0.7433 | 4 | 35 | adult walking behavior |
| GO:0016198 | 0.0064 | 23.1782 | 0.1274 | 2 | 6 | axon choice point recognition |
| GO:0042866 | 0.0064 | 23.1782 | 0.1274 | 2 | 6 | pyruvate biosynthetic process |
| GO:1904018 | 0.0069 | 3.0469 | 2.7819 | 8 | 131 | positive regulation of vasculature development |
| GO:0035588 | 0.0071 | 8.7114 | 0.4035 | 3 | 19 | G-protein coupled purinergic receptor signaling pathway |
| GO:0050427 | 0.0071 | 8.7114 | 0.4035 | 3 | 19 | 3'-phosphoadenosine 5'-phosphosulfate metabolic process |
| GO:1903955 | 0.0084 | 3.639 | 1.7626 | 6 | 83 | positive regulation of protein targeting to mitochondrion |
| GO:0016043 | 0.0086 | 1.315 | 123.5716 | 145 | 5819 | cellular component organization |
| GO:0006413 | 0.0088 | 2.3141 | 5.4364 | 12 | 256 | translational initiation |
| GO:0050862 | 0.0088 | 18.5414 | 0.1487 | 2 | 7 | positive regulation of T cell receptor signaling pathway |
| GO:0042775 | 0.0088 | 4.2386 | 1.2742 | 5 | 60 | mitochondrial ATP synthesis coupled electron transport |
| GOMFID | Pvalue | OddsRatio | ExpCount | Count | Size | Term |
| GO:0019058 | 6e-04 | 2.4174 | 8.8215 | 20 | 435 | viral life cycle |
| GO:0034122 | 9e-04 | 10.8599 | 0.4461 | 4 | 22 | negative regulation of toll-like receptor signaling pathway |
| GO:0070254 | 0.002 | 14.6219 | 0.2636 | 3 | 13 | mucus secretion |
| GO:0002084 | 0.0024 | 48.6108 | 0.0811 | 2 | 4 | protein depalmitoylation |
| GO:0002906 | 0.0024 | 48.6108 | 0.0811 | 2 | 4 | negative regulation of mature B cell apoptotic process |
| GO:0043044 | 0.0027 | 4.6703 | 1.3993 | 6 | 69 | ATP-dependent chromatin remodeling |
| GO:0006195 | 0.0028 | 5.6914 | 0.9734 | 5 | 48 | purine nucleotide catabolic process |
| GO:0072521 | 0.0029 | 2.0551 | 10.7886 | 21 | 532 | purine-containing compound metabolic process |
| GO:0009150 | 0.003 | 2.1352 | 9.3893 | 19 | 463 | purine ribonucleotide metabolic process |
| GO:0045071 | 0.0031 | 5.5616 | 0.9937 | 5 | 49 | negative regulation of viral genome replication |
| GO:0045581 | 0.0034 | 7.2357 | 0.6287 | 4 | 31 | negative regulation of T cell differentiation |
| GO:0046513 | 0.004 | 5.2056 | 1.0545 | 5 | 52 | ceramide biosynthetic process |
| GO:1903706 | 0.0045 | 2.3442 | 6.2866 | 14 | 310 | regulation of hemopoiesis |
| GO:0034143 | 0.0045 | 10.4415 | 0.3447 | 3 | 17 | regulation of toll-like receptor 4 signaling pathway |
| GO:0033003 | 0.0048 | 6.5108 | 0.6895 | 4 | 34 | regulation of mast cell activation |
| GO:0009117 | 0.005 | 1.9184 | 12.0662 | 22 | 595 | nucleotide metabolic process |
| GO:0019693 | 0.0053 | 2.0136 | 9.9166 | 19 | 489 | ribose phosphate metabolic process |
| GO:0009144 | 0.0054 | 2.598 | 4.4615 | 11 | 220 | purine nucleoside triphosphate metabolic process |
| GO:0008063 | 0.0058 | 24.3022 | 0.1217 | 2 | 6 | Toll signaling pathway |
| GO:0070944 | 0.0058 | 24.3022 | 0.1217 | 2 | 6 | neutrophil mediated killing of bacterium |
| GO:0071609 | 0.0058 | 24.3022 | 0.1217 | 2 | 6 | chemokine (C-C motif) ligand 5 production |
| GO:0030890 | 0.0059 | 6.1031 | 0.7301 | 4 | 36 | positive regulation of B cell proliferation |
| GO:0006119 | 0.006 | 3.92 | 1.6426 | 6 | 81 | oxidative phosphorylation |
| GO:0045619 | 0.0063 | 3.096 | 2.7377 | 8 | 135 | regulation of lymphocyte differentiation |
| GO:0071616 | 0.0063 | 4.6145 | 1.1762 | 5 | 58 | acyl-CoA biosynthetic process |
| GO:1902106 | 0.0064 | 3.8682 | 1.6629 | 6 | 82 | negative regulation of leukocyte differentiation |
| GO:0009167 | 0.0074 | 2.4777 | 4.6642 | 11 | 230 | purine ribonucleoside monophosphate metabolic process |
| GO:0045343 | 0.008 | 19.4405 | 0.142 | 2 | 7 | regulation of MHC class I biosynthetic process |
| GO:0070942 | 0.008 | 19.4405 | 0.142 | 2 | 7 | neutrophil mediated cytotoxicity |
| GO:0030149 | 0.0084 | 8.119 | 0.4259 | 3 | 21 | sphingolipid catabolic process |
| GO:0035383 | 0.0085 | 3.6282 | 1.7643 | 6 | 87 | thioester metabolic process |
| GO:0035338 | 0.0085 | 5.4236 | 0.8112 | 4 | 40 | long-chain fatty-acyl-CoA biosynthetic process |
| GO:0006303 | 0.0089 | 4.2153 | 1.2776 | 5 | 63 | double-strand break repair via nonhomologous end joining |
| GO:0046128 | 0.0091 | 2.2154 | 6.1446 | 13 | 303 | purine ribonucleoside metabolic process |
| GO:0071359 | 0.0093 | 5.2766 | 0.8315 | 4 | 41 | cellular response to dsRNA |
| GO:0048525 | 0.0094 | 3.5403 | 1.8049 | 6 | 89 | negative regulation of viral process |
| GO:0002460 | 0.0095 | 2.5124 | 4.1775 | 10 | 206 | adaptive immune response based on somatic recombination of immune receptors built from immunoglobulin superfamily domains |
| GO:0031047 | 0.0095 | 2.8681 | 2.9405 | 8 | 145 | gene silencing by RNA |
| GO:0001783 | 0.0096 | 7.6912 | 0.4461 | 3 | 22 | B cell apoptotic process |
| GOMFID | Pvalue | OddsRatio | ExpCount | Count | Size | Term |
| GO:2000271 | 3e-04 | 40.8 | 0.1446 | 3 | 6 | positive regulation of fibroblast apoptotic process |
| GO:0090150 | 0.002 | 2.2686 | 8.3888 | 18 | 348 | establishment of protein localization to membrane |
| GO:0086004 | 0.0028 | 7.783 | 0.6026 | 4 | 25 | regulation of cardiac muscle cell contraction |
| GO:0034316 | 0.0034 | 40.6941 | 0.0964 | 2 | 4 | negative regulation of Arp2/3 complex-mediated actin nucleation |
| GO:0035021 | 0.0034 | 40.6941 | 0.0964 | 2 | 4 | negative regulation of Rac protein signal transduction |
| GO:0045010 | 0.0036 | 5.3849 | 1.0365 | 5 | 43 | actin nucleation |
| GO:0043506 | 0.0036 | 3.8309 | 1.9767 | 7 | 82 | regulation of JUN kinase activity |
| GO:0070972 | 0.0038 | 3.1121 | 3.0855 | 9 | 128 | protein localization to endoplasmic reticulum |
| GO:2001239 | 0.004 | 5.2464 | 1.0606 | 5 | 44 | regulation of extrinsic apoptotic signaling pathway in absence of ligand |
| GO:0090307 | 0.0044 | 5.1149 | 1.0848 | 5 | 45 | mitotic spindle assembly |
| GO:0032273 | 0.0046 | 3.2871 | 2.6034 | 8 | 108 | positive regulation of protein polymerization |
| GO:0034394 | 0.0048 | 4.9899 | 1.1089 | 5 | 46 | protein localization to cell surface |
| GO:0051665 | 0.0055 | 27.1277 | 0.1205 | 2 | 5 | membrane raft localization |
| GO:0070934 | 0.0055 | 27.1277 | 0.1205 | 2 | 5 | CRD-mediated mRNA stabilization |
| GO:0015031 | 0.006 | 1.4712 | 42.6187 | 59 | 1768 | protein transport |
| GO:0033036 | 0.0061 | 1.394 | 63.9522 | 83 | 2653 | macromolecule localization |
| GO:0048490 | 0.0062 | 9.4092 | 0.3857 | 3 | 16 | anterograde synaptic vesicle transport |
| GO:0099514 | 0.0062 | 9.4092 | 0.3857 | 3 | 16 | synaptic vesicle cytoskeletal transport |
| GO:0006821 | 0.0064 | 3.4185 | 2.1936 | 7 | 91 | chloride transport |
| GO:0034622 | 0.0064 | 1.6722 | 20.1041 | 32 | 834 | cellular macromolecular complex assembly |
| GO:0048247 | 0.0069 | 4.5451 | 1.2053 | 5 | 50 | lymphocyte chemotaxis |
| GO:0090004 | 0.007 | 5.8346 | 0.7714 | 4 | 32 | positive regulation of establishment of protein localization to plasma membrane |
| GO:0006868 | 0.0082 | 20.3444 | 0.1446 | 2 | 6 | glutamine transport |
| GO:0086073 | 0.0082 | 20.3444 | 0.1446 | 2 | 6 | bundle of His cell-Purkinje myocyte adhesion involved in cell communication |
| GO:0006942 | 0.0083 | 3.6678 | 1.7597 | 6 | 73 | regulation of striated muscle contraction |
| GO:0032288 | 0.0087 | 8.1536 | 0.4339 | 3 | 18 | myelin assembly |
| GO:0098901 | 0.0087 | 8.1536 | 0.4339 | 3 | 18 | regulation of cardiac muscle cell action potential |
| GO:0006826 | 0.0088 | 4.2602 | 1.2776 | 5 | 53 | iron ion transport |
| GO:0022607 | 0.0094 | 1.3885 | 55.9973 | 73 | 2323 | cellular component assembly |
| GO:0046847 | 0.0095 | 4.173 | 1.3017 | 5 | 54 | filopodium assembly |
| GO:1904377 | 0.0096 | 5.2689 | 0.8437 | 4 | 35 | positive regulation of protein localization to cell periphery |
| GO:0038034 | 0.01 | 3.5099 | 1.832 | 6 | 76 | signal transduction in absence of ligand |
| GOMFID | Pvalue | OddsRatio | ExpCount | Count | Size | Term |
| GO:0006807 | 1e-04 | 1.4076 | 225.1647 | 270 | 6408 | nitrogen compound metabolic process |
| GO:0031339 | 4e-04 | 41.4088 | 0.1757 | 3 | 5 | negative regulation of vesicle fusion |
| GO:0006506 | 8e-04 | 6.3955 | 1.1244 | 6 | 32 | GPI anchor biosynthetic process |
| GO:0032707 | 0.0012 | Inf | 0.0703 | 2 | 2 | negative regulation of interleukin-23 production |
| GO:0006974 | 0.0015 | 1.6966 | 26.7752 | 43 | 762 | cellular response to DNA damage stimulus |
| GO:0000076 | 0.0015 | 10.0509 | 0.5271 | 4 | 15 | DNA replication checkpoint |
| GO:0044085 | 0.0018 | 1.3878 | 88.1263 | 114 | 2508 | cellular component biogenesis |
| GO:0000059 | 0.0021 | 16.5602 | 0.2811 | 3 | 8 | protein import into nucleus, docking |
| GO:0006610 | 0.0021 | 16.5602 | 0.2811 | 3 | 8 | ribosomal protein import into nucleus |
| GO:0090304 | 0.0025 | 1.2981 | 166.449 | 197 | 4737 | nucleic acid metabolic process |
| GO:0051607 | 0.0027 | 2.0282 | 11.455 | 22 | 326 | defense response to virus |
| GO:1901576 | 0.0031 | 1.2779 | 205.7334 | 237 | 5855 | organic substance biosynthetic process |
| GO:0001845 | 0.0031 | 13.7993 | 0.3162 | 3 | 9 | phagolysosome assembly |
| GO:2000322 | 0.0031 | 13.7993 | 0.3162 | 3 | 9 | regulation of glucocorticoid receptor signaling pathway |
| GO:0042771 | 0.0033 | 4.6159 | 1.4758 | 6 | 42 | intrinsic apoptotic signaling pathway in response to DNA damage by p53 class mediator |
| GO:0044711 | 0.0034 | 1.4253 | 59.4185 | 80 | 1691 | single-organism biosynthetic process |
| GO:0010266 | 0.0036 | 55.1148 | 0.1054 | 2 | 3 | response to vitamin B1 |
| GO:0034436 | 0.0036 | 55.1148 | 0.1054 | 2 | 3 | glycoprotein transport |
| GO:0006501 | 0.0036 | 5.533 | 1.0541 | 5 | 30 | C-terminal protein lipidation |
| GO:0044249 | 0.0036 | 1.2727 | 202.4304 | 233 | 5761 | cellular biosynthetic process |
| GO:0051641 | 0.0036 | 1.3358 | 100.9868 | 126 | 2874 | cellular localization |
| GO:0051130 | 0.0039 | 1.5164 | 38.1599 | 55 | 1086 | positive regulation of cellular component organization |
| GO:0050848 | 0.004 | 3.4146 | 2.5651 | 8 | 73 | regulation of calcium-mediated signaling |
| GO:0071375 | 0.0041 | 1.7797 | 17.1122 | 29 | 487 | cellular response to peptide hormone stimulus |
| GO:0060294 | 0.0043 | 11.8272 | 0.3514 | 3 | 10 | cilium movement involved in cell motility |
| GO:0032880 | 0.0047 | 1.5434 | 32.6433 | 48 | 929 | regulation of protein localization |
| GO:0038093 | 0.0052 | 1.9125 | 12.0875 | 22 | 344 | Fc receptor signaling pathway |
| GO:0046907 | 0.0053 | 1.3891 | 63.108 | 83 | 1796 | intracellular transport |
| GO:0008286 | 0.0053 | 1.9389 | 11.3847 | 21 | 324 | insulin receptor signaling pathway |
| GO:0006897 | 0.0056 | 1.673 | 20.6612 | 33 | 588 | endocytosis |
| GO:0006359 | 0.0056 | 6.5009 | 0.7379 | 4 | 21 | regulation of transcription from RNA polymerase III promoter |
| GO:0032688 | 0.0058 | 10.3481 | 0.3865 | 3 | 11 | negative regulation of interferon-beta production |
| GO:0045351 | 0.0058 | 10.3481 | 0.3865 | 3 | 11 | type I interferon biosynthetic process |
| GO:0060252 | 0.0058 | 10.3481 | 0.3865 | 3 | 11 | positive regulation of glial cell proliferation |
| GO:0072331 | 0.0058 | 2.3653 | 5.8329 | 13 | 166 | signal transduction by p53 class mediator |
| GO:0006595 | 0.006 | 3.1697 | 2.7408 | 8 | 78 | polyamine metabolic process |
| GO:1901657 | 0.006 | 1.8558 | 13.0011 | 23 | 370 | glycosyl compound metabolic process |
| GO:0042158 | 0.0065 | 3.1248 | 2.7759 | 8 | 79 | lipoprotein biosynthetic process |
| GO:0009119 | 0.0066 | 1.9005 | 11.5956 | 21 | 330 | ribonucleoside metabolic process |
| GO:1902589 | 0.0069 | 1.3237 | 88.1614 | 110 | 2509 | single-organism organelle organization |
| GO:0006139 | 0.007 | 1.7141 | 17.8876 | 29 | 553 | nucleobase-containing compound metabolic process |
| GO:0007079 | 0.0071 | 27.5556 | 0.1406 | 2 | 4 | mitotic chromosome movement towards spindle pole |
| GO:0061051 | 0.0071 | 27.5556 | 0.1406 | 2 | 4 | positive regulation of cell growth involved in cardiac muscle cell development |
| GO:0071284 | 0.0071 | 27.5556 | 0.1406 | 2 | 4 | cellular response to lead ion |
| GO:0072144 | 0.0071 | 27.5556 | 0.1406 | 2 | 4 | glomerular mesangial cell development |
| GO:0051155 | 0.0071 | 3.8627 | 1.7218 | 6 | 49 | positive regulation of striated muscle cell differentiation |
| GO:0006744 | 0.0075 | 9.1977 | 0.4217 | 3 | 12 | ubiquinone biosynthetic process |
| GO:0007252 | 0.0075 | 9.1977 | 0.4217 | 3 | 12 | I-kappaB phosphorylation |
| GO:0000060 | 0.0078 | 3.7746 | 1.7569 | 6 | 50 | protein import into nucleus, translocation |
| GO:0042634 | 0.0078 | 5.8158 | 0.8082 | 4 | 23 | regulation of hair cycle |
| GO:1990090 | 0.0081 | 4.4603 | 1.265 | 5 | 36 | cellular response to nerve growth factor stimulus |
| GO:0032479 | 0.0082 | 2.5952 | 4.1112 | 10 | 117 | regulation of type I interferon production |
| GO:0009123 | 0.0082 | 2.0091 | 8.8899 | 17 | 253 | nucleoside monophosphate metabolic process |
| GO:0010976 | 0.0087 | 2.0997 | 7.5195 | 15 | 214 | positive regulation of neuron projection development |
| GO:0006950 | 0.009 | 1.2637 | 135.6681 | 160 | 3861 | response to stress |
| GO:0043174 | 0.0095 | 8.2774 | 0.4568 | 3 | 13 | nucleoside salvage |
| GO:0034613 | 0.0095 | 1.3906 | 51.2664 | 68 | 1459 | cellular protein localization |
| GO:0071822 | 0.0099 | 1.3553 | 62.0187 | 80 | 1765 | protein complex subunit organization |
| GOMFID | Pvalue | OddsRatio | ExpCount | Count | Size | Term |
| GO:0032984 | 6e-04 | 2.2253 | 11.5139 | 24 | 314 | macromolecular complex disassembly |
| GO:2000653 | 9e-04 | 26.4038 | 0.22 | 3 | 6 | regulation of genetic imprinting |
| GO:0016236 | 0.001 | 2.1003 | 12.6507 | 25 | 345 | macroautophagy |
| GO:0019886 | 0.0015 | 3.3666 | 3.2635 | 10 | 89 | antigen processing and presentation of exogenous peptide antigen via MHC class II |
| GO:0002504 | 0.0023 | 3.1652 | 3.4468 | 10 | 94 | antigen processing and presentation of peptide or polysaccharide antigen via MHC class II |
| GO:0001514 | 0.0024 | 15.8402 | 0.2933 | 3 | 8 | selenocysteine incorporation |
| GO:0006573 | 0.0024 | 15.8402 | 0.2933 | 3 | 8 | valine metabolic process |
| GO:0043624 | 0.0025 | 2.1241 | 9.9739 | 20 | 272 | cellular protein complex disassembly |
| GO:0006930 | 0.0035 | 13.1993 | 0.33 | 3 | 9 | substrate-dependent cell migration, cell extension |
| GO:0070125 | 0.0036 | 3.1868 | 3.0802 | 9 | 84 | mitochondrial translational elongation |
| GO:0009233 | 0.0039 | 52.7225 | 0.11 | 2 | 3 | menaquinone metabolic process |
| GO:0033512 | 0.0039 | 52.7225 | 0.11 | 2 | 3 | L-lysine catabolic process to acetyl-CoA via saccharopine |
| GO:0044861 | 0.0039 | 52.7225 | 0.11 | 2 | 3 | protein transport into plasma membrane raft |
| GO:0060392 | 0.0039 | 52.7225 | 0.11 | 2 | 3 | negative regulation of SMAD protein import into nucleus |
| GO:0006520 | 0.0043 | 1.7526 | 17.9676 | 30 | 490 | cellular amino acid metabolic process |
| GO:0000422 | 0.0045 | 2.2116 | 7.6637 | 16 | 209 | mitophagy |
| GO:0006600 | 0.0049 | 11.3129 | 0.3667 | 3 | 10 | creatine metabolic process |
| GO:0036066 | 0.0065 | 9.8982 | 0.4034 | 3 | 11 | protein O-linked fucosylation |
| GO:0042347 | 0.0065 | 6.2178 | 0.77 | 4 | 21 | negative regulation of NF-kappaB import into nucleus |
| GO:0003011 | 0.0077 | 26.3595 | 0.1467 | 2 | 4 | involuntary skeletal muscle contraction |
| GO:0006549 | 0.0077 | 26.3595 | 0.1467 | 2 | 4 | isoleucine metabolic process |
| GO:0010572 | 0.0077 | 26.3595 | 0.1467 | 2 | 4 | positive regulation of platelet activation |
| GO:0019477 | 0.0077 | 26.3595 | 0.1467 | 2 | 4 | L-lysine catabolic process |
| GO:0032286 | 0.0077 | 26.3595 | 0.1467 | 2 | 4 | central nervous system myelin maintenance |
| GO:0036444 | 0.0077 | 26.3595 | 0.1467 | 2 | 4 | calcium ion transmembrane import into mitochondrion |
| GO:0046449 | 0.0077 | 26.3595 | 0.1467 | 2 | 4 | creatinine metabolic process |
| GO:0060335 | 0.0077 | 26.3595 | 0.1467 | 2 | 4 | positive regulation of interferon-gamma-mediated signaling pathway |
| GO:0019985 | 0.0079 | 3.7821 | 1.7601 | 6 | 48 | translesion synthesis |
| GO:0006878 | 0.0084 | 8.7978 | 0.44 | 3 | 12 | cellular copper ion homeostasis |
| GO:0009109 | 0.0084 | 8.7978 | 0.44 | 3 | 12 | coenzyme catabolic process |
| GO:0044710 | 0.0087 | 1.2376 | 193.8301 | 221 | 5286 | single-organism metabolic process |
| GO:0006807 | 0.0089 | 1.2292 | 234.9723 | 263 | 6408 | nitrogen compound metabolic process |
| GO:1903008 | 0.0093 | 2.0303 | 8.2871 | 16 | 226 | organelle disassembly |
| GO:0006040 | 0.0096 | 4.2657 | 1.3201 | 5 | 36 | amino sugar metabolic process |
| GOMFID | Pvalue | OddsRatio | ExpCount | Count | Size | Term |
| GO:0050860 | 1e-04 | 13.5621 | 0.5234 | 5 | 16 | negative regulation of T cell receptor signaling pathway |
| GO:0043981 | 5e-04 | 14.8919 | 0.3926 | 4 | 12 | histone H4-K5 acetylation |
| GO:0043982 | 5e-04 | 14.8919 | 0.3926 | 4 | 12 | histone H4-K8 acetylation |
| GO:0071211 | 0.0011 | Inf | 0.0654 | 2 | 2 | protein targeting to vacuole involved in autophagy |
| GO:0034310 | 0.0017 | 17.8388 | 0.2617 | 3 | 8 | primary alcohol catabolic process |
| GO:0048302 | 0.0017 | 17.8388 | 0.2617 | 3 | 8 | regulation of isotype switching to IgG isotypes |
| GO:0043409 | 0.0022 | 2.8144 | 4.5801 | 12 | 140 | negative regulation of MAPK cascade |
| GO:0043966 | 0.0027 | 4.1006 | 1.8975 | 7 | 58 | histone H3 acetylation |
| GO:0032423 | 0.0031 | 59.362 | 0.0981 | 2 | 3 | regulation of mismatch repair |
| GO:0043570 | 0.0061 | 29.6791 | 0.1309 | 2 | 4 | maintenance of DNA repeat elements |
| GO:0045077 | 0.0061 | 29.6791 | 0.1309 | 2 | 4 | negative regulation of interferon-gamma biosynthetic process |
| GO:0051790 | 0.0061 | 29.6791 | 0.1309 | 2 | 4 | short-chain fatty acid biosynthetic process |
| GO:0006069 | 0.0061 | 9.9078 | 0.3926 | 3 | 12 | ethanol oxidation |
| GO:0006744 | 0.0061 | 9.9078 | 0.3926 | 3 | 12 | ubiquinone biosynthetic process |
| GO:1904037 | 0.0071 | 5.9521 | 0.7852 | 4 | 24 | positive regulation of epithelial cell apoptotic process |
| GO:0006360 | 0.0089 | 3.6515 | 1.7993 | 6 | 55 | transcription from RNA polymerase I promoter |
| GO:0070830 | 0.0089 | 3.6515 | 1.7993 | 6 | 55 | bicellular tight junction assembly |
| GO:0050854 | 0.0094 | 4.2556 | 1.3086 | 5 | 40 | regulation of antigen receptor-mediated signaling pathway |
| GO:0006664 | 0.0095 | 2.6907 | 3.5659 | 9 | 109 | glycolipid metabolic process |
| GO:0034629 | 0.0096 | 5.4103 | 0.8506 | 4 | 26 | cellular protein complex localization |
| GO:0042487 | 0.0097 | 8.1053 | 0.458 | 3 | 14 | regulation of odontogenesis of dentin-containing tooth |
| GO:0006399 | 0.0098 | 2.2021 | 6.2158 | 13 | 190 | tRNA metabolic process |
| GOMFID | Pvalue | OddsRatio | ExpCount | Count | Size | Term |
| GO:0071704 | 4e-04 | 1.389 | 327.2934 | 363 | 10024 | organic substance metabolic process |
| GO:0044237 | 0.0011 | 1.3448 | 315.6044 | 349 | 9666 | cellular metabolic process |
| GO:0001189 | 0.0011 | Inf | 0.0653 | 2 | 2 | RNA polymerase I transcriptional preinitiation complex assembly at the promoter for the nuclear large rRNA transcript |
| GO:0045053 | 0.0011 | Inf | 0.0653 | 2 | 2 | protein retention in Golgi apparatus |
| GO:0044238 | 0.0024 | 1.3125 | 317.3675 | 348 | 9720 | primary metabolic process |
| GO:0007528 | 0.0026 | 4.8495 | 1.404 | 6 | 43 | neuromuscular junction development |
| GO:0061337 | 0.0026 | 2.8996 | 4.0814 | 11 | 125 | cardiac conduction |
| GO:0032507 | 0.0044 | 3.3415 | 2.6022 | 8 | 80 | maintenance of protein location in cell |
| GO:0001832 | 0.0061 | 6.2785 | 0.751 | 4 | 23 | blastocyst growth |
| GO:2001257 | 0.0061 | 3.1523 | 2.7427 | 8 | 84 | regulation of cation channel activity |
| GO:0042790 | 0.0061 | 9.928 | 0.3918 | 3 | 12 | transcription of nuclear large rRNA transcript from RNA polymerase I promoter |
| GO:0045636 | 0.0061 | 29.7392 | 0.1306 | 2 | 4 | positive regulation of melanocyte differentiation |
| GO:0061551 | 0.0061 | 29.7392 | 0.1306 | 2 | 4 | trigeminal ganglion development |
| GO:1903525 | 0.0061 | 29.7392 | 0.1306 | 2 | 4 | regulation of membrane tubulation |
| GO:0006888 | 0.0069 | 2.403 | 5.2895 | 12 | 162 | ER to Golgi vesicle-mediated transport |
| GO:0050435 | 0.0071 | 5.9642 | 0.7836 | 4 | 24 | beta-amyloid metabolic process |
| GO:0044710 | 0.0073 | 1.2601 | 172.5931 | 199 | 5286 | single-organism metabolic process |
| GO:0031103 | 0.0075 | 4.5233 | 1.2407 | 5 | 38 | axon regeneration |
| GO:0098781 | 0.0084 | 4.39 | 1.2734 | 5 | 39 | ncRNA transcription |
| GO:0032727 | 0.0096 | 8.1218 | 0.4571 | 3 | 14 | positive regulation of interferon-alpha production |
| GO:0048313 | 0.0096 | 8.1218 | 0.4571 | 3 | 14 | Golgi inheritance |
| GO:0045345 | 0.01 | 19.8248 | 0.1633 | 2 | 5 | positive regulation of MHC class I biosynthetic process |
| GOMFID | Pvalue | OddsRatio | ExpCount | Count | Size | Term |
| GO:0008088 | 6e-04 | 6.5099 | 1.0719 | 6 | 39 | axo-dendritic transport |
| GO:0048490 | 8e-04 | 11.8954 | 0.4398 | 4 | 16 | anterograde synaptic vesicle transport |
| GO:0099514 | 8e-04 | 11.8954 | 0.4398 | 4 | 16 | synaptic vesicle cytoskeletal transport |
| GO:0019218 | 0.0016 | 3.9869 | 2.1988 | 8 | 80 | regulation of steroid metabolic process |
| GO:0033692 | 0.0017 | 4.4794 | 1.7316 | 7 | 63 | cellular polysaccharide biosynthetic process |
| GO:0006862 | 0.0019 | 8.9192 | 0.5497 | 4 | 20 | nucleotide transport |
| GO:0048552 | 0.0021 | 15.2634 | 0.2749 | 3 | 10 | regulation of metalloenzyme activity |
| GO:0051085 | 0.0021 | 15.2634 | 0.2749 | 3 | 10 | chaperone mediated protein folding requiring cofactor |
| GO:0047496 | 0.0022 | 6.1604 | 0.9345 | 5 | 34 | vesicle transport along microtubule |
| GO:2000188 | 0.0029 | 13.3546 | 0.3023 | 3 | 11 | regulation of cholesterol homeostasis |
| GO:0044723 | 0.0035 | 1.704 | 21.6311 | 35 | 787 | single-organism carbohydrate metabolic process |
| GO:0046476 | 0.0044 | 35.5431 | 0.1099 | 2 | 4 | glycosylceramide biosynthetic process |
| GO:0061732 | 0.0044 | 35.5431 | 0.1099 | 2 | 4 | mitochondrial acetyl-CoA biosynthetic process from pyruvate |
| GO:1901563 | 0.0044 | 35.5431 | 0.1099 | 2 | 4 | response to camptothecin |
| GO:0001675 | 0.006 | 9.7105 | 0.3848 | 3 | 14 | acrosome assembly |
| GO:0032259 | 0.0066 | 2.0078 | 9.4 | 18 | 342 | methylation |
| GO:0032482 | 0.0071 | 23.6939 | 0.1374 | 2 | 5 | Rab protein signal transduction |
| GO:0018279 | 0.0075 | 2.2022 | 6.679 | 14 | 243 | protein N-linked glycosylation via asparagine |
| GO:0090114 | 0.0075 | 3.763 | 1.7316 | 6 | 63 | COPII-coated vesicle budding |
| GO:0000381 | 0.0078 | 5.7049 | 0.7971 | 4 | 29 | regulation of alternative mRNA splicing, via spliceosome |
| GO:0006306 | 0.0078 | 3.2962 | 2.2813 | 7 | 83 | DNA methylation |
| GO:0051641 | 0.0081 | 1.3405 | 78.9933 | 99 | 2874 | cellular localization |
| GO:0046907 | 0.0084 | 1.4131 | 49.3639 | 66 | 1796 | intracellular transport |
| GO:0005976 | 0.0088 | 2.9241 | 2.9135 | 8 | 106 | polysaccharide metabolic process |
| GO:0006486 | 0.0095 | 1.859 | 11.2416 | 20 | 409 | protein glycosylation |
| GO:0009066 | 0.0099 | 4.1508 | 1.3193 | 5 | 48 | aspartate family amino acid metabolic process |
| GOMFID | Pvalue | OddsRatio | ExpCount | Count | Size | Term |
| GO:0006655 | 5e-04 | 14.2157 | 0.3971 | 4 | 13 | phosphatidylglycerol biosynthetic process |
| GO:0007567 | 0.0023 | 8.526 | 0.5804 | 4 | 19 | parturition |
| GO:0046078 | 0.0027 | 63.7358 | 0.0916 | 2 | 3 | dUMP metabolic process |
| GO:0061182 | 0.0027 | 63.7358 | 0.0916 | 2 | 3 | negative regulation of chondrocyte development |
| GO:0071705 | 0.0028 | 1.7036 | 22.8793 | 37 | 749 | nitrogen compound transport |
| GO:0009223 | 0.0039 | 11.9701 | 0.336 | 3 | 11 | pyrimidine deoxyribonucleotide catabolic process |
| GO:0032259 | 0.0043 | 2.0136 | 10.4469 | 20 | 342 | methylation |
| GO:0051046 | 0.0044 | 1.703 | 20.344 | 33 | 666 | regulation of secretion |
| GO:0043044 | 0.005 | 3.6215 | 2.1077 | 7 | 69 | ATP-dependent chromatin remodeling |
| GO:0044058 | 0.0051 | 5.0007 | 1.1302 | 5 | 37 | regulation of digestive system process |
| GO:0051966 | 0.0051 | 5.0007 | 1.1302 | 5 | 37 | regulation of synaptic transmission, glutamatergic |
| GO:0035627 | 0.0054 | 31.8658 | 0.1222 | 2 | 4 | ceramide transport |
| GO:0046292 | 0.0054 | 31.8658 | 0.1222 | 2 | 4 | formaldehyde metabolic process |
| GO:1900158 | 0.0054 | 31.8658 | 0.1222 | 2 | 4 | negative regulation of bone mineralization involved in bone maturation |
| GO:2000852 | 0.0054 | 31.8658 | 0.1222 | 2 | 4 | regulation of corticosterone secretion |
| GO:0023061 | 0.006 | 1.8569 | 12.9823 | 23 | 425 | signal release |
| GO:0006807 | 0.006 | 1.27 | 195.7421 | 223 | 6408 | nitrogen compound metabolic process |
| GO:0016042 | 0.0068 | 2.0504 | 8.7058 | 17 | 285 | lipid catabolic process |
| GO:0035774 | 0.0075 | 5.8105 | 0.7942 | 4 | 26 | positive regulation of insulin secretion involved in cellular response to glucose stimulus |
| GO:0034389 | 0.008 | 8.7038 | 0.4277 | 3 | 14 | lipid particle organization |
| GO:1903010 | 0.008 | 8.7038 | 0.4277 | 3 | 14 | regulation of bone development |
| GO:0009448 | 0.0088 | 21.2425 | 0.1527 | 2 | 5 | gamma-aminobutyric acid metabolic process |
| GO:0010841 | 0.0088 | 21.2425 | 0.1527 | 2 | 5 | positive regulation of circadian sleep/wake cycle, wakefulness |
| GO:0044791 | 0.0088 | 21.2425 | 0.1527 | 2 | 5 | positive regulation by host of viral release from host cell |
| GO:1901026 | 0.0088 | 21.2425 | 0.1527 | 2 | 5 | ripoptosome assembly involved in necroptotic process |
| GO:0050886 | 0.0091 | 3.2059 | 2.3521 | 7 | 77 | endocrine process |
| GO:0018146 | 0.0098 | 5.3256 | 0.8553 | 4 | 28 | keratan sulfate biosynthetic process |
| GOMFID | Pvalue | OddsRatio | ExpCount | Count | Size | Term |
| GO:0044085 | 1e-04 | 1.4943 | 92.9244 | 127 | 2508 | cellular component biogenesis |
| GO:0031339 | 5e-04 | 39.1817 | 0.1853 | 3 | 5 | negative regulation of vesicle fusion |
| GO:0032688 | 5e-04 | 14.9473 | 0.4076 | 4 | 11 | negative regulation of interferon-beta production |
| GO:0006501 | 7e-04 | 6.5548 | 1.1115 | 6 | 30 | C-terminal protein lipidation |
| GO:0006506 | 0.001 | 6.0498 | 1.1856 | 6 | 32 | GPI anchor biosynthetic process |
| GO:0051017 | 0.0012 | 3.041 | 4.2979 | 12 | 116 | actin filament bundle assembly |
| GO:0010041 | 0.0014 | Inf | 0.0741 | 2 | 2 | response to iron(III) ion |
| GO:0060017 | 0.0016 | 19.5882 | 0.2594 | 3 | 7 | parathyroid gland development |
| GO:0071822 | 0.0032 | 1.4087 | 65.3954 | 87 | 1765 | protein complex subunit organization |
| GO:0033554 | 0.0035 | 1.3942 | 69.1376 | 91 | 1866 | cellular response to stress |
| GO:0006203 | 0.004 | 52.1554 | 0.1112 | 2 | 3 | dGTP catabolic process |
| GO:0009106 | 0.004 | 52.1554 | 0.1112 | 2 | 3 | lipoate metabolic process |
| GO:0010266 | 0.004 | 52.1554 | 0.1112 | 2 | 3 | response to vitamin B1 |
| GO:0046061 | 0.004 | 52.1554 | 0.1112 | 2 | 3 | dATP catabolic process |
| GO:0008630 | 0.0045 | 2.8569 | 3.7792 | 10 | 102 | intrinsic apoptotic signaling pathway in response to DNA damage |
| GO:0002429 | 0.0045 | 1.9705 | 11.2265 | 21 | 303 | immune response-activating cell surface receptor signaling pathway |
| GO:0045010 | 0.0048 | 4.2481 | 1.5932 | 6 | 43 | actin nucleation |
| GO:0051726 | 0.0048 | 1.5087 | 36.866 | 53 | 995 | regulation of cell cycle |
| GO:0009215 | 0.005 | 11.1911 | 0.3705 | 3 | 10 | purine deoxyribonucleoside triphosphate metabolic process |
| GO:0051607 | 0.0051 | 1.9155 | 12.0787 | 22 | 326 | defense response to virus |
| GO:0009987 | 0.0053 | 1.5458 | 527.8315 | 545 | 14246 | cellular process |
| GO:0065003 | 0.0057 | 1.4017 | 57.0589 | 76 | 1540 | macromolecular complex assembly |
| GO:0022402 | 0.006 | 1.4421 | 45.8519 | 63 | 1243 | cell cycle process |
| GO:0007264 | 0.0064 | 1.521 | 32.3457 | 47 | 873 | small GTPase mediated signal transduction |
| GO:0060252 | 0.0067 | 9.7915 | 0.4076 | 3 | 11 | positive regulation of glial cell proliferation |
| GO:0033209 | 0.007 | 2.3122 | 5.9652 | 13 | 161 | tumor necrosis factor-mediated signaling pathway |
| GO:0030036 | 0.0071 | 1.67 | 19.4148 | 31 | 524 | actin cytoskeleton organization |
| GO:0007079 | 0.0078 | 26.076 | 0.1482 | 2 | 4 | mitotic chromosome movement towards spindle pole |
| GO:0008295 | 0.0078 | 26.076 | 0.1482 | 2 | 4 | spermidine biosynthetic process |
| GO:0061051 | 0.0078 | 26.076 | 0.1482 | 2 | 4 | positive regulation of cell growth involved in cardiac muscle cell development |
| GO:0071284 | 0.0078 | 26.076 | 0.1482 | 2 | 4 | cellular response to lead ion |
| GO:0006595 | 0.0081 | 2.9978 | 2.89 | 8 | 78 | polyamine metabolic process |
| GO:1901990 | 0.0086 | 1.9547 | 9.6704 | 18 | 261 | regulation of mitotic cell cycle phase transition |
| GO:0051382 | 0.0087 | 8.703 | 0.4446 | 3 | 12 | kinetochore assembly |
| GO:1902991 | 0.0087 | 8.703 | 0.4446 | 3 | 12 | regulation of amyloid precursor protein catabolic process |
| GO:0042158 | 0.0088 | 2.9553 | 2.927 | 8 | 79 | lipoprotein biosynthetic process |
| GOMFID | Pvalue | OddsRatio | ExpCount | Count | Size | Term |
| GO:0002323 | 6e-04 | 11.8255 | 0.3922 | 4 | 30 | natural killer cell activation involved in immune response |
| GO:0022617 | 0.0016 | 4.4129 | 1.6995 | 7 | 130 | extracellular matrix disassembly |
| GO:0033141 | 0.0025 | 12.7541 | 0.2745 | 3 | 21 | positive regulation of peptidyl-serine phosphorylation of STAT protein |
| GO:0044117 | 0.0025 | 12.7541 | 0.2745 | 3 | 21 | growth of symbiont in host |
| GO:0046113 | 0.0025 | 38.1084 | 0.0784 | 2 | 6 | nucleobase catabolic process |
| GO:0044110 | 0.0028 | 12.0821 | 0.2876 | 3 | 22 | growth involved in symbiotic interaction |
| GO:0030574 | 0.0032 | 5.4243 | 0.9936 | 5 | 76 | collagen catabolic process |
| GO:0000724 | 0.0032 | 3.8727 | 1.9218 | 7 | 147 | double-strand break repair via homologous recombination |
| GO:0043330 | 0.0033 | 7.1424 | 0.6144 | 4 | 47 | response to exogenous dsRNA |
| GO:0042148 | 0.0034 | 30.4847 | 0.0915 | 2 | 7 | strand invasion |
| GO:0010389 | 0.0044 | 6.5329 | 0.6667 | 4 | 51 | regulation of G2/M transition of mitotic cell cycle |
| GO:0000730 | 0.0045 | 25.4023 | 0.1046 | 2 | 8 | DNA recombinase assembly |
| GO:0042100 | 0.0054 | 4.7515 | 1.1243 | 5 | 86 | B cell proliferation |
| GO:0044259 | 0.0058 | 3.9242 | 1.6211 | 6 | 124 | multicellular organismal macromolecule metabolic process |
| GO:0071985 | 0.0071 | 19.0493 | 0.1307 | 2 | 10 | multivesicular body sorting pathway |
| GOMFID | Pvalue | OddsRatio | ExpCount | Count | Size | Term |
| GO:0014736 | 0.001 | Inf | 0.064 | 2 | 2 | negative regulation of muscle atrophy |
| GO:0010634 | 0.0012 | 3.4855 | 3.1373 | 10 | 98 | positive regulation of epithelial cell migration |
| GO:0034080 | 0.0012 | 5.7259 | 1.2165 | 6 | 38 | CENP-A containing nucleosome assembly |
| GO:0043044 | 0.0016 | 4.0135 | 2.2089 | 8 | 69 | ATP-dependent chromatin remodeling |
| GO:0022904 | 0.0017 | 3.069 | 3.8736 | 11 | 121 | respiratory electron transport chain |
| GO:0007005 | 0.0018 | 1.7355 | 23.1136 | 38 | 722 | mitochondrion organization |
| GO:0007015 | 0.0019 | 2.1841 | 9.7 | 20 | 303 | actin filament organization |
| GO:0009060 | 0.0024 | 4.1947 | 1.8568 | 7 | 58 | aerobic respiration |
| GO:0043603 | 0.0026 | 1.6235 | 29.2281 | 45 | 913 | cellular amide metabolic process |
| GO:0051304 | 0.0032 | 3.5463 | 2.465 | 8 | 77 | chromosome separation |
| GO:1902589 | 0.0038 | 1.3704 | 80.3213 | 103 | 2509 | single-organism organelle organization |
| GO:0034724 | 0.0041 | 4.3597 | 1.5366 | 6 | 48 | DNA replication-independent nucleosome organization |
| GO:0009396 | 0.0044 | 11.4011 | 0.3521 | 3 | 11 | folic acid-containing compound biosynthetic process |
| GO:0001510 | 0.0045 | 4.2581 | 1.5686 | 6 | 49 | RNA methylation |
| GO:0070125 | 0.0054 | 3.2182 | 2.6891 | 8 | 84 | mitochondrial translational elongation |
| GO:0031646 | 0.0057 | 6.4088 | 0.7363 | 4 | 23 | positive regulation of neurological system process |
| GO:0048549 | 0.0059 | 30.354 | 0.1281 | 2 | 4 | positive regulation of pinocytosis |
| GO:2000852 | 0.0059 | 30.354 | 0.1281 | 2 | 4 | regulation of corticosterone secretion |
| GO:0045765 | 0.0066 | 2.2393 | 6.5947 | 14 | 206 | regulation of angiogenesis |
| GO:0010942 | 0.0067 | 1.6777 | 19.336 | 31 | 604 | positive regulation of cell death |
| GO:0034643 | 0.0073 | 9.1196 | 0.4162 | 3 | 13 | establishment of mitochondrion localization, microtubule-mediated |
| GO:0007160 | 0.0083 | 2.2533 | 6.0825 | 13 | 190 | cell-matrix adhesion |
| GO:0071482 | 0.0083 | 2.7528 | 3.4894 | 9 | 109 | cellular response to light stimulus |
| GO:0035930 | 0.0091 | 8.29 | 0.4482 | 3 | 14 | corticosteroid hormone secretion |
| GO:0019896 | 0.0096 | 20.2347 | 0.1601 | 2 | 5 | axon transport of mitochondrion |
| GO:0051902 | 0.0096 | 20.2347 | 0.1601 | 2 | 5 | negative regulation of mitochondrial depolarization |
| GO:0061087 | 0.0096 | 20.2347 | 0.1601 | 2 | 5 | positive regulation of histone H3-K27 methylation |
| GO:0070278 | 0.0096 | 20.2347 | 0.1601 | 2 | 5 | extracellular matrix constituent secretion |
| GO:0002495 | 0.0099 | 2.8757 | 2.9772 | 8 | 93 | antigen processing and presentation of peptide antigen via MHC class II |
| GOMFID | Pvalue | OddsRatio | ExpCount | Count | Size | Term |
| GO:0090150 | 2e-04 | 2.3186 | 12.0283 | 26 | 348 | establishment of protein localization to membrane |
| GO:0071704 | 2e-04 | 1.3992 | 346.4708 | 385 | 10024 | organic substance metabolic process |
| GO:0070885 | 4e-04 | 42.1252 | 0.1728 | 3 | 5 | negative regulation of calcineurin-NFAT signaling cascade |
| GO:0051952 | 6e-04 | 4.2436 | 2.3849 | 9 | 69 | regulation of amine transport |
| GO:0044238 | 6e-04 | 1.3556 | 335.9633 | 372 | 9720 | primary metabolic process |
| GO:2000653 | 8e-04 | 28.0816 | 0.2074 | 3 | 6 | regulation of genetic imprinting |
| GO:0010983 | 0.0012 | Inf | 0.0691 | 2 | 2 | positive regulation of high-density lipoprotein particle clearance |
| GO:0051966 | 0.0015 | 5.4555 | 1.2789 | 6 | 37 | regulation of synaptic transmission, glutamatergic |
| GO:0033120 | 0.0017 | 6.703 | 0.8987 | 5 | 26 | positive regulation of RNA splicing |
| GO:0001516 | 0.0025 | 6.1193 | 0.9678 | 5 | 28 | prostaglandin biosynthetic process |
| GO:1902589 | 0.0029 | 1.3684 | 86.7214 | 111 | 2509 | single-organism organelle organization |
| GO:1903209 | 0.003 | 14.038 | 0.3111 | 3 | 9 | positive regulation of oxidative stress-induced cell death |
| GO:0030534 | 0.0034 | 2.6552 | 4.839 | 12 | 140 | adult behavior |
| GO:0008610 | 0.0034 | 1.7053 | 21.568 | 35 | 624 | lipid biosynthetic process |
| GO:0010751 | 0.0035 | 56.0667 | 0.1037 | 2 | 3 | negative regulation of nitric oxide mediated signal transduction |
| GO:1903378 | 0.0035 | 56.0667 | 0.1037 | 2 | 3 | positive regulation of oxidative stress-induced neuron intrinsic apoptotic signaling pathway |
| GO:0009749 | 0.0036 | 2.4211 | 6.1524 | 14 | 178 | response to glucose |
| GO:0044070 | 0.0038 | 2.7546 | 4.286 | 11 | 124 | regulation of anion transport |
| GO:0006600 | 0.0041 | 12.0318 | 0.3456 | 3 | 10 | creatine metabolic process |
| GO:0042747 | 0.0041 | 12.0318 | 0.3456 | 3 | 10 | circadian sleep/wake cycle, REM sleep |
| GO:0007346 | 0.0042 | 1.7946 | 16.3834 | 28 | 474 | regulation of mitotic cell cycle |
| GO:0001890 | 0.0045 | 2.5546 | 5.0118 | 12 | 145 | placenta development |
| GO:0051186 | 0.0046 | 1.9345 | 11.9592 | 22 | 346 | cofactor metabolic process |
| GO:0034394 | 0.0048 | 4.2255 | 1.5899 | 6 | 46 | protein localization to cell surface |
| GO:0051641 | 0.0052 | 1.3219 | 99.3373 | 123 | 2874 | cellular localization |
| GO:0046697 | 0.0053 | 6.6136 | 0.7258 | 4 | 21 | decidualization |
| GO:0051588 | 0.0054 | 3.5884 | 2.143 | 7 | 62 | regulation of neurotransmitter transport |
| GO:0036475 | 0.0055 | 10.5271 | 0.3802 | 3 | 11 | neuron death in response to oxidative stress |
| GO:0042761 | 0.0055 | 10.5271 | 0.3802 | 3 | 11 | very long-chain fatty acid biosynthetic process |
| GO:1902884 | 0.0055 | 10.5271 | 0.3802 | 3 | 11 | positive regulation of response to oxidative stress |
| GO:0006692 | 0.0059 | 4.8513 | 1.1752 | 5 | 34 | prostanoid metabolic process |
| GO:0001676 | 0.0059 | 2.9214 | 3.3182 | 9 | 96 | long-chain fatty acid metabolic process |
| GO:0034284 | 0.0064 | 2.2542 | 6.5672 | 14 | 190 | response to monosaccharide |
| GO:0032663 | 0.0066 | 3.9299 | 1.6936 | 6 | 49 | regulation of interleukin-2 production |
| GO:0010647 | 0.0066 | 1.4054 | 53.92 | 72 | 1560 | positive regulation of cell communication |
| GO:0051130 | 0.0068 | 1.48 | 37.5366 | 53 | 1086 | positive regulation of cellular component organization |
| GO:0006769 | 0.0068 | 28.0315 | 0.1383 | 2 | 4 | nicotinamide metabolic process |
| GO:0010716 | 0.0068 | 28.0315 | 0.1383 | 2 | 4 | negative regulation of extracellular matrix disassembly |
| GO:0030886 | 0.0068 | 28.0315 | 0.1383 | 2 | 4 | negative regulation of myeloid dendritic cell activation |
| GO:0034626 | 0.0068 | 28.0315 | 0.1383 | 2 | 4 | fatty acid elongation, polyunsaturated fatty acid |
| GO:0051790 | 0.0068 | 28.0315 | 0.1383 | 2 | 4 | short-chain fatty acid biosynthetic process |
| GO:0072108 | 0.0068 | 28.0315 | 0.1383 | 2 | 4 | positive regulation of mesenchymal to epithelial transition involved in metanephros morphogenesis |
| GO:1902534 | 0.0068 | 28.0315 | 0.1383 | 2 | 4 | single-organism membrane invagination |
| GO:0008104 | 0.0069 | 1.337 | 80.0159 | 101 | 2315 | protein localization |
| GO:0006636 | 0.007 | 3.4021 | 2.2467 | 7 | 65 | unsaturated fatty acid biosynthetic process |
| GO:0009615 | 0.007 | 1.8044 | 13.9293 | 24 | 403 | response to virus |
| GO:0023056 | 0.0071 | 1.4028 | 53.2287 | 71 | 1540 | positive regulation of signaling |
| GO:0030497 | 0.0072 | 9.3568 | 0.4148 | 3 | 12 | fatty acid elongation |
| GO:0071397 | 0.0072 | 9.3568 | 0.4148 | 3 | 12 | cellular response to cholesterol |
| GO:0060384 | 0.0074 | 5.9167 | 0.795 | 4 | 23 | innervation |
| GO:0006006 | 0.0082 | 2.1153 | 7.4659 | 15 | 216 | glucose metabolic process |
| GO:0006779 | 0.0087 | 5.6204 | 0.8295 | 4 | 24 | porphyrin-containing compound biosynthetic process |
| GO:0044802 | 0.0089 | 1.5184 | 29.5886 | 43 | 859 | single-organism membrane organization |
| GO:0048172 | 0.0091 | 8.4206 | 0.4493 | 3 | 13 | regulation of short-term neuronal synaptic plasticity |
| GO:0030431 | 0.0095 | 4.2622 | 1.3134 | 5 | 38 | sleep |
| GO:0016525 | 0.0096 | 3.1818 | 2.3849 | 7 | 69 | negative regulation of angiogenesis |
| GO:0007049 | 0.0098 | 1.3639 | 59.312 | 77 | 1716 | cell cycle |
| GOMFID | Pvalue | OddsRatio | ExpCount | Count | Size | Term |
| GO:0050893 | 0.0014 | 89.9531 | 0.0656 | 2 | 3 | sensory processing |
| GO:1900226 | 0.0014 | 89.9531 | 0.0656 | 2 | 3 | negative regulation of NLRP3 inflammasome complex assembly |
| GO:0032691 | 0.0025 | 13.5247 | 0.2844 | 3 | 13 | negative regulation of interleukin-1 beta production |
| GO:2000619 | 0.0028 | 44.9736 | 0.0875 | 2 | 4 | negative regulation of histone H4-K16 acetylation |
| GO:0032682 | 0.0039 | 11.2691 | 0.3281 | 3 | 15 | negative regulation of chemokine production |
| GO:0021603 | 0.0046 | 29.9804 | 0.1094 | 2 | 5 | cranial nerve formation |
| GO:0060754 | 0.0046 | 29.9804 | 0.1094 | 2 | 5 | positive regulation of mast cell chemotaxis |
| GO:0034220 | 0.0055 | 1.6799 | 20.7143 | 33 | 947 | ion transmembrane transport |
| GO:0001824 | 0.0056 | 3.9981 | 1.6186 | 6 | 74 | blastocyst development |
| GO:0006545 | 0.0068 | 22.4839 | 0.1312 | 2 | 6 | glycine biosynthetic process |
| GO:0032020 | 0.0068 | 22.4839 | 0.1312 | 2 | 6 | ISG15-protein conjugation |
| GO:0046654 | 0.0068 | 22.4839 | 0.1312 | 2 | 6 | tetrahydrofolate biosynthetic process |
| GO:2001204 | 0.0068 | 22.4839 | 0.1312 | 2 | 6 | regulation of osteoclast development |
| GO:0050427 | 0.0078 | 8.4496 | 0.4156 | 3 | 19 | 3'-phosphoadenosine 5'-phosphosulfate metabolic process |
| GO:0060119 | 0.0084 | 5.4724 | 0.8093 | 4 | 37 | inner ear receptor cell development |
| GO:2001300 | 0.0093 | 17.9859 | 0.1531 | 2 | 7 | lipoxin metabolic process |
| GO:0007584 | 0.0098 | 2.5007 | 4.1997 | 10 | 192 | response to nutrient |
| GOMFID | Pvalue | OddsRatio | ExpCount | Count | Size | Term |
| GO:0046483 | 8e-04 | 1.3688 | 157.4981 | 190 | 5464 | heterocycle metabolic process |
| GO:0000105 | 8e-04 | Inf | 0.0576 | 2 | 2 | histidine biosynthetic process |
| GO:0070537 | 8e-04 | Inf | 0.0576 | 2 | 2 | histone H2A K63-linked deubiquitination |
| GO:0006725 | 9e-04 | 1.3617 | 158.017 | 190 | 5482 | cellular aromatic compound metabolic process |
| GO:0034587 | 0.0013 | 7.0866 | 0.8359 | 5 | 29 | piRNA metabolic process |
| GO:1901360 | 0.0014 | 1.3422 | 164.1566 | 195 | 5695 | organic cyclic compound metabolic process |
| GO:0042149 | 0.0018 | 6.5406 | 0.8936 | 5 | 31 | cellular response to glucose starvation |
| GO:0034641 | 0.0018 | 1.33 | 176.4936 | 207 | 6123 | cellular nitrogen compound metabolic process |
| GO:0016070 | 0.0023 | 1.346 | 122.6491 | 150 | 4255 | RNA metabolic process |
| GO:0030259 | 0.0024 | 67.68 | 0.0865 | 2 | 3 | lipid glycosylation |
| GO:0070837 | 0.0024 | 67.68 | 0.0865 | 2 | 3 | dehydroascorbic acid transport |
| GO:0097694 | 0.0024 | 67.68 | 0.0865 | 2 | 3 | establishment of RNA localization to telomere |
| GO:0097695 | 0.0024 | 67.68 | 0.0865 | 2 | 3 | establishment of macromolecular complex localization to telomere |
| GO:0034654 | 0.0029 | 1.3428 | 114.8664 | 141 | 3985 | nucleobase-containing compound biosynthetic process |
| GO:0006541 | 0.0033 | 7.5451 | 0.6341 | 4 | 22 | glutamine metabolic process |
| GO:1901576 | 0.0033 | 1.3068 | 168.7686 | 197 | 5855 | organic substance biosynthetic process |
| GO:0043623 | 0.0048 | 1.8426 | 14.2394 | 25 | 494 | cellular protein complex assembly |
| GO:0009256 | 0.0048 | 33.8378 | 0.1153 | 2 | 4 | 10-formyltetrahydrofolate metabolic process |
| GO:0034502 | 0.0049 | 4.1677 | 1.5854 | 6 | 55 | protein localization to chromosome |
| GO:0006397 | 0.0053 | 1.9065 | 12.1064 | 22 | 420 | mRNA processing |
| GO:0002295 | 0.0055 | 10.1686 | 0.3747 | 3 | 13 | T-helper cell lineage commitment |
| GO:0045589 | 0.0055 | 10.1686 | 0.3747 | 3 | 13 | regulation of regulatory T cell differentiation |
| GO:0010468 | 0.0065 | 1.3057 | 115.4141 | 139 | 4004 | regulation of gene expression |
| GO:0008380 | 0.0068 | 1.9629 | 10.1463 | 19 | 352 | RNA splicing |
| GO:0002363 | 0.0068 | 9.2436 | 0.4035 | 3 | 14 | alpha-beta T cell lineage commitment |
| GO:0045655 | 0.0068 | 9.2436 | 0.4035 | 3 | 14 | regulation of monocyte differentiation |
| GO:0072539 | 0.0068 | 9.2436 | 0.4035 | 3 | 14 | T-helper 17 cell differentiation |
| GO:2001141 | 0.0075 | 1.3176 | 96.2168 | 118 | 3338 | regulation of RNA biosynthetic process |
| GO:2000328 | 0.0078 | 22.557 | 0.1441 | 2 | 5 | regulation of T-helper 17 cell lineage commitment |
| GO:0030866 | 0.0081 | 5.6566 | 0.8071 | 4 | 28 | cortical actin cytoskeleton organization |
| GO:0043369 | 0.0084 | 8.4727 | 0.4324 | 3 | 15 | CD4-positive or CD8-positive, alpha-beta T cell lineage commitment |
| GO:0019219 | 0.0088 | 1.2971 | 107.9485 | 130 | 3745 | regulation of nucleobase-containing compound metabolic process |
| GO:0048701 | 0.0092 | 4.2475 | 1.2971 | 5 | 45 | embryonic cranial skeleton morphogenesis |
| GO:0034645 | 0.0095 | 1.2732 | 136.6867 | 160 | 4742 | cellular macromolecule biosynthetic process |
| GOMFID | Pvalue | OddsRatio | ExpCount | Count | Size | Term |
| GO:0034641 | 2e-04 | 1.399 | 188.5982 | 227 | 6123 | cellular nitrogen compound metabolic process |
| GO:0006681 | 3e-04 | 47.4875 | 0.154 | 3 | 5 | galactosylceramide metabolic process |
| GO:0070986 | 5e-04 | 14.0932 | 0.4004 | 4 | 13 | left/right axis specification |
| GO:0046483 | 5e-04 | 1.3694 | 168.3 | 203 | 5464 | heterocycle metabolic process |
| GO:1901360 | 6e-04 | 1.3622 | 175.4152 | 210 | 5695 | organic cyclic compound metabolic process |
| GO:0006687 | 8e-04 | 4.4738 | 2.0021 | 8 | 65 | glycosphingolipid metabolic process |
| GO:0006725 | 9e-04 | 1.3503 | 168.8544 | 202 | 5482 | cellular aromatic compound metabolic process |
| GO:0006678 | 9e-04 | 23.7406 | 0.2156 | 3 | 7 | glucosylceramide metabolic process |
| GO:1901576 | 0.0012 | 1.3362 | 180.3434 | 213 | 5855 | organic substance biosynthetic process |
| GO:0042559 | 0.0012 | 10.5678 | 0.4928 | 4 | 16 | pteridine-containing compound biosynthetic process |
| GO:1901605 | 0.0013 | 2.2139 | 10.0643 | 21 | 328 | alpha-amino acid metabolic process |
| GO:0040016 | 0.0014 | 18.9913 | 0.2464 | 3 | 8 | embryonic cleavage |
| GO:0006612 | 0.0015 | 2.6706 | 5.6059 | 14 | 182 | protein targeting to membrane |
| GO:0006396 | 0.0016 | 1.7359 | 23.748 | 39 | 771 | RNA processing |
| GO:0044281 | 0.0017 | 1.4166 | 78.3593 | 103 | 2544 | small molecule metabolic process |
| GO:0044033 | 0.0018 | 2.5183 | 6.3451 | 15 | 206 | multi-organism metabolic process |
| GO:0022607 | 0.0019 | 1.4253 | 71.5521 | 95 | 2323 | cellular component assembly |
| GO:0051289 | 0.0022 | 4.2834 | 1.8173 | 7 | 59 | protein homotetramerization |
| GO:1903509 | 0.0022 | 3.1602 | 3.419 | 10 | 111 | liposaccharide metabolic process |
| GO:0044764 | 0.0023 | 1.6993 | 24.2101 | 39 | 786 | multi-organism cellular process |
| GO:0070884 | 0.0024 | 8.4526 | 0.5852 | 4 | 19 | regulation of calcineurin-NFAT signaling cascade |
| GO:0071840 | 0.0026 | 1.3046 | 182.9615 | 213 | 5940 | cellular component organization or biogenesis |
| GO:0034654 | 0.0026 | 1.3347 | 122.7444 | 150 | 3985 | nucleobase-containing compound biosynthetic process |
| GO:0033489 | 0.0028 | 63.1892 | 0.0924 | 2 | 3 | cholesterol biosynthetic process via desmosterol |
| GO:0033490 | 0.0028 | 63.1892 | 0.0924 | 2 | 3 | cholesterol biosynthetic process via lathosterol |
| GO:1900368 | 0.0028 | 63.1892 | 0.0924 | 2 | 3 | regulation of RNA interference |
| GO:0014068 | 0.0029 | 4.0489 | 1.9097 | 7 | 62 | positive regulation of phosphatidylinositol 3-kinase signaling |
| GO:0006672 | 0.0032 | 3.5382 | 2.4641 | 8 | 80 | ceramide metabolic process |
| GO:0034645 | 0.0032 | 1.3104 | 146.0612 | 174 | 4742 | cellular macromolecule biosynthetic process |
| GO:0007398 | 0.0035 | 7.4572 | 0.6468 | 4 | 21 | ectoderm development |
| GO:0043405 | 0.0037 | 1.8837 | 13.9531 | 25 | 453 | regulation of MAP kinase activity |
| GO:0044403 | 0.0039 | 1.6414 | 24.9801 | 39 | 811 | symbiosis, encompassing mutualism through parasitism |
| GO:0032984 | 0.0041 | 2.0687 | 9.6717 | 19 | 314 | macromolecular complex disassembly |
| GO:0090304 | 0.0041 | 1.3003 | 145.9072 | 173 | 4737 | nucleic acid metabolic process |
| GO:0019058 | 0.0044 | 1.8812 | 13.3987 | 24 | 435 | viral life cycle |
| GO:0060759 | 0.0045 | 2.6804 | 4.3738 | 11 | 142 | regulation of response to cytokine stimulus |
| GO:0045859 | 0.0048 | 1.6102 | 26.089 | 40 | 847 | regulation of protein kinase activity |
| GO:0019083 | 0.0049 | 2.4164 | 5.6983 | 13 | 185 | viral transcription |
| GO:0009719 | 0.0049 | 1.4287 | 53.3484 | 72 | 1732 | response to endogenous stimulus |
| GO:0090183 | 0.0051 | 4.1433 | 1.6017 | 6 | 52 | regulation of kidney development |
| GO:0046021 | 0.0055 | 31.5925 | 0.1232 | 2 | 4 | regulation of transcription from RNA polymerase II promoter, mitotic |
| GO:0022618 | 0.0056 | 2.3745 | 5.7907 | 13 | 188 | ribonucleoprotein complex assembly |
| GO:0016071 | 0.006 | 1.7244 | 17.6155 | 29 | 575 | mRNA metabolic process |
| GO:0006928 | 0.0062 | 1.3984 | 58.2766 | 77 | 1892 | movement of cell or subcellular component |
| GO:0072080 | 0.0065 | 3.1047 | 2.7721 | 8 | 90 | nephron tubule development |
| GO:0016556 | 0.0066 | 9.4925 | 0.4004 | 3 | 13 | mRNA modification |
| GO:0030325 | 0.0067 | 6.0352 | 0.77 | 4 | 25 | adrenal gland development |
| GO:0033002 | 0.0068 | 2.5248 | 4.6202 | 11 | 150 | muscle cell proliferation |
| GO:0006996 | 0.0075 | 1.302 | 107.2204 | 130 | 3481 | organelle organization |
| GO:0032835 | 0.008 | 3.7358 | 1.7557 | 6 | 57 | glomerulus development |
| GO:0043508 | 0.0082 | 8.629 | 0.4312 | 3 | 14 | negative regulation of JUN kinase activity |
| GO:0072028 | 0.0082 | 3.2721 | 2.3101 | 7 | 75 | nephron morphogenesis |
| GO:0002507 | 0.0089 | 5.5097 | 0.8316 | 4 | 27 | tolerance induction |
| GO:0046416 | 0.0089 | 21.0603 | 0.154 | 2 | 5 | D-amino acid metabolic process |
| GO:0046477 | 0.0089 | 21.0603 | 0.154 | 2 | 5 | glycosylceramide catabolic process |
| GO:0060126 | 0.0089 | 21.0603 | 0.154 | 2 | 5 | somatotropin secreting cell differentiation |
| GO:0060754 | 0.0089 | 21.0603 | 0.154 | 2 | 5 | positive regulation of mast cell chemotaxis |
| GO:0072162 | 0.0089 | 21.0603 | 0.154 | 2 | 5 | metanephric mesenchymal cell differentiation |
| GO:1903772 | 0.0089 | 21.0603 | 0.154 | 2 | 5 | regulation of viral budding via host ESCRT complex |
| GO:0060338 | 0.009 | 4.2862 | 1.2937 | 5 | 42 | regulation of type I interferon-mediated signaling pathway |
| GO:0033673 | 0.0098 | 2.0676 | 7.608 | 15 | 247 | negative regulation of kinase activity |
| GO:0055114 | 0.0098 | 1.4955 | 31.4792 | 45 | 1022 | oxidation-reduction process |
| GOMFID | Pvalue | OddsRatio | ExpCount | Count | Size | Term |
| GO:0015179 | 4e-04 | 5.8061 | 1.3785 | 7 | 51 | L-amino acid transmembrane transporter activity |
| GO:0015174 | 0.0015 | 18.1197 | 0.2433 | 3 | 9 | basic amino acid transmembrane transporter activity |
| GO:0031708 | 0.0021 | 72.331 | 0.0811 | 2 | 3 | endothelin B receptor binding |
| GO:0070006 | 0.007 | 9.0563 | 0.4054 | 3 | 15 | metalloaminopeptidase activity |
| GOMFID | Pvalue | OddsRatio | ExpCount | Count | Size | Term |
| GO:0018685 | 0.0024 | 48.9048 | 0.0806 | 2 | 4 | alkane 1-monooxygenase activity |
| GO:0050051 | 0.0024 | 48.9048 | 0.0806 | 2 | 4 | leukotriene-B4 20-monooxygenase activity |
| GO:0004062 | 0.0058 | 24.4492 | 0.121 | 2 | 6 | aryl sulfotransferase activity |
| GOMFID | Pvalue | OddsRatio | ExpCount | Count | Size | Term |
| GO:0009881 | 0.0017 | 16.2701 | 0.2497 | 3 | 11 | photoreceptor activity |
| GO:0044548 | 0.0028 | 13.0144 | 0.2952 | 3 | 13 | S100 protein binding |
| GO:0002039 | 0.0038 | 4.361 | 1.4985 | 6 | 66 | p53 binding |
| GO:0042393 | 0.0039 | 2.8847 | 3.6781 | 10 | 162 | histone binding |
| GO:0008432 | 0.0073 | 21.638 | 0.1362 | 2 | 6 | JUN kinase binding |
| GO:1901474 | 0.0073 | 21.638 | 0.1362 | 2 | 6 | azole transmembrane transporter activity |
| GOMFID | Pvalue | OddsRatio | ExpCount | Count | Size | Term |
| GO:0008474 | 0.0041 | 31.677 | 0.1037 | 2 | 5 | palmitoyl-(protein) hydrolase activity |
| GO:0047485 | 0.0045 | 3.6507 | 2.0525 | 7 | 99 | protein N-terminus binding |
| GO:0016289 | 0.0057 | 9.5251 | 0.3732 | 3 | 18 | CoA hydrolase activity |
| GO:0042393 | 0.0067 | 2.8289 | 3.3587 | 9 | 162 | histone binding |
| GO:0048306 | 0.0086 | 4.2674 | 1.2647 | 5 | 61 | calcium-dependent protein binding |
| GOMFID | Pvalue | OddsRatio | ExpCount | Count | Size | Term |
| GO:0005096 | 3e-04 | 2.8804 | 5.9607 | 16 | 246 | GTPase activator activity |
| GO:0060589 | 0.001 | 2.5125 | 7.1965 | 17 | 297 | nucleoside-triphosphatase regulator activity |
| GO:0098632 | 0.002 | 15.2133 | 0.2665 | 3 | 11 | protein binding involved in cell-cell adhesion |
| GO:0030544 | 0.005 | 6.501 | 0.7027 | 4 | 29 | Hsp70 protein binding |
| GO:0008273 | 0.0056 | 26.9833 | 0.1212 | 2 | 5 | calcium, potassium:sodium antiporter activity |
| GO:0015186 | 0.0056 | 26.9833 | 0.1212 | 2 | 5 | L-glutamine transmembrane transporter activity |
| GO:0070717 | 0.0063 | 9.359 | 0.3877 | 3 | 16 | poly-purine tract binding |
| GO:0005254 | 0.0074 | 3.7607 | 1.7204 | 6 | 71 | chloride channel activity |
| GO:0086083 | 0.0082 | 20.2361 | 0.1454 | 2 | 6 | cell adhesive protein binding involved in bundle of His cell-Purkinje myocyte communication |
| GO:0008565 | 0.0087 | 3.2079 | 2.3261 | 7 | 96 | protein transporter activity |
| GOMFID | Pvalue | OddsRatio | ExpCount | Count | Size | Term |
| GO:0034235 | 1e-04 | 27.2154 | 0.2854 | 4 | 8 | GPI anchor binding |
| GO:0016740 | 3e-04 | 1.4978 | 75.0664 | 104 | 2104 | transferase activity |
| GO:0005543 | 7e-04 | 2.1993 | 11.631 | 24 | 326 | phospholipid binding |
| GO:0032555 | 0.0028 | 1.4267 | 62.4364 | 84 | 1750 | purine ribonucleotide binding |
| GO:0001882 | 0.0029 | 1.4269 | 61.6515 | 83 | 1728 | nucleoside binding |
| GO:0008536 | 0.0033 | 5.6726 | 1.0347 | 5 | 29 | Ran GTPase binding |
| GO:0043167 | 0.0036 | 1.2703 | 205.1839 | 236 | 5751 | ion binding |
| GO:0032550 | 0.0037 | 1.4145 | 61.3304 | 82 | 1719 | purine ribonucleoside binding |
| GO:0035639 | 0.0046 | 1.403 | 60.9736 | 81 | 1709 | purine ribonucleoside triphosphate binding |
| GO:0016301 | 0.0048 | 1.608 | 26.0806 | 40 | 731 | kinase activity |
| GO:0005546 | 0.0056 | 4.0873 | 1.6412 | 6 | 46 | phosphatidylinositol-4,5-bisphosphate binding |
| GO:0008565 | 0.0073 | 2.8253 | 3.4251 | 9 | 96 | protein transporter activity |
| GO:0004082 | 0.0073 | 27.1216 | 0.1427 | 2 | 4 | bisphosphoglycerate mutase activity |
| GO:0043533 | 0.0073 | 27.1216 | 0.1427 | 2 | 4 | inositol 1,3,4,5 tetrakisphosphate binding |
| GO:0046538 | 0.0073 | 27.1216 | 0.1427 | 2 | 4 | 2,3-bisphosphoglycerate-dependent phosphoglycerate mutase activity |
| GO:1901363 | 0.0073 | 1.2875 | 127.9357 | 152 | 3746 | heterocyclic compound binding |
| GO:0031267 | 0.0079 | 2.0704 | 8.1346 | 16 | 228 | small GTPase binding |
| GO:0000166 | 0.0089 | 1.3262 | 77.9563 | 98 | 2185 | nucleotide binding |
| GO:0016773 | 0.0098 | 1.5688 | 23.9399 | 36 | 671 | phosphotransferase activity, alcohol group as acceptor |
| GOMFID | Pvalue | OddsRatio | ExpCount | Count | Size | Term |
| GO:0097159 | 2e-04 | 1.3733 | 201.6512 | 243 | 5553 | organic cyclic compound binding |
| GO:1901363 | 2e-04 | 1.3741 | 198.7824 | 240 | 5474 | heterocyclic compound binding |
| GO:0032555 | 0.0021 | 1.4374 | 63.5494 | 86 | 1750 | purine ribonucleotide binding |
| GO:0008656 | 0.0022 | 8.9012 | 0.581 | 4 | 16 | cysteine-type endopeptidase activator activity involved in apoptotic process |
| GO:0003723 | 0.0023 | 1.4658 | 54.1804 | 75 | 1492 | RNA binding |
| GO:0001883 | 0.0029 | 1.4232 | 62.5326 | 84 | 1722 | purine nucleoside binding |
| GO:0032549 | 0.0029 | 1.4232 | 62.5326 | 84 | 1722 | ribonucleoside binding |
| GO:0016740 | 0.0032 | 1.3836 | 76.0428 | 99 | 2101 | transferase activity |
| GO:0030544 | 0.0036 | 5.5687 | 1.0531 | 5 | 29 | Hsp70 protein binding |
| GO:0004698 | 0.0039 | 53.2583 | 0.1089 | 2 | 3 | calcium-dependent protein kinase C activity |
| GO:0005497 | 0.0039 | 53.2583 | 0.1089 | 2 | 3 | androgen binding |
| GO:0016744 | 0.0039 | 53.2583 | 0.1089 | 2 | 3 | transferase activity, transferring aldehyde or ketonic groups |
| GO:0000166 | 0.004 | 1.3646 | 79.3459 | 102 | 2185 | nucleotide binding |
| GO:0019205 | 0.0043 | 4.3385 | 1.5615 | 6 | 43 | nucleobase-containing compound kinase activity |
| GO:0030554 | 0.0049 | 1.4286 | 52.3284 | 71 | 1441 | adenyl nucleotide binding |
| GO:0043168 | 0.0051 | 1.3328 | 90.8937 | 114 | 2503 | anion binding |
| GO:0005524 | 0.0054 | 1.4286 | 50.8032 | 69 | 1399 | ATP binding |
| GO:0016773 | 0.0077 | 1.5867 | 24.3666 | 37 | 671 | phosphotransferase activity, alcohol group as acceptor |
| GO:0097367 | 0.0077 | 1.3358 | 76.6224 | 97 | 2110 | carbohydrate derivative binding |
| GOMFID | Pvalue | OddsRatio | ExpCount | Count | Size | Term |
| GO:0004070 | 0.001 | Inf | 0.0625 | 2 | 2 | aspartate carbamoyltransferase activity |
| GO:0004087 | 0.001 | Inf | 0.0625 | 2 | 2 | carbamoyl-phosphate synthase (ammonia) activity |
| GO:0004088 | 0.001 | Inf | 0.0625 | 2 | 2 | carbamoyl-phosphate synthase (glutamine-hydrolyzing) activity |
| GO:0004151 | 0.001 | Inf | 0.0625 | 2 | 2 | dihydroorotase activity |
| GO:0009055 | 0.0019 | 3.2441 | 3.3412 | 10 | 107 | electron carrier activity |
| GO:0017075 | 0.002 | 8.9287 | 0.5621 | 4 | 18 | syntaxin-1 binding |
| GO:0032557 | 0.0029 | 62.2986 | 0.0937 | 2 | 3 | pyrimidine ribonucleotide binding |
| GO:0050211 | 0.0029 | 62.2986 | 0.0937 | 2 | 3 | procollagen galactosyltransferase activity |
| GO:0004298 | 0.0037 | 7.3516 | 0.6557 | 4 | 21 | threonine-type endopeptidase activity |
| GO:0019992 | 0.0041 | 11.6995 | 0.3435 | 3 | 11 | diacylglycerol binding |
| GO:0030911 | 0.0091 | 20.7635 | 0.1561 | 2 | 5 | TPR domain binding |
| GOMFID | Pvalue | OddsRatio | ExpCount | Count | Size | Term |
| GO:0030158 | 0.0034 | 57.2128 | 0.1017 | 2 | 3 | protein xylosyltransferase activity |
| GO:0043177 | 0.0043 | 2.3694 | 6.271 | 14 | 185 | organic acid binding |
| GO:0005086 | 0.0059 | 6.3739 | 0.7457 | 4 | 22 | ARF guanyl-nucleotide exchange factor activity |
| GO:0034483 | 0.0086 | 8.593 | 0.4407 | 3 | 13 | heparan sulfate sulfotransferase activity |
| GO:0016746 | 0.0095 | 2.0758 | 7.593 | 15 | 224 | transferase activity, transferring acyl groups |
| GO:0004177 | 0.0098 | 4.2215 | 1.322 | 5 | 39 | aminopeptidase activity |
| GOMFID | Pvalue | OddsRatio | ExpCount | Count | Size | Term |
| GO:1904680 | 9e-04 | 24.0142 | 0.2132 | 3 | 7 | peptide transmembrane transporter activity |
| GO:0015433 | 9e-04 | Inf | 0.0609 | 2 | 2 | peptide antigen-transporting ATPase activity |
| GO:0016823 | 0.0027 | 63.9161 | 0.0914 | 2 | 3 | hydrolase activity, acting on acid carbon-carbon bonds, in ketonic substances |
| GO:0017159 | 0.0027 | 63.9161 | 0.0914 | 2 | 3 | pantetheine hydrolase activity |
| GO:0031749 | 0.0027 | 63.9161 | 0.0914 | 2 | 3 | D2 dopamine receptor binding |
| GO:0016831 | 0.0039 | 5.3499 | 1.0662 | 5 | 35 | carboxy-lyase activity |
| GO:0052866 | 0.004 | 7.1237 | 0.6702 | 4 | 22 | phosphatidylinositol phosphate phosphatase activity |
| GO:0046978 | 0.0053 | 31.956 | 0.1219 | 2 | 4 | TAP1 binding |
| GO:0044822 | 0.0067 | 1.5066 | 34.149 | 49 | 1121 | poly(A) RNA binding |
| GO:0042287 | 0.0086 | 5.5733 | 0.8225 | 4 | 27 | MHC protein binding |
| GO:0004439 | 0.0087 | 21.3026 | 0.1523 | 2 | 5 | phosphatidylinositol-4,5-bisphosphate 5-phosphatase activity |
| GO:0008273 | 0.0087 | 21.3026 | 0.1523 | 2 | 5 | calcium, potassium:sodium antiporter activity |
| GO:0046923 | 0.0087 | 21.3026 | 0.1523 | 2 | 5 | ER retention sequence binding |
| GO:1901265 | 0.0097 | 1.3497 | 66.5921 | 85 | 2186 | nucleoside phosphate binding |
| GOMFID | Pvalue | OddsRatio | ExpCount | Count | Size | Term |
| GO:0016874 | 0.0015 | 1.9944 | 13.7993 | 26 | 380 | ligase activity |
| GO:0046527 | 0.0017 | 9.7111 | 0.5447 | 4 | 15 | glucosyltransferase activity |
| GO:0046872 | 0.0027 | 1.3076 | 140.898 | 170 | 3880 | metal ion binding |
| GO:0045236 | 0.0028 | 8.216 | 0.6173 | 4 | 17 | CXCR chemokine receptor binding |
| GO:0005488 | 0.0034 | 1.426 | 480.1752 | 503 | 13266 | binding |
| GO:0032266 | 0.0036 | 5.5687 | 1.0531 | 5 | 29 | phosphatidylinositol-3-phosphate binding |
| GO:0050473 | 0.0039 | 53.2583 | 0.1089 | 2 | 3 | arachidonate 15-lipoxygenase activity |
| GO:0097322 | 0.0039 | 53.2583 | 0.1089 | 2 | 3 | 7SK snRNA binding |
| GO:0097602 | 0.0063 | 9.9989 | 0.3995 | 3 | 11 | cullin family protein binding |
| GO:0008009 | 0.0075 | 3.8207 | 1.7431 | 6 | 48 | chemokine activity |
| GO:0015016 | 0.0075 | 26.6274 | 0.1453 | 2 | 4 | [heparan sulfate]-glucosamine N-sulfotransferase activity |
| GO:0019788 | 0.0075 | 26.6274 | 0.1453 | 2 | 4 | NEDD8 transferase activity |
| GO:0046848 | 0.0075 | 26.6274 | 0.1453 | 2 | 4 | hydroxyapatite binding |
| GO:0032182 | 0.0076 | 2.6303 | 4.0672 | 10 | 112 | ubiquitin-like protein binding |
| GO:0003676 | 0.0078 | 1.2693 | 134.071 | 159 | 3692 | nucleic acid binding |
| GO:0051787 | 0.0082 | 8.8873 | 0.4358 | 3 | 12 | misfolded protein binding |
| GO:0070300 | 0.0082 | 8.8873 | 0.4358 | 3 | 12 | phosphatidic acid binding |
| GO:1990381 | 0.0082 | 8.8873 | 0.4358 | 3 | 12 | ubiquitin-specific protease binding |
| GO:1902936 | 0.009 | 3.2302 | 2.3604 | 7 | 65 | phosphatidylinositol bisphosphate binding |
| GOMFID | Pvalue | OddsRatio | ExpCount | Count | Size | Term |
| GO:0003845 | 0.0011 | Inf | 0.0663 | 2 | 2 | 11-beta-hydroxysteroid dehydrogenase [NAD(P)] activity |
| GO:0030331 | 0.0014 | 5.5234 | 1.2591 | 6 | 38 | estrogen receptor binding |
| GO:0003987 | 0.0032 | 58.5819 | 0.0994 | 2 | 3 | acetate-CoA ligase activity |
| GO:0098632 | 0.0049 | 11.0002 | 0.3645 | 3 | 11 | protein binding involved in cell-cell adhesion |
| GO:0035877 | 0.0063 | 29.289 | 0.1325 | 2 | 4 | death effector domain binding |
| GO:0005031 | 0.0064 | 6.183 | 0.7621 | 4 | 23 | tumor necrosis factor-activated receptor activity |
| GO:0070016 | 0.0081 | 8.799 | 0.4307 | 3 | 13 | armadillo repeat domain binding |
| GOMFID | Pvalue | OddsRatio | ExpCount | Count | Size | Term |
| GO:0042887 | 0.0016 | 9.6973 | 0.5352 | 4 | 16 | amide transmembrane transporter activity |
| GO:0034450 | 0.005 | 10.8915 | 0.368 | 3 | 11 | ubiquitin-ubiquitin ligase activity |
| GO:0051287 | 0.0062 | 3.974 | 1.6726 | 6 | 50 | NAD binding |
| GO:0015440 | 0.0064 | 29 | 0.1338 | 2 | 4 | peptide-transporting ATPase activity |
| GO:0023029 | 0.0064 | 29 | 0.1338 | 2 | 4 | MHC class Ib protein binding |
| GO:0035877 | 0.0064 | 29 | 0.1338 | 2 | 4 | death effector domain binding |
| GO:1904288 | 0.0064 | 29 | 0.1338 | 2 | 4 | BAT3 complex binding |
| GO:0044325 | 0.0086 | 2.7385 | 3.5125 | 9 | 105 | ion channel binding |
| GOMFID | Pvalue | OddsRatio | ExpCount | Count | Size | Term |
| GO:0004439 | 5e-04 | 39.9385 | 0.1819 | 3 | 5 | phosphatidylinositol-4,5-bisphosphate 5-phosphatase activity |
| GO:0016791 | 8e-04 | 2.436 | 8.3561 | 19 | 231 | phosphatase activity |
| GO:0016788 | 8e-04 | 1.7857 | 24.3366 | 41 | 669 | hydrolase activity, acting on ester bonds |
| GO:0035575 | 0.001 | 11.849 | 0.4729 | 4 | 13 | histone demethylase activity (H4-K20 specific) |
| GO:0046030 | 0.0023 | 15.9722 | 0.291 | 3 | 8 | inositol trisphosphate phosphatase activity |
| GO:0016740 | 0.0038 | 1.3724 | 76.5383 | 99 | 2104 | transferase activity |
| GO:0031493 | 0.0039 | 53.1614 | 0.1091 | 2 | 3 | nucleosomal histone binding |
| GO:0031749 | 0.0039 | 53.1614 | 0.1091 | 2 | 3 | D2 dopamine receptor binding |
| GO:0036042 | 0.0039 | 53.1614 | 0.1091 | 2 | 3 | long-chain fatty acyl-CoA binding |
| GO:0061578 | 0.0039 | 53.1614 | 0.1091 | 2 | 3 | Lys63-specific deubiquitinase activity |
| GO:0089720 | 0.0039 | 53.1614 | 0.1091 | 2 | 3 | caspase binding |
| GO:0004722 | 0.0044 | 3.7421 | 2.0735 | 7 | 57 | protein serine/threonine phosphatase activity |
| GO:0001055 | 0.0047 | 11.4072 | 0.3638 | 3 | 10 | RNA polymerase II activity |
| GO:0003777 | 0.0053 | 3.2422 | 2.6919 | 8 | 74 | microtubule motor activity |
| GO:0052866 | 0.0075 | 5.921 | 0.8003 | 4 | 22 | phosphatidylinositol phosphate phosphatase activity |
| GO:0003886 | 0.0075 | 26.5789 | 0.1455 | 2 | 4 | DNA (cytosine-5-)-methyltransferase activity |
| GO:1990380 | 0.0075 | 26.5789 | 0.1455 | 2 | 4 | Lys48-specific deubiquitinase activity |
| GO:0003824 | 0.0086 | 1.2944 | 110.575 | 133 | 3184 | catalytic activity |
| GOMFID | Pvalue | OddsRatio | ExpCount | Count | Size | Term |
| GO:0016836 | 5e-04 | 5.7041 | 1.4085 | 7 | 49 | hydro-lyase activity |
| GO:0001055 | 0.0024 | 14.5705 | 0.2875 | 3 | 10 | RNA polymerase II activity |
| GO:0036435 | 0.0048 | 33.9333 | 0.115 | 2 | 4 | K48-linked polyubiquitin binding |
| GO:0008191 | 0.0054 | 10.1973 | 0.3737 | 3 | 13 | metalloendopeptidase inhibitor activity |
| GO:0010576 | 0.0068 | 9.2697 | 0.4024 | 3 | 14 | metalloenzyme regulator activity |
| GO:0008503 | 0.0078 | 22.6207 | 0.1437 | 2 | 5 | benzodiazepine receptor activity |
| GO:0004890 | 0.01 | 7.8426 | 0.4599 | 3 | 16 | GABA-A receptor activity |
| GOMFID | Pvalue | OddsRatio | ExpCount | Count | Size | Term |
| GO:0031996 | 3e-04 | 15.8322 | 0.358 | 4 | 13 | thioesterase binding |
| GO:0015379 | 0.0044 | 35.4733 | 0.1102 | 2 | 4 | potassium:chloride symporter activity |
| GO:0022820 | 0.0044 | 35.4733 | 0.1102 | 2 | 4 | potassium ion symporter activity |
| GO:0034604 | 0.0044 | 35.4733 | 0.1102 | 2 | 4 | pyruvate dehydrogenase (NAD+) activity |
| GO:0004738 | 0.0072 | 23.6473 | 0.1377 | 2 | 5 | pyruvate dehydrogenase activity |
| GO:0015215 | 0.0074 | 8.8831 | 0.4131 | 3 | 15 | nucleotide transmembrane transporter activity |
| GOMFID | Pvalue | OddsRatio | ExpCount | Count | Size | Term |
| GO:1901981 | 0 | 4.605 | 3.1919 | 13 | 105 | phosphatidylinositol phosphate binding |
| GO:0015379 | 1e-04 | 96.2842 | 0.1216 | 3 | 4 | potassium:chloride symporter activity |
| GO:0022820 | 1e-04 | 96.2842 | 0.1216 | 3 | 4 | potassium ion symporter activity |
| GO:0004630 | 5e-04 | 32.0905 | 0.1824 | 3 | 6 | phospholipase D activity |
| GO:1901363 | 7e-04 | 1.3603 | 166.4063 | 200 | 5474 | heterocyclic compound binding |
| GO:0035620 | 9e-04 | Inf | 0.0608 | 2 | 2 | ceramide transporter activity |
| GO:0043168 | 0.0014 | 1.4325 | 76.0897 | 101 | 2503 | anion binding |
| GO:0097159 | 0.0016 | 1.3296 | 168.8078 | 200 | 5553 | organic cyclic compound binding |
| GO:0005546 | 0.0026 | 4.8324 | 1.3984 | 6 | 46 | phosphatidylinositol-4,5-bisphosphate binding |
| GO:0008378 | 0.003 | 5.7452 | 1.0032 | 5 | 33 | galactosyltransferase activity |
| GO:0019213 | 0.0039 | 5.3615 | 1.064 | 5 | 35 | deacetylase activity |
| GO:0003945 | 0.0053 | 32.0252 | 0.1216 | 2 | 4 | N-acetyllactosamine synthase activity |
| GO:0097001 | 0.0053 | 32.0252 | 0.1216 | 2 | 4 | ceramide binding |
| GO:0003956 | 0.0087 | 21.3487 | 0.152 | 2 | 5 | NAD(P)+-protein-arginine ADP-ribosyltransferase activity |
| GO:0070290 | 0.0087 | 21.3487 | 0.152 | 2 | 5 | N-acylphosphatidylethanolamine-specific phospholipase D activity |
| GO:0043167 | 0.0089 | 1.3256 | 92.6175 | 113 | 3248 | ion binding |
| GOMFID | Pvalue | OddsRatio | ExpCount | Count | Size | Term |
| GO:0005546 | 0.0014 | 4.7144 | 1.7026 | 7 | 46 | phosphatidylinositol-4,5-bisphosphate binding |
| GO:0005515 | 0.0015 | 1.3144 | 374.2433 | 408 | 10111 | protein binding |
| GO:0005543 | 0.0024 | 2.015 | 12.0664 | 23 | 326 | phospholipid binding |
| GO:0051015 | 0.0031 | 2.8406 | 4.1825 | 11 | 113 | actin filament binding |
| GO:0016301 | 0.0032 | 1.6315 | 27.0569 | 42 | 731 | kinase activity |
| GO:0005497 | 0.004 | 52.2103 | 0.111 | 2 | 3 | androgen binding |
| GO:0000166 | 0.0051 | 1.3489 | 80.8745 | 103 | 2185 | nucleotide binding |
| GO:0032555 | 0.0052 | 1.3843 | 64.7736 | 85 | 1750 | purine ribonucleotide binding |
| GO:0001882 | 0.0053 | 1.3849 | 63.9593 | 84 | 1728 | nucleoside binding |
| GO:1901981 | 0.0055 | 2.769 | 3.8864 | 10 | 105 | phosphatidylinositol phosphate binding |
| GO:0016740 | 0.0064 | 1.343 | 77.8764 | 99 | 2104 | transferase activity |
| GO:0032550 | 0.0066 | 1.3732 | 63.6262 | 83 | 1719 | purine ribonucleoside binding |
| GO:0003723 | 0.008 | 1.387 | 55.2241 | 73 | 1492 | RNA binding |
| GO:0043167 | 0.008 | 1.2355 | 212.8645 | 241 | 5751 | ion binding |
| GO:0035639 | 0.0082 | 1.3623 | 63.256 | 82 | 1709 | purine ribonucleoside triphosphate binding |
| GOMFID | Pvalue | OddsRatio | ExpCount | Count | Size | Term |
| GO:0005068 | 0.0011 | 20.287 | 0.2181 | 3 | 9 | transmembrane receptor protein tyrosine kinase adaptor activity |
| GO:0008597 | 0.0017 | 80.9604 | 0.0727 | 2 | 3 | calcium-dependent protein serine/threonine phosphatase regulator activity |
| GO:0017056 | 0.0034 | 12.169 | 0.315 | 3 | 13 | structural constituent of nuclear pore |
| GO:0051059 | 0.0044 | 6.7723 | 0.6785 | 4 | 28 | NF-kappaB binding |
| GO:0016408 | 0.0052 | 10.1396 | 0.3635 | 3 | 15 | C-acyltransferase activity |
| GO:0008503 | 0.0056 | 26.9833 | 0.1212 | 2 | 5 | benzodiazepine receptor activity |
| GO:0004521 | 0.0059 | 4.7316 | 1.1631 | 5 | 48 | endoribonuclease activity |
| GO:0060090 | 0.007 | 2.6412 | 3.998 | 10 | 165 | binding, bridging |
| GO:1990782 | 0.0077 | 4.4221 | 1.2358 | 5 | 51 | protein tyrosine kinase binding |
| GOMFID | Pvalue | OddsRatio | ExpCount | Count | Size | Term |
| GO:0005132 | 0.0015 | 15.5137 | 0.2346 | 3 | 17 | type I interferon receptor binding |
| GO:0043142 | 0.0027 | 36.0535 | 0.0828 | 2 | 6 | single-stranded DNA-dependent ATPase activity |
| GO:0050543 | 0.0027 | 36.0535 | 0.0828 | 2 | 6 | icosatetraenoic acid binding |
| GO:0000217 | 0.0029 | 12.0631 | 0.2898 | 3 | 21 | DNA secondary structure binding |
| GO:0008022 | 0.0036 | 3.4127 | 2.4841 | 8 | 180 | protein C-terminus binding |
| GO:0000150 | 0.005 | 24.0326 | 0.1104 | 2 | 8 | recombinase activity |
| GO:0004673 | 0.0064 | 20.598 | 0.1242 | 2 | 9 | protein histidine kinase activity |
| GO:0005504 | 0.0066 | 8.6815 | 0.3864 | 3 | 28 | fatty acid binding |
| GOMFID | Pvalue | OddsRatio | ExpCount | Count | Size | Term |
| GO:0005132 | 0.0016 | 15.2251 | 0.2389 | 3 | 17 | type I interferon receptor binding |
| GO:0050543 | 0.0028 | 35.3858 | 0.0843 | 2 | 6 | icosatetraenoic acid binding |
| GO:0051537 | 0.0035 | 11.2149 | 0.3092 | 3 | 22 | 2 iron, 2 sulfur cluster binding |
| GO:0004673 | 0.0066 | 20.2166 | 0.1265 | 2 | 9 | protein histidine kinase activity |
| GO:0046790 | 0.0066 | 20.2166 | 0.1265 | 2 | 9 | virion binding |
| GO:0005504 | 0.0069 | 8.52 | 0.3935 | 3 | 28 | fatty acid binding |
| GOMFID | Pvalue | OddsRatio | ExpCount | Count | Size | Term |
| GO:0004146 | 0.0011 | Inf | 0.0655 | 2 | 2 | dihydrofolate reductase activity |
| GO:0042301 | 0.0035 | 12.7249 | 0.3275 | 3 | 10 | phosphate ion binding |
| GO:0050662 | 0.0056 | 2.3757 | 5.7972 | 13 | 177 | coenzyme binding |
| GO:0044325 | 0.0075 | 2.8001 | 3.439 | 9 | 105 | ion channel binding |
| GO:0030331 | 0.0076 | 4.5086 | 1.2446 | 5 | 38 | estrogen receptor binding |
| GOMFID | Pvalue | OddsRatio | ExpCount | Count | Size | Term |
| GO:0008124 | 8e-04 | Inf | 0.0583 | 2 | 2 | 4-alpha-hydroxytetrahydrobiopterin dehydratase activity |
| GO:0005488 | 0.0022 | 1.5252 | 386.5212 | 408 | 13270 | binding |
| GO:0004477 | 0.0025 | 66.9518 | 0.0874 | 2 | 3 | methenyltetrahydrofolate cyclohydrolase activity |
| GO:0004487 | 0.0025 | 66.9518 | 0.0874 | 2 | 3 | methylenetetrahydrofolate dehydrogenase (NAD+) activity |
| GO:0004488 | 0.0025 | 66.9518 | 0.0874 | 2 | 3 | methylenetetrahydrofolate dehydrogenase (NADP+) activity |
| GO:0004505 | 0.0025 | 66.9518 | 0.0874 | 2 | 3 | phenylalanine 4-monooxygenase activity |
| GO:0004594 | 0.0049 | 33.4737 | 0.1165 | 2 | 4 | pantothenate kinase activity |
| GO:0047631 | 0.008 | 22.3143 | 0.1456 | 2 | 5 | ADP-ribose diphosphatase activity |
| GO:0047485 | 0.0083 | 2.9646 | 2.8836 | 8 | 99 | protein N-terminus binding |
| GOMFID | Pvalue | OddsRatio | ExpCount | Count | Size | Term |
| GO:0004659 | 0.001 | 11.5015 | 0.4737 | 4 | 14 | prenyltransferase activity |
| GO:0000182 | 0.0012 | 21.5331 | 0.2368 | 3 | 7 | rDNA binding |
| GO:0016874 | 0.0012 | 2.0609 | 12.8568 | 25 | 380 | ligase activity |
| GO:0051087 | 0.0014 | 3.7175 | 2.6729 | 9 | 79 | chaperone binding |
| GO:0030544 | 0.0026 | 5.9962 | 0.9812 | 5 | 29 | Hsp70 protein binding |
| GO:0019992 | 0.0052 | 10.7637 | 0.3722 | 3 | 11 | diacylglycerol binding |
| GO:0019843 | 0.0059 | 4.0187 | 1.6578 | 6 | 49 | rRNA binding |
| GO:0003917 | 0.0066 | 28.6604 | 0.1353 | 2 | 4 | DNA topoisomerase type I activity |
| GO:0046848 | 0.0066 | 28.6604 | 0.1353 | 2 | 4 | hydroxyapatite binding |
| GO:0016740 | 0.0075 | 1.351 | 71.186 | 91 | 2104 | transferase activity |
| GOMFID | Pvalue | OddsRatio | ExpCount | Count | Size | Term |
| GO:0004146 | 5e-04 | Inf | 0.0432 | 2 | 2 | dihydrofolate reductase activity |
| GO:0036041 | 0.0024 | 13.6861 | 0.2811 | 3 | 13 | long-chain fatty acid binding |
| GO:0042296 | 0.0027 | 45.5089 | 0.0865 | 2 | 4 | ISG15 transferase activity |
| GO:0030955 | 0.0038 | 11.4036 | 0.3243 | 3 | 15 | potassium ion binding |
| GO:0008273 | 0.0045 | 30.3373 | 0.1081 | 2 | 5 | calcium, potassium:sodium antiporter activity |
| GO:0005215 | 0.0091 | 1.5662 | 25.5584 | 38 | 1182 | transporter activity |
| GO:0017124 | 0.0099 | 3.1187 | 2.3785 | 7 | 110 | SH3 domain binding |
| GO:0015491 | 0.01 | 7.5994 | 0.4541 | 3 | 21 | cation:cation antiporter activity |
| GOMFID | Pvalue | OddsRatio | ExpCount | Count | Size | Term |
| GO:0004477 | 0.0025 | 66.6507 | 0.0878 | 2 | 3 | methenyltetrahydrofolate cyclohydrolase activity |
| GO:0004487 | 0.0025 | 66.6507 | 0.0878 | 2 | 3 | methylenetetrahydrofolate dehydrogenase (NAD+) activity |
| GO:0004488 | 0.0025 | 66.6507 | 0.0878 | 2 | 3 | methylenetetrahydrofolate dehydrogenase (NADP+) activity |
| GO:0033300 | 0.0025 | 66.6507 | 0.0878 | 2 | 3 | dehydroascorbic acid transporter activity |
| GO:0035254 | 0.0029 | 5.773 | 0.9947 | 5 | 34 | glutamate receptor binding |
| GO:0005488 | 0.003 | 1.4984 | 388.2091 | 409 | 13270 | binding |
| GO:0032554 | 0.0049 | 33.3231 | 0.117 | 2 | 4 | purine deoxyribonucleotide binding |
| GO:0035368 | 0.0049 | 33.3231 | 0.117 | 2 | 4 | selenocysteine insertion sequence binding |
| GO:0048030 | 0.0049 | 33.3231 | 0.117 | 2 | 4 | disaccharide binding |
| GO:0032182 | 0.0056 | 2.9374 | 3.2765 | 9 | 112 | ubiquitin-like protein binding |
| GO:0031369 | 0.0065 | 6.0774 | 0.7606 | 4 | 26 | translation initiation factor binding |
| GO:0004439 | 0.0081 | 22.214 | 0.1463 | 2 | 5 | phosphatidylinositol-4,5-bisphosphate 5-phosphatase activity |
| GO:0005131 | 0.0081 | 22.214 | 0.1463 | 2 | 5 | growth hormone receptor binding |
| GOMFID | Pvalue | OddsRatio | ExpCount | Count | Size | Term |
| GO:0035870 | 7e-04 | Inf | 0.0511 | 2 | 2 | dITP diphosphatase activity |
| GO:0016742 | 8e-04 | 23.0331 | 0.2045 | 3 | 8 | hydroxymethyl-, formyl- and related transferase activity |
| GO:0044822 | 0.0017 | 1.6689 | 28.6595 | 45 | 1121 | poly(A) RNA binding |
| GO:0050897 | 0.0019 | 76.605 | 0.0767 | 2 | 3 | cobalt ion binding |
| GO:0003676 | 0.0035 | 1.3658 | 94.3897 | 118 | 3692 | nucleic acid binding |
| GO:0030898 | 0.0039 | 11.5128 | 0.3324 | 3 | 13 | actin-dependent ATPase activity |
| GO:0035575 | 0.0039 | 11.5128 | 0.3324 | 3 | 13 | histone demethylase activity (H4-K20 specific) |
| GO:0044183 | 0.0049 | 10.4655 | 0.3579 | 3 | 14 | protein binding involved in protein folding |
| GO:0042623 | 0.0053 | 2.2266 | 7.0855 | 15 | 279 | ATPase activity, coupled |
| GO:0003730 | 0.0068 | 4.582 | 1.2016 | 5 | 47 | mRNA 3'-UTR binding |
| GO:0016646 | 0.0086 | 8.2213 | 0.4346 | 3 | 17 | oxidoreductase activity, acting on the CH-NH group of donors, NAD or NADP as acceptor |
| GO:0030742 | 0.0086 | 8.2213 | 0.4346 | 3 | 17 | GTP-dependent protein binding |
| GO:0045236 | 0.0086 | 8.2213 | 0.4346 | 3 | 17 | CXCR chemokine receptor binding |
| GO:0016814 | 0.0096 | 5.2999 | 0.8437 | 4 | 33 | hydrolase activity, acting on carbon-nitrogen (but not peptide) bonds, in cyclic amidines |
| GO:0016462 | 0.0097 | 1.6451 | 19.0722 | 30 | 746 | pyrophosphatase activity |
| NA. |
| n/a |
| NA. |
| n/a |
| NA. |
| n/a |
| NA. |
| n/a |
| NA. |
| n/a |
| NA. |
| n/a |
| NA. |
| n/a |
| NA. |
| n/a |
| NA. |
| n/a |
| NA. |
| n/a |
| NA. |
| n/a |
| NA. |
| n/a |
| NA. |
| n/a |
| NA. |
| n/a |
| NA. |
| n/a |
| NA. |
| n/a |
| NA. |
| n/a |
| NA. |
| n/a |
| NA. |
| n/a |
| NA. |
| n/a |
| NA. |
| n/a |
| NA. |
| n/a |
| NA. |
| n/a |
| NA. |
| n/a |
| NA. |
| n/a |
| NA. |
| n/a |
| NA. |
| n/a |
| NA. |
| n/a |
| NA. |
| n/a |
| NA. |
| n/a |
| NA. |
| n/a |
| NA. |
| n/a |
| NA. |
| n/a |
| NA. |
| n/a |
| NA. |
| n/a |
| NA. |
| n/a |
| NA. |
| n/a |
| NA. |
| n/a |
| NA. |
| n/a |
| NA. |
| n/a |
| NA. |
| n/a |
| NA. |
| n/a |
| NA. |
| n/a |
| NA. |
| n/a |
| NA. |
| n/a |
| NA. |
| n/a |
| NA. |
| n/a |
| NA. |
| n/a |
| NA. |
| n/a |
| NA. |
| n/a |
| NA. |
| n/a |
| NA. |
| n/a |
| NA. |
| n/a |
| NA. |
| n/a |
| NA. |
| n/a |
| NA. |
| n/a |
| NA. |
| n/a |
| NA. |
| n/a |
| NA. |
| n/a |
| NA. |
| n/a |
| NA. |
| n/a |
| NA. |
| n/a |
| NA. |
| n/a |
| NA. |
| n/a |
| NA. |
| n/a |
| NA. |
| n/a |
| NA. |
| n/a |
| NA. |
| n/a |
| NA. |
| n/a |
| NA. |
| n/a |
| NA. |
| n/a |
| NA. |
| n/a |
| NA. |
| n/a |
| NA. |
| n/a |
| NA. |
| n/a |
| NA. |
| n/a |
| NA. |
| n/a |
| NA. |
| n/a |
| NA. |
| n/a |
| NA. |
| n/a |
| NA. |
| n/a |
| NA. |
| n/a |
| NA. |
| n/a |
| NA. |
| n/a |
| NA. |
| n/a |
| NA. |
| n/a |
| NA. |
| n/a |
| NA. |
| n/a |
| NA. |
| n/a |
| NA. |
| n/a |
| NA. |
| n/a |
| NA. |
| n/a |
| NA. |
| n/a |
| NA. |
| n/a |
| NA. |
| n/a |
| NA. |
| n/a |
| NA. |
| n/a |
| NA. |
| n/a |
| NA. |
| n/a |
| NA. |
| n/a |
| NA. |
| n/a |
| NA. |
| n/a |
| NA. |
| n/a |
| NA. |
| n/a |
| NA. |
| n/a |
| NA. |
| n/a |
| NA. |
| n/a |
| NA. |
| n/a |
| NA. |
| n/a |
| NA. |
| n/a |
| NA. |
| n/a |
| NA. |
| n/a |
| NA. |
| n/a |
| NA. |
| n/a |
| NA. |
| n/a |
| NA. |
| n/a |
| NA. |
| n/a |
| NA. |
| n/a |
| NA. |
| n/a |
| NA. |
| n/a |
| NA. |
| n/a |
| NA. |
| n/a |
| NA. |
| n/a |
| NA. |
| n/a |
| NA. |
| n/a |
| NA. |
| n/a |
| NA. |
| n/a |
| NA. |
| n/a |
| NA. |
| n/a |
| NA. |
| n/a |
| NA. |
| n/a |
| NA. |
| n/a |
| NA. |
| n/a |
| NA. |
| n/a |
| NA. |
| n/a |
| NA. |
| n/a |
| NA. |
| n/a |
| NA. |
| n/a |
| NA. |
| n/a |
| NA. |
| n/a |
| NA. |
| n/a |
| NA. |
| n/a |
| NA. |
| n/a |
| NA. |
| n/a |
| NA. |
| n/a |
| NA. |
| n/a |
| NA. |
| n/a |
| NA. |
| n/a |
| NA. |
| n/a |
| NA. |
| n/a |
| NA. |
| n/a |
| NA. |
| n/a |
| NA. |
| n/a |
| NA. |
| n/a |
| NA. |
| n/a |
| NA. |
| n/a |
| NA. |
| n/a |
| NA. |
| n/a |
| NA. |
| n/a |
| NA. |
| n/a |
| NA. |
| n/a |
| NA. |
| n/a |
| NA. |
| n/a |
| NA. |
| n/a |
| NA. |
| n/a |
| NA. |
| n/a |
| NA. |
| n/a |
| NA. |
| n/a |
| NA. |
| n/a |
| NA. |
| n/a |
| NA. |
| n/a |
| NA. |
| n/a |
| NA. |
| n/a |
| NA. |
| n/a |
| NA. |
| n/a |
| NA. |
| n/a |
| NA. |
| n/a |
| NA. |
| n/a |
| NA. |
| n/a |
| NA. |
| n/a |
| NA. |
| n/a |
| NA. |
| n/a |
| NA. |
| n/a |
| NA. |
| n/a |
| NA. |
| n/a |
| NA. |
| n/a |
| NA. |
| n/a |
| NA. |
| n/a |
| NA. |
| n/a |
| NA. |
| n/a |
| NA. |
| n/a |
| NA. |
| n/a |
| NA. |
| n/a |
| NA. |
| n/a |
| NA. |
| n/a |
| NA. |
| n/a |
| NA. |
| n/a |
| NA. |
| n/a |
| NA. |
| n/a |
| NA. |
| n/a |
| NA. |
| n/a |
| NA. |
| n/a |
| NA. |
| n/a |
| NA. |
| n/a |
| NA. |
| n/a |
| NA. |
| n/a |
| NA. |
| n/a |
| NA. |
| n/a |
| NA. |
| n/a |
| NA. |
| n/a |
| NA. |
| n/a |
| NA. |
| n/a |
| NA. |
| n/a |
| NA. |
| n/a |
| NA. |
| n/a |
| NA. |
| n/a |
| NA. |
| n/a |
| NA. |
| n/a |
| NA. |
| n/a |
| NA. |
| n/a |
| NA. |
| n/a |
| NA. |
| n/a |
| NA. |
| n/a |
| NA. |
| n/a |
| NA. |
| n/a |
| NA. |
| n/a |
| NA. |
| n/a |
| NA. |
| n/a |
| NA. |
| n/a |
| NA. |
| n/a |
| NA. |
| n/a |
| NA. |
| n/a |
| NA. |
| n/a |
| NA. |
| n/a |
| NA. |
| n/a |
| NA. |
| n/a |
| NA. |
| n/a |
| NA. |
| n/a |
| NA. |
| n/a |
| NA. |
| n/a |
| NA. |
| n/a |
| NA. |
| n/a |
| NA. |
| n/a |
| NA. |
| n/a |
| NA. |
| n/a |
| NA. |
| n/a |
| NA. |
| n/a |
| NA. |
| n/a |
| NA. |
| n/a |
| NA. |
| n/a |
| NA. |
| n/a |
| NA. |
| n/a |
| NA. |
| n/a |
| NA. |
| n/a |
| NA. |
| n/a |
| NA. |
| n/a |
| NA. |
| n/a |
| NA. |
| n/a |
| NA. |
| n/a |
| NA. |
| n/a |
| NA. |
| n/a |
| NA. |
| n/a |
| NA. |
| n/a |
| NA. |
| n/a |
| NA. |
| n/a |
| NA. |
| n/a |
| NA. |
| n/a |
| NA. |
| n/a |
| NA. |
| n/a |
| NA. |
| n/a |
| NA. |
| n/a |
| NA. |
| n/a |
| NA. |
| n/a |
| NA. |
| n/a |
| NA. |
| n/a |
| NA. |
| n/a |
| NA. |
| n/a |
| NA. |
| n/a |
| NA. |
| n/a |
| NA. |
| n/a |
| NA. |
| n/a |
| NA. |
| n/a |
| NA. |
| n/a |
| NA. |
| n/a |
| NA. |
| n/a |
| NA. |
| n/a |
| NA. |
| n/a |
| NA. |
| n/a |
| NA. |
| n/a |
| NA. |
| n/a |
| NA. |
| n/a |
| NA. |
| n/a |
| NA. |
| n/a |
| NA. |
| n/a |
| NA. |
| n/a |
| NA. |
| n/a |
| NA. |
| n/a |
| NA. |
| n/a |
| NA. |
| n/a |
| NA. |
| n/a |
| NA. |
| n/a |
| NA. |
| n/a |
| NA. |
| n/a |
| NA. |
| n/a |
| NA. |
| n/a |
| NA. |
| n/a |
| NA. |
| n/a |
| NA. |
| n/a |
| NA. |
| n/a |
| NA. |
| n/a |
| NA. |
| n/a |
| NA. |
| n/a |
| NA. |
| n/a |
| NA. |
| n/a |
| NA. |
| n/a |
| NA. |
| n/a |
| NA. |
| n/a |
| NA. |
| n/a |
| NA. |
| n/a |
| NA. |
| n/a |
| NA. |
| n/a |
| NA. |
| n/a |
| NA. |
| n/a |
| NA. |
| n/a |
| NA. |
| n/a |
| NA. |
| n/a |
| NA. |
| n/a |
| NA. |
| n/a |
| NA. |
| n/a |
| NA. |
| n/a |
| NA. |
| n/a |
| NA. |
| n/a |
| NA. |
| n/a |
| NA. |
| n/a |
| NA. |
| n/a |
| NA. |
| n/a |
| NA. |
| n/a |
| NA. |
| n/a |
| NA. |
| n/a |
| NA. |
| n/a |
| NA. |
| n/a |
| NA. |
| n/a |
| NA. |
| n/a |
| NA. |
| n/a |
| NA. |
| n/a |
| NA. |
| n/a |
| NA. |
| n/a |
| NA. |
| n/a |
| NA. |
| n/a |
| NA. |
| n/a |
| NA. |
| n/a |
| NA. |
| n/a |
| NA. |
| n/a |
| NA. |
| n/a |
| NA. |
| n/a |
| NA. |
| n/a |
| NA. |
| n/a |
| NA. |
| n/a |
| NA. |
| n/a |
| NA. |
| n/a |
| NA. |
| n/a |
| NA. |
| n/a |
| NA. |
| n/a |
| NA. |
| n/a |
| NA. |
| n/a |
| NA. |
| n/a |
| NA. |
| n/a |
| NA. |
| n/a |
| NA. |
| n/a |
| NA. |
| n/a |
| NA. |
| n/a |
| NA. |
| n/a |
| NA. |
| n/a |
| NA. |
| n/a |
| NA. |
| n/a |
| NA. |
| n/a |
| NA. |
| n/a |
| NA. |
| n/a |
| NA. |
| n/a |
| NA. |
| n/a |
| NA. |
| n/a |
| NA. |
| n/a |
| NA. |
| n/a |
| NA. |
| n/a |
| NA. |
| n/a |
| NA. |
| n/a |
| NA. |
| n/a |
| NA. |
| n/a |
| NA. |
| n/a |
| NA. |
| n/a |
| NA. |
| n/a |
| NA. |
| n/a |
| NA. |
| n/a |
| NA. |
| n/a |
| NA. |
| n/a |
| NA. |
| n/a |
| NA. |
| n/a |
| NA. |
| n/a |
| NA. |
| n/a |
| NA. |
| n/a |
| NA. |
| n/a |
| NA. |
| n/a |
| NA. |
| n/a |
| NA. |
| n/a |
| NA. |
| n/a |
| NA. |
| n/a |
| NA. |
| n/a |
| NA. |
| n/a |
| NA. |
| n/a |
| NA. |
| n/a |
| NA. |
| n/a |
| NA. |
| n/a |
| NA. |
| n/a |
| NA. |
| n/a |
| NA. |
| n/a |
| NA. |
| n/a |
| NA. |
| n/a |
| NA. |
| n/a |
| NA. |
| n/a |
| NA. |
| n/a |
| NA. |
| n/a |
| NA. |
| n/a |
| NA. |
| n/a |
| NA. |
| n/a |
| NA. |
| n/a |
| NA. |
| n/a |
| NA. |
| n/a |
| NA. |
| n/a |
| NA. |
| n/a |
| NA. |
| n/a |
| NA. |
| n/a |
| NA. |
| n/a |
| NA. |
| n/a |
| NA. |
| n/a |
| NA. |
| n/a |
| NA. |
| n/a |
| NA. |
| n/a |
| NA. |
| n/a |
| NA. |
| n/a |
| NA. |
| n/a |
| NA. |
| n/a |
| NA. |
| n/a |
| NA. |
| n/a |
| NA. |
| n/a |
| NA. |
| n/a |
| NA. |
| n/a |
| NA. |
| n/a |
| NA. |
| n/a |