Differential methylation on the region level was computed based on a variety of metrics. Of particular interest for the following plots and analyses are the following quantities for each region: the mean methylation difference in a region of the two groups being and of quotient of mean methylation levelsas well as a p-value obtained from statistical testing (limma or t-test; depending on parameter settings). Additionally each region was assigned a rank based on each of these three criteria. A combined rank is computed as the maximum (i.e. worst) value among the three ranks. The smaller the combined rank for a region, the more evidence for differential methylation it exhibits. Regions were defined based on the region types specified in the analysis. This section includes scatterplots of the region group means as well as volcano plots of each pairwise comparison colored according to the combined rank of a given region.
The following rank cutfoffs have been automatically selected for the analysis of differentially methylated regions:
| tiling | cpgislands | genes | promoters | ensembleRegBuildBPall | ensembleRegBuildBPallMerged | |
| CMP vs. MEP (based on cmp_ct_CMPvMEP) | 0 | 0 | 0 | 0 | 0 | 0 |
| CMP vs. GMP (based on cmp_ct_CMPvGMP) | 0 | 0 | 0 | 0 | 0 | 0 |
| CLP vs. CMP (based on cmp_ct_CMPvCLP) | 0 | 0 | 0 | 0 | 0 | 0 |
| GMP vs. MLP3 (based on cmp_ct_MLP3vGMP) | 0 | 0 | 0 | 0 | 0 | 0 |
| CLP vs. MLP0 (based on cmp_ct_CLPvMLP0) | 0 | 0 | 0 | 0 | 0 | 0 |
| CLP vs. MLP1 (based on cmp_ct_CLPvMLP1) | 0 | 0 | 0 | 0 | 0 | 0 |
| CLP vs. MLP2 (based on cmp_ct_CLPvMLP2) | 0 | 0 | 0 | 0 | 0 | 0 |
| CLP vs. MLP3 (based on cmp_ct_CLPvMLP3) | 0 | 0 | 0 | 0 | 0 | 0 |
| MLP1 vs. MLP2 (based on cmp_ct_MLP1vMLP2) | 0 | 0 | 0 | 0 | 0 | 0 |
| MLP2 vs. MLP3 (based on cmp_ct_MLP2vMLP3) | 0 | 0 | 0 | 0 | 0 | 0 |
| MLP1 vs. MLP3 (based on cmp_ct_MLP1vMLP3) | 0 | 0 | 0 | 0 | 0 | 0 |
| MLP0 vs. MLP1 (based on cmp_ct_MLP0vMLP1) | 0 | 0 | 0 | 0 | 0 | 0 |
| MLP0 vs. MLP2 (based on cmp_ct_MLP0vMLP2) | 0 | 0 | 0 | 0 | 0 | 0 |
| MLP0 vs. MLP3 (based on cmp_ct_MLP0vMLP3) | 0 | 0 | 0 | 0 | 0 | 0 |
| HSC vs. MPP (based on cmp_ct_HSCvMPP) | 0 | 0 | 0 | 0 | 0 | 0 |
| CMP vs. MPP (based on cmp_ct_MPPvCMP) | 0 | 0 | 0 | 0 | 0 | 0 |
| HSC vs. ML (based on cmp_ct_HSCvML) | 0 | 0 | 0 | 0 | 0 | 0 |
| LYM vs. MYE (based on cmp_ct_MYEvLYM) | 0 | 0 | 0 | 0 | 0 | 0 |
| BM vs. CB (based on cmp_src_HSC_BMvCB) | 0 | 0 | 0 | 0 | 0 | 0 |
| BM vs. FL (based on cmp_src_HSC_BMvFL) | 0 | 0 | 0 | 0 | 0 | 0 |
| BM vs. PB (based on cmp_src_HSC_BMvPB) | 0 | 0 | 0 | 0 | 0 | 0 |
| CB vs. FL (based on cmp_src_HSC_CBvFL) | 0 | 0 | 0 | 0 | 0 | 0 |
| CB vs. PB (based on cmp_src_HSC_CBvPB) | 0 | 0 | 0 | 0 | 0 | 0 |
| FL vs. PB (based on cmp_src_HSC_FLvPB) | 0 | 0 | 0 | 0 | 0 | 0 |
| BM vs. CB (based on cmp_src_MPP_BMvCB) | 0 | 0 | 0 | 0 | 0 | 0 |
| BM vs. PB (based on cmp_src_MPP_BMvPB) | 0 | 0 | 0 | 0 | 0 | 0 |
| CB vs. PB (based on cmp_src_MPP_CBvPB) | 0 | 0 | 0 | 0 | 0 | 0 |
| HSC vs. MPP (based on cmp_HSCvMPP_PB) | 0 | 0 | 0 | 0 | 0 | 0 |
| HSC vs. MPP (based on cmp_HSCvMPP_CB) | 0 | 0 | 0 | 0 | 0 | 0 |
| HSC vs. MPP (based on cmp_HSCvMPP_BM) | 0 | 0 | 0 | 0 | 0 | 0 |
| comparison | |
| regions | |
| differential methylation measure |
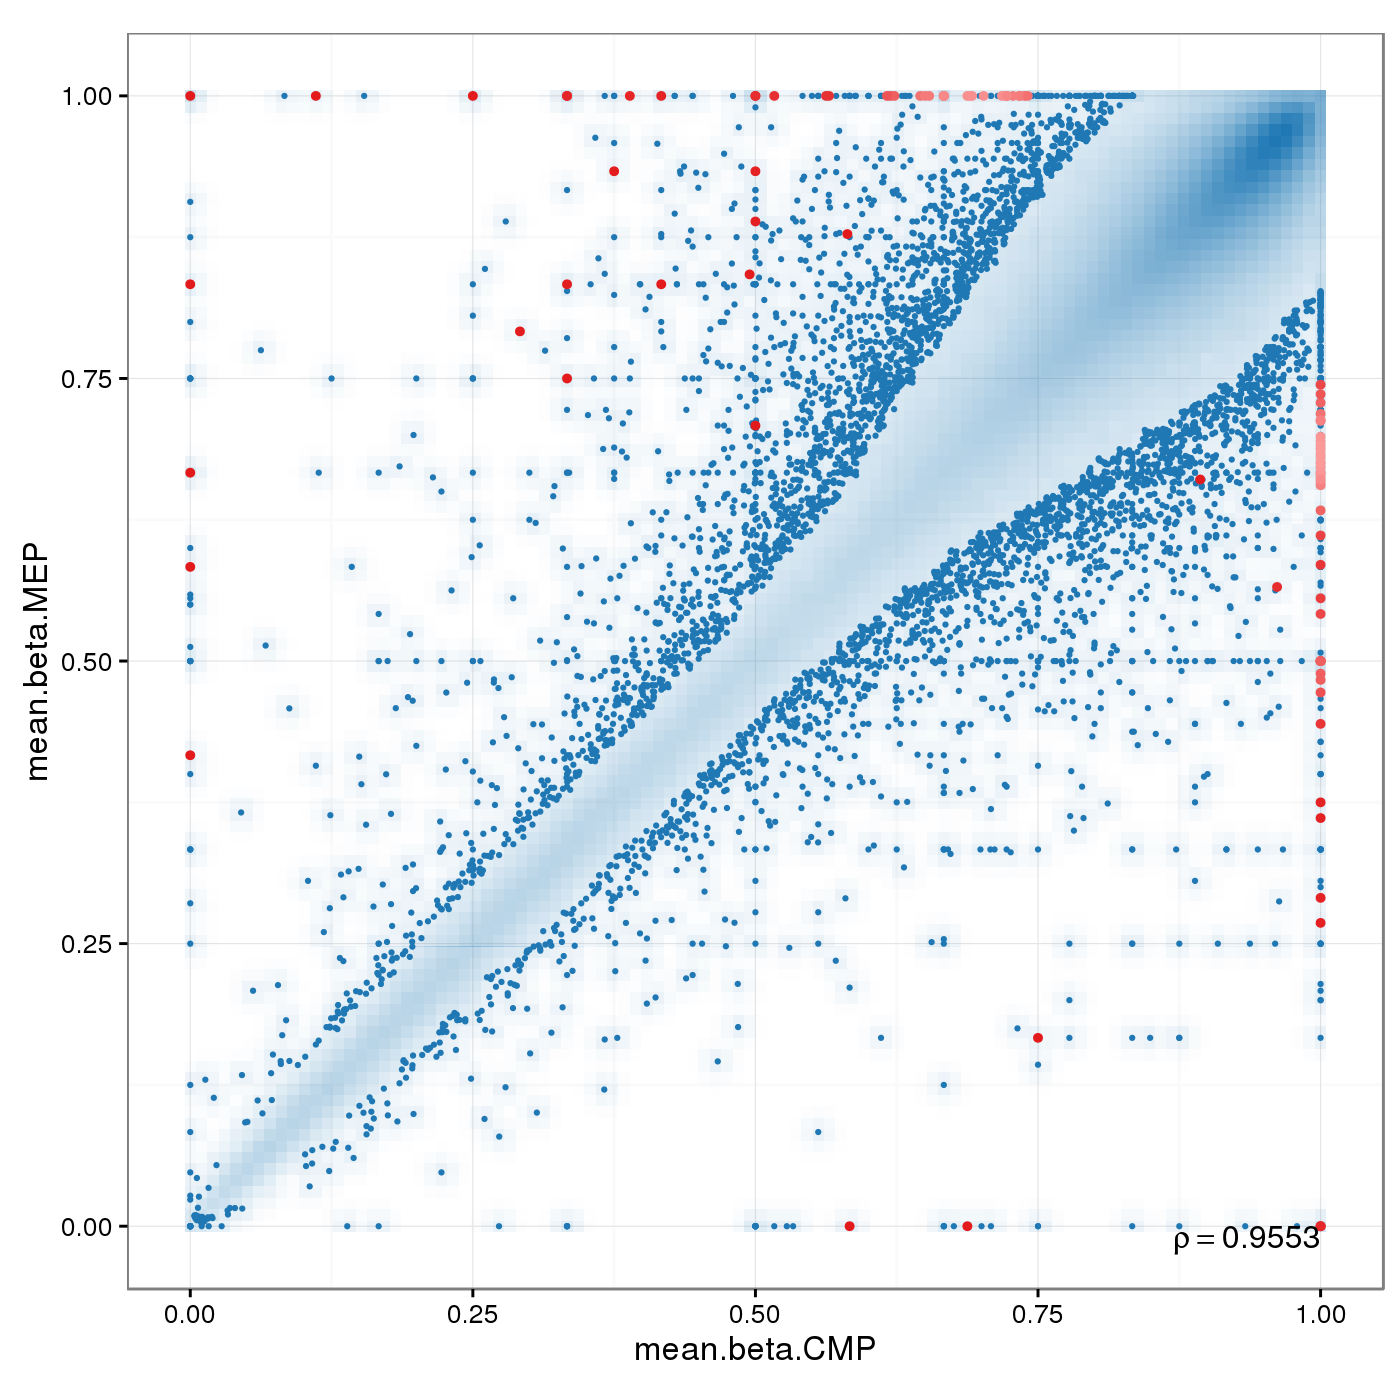
Scatterplot for differential methylation (regions). If the selected criterion is not rankGradient:
The transparency corresponds to point density. The 1% of the points in the sparsest populated plot regions are drawn explicitly.
Additionally, the colored points represent differentially methylated regions (according to the selected criterion).
If the selected criterion is rankGradient: median combined ranks accross hexagonal bins are shown
as a gradient according to the color legend.
| comparison | |
| regions | |
| difference metric | |
| significance metric |
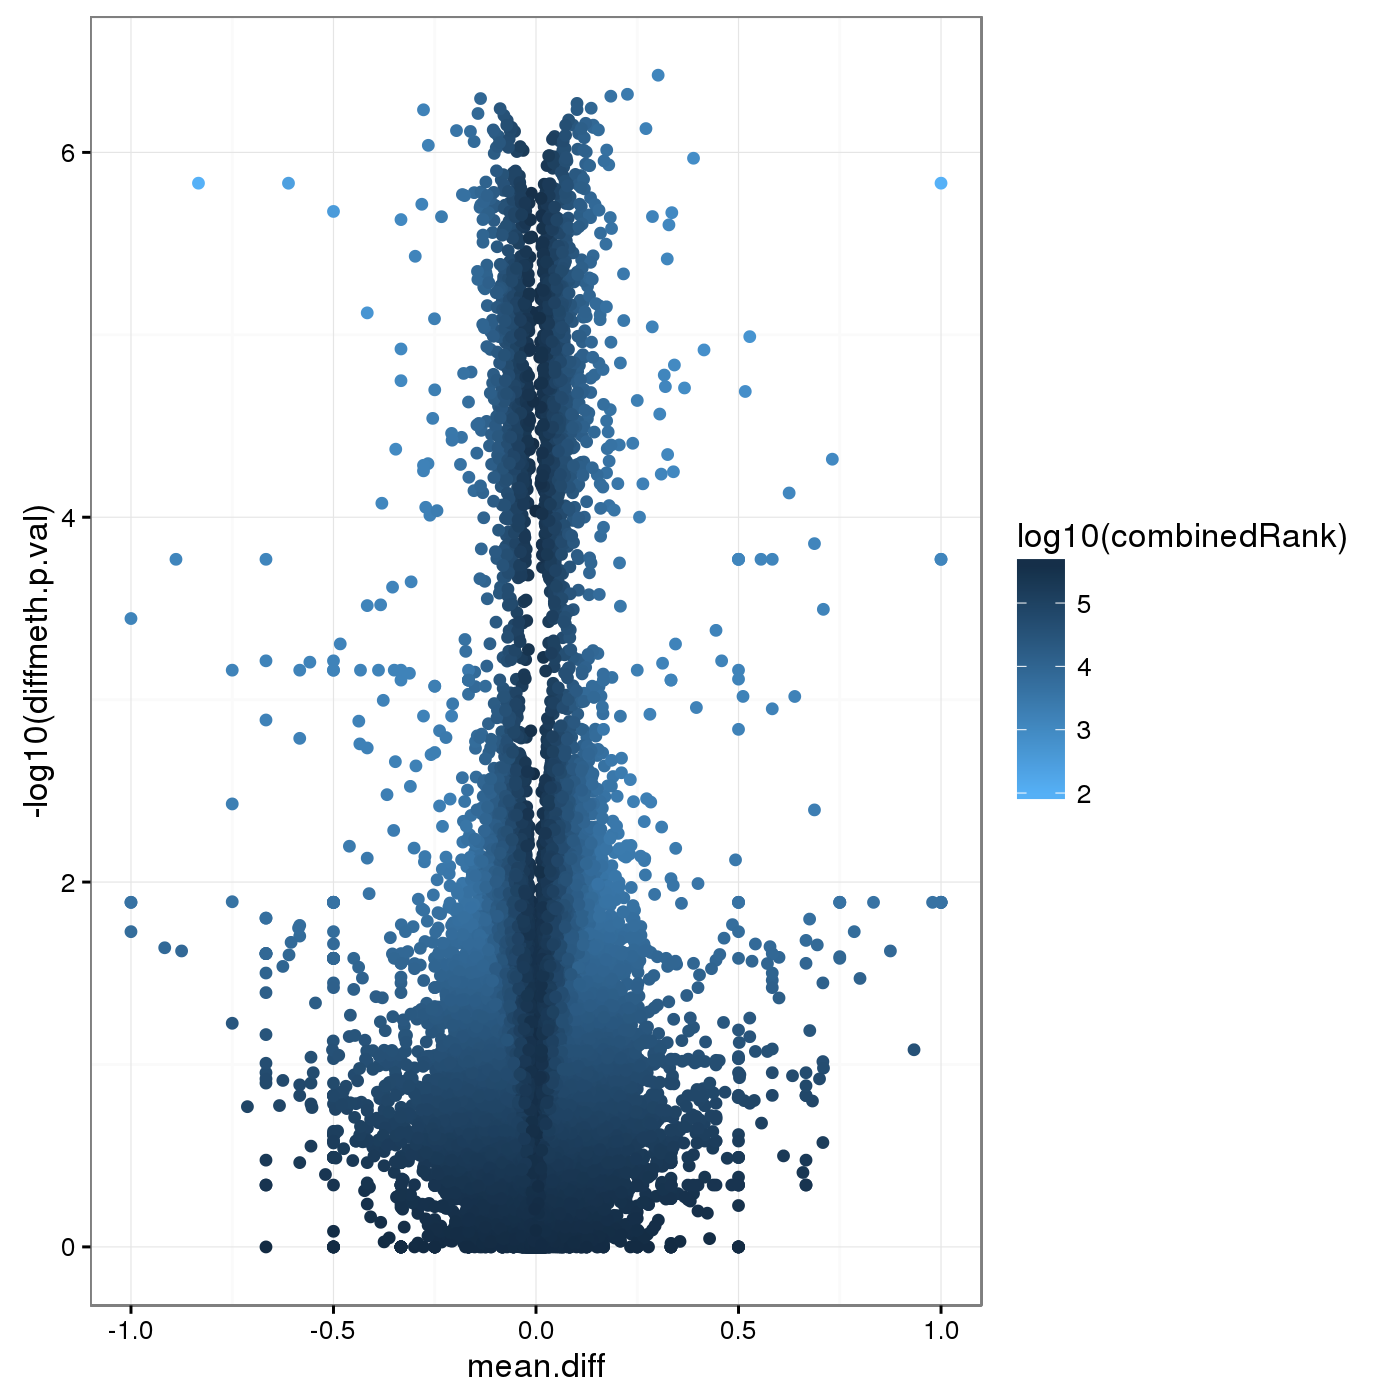
Volcano plot for differential methylation quantified by various metrics. Color scale according to combined ranking.
Differential Methylation Tables
A tabular overview of measures for differential methylation on the region level for the individual comparisons are provided in this section.
- id: region id
- Chromosome: chromosome of the region
- Start: start coordinate of the region
- End: end coordinate of the region
- mean.g1,mean.g2: (where g1 and g2 is replaced by the respective group names in the table) mean methylation in each of the two groups
- mean.diff: difference in methylation means between the two groups: mean.g1-mean.g2. In case of paired analysis, it is the mean of the pairwise differences.
- mean.quot.log2: log2 of the quotient in methylation: log2((mean.g1+epsilon)/(mean.g2+epsilon)), where epsilon:=0.01. In case of paired analysis, it is the mean of the pairwise quotients.
- diffmeth.p.val: p-value obtained from linear models employed in the limma package (or alternatively from a two-sided Welch t-test; which type of p-value is computed is specified in the differential.site.test.method option).
- max.g1,max.g2: maximum methylation level in group 1 and 2 respectively
- min.g1,min.g2: minimum methylation level in group 1 and 2 respectively
- sd.g1,sd.g2: standard deviation of methylation levels
- min.diff: Minimum of 0 and the smallest pairwise difference between samples of the two groups
- diffmeth.p.adj.fdr: FDR adjusted p-value of all sites
- combinedRank: mean.diff, mean.quot.log2 and diffmeth.p.val are ranked for all regions. This aggregates them using the maximum, i.e. worst rank of a site among the three measures
- num.na.g1,num.na.g2: number of NA methylation values for groups 1 and 2 respectively
- mean.covg.g1,mean.covg.g2: mean coverage of groups 1 and 2 respectively (In case of Infinium array methylation data, coverage is defined as combined beadcount.)
- min.covg.g1,min.covg.g2: minimum coverage of groups 1 and 2 respectively
- max.covg.g1,max.covg.g2: maximum coverage of groups 1 and 2 respectively
- covg.thresh.nsamples.g1,covg.thresh.nsamples.g2: number of samples in group 1 and 2 respectively exceeding the coverage threshold (1) for this region.
The tables for the individual comparisons can be found here:
| tiling | cpgislands | genes | promoters | ensembleRegBuildBPall | ensembleRegBuildBPallMerged | |
| CMP vs. MEP (based on cmp_ct_CMPvMEP) | csv | csv | csv | csv | csv | csv |
| CMP vs. GMP (based on cmp_ct_CMPvGMP) | csv | csv | csv | csv | csv | csv |
| CLP vs. CMP (based on cmp_ct_CMPvCLP) | csv | csv | csv | csv | csv | csv |
| GMP vs. MLP3 (based on cmp_ct_MLP3vGMP) | csv | csv | csv | csv | csv | csv |
| CLP vs. MLP0 (based on cmp_ct_CLPvMLP0) | csv | csv | csv | csv | csv | csv |
| CLP vs. MLP1 (based on cmp_ct_CLPvMLP1) | csv | csv | csv | csv | csv | csv |
| CLP vs. MLP2 (based on cmp_ct_CLPvMLP2) | csv | csv | csv | csv | csv | csv |
| CLP vs. MLP3 (based on cmp_ct_CLPvMLP3) | csv | csv | csv | csv | csv | csv |
| MLP1 vs. MLP2 (based on cmp_ct_MLP1vMLP2) | csv | csv | csv | csv | csv | csv |
| MLP2 vs. MLP3 (based on cmp_ct_MLP2vMLP3) | csv | csv | csv | csv | csv | csv |
| MLP1 vs. MLP3 (based on cmp_ct_MLP1vMLP3) | csv | csv | csv | csv | csv | csv |
| MLP0 vs. MLP1 (based on cmp_ct_MLP0vMLP1) | csv | csv | csv | csv | csv | csv |
| MLP0 vs. MLP2 (based on cmp_ct_MLP0vMLP2) | csv | csv | csv | csv | csv | csv |
| MLP0 vs. MLP3 (based on cmp_ct_MLP0vMLP3) | csv | csv | csv | csv | csv | csv |
| HSC vs. MPP (based on cmp_ct_HSCvMPP) | csv | csv | csv | csv | csv | csv |
| CMP vs. MPP (based on cmp_ct_MPPvCMP) | csv | csv | csv | csv | csv | csv |
| HSC vs. ML (based on cmp_ct_HSCvML) | csv | csv | csv | csv | csv | csv |
| LYM vs. MYE (based on cmp_ct_MYEvLYM) | csv | csv | csv | csv | csv | csv |
| BM vs. CB (based on cmp_src_HSC_BMvCB) | csv | csv | csv | csv | csv | csv |
| BM vs. FL (based on cmp_src_HSC_BMvFL) | csv | csv | csv | csv | csv | csv |
| BM vs. PB (based on cmp_src_HSC_BMvPB) | csv | csv | csv | csv | csv | csv |
| CB vs. FL (based on cmp_src_HSC_CBvFL) | csv | csv | csv | csv | csv | csv |
| CB vs. PB (based on cmp_src_HSC_CBvPB) | csv | csv | csv | csv | csv | csv |
| FL vs. PB (based on cmp_src_HSC_FLvPB) | csv | csv | csv | csv | csv | csv |
| BM vs. CB (based on cmp_src_MPP_BMvCB) | csv | csv | csv | csv | csv | csv |
| BM vs. PB (based on cmp_src_MPP_BMvPB) | csv | csv | csv | csv | csv | csv |
| CB vs. PB (based on cmp_src_MPP_CBvPB) | csv | csv | csv | csv | csv | csv |
| HSC vs. MPP (based on cmp_HSCvMPP_PB) | csv | csv | csv | csv | csv | csv |
| HSC vs. MPP (based on cmp_HSCvMPP_CB) | csv | csv | csv | csv | csv | csv |
| HSC vs. MPP (based on cmp_HSCvMPP_BM) | csv | csv | csv | csv | csv | csv |
Enrichment Analysis
Enrichment Analysis was conducted. The wordclouds and tables below contains significant GO terms as determined by a hypergeometric test.
| comparison | |
| Hypermethylation/hypomethylation | |
| ontology | |
| regions | |
| differential methylation measure |
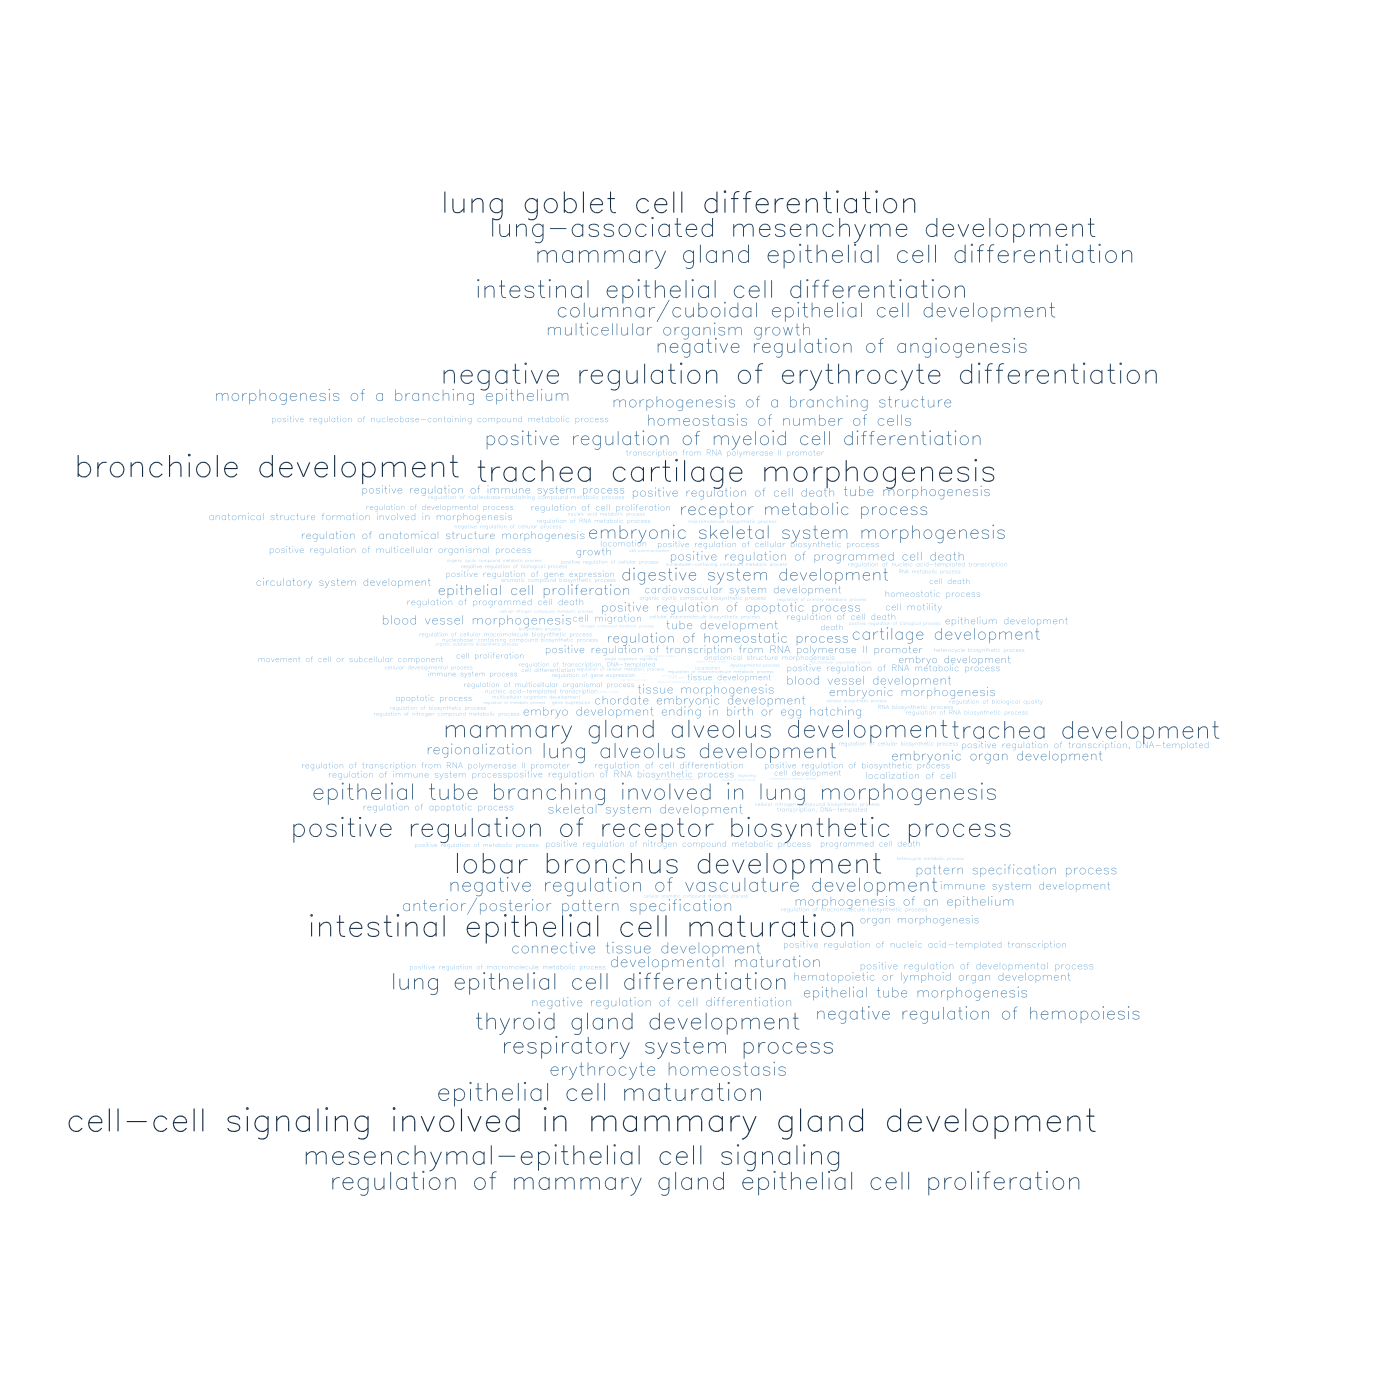
Wordclouds for GO enrichment terms.
| comparison | |
| Hypermethylation/hypomethylation | |
| ontology | |
| regions | |
| differential methylation measure |
| GOMFID | Pvalue | OddsRatio | ExpCount | Count | Size | Term |
| GO:0050911 | 4e-04 | 31.3263 | 0.1649 | 3 | 370 | detection of chemical stimulus involved in sensory perception of smell |
| GO:0009593 | 8e-04 | 25.5268 | 0.201 | 3 | 451 | detection of chemical stimulus |
| GO:0007606 | 8e-04 | 24.7858 | 0.2068 | 3 | 464 | sensory perception of chemical stimulus |
| GO:0050906 | 8e-04 | 24.7858 | 0.2068 | 3 | 464 | detection of stimulus involved in sensory perception |
| GO:0021542 | 0.0071 | 174.2333 | 0.0071 | 1 | 16 | dentate gyrus development |
| NA. |
| n/a |
| GOMFID | Pvalue | OddsRatio | ExpCount | Count | Size | Term |
| GO:0021509 | 2e-04 | Inf | 2e-04 | 1 | 1 | roof plate formation |
| GO:2001051 | 2e-04 | Inf | 2e-04 | 1 | 1 | positive regulation of tendon cell differentiation |
| GO:0035992 | 8e-04 | 2616.1667 | 8e-04 | 1 | 4 | tendon formation |
| GO:0021527 | 0.0029 | 560.2143 | 0.0029 | 1 | 15 | spinal cord association neuron differentiation |
| GO:0048853 | 0.0032 | 490.125 | 0.0032 | 1 | 17 | forebrain morphogenesis |
| GO:0045730 | 0.0048 | 326.5833 | 0.0048 | 1 | 25 | respiratory burst |
| GO:0060571 | 0.005 | 313.5 | 0.005 | 1 | 26 | morphogenesis of an epithelial fold |
| GO:0032924 | 0.008 | 190.9634 | 0.008 | 1 | 42 | activin receptor signaling pathway |
| GO:0010862 | 0.009 | 170.1522 | 0.009 | 1 | 47 | positive regulation of pathway-restricted SMAD protein phosphorylation |
| GOMFID | Pvalue | OddsRatio | ExpCount | Count | Size | Term |
| GO:0010868 | 4e-04 | 7849.5 | 4e-04 | 1 | 2 | negative regulation of triglyceride biosynthetic process |
| GO:0032792 | 0.001 | 1962 | 0.001 | 1 | 5 | negative regulation of CREB transcription factor activity |
| GO:2000210 | 0.0013 | 1307.8333 | 0.0013 | 1 | 7 | positive regulation of anoikis |
| GO:0061088 | 0.0019 | 871.7222 | 0.0019 | 1 | 10 | regulation of sequestering of zinc ion |
| GO:0045721 | 0.0023 | 713.1364 | 0.0023 | 1 | 12 | negative regulation of gluconeogenesis |
| GO:0043153 | 0.0036 | 435.6111 | 0.0036 | 1 | 19 | entrainment of circadian clock by photoperiod |
| GO:0006882 | 0.004 | 392 | 0.004 | 1 | 21 | cellular zinc ion homeostasis |
| GO:0071577 | 0.0042 | 373.3095 | 0.0042 | 1 | 22 | zinc II ion transmembrane transport |
| GO:0090207 | 0.0065 | 237.3788 | 0.0065 | 1 | 34 | regulation of triglyceride metabolic process |
| GO:0030001 | 0.0071 | 38.621 | 0.1481 | 2 | 775 | metal ion transport |
| GOMFID | Pvalue | OddsRatio | ExpCount | Count | Size | Term |
| GO:0035574 | 0 | 482.5538 | 0.0067 | 2 | 15 | histone H4-K20 demethylation |
| GO:0045653 | 0 | 392 | 0.008 | 2 | 18 | negative regulation of megakaryocyte differentiation |
| GO:0006335 | 1e-04 | 208.88 | 0.0143 | 2 | 32 | DNA replication-dependent nucleosome assembly |
| GO:0016577 | 1e-04 | 202.129 | 0.0147 | 2 | 33 | histone demethylation |
| GO:0008214 | 1e-04 | 189.8545 | 0.0156 | 2 | 35 | protein dealkylation |
| GO:0032776 | 1e-04 | 189.8545 | 0.0156 | 2 | 35 | DNA methylation on cytosine |
| GO:0051290 | 1e-04 | 174 | 0.0169 | 2 | 38 | protein heterotetramerization |
| GO:0034080 | 1e-04 | 164.8211 | 0.0178 | 2 | 40 | CENP-A containing nucleosome assembly |
| GO:0000183 | 1e-04 | 160.5846 | 0.0183 | 2 | 41 | chromatin silencing at rDNA |
| GO:1901532 | 2e-04 | 152.7317 | 0.0192 | 2 | 43 | regulation of hematopoietic progenitor cell differentiation |
| GO:0034724 | 2e-04 | 130.4 | 0.0223 | 2 | 50 | DNA replication-independent nucleosome organization |
| GO:0002548 | 3e-04 | 109.7474 | 0.0263 | 2 | 59 | monocyte chemotaxis |
| GO:0070988 | 3e-04 | 104.24 | 0.0276 | 2 | 62 | demethylation |
| GO:0006303 | 3e-04 | 99.2571 | 0.029 | 2 | 65 | double-strand break repair via nonhomologous end joining |
| GO:0043044 | 4e-04 | 90.5913 | 0.0317 | 2 | 71 | ATP-dependent chromatin remodeling |
| GO:0072676 | 5e-04 | 85.6055 | 0.0334 | 2 | 75 | lymphocyte migration |
| GO:0045815 | 5e-04 | 83.312 | 0.0343 | 2 | 77 | positive regulation of gene expression, epigenetic |
| GO:0070098 | 5e-04 | 81.1377 | 0.0352 | 2 | 79 | chemokine-mediated signaling pathway |
| GO:0030593 | 6e-04 | 74.3429 | 0.0383 | 2 | 86 | neutrophil chemotaxis |
| GO:0006305 | 6e-04 | 73.4635 | 0.0388 | 2 | 87 | DNA alkylation |
| GO:0071347 | 7e-04 | 70.9455 | 0.0401 | 2 | 90 | cellular response to interleukin-1 |
| GO:0044728 | 8e-04 | 63.6653 | 0.0446 | 2 | 100 | DNA methylation or demethylation |
| GO:0010868 | 9e-04 | 2615.8333 | 9e-04 | 1 | 2 | negative regulation of triglyceride biosynthetic process |
| GO:1902679 | 9e-04 | 16.4173 | 0.5274 | 4 | 1183 | negative regulation of RNA biosynthetic process |
| GO:0097530 | 0.001 | 57.7333 | 0.049 | 2 | 110 | granulocyte migration |
| GO:0050729 | 0.001 | 56.6764 | 0.0499 | 2 | 112 | positive regulation of inflammatory response |
| GO:0000723 | 0.0013 | 49.8272 | 0.0566 | 2 | 127 | telomere maintenance |
| GO:1903707 | 0.0014 | 48.65 | 0.058 | 2 | 130 | negative regulation of hemopoiesis |
| GO:0071346 | 0.0015 | 46.4537 | 0.0606 | 2 | 136 | cellular response to interferon-gamma |
| GO:0045934 | 0.0016 | 14.1574 | 0.604 | 4 | 1355 | negative regulation of nucleobase-containing compound metabolic process |
| GO:0031497 | 0.0016 | 45.4277 | 0.062 | 2 | 139 | chromatin assembly |
| GO:0035556 | 0.0017 | 13.09 | 1.1242 | 5 | 2522 | intracellular signal transduction |
| GO:0031047 | 0.0018 | 42.3102 | 0.0664 | 2 | 149 | gene silencing by RNA |
| GO:0000724 | 0.0019 | 41.7369 | 0.0673 | 2 | 151 | double-strand break repair via homologous recombination |
| GO:0045814 | 0.0019 | 41.7369 | 0.0673 | 2 | 151 | negative regulation of gene expression, epigenetic |
| GO:0009890 | 0.0021 | 12.9813 | 0.6535 | 4 | 1466 | negative regulation of biosynthetic process |
| GO:0032792 | 0.0022 | 653.8333 | 0.0022 | 1 | 5 | negative regulation of CREB transcription factor activity |
| GO:0065004 | 0.0023 | 37.1952 | 0.0753 | 2 | 169 | protein-DNA complex assembly |
| GO:0070374 | 0.0023 | 37.1952 | 0.0753 | 2 | 169 | positive regulation of ERK1 and ERK2 cascade |
| GO:0045637 | 0.0026 | 34.8719 | 0.0802 | 2 | 180 | regulation of myeloid cell differentiation |
| GO:2000503 | 0.0027 | 523.0333 | 0.0027 | 1 | 6 | positive regulation of natural killer cell chemotaxis |
| GO:2000210 | 0.0031 | 435.8333 | 0.0031 | 1 | 7 | positive regulation of anoikis |
| GO:0060326 | 0.0042 | 27.3805 | 0.1016 | 2 | 228 | cell chemotaxis |
| GO:0071103 | 0.0043 | 27.0166 | 0.103 | 2 | 231 | DNA conformation change |
| GO:0071356 | 0.0051 | 24.7136 | 0.1123 | 2 | 252 | cellular response to tumor necrosis factor |
| GO:0043117 | 0.0053 | 237.6515 | 0.0053 | 1 | 12 | positive regulation of vascular permeability |
| GO:0043922 | 0.0053 | 237.6515 | 0.0053 | 1 | 12 | negative regulation by host of viral transcription |
| GO:0045721 | 0.0053 | 237.6515 | 0.0053 | 1 | 12 | negative regulation of gluconeogenesis |
| GO:0043414 | 0.0057 | 23.2921 | 0.119 | 2 | 267 | macromolecule methylation |
| GO:0006310 | 0.0064 | 22.0229 | 0.1257 | 2 | 282 | DNA recombination |
| GO:0051252 | 0.0071 | 8.9103 | 1.5352 | 5 | 3444 | regulation of RNA metabolic process |
| GO:0000278 | 0.0075 | 11.0338 | 0.4467 | 3 | 1002 | mitotic cell cycle |
| GO:0010959 | 0.0083 | 19.1589 | 0.144 | 2 | 323 | regulation of metal ion transport |
| GO:0043153 | 0.0084 | 145.1667 | 0.0085 | 1 | 19 | entrainment of circadian clock by photoperiod |
| GO:1901623 | 0.0089 | 137.5175 | 0.0089 | 1 | 20 | regulation of lymphocyte chemotaxis |
| GO:0080090 | 0.0089 | 11.1697 | 2.4477 | 6 | 5491 | regulation of primary metabolic process |
| GO:0052472 | 0.0093 | 130.6333 | 0.0094 | 1 | 21 | modulation by host of symbiont transcription |
| GO:0031323 | 0.0097 | 10.9199 | 2.4839 | 6 | 5572 | regulation of cellular metabolic process |
| NA. |
| n/a |
| GOMFID | Pvalue | OddsRatio | ExpCount | Count | Size | Term |
| GO:0000028 | 0.002 | 1045.7333 | 0.002 | 1 | 16 | ribosomal small subunit assembly |
| GO:0000462 | 0.0032 | 653.2083 | 0.0032 | 1 | 25 | maturation of SSU-rRNA from tricistronic rRNA transcript (SSU-rRNA, 5.8S rRNA, LSU-rRNA) |
| GOMFID | Pvalue | OddsRatio | ExpCount | Count | Size | Term |
| GO:0000042 | 0 | 2010.5128 | 0.0092 | 5 | 18 | protein targeting to Golgi |
| GO:0006891 | 0 | 686.7105 | 0.0219 | 5 | 43 | intra-Golgi vesicle-mediated transport |
| GO:0072594 | 0 | 39.7887 | 0.324 | 5 | 636 | establishment of protein localization to organelle |
| GO:0006886 | 0 | 25.4124 | 0.4947 | 5 | 971 | intracellular protein transport |
| GO:0016192 | 2e-04 | 18.5017 | 0.6633 | 5 | 1302 | vesicle-mediated transport |
| GO:0070727 | 3e-04 | 16.1767 | 0.7494 | 5 | 1471 | cellular macromolecule localization |
| GO:1902582 | 5e-04 | 14.2933 | 0.8375 | 5 | 1644 | single-organism intracellular transport |
| GO:0008104 | 0.0026 | 9.6426 | 1.1809 | 5 | 2318 | protein localization |
| GO:0071702 | 0.0037 | 8.8345 | 1.2716 | 5 | 2496 | organic substance transport |
| GO:0051649 | 0.0037 | 8.8303 | 1.2721 | 5 | 2497 | establishment of localization in cell |
| GOMFID | Pvalue | OddsRatio | ExpCount | Count | Size | Term |
| GO:0010868 | 6e-04 | 3924.25 | 6e-04 | 1 | 2 | negative regulation of triglyceride biosynthetic process |
| GO:0032792 | 0.0016 | 980.875 | 0.0016 | 1 | 5 | negative regulation of CREB transcription factor activity |
| GO:2000210 | 0.0022 | 653.8333 | 0.0022 | 1 | 7 | positive regulation of anoikis |
| GO:0030522 | 0.0033 | 35.6713 | 0.0923 | 2 | 290 | intracellular receptor signaling pathway |
| GO:0045721 | 0.0038 | 356.5227 | 0.0038 | 1 | 12 | negative regulation of gluconeogenesis |
| GO:0043153 | 0.006 | 217.7778 | 0.006 | 1 | 19 | entrainment of circadian clock by photoperiod |
| GO:0002227 | 0.007 | 186.631 | 0.007 | 1 | 22 | innate immune response in mucosa |
| GO:0048387 | 0.0092 | 139.9107 | 0.0092 | 1 | 29 | negative regulation of retinoic acid receptor signaling pathway |
| GOMFID | Pvalue | OddsRatio | ExpCount | Count | Size | Term |
| GO:0009386 | 5e-04 | 5232.6667 | 5e-04 | 1 | 2 | translational attenuation |
| GO:0050911 | 0.0032 | 41.6603 | 0.0942 | 2 | 370 | detection of chemical stimulus involved in sensory perception of smell |
| GO:0000028 | 0.0041 | 348.5333 | 0.0041 | 1 | 16 | ribosomal small subunit assembly |
| GO:0009593 | 0.0048 | 33.9644 | 0.1149 | 2 | 451 | detection of chemical stimulus |
| GO:0007606 | 0.005 | 32.9805 | 0.1182 | 2 | 464 | sensory perception of chemical stimulus |
| GO:0050906 | 0.005 | 32.9805 | 0.1182 | 2 | 464 | detection of stimulus involved in sensory perception |
| GO:0000462 | 0.0064 | 217.7083 | 0.0064 | 1 | 25 | maturation of SSU-rRNA from tricistronic rRNA transcript (SSU-rRNA, 5.8S rRNA, LSU-rRNA) |
| GO:0048255 | 0.0081 | 168.4731 | 0.0082 | 1 | 32 | mRNA stabilization |
| GOMFID | Pvalue | OddsRatio | ExpCount | Count | Size | Term |
| GO:0000042 | 0 | 784.05 | 0.008 | 3 | 18 | protein targeting to Golgi |
| GO:0006891 | 0 | 293.55 | 0.0192 | 3 | 43 | intra-Golgi vesicle-mediated transport |
| GO:0050911 | 0 | 55.847 | 0.1649 | 4 | 370 | detection of chemical stimulus involved in sensory perception of smell |
| GO:0009593 | 0 | 45.4855 | 0.201 | 4 | 451 | detection of chemical stimulus |
| GO:0007606 | 0 | 44.1623 | 0.2068 | 4 | 464 | sensory perception of chemical stimulus |
| GO:0050906 | 0 | 44.1623 | 0.2068 | 4 | 464 | detection of stimulus involved in sensory perception |
| GO:0007186 | 9e-04 | 16.7705 | 0.5171 | 4 | 1160 | G-protein coupled receptor signaling pathway |
| GO:0050877 | 0.001 | 15.9625 | 0.5412 | 4 | 1214 | neurological system process |
| GO:0072594 | 0.002 | 17.8472 | 0.2835 | 3 | 636 | establishment of protein localization to organelle |
| GO:0006886 | 0.0068 | 11.4112 | 0.4328 | 3 | 971 | intracellular protein transport |
| GOMFID | Pvalue | OddsRatio | ExpCount | Count | Size | Term |
| GO:0007369 | 1e-04 | Inf | 0.0228 | 2 | 179 | gastrulation |
| GO:0038092 | 0.0019 | 1120.5 | 0.0019 | 1 | 15 | nodal signaling pathway |
| GO:0009790 | 0.0039 | Inf | 0.1252 | 2 | 983 | embryo development |
| GOMFID | Pvalue | OddsRatio | ExpCount | Count | Size | Term |
| GO:0042502 | 6e-04 | Inf | 6e-04 | 1 | 1 | tyrosine phosphorylation of Stat2 protein |
| GO:0043456 | 0.0029 | 490.3125 | 0.0029 | 1 | 5 | regulation of pentose-phosphate shunt |
| GO:0016051 | 0.0052 | 23.0685 | 0.1112 | 2 | 194 | carbohydrate biosynthetic process |
| GO:0006006 | 0.0064 | 20.6676 | 0.1238 | 2 | 216 | glucose metabolic process |
| GO:0046689 | 0.0086 | 140 | 0.0086 | 1 | 15 | response to mercury ion |
| GO:0021542 | 0.0091 | 130.6583 | 0.0092 | 1 | 16 | dentate gyrus development |
| NA. |
| n/a |
| GOMFID | Pvalue | OddsRatio | ExpCount | Count | Size | Term |
| GO:0048866 | 9e-04 | 2615.8333 | 9e-04 | 1 | 2 | stem cell fate specification |
| GO:0060214 | 0.0018 | 871.8333 | 0.0018 | 1 | 4 | endocardium formation |
| GO:0060836 | 0.0027 | 523.0333 | 0.0027 | 1 | 6 | lymphatic endothelial cell differentiation |
| GO:0060956 | 0.0027 | 523.0333 | 0.0027 | 1 | 6 | endocardial cell differentiation |
| GO:0090336 | 0.0031 | 435.8333 | 0.0031 | 1 | 7 | positive regulation of brown fat cell differentiation |
| GO:0043588 | 0.0049 | 25.2261 | 0.1101 | 2 | 247 | skin development |
| GO:0042789 | 0.0058 | 217.8333 | 0.0058 | 1 | 13 | mRNA transcription from RNA polymerase II promoter |
| GO:0001946 | 0.0062 | 201.0641 | 0.0062 | 1 | 14 | lymphangiogenesis |
| GO:0008544 | 0.0074 | 20.3208 | 0.136 | 2 | 305 | epidermis development |
| GO:0003159 | 0.0084 | 145.1667 | 0.0085 | 1 | 19 | morphogenesis of an endothelium |
| GO:0014850 | 0.0089 | 137.5175 | 0.0089 | 1 | 20 | response to muscle activity |
| GO:0030154 | 0.0092 | 8.2802 | 1.6248 | 5 | 3645 | cell differentiation |
| NA. |
| n/a |
| NA. |
| n/a |
| GOMFID | Pvalue | OddsRatio | ExpCount | Count | Size | Term |
| GO:0050726 | 5e-04 | Inf | 5e-04 | 1 | 1 | positive regulation of interleukin-1 alpha biosynthetic process |
| GO:0045360 | 0.001 | 2242 | 0.001 | 1 | 2 | regulation of interleukin-1 biosynthetic process |
| GO:0043137 | 0.002 | 747.2381 | 0.002 | 1 | 4 | DNA replication, removal of RNA primer |
| GO:0071222 | 0.0025 | 34.5444 | 0.0774 | 2 | 152 | cellular response to lipopolysaccharide |
| GO:0071216 | 0.0034 | 29.5619 | 0.0902 | 2 | 177 | cellular response to biotic stimulus |
| GO:0019236 | 0.0036 | 373.5476 | 0.0036 | 1 | 7 | response to pheromone |
| GO:0032650 | 0.0036 | 373.5476 | 0.0036 | 1 | 7 | regulation of interleukin-1 alpha production |
| GO:0006273 | 0.0041 | 320.1633 | 0.0041 | 1 | 8 | lagging strand elongation |
| GO:0071223 | 0.0046 | 280.125 | 0.0046 | 1 | 9 | cellular response to lipoteichoic acid |
| GO:0010510 | 0.0051 | 248.9841 | 0.0051 | 1 | 10 | regulation of acetyl-CoA biosynthetic process from pyruvate |
| GO:0010172 | 0.0066 | 186.7024 | 0.0066 | 1 | 13 | embryonic body morphogenesis |
| GO:0051770 | 0.0066 | 186.7024 | 0.0066 | 1 | 13 | positive regulation of nitric-oxide synthase biosynthetic process |
| GO:0006085 | 0.0081 | 149.3333 | 0.0082 | 1 | 16 | acetyl-CoA biosynthetic process |
| GO:2000251 | 0.0081 | 149.3333 | 0.0082 | 1 | 16 | positive regulation of actin cytoskeleton reorganization |
| GO:0051707 | 0.0084 | 9.9454 | 0.4565 | 3 | 896 | response to other organism |
| GO:2000811 | 0.0086 | 139.9911 | 0.0087 | 1 | 17 | negative regulation of anoikis |
| GO:0033993 | 0.0088 | 9.737 | 0.4656 | 3 | 914 | response to lipid |
| GO:0042762 | 0.0091 | 131.7479 | 0.0092 | 1 | 18 | regulation of sulfur metabolic process |
| GOMFID | Pvalue | OddsRatio | ExpCount | Count | Size | Term |
| GO:0042742 | 0.003 | 34.2279 | 0.0871 | 2 | 228 | defense response to bacterium |
| NA. |
| n/a |
| GOMFID | Pvalue | OddsRatio | ExpCount | Count | Size | Term |
| GO:0050911 | 0.0016 | 83.3261 | 0.0707 | 2 | 370 | detection of chemical stimulus involved in sensory perception of smell |
| GO:0009593 | 0.0024 | 67.9332 | 0.0862 | 2 | 451 | detection of chemical stimulus |
| GO:0007606 | 0.0026 | 65.9654 | 0.0886 | 2 | 464 | sensory perception of chemical stimulus |
| GO:0050906 | 0.0026 | 65.9654 | 0.0886 | 2 | 464 | detection of stimulus involved in sensory perception |
| GOMFID | Pvalue | OddsRatio | ExpCount | Count | Size | Term |
| GO:0007369 | 1e-04 | Inf | 0.0228 | 2 | 179 | gastrulation |
| GO:0038092 | 0.0019 | 1120.5 | 0.0019 | 1 | 15 | nodal signaling pathway |
| GO:0009790 | 0.0039 | Inf | 0.1252 | 2 | 983 | embryo development |
| NA. |
| n/a |
| GOMFID | Pvalue | OddsRatio | ExpCount | Count | Size | Term |
| GO:0006535 | 9e-04 | 2615.8333 | 9e-04 | 1 | 2 | cysteine biosynthetic process from serine |
| GO:0043418 | 9e-04 | 2615.8333 | 9e-04 | 1 | 2 | homocysteine catabolic process |
| GO:0006565 | 0.0013 | 1307.8333 | 0.0013 | 1 | 3 | L-serine catabolic process |
| GO:0019343 | 0.0013 | 1307.8333 | 0.0013 | 1 | 3 | cysteine biosynthetic process via cystathionine |
| GO:0019448 | 0.0013 | 1307.8333 | 0.0013 | 1 | 3 | L-cysteine catabolic process |
| GO:0042262 | 0.0013 | 1307.8333 | 0.0013 | 1 | 3 | DNA protection |
| GO:0019346 | 0.0018 | 871.8333 | 0.0018 | 1 | 4 | transsulfuration |
| GO:0070814 | 0.0018 | 871.8333 | 0.0018 | 1 | 4 | hydrogen sulfide biosynthetic process |
| GO:0045091 | 0.0036 | 373.5476 | 0.0036 | 1 | 8 | regulation of single stranded viral RNA replication via double stranded DNA intermediate |
| GO:0039694 | 0.0062 | 201.0641 | 0.0062 | 1 | 14 | viral RNA genome replication |
| GO:0050930 | 0.0062 | 201.0641 | 0.0062 | 1 | 14 | induction of positive chemotaxis |
| GO:0009070 | 0.0071 | 174.2333 | 0.0071 | 1 | 16 | serine family amino acid biosynthetic process |
| GO:0006346 | 0.008 | 153.7157 | 0.008 | 1 | 18 | methylation-dependent chromatin silencing |
| GO:0000097 | 0.0084 | 145.1667 | 0.0085 | 1 | 19 | sulfur amino acid biosynthetic process |
| GO:0036499 | 0.0084 | 145.1667 | 0.0085 | 1 | 19 | PERK-mediated unfolded protein response |
| GO:0033141 | 0.0093 | 130.6333 | 0.0094 | 1 | 21 | positive regulation of peptidyl-serine phosphorylation of STAT protein |
| GOMFID | Pvalue | OddsRatio | ExpCount | Count | Size | Term |
| GO:0035589 | 0.0025 | 581.1111 | 0.0025 | 1 | 10 | G-protein coupled purinergic nucleotide receptor signaling pathway |
| GO:0009813 | 0.0046 | 307.4902 | 0.0046 | 1 | 18 | flavonoid biosynthetic process |
| GO:0052696 | 0.0051 | 275.0877 | 0.0051 | 1 | 20 | flavonoid glucuronidation |
| GO:0007194 | 0.0061 | 227.1884 | 0.0061 | 1 | 24 | negative regulation of adenylate cyclase activity |
| GO:0035587 | 0.0069 | 200.9359 | 0.0069 | 1 | 27 | purinergic receptor signaling pathway |
| GO:0019585 | 0.0076 | 180.1149 | 0.0076 | 1 | 30 | glucuronate metabolic process |
| GO:0030803 | 0.0096 | 141.0991 | 0.0097 | 1 | 38 | negative regulation of cyclic nucleotide biosynthetic process |
| NA. |
| n/a |
| GOMFID | Pvalue | OddsRatio | ExpCount | Count | Size | Term |
| GO:0000042 | 0 | 1045.4667 | 0.0069 | 3 | 18 | protein targeting to Golgi |
| GO:0006891 | 0 | 391.425 | 0.0164 | 3 | 43 | intra-Golgi vesicle-mediated transport |
| GO:0050911 | 2e-04 | 41.7711 | 0.1414 | 3 | 370 | detection of chemical stimulus involved in sensory perception of smell |
| GO:0009593 | 4e-04 | 34.0379 | 0.1723 | 3 | 451 | detection of chemical stimulus |
| GO:0007606 | 5e-04 | 33.0499 | 0.1773 | 3 | 464 | sensory perception of chemical stimulus |
| GO:0050906 | 5e-04 | 33.0499 | 0.1773 | 3 | 464 | detection of stimulus involved in sensory perception |
| GO:0072594 | 0.0012 | 23.7978 | 0.243 | 3 | 636 | establishment of protein localization to organelle |
| GO:0006886 | 0.0041 | 15.2159 | 0.371 | 3 | 971 | intracellular protein transport |
| GO:0007186 | 0.0068 | 12.567 | 0.4432 | 3 | 1160 | G-protein coupled receptor signaling pathway |
| GO:0050877 | 0.0077 | 11.962 | 0.4639 | 3 | 1214 | neurological system process |
| GO:0016192 | 0.0094 | 11.0839 | 0.4975 | 3 | 1302 | vesicle-mediated transport |
| NA. |
| n/a |
| GOMFID | Pvalue | OddsRatio | ExpCount | Count | Size | Term |
| GO:0071918 | 0.0011 | 1569.5 | 0.0011 | 1 | 6 | urea transmembrane transport |
| GO:0050911 | 0.0016 | 83.3261 | 0.0707 | 2 | 370 | detection of chemical stimulus involved in sensory perception of smell |
| GO:0019755 | 0.0019 | 871.7222 | 0.0019 | 1 | 10 | one-carbon compound transport |
| GO:0015793 | 0.0021 | 784.5 | 0.0021 | 1 | 11 | glycerol transport |
| GO:0009593 | 0.0024 | 67.9332 | 0.0862 | 2 | 451 | detection of chemical stimulus |
| GO:0007606 | 0.0026 | 65.9654 | 0.0886 | 2 | 464 | sensory perception of chemical stimulus |
| GO:0050906 | 0.0026 | 65.9654 | 0.0886 | 2 | 464 | detection of stimulus involved in sensory perception |
| GO:0006833 | 0.0074 | 206.0789 | 0.0075 | 1 | 39 | water transport |
| GOMFID | Pvalue | OddsRatio | ExpCount | Count | Size | Term |
| GO:0006972 | 0.0027 | 784.05 | 0.0027 | 1 | 21 | hyperosmotic response |
| GO:0042104 | 0.0034 | 602.8846 | 0.0034 | 1 | 27 | positive regulation of activated T cell proliferation |
| GO:0031295 | 0.0093 | 217.0694 | 0.0093 | 1 | 73 | T cell costimulation |
| GOMFID | Pvalue | OddsRatio | ExpCount | Count | Size | Term |
| GO:0050911 | 6e-04 | Inf | 0.0471 | 2 | 370 | detection of chemical stimulus involved in sensory perception of smell |
| GO:0009593 | 8e-04 | Inf | 0.0574 | 2 | 451 | detection of chemical stimulus |
| GO:0007606 | 9e-04 | Inf | 0.0591 | 2 | 464 | sensory perception of chemical stimulus |
| GO:0050906 | 9e-04 | Inf | 0.0591 | 2 | 464 | detection of stimulus involved in sensory perception |
| GO:0007186 | 0.0055 | Inf | 0.1477 | 2 | 1160 | G-protein coupled receptor signaling pathway |
| GO:0050877 | 0.006 | Inf | 0.1546 | 2 | 1214 | neurological system process |
| GOMFID | Pvalue | OddsRatio | ExpCount | Count | Size | Term |
| GO:0000042 | 0 | Inf | 0.0057 | 5 | 18 | protein targeting to Golgi |
| GO:0006891 | 0 | Inf | 0.0137 | 5 | 43 | intra-Golgi vesicle-mediated transport |
| GO:0072594 | 0 | Inf | 0.2025 | 5 | 636 | establishment of protein localization to organelle |
| GO:0006886 | 0 | Inf | 0.3092 | 5 | 971 | intracellular protein transport |
| GO:0016192 | 0 | Inf | 0.4146 | 5 | 1302 | vesicle-mediated transport |
| GO:0070727 | 0 | Inf | 0.4684 | 5 | 1471 | cellular macromolecule localization |
| GO:1902582 | 0 | Inf | 0.5235 | 5 | 1644 | single-organism intracellular transport |
| GO:0008104 | 1e-04 | Inf | 0.7381 | 5 | 2318 | protein localization |
| GO:0071702 | 1e-04 | Inf | 0.7948 | 5 | 2496 | organic substance transport |
| GO:0051649 | 1e-04 | Inf | 0.7951 | 5 | 2497 | establishment of localization in cell |
| GO:1902578 | 9e-04 | Inf | 1.2431 | 5 | 3904 | single-organism localization |
| GOMFID | Pvalue | OddsRatio | ExpCount | Count | Size | Term |
| GO:0061088 | 0.0013 | 1743.5556 | 0.0013 | 1 | 10 | regulation of sequestering of zinc ion |
| GO:0006882 | 0.0027 | 784.05 | 0.0027 | 1 | 21 | cellular zinc ion homeostasis |
| GO:0071577 | 0.0028 | 746.6667 | 0.0028 | 1 | 22 | zinc II ion transmembrane transport |
| GO:0010043 | 0.0067 | 300.9423 | 0.0068 | 1 | 53 | response to zinc ion |
| GOMFID | Pvalue | OddsRatio | ExpCount | Count | Size | Term |
| GO:0010868 | 3e-04 | 15700 | 3e-04 | 1 | 2 | negative regulation of triglyceride biosynthetic process |
| GO:0032792 | 6e-04 | 3924.25 | 6e-04 | 1 | 5 | negative regulation of CREB transcription factor activity |
| GO:2000210 | 9e-04 | 2615.8333 | 9e-04 | 1 | 7 | positive regulation of anoikis |
| GO:0045721 | 0.0015 | 1426.3636 | 0.0015 | 1 | 12 | negative regulation of gluconeogenesis |
| GO:0043153 | 0.0024 | 871.2778 | 0.0024 | 1 | 19 | entrainment of circadian clock by photoperiod |
| GO:0090207 | 0.0043 | 474.7879 | 0.0043 | 1 | 34 | regulation of triglyceride metabolic process |
| GO:0010830 | 0.0069 | 295.2453 | 0.0069 | 1 | 54 | regulation of myotube differentiation |
| GO:0045912 | 0.007 | 289.7593 | 0.007 | 1 | 55 | negative regulation of carbohydrate metabolic process |
| GOMFID | Pvalue | OddsRatio | ExpCount | Count | Size | Term |
| GO:0007586 | 0 | 293.2075 | 0.0413 | 3 | 162 | digestion |
| GO:0005975 | 9e-04 | 46.1105 | 0.245 | 3 | 962 | carbohydrate metabolic process |
| GOMFID | Pvalue | OddsRatio | ExpCount | Count | Size | Term |
| GO:0045091 | 0.0025 | 560.3929 | 0.0025 | 1 | 8 | regulation of single stranded viral RNA replication via double stranded DNA intermediate |
| GO:0007186 | 0.0036 | 18.8518 | 0.3694 | 3 | 1160 | G-protein coupled receptor signaling pathway |
| GO:0039694 | 0.0045 | 301.6346 | 0.0045 | 1 | 14 | viral RNA genome replication |
| GO:0050930 | 0.0045 | 301.6346 | 0.0045 | 1 | 14 | induction of positive chemotaxis |
| GO:0050911 | 0.0053 | 27.7717 | 0.1178 | 2 | 370 | detection of chemical stimulus involved in sensory perception of smell |
| GO:0036499 | 0.006 | 217.7778 | 0.006 | 1 | 19 | PERK-mediated unfolded protein response |
| GO:0009593 | 0.0078 | 22.6414 | 0.1436 | 2 | 451 | detection of chemical stimulus |
| GO:0042119 | 0.0079 | 163.2708 | 0.008 | 1 | 25 | neutrophil activation |
| GO:0050926 | 0.0079 | 163.2708 | 0.008 | 1 | 25 | regulation of positive chemotaxis |
| GO:0090023 | 0.0079 | 163.2708 | 0.008 | 1 | 25 | positive regulation of neutrophil chemotaxis |
| GO:0007606 | 0.0082 | 21.9856 | 0.1477 | 2 | 464 | sensory perception of chemical stimulus |
| GO:0050906 | 0.0082 | 21.9856 | 0.1477 | 2 | 464 | detection of stimulus involved in sensory perception |
| GOMFID | Pvalue | OddsRatio | ExpCount | Count | Size | Term |
| GO:0007586 | 0 | 146.5943 | 0.0516 | 3 | 162 | digestion |
| GO:0032776 | 0 | 316.4646 | 0.0111 | 2 | 35 | DNA methylation on cytosine |
| GO:0000183 | 1e-04 | 267.6752 | 0.0131 | 2 | 41 | chromatin silencing at rDNA |
| GO:0045815 | 2e-04 | 138.8711 | 0.0245 | 2 | 77 | positive regulation of gene expression, epigenetic |
| GO:0006305 | 3e-04 | 122.4549 | 0.0277 | 2 | 87 | DNA alkylation |
| GO:0044728 | 4e-04 | 106.1224 | 0.0318 | 2 | 100 | DNA methylation or demethylation |
| GO:0006334 | 6e-04 | 87.2773 | 0.0385 | 2 | 121 | nucleosome assembly |
| GO:0031047 | 9e-04 | 70.5261 | 0.0474 | 2 | 149 | gene silencing by RNA |
| GO:0045814 | 9e-04 | 69.5705 | 0.0481 | 2 | 151 | negative regulation of gene expression, epigenetic |
| GO:0006333 | 0.001 | 64.3354 | 0.0519 | 2 | 163 | chromatin assembly or disassembly |
| GO:0006323 | 0.0012 | 60.5341 | 0.0551 | 2 | 173 | DNA packaging |
| GO:0071824 | 0.0015 | 53.5579 | 0.0621 | 2 | 195 | protein-DNA complex subunit organization |
| GO:0005975 | 0.0021 | 23.0537 | 0.3063 | 3 | 962 | carbohydrate metabolic process |
| GO:0043414 | 0.0028 | 38.8252 | 0.085 | 2 | 267 | macromolecule methylation |
| GOMFID | Pvalue | OddsRatio | ExpCount | Count | Size | Term |
| GO:0002642 | 4e-04 | Inf | 4e-04 | 1 | 1 | positive regulation of immunoglobulin biosynthetic process |
| GO:0002377 | 4e-04 | 97.6063 | 0.0313 | 2 | 82 | immunoglobulin production |
| GO:2001274 | 0.0011 | 1569.5 | 0.0011 | 1 | 3 | negative regulation of glucose import in response to insulin stimulus |
| GO:0070317 | 0.0015 | 1046.2667 | 0.0015 | 1 | 4 | negative regulation of G0 to G1 transition |
| GO:0010890 | 0.0027 | 523.0333 | 0.0027 | 1 | 7 | positive regulation of sequestering of triglyceride |
| GO:0034389 | 0.0053 | 241.2923 | 0.0053 | 1 | 14 | lipid particle organization |
| GO:0033622 | 0.0061 | 209.0933 | 0.0061 | 1 | 16 | integrin activation |
| GO:0010829 | 0.0069 | 184.4706 | 0.0069 | 1 | 18 | negative regulation of glucose transport |
| GO:0016338 | 0.0088 | 142.5 | 0.0088 | 1 | 23 | calcium-independent cell-cell adhesion via plasma membrane cell-adhesion molecules |
| GOMFID | Pvalue | OddsRatio | ExpCount | Count | Size | Term |
| GO:0061088 | 0.0013 | 1743.5556 | 0.0013 | 1 | 10 | regulation of sequestering of zinc ion |
| GO:0000028 | 0.002 | 1045.7333 | 0.002 | 1 | 16 | ribosomal small subunit assembly |
| GO:0006882 | 0.0027 | 784.05 | 0.0027 | 1 | 21 | cellular zinc ion homeostasis |
| GO:0071577 | 0.0028 | 746.6667 | 0.0028 | 1 | 22 | zinc II ion transmembrane transport |
| GO:0000462 | 0.0032 | 653.2083 | 0.0032 | 1 | 25 | maturation of SSU-rRNA from tricistronic rRNA transcript (SSU-rRNA, 5.8S rRNA, LSU-rRNA) |
| GO:0010043 | 0.0067 | 300.9423 | 0.0068 | 1 | 53 | response to zinc ion |
| GOMFID | Pvalue | OddsRatio | ExpCount | Count | Size | Term |
| GO:0061088 | 0.0019 | 871.7222 | 0.0019 | 1 | 10 | regulation of sequestering of zinc ion |
| GO:0006882 | 0.004 | 392 | 0.004 | 1 | 21 | cellular zinc ion homeostasis |
| GO:0071577 | 0.0042 | 373.3095 | 0.0042 | 1 | 22 | zinc II ion transmembrane transport |
| GOMFID | Pvalue | OddsRatio | ExpCount | Count | Size | Term |
| GO:0061088 | 0.0025 | 581.1111 | 0.0025 | 1 | 10 | regulation of sequestering of zinc ion |
| GO:0050911 | 0.0032 | 41.6603 | 0.0942 | 2 | 370 | detection of chemical stimulus involved in sensory perception of smell |
| GO:0009593 | 0.0048 | 33.9644 | 0.1149 | 2 | 451 | detection of chemical stimulus |
| GO:0007606 | 0.005 | 32.9805 | 0.1182 | 2 | 464 | sensory perception of chemical stimulus |
| GO:0050906 | 0.005 | 32.9805 | 0.1182 | 2 | 464 | detection of stimulus involved in sensory perception |
| GO:0006882 | 0.0053 | 261.3167 | 0.0053 | 1 | 21 | cellular zinc ion homeostasis |
| GO:0071577 | 0.0056 | 248.8571 | 0.0056 | 1 | 22 | zinc II ion transmembrane transport |
| GOMFID | Pvalue | OddsRatio | ExpCount | Count | Size | Term |
| GO:0050911 | 6e-04 | Inf | 0.0471 | 2 | 370 | detection of chemical stimulus involved in sensory perception of smell |
| GO:0009593 | 8e-04 | Inf | 0.0574 | 2 | 451 | detection of chemical stimulus |
| GO:0007606 | 9e-04 | Inf | 0.0591 | 2 | 464 | sensory perception of chemical stimulus |
| GO:0050906 | 9e-04 | Inf | 0.0591 | 2 | 464 | detection of stimulus involved in sensory perception |
| GO:0007186 | 0.0055 | Inf | 0.1477 | 2 | 1160 | G-protein coupled receptor signaling pathway |
| GO:0050877 | 0.006 | Inf | 0.1546 | 2 | 1214 | neurological system process |
| NA. |
| n/a |
| GOMFID | Pvalue | OddsRatio | ExpCount | Count | Size | Term |
| GO:0001881 | 0.0017 | Inf | 0.0017 | 1 | 27 | receptor recycling |
| GO:0033572 | 0.0022 | Inf | 0.0022 | 1 | 35 | transferrin transport |
| GO:0072512 | 0.0024 | Inf | 0.0024 | 1 | 37 | trivalent inorganic cation transport |
| GO:0006826 | 0.0034 | Inf | 0.0034 | 1 | 53 | iron ion transport |
| GO:0098792 | 0.0068 | Inf | 0.0068 | 1 | 106 | xenophagy |
| GO:0002230 | 0.0078 | Inf | 0.0078 | 1 | 122 | positive regulation of defense response to virus by host |
| GO:0098779 | 0.0084 | Inf | 0.0084 | 1 | 132 | mitophagy in response to mitochondrial depolarization |
| NA. |
| n/a |
| NA. |
| n/a |
| NA. |
| n/a |
| NA. |
| n/a |
| GOMFID | Pvalue | OddsRatio | ExpCount | Count | Size | Term |
| GO:0004984 | 2e-04 | 41.8937 | 0.141 | 3 | 370 | olfactory receptor activity |
| GO:0004930 | 0.0022 | 19.2339 | 0.2976 | 3 | 781 | G-protein coupled receptor activity |
| GO:0016175 | 0.003 | 449.5714 | 0.003 | 1 | 8 | superoxide-generating NADPH oxidase activity |
| GO:0099600 | 0.0077 | 11.9777 | 0.4633 | 3 | 1216 | transmembrane receptor activity |
| GO:0038023 | 0.0087 | 11.4344 | 0.4835 | 3 | 1269 | signaling receptor activity |
| NA. |
| n/a |
| GOMFID | Pvalue | OddsRatio | ExpCount | Count | Size | Term |
| GO:0005160 | 0.0062 | 327.0417 | 0.0062 | 1 | 49 | transforming growth factor beta receptor binding |
| GOMFID | Pvalue | OddsRatio | ExpCount | Count | Size | Term |
| GO:0008140 | 0.0019 | 874.2222 | 0.0019 | 1 | 10 | cAMP response element binding protein binding |
| GO:0071889 | 0.0038 | 413.8421 | 0.0038 | 1 | 20 | 14-3-3 protein binding |
| GO:0005385 | 0.004 | 393.125 | 0.004 | 1 | 21 | zinc ion transmembrane transporter activity |
| GOMFID | Pvalue | OddsRatio | ExpCount | Count | Size | Term |
| GO:0035575 | 0 | 483.9385 | 0.0067 | 2 | 15 | histone demethylase activity (H4-K20 specific) |
| GO:0032451 | 1e-04 | 179.4971 | 0.0164 | 2 | 37 | demethylase activity |
| GO:0008009 | 2e-04 | 136.4783 | 0.0213 | 2 | 48 | chemokine activity |
| GO:0042393 | 0.0022 | 37.9927 | 0.0738 | 2 | 166 | histone binding |
| GO:0031726 | 0.0027 | 524.5333 | 0.0027 | 1 | 6 | CCR1 chemokine receptor binding |
| GO:0031730 | 0.0027 | 524.5333 | 0.0027 | 1 | 6 | CCR5 chemokine receptor binding |
| GO:0008140 | 0.0044 | 291.3333 | 0.0044 | 1 | 10 | cAMP response element binding protein binding |
| GO:0001664 | 0.005 | 24.9887 | 0.1111 | 2 | 250 | G-protein coupled receptor binding |
| GO:0005126 | 0.0056 | 23.45 | 0.1182 | 2 | 266 | cytokine receptor binding |
| GO:0071889 | 0.0089 | 137.9123 | 0.0089 | 1 | 20 | 14-3-3 protein binding |
| GO:0048020 | 0.0099 | 125.664 | 0.0099 | 1 | 26 | CCR chemokine receptor binding |
| GOMFID | Pvalue | OddsRatio | ExpCount | Count | Size | Term |
| GO:0001965 | 0.0053 | 262.0667 | 0.0053 | 1 | 21 | G-protein alpha-subunit binding |
| GO:0042605 | 0.0061 | 227.8406 | 0.0061 | 1 | 24 | peptide antigen binding |
| GO:0030515 | 0.0063 | 218.3333 | 0.0064 | 1 | 25 | snoRNA binding |
| NA. |
| n/a |
| GOMFID | Pvalue | OddsRatio | ExpCount | Count | Size | Term |
| GO:0030515 | 0.0032 | 655.0833 | 0.0032 | 1 | 25 | snoRNA binding |
| NA. |
| n/a |
| GOMFID | Pvalue | OddsRatio | ExpCount | Count | Size | Term |
| GO:0008536 | 0.0073 | 187.0952 | 0.0074 | 1 | 29 | Ran GTPase binding |
| GOMFID | Pvalue | OddsRatio | ExpCount | Count | Size | Term |
| GO:0008140 | 0.0025 | 582.7778 | 0.0025 | 1 | 10 | cAMP response element binding protein binding |
| GO:0071889 | 0.0051 | 275.8772 | 0.0051 | 1 | 20 | 14-3-3 protein binding |
| GOMFID | Pvalue | OddsRatio | ExpCount | Count | Size | Term |
| GO:0004984 | 0.0032 | 41.7826 | 0.094 | 2 | 370 | olfactory receptor activity |
| GO:0030515 | 0.0063 | 218.3333 | 0.0064 | 1 | 25 | snoRNA binding |
| GO:0045182 | 0.0086 | 158.697 | 0.0086 | 1 | 34 | translation regulator activity |
| GOMFID | Pvalue | OddsRatio | ExpCount | Count | Size | Term |
| GO:0004984 | 0 | Inf | 0.094 | 4 | 370 | olfactory receptor activity |
| GO:0004930 | 0 | Inf | 0.1984 | 4 | 781 | G-protein coupled receptor activity |
| GO:0099600 | 0 | Inf | 0.3089 | 4 | 1216 | transmembrane receptor activity |
| GO:0038023 | 0 | Inf | 0.3223 | 4 | 1269 | signaling receptor activity |
| GO:0060089 | 1e-04 | Inf | 0.3823 | 4 | 1505 | molecular transducer activity |
| GOMFID | Pvalue | OddsRatio | ExpCount | Count | Size | Term |
| GO:0038100 | 4e-04 | 7872 | 4e-04 | 1 | 2 | nodal binding |
| GOMFID | Pvalue | OddsRatio | ExpCount | Count | Size | Term |
| GO:0004082 | 0.0025 | 582.7778 | 0.0025 | 1 | 4 | bisphosphoglycerate mutase activity |
| GO:0046538 | 0.0025 | 582.7778 | 0.0025 | 1 | 4 | 2,3-bisphosphoglycerate-dependent phosphoglycerate mutase activity |
| GO:0004083 | 0.0032 | 437.0556 | 0.0032 | 1 | 5 | bisphosphoglycerate 2-phosphatase activity |
| NA. |
| n/a |
| GOMFID | Pvalue | OddsRatio | ExpCount | Count | Size | Term |
| GO:0071862 | 6e-04 | 3935.5 | 6e-04 | 1 | 2 | protein phosphatase type 1 activator activity |
| GO:0008508 | 0.0016 | 983.6875 | 0.0016 | 1 | 5 | bile acid:sodium symporter activity |
| GO:0019957 | 0.0022 | 655.7083 | 0.0022 | 1 | 7 | C-C chemokine binding |
| GO:0019211 | 0.0035 | 393.325 | 0.0035 | 1 | 11 | phosphatase activator activity |
| GO:0008157 | 0.0063 | 206.8947 | 0.0064 | 1 | 20 | protein phosphatase 1 binding |
| GO:0050699 | 0.007 | 187.1667 | 0.007 | 1 | 22 | WW domain binding |
| GOMFID | Pvalue | OddsRatio | ExpCount | Count | Size | Term |
| GO:0004984 | 0.0078 | 20.8886 | 0.141 | 2 | 370 | olfactory receptor activity |
| NA. |
| n/a |
| GOMFID | Pvalue | OddsRatio | ExpCount | Count | Size | Term |
| GO:0004740 | 0.0021 | 786.75 | 0.0021 | 1 | 3 | pyruvate dehydrogenase (acetyl-transferring) kinase activity |
| GO:0016503 | 0.0021 | 786.75 | 0.0021 | 1 | 3 | pheromone receptor activity |
| GO:0055131 | 0.0042 | 314.64 | 0.0042 | 1 | 6 | C3HC4-type RING finger domain binding |
| GO:0044183 | 0.0097 | 120.9538 | 0.0098 | 1 | 14 | protein binding involved in protein folding |
| GOMFID | Pvalue | OddsRatio | ExpCount | Count | Size | Term |
| GO:0001055 | 0.0013 | 1748.5556 | 0.0013 | 1 | 10 | RNA polymerase II activity |
| GO:0001054 | 0.0015 | 1430.4545 | 0.0015 | 1 | 12 | RNA polymerase I activity |
| GO:0005132 | 0.0022 | 983.125 | 0.0022 | 1 | 17 | type I interferon receptor binding |
| GO:0001056 | 0.0023 | 925.2353 | 0.0023 | 1 | 18 | RNA polymerase III activity |
| GO:0034062 | 0.0053 | 383.0488 | 0.0053 | 1 | 42 | RNA polymerase activity |
| NA. |
| n/a |
| GOMFID | Pvalue | OddsRatio | ExpCount | Count | Size | Term |
| GO:0005130 | 5e-04 | Inf | 5e-04 | 1 | 1 | granulocyte colony-stimulating factor receptor binding |
| GO:0004740 | 0.0015 | 1124.1429 | 0.0015 | 1 | 3 | pyruvate dehydrogenase (acetyl-transferring) kinase activity |
| GO:0016503 | 0.0015 | 1124.1429 | 0.0015 | 1 | 3 | pheromone receptor activity |
| GO:0004523 | 0.0036 | 374.619 | 0.0036 | 1 | 7 | RNA-DNA hybrid ribonuclease activity |
| GO:0005125 | 0.0049 | 24.2989 | 0.1092 | 2 | 215 | cytokine activity |
| NA. |
| n/a |
| NA. |
| n/a |
| GOMFID | Pvalue | OddsRatio | ExpCount | Count | Size | Term |
| GO:0071862 | 8e-04 | 3148.2 | 8e-04 | 1 | 2 | protein phosphatase type 1 activator activity |
| GO:0019211 | 0.0042 | 314.64 | 0.0042 | 1 | 11 | phosphatase activator activity |
| GO:0005132 | 0.0065 | 196.575 | 0.0065 | 1 | 17 | type I interferon receptor binding |
| GO:0008157 | 0.0076 | 165.5053 | 0.0076 | 1 | 20 | protein phosphatase 1 binding |
| GO:0004984 | 0.0078 | 20.8886 | 0.141 | 2 | 370 | olfactory receptor activity |
| GOMFID | Pvalue | OddsRatio | ExpCount | Count | Size | Term |
| GO:0004984 | 0.0032 | 41.7826 | 0.094 | 2 | 370 | olfactory receptor activity |
| GOMFID | Pvalue | OddsRatio | ExpCount | Count | Size | Term |
| GO:0038100 | 1e-04 | Inf | 1e-04 | 1 | 2 | nodal binding |
| NA. |
| n/a |
| GOMFID | Pvalue | OddsRatio | ExpCount | Count | Size | Term |
| GO:0004124 | 5e-04 | Inf | 5e-04 | 1 | 1 | cysteine synthase activity |
| GO:0050421 | 5e-04 | Inf | 5e-04 | 1 | 1 | nitrite reductase (NO-forming) activity |
| GO:0070025 | 5e-04 | Inf | 5e-04 | 1 | 1 | carbon monoxide binding |
| GO:1904047 | 5e-04 | Inf | 5e-04 | 1 | 1 | S-adenosyl-L-methionine binding |
| GO:0004122 | 0.001 | 2248.4286 | 0.001 | 1 | 2 | cystathionine beta-synthase activity |
| GO:0005153 | 0.001 | 2248.4286 | 0.001 | 1 | 2 | interleukin-8 receptor binding |
| GO:0070026 | 0.001 | 2248.4286 | 0.001 | 1 | 2 | nitric oxide binding |
| GO:0016661 | 0.0015 | 1124.1429 | 0.0015 | 1 | 3 | oxidoreductase activity, acting on other nitrogenous compounds as donors |
| GO:0005125 | 0.0049 | 24.2989 | 0.1092 | 2 | 215 | cytokine activity |
| GO:0005132 | 0.0086 | 140.3929 | 0.0086 | 1 | 17 | type I interferon receptor binding |
| GO:0008327 | 0.0096 | 124.7778 | 0.0097 | 1 | 19 | methyl-CpG binding |
| GOMFID | Pvalue | OddsRatio | ExpCount | Count | Size | Term |
| GO:0045028 | 0.0019 | 874.2222 | 0.0019 | 1 | 10 | G-protein coupled purinergic nucleotide receptor activity |
| GO:0016502 | 0.0032 | 491.5312 | 0.0032 | 1 | 17 | nucleotide receptor activity |
| GO:0035586 | 0.004 | 393.125 | 0.004 | 1 | 21 | purinergic receptor activity |
| GO:0015020 | 0.0063 | 245.5156 | 0.0063 | 1 | 33 | glucuronosyltransferase activity |
| GO:0004930 | 0.0071 | 38.4236 | 0.1488 | 2 | 781 | G-protein coupled receptor activity |
| NA. |
| n/a |
| GOMFID | Pvalue | OddsRatio | ExpCount | Count | Size | Term |
| GO:0004523 | 0.0018 | 874.3333 | 0.0018 | 1 | 7 | RNA-DNA hybrid ribonuclease activity |
| GO:0005149 | 0.0038 | 374.5238 | 0.0038 | 1 | 15 | interleukin-1 receptor binding |
| GO:0050699 | 0.0056 | 249.5714 | 0.0056 | 1 | 22 | WW domain binding |
| GO:0016893 | 0.0094 | 145.4444 | 0.0094 | 1 | 37 | endonuclease activity, active with either ribo- or deoxyribonucleic acids and producing 5'-phosphomonoesters |
| GOMFID | Pvalue | OddsRatio | ExpCount | Count | Size | Term |
| GO:0004984 | 0 | Inf | 0.0705 | 3 | 370 | olfactory receptor activity |
| GO:0004930 | 1e-04 | Inf | 0.1488 | 3 | 781 | G-protein coupled receptor activity |
| GO:0099600 | 5e-04 | Inf | 0.2316 | 3 | 1216 | transmembrane receptor activity |
| GO:0038023 | 5e-04 | Inf | 0.2417 | 3 | 1269 | signaling receptor activity |
| GO:0060089 | 9e-04 | Inf | 0.2867 | 3 | 1505 | molecular transducer activity |
| NA. |
| n/a |
| GOMFID | Pvalue | OddsRatio | ExpCount | Count | Size | Term |
| GO:0015204 | 0.0015 | 1049.2667 | 0.0015 | 1 | 6 | urea transmembrane transporter activity |
| GO:0015250 | 0.0028 | 524.4667 | 0.0028 | 1 | 11 | water channel activity |
| GO:0015254 | 0.0028 | 524.4667 | 0.0028 | 1 | 11 | glycerol channel activity |
| GO:0015166 | 0.003 | 476.7576 | 0.003 | 1 | 12 | polyol transmembrane transporter activity |
| GO:0004984 | 0.0032 | 41.7826 | 0.094 | 2 | 370 | olfactory receptor activity |
| GO:0015144 | 0.0089 | 154.0196 | 0.0089 | 1 | 35 | carbohydrate transmembrane transporter activity |
| NA. |
| n/a |
| GOMFID | Pvalue | OddsRatio | ExpCount | Count | Size | Term |
| GO:0004984 | 4e-04 | 31.4183 | 0.1645 | 3 | 370 | olfactory receptor activity |
| GO:0004930 | 0.0037 | 14.4245 | 0.3472 | 3 | 781 | G-protein coupled receptor activity |
| GO:0001055 | 0.0044 | 291.3333 | 0.0044 | 1 | 10 | RNA polymerase II activity |
| GO:0001054 | 0.0053 | 238.3333 | 0.0053 | 1 | 12 | RNA polymerase I activity |
| GO:0001056 | 0.008 | 154.1569 | 0.008 | 1 | 18 | RNA polymerase III activity |
| GO:0008270 | 0.0097 | 9.9825 | 0.4903 | 3 | 1103 | zinc ion binding |
| GOMFID | Pvalue | OddsRatio | ExpCount | Count | Size | Term |
| GO:0004984 | 6e-04 | Inf | 0.047 | 2 | 370 | olfactory receptor activity |
| GO:0004930 | 0.0025 | Inf | 0.0992 | 2 | 781 | G-protein coupled receptor activity |
| GO:0099600 | 0.006 | Inf | 0.1544 | 2 | 1216 | transmembrane receptor activity |
| GO:0038023 | 0.0065 | Inf | 0.1612 | 2 | 1269 | signaling receptor activity |
| GO:0060089 | 0.0091 | Inf | 0.1911 | 2 | 1505 | molecular transducer activity |
| GOMFID | Pvalue | OddsRatio | ExpCount | Count | Size | Term |
| GO:0008140 | 0.0019 | 874.2222 | 0.0019 | 1 | 10 | cAMP response element binding protein binding |
| GO:0071889 | 0.0038 | 413.8421 | 0.0038 | 1 | 20 | 14-3-3 protein binding |
| GOMFID | Pvalue | OddsRatio | ExpCount | Count | Size | Term |
| GO:0008536 | 0.0018 | Inf | 0.0018 | 1 | 29 | Ran GTPase binding |
| GOMFID | Pvalue | OddsRatio | ExpCount | Count | Size | Term |
| GO:0005385 | 0.0053 | 262.0667 | 0.0053 | 1 | 21 | zinc ion transmembrane transporter activity |
| GO:0005031 | 0.0058 | 238.2121 | 0.0058 | 1 | 23 | tumor necrosis factor-activated receptor activity |
| GOMFID | Pvalue | OddsRatio | ExpCount | Count | Size | Term |
| GO:0008140 | 0.0013 | 1748.5556 | 0.0013 | 1 | 10 | cAMP response element binding protein binding |
| GO:0071889 | 0.0025 | 827.7368 | 0.0025 | 1 | 20 | 14-3-3 protein binding |
| GOMFID | Pvalue | OddsRatio | ExpCount | Count | Size | Term |
| GO:0004556 | 0 | 23613 | 0.0013 | 3 | 5 | alpha-amylase activity |
| GO:0004553 | 0 | 539.8966 | 0.0229 | 3 | 90 | hydrolase activity, hydrolyzing O-glycosyl compounds |
| GO:0016787 | 4e-04 | Inf | 0.5779 | 4 | 2275 | hydrolase activity |
| GOMFID | Pvalue | OddsRatio | ExpCount | Count | Size | Term |
| GO:0005153 | 6e-04 | 3935.5 | 6e-04 | 1 | 2 | interleukin-8 receptor binding |
| GO:0099600 | 0.0041 | 17.9678 | 0.3861 | 3 | 1216 | transmembrane receptor activity |
| GO:0038023 | 0.0046 | 17.1528 | 0.4029 | 3 | 1269 | signaling receptor activity |
| GO:0004984 | 0.0053 | 27.8533 | 0.1175 | 2 | 370 | olfactory receptor activity |
| GO:0060089 | 0.0075 | 14.222 | 0.4778 | 3 | 1505 | molecular transducer activity |
| GOMFID | Pvalue | OddsRatio | ExpCount | Count | Size | Term |
| GO:0004556 | 0 | 11805.75 | 0.0016 | 3 | 5 | alpha-amylase activity |
| GO:0004553 | 0 | 269.931 | 0.0286 | 3 | 90 | hydrolase activity, hydrolyzing O-glycosyl compounds |
| GO:0042393 | 0.0011 | 63.3293 | 0.0527 | 2 | 166 | histone binding |
| GO:0046982 | 0.0077 | 22.8128 | 0.1426 | 2 | 449 | protein heterodimerization activity |
| NA. |
| n/a |
| GOMFID | Pvalue | OddsRatio | ExpCount | Count | Size | Term |
| GO:0005125 | 0.0018 | 48.6072 | 0.0683 | 2 | 215 | cytokine activity |
| GO:0005132 | 0.0054 | 245.7344 | 0.0054 | 1 | 17 | type I interferon receptor binding |
| GO:0005385 | 0.0067 | 196.5375 | 0.0067 | 1 | 21 | zinc ion transmembrane transporter activity |
| GO:0005164 | 0.0089 | 145.5185 | 0.0089 | 1 | 28 | tumor necrosis factor receptor binding |
| GOMFID | Pvalue | OddsRatio | ExpCount | Count | Size | Term |
| GO:0005385 | 0.0027 | 786.3 | 0.0027 | 1 | 21 | zinc ion transmembrane transporter activity |
| GO:0030515 | 0.0032 | 655.0833 | 0.0032 | 1 | 25 | snoRNA binding |
| GOMFID | Pvalue | OddsRatio | ExpCount | Count | Size | Term |
| GO:0005385 | 0.0027 | 786.3 | 0.0027 | 1 | 21 | zinc ion transmembrane transporter activity |
| GOMFID | Pvalue | OddsRatio | ExpCount | Count | Size | Term |
| GO:0004984 | 0.0016 | 83.5707 | 0.0705 | 2 | 370 | olfactory receptor activity |
| GO:0005385 | 0.004 | 393.125 | 0.004 | 1 | 21 | zinc ion transmembrane transporter activity |
| GO:0004930 | 0.0071 | 38.4236 | 0.1488 | 2 | 781 | G-protein coupled receptor activity |
| GOMFID | Pvalue | OddsRatio | ExpCount | Count | Size | Term |
| GO:0042813 | 0.0063 | 206.8947 | 0.0064 | 1 | 20 | Wnt-activated receptor activity |
| GO:0005385 | 0.0067 | 196.5375 | 0.0067 | 1 | 21 | zinc ion transmembrane transporter activity |
| GO:0017147 | 0.0095 | 135.4655 | 0.0095 | 1 | 30 | Wnt-protein binding |
| GOMFID | Pvalue | OddsRatio | ExpCount | Count | Size | Term |
| GO:0004984 | 6e-04 | Inf | 0.047 | 2 | 370 | olfactory receptor activity |
| GO:0004930 | 0.0025 | Inf | 0.0992 | 2 | 781 | G-protein coupled receptor activity |
| GO:0099600 | 0.006 | Inf | 0.1544 | 2 | 1216 | transmembrane receptor activity |
| GO:0038023 | 0.0065 | Inf | 0.1612 | 2 | 1269 | signaling receptor activity |
| GO:0060089 | 0.0091 | Inf | 0.1911 | 2 | 1505 | molecular transducer activity |
| NA. |
| n/a |
| NA. |
| n/a |
| GOMFID | Pvalue | OddsRatio | ExpCount | Count | Size | Term |
| GO:0001664 | 4e-04 | 26.8785 | 0.1588 | 3 | 250 | G-protein coupled receptor binding |
| GO:0099600 | 5e-04 | 11.9959 | 0.7722 | 5 | 1216 | transmembrane receptor activity |
| GO:0038023 | 6e-04 | 11.4509 | 0.8058 | 5 | 1269 | signaling receptor activity |
| GO:0004930 | 0.001 | 12.8366 | 0.4959 | 4 | 781 | G-protein coupled receptor activity |
| GO:0031696 | 0.0013 | 1748.5556 | 0.0013 | 1 | 2 | alpha-2C adrenergic receptor binding |
| GO:0046811 | 0.0013 | 1748.5556 | 0.0013 | 1 | 2 | histone deacetylase inhibitor activity |
| GO:0060089 | 0.0013 | 9.492 | 0.9557 | 5 | 1505 | molecular transducer activity |
| GO:0004984 | 0.0014 | 17.9498 | 0.235 | 3 | 370 | olfactory receptor activity |
| GO:0004938 | 0.0019 | 874.2222 | 0.0019 | 1 | 3 | alpha2-adrenergic receptor activity |
| GO:0031692 | 0.0019 | 874.2222 | 0.0019 | 1 | 3 | alpha-1B adrenergic receptor binding |
| GO:0032795 | 0.0019 | 874.2222 | 0.0019 | 1 | 3 | heterotrimeric G-protein binding |
| GO:0051380 | 0.0025 | 582.7778 | 0.0025 | 1 | 4 | norepinephrine binding |
| GO:0051430 | 0.0025 | 582.7778 | 0.0025 | 1 | 4 | corticotropin-releasing hormone receptor 1 binding |
| GO:0051431 | 0.0025 | 582.7778 | 0.0025 | 1 | 4 | corticotropin-releasing hormone receptor 2 binding |
| GO:0051379 | 0.0038 | 349.6222 | 0.0038 | 1 | 6 | epinephrine binding |
| GO:0004935 | 0.0057 | 218.4722 | 0.0057 | 1 | 9 | adrenergic receptor activity |
| GO:0031996 | 0.0082 | 145.6111 | 0.0083 | 1 | 13 | thioesterase binding |
| NA. |
| n/a |
| NA. |
| n/a |
| NA. |
| n/a |
| NA. |
| n/a |
| NA. |
| n/a |
| NA. |
| n/a |
| NA. |
| n/a |
| NA. |
| n/a |
| NA. |
| n/a |
| NA. |
| n/a |
| NA. |
| n/a |
| NA. |
| n/a |
| NA. |
| n/a |
| NA. |
| n/a |
| NA. |
| n/a |
| NA. |
| n/a |
| NA. |
| n/a |
| NA. |
| n/a |
| NA. |
| n/a |
| NA. |
| n/a |
| NA. |
| n/a |
| NA. |
| n/a |
| NA. |
| n/a |
| NA. |
| n/a |
| NA. |
| n/a |
| NA. |
| n/a |
| NA. |
| n/a |
| NA. |
| n/a |
| NA. |
| n/a |
| NA. |
| n/a |
| NA. |
| n/a |
| NA. |
| n/a |
| NA. |
| n/a |
| NA. |
| n/a |
| NA. |
| n/a |
| NA. |
| n/a |
| NA. |
| n/a |
| NA. |
| n/a |
| NA. |
| n/a |
| NA. |
| n/a |
| NA. |
| n/a |
| NA. |
| n/a |
| NA. |
| n/a |
| NA. |
| n/a |
| NA. |
| n/a |
| NA. |
| n/a |
| NA. |
| n/a |
| NA. |
| n/a |
| NA. |
| n/a |
| NA. |
| n/a |
| NA. |
| n/a |
| NA. |
| n/a |
| NA. |
| n/a |
| NA. |
| n/a |
| NA. |
| n/a |
| NA. |
| n/a |
| NA. |
| n/a |
| NA. |
| n/a |
| NA. |
| n/a |
| NA. |
| n/a |
| NA. |
| n/a |
| NA. |
| n/a |
| NA. |
| n/a |
| NA. |
| n/a |
| NA. |
| n/a |
| NA. |
| n/a |
| NA. |
| n/a |
| NA. |
| n/a |
| NA. |
| n/a |
| NA. |
| n/a |
| NA. |
| n/a |
| NA. |
| n/a |
| NA. |
| n/a |
| NA. |
| n/a |
| NA. |
| n/a |
| NA. |
| n/a |
| NA. |
| n/a |
| NA. |
| n/a |
| NA. |
| n/a |
| NA. |
| n/a |
| NA. |
| n/a |
| NA. |
| n/a |
| NA. |
| n/a |
| NA. |
| n/a |
| NA. |
| n/a |
| NA. |
| n/a |
| NA. |
| n/a |
| NA. |
| n/a |
| NA. |
| n/a |
| NA. |
| n/a |
| NA. |
| n/a |
| NA. |
| n/a |
| NA. |
| n/a |
| NA. |
| n/a |
| NA. |
| n/a |
| NA. |
| n/a |
| NA. |
| n/a |
| NA. |
| n/a |
| NA. |
| n/a |
| NA. |
| n/a |
| NA. |
| n/a |
| NA. |
| n/a |
| NA. |
| n/a |
| NA. |
| n/a |
| NA. |
| n/a |
| NA. |
| n/a |
| NA. |
| n/a |
| NA. |
| n/a |
| NA. |
| n/a |
| NA. |
| n/a |
| NA. |
| n/a |
| NA. |
| n/a |
| NA. |
| n/a |
| NA. |
| n/a |
| NA. |
| n/a |
| NA. |
| n/a |
| NA. |
| n/a |
| NA. |
| n/a |
| NA. |
| n/a |
| NA. |
| n/a |
| NA. |
| n/a |
| NA. |
| n/a |
| NA. |
| n/a |
| NA. |
| n/a |
| NA. |
| n/a |
| NA. |
| n/a |
| NA. |
| n/a |
| NA. |
| n/a |
| NA. |
| n/a |
| NA. |
| n/a |
| NA. |
| n/a |
| NA. |
| n/a |
| NA. |
| n/a |
| NA. |
| n/a |
| NA. |
| n/a |
| NA. |
| n/a |
| NA. |
| n/a |
| NA. |
| n/a |
| NA. |
| n/a |
| NA. |
| n/a |
| NA. |
| n/a |
| NA. |
| n/a |
| NA. |
| n/a |
| NA. |
| n/a |
| NA. |
| n/a |
| NA. |
| n/a |
| NA. |
| n/a |
| NA. |
| n/a |
| NA. |
| n/a |
| NA. |
| n/a |
| NA. |
| n/a |
| NA. |
| n/a |
| NA. |
| n/a |
| NA. |
| n/a |
| NA. |
| n/a |
| NA. |
| n/a |
| NA. |
| n/a |
| NA. |
| n/a |
| NA. |
| n/a |
| NA. |
| n/a |
| NA. |
| n/a |
| NA. |
| n/a |
| NA. |
| n/a |
| NA. |
| n/a |
| NA. |
| n/a |
| NA. |
| n/a |
| NA. |
| n/a |
| NA. |
| n/a |
| NA. |
| n/a |
| NA. |
| n/a |
| NA. |
| n/a |
| NA. |
| n/a |
| NA. |
| n/a |
| NA. |
| n/a |
| NA. |
| n/a |
| NA. |
| n/a |
| NA. |
| n/a |
| NA. |
| n/a |
| NA. |
| n/a |
| NA. |
| n/a |
| NA. |
| n/a |
| NA. |
| n/a |
| NA. |
| n/a |
| NA. |
| n/a |
| NA. |
| n/a |
| NA. |
| n/a |
| NA. |
| n/a |
| NA. |
| n/a |
| NA. |
| n/a |
| NA. |
| n/a |
| NA. |
| n/a |
| NA. |
| n/a |
| NA. |
| n/a |
| NA. |
| n/a |
| NA. |
| n/a |
| NA. |
| n/a |
| NA. |
| n/a |
| NA. |
| n/a |
| NA. |
| n/a |
| NA. |
| n/a |
| NA. |
| n/a |
| NA. |
| n/a |
| NA. |
| n/a |
| NA. |
| n/a |
| NA. |
| n/a |
| NA. |
| n/a |
| NA. |
| n/a |
| NA. |
| n/a |
| NA. |
| n/a |
| NA. |
| n/a |
| NA. |
| n/a |
| NA. |
| n/a |
| NA. |
| n/a |
| NA. |
| n/a |
| NA. |
| n/a |
| NA. |
| n/a |
| NA. |
| n/a |
| NA. |
| n/a |
| NA. |
| n/a |
| NA. |
| n/a |
| NA. |
| n/a |
| NA. |
| n/a |
| NA. |
| n/a |
| NA. |
| n/a |
| NA. |
| n/a |
| NA. |
| n/a |
| NA. |
| n/a |
| NA. |
| n/a |
| NA. |
| n/a |
| NA. |
| n/a |
| NA. |
| n/a |
| NA. |
| n/a |
| NA. |
| n/a |
| NA. |
| n/a |
| NA. |
| n/a |
| NA. |
| n/a |
| NA. |
| n/a |
| NA. |
| n/a |
| NA. |
| n/a |
| NA. |
| n/a |
| NA. |
| n/a |
| NA. |
| n/a |
| NA. |
| n/a |
| GOMFID | Pvalue | OddsRatio | ExpCount | Count | Size | Term |
| GO:0032078 | 0.001 | Inf | 0.001 | 1 | 1 | negative regulation of endodeoxyribonuclease activity |
| GO:0048211 | 0.002 | 1045.9333 | 0.002 | 1 | 2 | Golgi vesicle docking |
| GO:0060764 | 0.002 | 1045.9333 | 0.002 | 1 | 2 | cell-cell signaling involved in mammary gland development |
| GO:0015820 | 0.0031 | 522.9333 | 0.0031 | 1 | 3 | leucine transport |
| GO:0032074 | 0.0031 | 522.9333 | 0.0031 | 1 | 3 | negative regulation of nuclease activity |
| GO:0060435 | 0.0031 | 522.9333 | 0.0031 | 1 | 3 | bronchiole development |
| GO:0070458 | 0.0031 | 522.9333 | 0.0031 | 1 | 3 | cellular detoxification of nitrogen compound |
| GO:0018916 | 0.0041 | 348.6 | 0.0041 | 1 | 4 | nitrobenzene metabolic process |
| GO:0060480 | 0.0041 | 348.6 | 0.0041 | 1 | 4 | lung goblet cell differentiation |
| GO:0060535 | 0.0041 | 348.6 | 0.0041 | 1 | 4 | trachea cartilage morphogenesis |
| GO:0060574 | 0.0041 | 348.6 | 0.0041 | 1 | 4 | intestinal epithelial cell maturation |
| GO:0070317 | 0.0041 | 348.6 | 0.0041 | 1 | 4 | negative regulation of G0 to G1 transition |
| GO:1901387 | 0.0041 | 348.6 | 0.0041 | 1 | 4 | positive regulation of voltage-gated calcium channel activity |
| GO:0060482 | 0.0061 | 209.1333 | 0.0061 | 1 | 6 | lobar bronchus development |
| GO:0035524 | 0.0071 | 174.2667 | 0.0071 | 1 | 7 | proline transmembrane transport |
| GO:0045647 | 0.0071 | 174.2667 | 0.0071 | 1 | 7 | negative regulation of erythrocyte differentiation |
| GO:2001300 | 0.0071 | 174.2667 | 0.0071 | 1 | 7 | lipoxin metabolic process |
| GO:0032070 | 0.0081 | 149.3619 | 0.0081 | 1 | 8 | regulation of deoxyribonuclease activity |
| GO:0060638 | 0.0091 | 130.6833 | 0.0092 | 1 | 9 | mesenchymal-epithelial cell signaling |
| GO:0043112 | 0.0093 | 15.5315 | 0.1477 | 2 | 145 | receptor metabolic process |
| GOMFID | Pvalue | OddsRatio | ExpCount | Count | Size | Term |
| GO:0006584 | 0.0019 | 34.7533 | 0.0658 | 2 | 47 | catecholamine metabolic process |
| GO:1902952 | 0.0028 | 746.8095 | 0.0028 | 1 | 2 | positive regulation of dendritic spine maintenance |
| GO:1902897 | 0.0042 | 373.381 | 0.0042 | 1 | 3 | regulation of postsynaptic density protein 95 clustering |
| GO:2000232 | 0.0042 | 373.381 | 0.0042 | 1 | 3 | regulation of rRNA processing |
| GO:0002408 | 0.0056 | 248.9048 | 0.0056 | 1 | 4 | myeloid dendritic cell chemotaxis |
| GO:0048680 | 0.007 | 186.6667 | 0.007 | 1 | 5 | positive regulation of axon regeneration |
| GO:0061737 | 0.007 | 186.6667 | 0.007 | 1 | 5 | leukotriene signaling pathway |
| GO:0018958 | 0.0073 | 17.3267 | 0.1289 | 2 | 92 | phenol-containing compound metabolic process |
| GO:1901838 | 0.0084 | 149.3238 | 0.0084 | 1 | 6 | positive regulation of transcription of nuclear large rRNA transcript from RNA polymerase I promoter |
| GO:0008090 | 0.0098 | 124.4286 | 0.0098 | 1 | 7 | retrograde axonal transport |
| GO:0051694 | 0.0098 | 124.4286 | 0.0098 | 1 | 7 | pointed-end actin filament capping |
| GOMFID | Pvalue | OddsRatio | ExpCount | Count | Size | Term |
| GO:0007147 | 0.0017 | 1307.6667 | 0.0017 | 1 | 2 | female meiosis II |
| GO:1902530 | 0.0017 | 1307.6667 | 0.0017 | 1 | 2 | positive regulation of protein linear polyubiquitination |
| GO:1903551 | 0.005 | 261.4667 | 0.005 | 1 | 6 | regulation of extracellular exosome assembly |
| GO:2000271 | 0.005 | 261.4667 | 0.005 | 1 | 6 | positive regulation of fibroblast apoptotic process |
| GO:0070424 | 0.0074 | 163.3854 | 0.0074 | 1 | 9 | regulation of nucleotide-binding oligomerization domain containing signaling pathway |
| GO:0097341 | 0.0074 | 163.3854 | 0.0074 | 1 | 9 | zymogen inhibition |
| GO:1990001 | 0.0074 | 163.3854 | 0.0074 | 1 | 9 | inhibition of cysteine-type endopeptidase activity involved in apoptotic process |
| GOMFID | Pvalue | OddsRatio | ExpCount | Count | Size | Term |
| GO:0034553 | 0.002 | Inf | 0.002 | 1 | 1 | mitochondrial respiratory chain complex II assembly |
| GO:0045494 | 0.0028 | 28.3793 | 0.079 | 2 | 40 | photoreceptor cell maintenance |
| GO:0006682 | 0.0039 | 522.4667 | 0.0039 | 1 | 2 | galactosylceramide biosynthetic process |
| GO:0038060 | 0.0039 | 522.4667 | 0.0039 | 1 | 2 | nitric oxide-cGMP-mediated signaling pathway |
| GO:0021759 | 0.0059 | 261.2167 | 0.0059 | 1 | 3 | globus pallidus development |
| GO:0002408 | 0.0079 | 174.1333 | 0.0079 | 1 | 4 | myeloid dendritic cell chemotaxis |
| GO:0038108 | 0.0079 | 174.1333 | 0.0079 | 1 | 4 | negative regulation of appetite by leptin-mediated signaling pathway |
| GO:2000048 | 0.0079 | 174.1333 | 0.0079 | 1 | 4 | negative regulation of cell-cell adhesion mediated by cadherin |
| GO:0051252 | 0.0098 | 2.5764 | 6.7996 | 13 | 3445 | regulation of RNA metabolic process |
| GO:0030046 | 0.0098 | 130.5917 | 0.0099 | 1 | 5 | parallel actin filament bundle assembly |
| GOMFID | Pvalue | OddsRatio | ExpCount | Count | Size | Term |
| GO:0046534 | 0.0017 | Inf | 0.0017 | 1 | 1 | positive regulation of photoreceptor cell differentiation |
| GO:1904158 | 0.0017 | Inf | 0.0017 | 1 | 1 | axonemal central apparatus assembly |
| GO:1904205 | 0.0017 | Inf | 0.0017 | 1 | 1 | negative regulation of skeletal muscle hypertrophy |
| GO:0006682 | 0.0034 | 603 | 0.0034 | 1 | 2 | galactosylceramide biosynthetic process |
| GO:0010730 | 0.0034 | 603 | 0.0034 | 1 | 2 | negative regulation of hydrogen peroxide biosynthetic process |
| GO:0070682 | 0.0034 | 603 | 0.0034 | 1 | 2 | proteasome regulatory particle assembly |
| GO:2000255 | 0.0051 | 301.4808 | 0.0052 | 1 | 3 | negative regulation of male germ cell proliferation |
| GO:0001895 | 0.0068 | 17.8389 | 0.1238 | 2 | 72 | retina homeostasis |
| GO:1901029 | 0.0086 | 150.7212 | 0.0086 | 1 | 5 | negative regulation of mitochondrial outer membrane permeabilization involved in apoptotic signaling pathway |
| GOMFID | Pvalue | OddsRatio | ExpCount | Count | Size | Term |
| GO:0033030 | 0.0029 | 712.8182 | 0.0029 | 1 | 2 | negative regulation of neutrophil apoptotic process |
| GO:1902530 | 0.0029 | 712.8182 | 0.0029 | 1 | 2 | positive regulation of protein linear polyubiquitination |
| GO:0035726 | 0.0088 | 142.5273 | 0.0088 | 1 | 6 | common myeloid progenitor cell proliferation |
| GOMFID | Pvalue | OddsRatio | ExpCount | Count | Size | Term |
| GO:0002779 | 0.001 | Inf | 0.001 | 1 | 1 | antibacterial peptide secretion |
| GO:0051977 | 0.001 | Inf | 0.001 | 1 | 1 | lysophospholipid transport |
| GO:1902530 | 0.002 | 1045.9333 | 0.002 | 1 | 2 | positive regulation of protein linear polyubiquitination |
| GO:0002780 | 0.0041 | 348.6 | 0.0041 | 1 | 4 | antibacterial peptide biosynthetic process |
| GO:0090238 | 0.0051 | 261.4333 | 0.0051 | 1 | 5 | positive regulation of arachidonic acid secretion |
| GO:0090370 | 0.0051 | 261.4333 | 0.0051 | 1 | 5 | negative regulation of cholesterol efflux |
| GO:1903551 | 0.0061 | 209.1333 | 0.0061 | 1 | 6 | regulation of extracellular exosome assembly |
| GO:0002775 | 0.0091 | 130.6833 | 0.0092 | 1 | 9 | antimicrobial peptide production |
| GO:0070424 | 0.0091 | 130.6833 | 0.0092 | 1 | 9 | regulation of nucleotide-binding oligomerization domain containing signaling pathway |
| GO:0097341 | 0.0091 | 130.6833 | 0.0092 | 1 | 9 | zymogen inhibition |
| GO:1990001 | 0.0091 | 130.6833 | 0.0092 | 1 | 9 | inhibition of cysteine-type endopeptidase activity involved in apoptotic process |
| GOMFID | Pvalue | OddsRatio | ExpCount | Count | Size | Term |
| GO:0003421 | 0.0013 | Inf | 0.0013 | 1 | 1 | growth plate cartilage axis specification |
| GO:0021541 | 0.0013 | Inf | 0.0013 | 1 | 1 | ammon gyrus development |
| GO:1903403 | 0.0013 | Inf | 0.0013 | 1 | 1 | negative regulation of renal phosphate excretion |
| GO:0002408 | 0.0053 | 261.3667 | 0.0053 | 1 | 4 | myeloid dendritic cell chemotaxis |
| GO:0038026 | 0.0053 | 261.3667 | 0.0053 | 1 | 4 | reelin-mediated signaling pathway |
| GO:0031098 | 0.0055 | 9.5154 | 0.365 | 3 | 273 | stress-activated protein kinase signaling cascade |
| GO:0046330 | 0.0094 | 15.1823 | 0.1471 | 2 | 110 | positive regulation of JNK cascade |
| GOMFID | Pvalue | OddsRatio | ExpCount | Count | Size | Term |
| GO:0006749 | 0 | 58.6388 | 0.0641 | 3 | 53 | glutathione metabolic process |
| GO:1901687 | 6e-04 | 63.5213 | 0.0375 | 2 | 31 | glutathione derivative biosynthetic process |
| GO:0010868 | 0.0024 | 871.4444 | 0.0024 | 1 | 2 | negative regulation of triglyceride biosynthetic process |
| GO:0048211 | 0.0024 | 871.4444 | 0.0024 | 1 | 2 | Golgi vesicle docking |
| GO:0070458 | 0.0036 | 435.6944 | 0.0036 | 1 | 3 | cellular detoxification of nitrogen compound |
| GO:0018916 | 0.0048 | 290.4444 | 0.0048 | 1 | 4 | nitrobenzene metabolic process |
| GO:0032792 | 0.006 | 217.8194 | 0.006 | 1 | 5 | negative regulation of CREB transcription factor activity |
| GO:0097264 | 0.0084 | 145.1944 | 0.0085 | 1 | 7 | self proteolysis |
| GO:2000210 | 0.0084 | 145.1944 | 0.0085 | 1 | 7 | positive regulation of anoikis |
| GOMFID | Pvalue | OddsRatio | ExpCount | Count | Size | Term |
| GO:0021642 | 0.0017 | Inf | 0.0017 | 1 | 1 | trochlear nerve formation |
| GO:0021703 | 0.0017 | Inf | 0.0017 | 1 | 1 | locus ceruleus development |
| GO:0007308 | 0.0033 | 627.16 | 0.0033 | 1 | 2 | oocyte construction |
| GO:0007314 | 0.0033 | 627.16 | 0.0033 | 1 | 2 | oocyte anterior/posterior axis specification |
| GO:0021623 | 0.0033 | 627.16 | 0.0033 | 1 | 2 | oculomotor nerve formation |
| GO:0030719 | 0.0033 | 627.16 | 0.0033 | 1 | 2 | P granule organization |
| GO:0009790 | 0.0046 | 4.5147 | 1.6273 | 6 | 983 | embryo development |
| GO:0010636 | 0.005 | 313.56 | 0.005 | 1 | 3 | positive regulation of mitochondrial fusion |
| GO:0021558 | 0.005 | 313.56 | 0.005 | 1 | 3 | trochlear nerve development |
| GO:0098742 | 0.005 | 9.6553 | 0.3509 | 3 | 212 | cell-cell adhesion via plasma-membrane adhesion molecules |
| GO:0060415 | 0.0051 | 20.6574 | 0.1076 | 2 | 65 | muscle tissue morphogenesis |
| GO:0021557 | 0.0066 | 209.0267 | 0.0066 | 1 | 4 | oculomotor nerve development |
| GO:0022614 | 0.0066 | 209.0267 | 0.0066 | 1 | 4 | membrane to membrane docking |
| GO:0006306 | 0.009 | 15.2892 | 0.144 | 2 | 87 | DNA methylation |
| GO:0021523 | 0.0099 | 125.4 | 0.0099 | 1 | 6 | somatic motor neuron differentiation |
| GO:0035989 | 0.0099 | 125.4 | 0.0099 | 1 | 6 | tendon development |
| GO:0048743 | 0.0099 | 125.4 | 0.0099 | 1 | 6 | positive regulation of skeletal muscle fiber development |
| GOMFID | Pvalue | OddsRatio | ExpCount | Count | Size | Term |
| GO:2001300 | 0 | 298.6286 | 0.0103 | 2 | 7 | lipoxin metabolic process |
| GO:0019740 | 1e-04 | 248.8413 | 0.0117 | 2 | 8 | nitrogen utilization |
| GO:0019372 | 2e-04 | 135.6883 | 0.019 | 2 | 13 | lipoxygenase pathway |
| GO:0006995 | 2e-04 | 106.5918 | 0.0234 | 2 | 16 | cellular response to nitrogen starvation |
| GO:0015695 | 4e-04 | 82.8836 | 0.0293 | 2 | 20 | organic cation transport |
| GO:0072488 | 6e-04 | 67.7965 | 0.0351 | 2 | 24 | ammonium transmembrane transport |
| GO:0006950 | 0.0011 | 3.9859 | 5.6673 | 13 | 3870 | response to stress |
| GO:0071299 | 0.0015 | Inf | 0.0015 | 1 | 1 | cellular response to vitamin A |
| GO:1901751 | 0.0015 | Inf | 0.0015 | 1 | 1 | leukotriene A4 metabolic process |
| GO:2001306 | 0.0015 | Inf | 0.0015 | 1 | 1 | lipoxin B4 biosynthetic process |
| GO:0031669 | 0.0019 | 13.7698 | 0.2519 | 3 | 172 | cellular response to nutrient levels |
| GO:0046456 | 0.0027 | 29.1914 | 0.0776 | 2 | 53 | icosanoid biosynthetic process |
| GO:0071663 | 0.0029 | 712.8182 | 0.0029 | 1 | 2 | positive regulation of granzyme B production |
| GO:2001303 | 0.0029 | 712.8182 | 0.0029 | 1 | 2 | lipoxin A4 biosynthetic process |
| GO:0019369 | 0.0037 | 24.7984 | 0.0908 | 2 | 62 | arachidonic acid metabolic process |
| GO:0048678 | 0.0039 | 23.9954 | 0.0937 | 2 | 64 | response to axon injury |
| GO:0042322 | 0.0044 | 356.3864 | 0.0044 | 1 | 3 | negative regulation of circadian sleep/wake cycle, REM sleep |
| GO:0060399 | 0.0044 | 356.3864 | 0.0044 | 1 | 3 | positive regulation of growth hormone receptor signaling pathway |
| GO:0072156 | 0.0044 | 356.3864 | 0.0044 | 1 | 3 | distal tubule morphogenesis |
| GO:2000324 | 0.0044 | 356.3864 | 0.0044 | 1 | 3 | positive regulation of glucocorticoid receptor signaling pathway |
| GO:0045927 | 0.0045 | 10.1678 | 0.3383 | 3 | 231 | positive regulation of growth |
| GO:0016525 | 0.0045 | 22.1976 | 0.101 | 2 | 69 | negative regulation of angiogenesis |
| GO:0072376 | 0.0045 | 22.1976 | 0.101 | 2 | 69 | protein activation cascade |
| GO:1901343 | 0.0055 | 20.0888 | 0.1113 | 2 | 76 | negative regulation of vasculature development |
| GO:0030101 | 0.0056 | 19.8197 | 0.1128 | 2 | 77 | natural killer cell activation |
| GO:0032100 | 0.0058 | 237.5758 | 0.0059 | 1 | 4 | positive regulation of appetite |
| GO:0051464 | 0.0058 | 237.5758 | 0.0059 | 1 | 4 | positive regulation of cortisol secretion |
| GO:0070294 | 0.0058 | 237.5758 | 0.0059 | 1 | 4 | renal sodium ion absorption |
| GO:0009991 | 0.0066 | 6.1145 | 0.7703 | 4 | 526 | response to extracellular stimulus |
| GO:0071496 | 0.0072 | 8.5306 | 0.4012 | 3 | 274 | cellular response to external stimulus |
| GO:0048680 | 0.0073 | 178.1705 | 0.0073 | 1 | 5 | positive regulation of axon regeneration |
| GO:0051122 | 0.0073 | 178.1705 | 0.0073 | 1 | 5 | hepoxilin biosynthetic process |
| GO:0051461 | 0.0073 | 178.1705 | 0.0073 | 1 | 5 | positive regulation of corticotropin secretion |
| GO:0042536 | 0.0088 | 142.5273 | 0.0088 | 1 | 6 | negative regulation of tumor necrosis factor biosynthetic process |
| GO:0045409 | 0.0088 | 142.5273 | 0.0088 | 1 | 6 | negative regulation of interleukin-6 biosynthetic process |
| GO:1901568 | 0.0093 | 15.1458 | 0.1464 | 2 | 100 | fatty acid derivative metabolic process |
| GO:0001775 | 0.0097 | 4.4523 | 1.356 | 5 | 926 | cell activation |
| GOMFID | Pvalue | OddsRatio | ExpCount | Count | Size | Term |
| GO:0051216 | 6e-04 | 21.6648 | 0.1738 | 3 | 182 | cartilage development |
| GO:0044273 | 7e-04 | 60.1962 | 0.0401 | 2 | 42 | sulfur compound catabolic process |
| GO:0007601 | 8e-04 | 20.181 | 0.1862 | 3 | 195 | visual perception |
| GO:0060007 | 0.001 | Inf | 0.001 | 1 | 1 | linear vestibuloocular reflex |
| GO:0060618 | 0.001 | Inf | 0.001 | 1 | 1 | nipple development |
| GO:0060649 | 0.001 | Inf | 0.001 | 1 | 1 | mammary gland bud elongation |
| GO:0060659 | 0.001 | Inf | 0.001 | 1 | 1 | nipple sheath formation |
| GO:0002066 | 0.0013 | 43.7371 | 0.0544 | 2 | 57 | columnar/cuboidal epithelial cell development |
| GO:0007189 | 0.0019 | 36.4219 | 0.0649 | 2 | 68 | adenylate cyclase-activating G-protein coupled receptor signaling pathway |
| GO:0006535 | 0.0019 | 1120.7143 | 0.0019 | 1 | 2 | cysteine biosynthetic process from serine |
| GO:0043418 | 0.0019 | 1120.7143 | 0.0019 | 1 | 2 | homocysteine catabolic process |
| GO:0071676 | 0.0019 | 1120.7143 | 0.0019 | 1 | 2 | negative regulation of mononuclear cell migration |
| GO:0030819 | 0.0022 | 33.3739 | 0.0707 | 2 | 74 | positive regulation of cAMP biosynthetic process |
| GO:0006565 | 0.0029 | 560.3214 | 0.0029 | 1 | 3 | L-serine catabolic process |
| GO:0019343 | 0.0029 | 560.3214 | 0.0029 | 1 | 3 | cysteine biosynthetic process via cystathionine |
| GO:0019448 | 0.0029 | 560.3214 | 0.0029 | 1 | 3 | L-cysteine catabolic process |
| GO:0036112 | 0.0029 | 560.3214 | 0.0029 | 1 | 3 | medium-chain fatty-acyl-CoA metabolic process |
| GO:0042262 | 0.0029 | 560.3214 | 0.0029 | 1 | 3 | DNA protection |
| GO:0030810 | 0.0038 | 25.2567 | 0.0926 | 2 | 97 | positive regulation of nucleotide biosynthetic process |
| GO:0019346 | 0.0038 | 373.5238 | 0.0038 | 1 | 4 | transsulfuration |
| GO:0032348 | 0.0038 | 373.5238 | 0.0038 | 1 | 4 | negative regulation of aldosterone biosynthetic process |
| GO:0032914 | 0.0038 | 373.5238 | 0.0038 | 1 | 4 | positive regulation of transforming growth factor beta1 production |
| GO:0070814 | 0.0038 | 373.5238 | 0.0038 | 1 | 4 | hydrogen sulfide biosynthetic process |
| GO:2000065 | 0.0038 | 373.5238 | 0.0038 | 1 | 4 | negative regulation of cortisol biosynthetic process |
| GO:0030801 | 0.0041 | 24.23 | 0.0965 | 2 | 101 | positive regulation of cyclic nucleotide metabolic process |
| GO:0031944 | 0.0048 | 280.125 | 0.0048 | 1 | 5 | negative regulation of glucocorticoid metabolic process |
| GO:0000003 | 0.0055 | 5.6102 | 1.2311 | 5 | 1289 | reproduction |
| GO:0044281 | 0.0056 | 4.5346 | 2.4306 | 7 | 2545 | small molecule metabolic process |
| GO:0021562 | 0.0057 | 224.0857 | 0.0057 | 1 | 6 | vestibulocochlear nerve development |
| GO:0030814 | 0.006 | 19.7966 | 0.1175 | 2 | 123 | regulation of cAMP metabolic process |
| GO:1900544 | 0.0062 | 19.4722 | 0.1194 | 2 | 125 | positive regulation of purine nucleotide metabolic process |
| GO:0030802 | 0.0064 | 19.1582 | 0.1213 | 2 | 127 | regulation of cyclic nucleotide biosynthetic process |
| GO:0031946 | 0.0067 | 186.7262 | 0.0067 | 1 | 7 | regulation of glucocorticoid biosynthetic process |
| GO:0032344 | 0.0067 | 186.7262 | 0.0067 | 1 | 7 | regulation of aldosterone metabolic process |
| GO:1900371 | 0.007 | 18.2736 | 0.127 | 2 | 133 | regulation of purine nucleotide biosynthetic process |
| GO:0031223 | 0.0076 | 160.0408 | 0.0076 | 1 | 8 | auditory behavior |
| GO:0032353 | 0.0076 | 160.0408 | 0.0076 | 1 | 8 | negative regulation of hormone biosynthetic process |
| GO:0043569 | 0.0076 | 160.0408 | 0.0076 | 1 | 8 | negative regulation of insulin-like growth factor receptor signaling pathway |
| GO:0044703 | 0.0083 | 6.1129 | 0.8452 | 4 | 885 | multi-organism reproductive process |
| GO:0052652 | 0.0084 | 16.4944 | 0.1404 | 2 | 147 | cyclic purine nucleotide metabolic process |
| GO:0010566 | 0.0086 | 140.0268 | 0.0086 | 1 | 9 | regulation of ketone biosynthetic process |
| GO:0034650 | 0.0086 | 140.0268 | 0.0086 | 1 | 9 | cortisol metabolic process |
| GO:0046661 | 0.0088 | 16.157 | 0.1433 | 2 | 150 | male sex differentiation |
| GO:0006600 | 0.0095 | 124.4603 | 0.0096 | 1 | 10 | creatine metabolic process |
| GOMFID | Pvalue | OddsRatio | ExpCount | Count | Size | Term |
| GO:0030097 | 7e-04 | 8.869 | 0.7674 | 5 | 709 | hemopoiesis |
| GO:0050913 | 8e-04 | 56.4036 | 0.0422 | 2 | 39 | sensory perception of bitter taste |
| GO:0002573 | 9e-04 | 18.5674 | 0.197 | 3 | 182 | myeloid leukocyte differentiation |
| GO:0002668 | 0.0011 | Inf | 0.0011 | 1 | 1 | negative regulation of T cell anergy |
| GO:0032681 | 0.0011 | Inf | 0.0011 | 1 | 1 | regulation of lymphotoxin A production |
| GO:0035038 | 0.0011 | Inf | 0.0011 | 1 | 1 | female pronucleus assembly |
| GO:0035644 | 0.0011 | Inf | 0.0011 | 1 | 1 | phosphoanandamide dephosphorylation |
| GO:0043017 | 0.0011 | Inf | 0.0011 | 1 | 1 | positive regulation of lymphotoxin A biosynthetic process |
| GO:0002520 | 0.0012 | 7.8164 | 0.8648 | 5 | 799 | immune system development |
| GO:0002366 | 0.0013 | 16.5954 | 0.2197 | 3 | 203 | leukocyte activation involved in immune response |
| GO:0002644 | 0.0022 | 980.5 | 0.0022 | 1 | 2 | negative regulation of tolerance induction |
| GO:0045404 | 0.0022 | 980.5 | 0.0022 | 1 | 2 | positive regulation of interleukin-4 biosynthetic process |
| GO:1902523 | 0.0022 | 980.5 | 0.0022 | 1 | 2 | positive regulation of protein K63-linked ubiquitination |
| GO:0046651 | 0.0023 | 13.3419 | 0.2717 | 3 | 251 | lymphocyte proliferation |
| GO:0014823 | 0.0026 | 30.6294 | 0.0758 | 2 | 70 | response to activity |
| GO:0070661 | 0.0027 | 12.5687 | 0.2879 | 3 | 266 | leukocyte proliferation |
| GO:0030101 | 0.0031 | 27.7582 | 0.0833 | 2 | 77 | natural killer cell activation |
| GO:0042427 | 0.0032 | 490.2188 | 0.0032 | 1 | 3 | serotonin biosynthetic process |
| GO:0070433 | 0.0032 | 490.2188 | 0.0032 | 1 | 3 | negative regulation of nucleotide-binding oligomerization domain containing 2 signaling pathway |
| GO:1900194 | 0.0032 | 490.2188 | 0.0032 | 1 | 3 | negative regulation of oocyte maturation |
| GO:0002682 | 0.0034 | 5.2761 | 1.5976 | 6 | 1476 | regulation of immune system process |
| GO:0060337 | 0.0035 | 26.015 | 0.0888 | 2 | 82 | type I interferon signaling pathway |
| GO:0034340 | 0.0038 | 24.7698 | 0.0931 | 2 | 86 | response to type I interferon |
| GO:0030098 | 0.0039 | 11.0296 | 0.3269 | 3 | 302 | lymphocyte differentiation |
| GO:0046219 | 0.0043 | 326.7917 | 0.0043 | 1 | 4 | indolalkylamine biosynthetic process |
| GO:1903753 | 0.0043 | 326.7917 | 0.0043 | 1 | 4 | negative regulation of p38MAPK cascade |
| GO:2000483 | 0.0043 | 326.7917 | 0.0043 | 1 | 4 | negative regulation of interleukin-8 secretion |
| GO:0051607 | 0.0049 | 10.1942 | 0.3529 | 3 | 326 | defense response to virus |
| GO:0002309 | 0.0054 | 245.0781 | 0.0054 | 1 | 5 | T cell proliferation involved in immune response |
| GO:0008588 | 0.0054 | 245.0781 | 0.0054 | 1 | 5 | release of cytoplasmic sequestered NF-kappaB |
| GO:0032571 | 0.0054 | 245.0781 | 0.0054 | 1 | 5 | response to vitamin K |
| GO:0033594 | 0.0054 | 245.0781 | 0.0054 | 1 | 5 | response to hydroxyisoflavone |
| GO:0071225 | 0.0054 | 245.0781 | 0.0054 | 1 | 5 | cellular response to muramyl dipeptide |
| GO:0071706 | 0.0055 | 20.3752 | 0.1126 | 2 | 104 | tumor necrosis factor superfamily cytokine production |
| GO:1903715 | 0.0065 | 196.05 | 0.0065 | 1 | 6 | regulation of aerobic respiration |
| GO:0002911 | 0.0076 | 163.3646 | 0.0076 | 1 | 7 | regulation of lymphocyte anergy |
| GO:0034141 | 0.0076 | 163.3646 | 0.0076 | 1 | 7 | positive regulation of toll-like receptor 3 signaling pathway |
| GO:0045630 | 0.0076 | 163.3646 | 0.0076 | 1 | 7 | positive regulation of T-helper 2 cell differentiation |
| GO:0060631 | 0.0076 | 163.3646 | 0.0076 | 1 | 7 | regulation of meiosis I |
| GO:1900165 | 0.0076 | 163.3646 | 0.0076 | 1 | 7 | negative regulation of interleukin-6 secretion |
| GO:0071901 | 0.0078 | 17.0131 | 0.1342 | 2 | 124 | negative regulation of protein serine/threonine kinase activity |
| GO:0031347 | 0.0082 | 5.9862 | 0.8345 | 4 | 771 | regulation of defense response |
| GO:0032817 | 0.0086 | 140.0179 | 0.0087 | 1 | 8 | regulation of natural killer cell proliferation |
| GO:1902715 | 0.0086 | 140.0179 | 0.0087 | 1 | 8 | positive regulation of interferon-gamma secretion |
| GO:0042326 | 0.0095 | 7.926 | 0.4503 | 3 | 416 | negative regulation of phosphorylation |
| GO:0071248 | 0.0096 | 15.248 | 0.1494 | 2 | 138 | cellular response to metal ion |
| GO:0010388 | 0.0097 | 122.5078 | 0.0097 | 1 | 9 | cullin deneddylation |
| GO:0060281 | 0.0097 | 122.5078 | 0.0097 | 1 | 9 | regulation of oocyte development |
| GO:0070424 | 0.0097 | 122.5078 | 0.0097 | 1 | 9 | regulation of nucleotide-binding oligomerization domain containing signaling pathway |
| GOMFID | Pvalue | OddsRatio | ExpCount | Count | Size | Term |
| GO:0031295 | 3e-04 | 25.7258 | 0.1348 | 3 | 73 | T cell costimulation |
| GO:0002062 | 7e-04 | 19.1281 | 0.1791 | 3 | 97 | chondrocyte differentiation |
| GO:0032673 | 0.001 | 50.4155 | 0.0462 | 2 | 25 | regulation of interleukin-4 production |
| GO:0002668 | 0.0018 | Inf | 0.0018 | 1 | 1 | negative regulation of T cell anergy |
| GO:0032203 | 0.0018 | Inf | 0.0018 | 1 | 1 | telomere formation via telomerase |
| GO:0032681 | 0.0018 | Inf | 0.0018 | 1 | 1 | regulation of lymphotoxin A production |
| GO:0043017 | 0.0018 | Inf | 0.0018 | 1 | 1 | positive regulation of lymphotoxin A biosynthetic process |
| GO:1990079 | 0.0018 | Inf | 0.0018 | 1 | 1 | cartilage homeostasis |
| GO:0048522 | 0.0026 | 3.0493 | 8.3532 | 16 | 4524 | positive regulation of cellular process |
| GO:0034341 | 0.003 | 11.6306 | 0.2899 | 3 | 157 | response to interferon-gamma |
| GO:0050852 | 0.003 | 11.6306 | 0.2899 | 3 | 157 | T cell receptor signaling pathway |
| GO:0002478 | 0.0035 | 10.9144 | 0.3084 | 3 | 167 | antigen processing and presentation of exogenous peptide antigen |
| GO:0002644 | 0.0037 | 559.8571 | 0.0037 | 1 | 2 | negative regulation of tolerance induction |
| GO:0014846 | 0.0037 | 559.8571 | 0.0037 | 1 | 2 | esophagus smooth muscle contraction |
| GO:0045404 | 0.0037 | 559.8571 | 0.0037 | 1 | 2 | positive regulation of interleukin-4 biosynthetic process |
| GO:0007032 | 0.0058 | 19.2802 | 0.1145 | 2 | 62 | endosome organization |
| GO:0034112 | 0.0058 | 9.0668 | 0.3693 | 3 | 200 | positive regulation of homotypic cell-cell adhesion |
| GO:1903039 | 0.006 | 8.9745 | 0.373 | 3 | 202 | positive regulation of leukocyte cell-cell adhesion |
| GO:0060686 | 0.0074 | 186.5952 | 0.0074 | 1 | 4 | negative regulation of prostatic bud formation |
| GO:0090666 | 0.0074 | 186.5952 | 0.0074 | 1 | 4 | scaRNA localization to Cajal body |
| GO:0042110 | 0.0078 | 5.7006 | 0.7977 | 4 | 432 | T cell activation |
| GO:0071593 | 0.0078 | 5.6869 | 0.7995 | 4 | 433 | lymphocyte aggregation |
| GO:0019882 | 0.0081 | 8.0327 | 0.4154 | 3 | 225 | antigen processing and presentation |
| GO:0002757 | 0.0087 | 5.5149 | 0.8235 | 4 | 446 | immune response-activating signal transduction |
| GO:0061448 | 0.0089 | 7.7493 | 0.4302 | 3 | 233 | connective tissue development |
| GO:0006595 | 0.0091 | 15.2057 | 0.144 | 2 | 78 | polyamine metabolic process |
| GO:0002309 | 0.0092 | 139.9375 | 0.0092 | 1 | 5 | T cell proliferation involved in immune response |
| GO:0008588 | 0.0092 | 139.9375 | 0.0092 | 1 | 5 | release of cytoplasmic sequestered NF-kappaB |
| GO:0042760 | 0.0092 | 139.9375 | 0.0092 | 1 | 5 | very long-chain fatty acid catabolic process |
| GO:0007034 | 0.01 | 14.4417 | 0.1514 | 2 | 82 | vacuolar transport |
| GOMFID | Pvalue | OddsRatio | ExpCount | Count | Size | Term |
| GO:0010226 | 6e-04 | 68.2353 | 0.0351 | 2 | 29 | response to lithium ion |
| GO:0050911 | 9e-04 | 11.0699 | 0.4512 | 4 | 373 | detection of chemical stimulus involved in sensory perception of smell |
| GO:0097275 | 0.0012 | Inf | 0.0012 | 1 | 1 | cellular ammonia homeostasis |
| GO:0097276 | 0.0012 | Inf | 0.0012 | 1 | 1 | cellular creatinine homeostasis |
| GO:0097277 | 0.0012 | Inf | 0.0012 | 1 | 1 | cellular urea homeostasis |
| GO:0009593 | 0.0019 | 9.0293 | 0.5492 | 4 | 454 | detection of chemical stimulus |
| GO:0003407 | 0.0021 | 34.0588 | 0.0677 | 2 | 56 | neural retina development |
| GO:0007606 | 0.0021 | 8.7683 | 0.5649 | 4 | 467 | sensory perception of chemical stimulus |
| GO:0050906 | 0.0021 | 8.7683 | 0.5649 | 4 | 467 | detection of stimulus involved in sensory perception |
| GO:0050877 | 0.0024 | 5.5171 | 1.4722 | 6 | 1217 | neurological system process |
| GO:0006682 | 0.0024 | 871.4444 | 0.0024 | 1 | 2 | galactosylceramide biosynthetic process |
| GO:0097332 | 0.0036 | 435.6944 | 0.0036 | 1 | 3 | response to antipsychotic drug |
| GO:0060024 | 0.0048 | 290.4444 | 0.0048 | 1 | 4 | rhythmic synaptic transmission |
| GO:0003279 | 0.0057 | 19.9425 | 0.1137 | 2 | 94 | cardiac septum development |
| GO:0019374 | 0.0072 | 174.2444 | 0.0073 | 1 | 6 | galactolipid metabolic process |
| GO:0097070 | 0.0072 | 174.2444 | 0.0073 | 1 | 6 | ductus arteriosus closure |
| GO:0071670 | 0.0084 | 145.1944 | 0.0085 | 1 | 7 | smooth muscle cell chemotaxis |
| GOMFID | Pvalue | OddsRatio | ExpCount | Count | Size | Term |
| GO:0071285 | 4e-04 | 80.1228 | 0.0302 | 2 | 19 | cellular response to lithium ion |
| GO:1901687 | 0.0011 | 46.9325 | 0.0493 | 2 | 31 | glutathione derivative biosynthetic process |
| GO:0008207 | 0.0012 | 43.899 | 0.0525 | 2 | 33 | C21-steroid hormone metabolic process |
| GO:0032078 | 0.0016 | Inf | 0.0016 | 1 | 1 | negative regulation of endodeoxyribonuclease activity |
| GO:0034230 | 0.0016 | Inf | 0.0016 | 1 | 1 | enkephalin processing |
| GO:0034231 | 0.0016 | Inf | 0.0016 | 1 | 1 | islet amyloid polypeptide processing |
| GO:0042445 | 0.0029 | 11.8767 | 0.2881 | 3 | 181 | hormone metabolic process |
| GO:0071344 | 0.0032 | 653.3333 | 0.0032 | 1 | 2 | diphosphate metabolic process |
| GO:0071676 | 0.0032 | 653.3333 | 0.0032 | 1 | 2 | negative regulation of mononuclear cell migration |
| GO:0006749 | 0.0032 | 26.6496 | 0.0844 | 2 | 53 | glutathione metabolic process |
| GO:0030070 | 0.0048 | 326.6458 | 0.0048 | 1 | 3 | insulin processing |
| GO:0032074 | 0.0048 | 326.6458 | 0.0048 | 1 | 3 | negative regulation of nuclease activity |
| GO:0042427 | 0.0048 | 326.6458 | 0.0048 | 1 | 3 | serotonin biosynthetic process |
| GO:0044375 | 0.0048 | 326.6458 | 0.0048 | 1 | 3 | regulation of peroxisome size |
| GO:0070458 | 0.0048 | 326.6458 | 0.0048 | 1 | 3 | cellular detoxification of nitrogen compound |
| GO:0097332 | 0.0048 | 326.6458 | 0.0048 | 1 | 3 | response to antipsychotic drug |
| GO:0043627 | 0.0048 | 9.8558 | 0.3454 | 3 | 217 | response to estrogen |
| GO:0014823 | 0.0055 | 19.9655 | 0.1114 | 2 | 70 | response to activity |
| GO:0002943 | 0.0064 | 217.75 | 0.0064 | 1 | 4 | tRNA dihydrouridine synthesis |
| GO:0016557 | 0.0064 | 217.75 | 0.0064 | 1 | 4 | peroxisome membrane biogenesis |
| GO:0018916 | 0.0064 | 217.75 | 0.0064 | 1 | 4 | nitrobenzene metabolic process |
| GO:0032348 | 0.0064 | 217.75 | 0.0064 | 1 | 4 | negative regulation of aldosterone biosynthetic process |
| GO:0046219 | 0.0064 | 217.75 | 0.0064 | 1 | 4 | indolalkylamine biosynthetic process |
| GO:2000065 | 0.0064 | 217.75 | 0.0064 | 1 | 4 | negative regulation of cortisol biosynthetic process |
| GO:0098754 | 0.0071 | 17.3946 | 0.1273 | 2 | 80 | detoxification |
| GO:0031944 | 0.0079 | 163.3021 | 0.008 | 1 | 5 | negative regulation of glucocorticoid metabolic process |
| GOMFID | Pvalue | OddsRatio | ExpCount | Count | Size | Term |
| GO:0071346 | 5e-04 | 23.391 | 0.1559 | 3 | 136 | cellular response to interferon-gamma |
| GO:0007156 | 6e-04 | 21 | 0.1731 | 3 | 151 | homophilic cell adhesion via plasma membrane adhesion molecules |
| GO:0070374 | 9e-04 | 18.7012 | 0.1937 | 3 | 169 | positive regulation of ERK1 and ERK2 cascade |
| GO:0051977 | 0.0011 | Inf | 0.0011 | 1 | 1 | lysophospholipid transport |
| GO:0048247 | 0.0015 | 40.7292 | 0.0573 | 2 | 50 | lymphocyte chemotaxis |
| GO:0002548 | 0.002 | 34.2785 | 0.0676 | 2 | 59 | monocyte chemotaxis |
| GO:0043420 | 0.0034 | 461.3529 | 0.0034 | 1 | 3 | anthranilate metabolic process |
| GO:0070098 | 0.0036 | 25.3425 | 0.0905 | 2 | 79 | chemokine-mediated signaling pathway |
| GO:0030593 | 0.0043 | 23.2202 | 0.0986 | 2 | 86 | neutrophil chemotaxis |
| GO:0019805 | 0.0046 | 307.549 | 0.0046 | 1 | 4 | quinolinate biosynthetic process |
| GO:0034354 | 0.0046 | 307.549 | 0.0046 | 1 | 4 | 'de novo' NAD biosynthetic process from tryptophan |
| GO:0071347 | 0.0047 | 22.1591 | 0.1031 | 2 | 90 | cellular response to interleukin-1 |
| GO:0090238 | 0.0057 | 230.6471 | 0.0057 | 1 | 5 | positive regulation of arachidonic acid secretion |
| GO:0090370 | 0.0057 | 230.6471 | 0.0057 | 1 | 5 | negative regulation of cholesterol efflux |
| GO:0016198 | 0.0069 | 184.5059 | 0.0069 | 1 | 6 | axon choice point recognition |
| GO:0097530 | 0.0069 | 18.0324 | 0.1261 | 2 | 110 | granulocyte migration |
| GO:0050729 | 0.0072 | 17.7023 | 0.1284 | 2 | 112 | positive regulation of inflammatory response |
| GO:0019441 | 0.008 | 153.7451 | 0.008 | 1 | 7 | tryptophan catabolic process to kynurenine |
| GO:0008037 | 0.0097 | 15.0766 | 0.1501 | 2 | 131 | cell recognition |
| GOMFID | Pvalue | OddsRatio | ExpCount | Count | Size | Term |
| GO:0050928 | 9e-04 | Inf | 9e-04 | 1 | 1 | negative regulation of positive chemotaxis |
| GO:0071299 | 9e-04 | Inf | 9e-04 | 1 | 1 | cellular response to vitamin A |
| GO:0072274 | 9e-04 | Inf | 9e-04 | 1 | 1 | metanephric glomerular basement membrane development |
| GO:0032835 | 0.0011 | 47.3848 | 0.0508 | 2 | 57 | glomerulus development |
| GO:0048678 | 0.0014 | 42.0161 | 0.057 | 2 | 64 | response to axon injury |
| GO:0052565 | 0.0018 | 1207 | 0.0018 | 1 | 2 | response to defense-related host nitric oxide production |
| GO:0048014 | 0.0027 | 603.4615 | 0.0027 | 1 | 3 | Tie signaling pathway |
| GO:0048677 | 0.0027 | 603.4615 | 0.0027 | 1 | 3 | axon extension involved in regeneration |
| GO:0072249 | 0.0027 | 603.4615 | 0.0027 | 1 | 3 | metanephric glomerular visceral epithelial cell development |
| GO:0072312 | 0.0027 | 603.4615 | 0.0027 | 1 | 3 | metanephric glomerular epithelial cell differentiation |
| GO:0043137 | 0.0036 | 402.2821 | 0.0036 | 1 | 4 | DNA replication, removal of RNA primer |
| GO:0052564 | 0.0053 | 241.3385 | 0.0053 | 1 | 6 | response to immune response of other organism involved in symbiotic interaction |
| GO:0052200 | 0.0062 | 201.1026 | 0.0062 | 1 | 7 | response to host defenses |
| GO:2001300 | 0.0062 | 201.1026 | 0.0062 | 1 | 7 | lipoxin metabolic process |
| GO:0051707 | 0.0066 | 6.6368 | 0.7987 | 4 | 896 | response to other organism |
| GO:0006273 | 0.0071 | 172.3626 | 0.0071 | 1 | 8 | lagging strand elongation |
| GO:0060087 | 0.0071 | 172.3626 | 0.0071 | 1 | 8 | relaxation of vascular smooth muscle |
| GO:0009607 | 0.0076 | 6.3638 | 0.8308 | 4 | 932 | response to biotic stimulus |
| GO:0009635 | 0.0089 | 134.0427 | 0.0089 | 1 | 10 | response to herbicide |
| GO:0072310 | 0.0098 | 120.6308 | 0.0098 | 1 | 11 | glomerular epithelial cell development |
| GOMFID | Pvalue | OddsRatio | ExpCount | Count | Size | Term |
| GO:0032970 | 7e-04 | 11.6327 | 0.4174 | 4 | 298 | regulation of actin filament-based process |
| GO:0003421 | 0.0014 | Inf | 0.0014 | 1 | 1 | growth plate cartilage axis specification |
| GO:0043538 | 0.0014 | Inf | 0.0014 | 1 | 1 | regulation of actin phosphorylation |
| GO:1903403 | 0.0014 | Inf | 0.0014 | 1 | 1 | negative regulation of renal phosphate excretion |
| GO:0030047 | 0.0042 | 373.381 | 0.0042 | 1 | 3 | actin modification |
| GO:0042427 | 0.0042 | 373.381 | 0.0042 | 1 | 3 | serotonin biosynthetic process |
| GO:0002408 | 0.0056 | 248.9048 | 0.0056 | 1 | 4 | myeloid dendritic cell chemotaxis |
| GO:0006021 | 0.0056 | 248.9048 | 0.0056 | 1 | 4 | inositol biosynthetic process |
| GO:0046219 | 0.0056 | 248.9048 | 0.0056 | 1 | 4 | indolalkylamine biosynthetic process |
| GO:0042989 | 0.007 | 186.6667 | 0.007 | 1 | 5 | sequestering of actin monomers |
| GO:0007015 | 0.0083 | 8.0968 | 0.4244 | 3 | 303 | actin filament organization |
| GO:0009249 | 0.0084 | 149.3238 | 0.0084 | 1 | 6 | protein lipoylation |
| GO:0006342 | 0.0095 | 14.9808 | 0.1485 | 2 | 106 | chromatin silencing |
| GOMFID | Pvalue | OddsRatio | ExpCount | Count | Size | Term |
| GO:0046356 | 0.0013 | Inf | 0.0013 | 1 | 1 | acetyl-CoA catabolic process |
| GO:0051977 | 0.0013 | Inf | 0.0013 | 1 | 1 | lysophospholipid transport |
| GO:0044712 | 0.0017 | 5.8956 | 1.3613 | 6 | 1069 | single-organism catabolic process |
| GO:0006535 | 0.0025 | 825.5263 | 0.0025 | 1 | 2 | cysteine biosynthetic process from serine |
| GO:0015938 | 0.0025 | 825.5263 | 0.0025 | 1 | 2 | coenzyme A catabolic process |
| GO:0033869 | 0.0025 | 825.5263 | 0.0025 | 1 | 2 | nucleoside bisphosphate catabolic process |
| GO:0043418 | 0.0025 | 825.5263 | 0.0025 | 1 | 2 | homocysteine catabolic process |
| GO:0016054 | 0.0026 | 12.5213 | 0.2814 | 3 | 221 | organic acid catabolic process |
| GO:0006565 | 0.0038 | 412.7368 | 0.0038 | 1 | 3 | L-serine catabolic process |
| GO:0019343 | 0.0038 | 412.7368 | 0.0038 | 1 | 3 | cysteine biosynthetic process via cystathionine |
| GO:0019448 | 0.0038 | 412.7368 | 0.0038 | 1 | 3 | L-cysteine catabolic process |
| GO:0042262 | 0.0038 | 412.7368 | 0.0038 | 1 | 3 | DNA protection |
| GO:0043420 | 0.0038 | 412.7368 | 0.0038 | 1 | 3 | anthranilate metabolic process |
| GO:0010992 | 0.0051 | 275.1404 | 0.0051 | 1 | 4 | ubiquitin homeostasis |
| GO:0019346 | 0.0051 | 275.1404 | 0.0051 | 1 | 4 | transsulfuration |
| GO:0019805 | 0.0051 | 275.1404 | 0.0051 | 1 | 4 | quinolinate biosynthetic process |
| GO:0034354 | 0.0051 | 275.1404 | 0.0051 | 1 | 4 | 'de novo' NAD biosynthetic process from tryptophan |
| GO:0070814 | 0.0051 | 275.1404 | 0.0051 | 1 | 4 | hydrogen sulfide biosynthetic process |
| GO:0006575 | 0.0062 | 9.1125 | 0.3833 | 3 | 301 | cellular modified amino acid metabolic process |
| GO:0010756 | 0.0064 | 206.3421 | 0.0064 | 1 | 5 | positive regulation of plasminogen activation |
| GO:0042760 | 0.0064 | 206.3421 | 0.0064 | 1 | 5 | very long-chain fatty acid catabolic process |
| GO:0090238 | 0.0064 | 206.3421 | 0.0064 | 1 | 5 | positive regulation of arachidonic acid secretion |
| GO:0090370 | 0.0064 | 206.3421 | 0.0064 | 1 | 5 | negative regulation of cholesterol efflux |
| GO:0050684 | 0.0065 | 18.4303 | 0.1222 | 2 | 96 | regulation of mRNA processing |
| GO:0008063 | 0.0076 | 165.0632 | 0.0076 | 1 | 6 | Toll signaling pathway |
| GO:1901605 | 0.0082 | 8.2118 | 0.424 | 3 | 333 | alpha-amino acid metabolic process |
| GO:0019441 | 0.0089 | 137.5439 | 0.0089 | 1 | 7 | tryptophan catabolic process to kynurenine |
| GO:0060054 | 0.0089 | 137.5439 | 0.0089 | 1 | 7 | positive regulation of epithelial cell proliferation involved in wound healing |
| GO:0090091 | 0.0089 | 137.5439 | 0.0089 | 1 | 7 | positive regulation of extracellular matrix disassembly |
| GO:0009063 | 0.0096 | 15.0444 | 0.149 | 2 | 117 | cellular amino acid catabolic process |
| GOMFID | Pvalue | OddsRatio | ExpCount | Count | Size | Term |
| GO:0000387 | 0.0018 | 35.7963 | 0.0637 | 2 | 40 | spliceosomal snRNP assembly |
| GO:0007618 | 0.0022 | 32.3789 | 0.07 | 2 | 44 | mating |
| GO:0035039 | 0.0032 | 653.3333 | 0.0032 | 1 | 2 | male pronucleus assembly |
| GO:1904211 | 0.0032 | 653.3333 | 0.0032 | 1 | 2 | membrane protein proteolysis involved in retrograde protein transport, ER to cytosol |
| GO:0000245 | 0.0032 | 26.6496 | 0.0844 | 2 | 53 | spliceosomal complex assembly |
| GO:0006749 | 0.0032 | 26.6496 | 0.0844 | 2 | 53 | glutathione metabolic process |
| GO:0000720 | 0.0048 | 326.6458 | 0.0048 | 1 | 3 | pyrimidine dimer repair by nucleotide-excision repair |
| GO:0007621 | 0.0064 | 217.75 | 0.0064 | 1 | 4 | negative regulation of female receptivity |
| GO:0031117 | 0.0064 | 217.75 | 0.0064 | 1 | 4 | positive regulation of microtubule depolymerization |
| GO:0048597 | 0.0064 | 217.75 | 0.0064 | 1 | 4 | post-embryonic camera-type eye morphogenesis |
| GO:0042221 | 0.0065 | 2.9556 | 6.7156 | 13 | 4219 | response to chemical |
| GO:0030593 | 0.0082 | 16.146 | 0.1369 | 2 | 86 | neutrophil chemotaxis |
| GO:0008063 | 0.0095 | 130.6333 | 0.0096 | 1 | 6 | Toll signaling pathway |
| GO:0070459 | 0.0095 | 130.6333 | 0.0096 | 1 | 6 | prolactin secretion |
| GO:0006353 | 0.0097 | 14.7344 | 0.1496 | 2 | 94 | DNA-templated transcription, termination |
| GOMFID | Pvalue | OddsRatio | ExpCount | Count | Size | Term |
| GO:0016339 | 6e-04 | 64.4403 | 0.0369 | 2 | 29 | calcium-dependent cell-cell adhesion via plasma membrane cell adhesion molecules |
| GO:0007156 | 9e-04 | 18.527 | 0.1923 | 3 | 151 | homophilic cell adhesion via plasma membrane adhesion molecules |
| GO:0022610 | 0.0012 | 5.5206 | 1.784 | 7 | 1401 | biological adhesion |
| GO:0015747 | 0.0038 | 412.7368 | 0.0038 | 1 | 3 | urate transport |
| GO:0098609 | 0.0039 | 5.7465 | 1.1015 | 5 | 865 | cell-cell adhesion |
| GO:0015760 | 0.0051 | 275.1404 | 0.0051 | 1 | 4 | glucose-6-phosphate transport |
| GO:1903825 | 0.006 | 19.2543 | 0.1172 | 2 | 92 | organic acid transmembrane transport |
| GO:0008627 | 0.0064 | 206.3421 | 0.0064 | 1 | 5 | intrinsic apoptotic signaling pathway in response to osmotic stress |
| GO:0098661 | 0.0067 | 18.2351 | 0.1235 | 2 | 97 | inorganic anion transmembrane transport |
| GO:0035965 | 0.0076 | 165.0632 | 0.0076 | 1 | 6 | cardiolipin acyl-chain remodeling |
| GO:0007268 | 0.0099 | 5.5169 | 0.871 | 4 | 684 | synaptic transmission |
| GO:0099536 | 0.0099 | 5.5169 | 0.871 | 4 | 684 | synaptic signaling |
| GOMFID | Pvalue | OddsRatio | ExpCount | Count | Size | Term |
| GO:0019402 | 0.0018 | Inf | 0.0018 | 1 | 1 | galactitol metabolic process |
| GO:0019731 | 0.0036 | 25.0481 | 0.0891 | 2 | 50 | antibacterial humoral response |
| GO:0002337 | 0.0036 | 580.6296 | 0.0036 | 1 | 2 | B-1a B cell differentiation |
| GO:0048211 | 0.0036 | 580.6296 | 0.0036 | 1 | 2 | Golgi vesicle docking |
| GO:1901318 | 0.0036 | 580.6296 | 0.0036 | 1 | 2 | negative regulation of sperm motility |
| GO:0008065 | 0.0053 | 290.2963 | 0.0053 | 1 | 3 | establishment of blood-nerve barrier |
| GO:0070458 | 0.0053 | 290.2963 | 0.0053 | 1 | 3 | cellular detoxification of nitrogen compound |
| GO:1900005 | 0.0053 | 290.2963 | 0.0053 | 1 | 3 | positive regulation of serine-type endopeptidase activity |
| GO:0018916 | 0.0071 | 193.5185 | 0.0071 | 1 | 4 | nitrobenzene metabolic process |
| GO:0001895 | 0.0073 | 17.1516 | 0.1284 | 2 | 72 | retina homeostasis |
| GO:0044706 | 0.0087 | 7.8182 | 0.4279 | 3 | 240 | multi-multicellular organism process |
| GO:0002322 | 0.0089 | 145.1296 | 0.0089 | 1 | 5 | B cell proliferation involved in immune response |
| GO:0050859 | 0.0089 | 145.1296 | 0.0089 | 1 | 5 | negative regulation of B cell receptor signaling pathway |
| GOMFID | Pvalue | OddsRatio | ExpCount | Count | Size | Term |
| GO:0060618 | 8e-04 | Inf | 8e-04 | 1 | 1 | nipple development |
| GO:0060649 | 8e-04 | Inf | 8e-04 | 1 | 1 | mammary gland bud elongation |
| GO:0060659 | 8e-04 | Inf | 8e-04 | 1 | 1 | nipple sheath formation |
| GO:0006535 | 0.0015 | 1426.6364 | 0.0015 | 1 | 2 | cysteine biosynthetic process from serine |
| GO:0019343 | 0.0023 | 713.2727 | 0.0023 | 1 | 3 | cysteine biosynthetic process via cystathionine |
| GO:0036112 | 0.0023 | 713.2727 | 0.0023 | 1 | 3 | medium-chain fatty-acyl-CoA metabolic process |
| GO:0006289 | 0.0032 | 28.3345 | 0.0856 | 2 | 112 | nucleotide-excision repair |
| GO:0045814 | 0.0058 | 20.5868 | 0.1169 | 2 | 153 | negative regulation of gene expression, epigenetic |
| GO:0019227 | 0.0061 | 203.7273 | 0.0061 | 1 | 8 | neuronal action potential propagation |
| GO:0006534 | 0.0076 | 158.4343 | 0.0076 | 1 | 10 | cysteine metabolic process |
| GO:0043129 | 0.0091 | 129.6116 | 0.0092 | 1 | 12 | surfactant homeostasis |
| GOMFID | Pvalue | OddsRatio | ExpCount | Count | Size | Term |
| GO:0060618 | 0.001 | Inf | 0.001 | 1 | 1 | nipple development |
| GO:0060649 | 0.001 | Inf | 0.001 | 1 | 1 | mammary gland bud elongation |
| GO:0060659 | 0.001 | Inf | 0.001 | 1 | 1 | nipple sheath formation |
| GO:0036112 | 0.0031 | 522.9333 | 0.0031 | 1 | 3 | medium-chain fatty-acyl-CoA metabolic process |
| GO:0030817 | 0.0052 | 21.2041 | 0.109 | 2 | 107 | regulation of cAMP biosynthetic process |
| GO:0048539 | 0.0061 | 209.1333 | 0.0061 | 1 | 6 | bone marrow development |
| GO:2000766 | 0.0061 | 209.1333 | 0.0061 | 1 | 6 | negative regulation of cytoplasmic translation |
| GO:0007196 | 0.0071 | 174.2667 | 0.0071 | 1 | 7 | adenylate cyclase-inhibiting G-protein coupled glutamate receptor signaling pathway |
| GO:0030808 | 0.0079 | 16.9673 | 0.1355 | 2 | 133 | regulation of nucleotide biosynthetic process |
| GO:0007188 | 0.0088 | 15.9825 | 0.1436 | 2 | 141 | adenylate cyclase-modulating G-protein coupled receptor signaling pathway |
| GO:0046058 | 0.0096 | 15.3153 | 0.1498 | 2 | 147 | cAMP metabolic process |
| GO:0052652 | 0.0096 | 15.3153 | 0.1498 | 2 | 147 | cyclic purine nucleotide metabolic process |
| GO:0030799 | 0.0098 | 15.105 | 0.1518 | 2 | 149 | regulation of cyclic nucleotide metabolic process |
| GOMFID | Pvalue | OddsRatio | ExpCount | Count | Size | Term |
| GO:0019740 | 0 | 348.5111 | 0.0087 | 2 | 8 | nitrogen utilization |
| GO:0006995 | 1e-04 | 149.2857 | 0.0173 | 2 | 16 | cellular response to nitrogen starvation |
| GO:0015695 | 2e-04 | 116.0815 | 0.0216 | 2 | 20 | organic cation transport |
| GO:0072488 | 3e-04 | 94.9515 | 0.026 | 2 | 24 | ammonium transmembrane transport |
| GO:0007344 | 0.0011 | Inf | 0.0011 | 1 | 1 | pronuclear fusion |
| GO:0060007 | 0.0011 | Inf | 0.0011 | 1 | 1 | linear vestibuloocular reflex |
| GO:0014038 | 0.0032 | 490.2188 | 0.0032 | 1 | 3 | regulation of Schwann cell differentiation |
| GO:0030098 | 0.0039 | 11.0296 | 0.3269 | 3 | 302 | lymphocyte differentiation |
| GO:0022614 | 0.0043 | 326.7917 | 0.0043 | 1 | 4 | membrane to membrane docking |
| GO:0032609 | 0.0052 | 20.9966 | 0.1093 | 2 | 101 | interferon-gamma production |
| GO:0046631 | 0.0058 | 19.7892 | 0.1158 | 2 | 107 | alpha-beta T cell activation |
| GO:0021562 | 0.0065 | 196.05 | 0.0065 | 1 | 6 | vestibulocochlear nerve development |
| GO:0090166 | 0.0065 | 196.05 | 0.0065 | 1 | 6 | Golgi disassembly |
| GO:0001865 | 0.0076 | 163.3646 | 0.0076 | 1 | 7 | NK T cell differentiation |
| GO:0060710 | 0.0076 | 163.3646 | 0.0076 | 1 | 7 | chorio-allantoic fusion |
| GO:0031223 | 0.0086 | 140.0179 | 0.0087 | 1 | 8 | auditory behavior |
| GO:0045471 | 0.0088 | 15.9579 | 0.1429 | 2 | 132 | response to ethanol |
| GOMFID | Pvalue | OddsRatio | ExpCount | Count | Size | Term |
| GO:0000964 | 0.0018 | 1207 | 0.0018 | 1 | 2 | mitochondrial RNA 5'-end processing |
| GO:1902530 | 0.0018 | 1207 | 0.0018 | 1 | 2 | positive regulation of protein linear polyubiquitination |
| GO:1901509 | 0.0027 | 603.4615 | 0.0027 | 1 | 3 | regulation of endothelial tube morphogenesis |
| GO:1901740 | 0.0027 | 603.4615 | 0.0027 | 1 | 3 | negative regulation of myoblast fusion |
| GO:0019243 | 0.0036 | 402.2821 | 0.0036 | 1 | 4 | methylglyoxal catabolic process to D-lactate via S-lactoyl-glutathione |
| GO:0051596 | 0.0036 | 402.2821 | 0.0036 | 1 | 4 | methylglyoxal catabolic process |
| GO:0090646 | 0.0036 | 402.2821 | 0.0036 | 1 | 4 | mitochondrial tRNA processing |
| GO:0019249 | 0.0044 | 301.6923 | 0.0045 | 1 | 5 | lactate biosynthetic process |
| GO:0030046 | 0.0044 | 301.6923 | 0.0045 | 1 | 5 | parallel actin filament bundle assembly |
| GO:0050957 | 0.0071 | 172.3626 | 0.0071 | 1 | 8 | equilibrioception |
| GO:0070900 | 0.0071 | 172.3626 | 0.0071 | 1 | 8 | mitochondrial tRNA modification |
| GO:0070424 | 0.008 | 150.8077 | 0.008 | 1 | 9 | regulation of nucleotide-binding oligomerization domain containing signaling pathway |
| GO:0097341 | 0.008 | 150.8077 | 0.008 | 1 | 9 | zymogen inhibition |
| GO:1990001 | 0.008 | 150.8077 | 0.008 | 1 | 9 | inhibition of cysteine-type endopeptidase activity involved in apoptotic process |
| GO:0042118 | 0.0089 | 134.0427 | 0.0089 | 1 | 10 | endothelial cell activation |
| GO:0010819 | 0.0098 | 120.6308 | 0.0098 | 1 | 11 | regulation of T cell chemotaxis |
| GOMFID | Pvalue | OddsRatio | ExpCount | Count | Size | Term |
| GO:0000042 | 6e-04 | 65.2417 | 0.0367 | 2 | 18 | protein targeting to Golgi |
| GO:0007344 | 0.002 | Inf | 0.002 | 1 | 1 | pronuclear fusion |
| GO:1901986 | 0.002 | Inf | 0.002 | 1 | 1 | response to ketamine |
| GO:1904010 | 0.002 | Inf | 0.002 | 1 | 1 | response to Aroclor 1254 |
| GO:0030803 | 0.0027 | 28.9593 | 0.0774 | 2 | 38 | negative regulation of cyclic nucleotide biosynthetic process |
| GO:1900372 | 0.003 | 27.4316 | 0.0815 | 2 | 40 | negative regulation of purine nucleotide biosynthetic process |
| GO:0006891 | 0.0034 | 25.4195 | 0.0876 | 2 | 43 | intra-Golgi vesicle-mediated transport |
| GO:0021568 | 0.0041 | 505.5806 | 0.0041 | 1 | 2 | rhombomere 2 development |
| GO:0021658 | 0.0041 | 505.5806 | 0.0041 | 1 | 2 | rhombomere 3 morphogenesis |
| GO:0031283 | 0.0041 | 505.5806 | 0.0041 | 1 | 2 | negative regulation of guanylate cyclase activity |
| GO:0033030 | 0.0041 | 505.5806 | 0.0041 | 1 | 2 | negative regulation of neutrophil apoptotic process |
| GO:1902530 | 0.0041 | 505.5806 | 0.0041 | 1 | 2 | positive regulation of protein linear polyubiquitination |
| GO:1904009 | 0.0041 | 505.5806 | 0.0041 | 1 | 2 | cellular response to monosodium glutamate |
| GO:0006887 | 0.0053 | 6.3287 | 0.7131 | 4 | 350 | exocytosis |
| GO:0014038 | 0.0061 | 252.7742 | 0.0061 | 1 | 3 | regulation of Schwann cell differentiation |
| GO:0030047 | 0.0061 | 252.7742 | 0.0061 | 1 | 3 | actin modification |
| GO:0030824 | 0.0061 | 252.7742 | 0.0061 | 1 | 3 | negative regulation of cGMP metabolic process |
| GO:0033693 | 0.0061 | 252.7742 | 0.0061 | 1 | 3 | neurofilament bundle assembly |
| GO:0035284 | 0.0061 | 252.7742 | 0.0061 | 1 | 3 | brain segmentation |
| GO:0045761 | 0.0075 | 16.7871 | 0.1304 | 2 | 64 | regulation of adenylate cyclase activity |
| GO:0045980 | 0.008 | 16.2604 | 0.1345 | 2 | 66 | negative regulation of nucleotide metabolic process |
| GO:0016080 | 0.0081 | 168.5054 | 0.0081 | 1 | 4 | synaptic vesicle targeting |
| GO:0033634 | 0.0081 | 168.5054 | 0.0081 | 1 | 4 | positive regulation of cell-cell adhesion mediated by integrin |
| GO:0034599 | 0.0098 | 7.4033 | 0.4462 | 3 | 219 | cellular response to oxidative stress |
| GOMFID | Pvalue | OddsRatio | ExpCount | Count | Size | Term |
| GO:0001894 | 8e-04 | 20.5022 | 0.1863 | 3 | 209 | tissue homeostasis |
| GO:0007344 | 9e-04 | Inf | 9e-04 | 1 | 1 | pronuclear fusion |
| GO:0060764 | 0.0018 | 1207 | 0.0018 | 1 | 2 | cell-cell signaling involved in mammary gland development |
| GO:0046849 | 0.002 | 35.1757 | 0.0677 | 2 | 76 | bone remodeling |
| GO:0014038 | 0.0027 | 603.4615 | 0.0027 | 1 | 3 | regulation of Schwann cell differentiation |
| GO:0060435 | 0.0027 | 603.4615 | 0.0027 | 1 | 3 | bronchiole development |
| GO:1902714 | 0.0027 | 603.4615 | 0.0027 | 1 | 3 | negative regulation of interferon-gamma secretion |
| GO:0032649 | 0.0029 | 29.2191 | 0.0811 | 2 | 91 | regulation of interferon-gamma production |
| GO:0060480 | 0.0036 | 402.2821 | 0.0036 | 1 | 4 | lung goblet cell differentiation |
| GO:0060535 | 0.0036 | 402.2821 | 0.0036 | 1 | 4 | trachea cartilage morphogenesis |
| GO:0060574 | 0.0036 | 402.2821 | 0.0036 | 1 | 4 | intestinal epithelial cell maturation |
| GO:0060482 | 0.0053 | 241.3385 | 0.0053 | 1 | 6 | lobar bronchus development |
| GO:0090166 | 0.0053 | 241.3385 | 0.0053 | 1 | 6 | Golgi disassembly |
| GO:0045647 | 0.0062 | 201.1026 | 0.0062 | 1 | 7 | negative regulation of erythrocyte differentiation |
| GO:0035270 | 0.0073 | 17.9954 | 0.1301 | 2 | 146 | endocrine system development |
| GO:0048469 | 0.0076 | 17.5045 | 0.1337 | 2 | 150 | cell maturation |
| GO:0019732 | 0.008 | 150.8077 | 0.008 | 1 | 9 | antifungal humoral response |
| GO:0060638 | 0.008 | 150.8077 | 0.008 | 1 | 9 | mesenchymal-epithelial cell signaling |
| GO:0072540 | 0.0089 | 134.0427 | 0.0089 | 1 | 10 | T-helper 17 cell lineage commitment |
| GO:0032660 | 0.0091 | 130.6 | 0.0091 | 1 | 11 | regulation of interleukin-17 production |
| GO:0010870 | 0.0098 | 120.6308 | 0.0098 | 1 | 11 | positive regulation of receptor biosynthetic process |
| GO:0032700 | 0.0098 | 120.6308 | 0.0098 | 1 | 11 | negative regulation of interleukin-17 production |
| GO:0033160 | 0.0098 | 120.6308 | 0.0098 | 1 | 11 | positive regulation of protein import into nucleus, translocation |
| GO:0034501 | 0.0098 | 120.6308 | 0.0098 | 1 | 11 | protein localization to kinetochore |
| GO:0045779 | 0.0098 | 120.6308 | 0.0098 | 1 | 11 | negative regulation of bone resorption |
| GO:0060484 | 0.0098 | 120.6308 | 0.0098 | 1 | 11 | lung-associated mesenchyme development |
| GOMFID | Pvalue | OddsRatio | ExpCount | Count | Size | Term |
| GO:0046534 | 0.0011 | Inf | 0.0011 | 1 | 1 | positive regulation of photoreceptor cell differentiation |
| GO:0061580 | 0.0011 | Inf | 0.0011 | 1 | 1 | colon epithelial cell migration |
| GO:0044027 | 0.0034 | 461.3529 | 0.0034 | 1 | 3 | hypermethylation of CpG island |
| GO:0045541 | 0.0057 | 230.6471 | 0.0057 | 1 | 5 | negative regulation of cholesterol biosynthetic process |
| GO:0032259 | 0.0068 | 8.9475 | 0.3965 | 3 | 346 | methylation |
| GO:0045347 | 0.0069 | 184.5059 | 0.0069 | 1 | 6 | negative regulation of MHC class II biosynthetic process |
| GO:0090241 | 0.0069 | 184.5059 | 0.0069 | 1 | 6 | negative regulation of histone H4 acetylation |
| GO:1902262 | 0.0069 | 184.5059 | 0.0069 | 1 | 6 | apoptotic process involved in patterning of blood vessels |
| GO:1902895 | 0.0091 | 131.7731 | 0.0092 | 1 | 8 | positive regulation of pri-miRNA transcription from RNA polymerase II promoter |
| GO:0022617 | 0.0095 | 15.1953 | 0.149 | 2 | 130 | extracellular matrix disassembly |
| GOMFID | Pvalue | OddsRatio | ExpCount | Count | Size | Term |
| GO:0060831 | 2e-04 | 128.9547 | 0.0203 | 2 | 11 | smoothened signaling pathway involved in dorsal/ventral neural tube patterning |
| GO:0008052 | 0.0018 | Inf | 0.0018 | 1 | 1 | sensory organ boundary specification |
| GO:0060618 | 0.0018 | Inf | 0.0018 | 1 | 1 | nipple development |
| GO:0060649 | 0.0018 | Inf | 0.0018 | 1 | 1 | mammary gland bud elongation |
| GO:0060659 | 0.0018 | Inf | 0.0018 | 1 | 1 | nipple sheath formation |
| GO:1901731 | 0.0018 | Inf | 0.0018 | 1 | 1 | positive regulation of platelet aggregation |
| GO:1990403 | 0.0018 | Inf | 0.0018 | 1 | 1 | embryonic brain development |
| GO:0060603 | 0.0022 | 32.1831 | 0.0702 | 2 | 38 | mammary gland duct morphogenesis |
| GO:0021532 | 0.0023 | 31.3113 | 0.072 | 2 | 39 | neural tube patterning |
| GO:0001709 | 0.0031 | 26.932 | 0.0831 | 2 | 45 | cell fate determination |
| GO:0006535 | 0.0037 | 559.8571 | 0.0037 | 1 | 2 | cysteine biosynthetic process from serine |
| GO:0007402 | 0.0037 | 559.8571 | 0.0037 | 1 | 2 | ganglion mother cell fate determination |
| GO:0010157 | 0.0037 | 559.8571 | 0.0037 | 1 | 2 | response to chlorate |
| GO:0021997 | 0.0037 | 559.8571 | 0.0037 | 1 | 2 | neural plate axis specification |
| GO:0035585 | 0.0037 | 559.8571 | 0.0037 | 1 | 2 | calcium-mediated signaling using extracellular calcium source |
| GO:0061193 | 0.0037 | 559.8571 | 0.0037 | 1 | 2 | taste bud development |
| GO:0070560 | 0.0037 | 559.8571 | 0.0037 | 1 | 2 | protein secretion by platelet |
| GO:1903887 | 0.0037 | 559.8571 | 0.0037 | 1 | 2 | motile primary cilium assembly |
| GO:0009957 | 0.0055 | 279.9107 | 0.0055 | 1 | 3 | epidermal cell fate specification |
| GO:0019343 | 0.0055 | 279.9107 | 0.0055 | 1 | 3 | cysteine biosynthetic process via cystathionine |
| GO:0042490 | 0.0062 | 18.6559 | 0.1182 | 2 | 64 | mechanoreceptor differentiation |
| GO:0008589 | 0.0066 | 18.0706 | 0.1219 | 2 | 66 | regulation of smoothened signaling pathway |
| GO:0010626 | 0.0074 | 186.5952 | 0.0074 | 1 | 4 | negative regulation of Schwann cell proliferation |
| GO:2001046 | 0.0074 | 186.5952 | 0.0074 | 1 | 4 | positive regulation of integrin-mediated signaling pathway |
| GO:0048865 | 0.0092 | 139.9375 | 0.0092 | 1 | 5 | stem cell fate commitment |
| GO:0060708 | 0.0092 | 139.9375 | 0.0092 | 1 | 5 | spongiotrophoblast differentiation |
| GO:0090315 | 0.0092 | 139.9375 | 0.0092 | 1 | 5 | negative regulation of protein targeting to membrane |
| GOMFID | Pvalue | OddsRatio | ExpCount | Count | Size | Term |
| GO:0048149 | 1e-04 | 245 | 0.0115 | 2 | 10 | behavioral response to ethanol |
| GO:2000310 | 1e-04 | 150.7212 | 0.0172 | 2 | 15 | regulation of N-methyl-D-aspartate selective glutamate receptor activity |
| GO:0010811 | 2e-04 | 32.4833 | 0.1135 | 3 | 99 | positive regulation of cell-substrate adhesion |
| GO:0042755 | 6e-04 | 67.4957 | 0.0355 | 2 | 31 | eating behavior |
| GO:1900024 | 0.001 | 50.1571 | 0.047 | 2 | 41 | regulation of substrate adhesion-dependent cell spreading |
| GO:0021763 | 0.0011 | Inf | 0.0011 | 1 | 1 | subthalamic nucleus development |
| GO:0051460 | 0.0011 | Inf | 0.0011 | 1 | 1 | negative regulation of corticotropin secretion |
| GO:0060127 | 0.0011 | Inf | 0.0011 | 1 | 1 | prolactin secreting cell differentiation |
| GO:0060578 | 0.0011 | Inf | 0.0011 | 1 | 1 | superior vena cava morphogenesis |
| GO:0060611 | 0.0011 | Inf | 0.0011 | 1 | 1 | mammary gland fat development |
| GO:0061358 | 0.0011 | Inf | 0.0011 | 1 | 1 | negative regulation of Wnt protein secretion |
| GO:1900011 | 0.0011 | Inf | 0.0011 | 1 | 1 | negative regulation of corticotropin-releasing hormone receptor activity |
| GO:1902228 | 0.0011 | Inf | 0.0011 | 1 | 1 | positive regulation of macrophage colony-stimulating factor signaling pathway |
| GO:1903971 | 0.0011 | Inf | 0.0011 | 1 | 1 | positive regulation of response to macrophage colony-stimulating factor |
| GO:1904141 | 0.0011 | Inf | 0.0011 | 1 | 1 | positive regulation of microglial cell migration |
| GO:1904209 | 0.0011 | Inf | 0.0011 | 1 | 1 | positive regulation of chemokine (C-C motif) ligand 2 secretion |
| GO:0007626 | 0.0013 | 16.2272 | 0.2223 | 3 | 194 | locomotory behavior |
| GO:0060443 | 0.0017 | 38.326 | 0.0607 | 2 | 53 | mammary gland morphogenesis |
| GO:0002432 | 0.0023 | 922.7647 | 0.0023 | 1 | 2 | granuloma formation |
| GO:0031635 | 0.0023 | 922.7647 | 0.0023 | 1 | 2 | adenylate cyclase-inhibiting opioid receptor signaling pathway |
| GO:0060460 | 0.0023 | 922.7647 | 0.0023 | 1 | 2 | left lung morphogenesis |
| GO:0060577 | 0.0023 | 922.7647 | 0.0023 | 1 | 2 | pulmonary vein morphogenesis |
| GO:1990523 | 0.0023 | 922.7647 | 0.0023 | 1 | 2 | bone regeneration |
| GO:0007215 | 0.0025 | 30.5156 | 0.0756 | 2 | 66 | glutamate receptor signaling pathway |
| GO:0003350 | 0.0034 | 461.3529 | 0.0034 | 1 | 3 | pulmonary myocardium development |
| GO:0035993 | 0.0034 | 461.3529 | 0.0034 | 1 | 3 | deltoid tuberosity development |
| GO:0042488 | 0.0034 | 461.3529 | 0.0034 | 1 | 3 | positive regulation of odontogenesis of dentin-containing tooth |
| GO:0061325 | 0.0034 | 461.3529 | 0.0034 | 1 | 3 | cell proliferation involved in outflow tract morphogenesis |
| GO:0071307 | 0.0034 | 461.3529 | 0.0034 | 1 | 3 | cellular response to vitamin K |
| GO:0071314 | 0.0034 | 461.3529 | 0.0034 | 1 | 3 | cellular response to cocaine |
| GO:1903972 | 0.0034 | 461.3529 | 0.0034 | 1 | 3 | regulation of cellular response to macrophage colony-stimulating factor stimulus |
| GO:0001952 | 0.0045 | 22.6773 | 0.1009 | 2 | 88 | regulation of cell-matrix adhesion |
| GO:1903530 | 0.0045 | 7.0744 | 0.7025 | 4 | 613 | regulation of secretion by cell |
| GO:0002074 | 0.0046 | 307.549 | 0.0046 | 1 | 4 | extraocular skeletal muscle development |
| GO:0002125 | 0.0046 | 307.549 | 0.0046 | 1 | 4 | maternal aggressive behavior |
| GO:0003253 | 0.0046 | 307.549 | 0.0046 | 1 | 4 | cardiac neural crest cell migration involved in outflow tract morphogenesis |
| GO:0021855 | 0.0046 | 307.549 | 0.0046 | 1 | 4 | hypothalamus cell migration |
| GO:0032100 | 0.0046 | 307.549 | 0.0046 | 1 | 4 | positive regulation of appetite |
| GO:0061031 | 0.0046 | 307.549 | 0.0046 | 1 | 4 | endodermal digestive tract morphogenesis |
| GO:0071315 | 0.0046 | 307.549 | 0.0046 | 1 | 4 | cellular response to morphine |
| GO:0030155 | 0.0047 | 7.0144 | 0.7083 | 4 | 618 | regulation of cell adhesion |
| GO:0006954 | 0.005 | 6.8859 | 0.7209 | 4 | 629 | inflammatory response |
| GO:0060359 | 0.0052 | 20.961 | 0.1089 | 2 | 95 | response to ammonium ion |
| GO:0060126 | 0.0057 | 230.6471 | 0.0057 | 1 | 5 | somatotropin secreting cell differentiation |
| GO:0033273 | 0.0057 | 19.8852 | 0.1146 | 2 | 100 | response to vitamin |
| GO:0002158 | 0.0069 | 184.5059 | 0.0069 | 1 | 6 | osteoclast proliferation |
| GO:0045657 | 0.0069 | 184.5059 | 0.0069 | 1 | 6 | positive regulation of monocyte differentiation |
| GO:0055009 | 0.0069 | 184.5059 | 0.0069 | 1 | 6 | atrial cardiac muscle tissue morphogenesis |
| GO:0060763 | 0.0069 | 184.5059 | 0.0069 | 1 | 6 | mammary duct terminal end bud growth |
| GO:0097211 | 0.0069 | 184.5059 | 0.0069 | 1 | 6 | cellular response to gonadotropin-releasing hormone |
| GO:0097305 | 0.0076 | 8.5642 | 0.4137 | 3 | 361 | response to alcohol |
| GO:0035865 | 0.008 | 153.7451 | 0.008 | 1 | 7 | cellular response to potassium ion |
| GO:0043320 | 0.008 | 153.7451 | 0.008 | 1 | 7 | natural killer cell degranulation |
| GO:2000288 | 0.008 | 153.7451 | 0.008 | 1 | 7 | positive regulation of myoblast proliferation |
| GO:2000341 | 0.008 | 153.7451 | 0.008 | 1 | 7 | regulation of chemokine (C-X-C motif) ligand 2 production |
| GO:0042476 | 0.0082 | 16.4936 | 0.1375 | 2 | 120 | odontogenesis |
| GO:0042117 | 0.0091 | 131.7731 | 0.0092 | 1 | 8 | monocyte activation |
| GO:0043951 | 0.0091 | 131.7731 | 0.0092 | 1 | 8 | negative regulation of cAMP-mediated signaling |
| GO:0061072 | 0.0091 | 131.7731 | 0.0092 | 1 | 8 | iris morphogenesis |
| GO:1903975 | 0.0091 | 131.7731 | 0.0092 | 1 | 8 | regulation of glial cell migration |
| GO:0034765 | 0.0097 | 7.8041 | 0.4527 | 3 | 395 | regulation of ion transmembrane transport |
| GO:0007399 | 0.0098 | 3.7577 | 2.6119 | 7 | 2279 | nervous system development |
| GOMFID | Pvalue | OddsRatio | ExpCount | Count | Size | Term |
| GO:0005298 | 0.001 | Inf | 0.001 | 1 | 1 | proline:sodium symporter activity |
| GO:0032440 | 0.001 | Inf | 0.001 | 1 | 1 | 2-alkenal reductase [NAD(P)] activity |
| GO:0036132 | 0.0019 | 1123.7857 | 0.0019 | 1 | 2 | 13-prostaglandin reductase activity |
| GO:0047522 | 0.0019 | 1123.7857 | 0.0019 | 1 | 2 | 15-oxoprostaglandin 13-oxidase activity |
| GO:0005232 | 0.0057 | 224.7 | 0.0057 | 1 | 6 | serotonin-activated cation-selective channel activity |
| GOMFID | Pvalue | OddsRatio | ExpCount | Count | Size | Term |
| GO:0005157 | 0.0042 | 374.4048 | 0.0042 | 1 | 3 | macrophage colony-stimulating factor receptor binding |
| GO:0001601 | 0.0056 | 249.5873 | 0.0056 | 1 | 4 | peptide YY receptor activity |
| GO:0001602 | 0.0056 | 249.5873 | 0.0056 | 1 | 4 | pancreatic polypeptide receptor activity |
| GO:0042289 | 0.007 | 187.1786 | 0.007 | 1 | 5 | MHC class II protein binding |
| GOMFID | Pvalue | OddsRatio | ExpCount | Count | Size | Term |
| GO:0004062 | 0 | 413.7895 | 0.008 | 2 | 6 | aryl sulfotransferase activity |
| GO:0015035 | 4e-04 | 82.6737 | 0.0293 | 2 | 22 | protein disulfide oxidoreductase activity |
| GO:0001069 | 0.0013 | Inf | 0.0013 | 1 | 1 | regulatory region RNA binding |
| GO:1990631 | 0.0013 | Inf | 0.0013 | 1 | 1 | ErbB-4 class receptor binding |
| GO:0016667 | 0.0019 | 35.1198 | 0.0653 | 2 | 49 | oxidoreductase activity, acting on a sulfur group of donors |
| GO:0070012 | 0.0027 | 786.35 | 0.0027 | 1 | 2 | oligopeptidase activity |
| GO:0016782 | 0.0031 | 27.4877 | 0.0827 | 2 | 62 | transferase activity, transferring sulfur-containing groups |
| GO:0035368 | 0.0053 | 262.0833 | 0.0053 | 1 | 4 | selenocysteine insertion sequence binding |
| GO:0042134 | 0.0053 | 262.0833 | 0.0053 | 1 | 4 | rRNA primary transcript binding |
| GO:0003956 | 0.0067 | 196.55 | 0.0067 | 1 | 5 | NAD(P)+-protein-arginine ADP-ribosyltransferase activity |
| GOMFID | Pvalue | OddsRatio | ExpCount | Count | Size | Term |
| GO:0047323 | 8e-04 | Inf | 8e-04 | 1 | 1 | [3-methyl-2-oxobutanoate dehydrogenase (acetyl-transferring)] kinase activity |
| GO:0008494 | 0.0053 | 238.3485 | 0.0053 | 1 | 7 | translation activator activity |
| GOMFID | Pvalue | OddsRatio | ExpCount | Count | Size | Term |
| GO:0033862 | 0.0016 | Inf | 0.0016 | 1 | 1 | UMP kinase activity |
| GO:0046523 | 0.0016 | Inf | 0.0016 | 1 | 1 | S-methyl-5-thioribose-1-phosphate isomerase activity |
| GO:0004798 | 0.0032 | 655.125 | 0.0032 | 1 | 2 | thymidylate kinase activity |
| GO:0008260 | 0.0032 | 655.125 | 0.0032 | 1 | 2 | 3-oxoacid CoA-transferase activity |
| GO:0097016 | 0.0048 | 327.5417 | 0.0048 | 1 | 3 | L27 domain binding |
| GO:0001601 | 0.0063 | 218.3472 | 0.0063 | 1 | 4 | peptide YY receptor activity |
| GO:0001602 | 0.0063 | 218.3472 | 0.0063 | 1 | 4 | pancreatic polypeptide receptor activity |
| GO:0004127 | 0.0063 | 218.3472 | 0.0063 | 1 | 4 | cytidylate kinase activity |
| GO:0070051 | 0.0063 | 218.3472 | 0.0063 | 1 | 4 | fibrinogen binding |
| GOMFID | Pvalue | OddsRatio | ExpCount | Count | Size | Term |
| GO:0015327 | 0.0014 | Inf | 0.0014 | 1 | 1 | cystine:glutamate antiporter activity |
| GO:1901680 | 0.0014 | Inf | 0.0014 | 1 | 1 | sulfur-containing amino acid secondary active transmembrane transporter activity |
| GO:0005507 | 0.0022 | 32.6646 | 0.0698 | 2 | 50 | copper ion binding |
| GO:0016524 | 0.0028 | 748.8571 | 0.0028 | 1 | 2 | latrotoxin receptor activity |
| GO:0005125 | 0.0032 | 11.5554 | 0.3003 | 3 | 215 | cytokine activity |
| GO:0005294 | 0.0056 | 249.5873 | 0.0056 | 1 | 4 | neutral L-amino acid secondary active transmembrane transporter activity |
| GO:0036459 | 0.0075 | 16.9946 | 0.1313 | 2 | 94 | thiol-dependent ubiquitinyl hydrolase activity |
| GO:0004111 | 0.0084 | 149.7333 | 0.0084 | 1 | 6 | creatine kinase activity |
| GOMFID | Pvalue | OddsRatio | ExpCount | Count | Size | Term |
| GO:0004068 | 0.0022 | Inf | 0.0022 | 1 | 1 | aspartate 1-decarboxylase activity |
| GO:0098641 | 0.0022 | Inf | 0.0022 | 1 | 1 | cadherin binding involved in cell-cell adhesion |
| GO:1990595 | 0.0022 | Inf | 0.0022 | 1 | 1 | mast cell secretagogue receptor activity |
| GO:0004782 | 0.0044 | 462.1471 | 0.0044 | 1 | 2 | sulfinoalanine decarboxylase activity |
| GO:0032029 | 0.0044 | 462.1471 | 0.0044 | 1 | 2 | myosin tail binding |
| GO:0004719 | 0.0067 | 231.0588 | 0.0067 | 1 | 3 | protein-L-isoaspartate (D-aspartate) O-methyltransferase activity |
| GO:0001733 | 0.0089 | 154.0294 | 0.0089 | 1 | 4 | galactosylceramide sulfotransferase activity |
| GOMFID | Pvalue | OddsRatio | ExpCount | Count | Size | Term |
| GO:1990631 | 0.0011 | Inf | 0.0011 | 1 | 1 | ErbB-4 class receptor binding |
| GO:0017159 | 0.0032 | 491.5625 | 0.0032 | 1 | 3 | pantetheine hydrolase activity |
| GO:0035368 | 0.0043 | 327.6875 | 0.0043 | 1 | 4 | selenocysteine insertion sequence binding |
| GO:0042134 | 0.0043 | 327.6875 | 0.0043 | 1 | 4 | rRNA primary transcript binding |
| GO:0004725 | 0.0046 | 22.4215 | 0.1025 | 2 | 95 | protein tyrosine phosphatase activity |
| GO:0004111 | 0.0065 | 196.5875 | 0.0065 | 1 | 6 | creatine kinase activity |
| GOMFID | Pvalue | OddsRatio | ExpCount | Count | Size | Term |
| GO:0004693 | 0.0013 | 43.1126 | 0.0533 | 2 | 30 | cyclin-dependent protein serine/threonine kinase activity |
| GO:0004068 | 0.0018 | Inf | 0.0018 | 1 | 1 | aspartate 1-decarboxylase activity |
| GO:1990595 | 0.0018 | Inf | 0.0018 | 1 | 1 | mast cell secretagogue receptor activity |
| GO:0004667 | 0.0036 | 582.2222 | 0.0036 | 1 | 2 | prostaglandin-D synthase activity |
| GO:0004782 | 0.0036 | 582.2222 | 0.0036 | 1 | 2 | sulfinoalanine decarboxylase activity |
| GO:0001733 | 0.0071 | 194.0494 | 0.0071 | 1 | 4 | galactosylceramide sulfotransferase activity |
| GOMFID | Pvalue | OddsRatio | ExpCount | Count | Size | Term |
| GO:0004930 | 0.007 | 4.7962 | 1.2445 | 5 | 784 | G-protein coupled receptor activity |
| GO:0030246 | 0.0087 | 7.8943 | 0.4286 | 3 | 270 | carbohydrate binding |
| GOMFID | Pvalue | OddsRatio | ExpCount | Count | Size | Term |
| GO:0047341 | 0.001 | Inf | 0.001 | 1 | 1 | fucose-1-phosphate guanylyltransferase activity |
| GO:0038100 | 0.0019 | 1123.7857 | 0.0019 | 1 | 2 | nodal binding |
| GO:0005549 | 0.0028 | 29.7303 | 0.0791 | 2 | 83 | odorant binding |
| GO:0015252 | 0.0038 | 374.5476 | 0.0038 | 1 | 4 | hydrogen ion channel activity |
| GO:0016812 | 0.0066 | 187.2381 | 0.0067 | 1 | 7 | hydrolase activity, acting on carbon-nitrogen (but not peptide) bonds, in cyclic amides |
| GO:0015280 | 0.0076 | 160.4796 | 0.0076 | 1 | 8 | ligand-gated sodium channel activity |
| GOMFID | Pvalue | OddsRatio | ExpCount | Count | Size | Term |
| GO:0042497 | 0.0015 | Inf | 0.0015 | 1 | 1 | triacyl lipopeptide binding |
| GO:0001641 | 0.003 | 683.6522 | 0.003 | 1 | 2 | group II metabotropic glutamate receptor activity |
| GO:0004510 | 0.003 | 683.6522 | 0.003 | 1 | 2 | tryptophan 5-monooxygenase activity |
| GO:0042498 | 0.003 | 683.6522 | 0.003 | 1 | 2 | diacyl lipopeptide binding |
| GO:0005157 | 0.0046 | 341.8043 | 0.0046 | 1 | 3 | macrophage colony-stimulating factor receptor binding |
| GO:0004095 | 0.0061 | 227.8551 | 0.0061 | 1 | 4 | carnitine O-palmitoyltransferase activity |
| GO:0004871 | 0.0075 | 3.7072 | 2.4062 | 7 | 1579 | signal transducer activity |
| GO:0001875 | 0.0076 | 170.8804 | 0.0076 | 1 | 5 | lipopolysaccharide receptor activity |
| GO:0008142 | 0.0076 | 170.8804 | 0.0076 | 1 | 5 | oxysterol binding |
| GO:0070891 | 0.0076 | 170.8804 | 0.0076 | 1 | 5 | lipoteichoic acid binding |
| GO:0034987 | 0.0091 | 136.6957 | 0.0091 | 1 | 6 | immunoglobulin receptor binding |
| GOMFID | Pvalue | OddsRatio | ExpCount | Count | Size | Term |
| GO:0004510 | 0.0028 | 748.8571 | 0.0028 | 1 | 2 | tryptophan 5-monooxygenase activity |
| GO:0005157 | 0.0042 | 374.4048 | 0.0042 | 1 | 3 | macrophage colony-stimulating factor receptor binding |
| GO:0032051 | 0.0056 | 249.5873 | 0.0056 | 1 | 4 | clathrin light chain binding |
| GO:0004767 | 0.0097 | 124.7698 | 0.0098 | 1 | 7 | sphingomyelin phosphodiesterase activity |
| GO:0016812 | 0.0097 | 124.7698 | 0.0098 | 1 | 7 | hydrolase activity, acting on carbon-nitrogen (but not peptide) bonds, in cyclic amides |
| GOMFID | Pvalue | OddsRatio | ExpCount | Count | Size | Term |
| GO:0030354 | 0.0025 | 827.7895 | 0.0025 | 1 | 2 | melanin-concentrating hormone activity |
| GO:0038025 | 0.0025 | 827.7895 | 0.0025 | 1 | 2 | reelin receptor activity |
| GO:0015252 | 0.0051 | 275.8947 | 0.0051 | 1 | 4 | hydrogen ion channel activity |
| GO:0030229 | 0.0051 | 275.8947 | 0.0051 | 1 | 4 | very-low-density lipoprotein particle receptor activity |
| GO:0034987 | 0.0076 | 165.5158 | 0.0076 | 1 | 6 | immunoglobulin receptor binding |
| GO:0015385 | 0.0089 | 137.9211 | 0.0089 | 1 | 7 | sodium:proton antiporter activity |
| GO:0016812 | 0.0089 | 137.9211 | 0.0089 | 1 | 7 | hydrolase activity, acting on carbon-nitrogen (but not peptide) bonds, in cyclic amides |
| GOMFID | Pvalue | OddsRatio | ExpCount | Count | Size | Term |
| GO:0004364 | 0 | 136.5913 | 0.0297 | 3 | 26 | glutathione transferase activity |
| GO:0004117 | 0.0034 | 462.6176 | 0.0034 | 1 | 3 | calmodulin-dependent cyclic-nucleotide phosphodiesterase activity |
| GO:0004430 | 0.0057 | 231.2794 | 0.0057 | 1 | 5 | 1-phosphatidylinositol 4-kinase activity |
| GOMFID | Pvalue | OddsRatio | ExpCount | Count | Size | Term |
| GO:0035755 | 0.0015 | Inf | 0.0015 | 1 | 1 | cardiolipin hydrolase activity |
| GO:0008808 | 0.003 | 683.6522 | 0.003 | 1 | 2 | cardiolipin synthase activity |
| GO:0038100 | 0.003 | 683.6522 | 0.003 | 1 | 2 | nodal binding |
| GO:0042284 | 0.003 | 683.6522 | 0.003 | 1 | 2 | sphingolipid delta-4 desaturase activity |
| GO:0008131 | 0.0061 | 227.8551 | 0.0061 | 1 | 4 | primary amine oxidase activity |
| GO:0070051 | 0.0061 | 227.8551 | 0.0061 | 1 | 4 | fibrinogen binding |
| GOMFID | Pvalue | OddsRatio | ExpCount | Count | Size | Term |
| GO:0032394 | 0.0015 | 1430.5455 | 0.0015 | 1 | 2 | MHC class Ib receptor activity |
| GO:0034987 | 0.0046 | 286.0364 | 0.0046 | 1 | 6 | immunoglobulin receptor binding |
| GO:0008140 | 0.0076 | 158.8687 | 0.0076 | 1 | 10 | cAMP response element binding protein binding |
| GO:0019900 | 0.0088 | 8.649 | 0.4473 | 3 | 587 | kinase binding |
| GO:0019864 | 0.0091 | 129.9669 | 0.0091 | 1 | 12 | IgG binding |
| GOMFID | Pvalue | OddsRatio | ExpCount | Count | Size | Term |
| GO:0016667 | 0 | 51.1304 | 0.0716 | 3 | 49 | oxidoreductase activity, acting on a sulfur group of donors |
| GO:0015035 | 5e-04 | 74.7905 | 0.0321 | 2 | 22 | protein disulfide oxidoreductase activity |
| GO:0051537 | 5e-04 | 74.7905 | 0.0321 | 2 | 22 | 2 iron, 2 sulfur cluster binding |
| GO:0008519 | 5e-04 | 71.2245 | 0.0336 | 2 | 23 | ammonium transmembrane transporter activity |
| GO:0031768 | 0.0015 | Inf | 0.0015 | 1 | 1 | ghrelin receptor binding |
| GO:0050528 | 0.0015 | Inf | 0.0015 | 1 | 1 | acyloxyacyl hydrolase activity |
| GO:0004464 | 0.0029 | 714.7727 | 0.0029 | 1 | 2 | leukotriene-C4 synthase activity |
| GO:0016165 | 0.0029 | 714.7727 | 0.0029 | 1 | 2 | linoleate 13S-lipoxygenase activity |
| GO:0016608 | 0.0029 | 714.7727 | 0.0029 | 1 | 2 | growth hormone-releasing hormone activity |
| GO:0047977 | 0.0029 | 714.7727 | 0.0029 | 1 | 2 | hepoxilin-epoxide hydrolase activity |
| GO:0070012 | 0.0029 | 714.7727 | 0.0029 | 1 | 2 | oligopeptidase activity |
| GO:0051540 | 0.0035 | 25.2897 | 0.0891 | 2 | 61 | metal cluster binding |
| GO:0004052 | 0.0044 | 357.3636 | 0.0044 | 1 | 3 | arachidonate 12-lipoxygenase activity |
| GO:0004465 | 0.0044 | 357.3636 | 0.0044 | 1 | 3 | lipoprotein lipase activity |
| GO:0051120 | 0.0044 | 357.3636 | 0.0044 | 1 | 3 | hepoxilin A3 synthase activity |
| GO:0003956 | 0.0073 | 178.6591 | 0.0073 | 1 | 5 | NAD(P)+-protein-arginine ADP-ribosyltransferase activity |
| GO:0034987 | 0.0087 | 142.9182 | 0.0088 | 1 | 6 | immunoglobulin receptor binding |
| GOMFID | Pvalue | OddsRatio | ExpCount | Count | Size | Term |
| GO:0035925 | 0.0097 | 122.8438 | 0.0097 | 1 | 9 | mRNA 3'-UTR AU-rich region binding |
| GOMFID | Pvalue | OddsRatio | ExpCount | Count | Size | Term |
| GO:0004124 | 9e-04 | Inf | 9e-04 | 1 | 1 | cysteine synthase activity |
| GO:0050421 | 9e-04 | Inf | 9e-04 | 1 | 1 | nitrite reductase (NO-forming) activity |
| GO:0070025 | 9e-04 | Inf | 9e-04 | 1 | 1 | carbon monoxide binding |
| GO:1904047 | 9e-04 | Inf | 9e-04 | 1 | 1 | S-adenosyl-L-methionine binding |
| GO:0005201 | 0.0013 | 44.2825 | 0.0542 | 2 | 61 | extracellular matrix structural constituent |
| GO:0004122 | 0.0018 | 1210.3077 | 0.0018 | 1 | 2 | cystathionine beta-synthase activity |
| GO:0070026 | 0.0018 | 1210.3077 | 0.0018 | 1 | 2 | nitric oxide binding |
| GO:0016661 | 0.0027 | 605.1154 | 0.0027 | 1 | 3 | oxidoreductase activity, acting on other nitrogenous compounds as donors |
| GO:0004111 | 0.0053 | 242 | 0.0053 | 1 | 6 | creatine kinase activity |
| GO:0047760 | 0.0071 | 172.8352 | 0.0071 | 1 | 8 | butyrate-CoA ligase activity |
| GO:0070700 | 0.008 | 151.2212 | 0.008 | 1 | 9 | BMP receptor binding |
| GO:0016500 | 0.0097 | 120.9615 | 0.0098 | 1 | 11 | protein-hormone receptor activity |
| GOMFID | Pvalue | OddsRatio | ExpCount | Count | Size | Term |
| GO:0001621 | 0.002 | Inf | 0.002 | 1 | 1 | ADP receptor activity |
| GO:0004343 | 0.002 | Inf | 0.002 | 1 | 1 | glucosamine 6-phosphate N-acetyltransferase activity |
| GO:0004817 | 0.0039 | 523.9 | 0.0039 | 1 | 2 | cysteine-tRNA ligase activity |
| GO:0016005 | 0.0039 | 523.9 | 0.0039 | 1 | 2 | phospholipase A2 activator activity |
| GO:0005502 | 0.0059 | 261.9333 | 0.0059 | 1 | 3 | 11-cis retinal binding |
| GO:0008449 | 0.0059 | 261.9333 | 0.0059 | 1 | 3 | N-acetylglucosamine-6-sulfatase activity |
| GOMFID | Pvalue | OddsRatio | ExpCount | Count | Size | Term |
| GO:1990595 | 0.0011 | Inf | 0.0011 | 1 | 1 | mast cell secretagogue receptor activity |
| GO:0004510 | 0.0022 | 983.1875 | 0.0022 | 1 | 2 | tryptophan 5-monooxygenase activity |
| GO:0008147 | 0.0022 | 983.1875 | 0.0022 | 1 | 2 | structural constituent of bone |
| GO:0046848 | 0.0043 | 327.6875 | 0.0043 | 1 | 4 | hydroxyapatite binding |
| GOMFID | Pvalue | OddsRatio | ExpCount | Count | Size | Term |
| GO:0042605 | 9e-04 | 50.9643 | 0.0457 | 2 | 24 | peptide antigen binding |
| GO:0008449 | 0.0057 | 270.9828 | 0.0057 | 1 | 3 | N-acetylglucosamine-6-sulfatase activity |
| GOMFID | Pvalue | OddsRatio | ExpCount | Count | Size | Term |
| GO:0001621 | 0.002 | Inf | 0.002 | 1 | 1 | ADP receptor activity |
| GO:0004343 | 0.002 | Inf | 0.002 | 1 | 1 | glucosamine 6-phosphate N-acetyltransferase activity |
| GO:0008146 | 0.0042 | 22.9949 | 0.0965 | 2 | 49 | sulfotransferase activity |
| GO:0005502 | 0.0059 | 261.9333 | 0.0059 | 1 | 3 | 11-cis retinal binding |
| GOMFID | Pvalue | OddsRatio | ExpCount | Count | Size | Term |
| GO:0004984 | 0.0011 | 10.4065 | 0.4737 | 4 | 373 | olfactory receptor activity |
| GO:0001733 | 0.0051 | 275.8947 | 0.0051 | 1 | 4 | galactosylceramide sulfotransferase activity |
| GOMFID | Pvalue | OddsRatio | ExpCount | Count | Size | Term |
| GO:0004364 | 8e-04 | 56.8841 | 0.0413 | 2 | 26 | glutathione transferase activity |
| GO:0004510 | 0.0032 | 655.125 | 0.0032 | 1 | 2 | tryptophan 5-monooxygenase activity |
| GO:0004096 | 0.0048 | 327.5417 | 0.0048 | 1 | 3 | catalase activity |
| GO:0005502 | 0.0048 | 327.5417 | 0.0048 | 1 | 3 | 11-cis retinal binding |
| GO:0004090 | 0.0063 | 218.3472 | 0.0063 | 1 | 4 | carbonyl reductase (NADPH) activity |
| GO:0004427 | 0.0063 | 218.3472 | 0.0063 | 1 | 4 | inorganic diphosphatase activity |
| GO:0017150 | 0.0063 | 218.3472 | 0.0063 | 1 | 4 | tRNA dihydrouridine synthase activity |
| GO:0004046 | 0.0079 | 163.75 | 0.0079 | 1 | 5 | aminoacylase activity |
| GOMFID | Pvalue | OddsRatio | ExpCount | Count | Size | Term |
| GO:0008445 | 0.0015 | Inf | 0.0015 | 1 | 1 | D-aspartate oxidase activity |
| GO:0008147 | 0.003 | 683.6522 | 0.003 | 1 | 2 | structural constituent of bone |
| GO:0070080 | 0.003 | 683.6522 | 0.003 | 1 | 2 | titin Z domain binding |
| GO:0005201 | 0.0039 | 24.1387 | 0.093 | 2 | 61 | extracellular matrix structural constituent |
| GO:0051373 | 0.0046 | 341.8043 | 0.0046 | 1 | 3 | FATZ binding |
| GO:0070051 | 0.0061 | 227.8551 | 0.0061 | 1 | 4 | fibrinogen binding |
| GOMFID | Pvalue | OddsRatio | ExpCount | Count | Size | Term |
| GO:0001614 | 0.0013 | 43.5667 | 0.054 | 2 | 17 | purinergic nucleotide receptor activity |
| GO:0032550 | 0.0022 | 2.8819 | 5.4575 | 13 | 1719 | purine ribonucleoside binding |
| GO:0001882 | 0.0023 | 2.8649 | 5.4861 | 13 | 1728 | nucleoside binding |
| GO:0032555 | 0.0026 | 2.8242 | 5.5559 | 13 | 1750 | purine ribonucleotide binding |
| GO:0031877 | 0.0032 | Inf | 0.0032 | 1 | 1 | somatostatin receptor binding |
| GO:0032500 | 0.0032 | Inf | 0.0032 | 1 | 1 | muramyl dipeptide binding |
| GO:0008536 | 0.0038 | 24.1852 | 0.0921 | 2 | 29 | Ran GTPase binding |
| GO:0030544 | 0.0038 | 24.1852 | 0.0921 | 2 | 29 | Hsp70 protein binding |
| GO:0031267 | 0.0059 | 6.0074 | 0.7239 | 4 | 228 | small GTPase binding |
| GO:0035639 | 0.0062 | 2.6056 | 5.4257 | 12 | 1709 | purine ribonucleoside triphosphate binding |
| GO:0003875 | 0.0063 | 320.3673 | 0.0063 | 1 | 2 | ADP-ribosylarginine hydrolase activity |
| GO:0004743 | 0.0063 | 320.3673 | 0.0063 | 1 | 2 | pyruvate kinase activity |
| GO:0045029 | 0.0063 | 320.3673 | 0.0063 | 1 | 2 | UDP-activated nucleotide receptor activity |
| GO:0047057 | 0.0063 | 320.3673 | 0.0063 | 1 | 2 | vitamin-K-epoxide reductase (warfarin-sensitive) activity |
| GO:0070573 | 0.0063 | 320.3673 | 0.0063 | 1 | 2 | metallodipeptidase activity |
| GO:0030160 | 0.0095 | 160.1735 | 0.0095 | 1 | 3 | GKAP/Homer scaffold activity |
| GO:0047756 | 0.0095 | 160.1735 | 0.0095 | 1 | 3 | chondroitin 4-sulfotransferase activity |
| GO:0071532 | 0.0095 | 160.1735 | 0.0095 | 1 | 3 | ankyrin repeat binding |
| GO:0071553 | 0.0095 | 160.1735 | 0.0095 | 1 | 3 | G-protein coupled pyrimidinergic nucleotide receptor activity |
| GOMFID | Pvalue | OddsRatio | ExpCount | Count | Size | Term |
| GO:0031732 | 0.0019 | 1123.7857 | 0.0019 | 1 | 2 | CCR7 chemokine receptor binding |
| GO:0031735 | 0.0029 | 561.8571 | 0.0029 | 1 | 3 | CCR10 chemokine receptor binding |
| GOMFID | Pvalue | OddsRatio | ExpCount | Count | Size | Term |
| GO:0035663 | 0 | 2247.4286 | 0.003 | 2 | 3 | Toll-like receptor 2 binding |
| GO:0043014 | 2e-04 | 106.8844 | 0.0234 | 2 | 23 | alpha-tubulin binding |
| GO:0004888 | 7e-04 | 7.482 | 1.1927 | 6 | 1174 | transmembrane signaling receptor activity |
| GO:0042498 | 0.002 | 1048.8 | 0.002 | 1 | 2 | diacyl lipopeptide binding |
| GO:0004872 | 0.0026 | 5.6848 | 1.532 | 6 | 1508 | receptor activity |
| GO:0015143 | 0.003 | 524.3667 | 0.003 | 1 | 3 | urate transmembrane transporter activity |
| GO:0004871 | 0.0033 | 5.4011 | 1.6042 | 6 | 1579 | signal transducer activity |
| GO:0015562 | 0.0041 | 349.5556 | 0.0041 | 1 | 4 | efflux transmembrane transporter activity |
| GO:0004430 | 0.0051 | 262.15 | 0.0051 | 1 | 5 | 1-phosphatidylinositol 4-kinase activity |
| GO:0019534 | 0.0061 | 209.7067 | 0.0061 | 1 | 6 | toxin transporter activity |
| GO:0015321 | 0.0081 | 149.7714 | 0.0081 | 1 | 8 | sodium-dependent phosphate transmembrane transporter activity |
| GO:0005436 | 0.0091 | 131.0417 | 0.0091 | 1 | 9 | sodium:phosphate symporter activity |
| GO:0046982 | 0.0099 | 7.8735 | 0.4582 | 3 | 451 | protein heterodimerization activity |
| GOMFID | Pvalue | OddsRatio | ExpCount | Count | Size | Term |
| GO:0048020 | 8e-04 | 55.9608 | 0.0422 | 2 | 35 | CCR chemokine receptor binding |
| GO:0004502 | 0.0012 | Inf | 0.0012 | 1 | 1 | kynurenine 3-monooxygenase activity |
| GO:0008009 | 0.0015 | 40.1125 | 0.0579 | 2 | 48 | chemokine activity |
| GO:0035727 | 0.0036 | 436.8889 | 0.0036 | 1 | 3 | lysophosphatidic acid binding |
| GO:0004430 | 0.006 | 218.4167 | 0.006 | 1 | 5 | 1-phosphatidylinositol 4-kinase activity |
| GO:0016174 | 0.006 | 218.4167 | 0.006 | 1 | 5 | NAD(P)H oxidase activity |
| GO:0005509 | 0.0071 | 6.1472 | 0.7938 | 4 | 658 | calcium ion binding |
| GOMFID | Pvalue | OddsRatio | ExpCount | Count | Size | Term |
| GO:0050660 | 2e-04 | 29.2071 | 0.12 | 3 | 70 | flavin adenine dinucleotide binding |
| GO:0042605 | 8e-04 | 57.0909 | 0.0411 | 2 | 24 | peptide antigen binding |
| GO:0004693 | 0.0012 | 44.84 | 0.0514 | 2 | 30 | cyclin-dependent protein serine/threonine kinase activity |
| GO:0004489 | 0.0017 | Inf | 0.0017 | 1 | 1 | methylenetetrahydrofolate reductase (NAD(P)H) activity |
| GO:0004502 | 0.0017 | Inf | 0.0017 | 1 | 1 | kynurenine 3-monooxygenase activity |
| GO:0031859 | 0.0017 | Inf | 0.0017 | 1 | 1 | platelet activating factor receptor binding |
| GO:0047323 | 0.0017 | Inf | 0.0017 | 1 | 1 | [3-methyl-2-oxobutanoate dehydrogenase (acetyl-transferring)] kinase activity |
| GO:0050661 | 0.0022 | 32.1703 | 0.0703 | 2 | 41 | NADP binding |
| GO:0001631 | 0.0034 | 604.6538 | 0.0034 | 1 | 2 | cysteinyl leukotriene receptor activity |
| GO:0031691 | 0.0034 | 604.6538 | 0.0034 | 1 | 2 | alpha-1A adrenergic receptor binding |
| GO:0031762 | 0.0034 | 604.6538 | 0.0034 | 1 | 2 | follicle-stimulating hormone receptor binding |
| GO:0031692 | 0.0051 | 302.3077 | 0.0051 | 1 | 3 | alpha-1B adrenergic receptor binding |
| GO:0031826 | 0.0051 | 302.3077 | 0.0051 | 1 | 3 | type 2A serotonin receptor binding |
| GO:0004499 | 0.0085 | 151.1346 | 0.0086 | 1 | 5 | N,N-dimethylaniline monooxygenase activity |
| GO:0016174 | 0.0085 | 151.1346 | 0.0086 | 1 | 5 | NAD(P)H oxidase activity |
| GO:0048037 | 0.009 | 7.736 | 0.4337 | 3 | 253 | cofactor binding |
| GOMFID | Pvalue | OddsRatio | ExpCount | Count | Size | Term |
| GO:0005141 | 6e-04 | Inf | 6e-04 | 1 | 1 | interleukin-10 receptor binding |
| GO:0035197 | 0.0029 | 491.75 | 0.0029 | 1 | 5 | siRNA binding |
| GO:0005149 | 0.0085 | 140.4107 | 0.0086 | 1 | 15 | interleukin-1 receptor binding |
| GOMFID | Pvalue | OddsRatio | ExpCount | Count | Size | Term |
| GO:0004464 | 0.0019 | 1123.7857 | 0.0019 | 1 | 2 | leukotriene-C4 synthase activity |
| GO:0034987 | 0.0057 | 224.7 | 0.0057 | 1 | 6 | immunoglobulin receptor binding |
| GO:0004383 | 0.0066 | 187.2381 | 0.0067 | 1 | 7 | guanylate cyclase activity |
| GO:0004523 | 0.0066 | 187.2381 | 0.0067 | 1 | 7 | RNA-DNA hybrid ribonuclease activity |
| GOMFID | Pvalue | OddsRatio | ExpCount | Count | Size | Term |
| GO:0004512 | 0.0013 | Inf | 0.0013 | 1 | 1 | inositol-3-phosphate synthase activity |
| GO:0004510 | 0.0027 | 786.35 | 0.0027 | 1 | 2 | tryptophan 5-monooxygenase activity |
| GO:0008269 | 0.0027 | 786.35 | 0.0027 | 1 | 2 | JAK pathway signal transduction adaptor activity |
| GO:0003823 | 0.0047 | 21.9691 | 0.1027 | 2 | 77 | antigen binding |
| GO:0004791 | 0.0067 | 196.55 | 0.0067 | 1 | 5 | thioredoxin-disulfide reductase activity |
| GO:0034987 | 0.008 | 157.23 | 0.008 | 1 | 6 | immunoglobulin receptor binding |
| GO:0016812 | 0.0093 | 131.0167 | 0.0093 | 1 | 7 | hydrolase activity, acting on carbon-nitrogen (but not peptide) bonds, in cyclic amides |
| GOMFID | Pvalue | OddsRatio | ExpCount | Count | Size | Term |
| GO:0004693 | 6e-04 | 65.9748 | 0.0362 | 2 | 30 | cyclin-dependent protein serine/threonine kinase activity |
| GO:0004124 | 0.0012 | Inf | 0.0012 | 1 | 1 | cysteine synthase activity |
| GO:0004502 | 0.0012 | Inf | 0.0012 | 1 | 1 | kynurenine 3-monooxygenase activity |
| GO:0050421 | 0.0012 | Inf | 0.0012 | 1 | 1 | nitrite reductase (NO-forming) activity |
| GO:0070025 | 0.0012 | Inf | 0.0012 | 1 | 1 | carbon monoxide binding |
| GO:1904047 | 0.0012 | Inf | 0.0012 | 1 | 1 | S-adenosyl-L-methionine binding |
| GO:0003986 | 0.0024 | 873.8333 | 0.0024 | 1 | 2 | acetyl-CoA hydrolase activity |
| GO:0004122 | 0.0024 | 873.8333 | 0.0024 | 1 | 2 | cystathionine beta-synthase activity |
| GO:0070026 | 0.0024 | 873.8333 | 0.0024 | 1 | 2 | nitric oxide binding |
| GO:0016661 | 0.0036 | 436.8889 | 0.0036 | 1 | 3 | oxidoreductase activity, acting on other nitrogenous compounds as donors |
| GO:0016174 | 0.006 | 218.4167 | 0.006 | 1 | 5 | NAD(P)H oxidase activity |
| GO:0016812 | 0.0084 | 145.5926 | 0.0084 | 1 | 7 | hydrolase activity, acting on carbon-nitrogen (but not peptide) bonds, in cyclic amides |
| GOMFID | Pvalue | OddsRatio | ExpCount | Count | Size | Term |
| GO:0005102 | 0.0018 | 6.1379 | 1.4294 | 6 | 1407 | receptor binding |
| GO:0003986 | 0.002 | 1048.8 | 0.002 | 1 | 2 | acetyl-CoA hydrolase activity |
| GO:0004984 | 0.0059 | 9.5819 | 0.3789 | 3 | 373 | olfactory receptor activity |
| GO:0035257 | 0.009 | 15.7974 | 0.1453 | 2 | 143 | nuclear hormone receptor binding |
| GOMFID | Pvalue | OddsRatio | ExpCount | Count | Size | Term |
| GO:0016509 | 0.0027 | 786.35 | 0.0027 | 1 | 2 | long-chain-3-hydroxyacyl-CoA dehydrogenase activity |
| GO:0004719 | 0.004 | 393.15 | 0.004 | 1 | 3 | protein-L-isoaspartate (D-aspartate) O-methyltransferase activity |
| GO:0004814 | 0.004 | 393.15 | 0.004 | 1 | 3 | arginine-tRNA ligase activity |
| GO:0008276 | 0.0048 | 21.6787 | 0.104 | 2 | 78 | protein methyltransferase activity |
| GO:0004300 | 0.0067 | 196.55 | 0.0067 | 1 | 5 | enoyl-CoA hydratase activity |
| GO:0034618 | 0.0067 | 196.55 | 0.0067 | 1 | 5 | arginine binding |
| GO:0003988 | 0.008 | 157.23 | 0.008 | 1 | 6 | acetyl-CoA C-acyltransferase activity |
| GO:0010340 | 0.008 | 157.23 | 0.008 | 1 | 6 | carboxyl-O-methyltransferase activity |
| GO:0004383 | 0.0093 | 131.0167 | 0.0093 | 1 | 7 | guanylate cyclase activity |
| GOMFID | Pvalue | OddsRatio | ExpCount | Count | Size | Term |
| GO:0004335 | 0.0034 | 604.6538 | 0.0034 | 1 | 2 | galactokinase activity |
| GO:0016404 | 0.0034 | 604.6538 | 0.0034 | 1 | 2 | 15-hydroxyprostaglandin dehydrogenase (NAD+) activity |
| GO:0005534 | 0.0068 | 201.5256 | 0.0069 | 1 | 4 | galactose binding |
| GO:0070051 | 0.0068 | 201.5256 | 0.0069 | 1 | 4 | fibrinogen binding |
| GO:0004957 | 0.0085 | 151.1346 | 0.0086 | 1 | 5 | prostaglandin E receptor activity |
| GOMFID | Pvalue | OddsRatio | ExpCount | Count | Size | Term |
| GO:0004335 | 0.0028 | 748.8571 | 0.0028 | 1 | 2 | galactokinase activity |
| GO:0004118 | 0.0042 | 374.4048 | 0.0042 | 1 | 3 | cGMP-stimulated cyclic-nucleotide phosphodiesterase activity |
| GO:0005534 | 0.0056 | 249.5873 | 0.0056 | 1 | 4 | galactose binding |
| GO:0070051 | 0.0056 | 249.5873 | 0.0056 | 1 | 4 | fibrinogen binding |
| GO:0019905 | 0.0056 | 19.8076 | 0.1132 | 2 | 81 | syntaxin binding |
| GO:0030911 | 0.007 | 187.1786 | 0.007 | 1 | 5 | TPR domain binding |
| GOMFID | Pvalue | OddsRatio | ExpCount | Count | Size | Term |
| GO:0008308 | 2e-04 | 109.1042 | 0.0231 | 2 | 14 | voltage-gated anion channel activity |
| GO:0004304 | 0.0017 | Inf | 0.0017 | 1 | 1 | estrone sulfotransferase activity |
| GO:0022832 | 0.003 | 11.7241 | 0.2906 | 3 | 176 | voltage-gated channel activity |
| GO:0032089 | 0.0033 | 628.88 | 0.0033 | 1 | 2 | NACHT domain binding |
| GO:0015143 | 0.0049 | 314.42 | 0.005 | 1 | 3 | urate transmembrane transporter activity |
| GO:0047894 | 0.0049 | 314.42 | 0.005 | 1 | 3 | flavonol 3-sulfotransferase activity |
| GO:0050294 | 0.0049 | 314.42 | 0.005 | 1 | 3 | steroid sulfotransferase activity |
| GO:0015562 | 0.0066 | 209.6 | 0.0066 | 1 | 4 | efflux transmembrane transporter activity |
| GO:0070051 | 0.0066 | 209.6 | 0.0066 | 1 | 4 | fibrinogen binding |
| GO:0016176 | 0.0082 | 157.19 | 0.0083 | 1 | 5 | superoxide-generating NADPH oxidase activator activity |
| GO:0008509 | 0.0084 | 7.9756 | 0.4226 | 3 | 256 | anion transmembrane transporter activity |
| GO:0019534 | 0.0099 | 125.744 | 0.0099 | 1 | 6 | toxin transporter activity |
| GOMFID | Pvalue | OddsRatio | ExpCount | Count | Size | Term |
| GO:0004122 | 0.0014 | 1573.7 | 0.0014 | 1 | 2 | cystathionine beta-synthase activity |
| GO:0047760 | 0.0056 | 224.7286 | 0.0056 | 1 | 8 | butyrate-CoA ligase activity |
| GO:0008266 | 0.009 | 131.05 | 0.0091 | 1 | 13 | poly(U) RNA binding |
| GO:0031402 | 0.0097 | 120.9615 | 0.0098 | 1 | 14 | sodium ion binding |
| GOMFID | Pvalue | OddsRatio | ExpCount | Count | Size | Term |
| GO:0008147 | 0.0024 | 873.8333 | 0.0024 | 1 | 2 | structural constituent of bone |
| GO:0070051 | 0.0048 | 291.2407 | 0.0048 | 1 | 4 | fibrinogen binding |
| GO:0004028 | 0.0072 | 174.7222 | 0.0072 | 1 | 6 | 3-chloroallyl aldehyde dehydrogenase activity |
| GO:0004030 | 0.0084 | 145.5926 | 0.0084 | 1 | 7 | aldehyde dehydrogenase [NAD(P)+] activity |
| GO:0004865 | 0.0096 | 124.7857 | 0.0097 | 1 | 8 | protein serine/threonine phosphatase inhibitor activity |
| GOMFID | Pvalue | OddsRatio | ExpCount | Count | Size | Term |
| GO:0001641 | 0.0018 | 1210.3077 | 0.0018 | 1 | 2 | group II metabotropic glutamate receptor activity |
| GO:0047760 | 0.0071 | 172.8352 | 0.0071 | 1 | 8 | butyrate-CoA ligase activity |
| GO:0035925 | 0.008 | 151.2212 | 0.008 | 1 | 9 | mRNA 3'-UTR AU-rich region binding |
| GO:0000900 | 0.0089 | 134.4103 | 0.0089 | 1 | 10 | translation repressor activity, nucleic acid binding |
| GOMFID | Pvalue | OddsRatio | ExpCount | Count | Size | Term |
| GO:0035197 | 0.0038 | 357.5682 | 0.0038 | 1 | 5 | siRNA binding |
| GO:0008494 | 0.0053 | 238.3485 | 0.0053 | 1 | 7 | translation activator activity |
| GOMFID | Pvalue | OddsRatio | ExpCount | Count | Size | Term |
| GO:0042605 | 6e-04 | 67.9827 | 0.035 | 2 | 24 | peptide antigen binding |
| GO:0032500 | 0.0015 | Inf | 0.0015 | 1 | 1 | muramyl dipeptide binding |
| GO:0000979 | 0.0029 | 28.1635 | 0.0803 | 2 | 55 | RNA polymerase II core promoter sequence-specific DNA binding |
| GO:0070051 | 0.0058 | 238.2273 | 0.0058 | 1 | 4 | fibrinogen binding |
| GO:0033218 | 0.0058 | 9.2107 | 0.3724 | 3 | 255 | amide binding |
| GO:0051864 | 0.0087 | 142.9182 | 0.0088 | 1 | 6 | histone demethylase activity (H3-K36 specific) |
| GOMFID | Pvalue | OddsRatio | ExpCount | Count | Size | Term |
| GO:0008519 | 3e-04 | 88.0056 | 0.0277 | 2 | 23 | ammonium transmembrane transporter activity |
| GO:0042605 | 4e-04 | 84 | 0.029 | 2 | 24 | peptide antigen binding |
| GO:0005111 | 0.006 | 218.4167 | 0.006 | 1 | 5 | type 2 fibroblast growth factor receptor binding |
| GO:0070851 | 0.0096 | 15.0511 | 0.1496 | 2 | 124 | growth factor receptor binding |
| GOMFID | Pvalue | OddsRatio | ExpCount | Count | Size | Term |
| GO:0008519 | 3e-04 | 93.5119 | 0.0263 | 2 | 23 | ammonium transmembrane transporter activity |
| GO:0008131 | 0.0046 | 308.3922 | 0.0046 | 1 | 4 | primary amine oxidase activity |
| GOMFID | Pvalue | OddsRatio | ExpCount | Count | Size | Term |
| GO:0004769 | 0.0024 | 873.8333 | 0.0024 | 1 | 2 | steroid delta-isomerase activity |
| GO:0009019 | 0.0024 | 873.8333 | 0.0024 | 1 | 2 | tRNA (guanine-N1-)-methyltransferase activity |
| GO:0019172 | 0.0024 | 873.8333 | 0.0024 | 1 | 2 | glyoxalase III activity |
| GO:0032029 | 0.0024 | 873.8333 | 0.0024 | 1 | 2 | myosin tail binding |
| GO:0016429 | 0.0036 | 436.8889 | 0.0036 | 1 | 3 | tRNA (adenine-N1-)-methyltransferase activity |
| GO:0003854 | 0.0048 | 291.2407 | 0.0048 | 1 | 4 | 3-beta-hydroxy-delta5-steroid dehydrogenase activity |
| GO:0048248 | 0.006 | 218.4167 | 0.006 | 1 | 5 | CXCR3 chemokine receptor binding |
| GO:0008603 | 0.0084 | 145.5926 | 0.0084 | 1 | 7 | cAMP-dependent protein kinase regulator activity |
| GOMFID | Pvalue | OddsRatio | ExpCount | Count | Size | Term |
| GO:0001641 | 0.0037 | 561.3929 | 0.0037 | 1 | 2 | group II metabotropic glutamate receptor activity |
| GO:0047057 | 0.0037 | 561.3929 | 0.0037 | 1 | 2 | vitamin-K-epoxide reductase (warfarin-sensitive) activity |
| GO:0004427 | 0.0073 | 187.1071 | 0.0074 | 1 | 4 | inorganic diphosphatase activity |
| GO:0004309 | 0.0092 | 140.3214 | 0.0092 | 1 | 5 | exopolyphosphatase activity |
| GO:0045159 | 0.0092 | 140.3214 | 0.0092 | 1 | 5 | myosin II binding |
| GOMFID | Pvalue | OddsRatio | ExpCount | Count | Size | Term |
| GO:0005152 | 0.0027 | 605.1154 | 0.0027 | 1 | 3 | interleukin-1 receptor antagonist activity |
| GO:0008240 | 0.0027 | 605.1154 | 0.0027 | 1 | 3 | tripeptidyl-peptidase activity |
| GO:0030547 | 0.0089 | 134.4103 | 0.0089 | 1 | 10 | receptor inhibitor activity |
| GO:0016500 | 0.0097 | 120.9615 | 0.0098 | 1 | 11 | protein-hormone receptor activity |
| GOMFID | Pvalue | OddsRatio | ExpCount | Count | Size | Term |
| GO:0003943 | 0.0023 | 925.2941 | 0.0023 | 1 | 2 | N-acetylgalactosamine-4-sulfatase activity |
| GO:0051525 | 0.0046 | 308.3922 | 0.0046 | 1 | 4 | NFAT protein binding |
| GO:0004065 | 0.0091 | 132.1345 | 0.0091 | 1 | 8 | arylsulfatase activity |
| GOMFID | Pvalue | OddsRatio | ExpCount | Count | Size | Term |
| GO:0004122 | 0.0034 | 604.6538 | 0.0034 | 1 | 2 | cystathionine beta-synthase activity |
| GO:0005119 | 0.0051 | 302.3077 | 0.0051 | 1 | 3 | smoothened binding |
| GO:0097108 | 0.0051 | 302.3077 | 0.0051 | 1 | 3 | hedgehog family protein binding |
| GO:0004720 | 0.0068 | 201.5256 | 0.0069 | 1 | 4 | protein-lysine 6-oxidase activity |
| GO:0005166 | 0.0068 | 201.5256 | 0.0069 | 1 | 4 | neurotrophin p75 receptor binding |
| GO:0004565 | 0.0085 | 151.1346 | 0.0086 | 1 | 5 | beta-galactosidase activity |
| GOMFID | Pvalue | OddsRatio | ExpCount | Count | Size | Term |
| GO:0004963 | 0.0017 | Inf | 0.0017 | 1 | 1 | follicle-stimulating hormone receptor activity |
| GO:0097200 | 0.0051 | 302.3077 | 0.0051 | 1 | 3 | cysteine-type endopeptidase activity involved in execution phase of apoptosis |
| GO:0005111 | 0.0085 | 151.1346 | 0.0086 | 1 | 5 | type 2 fibroblast growth factor receptor binding |
| GOMFID | Pvalue | OddsRatio | ExpCount | Count | Size | Term |
| GO:0004979 | 0.0011 | Inf | 0.0011 | 1 | 1 | beta-endorphin receptor activity |
| GO:0038047 | 0.0011 | Inf | 0.0011 | 1 | 1 | morphine receptor activity |
| GO:0051424 | 0.0011 | Inf | 0.0011 | 1 | 1 | corticotropin-releasing hormone binding |
| GO:0005157 | 0.0034 | 462.6176 | 0.0034 | 1 | 3 | macrophage colony-stimulating factor receptor binding |
| GO:0004111 | 0.0068 | 185.0118 | 0.0069 | 1 | 6 | creatine kinase activity |
| GOMFID | Pvalue | OddsRatio | ExpCount | Count | Size | Term |
| GO:0042605 | 2e-04 | 109.8741 | 0.0229 | 2 | 24 | peptide antigen binding |
| GO:0047961 | 0.0038 | 374.5476 | 0.0038 | 1 | 4 | glycine N-acyltransferase activity |
| GO:0015057 | 0.0048 | 280.8929 | 0.0048 | 1 | 5 | thrombin receptor activity |
| GO:0047760 | 0.0076 | 160.4796 | 0.0076 | 1 | 8 | butyrate-CoA ligase activity |
| GO:0032395 | 0.0095 | 124.8016 | 0.0095 | 1 | 10 | MHC class II receptor activity |
| NA. |
| n/a |
| NA. |
| n/a |
| NA. |
| n/a |
| NA. |
| n/a |
| NA. |
| n/a |
| NA. |
| n/a |
| NA. |
| n/a |
| NA. |
| n/a |
| NA. |
| n/a |
| NA. |
| n/a |
| NA. |
| n/a |
| NA. |
| n/a |
| NA. |
| n/a |
| NA. |
| n/a |
| NA. |
| n/a |
| NA. |
| n/a |
| NA. |
| n/a |
| NA. |
| n/a |
| NA. |
| n/a |
| NA. |
| n/a |
| NA. |
| n/a |
| NA. |
| n/a |
| NA. |
| n/a |
| NA. |
| n/a |
| NA. |
| n/a |
| NA. |
| n/a |
| NA. |
| n/a |
| NA. |
| n/a |
| NA. |
| n/a |
| NA. |
| n/a |
| NA. |
| n/a |
| NA. |
| n/a |
| NA. |
| n/a |
| NA. |
| n/a |
| NA. |
| n/a |
| NA. |
| n/a |
| NA. |
| n/a |
| NA. |
| n/a |
| NA. |
| n/a |
| NA. |
| n/a |
| NA. |
| n/a |
| NA. |
| n/a |
| NA. |
| n/a |
| NA. |
| n/a |
| NA. |
| n/a |
| NA. |
| n/a |
| NA. |
| n/a |
| NA. |
| n/a |
| NA. |
| n/a |
| NA. |
| n/a |
| NA. |
| n/a |
| NA. |
| n/a |
| NA. |
| n/a |
| NA. |
| n/a |
| NA. |
| n/a |
| NA. |
| n/a |
| NA. |
| n/a |
| NA. |
| n/a |
| NA. |
| n/a |
| NA. |
| n/a |
| NA. |
| n/a |
| NA. |
| n/a |
| NA. |
| n/a |
| NA. |
| n/a |
| NA. |
| n/a |
| NA. |
| n/a |
| NA. |
| n/a |
| NA. |
| n/a |
| NA. |
| n/a |
| NA. |
| n/a |
| NA. |
| n/a |
| NA. |
| n/a |
| NA. |
| n/a |
| NA. |
| n/a |
| NA. |
| n/a |
| NA. |
| n/a |
| NA. |
| n/a |
| NA. |
| n/a |
| NA. |
| n/a |
| NA. |
| n/a |
| NA. |
| n/a |
| NA. |
| n/a |
| NA. |
| n/a |
| NA. |
| n/a |
| NA. |
| n/a |
| NA. |
| n/a |
| NA. |
| n/a |
| NA. |
| n/a |
| NA. |
| n/a |
| NA. |
| n/a |
| NA. |
| n/a |
| NA. |
| n/a |
| NA. |
| n/a |
| NA. |
| n/a |
| NA. |
| n/a |
| NA. |
| n/a |
| NA. |
| n/a |
| NA. |
| n/a |
| NA. |
| n/a |
| NA. |
| n/a |
| NA. |
| n/a |
| NA. |
| n/a |
| NA. |
| n/a |
| NA. |
| n/a |
| NA. |
| n/a |
| NA. |
| n/a |
| NA. |
| n/a |
| NA. |
| n/a |
| NA. |
| n/a |
| NA. |
| n/a |
| NA. |
| n/a |
| NA. |
| n/a |
| NA. |
| n/a |
| NA. |
| n/a |
| NA. |
| n/a |
| NA. |
| n/a |
| NA. |
| n/a |
| NA. |
| n/a |
| NA. |
| n/a |
| NA. |
| n/a |
| NA. |
| n/a |
| NA. |
| n/a |
| NA. |
| n/a |
| NA. |
| n/a |
| NA. |
| n/a |
| NA. |
| n/a |
| NA. |
| n/a |
| NA. |
| n/a |
| NA. |
| n/a |
| NA. |
| n/a |
| NA. |
| n/a |
| NA. |
| n/a |
| NA. |
| n/a |
| NA. |
| n/a |
| NA. |
| n/a |
| NA. |
| n/a |
| NA. |
| n/a |
| NA. |
| n/a |
| NA. |
| n/a |
| NA. |
| n/a |
| NA. |
| n/a |
| NA. |
| n/a |
| NA. |
| n/a |
| NA. |
| n/a |
| NA. |
| n/a |
| NA. |
| n/a |
| NA. |
| n/a |
| NA. |
| n/a |
| NA. |
| n/a |
| NA. |
| n/a |
| NA. |
| n/a |
| NA. |
| n/a |
| NA. |
| n/a |
| NA. |
| n/a |
| NA. |
| n/a |
| NA. |
| n/a |
| NA. |
| n/a |
| NA. |
| n/a |
| NA. |
| n/a |
| NA. |
| n/a |
| NA. |
| n/a |
| NA. |
| n/a |
| NA. |
| n/a |
| NA. |
| n/a |
| NA. |
| n/a |
| NA. |
| n/a |
| NA. |
| n/a |
| NA. |
| n/a |
| NA. |
| n/a |
| NA. |
| n/a |
| NA. |
| n/a |
| NA. |
| n/a |
| NA. |
| n/a |
| NA. |
| n/a |
| NA. |
| n/a |
| NA. |
| n/a |
| NA. |
| n/a |
| NA. |
| n/a |
| NA. |
| n/a |
| NA. |
| n/a |
| NA. |
| n/a |
| NA. |
| n/a |
| NA. |
| n/a |
| NA. |
| n/a |
| NA. |
| n/a |
| NA. |
| n/a |
| NA. |
| n/a |
| NA. |
| n/a |
| NA. |
| n/a |
| NA. |
| n/a |
| NA. |
| n/a |
| NA. |
| n/a |
| NA. |
| n/a |
| NA. |
| n/a |
| NA. |
| n/a |
| NA. |
| n/a |
| NA. |
| n/a |
| NA. |
| n/a |
| NA. |
| n/a |
| NA. |
| n/a |
| NA. |
| n/a |
| NA. |
| n/a |
| NA. |
| n/a |
| NA. |
| n/a |
| NA. |
| n/a |
| NA. |
| n/a |
| NA. |
| n/a |
| NA. |
| n/a |
| NA. |
| n/a |
| NA. |
| n/a |
| NA. |
| n/a |
| NA. |
| n/a |
| NA. |
| n/a |
| NA. |
| n/a |
| NA. |
| n/a |
| NA. |
| n/a |
| NA. |
| n/a |
| NA. |
| n/a |
| NA. |
| n/a |
| NA. |
| n/a |
| NA. |
| n/a |
| NA. |
| n/a |
| NA. |
| n/a |
| NA. |
| n/a |
| NA. |
| n/a |
| NA. |
| n/a |
| NA. |
| n/a |
| NA. |
| n/a |
| NA. |
| n/a |
| NA. |
| n/a |
| NA. |
| n/a |
| NA. |
| n/a |
| NA. |
| n/a |
| NA. |
| n/a |
| NA. |
| n/a |
| NA. |
| n/a |
| NA. |
| n/a |
| NA. |
| n/a |
| NA. |
| n/a |
| NA. |
| n/a |
| GOMFID | Pvalue | OddsRatio | ExpCount | Count | Size | Term |
| GO:0050911 | 0 | 32.735 | 0.5419 | 10 | 370 | detection of chemical stimulus involved in sensory perception of smell |
| GO:0009593 | 0 | 26.5812 | 0.6606 | 10 | 451 | detection of chemical stimulus |
| GO:0007606 | 0 | 25.798 | 0.6796 | 10 | 464 | sensory perception of chemical stimulus |
| GO:0050906 | 0 | 25.798 | 0.6796 | 10 | 464 | detection of stimulus involved in sensory perception |
| GO:0050877 | 0 | 11.0312 | 1.7781 | 11 | 1214 | neurological system process |
| GO:0007186 | 0 | 9.7191 | 1.699 | 10 | 1160 | G-protein coupled receptor signaling pathway |
| GO:0032924 | 0.0017 | 37.2381 | 0.0615 | 2 | 42 | activin receptor signaling pathway |
| GO:0060764 | 0.0029 | 712.6818 | 0.0029 | 1 | 2 | cell-cell signaling involved in mammary gland development |
| GO:1901318 | 0.0029 | 712.6818 | 0.0029 | 1 | 2 | negative regulation of sperm motility |
| GO:1902530 | 0.0029 | 712.6818 | 0.0029 | 1 | 2 | positive regulation of protein linear polyubiquitination |
| GO:0009952 | 0.0031 | 11.61 | 0.2973 | 3 | 203 | anterior/posterior pattern specification |
| GO:0007389 | 0.0037 | 7.2411 | 0.6547 | 4 | 447 | pattern specification process |
| GO:0042742 | 0.0043 | 10.3033 | 0.3339 | 3 | 228 | defense response to bacterium |
| GO:0035582 | 0.0044 | 356.3182 | 0.0044 | 1 | 3 | sequestering of BMP in extracellular matrix |
| GO:0060435 | 0.0044 | 356.3182 | 0.0044 | 1 | 3 | bronchiole development |
| GO:0003419 | 0.0058 | 237.5303 | 0.0059 | 1 | 4 | growth plate cartilage chondrocyte proliferation |
| GO:0060480 | 0.0058 | 237.5303 | 0.0059 | 1 | 4 | lung goblet cell differentiation |
| GO:0060535 | 0.0058 | 237.5303 | 0.0059 | 1 | 4 | trachea cartilage morphogenesis |
| GO:0060574 | 0.0058 | 237.5303 | 0.0059 | 1 | 4 | intestinal epithelial cell maturation |
| GO:0030510 | 0.0059 | 19.2987 | 0.1157 | 2 | 79 | regulation of BMP signaling pathway |
| GO:0071692 | 0.0073 | 178.1364 | 0.0073 | 1 | 5 | protein localization to extracellular region |
| GO:0060482 | 0.0088 | 142.5 | 0.0088 | 1 | 6 | lobar bronchus development |
| GO:2000381 | 0.0088 | 142.5 | 0.0088 | 1 | 6 | negative regulation of mesoderm development |
| GOMFID | Pvalue | OddsRatio | ExpCount | Count | Size | Term |
| GO:0045744 | 1e-04 | 39.4722 | 0.0894 | 3 | 39 | negative regulation of G-protein coupled receptor protein signaling pathway |
| GO:0009593 | 5e-04 | 6.8413 | 1.0339 | 6 | 451 | detection of chemical stimulus |
| GO:0035574 | 5e-04 | 70.8326 | 0.0344 | 2 | 15 | histone H4-K20 demethylation |
| GO:0007606 | 6e-04 | 6.6415 | 1.0637 | 6 | 464 | sensory perception of chemical stimulus |
| GO:0050906 | 6e-04 | 6.6415 | 1.0637 | 6 | 464 | detection of stimulus involved in sensory perception |
| GO:0045653 | 8e-04 | 57.5404 | 0.0413 | 2 | 18 | negative regulation of megakaryocyte differentiation |
| GO:0070098 | 8e-04 | 18.6495 | 0.1811 | 3 | 79 | chemokine-mediated signaling pathway |
| GO:0030593 | 0.001 | 17.069 | 0.1972 | 3 | 86 | neutrophil chemotaxis |
| GO:0006305 | 0.001 | 16.8647 | 0.1995 | 3 | 87 | DNA alkylation |
| GO:0071347 | 0.0011 | 16.28 | 0.2063 | 3 | 90 | cellular response to interleukin-1 |
| GO:0050911 | 0.0015 | 6.7618 | 0.8482 | 5 | 370 | detection of chemical stimulus involved in sensory perception of smell |
| GO:0044728 | 0.0015 | 14.5923 | 0.2293 | 3 | 100 | DNA methylation or demethylation |
| GO:0007186 | 0.0019 | 4.1517 | 2.3734 | 8 | 1127 | G-protein coupled receptor signaling pathway |
| GO:0097530 | 0.002 | 13.2201 | 0.2522 | 3 | 110 | granulocyte migration |
| GO:0019677 | 0.0023 | Inf | 0.0023 | 1 | 1 | NAD catabolic process |
| GO:1903488 | 0.0023 | Inf | 0.0023 | 1 | 1 | negative regulation of lactation |
| GO:0006335 | 0.0024 | 30.6608 | 0.0734 | 2 | 32 | DNA replication-dependent nucleosome assembly |
| GO:0016577 | 0.0026 | 29.6698 | 0.0757 | 2 | 33 | histone demethylation |
| GO:0008214 | 0.0029 | 27.8681 | 0.0802 | 2 | 35 | protein dealkylation |
| GO:0032776 | 0.0029 | 27.8681 | 0.0802 | 2 | 35 | DNA methylation on cytosine |
| GO:0051290 | 0.0034 | 25.5408 | 0.0871 | 2 | 38 | protein heterotetramerization |
| GO:0071346 | 0.0037 | 10.6179 | 0.3118 | 3 | 136 | cellular response to interferon-gamma |
| GO:0034080 | 0.0038 | 24.1935 | 0.0917 | 2 | 40 | CENP-A containing nucleosome assembly |
| GO:0000183 | 0.004 | 23.5716 | 0.094 | 2 | 41 | chromatin silencing at rDNA |
| GO:1901532 | 0.0043 | 22.4189 | 0.0986 | 2 | 43 | regulation of hematopoietic progenitor cell differentiation |
| GO:0002381 | 0.0046 | 21.8838 | 0.1009 | 2 | 44 | immunoglobulin production involved in immunoglobulin mediated immune response |
| GO:0006742 | 0.0046 | 447.6 | 0.0046 | 1 | 2 | NADP catabolic process |
| GO:0007308 | 0.0046 | 447.6 | 0.0046 | 1 | 2 | oocyte construction |
| GO:0007314 | 0.0046 | 447.6 | 0.0046 | 1 | 2 | oocyte anterior/posterior axis specification |
| GO:0010868 | 0.0046 | 447.6 | 0.0046 | 1 | 2 | negative regulation of triglyceride biosynthetic process |
| GO:0030719 | 0.0046 | 447.6 | 0.0046 | 1 | 2 | P granule organization |
| GO:0044565 | 0.0046 | 447.6 | 0.0046 | 1 | 2 | dendritic cell proliferation |
| GO:0031047 | 0.0048 | 9.6644 | 0.3416 | 3 | 149 | gene silencing by RNA |
| GO:0050877 | 0.0054 | 3.426 | 2.7832 | 8 | 1214 | neurological system process |
| GO:0031424 | 0.0056 | 19.5494 | 0.1123 | 2 | 49 | keratinization |
| GO:0034724 | 0.0058 | 19.1409 | 0.1146 | 2 | 50 | DNA replication-independent nucleosome organization |
| GO:0048247 | 0.0058 | 19.1409 | 0.1146 | 2 | 50 | lymphocyte chemotaxis |
| GO:0005989 | 0.0069 | 223.7857 | 0.0069 | 1 | 3 | lactose biosynthetic process |
| GO:0010636 | 0.0069 | 223.7857 | 0.0069 | 1 | 3 | positive regulation of mitochondrial fusion |
| GO:0018149 | 0.007 | 17.3296 | 0.1261 | 2 | 55 | peptide cross-linking |
| GO:0050896 | 0.0078 | 2.5045 | 18.3542 | 26 | 8006 | response to stimulus |
| GO:0002548 | 0.0081 | 16.1094 | 0.1353 | 2 | 59 | monocyte chemotaxis |
| GO:0070988 | 0.0089 | 15.301 | 0.1421 | 2 | 62 | demethylation |
| GO:0006303 | 0.0097 | 14.5696 | 0.149 | 2 | 65 | double-strand break repair via nonhomologous end joining |
| GOMFID | Pvalue | OddsRatio | ExpCount | Count | Size | Term |
| GO:0007186 | 0 | 3.9665 | 4.6427 | 15 | 1157 | G-protein coupled receptor signaling pathway |
| GO:0050911 | 1e-04 | 5.9227 | 1.5316 | 8 | 370 | detection of chemical stimulus involved in sensory perception of smell |
| GO:0009593 | 5e-04 | 4.8141 | 1.8668 | 8 | 451 | detection of chemical stimulus |
| GO:0007606 | 6e-04 | 4.6728 | 1.9207 | 8 | 464 | sensory perception of chemical stimulus |
| GO:0050906 | 6e-04 | 4.6728 | 1.9207 | 8 | 464 | detection of stimulus involved in sensory perception |
| GO:0050877 | 0.0012 | 3.0052 | 5.0252 | 13 | 1214 | neurological system process |
| GO:0014821 | 0.0025 | 30.996 | 0.0745 | 2 | 18 | phasic smooth muscle contraction |
| GO:0097529 | 0.0039 | 6.7254 | 0.6416 | 4 | 155 | myeloid leukocyte migration |
| GO:0031989 | 0.0041 | Inf | 0.0041 | 1 | 1 | bombesin receptor signaling pathway |
| GO:0035645 | 0.0041 | Inf | 0.0041 | 1 | 1 | enteric smooth muscle cell differentiation |
| GO:1990167 | 0.0041 | Inf | 0.0041 | 1 | 1 | protein K27-linked deubiquitination |
| GO:0070098 | 0.0043 | 9.9079 | 0.327 | 3 | 79 | chemokine-mediated signaling pathway |
| GO:0030593 | 0.0054 | 9.0682 | 0.356 | 3 | 86 | neutrophil chemotaxis |
| GO:0071347 | 0.0062 | 8.6491 | 0.3725 | 3 | 90 | cellular response to interleukin-1 |
| GO:0030595 | 0.0062 | 5.8618 | 0.7327 | 4 | 177 | leukocyte chemotaxis |
| GO:0016339 | 0.0064 | 18.3551 | 0.12 | 2 | 29 | calcium-dependent cell-cell adhesion via plasma membrane cell adhesion molecules |
| GO:0043114 | 0.0068 | 17.6984 | 0.1242 | 2 | 30 | regulation of vascular permeability |
| GO:0001808 | 0.0083 | 244.3281 | 0.0083 | 1 | 2 | negative regulation of type IV hypersensitivity |
| GO:0007497 | 0.0083 | 244.3281 | 0.0083 | 1 | 2 | posterior midgut development |
| GO:0035523 | 0.0083 | 244.3281 | 0.0083 | 1 | 2 | protein K29-linked deubiquitination |
| GO:0046294 | 0.0083 | 244.3281 | 0.0083 | 1 | 2 | formaldehyde catabolic process |
| GO:0048866 | 0.0083 | 244.3281 | 0.0083 | 1 | 2 | stem cell fate specification |
| GO:0070901 | 0.0083 | 244.3281 | 0.0083 | 1 | 2 | mitochondrial tRNA methylation |
| GO:0086100 | 0.0083 | 244.3281 | 0.0083 | 1 | 2 | endothelin receptor signaling pathway |
| GO:1990168 | 0.0083 | 244.3281 | 0.0083 | 1 | 2 | protein K33-linked deubiquitination |
| GOMFID | Pvalue | OddsRatio | ExpCount | Count | Size | Term |
| GO:0050911 | 0 | 13.6273 | 0.8718 | 9 | 370 | detection of chemical stimulus involved in sensory perception of smell |
| GO:0009593 | 0 | 11.0711 | 1.0627 | 9 | 451 | detection of chemical stimulus |
| GO:0007606 | 0 | 10.7456 | 1.0933 | 9 | 464 | sensory perception of chemical stimulus |
| GO:0050906 | 0 | 10.7456 | 1.0933 | 9 | 464 | detection of stimulus involved in sensory perception |
| GO:0050877 | 4e-04 | 4.4488 | 2.8605 | 10 | 1214 | neurological system process |
| GO:0007186 | 0.0012 | 4.0535 | 2.7332 | 9 | 1160 | G-protein coupled receptor signaling pathway |
| GO:0000462 | 0.0016 | 38.8646 | 0.0589 | 2 | 25 | maturation of SSU-rRNA from tricistronic rRNA transcript (SSU-rRNA, 5.8S rRNA, LSU-rRNA) |
| GO:0010107 | 0.0021 | 33.0984 | 0.0683 | 2 | 29 | potassium ion import |
| GO:0051673 | 0.0024 | Inf | 0.0024 | 1 | 1 | membrane disruption in other organism |
| GO:0050829 | 0.0046 | 21.777 | 0.1013 | 2 | 43 | defense response to Gram-negative bacterium |
| GO:0044565 | 0.0047 | 435.1389 | 0.0047 | 1 | 2 | dendritic cell proliferation |
| GO:0042274 | 0.0055 | 19.8362 | 0.1107 | 2 | 47 | ribosomal small subunit biogenesis |
| GO:0043330 | 0.0055 | 19.8362 | 0.1107 | 2 | 47 | response to exogenous dsRNA |
| GO:0006741 | 0.0071 | 217.5556 | 0.0071 | 1 | 3 | NADP biosynthetic process |
| GOMFID | Pvalue | OddsRatio | ExpCount | Count | Size | Term |
| GO:0060112 | 0 | 824.3158 | 0.0076 | 2 | 3 | generation of ovulation cycle rhythm |
| GO:0042255 | 2e-04 | 28.1405 | 0.1223 | 3 | 48 | ribosome assembly |
| GO:0071826 | 0.0016 | 8.8597 | 0.5044 | 4 | 198 | ribonucleoprotein complex subunit organization |
| GO:0001963 | 0.0025 | 30.4795 | 0.0739 | 2 | 29 | synaptic transmission, dopaminergic |
| GO:0007631 | 0.0025 | 12.2488 | 0.27 | 3 | 106 | feeding behavior |
| GO:0001988 | 0.0025 | Inf | 0.0025 | 1 | 1 | positive regulation of heart rate involved in baroreceptor response to decreased systemic arterial blood pressure |
| GO:0009231 | 0.0025 | Inf | 0.0025 | 1 | 1 | riboflavin biosynthetic process |
| GO:0009398 | 0.0025 | Inf | 0.0025 | 1 | 1 | FMN biosynthetic process |
| GO:1990167 | 0.0025 | Inf | 0.0025 | 1 | 1 | protein K27-linked deubiquitination |
| GO:0045823 | 0.0032 | 26.5399 | 0.0841 | 2 | 33 | positive regulation of heart contraction |
| GO:0032094 | 0.0036 | 24.9282 | 0.0892 | 2 | 35 | response to food |
| GO:0007612 | 0.005 | 9.4676 | 0.3464 | 3 | 136 | learning |
| GO:0001189 | 0.0051 | 401.5897 | 0.0051 | 1 | 2 | RNA polymerase I transcriptional preinitiation complex assembly at the promoter for the nuclear large rRNA transcript |
| GO:0035523 | 0.0051 | 401.5897 | 0.0051 | 1 | 2 | protein K29-linked deubiquitination |
| GO:0048866 | 0.0051 | 401.5897 | 0.0051 | 1 | 2 | stem cell fate specification |
| GO:0070901 | 0.0051 | 401.5897 | 0.0051 | 1 | 2 | mitochondrial tRNA methylation |
| GO:1990168 | 0.0051 | 401.5897 | 0.0051 | 1 | 2 | protein K33-linked deubiquitination |
| GO:0042273 | 0.0051 | 20.5566 | 0.107 | 2 | 42 | ribosomal large subunit biogenesis |
| GO:0007268 | 0.0072 | 3.9003 | 1.7423 | 6 | 684 | synaptic transmission |
| GO:0099536 | 0.0072 | 3.9003 | 1.7423 | 6 | 684 | synaptic signaling |
| GO:0033864 | 0.0076 | 200.7821 | 0.0076 | 1 | 3 | positive regulation of NAD(P)H oxidase activity |
| GO:0035483 | 0.0076 | 200.7821 | 0.0076 | 1 | 3 | gastric emptying |
| GOMFID | Pvalue | OddsRatio | ExpCount | Count | Size | Term |
| GO:0000042 | 0 | 171.978 | 0.0459 | 5 | 18 | protein targeting to Golgi |
| GO:0006891 | 0 | 58.7406 | 0.1095 | 5 | 43 | intra-Golgi vesicle-mediated transport |
| GO:0050906 | 0 | 9.7038 | 1.1819 | 9 | 464 | detection of stimulus involved in sensory perception |
| GO:0009593 | 0 | 8.5892 | 1.1488 | 8 | 451 | detection of chemical stimulus |
| GO:0007606 | 0 | 8.3372 | 1.1819 | 8 | 464 | sensory perception of chemical stimulus |
| GO:0072594 | 0 | 6.9622 | 1.6201 | 9 | 636 | establishment of protein localization to organelle |
| GO:0050911 | 0 | 8.9406 | 0.9425 | 7 | 370 | detection of chemical stimulus involved in sensory perception of smell |
| GO:0006886 | 6e-04 | 4.4366 | 2.4734 | 9 | 971 | intracellular protein transport |
| GO:0050877 | 7e-04 | 4.003 | 3.0924 | 10 | 1214 | neurological system process |
| GO:0007186 | 0.0021 | 3.6604 | 2.9548 | 9 | 1160 | G-protein coupled receptor signaling pathway |
| GO:0006626 | 0.0068 | 8.4422 | 0.3872 | 3 | 152 | protein targeting to mitochondrion |
| GO:0031424 | 0.0069 | 17.4871 | 0.1248 | 2 | 49 | keratinization |
| GO:0018149 | 0.0086 | 15.5015 | 0.1401 | 2 | 55 | peptide cross-linking |
| GOMFID | Pvalue | OddsRatio | ExpCount | Count | Size | Term |
| GO:0009593 | 0 | 21.5399 | 1.2063 | 16 | 451 | detection of chemical stimulus |
| GO:0050911 | 0 | 23.9531 | 0.9896 | 15 | 370 | detection of chemical stimulus involved in sensory perception of smell |
| GO:0007606 | 0 | 20.897 | 1.241 | 16 | 464 | sensory perception of chemical stimulus |
| GO:0050906 | 0 | 20.897 | 1.241 | 16 | 464 | detection of stimulus involved in sensory perception |
| GO:0007186 | 0 | 9.5352 | 3.1026 | 18 | 1160 | G-protein coupled receptor signaling pathway |
| GO:0050877 | 0 | 7.4293 | 3.247 | 16 | 1214 | neurological system process |
| GO:0009386 | 0.0053 | 381.9512 | 0.0053 | 1 | 2 | translational attenuation |
| GO:0010868 | 0.0053 | 381.9512 | 0.0053 | 1 | 2 | negative regulation of triglyceride biosynthetic process |
| GO:0044700 | 0.0076 | 2.2246 | 15.7617 | 24 | 5893 | single organism signaling |
| GO:0015670 | 0.008 | 190.9634 | 0.008 | 1 | 3 | carbon dioxide transport |
| GO:0007154 | 0.0093 | 2.1738 | 15.989 | 24 | 5978 | cell communication |
| GOMFID | Pvalue | OddsRatio | ExpCount | Count | Size | Term |
| GO:0050911 | 0.001 | 20.8815 | 0.2121 | 3 | 370 | detection of chemical stimulus involved in sensory perception of smell |
| GO:0009593 | 0.0017 | 17.0156 | 0.2585 | 3 | 451 | detection of chemical stimulus |
| GO:0007606 | 0.0019 | 16.5217 | 0.2659 | 3 | 464 | sensory perception of chemical stimulus |
| GO:0050906 | 0.0019 | 16.5217 | 0.2659 | 3 | 464 | detection of stimulus involved in sensory perception |
| GO:0007369 | 0.0044 | 25.0476 | 0.1026 | 2 | 179 | gastrulation |
| GO:0061088 | 0.0057 | 217.8472 | 0.0057 | 1 | 10 | regulation of sequestering of zinc ion |
| GO:0038092 | 0.0086 | 140 | 0.0086 | 1 | 15 | nodal signaling pathway |
| GOMFID | Pvalue | OddsRatio | ExpCount | Count | Size | Term |
| GO:0050911 | 4e-04 | 13.9536 | 0.377 | 4 | 370 | detection of chemical stimulus involved in sensory perception of smell |
| GO:0009593 | 9e-04 | 11.3647 | 0.4595 | 4 | 451 | detection of chemical stimulus |
| GO:0007606 | 0.001 | 11.0341 | 0.4728 | 4 | 464 | sensory perception of chemical stimulus |
| GO:0050906 | 0.001 | 11.0341 | 0.4728 | 4 | 464 | detection of stimulus involved in sensory perception |
| GO:0002522 | 0.002 | 1045.7333 | 0.002 | 1 | 2 | leukocyte migration involved in immune response |
| GO:0002361 | 0.0051 | 261.3833 | 0.0051 | 1 | 5 | CD4-positive, CD25-positive, alpha-beta regulatory T cell differentiation |
| GO:0042355 | 0.0091 | 130.6583 | 0.0092 | 1 | 9 | L-fucose catabolic process |
| GOMFID | Pvalue | OddsRatio | ExpCount | Count | Size | Term |
| GO:0010868 | 6e-04 | 3924.25 | 6e-04 | 1 | 2 | negative regulation of triglyceride biosynthetic process |
| GO:0032792 | 0.0016 | 980.875 | 0.0016 | 1 | 5 | negative regulation of CREB transcription factor activity |
| GO:2000210 | 0.0022 | 653.8333 | 0.0022 | 1 | 7 | positive regulation of anoikis |
| GO:0045721 | 0.0038 | 356.5227 | 0.0038 | 1 | 12 | negative regulation of gluconeogenesis |
| GO:0035574 | 0.0048 | 280.0714 | 0.0048 | 1 | 15 | histone H4-K20 demethylation |
| GO:0045653 | 0.0057 | 230.6029 | 0.0057 | 1 | 18 | negative regulation of megakaryocyte differentiation |
| GO:0043153 | 0.006 | 217.7778 | 0.006 | 1 | 19 | entrainment of circadian clock by photoperiod |
| GOMFID | Pvalue | OddsRatio | ExpCount | Count | Size | Term |
| GO:1904431 | 2e-04 | 164.2526 | 0.0247 | 2 | 4 | positive regulation of t-circle formation |
| GO:0010792 | 6e-04 | 82.1158 | 0.0371 | 2 | 6 | DNA double-strand break processing involved in repair via single-strand annealing |
| GO:0006108 | 0.0013 | 46.9143 | 0.0556 | 2 | 9 | malate metabolic process |
| GO:0000387 | 0.0019 | 13.4293 | 0.2471 | 3 | 40 | spliceosomal snRNP assembly |
| GO:0090305 | 0.004 | 4.2757 | 1.5011 | 6 | 243 | nucleic acid phosphodiester bond hydrolysis |
| GO:0000245 | 0.0043 | 9.9294 | 0.3274 | 3 | 53 | spliceosomal complex assembly |
| GO:0034976 | 0.0044 | 4.1685 | 1.5381 | 6 | 249 | response to endoplasmic reticulum stress |
| GO:0006397 | 0.0045 | 3.3067 | 2.6006 | 8 | 421 | mRNA processing |
| GO:0071616 | 0.0055 | 9.0238 | 0.3583 | 3 | 58 | acyl-CoA biosynthetic process |
| GO:0008380 | 0.0061 | 3.4405 | 2.1744 | 7 | 352 | RNA splicing |
| GO:0009192 | 0.0062 | Inf | 0.0062 | 1 | 1 | deoxyribonucleoside diphosphate catabolic process |
| GO:0032788 | 0.0062 | Inf | 0.0062 | 1 | 1 | saturated monocarboxylic acid metabolic process |
| GO:0032789 | 0.0062 | Inf | 0.0062 | 1 | 1 | unsaturated monocarboxylic acid metabolic process |
| GO:0046057 | 0.0062 | Inf | 0.0062 | 1 | 1 | dADP catabolic process |
| GO:0046067 | 0.0062 | Inf | 0.0062 | 1 | 1 | dGDP catabolic process |
| GO:0046680 | 0.0062 | Inf | 0.0062 | 1 | 1 | response to DDT |
| GO:0046712 | 0.0062 | Inf | 0.0062 | 1 | 1 | GDP catabolic process |
| GO:0050726 | 0.0062 | Inf | 0.0062 | 1 | 1 | positive regulation of interleukin-1 alpha biosynthetic process |
| GO:0070981 | 0.0062 | Inf | 0.0062 | 1 | 1 | L-asparagine biosynthetic process |
| GO:0071234 | 0.0062 | Inf | 0.0062 | 1 | 1 | cellular response to phenylalanine |
| GO:0071283 | 0.0062 | Inf | 0.0062 | 1 | 1 | cellular response to iron(III) ion |
| GO:1902380 | 0.0062 | Inf | 0.0062 | 1 | 1 | positive regulation of endoribonuclease activity |
| GO:1904722 | 0.0062 | Inf | 0.0062 | 1 | 1 | positive regulation of mRNA endonucleolytic cleavage involved in unfolded protein response |
| GO:1990613 | 0.0062 | Inf | 0.0062 | 1 | 1 | mitochondrial membrane fusion |
| GO:2000775 | 0.0062 | Inf | 0.0062 | 1 | 1 | histone H3-S10 phosphorylation involved in chromosome condensation |
| GO:0034660 | 0.0076 | 3.0136 | 2.8415 | 8 | 460 | ncRNA metabolic process |
| GO:0006885 | 0.0079 | 7.8739 | 0.4077 | 3 | 66 | regulation of pH |
| GO:0006700 | 0.008 | 16.4063 | 0.1359 | 2 | 22 | C21-steroid hormone biosynthetic process |
| GO:0071456 | 0.0091 | 5.2009 | 0.8154 | 4 | 132 | cellular response to hypoxia |
| GOMFID | Pvalue | OddsRatio | ExpCount | Count | Size | Term |
| GO:0033386 | 0.0028 | Inf | 0.0028 | 1 | 1 | geranylgeranyl diphosphate biosynthetic process |
| GO:0050726 | 0.0028 | Inf | 0.0028 | 1 | 1 | positive regulation of interleukin-1 alpha biosynthetic process |
| GO:2000299 | 0.0028 | Inf | 0.0028 | 1 | 1 | negative regulation of Rho-dependent protein serine/threonine kinase activity |
| GO:0033384 | 0.0056 | 364.1395 | 0.0056 | 1 | 2 | geranyl diphosphate biosynthetic process |
| GO:0045337 | 0.0056 | 364.1395 | 0.0056 | 1 | 2 | farnesyl diphosphate biosynthetic process |
| GO:0045360 | 0.0056 | 364.1395 | 0.0056 | 1 | 2 | regulation of interleukin-1 biosynthetic process |
| GO:0006584 | 0.0077 | 16.5228 | 0.1317 | 2 | 47 | catecholamine metabolic process |
| GO:0008202 | 0.0081 | 5.4925 | 0.7958 | 4 | 284 | steroid metabolic process |
| GO:0006626 | 0.0088 | 7.6166 | 0.4259 | 3 | 152 | protein targeting to mitochondrion |
| GOMFID | Pvalue | OddsRatio | ExpCount | Count | Size | Term |
| GO:0050911 | 0 | 33.863 | 0.4241 | 8 | 370 | detection of chemical stimulus involved in sensory perception of smell |
| GO:0009593 | 0 | 27.5251 | 0.517 | 8 | 451 | detection of chemical stimulus |
| GO:0007606 | 0 | 26.7175 | 0.5319 | 8 | 464 | sensory perception of chemical stimulus |
| GO:0050906 | 0 | 26.7175 | 0.5319 | 8 | 464 | detection of stimulus involved in sensory perception |
| GO:0007186 | 0 | 10.0924 | 1.3297 | 8 | 1160 | G-protein coupled receptor signaling pathway |
| GO:0050877 | 0 | 9.6046 | 1.3916 | 8 | 1214 | neurological system process |
| GOMFID | Pvalue | OddsRatio | ExpCount | Count | Size | Term |
| GO:0000042 | 0 | 602.8846 | 0.0172 | 5 | 18 | protein targeting to Golgi |
| GO:0006891 | 0 | 205.9211 | 0.0411 | 5 | 43 | intra-Golgi vesicle-mediated transport |
| GO:0050911 | 0 | 20.9904 | 0.3534 | 5 | 370 | detection of chemical stimulus involved in sensory perception of smell |
| GO:0019740 | 0 | 402.1026 | 0.0076 | 2 | 8 | nitrogen utilization |
| GO:0009593 | 0 | 17.0874 | 0.4308 | 5 | 451 | detection of chemical stimulus |
| GO:0007606 | 1e-04 | 16.5893 | 0.4432 | 5 | 464 | sensory perception of chemical stimulus |
| GO:0050906 | 1e-04 | 16.5893 | 0.4432 | 5 | 464 | detection of stimulus involved in sensory perception |
| GO:0035574 | 1e-04 | 185.503 | 0.0143 | 2 | 15 | histone H4-K20 demethylation |
| GO:0006995 | 1e-04 | 172.2418 | 0.0153 | 2 | 16 | cellular response to nitrogen starvation |
| GO:0045653 | 1e-04 | 150.6923 | 0.0172 | 2 | 18 | negative regulation of megakaryocyte differentiation |
| GO:0015695 | 2e-04 | 133.9316 | 0.0191 | 2 | 20 | organic cation transport |
| GO:0072594 | 2e-04 | 11.9311 | 0.6075 | 5 | 636 | establishment of protein localization to organelle |
| GO:0072488 | 2e-04 | 109.5524 | 0.0229 | 2 | 24 | ammonium transmembrane transport |
| GO:0006335 | 4e-04 | 80.2974 | 0.0306 | 2 | 32 | DNA replication-dependent nucleosome assembly |
| GO:0016577 | 4e-04 | 77.7022 | 0.0315 | 2 | 33 | histone demethylation |
| GO:0008214 | 5e-04 | 72.9837 | 0.0334 | 2 | 35 | protein dealkylation |
| GO:0032776 | 5e-04 | 72.9837 | 0.0334 | 2 | 35 | DNA methylation on cytosine |
| GO:0051290 | 6e-04 | 66.8889 | 0.0363 | 2 | 38 | protein heterotetramerization |
| GO:0034080 | 7e-04 | 63.3603 | 0.0382 | 2 | 40 | CENP-A containing nucleosome assembly |
| GO:0000183 | 7e-04 | 61.7318 | 0.0392 | 2 | 41 | chromatin silencing at rDNA |
| GO:1901532 | 8e-04 | 58.7129 | 0.0411 | 2 | 43 | regulation of hematopoietic progenitor cell differentiation |
| GO:0034724 | 0.001 | 50.1282 | 0.0478 | 2 | 50 | DNA replication-independent nucleosome organization |
| GO:0070988 | 0.0016 | 40.0718 | 0.0592 | 2 | 62 | demethylation |
| GO:0006886 | 0.0016 | 7.6201 | 0.9275 | 5 | 971 | intracellular protein transport |
| GO:0006303 | 0.0017 | 38.1563 | 0.0621 | 2 | 65 | double-strand break repair via nonhomologous end joining |
| GO:0043044 | 0.002 | 34.825 | 0.0678 | 2 | 71 | ATP-dependent chromatin remodeling |
| GO:0045815 | 0.0024 | 32.0267 | 0.0736 | 2 | 77 | positive regulation of gene expression, epigenetic |
| GO:0006305 | 0.003 | 28.2407 | 0.0831 | 2 | 87 | DNA alkylation |
| GO:0007186 | 0.0035 | 6.2913 | 1.1081 | 5 | 1160 | G-protein coupled receptor signaling pathway |
| GO:0044728 | 0.004 | 24.4741 | 0.0955 | 2 | 100 | DNA methylation or demethylation |
| GO:0050877 | 0.0043 | 5.988 | 1.1597 | 5 | 1214 | neurological system process |
| GO:0016192 | 0.0058 | 5.5478 | 1.2437 | 5 | 1302 | vesicle-mediated transport |
| GO:0000723 | 0.0064 | 19.1545 | 0.1213 | 2 | 127 | telomere maintenance |
| GO:1903707 | 0.0067 | 18.7019 | 0.1242 | 2 | 130 | negative regulation of hemopoiesis |
| GO:0031497 | 0.0076 | 17.4632 | 0.1328 | 2 | 139 | chromatin assembly |
| GO:0031047 | 0.0087 | 16.2648 | 0.1423 | 2 | 149 | gene silencing by RNA |
| GO:0000724 | 0.0089 | 16.0444 | 0.1442 | 2 | 151 | double-strand break repair via homologous recombination |
| GO:0045814 | 0.0089 | 16.0444 | 0.1442 | 2 | 151 | negative regulation of gene expression, epigenetic |
| GO:0042594 | 0.0096 | 15.4174 | 0.15 | 2 | 157 | response to starvation |
| GO:0070727 | 0.0097 | 4.8506 | 1.4051 | 5 | 1471 | cellular macromolecule localization |
| GOMFID | Pvalue | OddsRatio | ExpCount | Count | Size | Term |
| GO:0051102 | 0.0021 | Inf | 0.0021 | 1 | 1 | DNA ligation involved in DNA recombination |
| GO:1990079 | 0.0021 | Inf | 0.0021 | 1 | 1 | cartilage homeostasis |
| GO:0006535 | 0.0042 | 489.6562 | 0.0042 | 1 | 2 | cysteine biosynthetic process from serine |
| GO:0043418 | 0.0042 | 489.6562 | 0.0042 | 1 | 2 | homocysteine catabolic process |
| GO:0006565 | 0.0063 | 244.8125 | 0.0063 | 1 | 3 | L-serine catabolic process |
| GO:0019343 | 0.0063 | 244.8125 | 0.0063 | 1 | 3 | cysteine biosynthetic process via cystathionine |
| GO:0019448 | 0.0063 | 244.8125 | 0.0063 | 1 | 3 | L-cysteine catabolic process |
| GO:0035928 | 0.0063 | 244.8125 | 0.0063 | 1 | 3 | rRNA import into mitochondrion |
| GO:0042262 | 0.0063 | 244.8125 | 0.0063 | 1 | 3 | DNA protection |
| GO:0097680 | 0.0063 | 244.8125 | 0.0063 | 1 | 3 | double-strand break repair via classical nonhomologous end joining |
| GO:0050911 | 0.0072 | 5.7675 | 0.7776 | 4 | 370 | detection of chemical stimulus involved in sensory perception of smell |
| GO:0008628 | 0.0084 | 163.1979 | 0.0084 | 1 | 4 | hormone-mediated apoptotic signaling pathway |
| GO:0019346 | 0.0084 | 163.1979 | 0.0084 | 1 | 4 | transsulfuration |
| GO:0033152 | 0.0084 | 163.1979 | 0.0084 | 1 | 4 | immunoglobulin V(D)J recombination |
| GO:0070814 | 0.0084 | 163.1979 | 0.0084 | 1 | 4 | hydrogen sulfide biosynthetic process |
| GO:0007186 | 0.0092 | 3.3898 | 2.4378 | 7 | 1160 | G-protein coupled receptor signaling pathway |
| GOMFID | Pvalue | OddsRatio | ExpCount | Count | Size | Term |
| GO:0001964 | 0.0018 | 36.206 | 0.0629 | 2 | 26 | startle response |
| GO:0030817 | 0.0022 | 12.825 | 0.2589 | 3 | 107 | regulation of cAMP biosynthetic process |
| GO:0030808 | 0.004 | 10.2429 | 0.3218 | 3 | 133 | regulation of nucleotide biosynthetic process |
| GO:0006535 | 0.0048 | 423.3514 | 0.0048 | 1 | 2 | cysteine biosynthetic process from serine |
| GO:0043418 | 0.0048 | 423.3514 | 0.0048 | 1 | 2 | homocysteine catabolic process |
| GO:0048866 | 0.0048 | 423.3514 | 0.0048 | 1 | 2 | stem cell fate specification |
| GO:0050906 | 0.005 | 5.0195 | 1.1228 | 5 | 464 | detection of stimulus involved in sensory perception |
| GO:0046058 | 0.0053 | 9.2387 | 0.3557 | 3 | 147 | cAMP metabolic process |
| GO:0052652 | 0.0053 | 9.2387 | 0.3557 | 3 | 147 | cyclic purine nucleotide metabolic process |
| GO:0030799 | 0.0055 | 9.111 | 0.3606 | 3 | 149 | regulation of cyclic nucleotide metabolic process |
| GO:0007186 | 0.0058 | 3.3595 | 2.8071 | 8 | 1160 | G-protein coupled receptor signaling pathway |
| GO:0006565 | 0.0072 | 211.6622 | 0.0073 | 1 | 3 | L-serine catabolic process |
| GO:0019343 | 0.0072 | 211.6622 | 0.0073 | 1 | 3 | cysteine biosynthetic process via cystathionine |
| GO:0019448 | 0.0072 | 211.6622 | 0.0073 | 1 | 3 | L-cysteine catabolic process |
| GO:0035483 | 0.0072 | 211.6622 | 0.0073 | 1 | 3 | gastric emptying |
| GO:0042262 | 0.0072 | 211.6622 | 0.0073 | 1 | 3 | DNA protection |
| GO:0050877 | 0.0075 | 3.1971 | 2.9378 | 8 | 1214 | neurological system process |
| GO:0008628 | 0.0096 | 141.0991 | 0.0097 | 1 | 4 | hormone-mediated apoptotic signaling pathway |
| GO:0019346 | 0.0096 | 141.0991 | 0.0097 | 1 | 4 | transsulfuration |
| GO:0031064 | 0.0096 | 141.0991 | 0.0097 | 1 | 4 | negative regulation of histone deacetylation |
| GO:0046952 | 0.0096 | 141.0991 | 0.0097 | 1 | 4 | ketone body catabolic process |
| GO:0060214 | 0.0096 | 141.0991 | 0.0097 | 1 | 4 | endocardium formation |
| GO:0070814 | 0.0096 | 141.0991 | 0.0097 | 1 | 4 | hydrogen sulfide biosynthetic process |
| GOMFID | Pvalue | OddsRatio | ExpCount | Count | Size | Term |
| GO:0050911 | 0 | 14.2061 | 1.0367 | 11 | 370 | detection of chemical stimulus involved in sensory perception of smell |
| GO:0009593 | 0 | 11.5295 | 1.2637 | 11 | 451 | detection of chemical stimulus |
| GO:0007606 | 0 | 11.1891 | 1.3001 | 11 | 464 | sensory perception of chemical stimulus |
| GO:0050906 | 0 | 11.1891 | 1.3001 | 11 | 464 | detection of stimulus involved in sensory perception |
| GO:0007186 | 0 | 5.3057 | 3.2503 | 13 | 1160 | G-protein coupled receptor signaling pathway |
| GO:0050877 | 1e-04 | 4.5103 | 3.4016 | 12 | 1214 | neurological system process |
| GO:0090103 | 0.0016 | 39.198 | 0.0588 | 2 | 21 | cochlea morphogenesis |
| GO:0042744 | 0.0019 | 35.4603 | 0.0644 | 2 | 23 | hydrogen peroxide catabolic process |
| GO:0007634 | 0.0028 | Inf | 0.0028 | 1 | 1 | optokinetic behavior |
| GO:0019428 | 0.0028 | Inf | 0.0028 | 1 | 1 | allantoin biosynthetic process |
| GO:0019628 | 0.0028 | Inf | 0.0028 | 1 | 1 | urate catabolic process |
| GO:0021560 | 0.0028 | Inf | 0.0028 | 1 | 1 | abducens nerve development |
| GO:0021599 | 0.0028 | Inf | 0.0028 | 1 | 1 | abducens nerve formation |
| GO:2000872 | 0.0028 | Inf | 0.0028 | 1 | 1 | positive regulation of progesterone secretion |
| GO:0016339 | 0.003 | 27.5697 | 0.0813 | 2 | 29 | calcium-dependent cell-cell adhesion via plasma membrane cell adhesion molecules |
| GO:0021754 | 0.0056 | 364.1395 | 0.0056 | 1 | 2 | facial nucleus development |
| GO:0060876 | 0.0056 | 364.1395 | 0.0056 | 1 | 2 | semicircular canal formation |
| GO:0071346 | 0.0065 | 8.5417 | 0.3811 | 3 | 136 | cellular response to interferon-gamma |
| GO:0006982 | 0.0084 | 182.0581 | 0.0084 | 1 | 3 | response to lipid hydroperoxide |
| GO:0021570 | 0.0084 | 182.0581 | 0.0084 | 1 | 3 | rhombomere 4 development |
| GO:0030185 | 0.0084 | 182.0581 | 0.0084 | 1 | 3 | nitric oxide transport |
| GO:0043932 | 0.0084 | 182.0581 | 0.0084 | 1 | 3 | ossification involved in bone remodeling |
| GOMFID | Pvalue | OddsRatio | ExpCount | Count | Size | Term |
| GO:0042743 | 0.001 | 48.8906 | 0.0481 | 2 | 42 | hydrogen peroxide metabolic process |
| GO:0010868 | 0.0023 | 922.5882 | 0.0023 | 1 | 2 | negative regulation of triglyceride biosynthetic process |
| GO:0070946 | 0.0023 | 922.5882 | 0.0023 | 1 | 2 | neutrophil mediated killing of gram-positive bacterium |
| GO:0070947 | 0.0023 | 922.5882 | 0.0023 | 1 | 2 | neutrophil mediated killing of fungus |
| GO:0008292 | 0.0034 | 461.2647 | 0.0034 | 1 | 3 | acetylcholine biosynthetic process |
| GO:0010133 | 0.0034 | 461.2647 | 0.0034 | 1 | 3 | proline catabolic process to glutamate |
| GO:0030185 | 0.0034 | 461.2647 | 0.0034 | 1 | 3 | nitric oxide transport |
| GO:1903409 | 0.0041 | 23.7851 | 0.0963 | 2 | 84 | reactive oxygen species biosynthetic process |
| GO:0007525 | 0.0046 | 307.4902 | 0.0046 | 1 | 4 | somatic muscle development |
| GO:0019470 | 0.0046 | 307.4902 | 0.0046 | 1 | 4 | 4-hydroxyproline catabolic process |
| GO:0032792 | 0.0057 | 230.6029 | 0.0057 | 1 | 5 | negative regulation of CREB transcription factor activity |
| GO:1900619 | 0.0057 | 230.6029 | 0.0057 | 1 | 5 | acetate ester metabolic process |
| GO:0010994 | 0.0069 | 184.4706 | 0.0069 | 1 | 6 | free ubiquitin chain polymerization |
| GO:0031536 | 0.0069 | 184.4706 | 0.0069 | 1 | 6 | positive regulation of exit from mitosis |
| GO:0008054 | 0.008 | 153.7157 | 0.008 | 1 | 7 | negative regulation of cyclin-dependent protein serine/threonine kinase by cyclin degradation |
| GO:0015871 | 0.008 | 153.7157 | 0.008 | 1 | 7 | choline transport |
| GO:0070942 | 0.008 | 153.7157 | 0.008 | 1 | 7 | neutrophil mediated cytotoxicity |
| GO:2000210 | 0.008 | 153.7157 | 0.008 | 1 | 7 | positive regulation of anoikis |
| GO:0051488 | 0.0091 | 131.7479 | 0.0092 | 1 | 8 | activation of anaphase-promoting complex activity |
| GOMFID | Pvalue | OddsRatio | ExpCount | Count | Size | Term |
| GO:0045766 | 3e-04 | 28.7623 | 0.1288 | 3 | 119 | positive regulation of angiogenesis |
| GO:0009607 | 3e-04 | 8.6943 | 1.009 | 6 | 932 | response to biotic stimulus |
| GO:0090023 | 3e-04 | 90.8 | 0.0271 | 2 | 25 | positive regulation of neutrophil chemotaxis |
| GO:1902622 | 6e-04 | 67.3333 | 0.0357 | 2 | 33 | regulation of neutrophil migration |
| GO:0071622 | 8e-04 | 54.9053 | 0.0433 | 2 | 40 | regulation of granulocyte chemotaxis |
| GO:0035505 | 0.0011 | Inf | 0.0011 | 1 | 1 | positive regulation of myosin light chain kinase activity |
| GO:0051673 | 0.0011 | Inf | 0.0011 | 1 | 1 | membrane disruption in other organism |
| GO:0071228 | 0.0011 | Inf | 0.0011 | 1 | 1 | cellular response to tumor cell |
| GO:0071414 | 0.0011 | Inf | 0.0011 | 1 | 1 | cellular response to methotrexate |
| GO:1901342 | 0.0017 | 14.8587 | 0.2447 | 3 | 226 | regulation of vasculature development |
| GO:0051707 | 0.0021 | 6.9187 | 0.97 | 5 | 896 | response to other organism |
| GO:0002522 | 0.0022 | 980.3125 | 0.0022 | 1 | 2 | leukocyte migration involved in immune response |
| GO:0019742 | 0.0022 | 980.3125 | 0.0022 | 1 | 2 | pentacyclic triterpenoid metabolic process |
| GO:0033092 | 0.0022 | 980.3125 | 0.0022 | 1 | 2 | positive regulation of immature T cell proliferation in thymus |
| GO:0036270 | 0.0022 | 980.3125 | 0.0022 | 1 | 2 | response to diuretic |
| GO:2000173 | 0.0022 | 980.3125 | 0.0022 | 1 | 2 | negative regulation of branching morphogenesis of a nerve |
| GO:0019221 | 0.0031 | 7.9568 | 0.6366 | 4 | 588 | cytokine-mediated signaling pathway |
| GO:0036273 | 0.0032 | 490.125 | 0.0032 | 1 | 3 | response to statin |
| GO:0046136 | 0.0032 | 490.125 | 0.0032 | 1 | 3 | positive regulation of vitamin metabolic process |
| GO:0060559 | 0.0032 | 490.125 | 0.0032 | 1 | 3 | positive regulation of calcidiol 1-monooxygenase activity |
| GO:0002690 | 0.0033 | 26.6803 | 0.0866 | 2 | 80 | positive regulation of leukocyte chemotaxis |
| GO:0030098 | 0.0039 | 11.0275 | 0.3269 | 3 | 302 | lymphocyte differentiation |
| GO:0014805 | 0.0043 | 326.7292 | 0.0043 | 1 | 4 | smooth muscle adaptation |
| GO:0070164 | 0.0043 | 326.7292 | 0.0043 | 1 | 4 | negative regulation of adiponectin secretion |
| GO:0002361 | 0.0054 | 245.0312 | 0.0054 | 1 | 5 | CD4-positive, CD25-positive, alpha-beta regulatory T cell differentiation |
| GO:0002439 | 0.0054 | 245.0312 | 0.0054 | 1 | 5 | chronic inflammatory response to antigenic stimulus |
| GO:0060355 | 0.0054 | 245.0312 | 0.0054 | 1 | 5 | positive regulation of cell adhesion molecule production |
| GO:0070487 | 0.0054 | 245.0312 | 0.0054 | 1 | 5 | monocyte aggregation |
| GO:0071639 | 0.0054 | 245.0312 | 0.0054 | 1 | 5 | positive regulation of monocyte chemotactic protein-1 production |
| GO:0045321 | 0.0058 | 6.6569 | 0.7546 | 4 | 697 | leukocyte activation |
| GO:0097530 | 0.0062 | 19.2321 | 0.1191 | 2 | 110 | granulocyte migration |
| GO:0014050 | 0.0065 | 196.0125 | 0.0065 | 1 | 6 | negative regulation of glutamate secretion |
| GO:0035634 | 0.0065 | 196.0125 | 0.0065 | 1 | 6 | response to stilbenoid |
| GO:0042060 | 0.0066 | 6.405 | 0.7827 | 4 | 723 | wound healing |
| GO:0010193 | 0.0076 | 163.3333 | 0.0076 | 1 | 7 | response to ozone |
| GO:0033591 | 0.0076 | 163.3333 | 0.0076 | 1 | 7 | response to L-ascorbic acid |
| GO:0033129 | 0.0086 | 139.9911 | 0.0087 | 1 | 8 | positive regulation of histone phosphorylation |
| GO:0035234 | 0.0086 | 139.9911 | 0.0087 | 1 | 8 | ectopic germ cell programmed cell death |
| GO:0045091 | 0.0086 | 139.9911 | 0.0087 | 1 | 8 | regulation of single stranded viral RNA replication via double stranded DNA intermediate |
| GO:0045410 | 0.0086 | 139.9911 | 0.0087 | 1 | 8 | positive regulation of interleukin-6 biosynthetic process |
| GO:0046425 | 0.0097 | 15.1328 | 0.1505 | 2 | 139 | regulation of JAK-STAT cascade |
| GO:0030638 | 0.0097 | 122.4844 | 0.0097 | 1 | 9 | polyketide metabolic process |
| GO:0033083 | 0.0097 | 122.4844 | 0.0097 | 1 | 9 | regulation of immature T cell proliferation |
| GO:0042355 | 0.0097 | 122.4844 | 0.0097 | 1 | 9 | L-fucose catabolic process |
| GO:0045080 | 0.0097 | 122.4844 | 0.0097 | 1 | 9 | positive regulation of chemokine biosynthetic process |
| GO:0060556 | 0.0097 | 122.4844 | 0.0097 | 1 | 9 | regulation of vitamin D biosynthetic process |
| GO:0009605 | 0.0097 | 3.8354 | 2.6285 | 7 | 2428 | response to external stimulus |
| GOMFID | Pvalue | OddsRatio | ExpCount | Count | Size | Term |
| GO:0007586 | 1e-04 | 23.1184 | 0.2166 | 4 | 162 | digestion |
| GO:0032776 | 0.001 | 49.9171 | 0.0468 | 2 | 35 | DNA methylation on cytosine |
| GO:0045814 | 0.001 | 17.4932 | 0.2019 | 3 | 151 | negative regulation of gene expression, epigenetic |
| GO:0021509 | 0.0013 | Inf | 0.0013 | 1 | 1 | roof plate formation |
| GO:0042502 | 0.0013 | Inf | 0.0013 | 1 | 1 | tyrosine phosphorylation of Stat2 protein |
| GO:2001051 | 0.0013 | Inf | 0.0013 | 1 | 1 | positive regulation of tendon cell differentiation |
| GO:0000183 | 0.0014 | 42.2213 | 0.0548 | 2 | 41 | chromatin silencing at rDNA |
| GO:0044338 | 0.0027 | 784.05 | 0.0027 | 1 | 2 | canonical Wnt signaling pathway involved in mesenchymal stem cell differentiation |
| GO:0048866 | 0.0027 | 784.05 | 0.0027 | 1 | 2 | stem cell fate specification |
| GO:0003151 | 0.003 | 27.8733 | 0.0816 | 2 | 61 | outflow tract morphogenesis |
| GO:0016458 | 0.0034 | 11.3473 | 0.3076 | 3 | 230 | gene silencing |
| GO:0034421 | 0.004 | 392 | 0.004 | 1 | 3 | post-translational protein acetylation |
| GO:0035425 | 0.004 | 392 | 0.004 | 1 | 3 | autocrine signaling |
| GO:0035483 | 0.004 | 392 | 0.004 | 1 | 3 | gastric emptying |
| GO:0044339 | 0.004 | 392 | 0.004 | 1 | 3 | canonical Wnt signaling pathway involved in osteoblast differentiation |
| GO:0045815 | 0.0047 | 21.9046 | 0.103 | 2 | 77 | positive regulation of gene expression, epigenetic |
| GO:0003150 | 0.0053 | 261.3167 | 0.0053 | 1 | 4 | muscular septum morphogenesis |
| GO:0031064 | 0.0053 | 261.3167 | 0.0053 | 1 | 4 | negative regulation of histone deacetylation |
| GO:0035992 | 0.0053 | 261.3167 | 0.0053 | 1 | 4 | tendon formation |
| GO:0060214 | 0.0053 | 261.3167 | 0.0053 | 1 | 4 | endocardium formation |
| GO:0030901 | 0.0057 | 19.7831 | 0.1137 | 2 | 85 | midbrain development |
| GO:0006305 | 0.006 | 19.3152 | 0.1163 | 2 | 87 | DNA alkylation |
| GO:0051461 | 0.0067 | 195.975 | 0.0067 | 1 | 5 | positive regulation of corticotropin secretion |
| GO:1903365 | 0.0067 | 195.975 | 0.0067 | 1 | 5 | regulation of fear response |
| GO:2000987 | 0.0067 | 195.975 | 0.0067 | 1 | 5 | positive regulation of behavioral fear response |
| GO:0044728 | 0.0078 | 16.739 | 0.1337 | 2 | 100 | DNA methylation or demethylation |
| GO:0003149 | 0.008 | 156.77 | 0.008 | 1 | 6 | membranous septum morphogenesis |
| GO:0042756 | 0.008 | 156.77 | 0.008 | 1 | 6 | drinking behavior |
| GO:0060022 | 0.008 | 156.77 | 0.008 | 1 | 6 | hard palate development |
| GO:0060836 | 0.008 | 156.77 | 0.008 | 1 | 6 | lymphatic endothelial cell differentiation |
| GO:0060956 | 0.008 | 156.77 | 0.008 | 1 | 6 | endocardial cell differentiation |
| GO:1904953 | 0.008 | 156.77 | 0.008 | 1 | 6 | Wnt signaling pathway involved in midbrain dopaminergic neuron differentiation |
| GO:0060562 | 0.0089 | 7.9252 | 0.436 | 3 | 326 | epithelial tube morphogenesis |
| GO:0060455 | 0.0093 | 130.6333 | 0.0094 | 1 | 7 | negative regulation of gastric acid secretion |
| GOMFID | Pvalue | OddsRatio | ExpCount | Count | Size | Term |
| GO:0009593 | 0 | 10.5754 | 0.9765 | 8 | 451 | detection of chemical stimulus |
| GO:0007606 | 0 | 10.2652 | 1.0046 | 8 | 464 | sensory perception of chemical stimulus |
| GO:0050906 | 0 | 10.2652 | 1.0046 | 8 | 464 | detection of stimulus involved in sensory perception |
| GO:0050911 | 0 | 10.9317 | 0.8011 | 7 | 370 | detection of chemical stimulus involved in sensory perception of smell |
| GO:0007186 | 1e-04 | 5.2605 | 2.5116 | 10 | 1160 | G-protein coupled receptor signaling pathway |
| GO:0050877 | 2e-04 | 5.0059 | 2.6285 | 10 | 1214 | neurological system process |
| GO:0006364 | 0.0039 | 10.4335 | 0.3183 | 3 | 147 | rRNA processing |
| GO:0019417 | 0.0043 | 474.7879 | 0.0043 | 1 | 2 | sulfur oxidation |
| GO:0046960 | 0.0043 | 474.7879 | 0.0043 | 1 | 2 | sensitization |
| GO:2001184 | 0.0065 | 237.3788 | 0.0065 | 1 | 3 | positive regulation of interleukin-12 secretion |
| GO:0002084 | 0.0086 | 158.2424 | 0.0087 | 1 | 4 | protein depalmitoylation |
| GO:0021769 | 0.0086 | 158.2424 | 0.0087 | 1 | 4 | orbitofrontal cortex development |
| GO:0035106 | 0.0086 | 158.2424 | 0.0087 | 1 | 4 | operant conditioning |
| GO:0046959 | 0.0086 | 158.2424 | 0.0087 | 1 | 4 | habituation |
| GO:0044700 | 0.0094 | 2.3828 | 12.7595 | 20 | 5893 | single organism signaling |
| GOMFID | Pvalue | OddsRatio | ExpCount | Count | Size | Term |
| GO:0001661 | 3e-04 | 116.6418 | 0.0264 | 2 | 6 | conditioned taste aversion |
| GO:0042502 | 0.0044 | Inf | 0.0044 | 1 | 1 | tyrosine phosphorylation of Stat2 protein |
| GO:0042666 | 0.0044 | Inf | 0.0044 | 1 | 1 | negative regulation of ectodermal cell fate specification |
| GO:0071881 | 0.0044 | Inf | 0.0044 | 1 | 1 | adenylate cyclase-inhibiting adrenergic receptor signaling pathway |
| GO:0071882 | 0.0044 | Inf | 0.0044 | 1 | 1 | phospholipase C-activating adrenergic receptor signaling pathway |
| GO:2000383 | 0.0044 | Inf | 0.0044 | 1 | 1 | regulation of ectoderm development |
| GO:0060259 | 0.0045 | 22.1933 | 0.1011 | 2 | 23 | regulation of feeding behavior |
| GO:0033555 | 0.0049 | 9.4297 | 0.3427 | 3 | 78 | multicellular organismal response to stress |
| GO:0050911 | 0.0057 | 3.9953 | 1.6258 | 6 | 370 | detection of chemical stimulus involved in sensory perception of smell |
| GO:0001964 | 0.0058 | 19.4154 | 0.1142 | 2 | 26 | startle response |
| GO:0045909 | 0.0076 | 16.6375 | 0.1318 | 2 | 30 | positive regulation of vasodilation |
| GO:0019417 | 0.0088 | 229.8971 | 0.0088 | 1 | 2 | sulfur oxidation |
| GO:0046960 | 0.0088 | 229.8971 | 0.0088 | 1 | 2 | sensitization |
| GO:0048866 | 0.0088 | 229.8971 | 0.0088 | 1 | 2 | stem cell fate specification |
| GO:0070473 | 0.0088 | 229.8971 | 0.0088 | 1 | 2 | negative regulation of uterine smooth muscle contraction |
| GO:0001662 | 0.0097 | 14.5541 | 0.1494 | 2 | 34 | behavioral fear response |
| GOMFID | Pvalue | OddsRatio | ExpCount | Count | Size | Term |
| GO:0035574 | 1e-04 | 150.6923 | 0.0172 | 2 | 15 | histone H4-K20 demethylation |
| GO:0045653 | 2e-04 | 122.4141 | 0.0206 | 2 | 18 | negative regulation of megakaryocyte differentiation |
| GO:0006335 | 6e-04 | 65.2292 | 0.0367 | 2 | 32 | DNA replication-dependent nucleosome assembly |
| GO:0016577 | 6e-04 | 63.121 | 0.0378 | 2 | 33 | histone demethylation |
| GO:0050911 | 7e-04 | 11.9586 | 0.4241 | 4 | 370 | detection of chemical stimulus involved in sensory perception of smell |
| GO:0008214 | 7e-04 | 59.2879 | 0.0401 | 2 | 35 | protein dealkylation |
| GO:0032776 | 7e-04 | 59.2879 | 0.0401 | 2 | 35 | DNA methylation on cytosine |
| GO:0051290 | 9e-04 | 54.3368 | 0.0436 | 2 | 38 | protein heterotetramerization |
| GO:0000387 | 9e-04 | 51.4704 | 0.0459 | 2 | 40 | spliceosomal snRNP assembly |
| GO:0034080 | 9e-04 | 51.4704 | 0.0459 | 2 | 40 | CENP-A containing nucleosome assembly |
| GO:0000183 | 0.001 | 50.1474 | 0.047 | 2 | 41 | chromatin silencing at rDNA |
| GO:1901532 | 0.0011 | 47.6951 | 0.0493 | 2 | 43 | regulation of hematopoietic progenitor cell differentiation |
| GO:1990079 | 0.0011 | Inf | 0.0011 | 1 | 1 | cartilage homeostasis |
| GO:0007186 | 0.0014 | 6.2959 | 1.3297 | 6 | 1160 | G-protein coupled receptor signaling pathway |
| GO:0034724 | 0.0015 | 40.7214 | 0.0573 | 2 | 50 | DNA replication-independent nucleosome organization |
| GO:0009593 | 0.0015 | 9.7399 | 0.517 | 4 | 451 | detection of chemical stimulus |
| GO:0000245 | 0.0017 | 38.3186 | 0.0608 | 2 | 53 | spliceosomal complex assembly |
| GO:0007606 | 0.0017 | 9.4565 | 0.5319 | 4 | 464 | sensory perception of chemical stimulus |
| GO:0050906 | 0.0017 | 9.4565 | 0.5319 | 4 | 464 | detection of stimulus involved in sensory perception |
| GO:0070988 | 0.0023 | 32.5521 | 0.0711 | 2 | 62 | demethylation |
| GO:0002522 | 0.0023 | 922.5882 | 0.0023 | 1 | 2 | leukocyte migration involved in immune response |
| GO:0006303 | 0.0025 | 30.996 | 0.0745 | 2 | 65 | double-strand break repair via nonhomologous end joining |
| GO:0043044 | 0.0029 | 28.2899 | 0.0814 | 2 | 71 | ATP-dependent chromatin remodeling |
| GO:0034421 | 0.0034 | 461.2647 | 0.0034 | 1 | 3 | post-translational protein acetylation |
| GO:0045815 | 0.0035 | 26.0167 | 0.0883 | 2 | 77 | positive regulation of gene expression, epigenetic |
| GO:0006305 | 0.0044 | 22.9412 | 0.0997 | 2 | 87 | DNA alkylation |
| GO:0006353 | 0.0051 | 21.1861 | 0.1078 | 2 | 94 | DNA-templated transcription, termination |
| GO:0002361 | 0.0057 | 230.6029 | 0.0057 | 1 | 5 | CD4-positive, CD25-positive, alpha-beta regulatory T cell differentiation |
| GO:0044728 | 0.0057 | 19.8814 | 0.1146 | 2 | 100 | DNA methylation or demethylation |
| GO:0000723 | 0.0091 | 15.56 | 0.1456 | 2 | 127 | telomere maintenance |
| GO:0045091 | 0.0091 | 131.7479 | 0.0092 | 1 | 8 | regulation of single stranded viral RNA replication via double stranded DNA intermediate |
| GO:1903707 | 0.0095 | 15.1924 | 0.149 | 2 | 130 | negative regulation of hemopoiesis |
| GOMFID | Pvalue | OddsRatio | ExpCount | Count | Size | Term |
| GO:0050911 | 0 | 21.0453 | 0.4241 | 6 | 370 | detection of chemical stimulus involved in sensory perception of smell |
| GO:0009593 | 0 | 17.1236 | 0.517 | 6 | 451 | detection of chemical stimulus |
| GO:0007606 | 0 | 16.6234 | 0.5319 | 6 | 464 | sensory perception of chemical stimulus |
| GO:0050906 | 0 | 16.6234 | 0.5319 | 6 | 464 | detection of stimulus involved in sensory perception |
| GO:0019740 | 0 | 326.6458 | 0.0092 | 2 | 8 | nitrogen utilization |
| GO:0006995 | 1e-04 | 139.9196 | 0.0183 | 2 | 16 | cellular response to nitrogen starvation |
| GO:0007186 | 2e-04 | 8.0205 | 1.3297 | 7 | 1160 | G-protein coupled receptor signaling pathway |
| GO:0015695 | 2e-04 | 108.7986 | 0.0229 | 2 | 20 | organic cation transport |
| GO:0072488 | 3e-04 | 88.9943 | 0.0275 | 2 | 24 | ammonium transmembrane transport |
| GO:0002381 | 0.0011 | 46.5565 | 0.0504 | 2 | 44 | immunoglobulin production involved in immunoglobulin mediated immune response |
| GO:0050877 | 0.0017 | 5.9921 | 1.3916 | 6 | 1214 | neurological system process |
| GO:0051716 | 0.0028 | 4.6839 | 7.7053 | 14 | 6722 | cellular response to stimulus |
| GO:0046013 | 0.0034 | 461.2647 | 0.0034 | 1 | 3 | regulation of T cell homeostatic proliferation |
| GO:0007154 | 0.0035 | 4.2367 | 6.8524 | 13 | 5978 | cell communication |
| GO:0070317 | 0.0046 | 307.4902 | 0.0046 | 1 | 4 | negative regulation of G0 to G1 transition |
| GO:0019724 | 0.0055 | 20.2982 | 0.1123 | 2 | 98 | B cell mediated immunity |
| GO:0048304 | 0.0069 | 184.4706 | 0.0069 | 1 | 6 | positive regulation of isotype switching to IgG isotypes |
| GO:0045591 | 0.0091 | 131.7479 | 0.0092 | 1 | 8 | positive regulation of regulatory T cell differentiation |
| GOMFID | Pvalue | OddsRatio | ExpCount | Count | Size | Term |
| GO:0031442 | 1e-04 | 38.8704 | 0.0964 | 3 | 17 | positive regulation of mRNA 3'-end processing |
| GO:0000027 | 2e-04 | 30.2248 | 0.119 | 3 | 21 | ribosomal large subunit assembly |
| GO:0043456 | 3e-04 | 119.6245 | 0.0283 | 2 | 5 | regulation of pentose-phosphate shunt |
| GO:0006479 | 0.0017 | 6.263 | 0.8615 | 5 | 152 | protein methylation |
| GO:0050684 | 0.0022 | 7.9396 | 0.5441 | 4 | 96 | regulation of mRNA processing |
| GO:1903313 | 0.0022 | 12.632 | 0.2607 | 3 | 46 | positive regulation of mRNA metabolic process |
| GO:0051196 | 0.0025 | 12.069 | 0.272 | 3 | 48 | regulation of coenzyme metabolic process |
| GO:0031123 | 0.0029 | 7.3007 | 0.5894 | 4 | 104 | RNA 3'-end processing |
| GO:0006474 | 0.0032 | 27.588 | 0.085 | 2 | 15 | N-terminal protein amino acid acetylation |
| GO:0019748 | 0.0039 | 10.242 | 0.3174 | 3 | 56 | secondary metabolic process |
| GO:0071826 | 0.0053 | 4.756 | 1.1222 | 5 | 198 | ribonucleoprotein complex subunit organization |
| GO:0019682 | 0.0056 | 19.9183 | 0.1134 | 2 | 20 | glyceraldehyde-3-phosphate metabolic process |
| GO:0046680 | 0.0057 | Inf | 0.0057 | 1 | 1 | response to DDT |
| GO:0050726 | 0.0057 | Inf | 0.0057 | 1 | 1 | positive regulation of interleukin-1 alpha biosynthetic process |
| GO:0060386 | 0.0057 | Inf | 0.0057 | 1 | 1 | synapse assembly involved in innervation |
| GO:0071283 | 0.0057 | Inf | 0.0057 | 1 | 1 | cellular response to iron(III) ion |
| GO:0071962 | 0.0057 | Inf | 0.0057 | 1 | 1 | mitotic sister chromatid cohesion, centromeric |
| GO:2000775 | 0.0057 | Inf | 0.0057 | 1 | 1 | histone H3-S10 phosphorylation involved in chromosome condensation |
| GO:0045730 | 0.0088 | 15.5832 | 0.1417 | 2 | 25 | respiratory burst |
| GO:0031058 | 0.0092 | 7.4264 | 0.4307 | 3 | 76 | positive regulation of histone modification |
| GO:0051156 | 0.0094 | 14.933 | 0.1474 | 2 | 26 | glucose 6-phosphate metabolic process |
| GOMFID | Pvalue | OddsRatio | ExpCount | Count | Size | Term |
| GO:0050911 | 0 | 32.0887 | 0.6597 | 12 | 370 | detection of chemical stimulus involved in sensory perception of smell |
| GO:0009593 | 0 | 26.0296 | 0.8042 | 12 | 451 | detection of chemical stimulus |
| GO:0007606 | 0 | 25.2594 | 0.8274 | 12 | 464 | sensory perception of chemical stimulus |
| GO:0050906 | 0 | 25.2594 | 0.8274 | 12 | 464 | detection of stimulus involved in sensory perception |
| GO:0007186 | 0 | 10.9773 | 2.0684 | 13 | 1160 | G-protein coupled receptor signaling pathway |
| GO:0050877 | 0 | 9.0306 | 2.1647 | 12 | 1214 | neurological system process |
| GO:0045407 | 0.0018 | Inf | 0.0018 | 1 | 1 | positive regulation of interleukin-5 biosynthetic process |
| GO:0031424 | 0.0034 | 25.5777 | 0.0874 | 2 | 49 | keratinization |
| GO:0018149 | 0.0043 | 22.6734 | 0.0981 | 2 | 55 | peptide cross-linking |
| GO:0032501 | 0.0065 | 2.8265 | 11.9842 | 19 | 6721 | multicellular organismal process |
| GOMFID | Pvalue | OddsRatio | ExpCount | Count | Size | Term |
| GO:0050911 | 4e-04 | 13.9536 | 0.377 | 4 | 370 | detection of chemical stimulus involved in sensory perception of smell |
| GO:0009593 | 9e-04 | 11.3647 | 0.4595 | 4 | 451 | detection of chemical stimulus |
| GO:0007606 | 0.001 | 11.0341 | 0.4728 | 4 | 464 | sensory perception of chemical stimulus |
| GO:0050906 | 0.001 | 11.0341 | 0.4728 | 4 | 464 | detection of stimulus involved in sensory perception |
| GO:1902530 | 0.002 | 1045.7333 | 0.002 | 1 | 2 | positive regulation of protein linear polyubiquitination |
| GO:0070424 | 0.0091 | 130.6583 | 0.0092 | 1 | 9 | regulation of nucleotide-binding oligomerization domain containing signaling pathway |
| GO:0097341 | 0.0091 | 130.6583 | 0.0092 | 1 | 9 | zymogen inhibition |
| GO:1990001 | 0.0091 | 130.6583 | 0.0092 | 1 | 9 | inhibition of cysteine-type endopeptidase activity involved in apoptotic process |
| GOMFID | Pvalue | OddsRatio | ExpCount | Count | Size | Term |
| GO:0004984 | 0 | 25.0997 | 0.6344 | 10 | 370 | olfactory receptor activity |
| GO:0004930 | 0 | 11.4061 | 1.339 | 10 | 781 | G-protein coupled receptor activity |
| GO:0099600 | 0 | 7.0798 | 2.0848 | 10 | 1216 | transmembrane receptor activity |
| GO:0038023 | 0 | 6.757 | 2.1757 | 10 | 1269 | signaling receptor activity |
| GO:0060089 | 1e-04 | 5.5975 | 2.5803 | 10 | 1505 | molecular transducer activity |
| GO:0038100 | 0.0034 | 604.6154 | 0.0034 | 1 | 2 | nodal binding |
| GO:0005549 | 0.0088 | 15.4469 | 0.1423 | 2 | 83 | odorant binding |
| GOMFID | Pvalue | OddsRatio | ExpCount | Count | Size | Term |
| GO:0005212 | 0.001 | 49.819 | 0.047 | 2 | 20 | structural constituent of eye lens |
| GO:0022894 | 0.0023 | Inf | 0.0023 | 1 | 1 | Intermediate conductance calcium-activated potassium channel activity |
| GO:0005135 | 0.0047 | 436.3889 | 0.0047 | 1 | 2 | interleukin-3 receptor binding |
| GO:0008260 | 0.0047 | 436.3889 | 0.0047 | 1 | 2 | 3-oxoacid CoA-transferase activity |
| GO:0071862 | 0.0047 | 436.3889 | 0.0047 | 1 | 2 | protein phosphatase type 1 activator activity |
| GO:0016286 | 0.0094 | 145.4444 | 0.0094 | 1 | 4 | small conductance calcium-activated potassium channel activity |
| GOMFID | Pvalue | OddsRatio | ExpCount | Count | Size | Term |
| GO:0004984 | 7e-04 | 8.0885 | 0.7283 | 5 | 370 | olfactory receptor activity |
| GO:0033981 | 0.002 | Inf | 0.002 | 1 | 1 | D-dopachrome decarboxylase activity |
| GO:0001850 | 0.0039 | 523.8667 | 0.0039 | 1 | 2 | complement component C3a binding |
| GO:0001851 | 0.0039 | 523.8667 | 0.0039 | 1 | 2 | complement component C3b binding |
| GO:0005128 | 0.0039 | 523.8667 | 0.0039 | 1 | 2 | erythropoietin receptor binding |
| GO:0004167 | 0.0059 | 261.9167 | 0.0059 | 1 | 3 | dopachrome isomerase activity |
| GO:0031871 | 0.0059 | 261.9167 | 0.0059 | 1 | 3 | proteinase activated receptor binding |
| GO:0070740 | 0.0059 | 261.9167 | 0.0059 | 1 | 3 | tubulin-glutamic acid ligase activity |
| GOMFID | Pvalue | OddsRatio | ExpCount | Count | Size | Term |
| GO:0008009 | 1e-04 | 33.6968 | 0.1036 | 3 | 48 | chemokine activity |
| GO:0004984 | 0.0011 | 7.2504 | 0.7988 | 5 | 370 | olfactory receptor activity |
| GO:0048020 | 0.0026 | 29.6989 | 0.0756 | 2 | 35 | CCR chemokine receptor binding |
| GO:0004666 | 0.0043 | 476.1515 | 0.0043 | 1 | 2 | prostaglandin-endoperoxide synthase activity |
| GO:0004756 | 0.0043 | 476.1515 | 0.0043 | 1 | 2 | selenide, water dikinase activity |
| GO:0017098 | 0.0043 | 476.1515 | 0.0043 | 1 | 2 | sulfonylurea receptor binding |
| GO:0004930 | 0.006 | 4.1306 | 1.6862 | 6 | 781 | G-protein coupled receptor activity |
| GO:0050473 | 0.0065 | 238.0606 | 0.0065 | 1 | 3 | arachidonate 15-lipoxygenase activity |
| GO:0001601 | 0.0086 | 158.697 | 0.0086 | 1 | 4 | peptide YY receptor activity |
| GO:0001602 | 0.0086 | 158.697 | 0.0086 | 1 | 4 | pancreatic polypeptide receptor activity |
| GO:0015272 | 0.0086 | 158.697 | 0.0086 | 1 | 4 | ATP-activated inward rectifier potassium channel activity |
| GOMFID | Pvalue | OddsRatio | ExpCount | Count | Size | Term |
| GO:0008009 | 2e-04 | 32.6417 | 0.1067 | 3 | 48 | chemokine activity |
| GO:0035575 | 5e-04 | 73.1935 | 0.0333 | 2 | 15 | histone demethylase activity (H4-K20 specific) |
| GO:0005212 | 9e-04 | 52.8451 | 0.0445 | 2 | 20 | structural constituent of eye lens |
| GO:0001965 | 0.001 | 50.0606 | 0.0467 | 2 | 21 | G-protein alpha-subunit binding |
| GO:0004984 | 0.0013 | 7.0082 | 0.8223 | 5 | 370 | olfactory receptor activity |
| GO:0001664 | 0.0022 | 8.1128 | 0.5556 | 4 | 250 | G-protein coupled receptor binding |
| GO:0000210 | 0.0022 | Inf | 0.0022 | 1 | 1 | NAD+ diphosphatase activity |
| GO:0035755 | 0.0022 | Inf | 0.0022 | 1 | 1 | cardiolipin hydrolase activity |
| GO:0048020 | 0.0027 | 28.7971 | 0.0778 | 2 | 35 | CCR chemokine receptor binding |
| GO:0032451 | 0.003 | 27.1481 | 0.0822 | 2 | 37 | demethylase activity |
| GO:0005153 | 0.0044 | 462.1176 | 0.0044 | 1 | 2 | interleukin-8 receptor binding |
| GO:0008808 | 0.0044 | 462.1176 | 0.0044 | 1 | 2 | cardiolipin synthase activity |
| GO:0004461 | 0.0067 | 231.0441 | 0.0067 | 1 | 3 | lactose synthase activity |
| GO:0035529 | 0.0067 | 231.0441 | 0.0067 | 1 | 3 | NADH pyrophosphatase activity |
| GO:0046848 | 0.0089 | 154.0196 | 0.0089 | 1 | 4 | hydroxyapatite binding |
| GOMFID | Pvalue | OddsRatio | ExpCount | Count | Size | Term |
| GO:0004984 | 2e-04 | 5.5491 | 1.6212 | 8 | 370 | olfactory receptor activity |
| GO:0004930 | 5e-04 | 3.6722 | 3.422 | 11 | 781 | G-protein coupled receptor activity |
| GO:0038023 | 0.001 | 2.9255 | 5.5601 | 14 | 1269 | signaling receptor activity |
| GO:0008009 | 0.0012 | 15.7919 | 0.2103 | 3 | 48 | chemokine activity |
| GO:0060089 | 0.0019 | 2.6452 | 6.5942 | 15 | 1505 | molecular transducer activity |
| GO:0099600 | 0.0021 | 2.7934 | 5.3279 | 13 | 1216 | transmembrane receptor activity |
| GO:0004946 | 0.0044 | Inf | 0.0044 | 1 | 1 | bombesin receptor activity |
| GO:0018738 | 0.0044 | Inf | 0.0044 | 1 | 1 | S-formylglutathione hydrolase activity |
| GO:0033981 | 0.0044 | Inf | 0.0044 | 1 | 1 | D-dopachrome decarboxylase activity |
| GO:0052906 | 0.0044 | Inf | 0.0044 | 1 | 1 | tRNA (guanine(37)-N(1))-methyltransferase activity |
| GO:1904265 | 0.0044 | Inf | 0.0044 | 1 | 1 | ubiquitin-specific protease activity involved in negative regulation of retrograde protein transport, ER to cytosol |
| GO:0001664 | 0.0048 | 4.9216 | 1.0954 | 5 | 250 | G-protein coupled receptor binding |
| GO:0004021 | 0.0087 | 230.5588 | 0.0088 | 1 | 2 | L-alanine:2-oxoglutarate aminotransferase activity |
| GO:0004478 | 0.0087 | 230.5588 | 0.0088 | 1 | 2 | methionine adenosyltransferase activity |
| GO:0004962 | 0.0087 | 230.5588 | 0.0088 | 1 | 2 | endothelin receptor activity |
| GO:0005153 | 0.0087 | 230.5588 | 0.0088 | 1 | 2 | interleukin-8 receptor binding |
| GOMFID | Pvalue | OddsRatio | ExpCount | Count | Size | Term |
| GO:0004984 | 0 | 13.6674 | 0.8693 | 9 | 370 | olfactory receptor activity |
| GO:0099600 | 0 | 5.7835 | 2.857 | 12 | 1216 | transmembrane receptor activity |
| GO:0005549 | 0 | 23.9847 | 0.195 | 4 | 83 | odorant binding |
| GO:0004930 | 0 | 6.4844 | 1.7767 | 9 | 777 | G-protein coupled receptor activity |
| GO:0060089 | 1e-04 | 4.5711 | 3.536 | 12 | 1505 | molecular transducer activity |
| GO:0038023 | 5e-04 | 4.2515 | 2.9815 | 10 | 1269 | signaling receptor activity |
| GO:0003951 | 0.0047 | 436.3889 | 0.0047 | 1 | 2 | NAD+ kinase activity |
| GO:0017098 | 0.0047 | 436.3889 | 0.0047 | 1 | 2 | sulfonylurea receptor binding |
| GO:0008020 | 0.0094 | 145.4444 | 0.0094 | 1 | 4 | G-protein coupled photoreceptor activity |
| GO:0015272 | 0.0094 | 145.4444 | 0.0094 | 1 | 4 | ATP-activated inward rectifier potassium channel activity |
| GO:0015467 | 0.0094 | 145.4444 | 0.0094 | 1 | 4 | G-protein activated inward rectifier potassium channel activity |
| GOMFID | Pvalue | OddsRatio | ExpCount | Count | Size | Term |
| GO:0008531 | 0.0028 | Inf | 0.0028 | 1 | 1 | riboflavin kinase activity |
| GO:0047273 | 0.0028 | Inf | 0.0028 | 1 | 1 | galactosylgalactosylglucosylceramide beta-D-acetylgalactosaminyltransferase activity |
| GO:0052906 | 0.0028 | Inf | 0.0028 | 1 | 1 | tRNA (guanine(37)-N(1))-methyltransferase activity |
| GO:1904265 | 0.0028 | Inf | 0.0028 | 1 | 1 | ubiquitin-specific protease activity involved in negative regulation of retrograde protein transport, ER to cytosol |
| GO:0001179 | 0.0056 | 365.186 | 0.0056 | 1 | 2 | RNA polymerase I transcription factor binding |
| GO:0004021 | 0.0056 | 365.186 | 0.0056 | 1 | 2 | L-alanine:2-oxoglutarate aminotransferase activity |
| GO:0046811 | 0.0056 | 365.186 | 0.0056 | 1 | 2 | histone deacetylase inhibitor activity |
| GO:0061578 | 0.0084 | 182.5814 | 0.0084 | 1 | 3 | Lys63-specific deubiquitinase activity |
| GOMFID | Pvalue | OddsRatio | ExpCount | Count | Size | Term |
| GO:0004984 | 0 | 11.3863 | 0.7753 | 7 | 370 | olfactory receptor activity |
| GO:0004930 | 2e-04 | 6.1856 | 1.6366 | 8 | 781 | G-protein coupled receptor activity |
| GO:0099600 | 7e-04 | 4.5075 | 2.5481 | 9 | 1216 | transmembrane receptor activity |
| GO:0005549 | 7e-04 | 19.5437 | 0.1739 | 3 | 83 | odorant binding |
| GO:0038023 | 9e-04 | 4.3021 | 2.6592 | 9 | 1269 | signaling receptor activity |
| GO:0060089 | 0.003 | 3.5643 | 3.1537 | 9 | 1505 | molecular transducer activity |
| GO:0047757 | 0.0042 | 491.0625 | 0.0042 | 1 | 2 | chondroitin-glucuronate 5-epimerase activity |
| GO:0004082 | 0.0084 | 163.6667 | 0.0084 | 1 | 4 | bisphosphoglycerate mutase activity |
| GO:0046538 | 0.0084 | 163.6667 | 0.0084 | 1 | 4 | 2,3-bisphosphoglycerate-dependent phosphoglycerate mutase activity |
| GOMFID | Pvalue | OddsRatio | ExpCount | Count | Size | Term |
| GO:0004984 | 0 | 20.9182 | 1.0808 | 15 | 370 | olfactory receptor activity |
| GO:0004930 | 0 | 10.8158 | 2.2236 | 16 | 778 | G-protein coupled receptor activity |
| GO:0099600 | 0 | 7.783 | 3.5519 | 18 | 1216 | transmembrane receptor activity |
| GO:0038023 | 0 | 7.426 | 3.7068 | 18 | 1269 | signaling receptor activity |
| GO:0060089 | 0 | 6.1454 | 4.3961 | 18 | 1505 | molecular transducer activity |
| GO:0016503 | 0.0087 | 174.4444 | 0.0088 | 1 | 3 | pheromone receptor activity |
| GOMFID | Pvalue | OddsRatio | ExpCount | Count | Size | Term |
| GO:0004984 | 0 | 12.6905 | 1.3392 | 13 | 370 | olfactory receptor activity |
| GO:0004930 | 0 | 6.335 | 2.8268 | 14 | 781 | G-protein coupled receptor activity |
| GO:0099600 | 0 | 5.1369 | 4.4013 | 17 | 1216 | transmembrane receptor activity |
| GO:0038023 | 0 | 4.9014 | 4.5932 | 17 | 1269 | signaling receptor activity |
| GO:0005549 | 0 | 19.2468 | 0.3004 | 5 | 83 | odorant binding |
| GO:0060089 | 0 | 4.0566 | 5.4474 | 17 | 1505 | molecular transducer activity |
| GO:0032395 | 6e-04 | 71.2864 | 0.0362 | 2 | 10 | MHC class II receptor activity |
| GO:0042605 | 0.0034 | 25.8992 | 0.0869 | 2 | 24 | peptide antigen binding |
| GO:0005130 | 0.0036 | Inf | 0.0036 | 1 | 1 | granulocyte colony-stimulating factor receptor binding |
| GO:0008613 | 0.0036 | Inf | 0.0036 | 1 | 1 | diuretic hormone activity |
| GO:0038164 | 0.0036 | Inf | 0.0036 | 1 | 1 | thrombopoietin receptor activity |
| GO:1990259 | 0.0036 | Inf | 0.0036 | 1 | 1 | histone-glutamine methyltransferase activity |
| GO:0004021 | 0.0072 | 280.1786 | 0.0072 | 1 | 2 | L-alanine:2-oxoglutarate aminotransferase activity |
| GOMFID | Pvalue | OddsRatio | ExpCount | Count | Size | Term |
| GO:0004984 | 0 | 16.9702 | 0.6579 | 8 | 370 | olfactory receptor activity |
| GO:0004930 | 0 | 9.1718 | 1.3886 | 9 | 781 | G-protein coupled receptor activity |
| GO:0099600 | 2e-04 | 5.6956 | 2.1621 | 9 | 1216 | transmembrane receptor activity |
| GO:0038023 | 2e-04 | 5.4361 | 2.2563 | 9 | 1269 | signaling receptor activity |
| GO:0060089 | 8e-04 | 4.5038 | 2.6759 | 9 | 1505 | molecular transducer activity |
| GO:0033735 | 0.0018 | Inf | 0.0018 | 1 | 1 | aspartate dehydrogenase activity |
| GO:0008009 | 0.0033 | 26.2107 | 0.0853 | 2 | 48 | chemokine activity |
| GO:0005549 | 0.0095 | 14.8519 | 0.1476 | 2 | 83 | odorant binding |
| GO:0001664 | 0.0097 | 7.5172 | 0.4445 | 3 | 250 | G-protein coupled receptor binding |
| GOMFID | Pvalue | OddsRatio | ExpCount | Count | Size | Term |
| GO:0004984 | 7e-04 | 25.133 | 0.188 | 3 | 370 | olfactory receptor activity |
| GO:0038100 | 0.001 | 2248.4286 | 0.001 | 1 | 2 | nodal binding |
| GO:0004930 | 0.0056 | 11.5388 | 0.3967 | 3 | 781 | G-protein coupled receptor activity |
| GO:0016290 | 0.0061 | 204.2727 | 0.0061 | 1 | 12 | palmitoyl-CoA hydrolase activity |
| GO:0016289 | 0.0091 | 132.1261 | 0.0091 | 1 | 18 | CoA hydrolase activity |
| GOMFID | Pvalue | OddsRatio | ExpCount | Count | Size | Term |
| GO:0004930 | 0 | 4.7138 | 3.8141 | 15 | 780 | G-protein coupled receptor activity |
| GO:0004984 | 1e-04 | 5.5314 | 1.8326 | 9 | 370 | olfactory receptor activity |
| GO:0099600 | 3e-04 | 3.1118 | 6.0229 | 16 | 1216 | transmembrane receptor activity |
| GO:0038023 | 4e-04 | 2.9693 | 6.2854 | 16 | 1269 | signaling receptor activity |
| GO:0005109 | 7e-04 | 18.9539 | 0.1783 | 3 | 36 | frizzled binding |
| GO:0060089 | 9e-04 | 2.6562 | 7.4543 | 17 | 1505 | molecular transducer activity |
| GO:0042813 | 0.0043 | 22.883 | 0.0991 | 2 | 20 | Wnt-activated receptor activity |
| GO:0000215 | 0.005 | Inf | 0.005 | 1 | 1 | tRNA 2'-phosphotransferase activity |
| GO:0001604 | 0.005 | Inf | 0.005 | 1 | 1 | urotensin II receptor activity |
| GO:0001616 | 0.005 | Inf | 0.005 | 1 | 1 | growth hormone secretagogue receptor activity |
| GO:0017174 | 0.005 | Inf | 0.005 | 1 | 1 | glycine N-methyltransferase activity |
| GO:0018738 | 0.005 | Inf | 0.005 | 1 | 1 | S-formylglutathione hydrolase activity |
| GO:0031861 | 0.005 | Inf | 0.005 | 1 | 1 | prolactin-releasing peptide receptor binding |
| GO:0035755 | 0.005 | Inf | 0.005 | 1 | 1 | cardiolipin hydrolase activity |
| GO:0005184 | 0.0073 | 17.1557 | 0.1288 | 2 | 26 | neuropeptide hormone activity |
| GO:0017147 | 0.0096 | 14.7011 | 0.1486 | 2 | 30 | Wnt-protein binding |
| GO:0004483 | 0.0099 | 203.4935 | 0.0099 | 1 | 2 | mRNA (nucleoside-2'-O-)-methyltransferase activity |
| GO:0008808 | 0.0099 | 203.4935 | 0.0099 | 1 | 2 | cardiolipin synthase activity |
| GO:0031696 | 0.0099 | 203.4935 | 0.0099 | 1 | 2 | alpha-2C adrenergic receptor binding |
| GO:0046811 | 0.0099 | 203.4935 | 0.0099 | 1 | 2 | histone deacetylase inhibitor activity |
| GOMFID | Pvalue | OddsRatio | ExpCount | Count | Size | Term |
| GO:0004984 | 6e-04 | 12.9172 | 0.3994 | 4 | 370 | olfactory receptor activity |
| GO:0099600 | 0.0012 | 6.5459 | 1.3127 | 6 | 1216 | transmembrane receptor activity |
| GO:0038023 | 0.0015 | 6.2483 | 1.3699 | 6 | 1269 | signaling receptor activity |
| GO:0038100 | 0.0022 | 983.125 | 0.0022 | 1 | 2 | nodal binding |
| GO:0060089 | 0.0037 | 5.1787 | 1.6247 | 6 | 1505 | molecular transducer activity |
| GO:0008508 | 0.0054 | 245.7344 | 0.0054 | 1 | 5 | bile acid:sodium symporter activity |
| GO:0061133 | 0.0065 | 196.575 | 0.0065 | 1 | 6 | endopeptidase activator activity |
| GO:0004930 | 0.0085 | 5.9218 | 0.8431 | 4 | 781 | G-protein coupled receptor activity |
| GO:0046920 | 0.0086 | 140.3929 | 0.0086 | 1 | 8 | alpha-(1->3)-fucosyltransferase activity |
| GOMFID | Pvalue | OddsRatio | ExpCount | Count | Size | Term |
| GO:0005125 | 1e-04 | 9.8807 | 0.6963 | 6 | 215 | cytokine activity |
| GO:0008519 | 0.0025 | 30.4684 | 0.0745 | 2 | 23 | ammonium transmembrane transporter activity |
| GO:0022894 | 0.0032 | Inf | 0.0032 | 1 | 1 | Intermediate conductance calcium-activated potassium channel activity |
| GO:0035438 | 0.0032 | Inf | 0.0032 | 1 | 1 | cyclic-di-GMP binding |
| GO:0061507 | 0.0032 | Inf | 0.0032 | 1 | 1 | cyclic-GMP-AMP binding |
| GO:0048020 | 0.0057 | 19.3741 | 0.1133 | 2 | 35 | CCR chemokine receptor binding |
| GO:0005135 | 0.0065 | 313.92 | 0.0065 | 1 | 2 | interleukin-3 receptor binding |
| GO:0010385 | 0.0065 | 313.92 | 0.0065 | 1 | 2 | double-stranded methylated DNA binding |
| GO:0031755 | 0.0065 | 313.92 | 0.0065 | 1 | 2 | Edg-2 lysophosphatidic acid receptor binding |
| GO:0061752 | 0.0065 | 313.92 | 0.0065 | 1 | 2 | telomeric repeat-containing RNA binding |
| GO:0071862 | 0.0065 | 313.92 | 0.0065 | 1 | 2 | protein phosphatase type 1 activator activity |
| GO:0004984 | 0.0068 | 4.5658 | 1.1982 | 5 | 370 | olfactory receptor activity |
| GO:0005094 | 0.0097 | 156.95 | 0.0097 | 1 | 3 | Rho GDP-dissociation inhibitor activity |
| GOMFID | Pvalue | OddsRatio | ExpCount | Count | Size | Term |
| GO:0004984 | 0 | 17.7708 | 0.7988 | 10 | 370 | olfactory receptor activity |
| GO:0004930 | 0 | 9.282 | 1.6862 | 11 | 781 | G-protein coupled receptor activity |
| GO:0005549 | 0 | 26.3882 | 0.1792 | 4 | 83 | odorant binding |
| GO:0099600 | 0 | 5.7586 | 2.6253 | 11 | 1216 | transmembrane receptor activity |
| GO:0060089 | 0 | 5.1955 | 3.2493 | 12 | 1505 | molecular transducer activity |
| GO:0038023 | 0 | 5.4958 | 2.7398 | 11 | 1269 | signaling receptor activity |
| GO:0050683 | 0.0022 | Inf | 0.0022 | 1 | 1 | AF-1 domain binding |
| GO:0046811 | 0.0043 | 476.1515 | 0.0043 | 1 | 2 | histone deacetylase inhibitor activity |
| GO:0005160 | 0.005 | 20.8338 | 0.1058 | 2 | 49 | transforming growth factor beta receptor binding |
| GO:0035939 | 0.0065 | 238.0606 | 0.0065 | 1 | 3 | microsatellite binding |
| GO:0004522 | 0.0086 | 158.697 | 0.0086 | 1 | 4 | ribonuclease A activity |
| GO:0051430 | 0.0086 | 158.697 | 0.0086 | 1 | 4 | corticotropin-releasing hormone receptor 1 binding |
| GO:0051431 | 0.0086 | 158.697 | 0.0086 | 1 | 4 | corticotropin-releasing hormone receptor 2 binding |
| GOMFID | Pvalue | OddsRatio | ExpCount | Count | Size | Term |
| GO:0008140 | 0.0032 | 437.0556 | 0.0032 | 1 | 10 | cAMP response element binding protein binding |
| GO:0035575 | 0.0048 | 280.875 | 0.0048 | 1 | 15 | histone demethylase activity (H4-K20 specific) |
| GO:0071889 | 0.0063 | 206.8947 | 0.0064 | 1 | 20 | 14-3-3 protein binding |
| GOMFID | Pvalue | OddsRatio | ExpCount | Count | Size | Term |
| GO:0004984 | 0 | 10.2064 | 0.8458 | 7 | 370 | olfactory receptor activity |
| GO:0004930 | 3e-04 | 5.5217 | 1.7854 | 8 | 781 | G-protein coupled receptor activity |
| GO:0035575 | 5e-04 | 71.0362 | 0.0343 | 2 | 15 | histone demethylase activity (H4-K20 specific) |
| GO:0005132 | 7e-04 | 61.5569 | 0.0389 | 2 | 17 | type I interferon receptor binding |
| GO:0032451 | 0.0032 | 26.3479 | 0.0846 | 2 | 37 | demethylase activity |
| GO:0004122 | 0.0046 | 448.8857 | 0.0046 | 1 | 2 | cystathionine beta-synthase activity |
| GO:0008413 | 0.0046 | 448.8857 | 0.0046 | 1 | 2 | 8-oxo-7,8-dihydroguanosine triphosphate pyrophosphatase activity |
| GO:0035539 | 0.0046 | 448.8857 | 0.0046 | 1 | 2 | 8-oxo-7,8-dihydrodeoxyguanosine triphosphate pyrophosphatase activity |
| GO:0099600 | 0.0053 | 3.4305 | 2.7798 | 8 | 1216 | transmembrane receptor activity |
| GO:0038023 | 0.0069 | 3.2743 | 2.9009 | 8 | 1269 | signaling receptor activity |
| GOMFID | Pvalue | OddsRatio | ExpCount | Count | Size | Term |
| GO:0004596 | 0.0012 | 49.1303 | 0.0531 | 2 | 9 | peptide alpha-N-acetyltransferase activity |
| GO:0016740 | 0.0049 | 2.0178 | 12.437 | 22 | 2106 | transferase activity |
| GO:0005130 | 0.0059 | Inf | 0.0059 | 1 | 1 | granulocyte colony-stimulating factor receptor binding |
| GO:0008962 | 0.0059 | Inf | 0.0059 | 1 | 1 | phosphatidylglycerophosphatase activity |
| GO:0042163 | 0.0059 | Inf | 0.0059 | 1 | 1 | interleukin-12 beta subunit binding |
| GO:0045513 | 0.0059 | Inf | 0.0059 | 1 | 1 | interleukin-27 binding |
| GO:0052858 | 0.0059 | Inf | 0.0059 | 1 | 1 | peptidyl-lysine N-acetyltransferase activity, acting on acetyl phosphate as donor |
| GO:0072572 | 0.0059 | Inf | 0.0059 | 1 | 1 | poly-ADP-D-ribose binding |
| GO:0004842 | 0.0066 | 3.4001 | 2.2028 | 7 | 373 | ubiquitin-protein transferase activity |
| GOMFID | Pvalue | OddsRatio | ExpCount | Count | Size | Term |
| GO:0004062 | 1e-04 | 186.9048 | 0.0168 | 2 | 6 | aryl sulfotransferase activity |
| GO:0005130 | 0.0028 | Inf | 0.0028 | 1 | 1 | granulocyte colony-stimulating factor receptor binding |
| GO:0043532 | 0.0028 | Inf | 0.0028 | 1 | 1 | angiostatin binding |
| GO:0004161 | 0.0056 | 365.186 | 0.0056 | 1 | 2 | dimethylallyltranstransferase activity |
| GO:0004337 | 0.0056 | 365.186 | 0.0056 | 1 | 2 | geranyltranstransferase activity |
| GO:0035614 | 0.0056 | 365.186 | 0.0056 | 1 | 2 | snRNA stem-loop binding |
| GO:0042030 | 0.0056 | 365.186 | 0.0056 | 1 | 2 | ATPase inhibitor activity |
| GO:0008009 | 0.0079 | 16.2091 | 0.1341 | 2 | 48 | chemokine activity |
| GO:0004740 | 0.0084 | 182.5814 | 0.0084 | 1 | 3 | pyruvate dehydrogenase (acetyl-transferring) kinase activity |
| GO:0016503 | 0.0084 | 182.5814 | 0.0084 | 1 | 3 | pheromone receptor activity |
| GOMFID | Pvalue | OddsRatio | ExpCount | Count | Size | Term |
| GO:0004930 | 0 | 9.3266 | 1.835 | 12 | 781 | G-protein coupled receptor activity |
| GO:0004984 | 0 | 11.6967 | 0.8693 | 8 | 370 | olfactory receptor activity |
| GO:0099600 | 0 | 6.5324 | 2.857 | 13 | 1216 | transmembrane receptor activity |
| GO:0038023 | 0 | 6.2339 | 2.9815 | 13 | 1269 | signaling receptor activity |
| GO:0060089 | 0 | 5.1622 | 3.536 | 13 | 1505 | molecular transducer activity |
| GO:0050683 | 0.0023 | Inf | 0.0023 | 1 | 1 | AF-1 domain binding |
| GO:0070180 | 0.0023 | Inf | 0.0023 | 1 | 1 | large ribosomal subunit rRNA binding |
| GO:0017077 | 0.0047 | 436.3889 | 0.0047 | 1 | 2 | oxidative phosphorylation uncoupler activity |
| GO:0031696 | 0.0047 | 436.3889 | 0.0047 | 1 | 2 | alpha-2C adrenergic receptor binding |
| GO:0046811 | 0.0047 | 436.3889 | 0.0047 | 1 | 2 | histone deacetylase inhibitor activity |
| GO:0004938 | 0.007 | 218.1806 | 0.007 | 1 | 3 | alpha2-adrenergic receptor activity |
| GO:0031692 | 0.007 | 218.1806 | 0.007 | 1 | 3 | alpha-1B adrenergic receptor binding |
| GO:0032795 | 0.007 | 218.1806 | 0.007 | 1 | 3 | heterotrimeric G-protein binding |
| GO:0035939 | 0.007 | 218.1806 | 0.007 | 1 | 3 | microsatellite binding |
| GO:0001601 | 0.0094 | 145.4444 | 0.0094 | 1 | 4 | peptide YY receptor activity |
| GO:0051380 | 0.0094 | 145.4444 | 0.0094 | 1 | 4 | norepinephrine binding |
| GO:0051430 | 0.0094 | 145.4444 | 0.0094 | 1 | 4 | corticotropin-releasing hormone receptor 1 binding |
| GO:0051431 | 0.0094 | 145.4444 | 0.0094 | 1 | 4 | corticotropin-releasing hormone receptor 2 binding |
| GOMFID | Pvalue | OddsRatio | ExpCount | Count | Size | Term |
| GO:0004984 | 0 | 12.3423 | 0.9398 | 9 | 370 | olfactory receptor activity |
| GO:0038023 | 0 | 4.927 | 3.2233 | 12 | 1269 | signaling receptor activity |
| GO:0060089 | 1e-04 | 4.5876 | 3.8227 | 13 | 1505 | molecular transducer activity |
| GO:0004930 | 1e-04 | 5.8272 | 1.9271 | 9 | 778 | G-protein coupled receptor activity |
| GO:0099600 | 2e-04 | 4.5653 | 3.0886 | 11 | 1216 | transmembrane receptor activity |
| GO:0051082 | 0.0017 | 13.9148 | 0.2388 | 3 | 94 | unfolded protein binding |
| GO:0042974 | 0.0061 | 18.7368 | 0.1168 | 2 | 46 | retinoic acid receptor binding |
| GO:0016503 | 0.0076 | 201.359 | 0.0076 | 1 | 3 | pheromone receptor activity |
| GOMFID | Pvalue | OddsRatio | ExpCount | Count | Size | Term |
| GO:0008147 | 0 | Inf | 0.0036 | 2 | 2 | structural constituent of bone |
| GO:0004984 | 4e-04 | 9.1453 | 0.6579 | 5 | 370 | olfactory receptor activity |
| GO:0005125 | 5e-04 | 12.2504 | 0.3823 | 4 | 215 | cytokine activity |
| GO:0004666 | 0.0036 | 582.1852 | 0.0036 | 1 | 2 | prostaglandin-endoperoxide synthase activity |
| GO:0005153 | 0.0036 | 582.1852 | 0.0036 | 1 | 2 | interleukin-8 receptor binding |
| GO:0071862 | 0.0036 | 582.1852 | 0.0036 | 1 | 2 | protein phosphatase type 1 activator activity |
| GO:0008853 | 0.0053 | 291.0741 | 0.0053 | 1 | 3 | exodeoxyribonuclease III activity |
| GO:0015379 | 0.0071 | 194.037 | 0.0071 | 1 | 4 | potassium:chloride symporter activity |
| GO:0022820 | 0.0071 | 194.037 | 0.0071 | 1 | 4 | potassium ion symporter activity |
| GO:0046848 | 0.0071 | 194.037 | 0.0071 | 1 | 4 | hydroxyapatite binding |
| GO:0005127 | 0.0089 | 145.5185 | 0.0089 | 1 | 5 | ciliary neurotrophic factor receptor binding |
| GO:0032405 | 0.0089 | 145.5185 | 0.0089 | 1 | 5 | MutLalpha complex binding |
| GO:0032407 | 0.0089 | 145.5185 | 0.0089 | 1 | 5 | MutSalpha complex binding |
| GO:0005126 | 0.0098 | 7.4893 | 0.4476 | 3 | 261 | cytokine receptor binding |
| GOMFID | Pvalue | OddsRatio | ExpCount | Count | Size | Term |
| GO:0045545 | 3e-04 | 128.9053 | 0.0264 | 2 | 5 | syndecan binding |
| GO:0008903 | 0.0053 | Inf | 0.0053 | 1 | 1 | hydroxypyruvate isomerase activity |
| GO:0047166 | 0.0053 | Inf | 0.0053 | 1 | 1 | 1-alkenylglycerophosphoethanolamine O-acyltransferase activity |
| GO:0003682 | 0.0083 | 3.2555 | 2.3085 | 7 | 438 | chromatin binding |
| GOMFID | Pvalue | OddsRatio | ExpCount | Count | Size | Term |
| GO:0004984 | 0 | 33.9624 | 0.4229 | 8 | 370 | olfactory receptor activity |
| GO:0004930 | 0 | 15.4794 | 0.8927 | 8 | 781 | G-protein coupled receptor activity |
| GO:0099600 | 0 | 12.0323 | 1.3899 | 9 | 1216 | transmembrane receptor activity |
| GO:0038023 | 0 | 11.4841 | 1.4505 | 9 | 1269 | signaling receptor activity |
| GO:0060089 | 0 | 9.5147 | 1.7202 | 9 | 1505 | molecular transducer activity |
| GO:0038100 | 0.0023 | 925.2353 | 0.0023 | 1 | 2 | nodal binding |
| GOMFID | Pvalue | OddsRatio | ExpCount | Count | Size | Term |
| GO:0004984 | 0 | 23.3927 | 0.3289 | 5 | 370 | olfactory receptor activity |
| GO:0035575 | 1e-04 | 201.5513 | 0.0133 | 2 | 15 | histone demethylase activity (H4-K20 specific) |
| GO:0008519 | 2e-04 | 124.7063 | 0.0204 | 2 | 23 | ammonium transmembrane transporter activity |
| GO:0004930 | 4e-04 | 10.7088 | 0.6943 | 5 | 781 | G-protein coupled receptor activity |
| GO:0032451 | 5e-04 | 74.7571 | 0.0329 | 2 | 37 | demethylase activity |
| GO:0099600 | 0.003 | 6.6625 | 1.081 | 5 | 1216 | transmembrane receptor activity |
| GO:0038023 | 0.0036 | 6.3599 | 1.1281 | 5 | 1269 | signaling receptor activity |
| GO:0060089 | 0.0076 | 5.2719 | 1.3379 | 5 | 1505 | molecular transducer activity |
| GO:0042393 | 0.0092 | 15.8232 | 0.1476 | 2 | 166 | histone binding |
| GOMFID | Pvalue | OddsRatio | ExpCount | Count | Size | Term |
| GO:0004124 | 0.002 | Inf | 0.002 | 1 | 1 | cysteine synthase activity |
| GO:0031857 | 0.002 | Inf | 0.002 | 1 | 1 | type 1 parathyroid hormone receptor binding |
| GO:0050421 | 0.002 | Inf | 0.002 | 1 | 1 | nitrite reductase (NO-forming) activity |
| GO:0070025 | 0.002 | Inf | 0.002 | 1 | 1 | carbon monoxide binding |
| GO:1904047 | 0.002 | Inf | 0.002 | 1 | 1 | S-adenosyl-L-methionine binding |
| GO:0019825 | 0.0024 | 30.749 | 0.0732 | 2 | 36 | oxygen binding |
| GO:0004122 | 0.0041 | 506.9355 | 0.0041 | 1 | 2 | cystathionine beta-synthase activity |
| GO:0005153 | 0.0041 | 506.9355 | 0.0041 | 1 | 2 | interleukin-8 receptor binding |
| GO:0070026 | 0.0041 | 506.9355 | 0.0041 | 1 | 2 | nitric oxide binding |
| GO:0016661 | 0.0061 | 253.4516 | 0.0061 | 1 | 3 | oxidoreductase activity, acting on other nitrogenous compounds as donors |
| GO:0004984 | 0.0064 | 5.9914 | 0.7518 | 4 | 370 | olfactory receptor activity |
| GO:0008097 | 0.0081 | 168.957 | 0.0081 | 1 | 4 | 5S rRNA binding |
| GOMFID | Pvalue | OddsRatio | ExpCount | Count | Size | Term |
| GO:0051428 | 6e-04 | 65.4125 | 0.0367 | 2 | 17 | peptide hormone receptor binding |
| GO:0022829 | 0.001 | 49.0438 | 0.0475 | 2 | 22 | wide pore channel activity |
| GO:0004124 | 0.0022 | Inf | 0.0022 | 1 | 1 | cysteine synthase activity |
| GO:0031857 | 0.0022 | Inf | 0.0022 | 1 | 1 | type 1 parathyroid hormone receptor binding |
| GO:0050421 | 0.0022 | Inf | 0.0022 | 1 | 1 | nitrite reductase (NO-forming) activity |
| GO:0070025 | 0.0022 | Inf | 0.0022 | 1 | 1 | carbon monoxide binding |
| GO:1904047 | 0.0022 | Inf | 0.0022 | 1 | 1 | S-adenosyl-L-methionine binding |
| GO:0004122 | 0.0043 | 476.1515 | 0.0043 | 1 | 2 | cystathionine beta-synthase activity |
| GO:0008260 | 0.0043 | 476.1515 | 0.0043 | 1 | 2 | 3-oxoacid CoA-transferase activity |
| GO:0046811 | 0.0043 | 476.1515 | 0.0043 | 1 | 2 | histone deacetylase inhibitor activity |
| GO:0070026 | 0.0043 | 476.1515 | 0.0043 | 1 | 2 | nitric oxide binding |
| GO:0004930 | 0.006 | 4.1306 | 1.6862 | 6 | 781 | G-protein coupled receptor activity |
| GO:0004663 | 0.0065 | 238.0606 | 0.0065 | 1 | 3 | Rab geranylgeranyltransferase activity |
| GO:0016661 | 0.0065 | 238.0606 | 0.0065 | 1 | 3 | oxidoreductase activity, acting on other nitrogenous compounds as donors |
| GO:0004984 | 0.008 | 5.5913 | 0.7988 | 4 | 370 | olfactory receptor activity |
| GO:0051430 | 0.0086 | 158.697 | 0.0086 | 1 | 4 | corticotropin-releasing hormone receptor 1 binding |
| GO:0051431 | 0.0086 | 158.697 | 0.0086 | 1 | 4 | corticotropin-releasing hormone receptor 2 binding |
| GOMFID | Pvalue | OddsRatio | ExpCount | Count | Size | Term |
| GO:0004984 | 0 | 22.4547 | 0.6814 | 10 | 370 | olfactory receptor activity |
| GO:0004930 | 0 | 11.8643 | 1.4382 | 11 | 781 | G-protein coupled receptor activity |
| GO:0099600 | 0 | 8.5099 | 2.2393 | 12 | 1216 | transmembrane receptor activity |
| GO:0038023 | 0 | 8.1213 | 2.3369 | 12 | 1269 | signaling receptor activity |
| GO:0060089 | 0 | 6.726 | 2.7715 | 12 | 1505 | molecular transducer activity |
| GOMFID | Pvalue | OddsRatio | ExpCount | Count | Size | Term |
| GO:0005125 | 7e-04 | 7.845 | 0.7099 | 5 | 215 | cytokine activity |
| GO:0005149 | 0.0011 | 48.2554 | 0.0495 | 2 | 15 | interleukin-1 receptor binding |
| GO:0008198 | 0.0022 | 33.0042 | 0.0693 | 2 | 21 | ferrous iron binding |
| GO:0004853 | 0.0033 | Inf | 0.0033 | 1 | 1 | uroporphyrinogen decarboxylase activity |
| GO:0005140 | 0.0033 | Inf | 0.0033 | 1 | 1 | interleukin-9 receptor binding |
| GO:0022894 | 0.0033 | Inf | 0.0033 | 1 | 1 | Intermediate conductance calcium-activated potassium channel activity |
| GO:0031861 | 0.0033 | Inf | 0.0033 | 1 | 1 | prolactin-releasing peptide receptor binding |
| GO:0035438 | 0.0033 | Inf | 0.0033 | 1 | 1 | cyclic-di-GMP binding |
| GO:0061507 | 0.0033 | Inf | 0.0033 | 1 | 1 | cyclic-GMP-AMP binding |
| GO:0003868 | 0.0066 | 307.7451 | 0.0066 | 1 | 2 | 4-hydroxyphenylpyruvate dioxygenase activity |
| GO:0071862 | 0.0066 | 307.7451 | 0.0066 | 1 | 2 | protein phosphatase type 1 activator activity |
| GO:0005094 | 0.0099 | 153.8627 | 0.0099 | 1 | 3 | Rho GDP-dissociation inhibitor activity |
| GO:0031720 | 0.0099 | 153.8627 | 0.0099 | 1 | 3 | haptoglobin binding |
| GOMFID | Pvalue | OddsRatio | ExpCount | Count | Size | Term |
| GO:0004984 | 0 | 19.2734 | 0.9868 | 13 | 370 | olfactory receptor activity |
| GO:0099600 | 0 | 8.2275 | 3.2431 | 17 | 1216 | transmembrane receptor activity |
| GO:0038023 | 0 | 7.8504 | 3.3844 | 17 | 1269 | signaling receptor activity |
| GO:0004930 | 0 | 8.7192 | 2.0829 | 13 | 781 | G-protein coupled receptor activity |
| GO:0060089 | 0 | 6.4975 | 4.0138 | 17 | 1505 | molecular transducer activity |
| GO:0032395 | 0 | 172.5165 | 0.0267 | 3 | 10 | MHC class II receptor activity |
| GO:0005549 | 0 | 27.0755 | 0.2214 | 5 | 83 | odorant binding |
| GO:0042605 | 0.0018 | 35.6455 | 0.064 | 2 | 24 | peptide antigen binding |
| GO:0008613 | 0.0027 | Inf | 0.0027 | 1 | 1 | diuretic hormone activity |
| GO:1990259 | 0.0027 | Inf | 0.0027 | 1 | 1 | histone-glutamine methyltransferase activity |
| GOMFID | Pvalue | OddsRatio | ExpCount | Count | Size | Term |
| GO:0004984 | 0 | 11.0045 | 0.6814 | 6 | 370 | olfactory receptor activity |
| GO:0004930 | 4e-04 | 6.1437 | 1.4382 | 7 | 781 | G-protein coupled receptor activity |
| GO:0005549 | 5e-04 | 22.5562 | 0.1528 | 3 | 83 | odorant binding |
| GO:0099600 | 0.0012 | 4.5762 | 2.2393 | 8 | 1216 | transmembrane receptor activity |
| GO:0003755 | 0.0024 | 30.5673 | 0.0737 | 2 | 40 | peptidyl-prolyl cis-trans isomerase activity |
| GO:0060089 | 0.0047 | 3.6192 | 2.7715 | 8 | 1505 | molecular transducer activity |
| GO:0038023 | 0.007 | 3.645 | 2.3369 | 7 | 1269 | signaling receptor activity |
| GO:0016972 | 0.0073 | 187.0952 | 0.0074 | 1 | 4 | thiol oxidase activity |
| GOMFID | Pvalue | OddsRatio | ExpCount | Count | Size | Term |
| GO:0004984 | 0 | 17.7708 | 0.7988 | 10 | 370 | olfactory receptor activity |
| GO:0004930 | 0 | 9.282 | 1.6862 | 11 | 781 | G-protein coupled receptor activity |
| GO:0099600 | 0 | 7.4672 | 2.6253 | 13 | 1216 | transmembrane receptor activity |
| GO:0038023 | 0 | 7.1259 | 2.7398 | 13 | 1269 | signaling receptor activity |
| GO:0060089 | 0 | 6.6775 | 3.2493 | 14 | 1505 | molecular transducer activity |
| GO:0005549 | 0 | 26.3882 | 0.1792 | 4 | 83 | odorant binding |
| GO:0042605 | 0.0012 | 44.5795 | 0.0518 | 2 | 24 | peptide antigen binding |
| GO:0030294 | 0.0022 | Inf | 0.0022 | 1 | 1 | receptor signaling protein tyrosine kinase inhibitor activity |
| GO:0004122 | 0.0043 | 476.1515 | 0.0043 | 1 | 2 | cystathionine beta-synthase activity |
| GO:0033906 | 0.0043 | 476.1515 | 0.0043 | 1 | 2 | hyaluronoglucuronidase activity |
| GO:0030971 | 0.0048 | 21.288 | 0.1036 | 2 | 48 | receptor tyrosine kinase binding |
| GO:0070905 | 0.0065 | 238.0606 | 0.0065 | 1 | 3 | serine binding |
| GO:0004035 | 0.0086 | 158.697 | 0.0086 | 1 | 4 | alkaline phosphatase activity |
| GO:0004522 | 0.0086 | 158.697 | 0.0086 | 1 | 4 | ribonuclease A activity |
| GO:0001618 | 0.0092 | 15.0471 | 0.1447 | 2 | 67 | virus receptor activity |
| GOMFID | Pvalue | OddsRatio | ExpCount | Count | Size | Term |
| GO:0019864 | 1e-04 | 142.8545 | 0.0183 | 2 | 12 | IgG binding |
| GO:0019763 | 0.0076 | 170.8696 | 0.0076 | 1 | 5 | immunoglobulin receptor activity |
| GO:0031849 | 0.0091 | 136.687 | 0.0091 | 1 | 6 | olfactory receptor binding |
| GO:0042608 | 0.0091 | 136.687 | 0.0091 | 1 | 6 | T cell receptor binding |
| GOMFID | Pvalue | OddsRatio | ExpCount | Count | Size | Term |
| GO:0004984 | 0 | 14.694 | 1.1043 | 12 | 370 | olfactory receptor activity |
| GO:0004930 | 0 | 6.6574 | 2.3309 | 12 | 781 | G-protein coupled receptor activity |
| GO:0099600 | 0 | 5.1174 | 3.6292 | 14 | 1216 | transmembrane receptor activity |
| GO:0038023 | 0 | 4.8834 | 3.7873 | 14 | 1269 | signaling receptor activity |
| GO:0060089 | 1e-04 | 4.0432 | 4.4917 | 14 | 1505 | molecular transducer activity |
| GOMFID | Pvalue | OddsRatio | ExpCount | Count | Size | Term |
| GO:0004984 | 0 | 13.828 | 1.0573 | 11 | 370 | olfactory receptor activity |
| GO:0004930 | 0 | 6.2744 | 2.2317 | 11 | 781 | G-protein coupled receptor activity |
| GO:0099600 | 0 | 4.8966 | 3.4747 | 13 | 1216 | transmembrane receptor activity |
| GO:0038023 | 0 | 4.6728 | 3.6262 | 13 | 1269 | signaling receptor activity |
| GO:0060089 | 2e-04 | 3.8694 | 4.3005 | 13 | 1505 | molecular transducer activity |
| GO:0019864 | 5e-04 | 72.9907 | 0.0343 | 2 | 12 | IgG binding |
| GO:0004601 | 0.0047 | 21.435 | 0.1029 | 2 | 36 | peroxidase activity |
| GO:0031720 | 0.0085 | 178.4205 | 0.0086 | 1 | 3 | haptoglobin binding |
| GOMFID | Pvalue | OddsRatio | ExpCount | Count | Size | Term |
| GO:0004984 | 0 | 14.1745 | 0.8458 | 9 | 370 | olfactory receptor activity |
| GO:0004930 | 0 | 6.7255 | 1.7294 | 9 | 778 | G-protein coupled receptor activity |
| GO:0099600 | 3e-04 | 4.6262 | 2.7798 | 10 | 1216 | transmembrane receptor activity |
| GO:0038023 | 4e-04 | 4.4153 | 2.9009 | 10 | 1269 | signaling receptor activity |
| GO:0060089 | 0.0015 | 3.6576 | 3.4404 | 10 | 1505 | molecular transducer activity |
| GO:0016503 | 0.0068 | 224.4286 | 0.0069 | 1 | 3 | pheromone receptor activity |
| GOMFID | Pvalue | OddsRatio | ExpCount | Count | Size | Term |
| GO:0099600 | 1e-04 | 5.2307 | 2.5481 | 10 | 1216 | transmembrane receptor activity |
| GO:0060089 | 2e-04 | 4.7594 | 3.1537 | 11 | 1505 | molecular transducer activity |
| GO:0004930 | 2e-04 | 6.1856 | 1.6366 | 8 | 781 | G-protein coupled receptor activity |
| GO:0038023 | 9e-04 | 4.3021 | 2.6592 | 9 | 1269 | signaling receptor activity |
| GO:0004666 | 0.0042 | 491.0625 | 0.0042 | 1 | 2 | prostaglandin-endoperoxide synthase activity |
| GO:0004756 | 0.0042 | 491.0625 | 0.0042 | 1 | 2 | selenide, water dikinase activity |
| GO:0017098 | 0.0042 | 491.0625 | 0.0042 | 1 | 2 | sulfonylurea receptor binding |
| GO:0004980 | 0.0063 | 245.5156 | 0.0063 | 1 | 3 | melanocyte-stimulating hormone receptor activity |
| GO:0050473 | 0.0063 | 245.5156 | 0.0063 | 1 | 3 | arachidonate 15-lipoxygenase activity |
| GO:0004984 | 0.0072 | 5.7844 | 0.7753 | 4 | 370 | olfactory receptor activity |
| GO:0001601 | 0.0084 | 163.6667 | 0.0084 | 1 | 4 | peptide YY receptor activity |
| GO:0001602 | 0.0084 | 163.6667 | 0.0084 | 1 | 4 | pancreatic polypeptide receptor activity |
| GO:0015272 | 0.0084 | 163.6667 | 0.0084 | 1 | 4 | ATP-activated inward rectifier potassium channel activity |
| GOMFID | Pvalue | OddsRatio | ExpCount | Count | Size | Term |
| GO:0004984 | 0 | 13.5717 | 0.7753 | 8 | 370 | olfactory receptor activity |
| GO:0004930 | 0 | 7.2586 | 1.6366 | 9 | 781 | G-protein coupled receptor activity |
| GO:0099600 | 1e-04 | 5.2307 | 2.5481 | 10 | 1216 | transmembrane receptor activity |
| GO:0038023 | 2e-04 | 4.9922 | 2.6592 | 10 | 1269 | signaling receptor activity |
| GO:0005549 | 7e-04 | 19.5437 | 0.1739 | 3 | 83 | odorant binding |
| GO:0060089 | 7e-04 | 4.1355 | 3.1537 | 10 | 1505 | molecular transducer activity |
| GO:0003948 | 0.0021 | Inf | 0.0021 | 1 | 1 | N4-(beta-N-acetylglucosaminyl)-L-asparaginase activity |
| GO:0004756 | 0.0042 | 491.0625 | 0.0042 | 1 | 2 | selenide, water dikinase activity |
| GO:0004522 | 0.0084 | 163.6667 | 0.0084 | 1 | 4 | ribonuclease A activity |
| GOMFID | Pvalue | OddsRatio | ExpCount | Count | Size | Term |
| GO:0005307 | 0.0011 | Inf | 0.0011 | 1 | 1 | choline:sodium symporter activity |
| GO:0004657 | 0.0022 | 983.125 | 0.0022 | 1 | 2 | proline dehydrogenase activity |
| GO:0031720 | 0.0032 | 491.5312 | 0.0032 | 1 | 3 | haptoglobin binding |
| GO:0030492 | 0.0054 | 245.7344 | 0.0054 | 1 | 5 | hemoglobin binding |
| GO:0033265 | 0.0065 | 196.575 | 0.0065 | 1 | 6 | choline binding |
| GO:0005179 | 0.0069 | 18.1055 | 0.1263 | 2 | 117 | hormone activity |
| GO:0016175 | 0.0086 | 140.3929 | 0.0086 | 1 | 8 | superoxide-generating NADPH oxidase activity |
| GOMFID | Pvalue | OddsRatio | ExpCount | Count | Size | Term |
| GO:0004556 | 0 | 3372 | 0.0032 | 3 | 5 | alpha-amylase activity |
| GO:0004553 | 0 | 77.0985 | 0.0572 | 3 | 90 | hydrolase activity, hydrolyzing O-glycosyl compounds |
| GOMFID | Pvalue | OddsRatio | ExpCount | Count | Size | Term |
| GO:0005125 | 0.001 | 18.3031 | 0.2048 | 3 | 215 | cytokine activity |
| GO:0005126 | 0.0019 | 14.7053 | 0.2534 | 3 | 266 | cytokine receptor binding |
| GO:0005153 | 0.0019 | 1123.7143 | 0.0019 | 1 | 2 | interleukin-8 receptor binding |
| GO:0015057 | 0.0048 | 280.875 | 0.0048 | 1 | 5 | thrombin receptor activity |
| GO:0046920 | 0.0076 | 160.4694 | 0.0076 | 1 | 8 | alpha-(1->3)-fucosyltransferase activity |
| GOMFID | Pvalue | OddsRatio | ExpCount | Count | Size | Term |
| GO:0004556 | 0 | 1310.4167 | 0.0067 | 3 | 5 | alpha-amylase activity |
| GO:0004553 | 2e-04 | 29.9617 | 0.12 | 3 | 90 | hydrolase activity, hydrolyzing O-glycosyl compounds |
| GO:0046811 | 0.0027 | 786.3 | 0.0027 | 1 | 2 | histone deacetylase inhibitor activity |
| GO:0051430 | 0.0053 | 262.0667 | 0.0053 | 1 | 4 | corticotropin-releasing hormone receptor 1 binding |
| GO:0051431 | 0.0053 | 262.0667 | 0.0053 | 1 | 4 | corticotropin-releasing hormone receptor 2 binding |
| GOMFID | Pvalue | OddsRatio | ExpCount | Count | Size | Term |
| GO:0004984 | 0.0018 | 6.3699 | 0.8928 | 5 | 370 | olfactory receptor activity |
| GO:0004607 | 0.0024 | Inf | 0.0024 | 1 | 1 | phosphatidylcholine-sterol O-acyltransferase activity |
| GO:0036455 | 0.0024 | Inf | 0.0024 | 1 | 1 | iron-sulfur transferase activity |
| GO:0001850 | 0.0048 | 424.5676 | 0.0048 | 1 | 2 | complement component C3a binding |
| GO:0001851 | 0.0048 | 424.5676 | 0.0048 | 1 | 2 | complement component C3b binding |
| GO:0004663 | 0.0072 | 212.2703 | 0.0072 | 1 | 3 | Rab geranylgeranyltransferase activity |
| GO:0031871 | 0.0072 | 212.2703 | 0.0072 | 1 | 3 | proteinase activated receptor binding |
| GO:0034186 | 0.0072 | 212.2703 | 0.0072 | 1 | 3 | apolipoprotein A-I binding |
| GOMFID | Pvalue | OddsRatio | ExpCount | Count | Size | Term |
| GO:0004984 | 0 | 15.4254 | 0.7049 | 8 | 370 | olfactory receptor activity |
| GO:0004930 | 0 | 8.2972 | 1.4878 | 9 | 781 | G-protein coupled receptor activity |
| GO:0005125 | 0 | 14.7695 | 0.4096 | 5 | 215 | cytokine activity |
| GO:0099600 | 1e-04 | 6.0166 | 2.3165 | 10 | 1216 | transmembrane receptor activity |
| GO:0038023 | 1e-04 | 5.7423 | 2.4174 | 10 | 1269 | signaling receptor activity |
| GO:0060089 | 3e-04 | 4.7569 | 2.867 | 10 | 1505 | molecular transducer activity |
| GO:0005130 | 0.0019 | Inf | 0.0019 | 1 | 1 | granulocyte colony-stimulating factor receptor binding |
| GO:0004666 | 0.0038 | 541.9655 | 0.0038 | 1 | 2 | prostaglandin-endoperoxide synthase activity |
| GO:0005127 | 0.0095 | 135.4655 | 0.0095 | 1 | 5 | ciliary neurotrophic factor receptor binding |
| GO:0048248 | 0.0095 | 135.4655 | 0.0095 | 1 | 5 | CXCR3 chemokine receptor binding |
| GOMFID | Pvalue | OddsRatio | ExpCount | Count | Size | Term |
| GO:0005153 | 0.0018 | 1210.2308 | 0.0018 | 1 | 2 | interleukin-8 receptor binding |
| GO:0046977 | 0.0062 | 201.641 | 0.0062 | 1 | 7 | TAP binding |
| GOMFID | Pvalue | OddsRatio | ExpCount | Count | Size | Term |
| GO:0004984 | 0 | 12.874 | 0.7049 | 7 | 370 | olfactory receptor activity |
| GO:0004930 | 0 | 8.2972 | 1.4878 | 9 | 781 | G-protein coupled receptor activity |
| GO:0099600 | 3e-04 | 5.1524 | 2.3165 | 9 | 1216 | transmembrane receptor activity |
| GO:0038023 | 4e-04 | 4.9177 | 2.4174 | 9 | 1269 | signaling receptor activity |
| GO:0060089 | 0.0015 | 4.0743 | 2.867 | 9 | 1505 | molecular transducer activity |
| GO:0031750 | 0.0057 | 270.9655 | 0.0057 | 1 | 3 | D3 dopamine receptor binding |
| GO:0004527 | 0.0083 | 15.9673 | 0.1372 | 2 | 72 | exonuclease activity |
| GO:0008474 | 0.0095 | 135.4655 | 0.0095 | 1 | 5 | palmitoyl-(protein) hydrolase activity |
| GOMFID | Pvalue | OddsRatio | ExpCount | Count | Size | Term |
| GO:0004984 | 0 | 21.5014 | 0.9163 | 13 | 370 | olfactory receptor activity |
| GO:0004930 | 0 | 10.9094 | 1.9342 | 14 | 781 | G-protein coupled receptor activity |
| GO:0099600 | 0 | 6.7587 | 3.0114 | 14 | 1216 | transmembrane receptor activity |
| GO:0038023 | 0 | 6.4496 | 3.1427 | 14 | 1269 | signaling receptor activity |
| GO:0060089 | 0 | 5.9643 | 3.7271 | 15 | 1505 | molecular transducer activity |
| GO:0030294 | 0.0025 | Inf | 0.0025 | 1 | 1 | receptor signaling protein tyrosine kinase inhibitor activity |
| GO:0005179 | 0.003 | 11.3999 | 0.2898 | 3 | 117 | hormone activity |
| GO:0033906 | 0.0049 | 413.3684 | 0.005 | 1 | 2 | hyaluronoglucuronidase activity |
| GO:0046811 | 0.0049 | 413.3684 | 0.005 | 1 | 2 | histone deacetylase inhibitor activity |
| GO:0051430 | 0.0099 | 137.7719 | 0.0099 | 1 | 4 | corticotropin-releasing hormone receptor 1 binding |
| GO:0051431 | 0.0099 | 137.7719 | 0.0099 | 1 | 4 | corticotropin-releasing hormone receptor 2 binding |
| GOMFID | Pvalue | OddsRatio | ExpCount | Count | Size | Term |
| GO:1901338 | 0.002 | 34.9253 | 0.0676 | 2 | 15 | catecholamine binding |
| GO:0004930 | 0.0025 | 3.1694 | 3.5211 | 10 | 781 | G-protein coupled receptor activity |
| GO:0042813 | 0.0036 | 25.2158 | 0.0902 | 2 | 20 | Wnt-activated receptor activity |
| GO:0047166 | 0.0045 | Inf | 0.0045 | 1 | 1 | 1-alkenylglycerophosphoethanolamine O-acyltransferase activity |
| GO:0004984 | 0.0064 | 3.8833 | 1.6681 | 6 | 370 | olfactory receptor activity |
| GO:0017147 | 0.008 | 16.1998 | 0.1353 | 2 | 30 | Wnt-protein binding |
| GO:0003875 | 0.009 | 223.9429 | 0.009 | 1 | 2 | ADP-ribosylarginine hydrolase activity |
| GO:0031696 | 0.009 | 223.9429 | 0.009 | 1 | 2 | alpha-2C adrenergic receptor binding |
| GO:0046811 | 0.009 | 223.9429 | 0.009 | 1 | 2 | histone deacetylase inhibitor activity |
| GOMFID | Pvalue | OddsRatio | ExpCount | Count | Size | Term |
| GO:0004930 | 0 | 11.4989 | 1.7358 | 13 | 781 | G-protein coupled receptor activity |
| GO:0004984 | 0 | 14.7206 | 0.8223 | 9 | 370 | olfactory receptor activity |
| GO:0099600 | 0 | 7.1273 | 2.7026 | 13 | 1216 | transmembrane receptor activity |
| GO:0038023 | 0 | 6.8016 | 2.8204 | 13 | 1269 | signaling receptor activity |
| GO:0060089 | 0 | 5.6323 | 3.3449 | 13 | 1505 | molecular transducer activity |
| GO:0033038 | 7e-04 | 59.4583 | 0.04 | 2 | 18 | bitter taste receptor activity |
| GO:0004603 | 0.0022 | Inf | 0.0022 | 1 | 1 | phenylethanolamine N-methyltransferase activity |
| GO:0004821 | 0.0044 | 462.1176 | 0.0044 | 1 | 2 | histidine-tRNA ligase activity |
| GO:0031696 | 0.0044 | 462.1176 | 0.0044 | 1 | 2 | alpha-2C adrenergic receptor binding |
| GO:0003953 | 0.0067 | 231.0441 | 0.0067 | 1 | 3 | NAD+ nucleosidase activity |
| GO:0004938 | 0.0067 | 231.0441 | 0.0067 | 1 | 3 | alpha2-adrenergic receptor activity |
| GO:0031692 | 0.0067 | 231.0441 | 0.0067 | 1 | 3 | alpha-1B adrenergic receptor binding |
| GO:0031750 | 0.0067 | 231.0441 | 0.0067 | 1 | 3 | D3 dopamine receptor binding |
| GO:0032795 | 0.0067 | 231.0441 | 0.0067 | 1 | 3 | heterotrimeric G-protein binding |
| GO:0051380 | 0.0089 | 154.0196 | 0.0089 | 1 | 4 | norepinephrine binding |
| GOMFID | Pvalue | OddsRatio | ExpCount | Count | Size | Term |
| GO:0035575 | 1e-04 | 151.125 | 0.0171 | 2 | 15 | histone demethylase activity (H4-K20 specific) |
| GO:0004984 | 7e-04 | 11.9938 | 0.4229 | 4 | 370 | olfactory receptor activity |
| GO:0032451 | 8e-04 | 56.0536 | 0.0423 | 2 | 37 | demethylase activity |
| GO:0004930 | 0.0015 | 7.4118 | 0.8927 | 5 | 781 | G-protein coupled receptor activity |
| GO:0099600 | 0.0017 | 6 | 1.3899 | 6 | 1216 | transmembrane receptor activity |
| GO:0038023 | 0.0022 | 5.7272 | 1.4505 | 6 | 1269 | signaling receptor activity |
| GO:0005153 | 0.0023 | 925.2353 | 0.0023 | 1 | 2 | interleukin-8 receptor binding |
| GO:0060089 | 0.0051 | 4.7468 | 1.7202 | 6 | 1505 | molecular transducer activity |
| GO:0038036 | 0.0091 | 132.1261 | 0.0091 | 1 | 8 | sphingosine-1-phosphate receptor activity |
| GO:0046920 | 0.0091 | 132.1261 | 0.0091 | 1 | 8 | alpha-(1->3)-fucosyltransferase activity |
| GOMFID | Pvalue | OddsRatio | ExpCount | Count | Size | Term |
| GO:0004984 | 0 | 19.4822 | 0.4464 | 6 | 370 | olfactory receptor activity |
| GO:0099600 | 0 | 8.7423 | 1.4671 | 8 | 1216 | transmembrane receptor activity |
| GO:0038023 | 1e-04 | 8.3443 | 1.5311 | 8 | 1269 | signaling receptor activity |
| GO:0060089 | 2e-04 | 6.9142 | 1.8158 | 8 | 1505 | molecular transducer activity |
| GO:0004930 | 2e-04 | 8.9056 | 0.9423 | 6 | 781 | G-protein coupled receptor activity |
| GO:0008519 | 3e-04 | 88 | 0.0277 | 2 | 23 | ammonium transmembrane transporter activity |
| GO:0031851 | 0.0012 | Inf | 0.0012 | 1 | 1 | kappa-type opioid receptor binding |
| GO:0005549 | 0.0044 | 22.7277 | 0.1001 | 2 | 83 | odorant binding |
| GO:0005134 | 0.006 | 218.4028 | 0.006 | 1 | 5 | interleukin-2 receptor binding |
| GO:0043208 | 0.0096 | 124.7778 | 0.0097 | 1 | 8 | glycosphingolipid binding |
| GOMFID | Pvalue | OddsRatio | ExpCount | Count | Size | Term |
| GO:0099600 | 0 | 6.7587 | 3.0114 | 14 | 1216 | transmembrane receptor activity |
| GO:0038023 | 0 | 6.4496 | 3.1427 | 14 | 1269 | signaling receptor activity |
| GO:0004930 | 0 | 7.6219 | 1.9342 | 11 | 781 | G-protein coupled receptor activity |
| GO:0004984 | 0 | 10.9407 | 0.9163 | 8 | 370 | olfactory receptor activity |
| GO:0060089 | 0 | 5.3401 | 3.7271 | 14 | 1505 | molecular transducer activity |
| GO:0042813 | 0.0011 | 47.1201 | 0.0495 | 2 | 20 | Wnt-activated receptor activity |
| GO:0017147 | 0.0025 | 30.2722 | 0.0743 | 2 | 30 | Wnt-protein binding |
| GO:0005109 | 0.0036 | 24.9205 | 0.0892 | 2 | 36 | frizzled binding |
| GO:0031696 | 0.0049 | 413.3684 | 0.005 | 1 | 2 | alpha-2C adrenergic receptor binding |
| GO:0046811 | 0.0049 | 413.3684 | 0.005 | 1 | 2 | histone deacetylase inhibitor activity |
| GO:0005102 | 0.0064 | 3.071 | 3.4844 | 9 | 1407 | receptor binding |
| GO:0004938 | 0.0074 | 206.6711 | 0.0074 | 1 | 3 | alpha2-adrenergic receptor activity |
| GO:0031692 | 0.0074 | 206.6711 | 0.0074 | 1 | 3 | alpha-1B adrenergic receptor binding |
| GO:0032795 | 0.0074 | 206.6711 | 0.0074 | 1 | 3 | heterotrimeric G-protein binding |
| GO:0051380 | 0.0099 | 137.7719 | 0.0099 | 1 | 4 | norepinephrine binding |
| GO:0051430 | 0.0099 | 137.7719 | 0.0099 | 1 | 4 | corticotropin-releasing hormone receptor 1 binding |
| GO:0051431 | 0.0099 | 137.7719 | 0.0099 | 1 | 4 | corticotropin-releasing hormone receptor 2 binding |
| GOMFID | Pvalue | OddsRatio | ExpCount | Count | Size | Term |
| GO:0004082 | 2e-04 | 172.011 | 0.0236 | 2 | 4 | bisphosphoglycerate mutase activity |
| GO:0046538 | 2e-04 | 172.011 | 0.0236 | 2 | 4 | 2,3-bisphosphoglycerate-dependent phosphoglycerate mutase activity |
| GO:0004083 | 3e-04 | 114.6667 | 0.0295 | 2 | 5 | bisphosphoglycerate 2-phosphatase activity |
| GO:0004062 | 5e-04 | 85.9945 | 0.0354 | 2 | 6 | aryl sulfotransferase activity |
| GO:0004596 | 0.0012 | 49.1303 | 0.0531 | 2 | 9 | peptide alpha-N-acetyltransferase activity |
| GO:0050786 | 0.0018 | 38.2076 | 0.065 | 2 | 11 | RAGE receptor binding |
| GO:0004333 | 0.0059 | Inf | 0.0059 | 1 | 1 | fumarate hydratase activity |
| GO:0052858 | 0.0059 | Inf | 0.0059 | 1 | 1 | peptidyl-lysine N-acetyltransferase activity, acting on acetyl phosphate as donor |
| GO:0016866 | 0.0095 | 14.9374 | 0.1476 | 2 | 25 | intramolecular transferase activity |
| GOMFID | Pvalue | OddsRatio | ExpCount | Count | Size | Term |
| GO:0004984 | 0 | 34.3307 | 0.6344 | 12 | 370 | olfactory receptor activity |
| GO:0004930 | 0 | 15.5547 | 1.339 | 12 | 781 | G-protein coupled receptor activity |
| GO:0099600 | 0 | 9.6458 | 2.0848 | 12 | 1216 | transmembrane receptor activity |
| GO:0038023 | 0 | 9.2054 | 2.1757 | 12 | 1269 | signaling receptor activity |
| GO:0060089 | 0 | 7.6238 | 2.5803 | 12 | 1505 | molecular transducer activity |
| GO:0005140 | 0.0017 | Inf | 0.0017 | 1 | 1 | interleukin-9 receptor binding |
| GO:0005153 | 0.0034 | 604.6154 | 0.0034 | 1 | 2 | interleukin-8 receptor binding |
| GO:0038100 | 0.0034 | 604.6154 | 0.0034 | 1 | 2 | nodal binding |
| GO:0004522 | 0.0068 | 201.5128 | 0.0069 | 1 | 4 | ribonuclease A activity |
| GO:0005549 | 0.0088 | 15.4469 | 0.1423 | 2 | 83 | odorant binding |
| GOMFID | Pvalue | OddsRatio | ExpCount | Count | Size | Term |
| GO:0004984 | 2e-04 | 16.7956 | 0.3289 | 4 | 370 | olfactory receptor activity |
| GO:0004930 | 0.004 | 7.6999 | 0.6943 | 4 | 781 | G-protein coupled receptor activity |
| NA. |
| n/a |
| NA. |
| n/a |
| NA. |
| n/a |
| NA. |
| n/a |
| NA. |
| n/a |
| NA. |
| n/a |
| NA. |
| n/a |
| NA. |
| n/a |
| NA. |
| n/a |
| NA. |
| n/a |
| NA. |
| n/a |
| NA. |
| n/a |
| NA. |
| n/a |
| NA. |
| n/a |
| NA. |
| n/a |
| NA. |
| n/a |
| NA. |
| n/a |
| NA. |
| n/a |
| NA. |
| n/a |
| NA. |
| n/a |
| NA. |
| n/a |
| NA. |
| n/a |
| NA. |
| n/a |
| NA. |
| n/a |
| NA. |
| n/a |
| NA. |
| n/a |
| NA. |
| n/a |
| NA. |
| n/a |
| NA. |
| n/a |
| NA. |
| n/a |
| NA. |
| n/a |
| NA. |
| n/a |
| NA. |
| n/a |
| NA. |
| n/a |
| NA. |
| n/a |
| NA. |
| n/a |
| NA. |
| n/a |
| NA. |
| n/a |
| NA. |
| n/a |
| NA. |
| n/a |
| NA. |
| n/a |
| NA. |
| n/a |
| NA. |
| n/a |
| NA. |
| n/a |
| NA. |
| n/a |
| NA. |
| n/a |
| NA. |
| n/a |
| NA. |
| n/a |
| NA. |
| n/a |
| NA. |
| n/a |
| NA. |
| n/a |
| NA. |
| n/a |
| NA. |
| n/a |
| NA. |
| n/a |
| NA. |
| n/a |
| NA. |
| n/a |
| NA. |
| n/a |
| NA. |
| n/a |
| NA. |
| n/a |
| NA. |
| n/a |
| NA. |
| n/a |
| NA. |
| n/a |
| NA. |
| n/a |
| NA. |
| n/a |
| NA. |
| n/a |
| NA. |
| n/a |
| NA. |
| n/a |
| NA. |
| n/a |
| NA. |
| n/a |
| NA. |
| n/a |
| NA. |
| n/a |
| NA. |
| n/a |
| NA. |
| n/a |
| NA. |
| n/a |
| NA. |
| n/a |
| NA. |
| n/a |
| NA. |
| n/a |
| NA. |
| n/a |
| NA. |
| n/a |
| NA. |
| n/a |
| NA. |
| n/a |
| NA. |
| n/a |
| NA. |
| n/a |
| NA. |
| n/a |
| NA. |
| n/a |
| NA. |
| n/a |
| NA. |
| n/a |
| NA. |
| n/a |
| NA. |
| n/a |
| NA. |
| n/a |
| NA. |
| n/a |
| NA. |
| n/a |
| NA. |
| n/a |
| NA. |
| n/a |
| NA. |
| n/a |
| NA. |
| n/a |
| NA. |
| n/a |
| NA. |
| n/a |
| NA. |
| n/a |
| NA. |
| n/a |
| NA. |
| n/a |
| NA. |
| n/a |
| NA. |
| n/a |
| NA. |
| n/a |
| NA. |
| n/a |
| NA. |
| n/a |
| NA. |
| n/a |
| NA. |
| n/a |
| NA. |
| n/a |
| NA. |
| n/a |
| NA. |
| n/a |
| NA. |
| n/a |
| NA. |
| n/a |
| NA. |
| n/a |
| NA. |
| n/a |
| NA. |
| n/a |
| NA. |
| n/a |
| NA. |
| n/a |
| NA. |
| n/a |
| NA. |
| n/a |
| NA. |
| n/a |
| NA. |
| n/a |
| NA. |
| n/a |
| NA. |
| n/a |
| NA. |
| n/a |
| NA. |
| n/a |
| NA. |
| n/a |
| NA. |
| n/a |
| NA. |
| n/a |
| NA. |
| n/a |
| NA. |
| n/a |
| NA. |
| n/a |
| NA. |
| n/a |
| NA. |
| n/a |
| NA. |
| n/a |
| NA. |
| n/a |
| NA. |
| n/a |
| NA. |
| n/a |
| NA. |
| n/a |
| NA. |
| n/a |
| NA. |
| n/a |
| NA. |
| n/a |
| NA. |
| n/a |
| NA. |
| n/a |
| NA. |
| n/a |
| NA. |
| n/a |
| NA. |
| n/a |
| NA. |
| n/a |
| NA. |
| n/a |
| NA. |
| n/a |
| NA. |
| n/a |
| NA. |
| n/a |
| NA. |
| n/a |
| NA. |
| n/a |
| NA. |
| n/a |
| NA. |
| n/a |
| NA. |
| n/a |
| NA. |
| n/a |
| NA. |
| n/a |
| NA. |
| n/a |
| NA. |
| n/a |
| NA. |
| n/a |
| NA. |
| n/a |
| NA. |
| n/a |
| NA. |
| n/a |
| NA. |
| n/a |
| NA. |
| n/a |
| NA. |
| n/a |
| NA. |
| n/a |
| NA. |
| n/a |
| NA. |
| n/a |
| NA. |
| n/a |
| NA. |
| n/a |
| NA. |
| n/a |
| NA. |
| n/a |
| NA. |
| n/a |
| NA. |
| n/a |
| NA. |
| n/a |
| NA. |
| n/a |
| NA. |
| n/a |
| NA. |
| n/a |
| NA. |
| n/a |
| NA. |
| n/a |
| NA. |
| n/a |
| NA. |
| n/a |
| NA. |
| n/a |
| NA. |
| n/a |
| NA. |
| n/a |
| NA. |
| n/a |
| NA. |
| n/a |
| NA. |
| n/a |
| NA. |
| n/a |
| NA. |
| n/a |
| NA. |
| n/a |
| NA. |
| n/a |
| NA. |
| n/a |
| NA. |
| n/a |
| NA. |
| n/a |
| NA. |
| n/a |
| NA. |
| n/a |
| NA. |
| n/a |
| NA. |
| n/a |
| NA. |
| n/a |
| NA. |
| n/a |
| NA. |
| n/a |
| NA. |
| n/a |
| NA. |
| n/a |
| NA. |
| n/a |
| NA. |
| n/a |
| NA. |
| n/a |
| NA. |
| n/a |
| NA. |
| n/a |
| NA. |
| n/a |
| NA. |
| n/a |
| NA. |
| n/a |
| NA. |
| n/a |
| NA. |
| n/a |
| NA. |
| n/a |
| NA. |
| n/a |
| NA. |
| n/a |
| NA. |
| n/a |
| NA. |
| n/a |
| NA. |
| n/a |
| NA. |
| n/a |
| NA. |
| n/a |
| NA. |
| n/a |
| NA. |
| n/a |
| NA. |
| n/a |
| NA. |
| n/a |
| NA. |
| n/a |
| NA. |
| n/a |
| NA. |
| n/a |
| NA. |
| n/a |
| NA. |
| n/a |
| NA. |
| n/a |
| NA. |
| n/a |
| NA. |
| n/a |
| NA. |
| n/a |
| NA. |
| n/a |
| NA. |
| n/a |
| GOMFID | Pvalue | OddsRatio | ExpCount | Count | Size | Term |
| GO:0019731 | 3e-04 | 9.6617 | 0.5826 | 5 | 50 | antibacterial humoral response |
| GO:0070340 | 4e-04 | 171.5138 | 0.035 | 2 | 3 | detection of bacterial lipopeptide |
| GO:0031640 | 5e-04 | 12.3663 | 0.3729 | 4 | 32 | killing of cells of other organism |
| GO:0008652 | 5e-04 | 6.4624 | 1.0137 | 6 | 87 | cellular amino acid biosynthetic process |
| GO:0043401 | 9e-04 | 4.3347 | 1.9808 | 8 | 170 | steroid hormone mediated signaling pathway |
| GO:0016045 | 9e-04 | 18.4631 | 0.1981 | 3 | 17 | detection of bacterium |
| GO:0050832 | 0.0012 | 9.6133 | 0.4661 | 4 | 40 | defense response to fungus |
| GO:0002221 | 0.0013 | 4.0562 | 2.1089 | 8 | 181 | pattern recognition receptor signaling pathway |
| GO:0032962 | 0.0013 | 57.1639 | 0.0583 | 2 | 5 | positive regulation of inositol trisphosphate biosynthetic process |
| GO:0035609 | 0.0013 | 57.1639 | 0.0583 | 2 | 5 | C-terminal protein deglutamylation |
| GO:0034142 | 0.0019 | 4.9776 | 1.2933 | 6 | 111 | toll-like receptor 4 signaling pathway |
| GO:0030091 | 0.002 | 42.8702 | 0.0699 | 2 | 6 | protein repair |
| GO:0046654 | 0.002 | 42.8702 | 0.0699 | 2 | 6 | tetrahydrofolate biosynthetic process |
| GO:0061635 | 0.002 | 42.8702 | 0.0699 | 2 | 6 | regulation of protein complex stability |
| GO:0071221 | 0.002 | 42.8702 | 0.0699 | 2 | 6 | cellular response to bacterial lipopeptide |
| GO:0002227 | 0.002 | 13.6 | 0.2563 | 3 | 22 | innate immune response in mucosa |
| GO:0007214 | 0.002 | 13.6 | 0.2563 | 3 | 22 | gamma-aminobutyric acid signaling pathway |
| GO:0050830 | 0.002 | 6.028 | 0.8972 | 5 | 77 | defense response to Gram-positive bacterium |
| GO:0030522 | 0.0022 | 3.1468 | 3.379 | 10 | 290 | intracellular receptor signaling pathway |
| GO:0032493 | 0.0027 | 34.2939 | 0.0816 | 2 | 7 | response to bacterial lipoprotein |
| GO:0009595 | 0.0033 | 11.2319 | 0.3029 | 3 | 26 | detection of biotic stimulus |
| GO:0061512 | 0.0033 | 11.2319 | 0.3029 | 3 | 26 | protein localization to cilium |
| GO:0045410 | 0.0036 | 28.5764 | 0.0932 | 2 | 8 | positive regulation of interleukin-6 biosynthetic process |
| GO:0006760 | 0.0037 | 10.7632 | 0.3146 | 3 | 27 | folic acid-containing compound metabolic process |
| GO:0034138 | 0.004 | 5.1018 | 1.0486 | 5 | 90 | toll-like receptor 3 signaling pathway |
| GO:1903557 | 0.0044 | 6.5226 | 0.6641 | 4 | 57 | positive regulation of tumor necrosis factor superfamily cytokine production |
| GO:0006776 | 0.0046 | 24.4925 | 0.1049 | 2 | 9 | vitamin A metabolic process |
| GO:0009642 | 0.0046 | 24.4925 | 0.1049 | 2 | 9 | response to light intensity |
| GO:0071550 | 0.0046 | 24.4925 | 0.1049 | 2 | 9 | death-inducing signaling complex assembly |
| GO:0045089 | 0.0047 | 2.8089 | 3.7635 | 10 | 323 | positive regulation of innate immune response |
| GO:0032957 | 0.0057 | 21.4296 | 0.1165 | 2 | 10 | inositol trisphosphate metabolic process |
| GO:0046950 | 0.0057 | 21.4296 | 0.1165 | 2 | 10 | cellular ketone body metabolic process |
| GO:0071407 | 0.0057 | 2.366 | 5.8141 | 13 | 499 | cellular response to organic cyclic compound |
| GO:0075733 | 0.0066 | 8.6072 | 0.3845 | 3 | 33 | intracellular transport of virus |
| GO:0043507 | 0.0066 | 5.759 | 0.7457 | 4 | 64 | positive regulation of JUN kinase activity |
| GO:0032490 | 0.0069 | 19.0473 | 0.1282 | 2 | 11 | detection of molecule of bacterial origin |
| GO:1902224 | 0.0069 | 19.0473 | 0.1282 | 2 | 11 | ketone body metabolic process |
| GO:0002251 | 0.0071 | 8.329 | 0.3962 | 3 | 34 | organ or tissue specific immune response |
| GO:0030207 | 0.0083 | 17.1414 | 0.1398 | 2 | 12 | chondroitin sulfate catabolic process |
| GO:0044283 | 0.0089 | 2.233 | 6.1404 | 13 | 527 | small molecule biosynthetic process |
| GO:0038123 | 0.009 | 5.2335 | 0.8156 | 4 | 70 | toll-like receptor TLR1:TLR2 signaling pathway |
| GO:0038124 | 0.009 | 5.2335 | 0.8156 | 4 | 70 | toll-like receptor TLR6:TLR2 signaling pathway |
| GO:0044766 | 0.009 | 7.5926 | 0.4311 | 3 | 37 | multi-organism transport |
| GO:0008366 | 0.0093 | 4.1247 | 1.2817 | 5 | 110 | axon ensheathment |
| GO:0046328 | 0.0094 | 3.5215 | 1.7943 | 6 | 154 | regulation of JNK cascade |
| GO:0051403 | 0.0095 | 2.8626 | 2.9362 | 8 | 252 | stress-activated MAPK cascade |
| GO:0045086 | 0.0097 | 15.5821 | 0.1515 | 2 | 13 | positive regulation of interleukin-2 biosynthetic process |
| GOMFID | Pvalue | OddsRatio | ExpCount | Count | Size | Term |
| GO:0006955 | 0 | 2.6435 | 13.4043 | 30 | 1632 | immune response |
| GO:0032490 | 1e-04 | 46.3363 | 0.0903 | 3 | 11 | detection of molecule of bacterial origin |
| GO:0070340 | 2e-04 | 245.2913 | 0.0246 | 2 | 3 | detection of bacterial lipopeptide |
| GO:0070489 | 2e-04 | 3.7013 | 3.5482 | 12 | 432 | T cell aggregation |
| GO:0070486 | 3e-04 | 3.6302 | 3.6139 | 12 | 440 | leukocyte aggregation |
| GO:0016045 | 3e-04 | 26.4677 | 0.1396 | 3 | 17 | detection of bacterium |
| GO:0007625 | 4e-04 | 24.7016 | 0.1478 | 3 | 18 | grooming behavior |
| GO:0031347 | 6e-04 | 2.7797 | 6.3325 | 16 | 771 | regulation of defense response |
| GO:0002682 | 9e-04 | 2.2235 | 12.123 | 24 | 1476 | regulation of immune system process |
| GO:0071221 | 0.001 | 61.311 | 0.0493 | 2 | 6 | cellular response to bacterial lipopeptide |
| GO:0009595 | 0.0012 | 16.1014 | 0.2135 | 3 | 26 | detection of biotic stimulus |
| GO:0032493 | 0.0014 | 49.0457 | 0.0575 | 2 | 7 | response to bacterial lipoprotein |
| GO:0002764 | 0.0016 | 2.7974 | 5.0348 | 13 | 613 | immune response-regulating signaling pathway |
| GO:0045410 | 0.0018 | 40.8688 | 0.0657 | 2 | 8 | positive regulation of interleukin-6 biosynthetic process |
| GO:0042107 | 0.002 | 6.0578 | 0.887 | 5 | 108 | cytokine metabolic process |
| GO:0071219 | 0.002 | 4.9176 | 1.3059 | 6 | 159 | cellular response to molecule of bacterial origin |
| GO:0007155 | 0.0022 | 2.1254 | 11.4659 | 22 | 1396 | cell adhesion |
| GO:0042355 | 0.0023 | 35.0281 | 0.0739 | 2 | 9 | L-fucose catabolic process |
| GO:0035589 | 0.0029 | 30.6476 | 0.0821 | 2 | 10 | G-protein coupled purinergic nucleotide receptor signaling pathway |
| GO:0051249 | 0.0035 | 3.1523 | 3.0472 | 9 | 371 | regulation of lymphocyte activation |
| GO:0030431 | 0.0037 | 10.5728 | 0.3121 | 3 | 38 | sleep |
| GO:0032308 | 0.0042 | 24.515 | 0.0986 | 2 | 12 | positive regulation of prostaglandin secretion |
| GO:0070633 | 0.0042 | 24.515 | 0.0986 | 2 | 12 | transepithelial transport |
| GO:0050865 | 0.0046 | 2.8313 | 3.77 | 10 | 459 | regulation of cell activation |
| GO:0046651 | 0.0047 | 3.6056 | 2.0616 | 7 | 251 | lymphocyte proliferation |
| GO:0007320 | 0.0049 | 22.2849 | 0.1068 | 2 | 13 | insemination |
| GO:0032740 | 0.0049 | 22.2849 | 0.1068 | 2 | 13 | positive regulation of interleukin-17 production |
| GO:0016337 | 0.0049 | 2.4327 | 5.7412 | 13 | 699 | single organismal cell-cell adhesion |
| GO:0045089 | 0.0052 | 3.2034 | 2.6529 | 8 | 323 | positive regulation of innate immune response |
| GO:0050870 | 0.0056 | 3.9504 | 1.6098 | 6 | 196 | positive regulation of T cell activation |
| GO:0070661 | 0.0064 | 3.3934 | 2.1848 | 7 | 266 | leukocyte proliferation |
| GO:0043330 | 0.0067 | 8.4053 | 0.386 | 3 | 47 | response to exogenous dsRNA |
| GO:0002758 | 0.0073 | 3.3026 | 2.2423 | 7 | 273 | innate immune response-activating signal transduction |
| GO:0006004 | 0.0074 | 17.5062 | 0.1314 | 2 | 16 | fucose metabolic process |
| GO:0032703 | 0.0074 | 17.5062 | 0.1314 | 2 | 16 | negative regulation of interleukin-2 production |
| GO:0033033 | 0.0074 | 17.5062 | 0.1314 | 2 | 16 | negative regulation of myeloid cell apoptotic process |
| GO:0042035 | 0.0075 | 5.5065 | 0.7721 | 4 | 94 | regulation of cytokine biosynthetic process |
| GO:0002253 | 0.0076 | 2.6205 | 4.0574 | 10 | 494 | activation of immune response |
| GO:0002696 | 0.0076 | 3.2776 | 2.2587 | 7 | 275 | positive regulation of leukocyte activation |
| GO:0048247 | 0.008 | 7.8673 | 0.4107 | 3 | 50 | lymphocyte chemotaxis |
| GO:0000494 | 0.0082 | Inf | 0.0082 | 1 | 1 | box C/D snoRNA 3'-end processing |
| GO:0002642 | 0.0082 | Inf | 0.0082 | 1 | 1 | positive regulation of immunoglobulin biosynthetic process |
| GO:0021919 | 0.0082 | Inf | 0.0082 | 1 | 1 | BMP signaling pathway involved in spinal cord dorsal/ventral patterning |
| GO:0032498 | 0.0082 | Inf | 0.0082 | 1 | 1 | detection of muramyl dipeptide |
| GO:0033967 | 0.0082 | Inf | 0.0082 | 1 | 1 | box C/D snoRNA metabolic process |
| GO:0034130 | 0.0082 | Inf | 0.0082 | 1 | 1 | toll-like receptor 1 signaling pathway |
| GO:0034150 | 0.0082 | Inf | 0.0082 | 1 | 1 | toll-like receptor 6 signaling pathway |
| GO:0051977 | 0.0082 | Inf | 0.0082 | 1 | 1 | lysophospholipid transport |
| GO:0071348 | 0.0082 | Inf | 0.0082 | 1 | 1 | cellular response to interleukin-11 |
| GO:1903621 | 0.0082 | Inf | 0.0082 | 1 | 1 | protein localization to photoreceptor connecting cilium |
| GO:1990258 | 0.0082 | Inf | 0.0082 | 1 | 1 | histone glutamine methylation |
| GO:1990830 | 0.0082 | Inf | 0.0082 | 1 | 1 | cellular response to leukemia inhibitory factor |
| GO:2000363 | 0.0082 | Inf | 0.0082 | 1 | 1 | positive regulation of prostaglandin-E synthase activity |
| GO:0002252 | 0.0086 | 2.2598 | 6.1519 | 13 | 749 | immune effector process |
| GO:0042116 | 0.0089 | 7.5452 | 0.4271 | 3 | 52 | macrophage activation |
| GO:0032675 | 0.009 | 5.215 | 0.8131 | 4 | 99 | regulation of interleukin-6 production |
| GO:0015732 | 0.0094 | 15.3159 | 0.1478 | 2 | 18 | prostaglandin transport |
| GO:0032303 | 0.0094 | 15.3159 | 0.1478 | 2 | 18 | regulation of icosanoid secretion |
| GO:1902236 | 0.0094 | 15.3159 | 0.1478 | 2 | 18 | negative regulation of endoplasmic reticulum stress-induced intrinsic apoptotic signaling pathway |
| GO:2000193 | 0.0094 | 15.3159 | 0.1478 | 2 | 18 | positive regulation of fatty acid transport |
| GO:0006749 | 0.0094 | 7.3938 | 0.4353 | 3 | 53 | glutathione metabolic process |
| GO:0032609 | 0.0096 | 5.1068 | 0.8296 | 4 | 101 | interferon-gamma production |
| GO:0051965 | 0.0099 | 7.2484 | 0.4435 | 3 | 54 | positive regulation of synapse assembly |
| GOMFID | Pvalue | OddsRatio | ExpCount | Count | Size | Term |
| GO:0009593 | 1e-04 | 4.3316 | 3.093 | 12 | 454 | detection of chemical stimulus |
| GO:0050877 | 2e-04 | 2.7659 | 8.291 | 20 | 1217 | neurological system process |
| GO:0050911 | 2e-04 | 4.3271 | 2.5411 | 10 | 373 | detection of chemical stimulus involved in sensory perception of smell |
| GO:0007606 | 3e-04 | 3.8051 | 3.1815 | 11 | 467 | sensory perception of chemical stimulus |
| GO:0050906 | 3e-04 | 3.8051 | 3.1815 | 11 | 467 | detection of stimulus involved in sensory perception |
| GO:0007186 | 8e-04 | 2.5531 | 7.9232 | 18 | 1163 | G-protein coupled receptor signaling pathway |
| GO:0006956 | 0.0043 | 9.9705 | 0.327 | 3 | 48 | complement activation |
| GO:0014910 | 0.0045 | 9.7531 | 0.3338 | 3 | 49 | regulation of smooth muscle cell migration |
| GO:0008542 | 0.0053 | 9.1542 | 0.3543 | 3 | 52 | visual learning |
| GO:0000042 | 0.0066 | 18.5512 | 0.1226 | 2 | 18 | protein targeting to Golgi |
| GO:0006062 | 0.0068 | Inf | 0.0068 | 1 | 1 | sorbitol catabolic process |
| GO:0019519 | 0.0068 | Inf | 0.0068 | 1 | 1 | pentitol metabolic process |
| GO:0051160 | 0.0068 | Inf | 0.0068 | 1 | 1 | L-xylitol catabolic process |
| GO:1904209 | 0.0068 | Inf | 0.0068 | 1 | 1 | positive regulation of chemokine (C-C motif) ligand 2 secretion |
| GOMFID | Pvalue | OddsRatio | ExpCount | Count | Size | Term |
| GO:0070169 | 7e-04 | 19.6639 | 0.1718 | 3 | 38 | positive regulation of biomineral tissue development |
| GO:0042340 | 0.0013 | 45.2899 | 0.0542 | 2 | 12 | keratan sulfate catabolic process |
| GO:0043129 | 0.0013 | 45.2899 | 0.0542 | 2 | 12 | surfactant homeostasis |
| GO:0045086 | 0.0015 | 41.17 | 0.0588 | 2 | 13 | positive regulation of interleukin-2 biosynthetic process |
| GO:0001660 | 0.0018 | 37.7367 | 0.0633 | 2 | 14 | fever generation |
| GO:0060788 | 0.0023 | 32.3416 | 0.0723 | 2 | 16 | ectodermal placode formation |
| GO:0071696 | 0.0023 | 32.3416 | 0.0723 | 2 | 16 | ectodermal placode development |
| GO:0007189 | 0.0036 | 10.5679 | 0.3074 | 3 | 68 | adenylate cyclase-activating G-protein coupled receptor signaling pathway |
| GO:2000026 | 0.0038 | 2.434 | 7.0747 | 15 | 1565 | regulation of multicellular organismal development |
| GO:0010038 | 0.0039 | 4.3212 | 1.5053 | 6 | 333 | response to metal ion |
| GO:0051963 | 0.0042 | 9.9527 | 0.3255 | 3 | 72 | regulation of synapse assembly |
| GO:0002668 | 0.0045 | Inf | 0.0045 | 1 | 1 | negative regulation of T cell anergy |
| GO:0032681 | 0.0045 | Inf | 0.0045 | 1 | 1 | regulation of lymphotoxin A production |
| GO:0035038 | 0.0045 | Inf | 0.0045 | 1 | 1 | female pronucleus assembly |
| GO:0043017 | 0.0045 | Inf | 0.0045 | 1 | 1 | positive regulation of lymphotoxin A biosynthetic process |
| GO:0060007 | 0.0045 | Inf | 0.0045 | 1 | 1 | linear vestibuloocular reflex |
| GO:0060618 | 0.0045 | Inf | 0.0045 | 1 | 1 | nipple development |
| GO:0060649 | 0.0045 | Inf | 0.0045 | 1 | 1 | mammary gland bud elongation |
| GO:0060659 | 0.0045 | Inf | 0.0045 | 1 | 1 | nipple sheath formation |
| GO:0070175 | 0.0045 | Inf | 0.0045 | 1 | 1 | positive regulation of enamel mineralization |
| GO:0030819 | 0.0046 | 9.6711 | 0.3345 | 3 | 74 | positive regulation of cAMP biosynthetic process |
| GO:0000003 | 0.0047 | 2.5223 | 5.827 | 13 | 1289 | reproduction |
| GO:0001556 | 0.0052 | 20.5705 | 0.1085 | 2 | 24 | oocyte maturation |
| GO:0044702 | 0.0053 | 2.5763 | 5.2258 | 12 | 1156 | single organism reproductive process |
| GO:0042127 | 0.0057 | 2.3828 | 6.6678 | 14 | 1475 | regulation of cell proliferation |
| GO:0006790 | 0.0059 | 3.9504 | 1.641 | 6 | 363 | sulfur compound metabolic process |
| GO:0006520 | 0.0066 | 3.4312 | 2.2151 | 7 | 490 | cellular amino acid metabolic process |
| GO:0018146 | 0.0071 | 17.4013 | 0.1266 | 2 | 28 | keratan sulfate biosynthetic process |
| GO:0032501 | 0.0078 | 1.8321 | 30.3827 | 41 | 6721 | multicellular organismal process |
| GO:0002644 | 0.009 | 223.3429 | 0.009 | 1 | 2 | negative regulation of tolerance induction |
| GO:0006535 | 0.009 | 223.3429 | 0.009 | 1 | 2 | cysteine biosynthetic process from serine |
| GO:0043418 | 0.009 | 223.3429 | 0.009 | 1 | 2 | homocysteine catabolic process |
| GO:0045404 | 0.009 | 223.3429 | 0.009 | 1 | 2 | positive regulation of interleukin-4 biosynthetic process |
| GO:0046619 | 0.009 | 223.3429 | 0.009 | 1 | 2 | optic placode formation involved in camera-type eye formation |
| GO:0071461 | 0.009 | 223.3429 | 0.009 | 1 | 2 | cellular response to redox state |
| GO:0071676 | 0.009 | 223.3429 | 0.009 | 1 | 2 | negative regulation of mononuclear cell migration |
| GO:1901090 | 0.009 | 223.3429 | 0.009 | 1 | 2 | regulation of protein tetramerization |
| GO:1901094 | 0.009 | 223.3429 | 0.009 | 1 | 2 | negative regulation of protein homotetramerization |
| GO:1902725 | 0.009 | 223.3429 | 0.009 | 1 | 2 | negative regulation of satellite cell differentiation |
| GO:0030810 | 0.0096 | 7.294 | 0.4385 | 3 | 97 | positive regulation of nucleotide biosynthetic process |
| GO:0042181 | 0.0097 | 14.59 | 0.1492 | 2 | 33 | ketone biosynthetic process |
| GOMFID | Pvalue | OddsRatio | ExpCount | Count | Size | Term |
| GO:0060903 | 6e-04 | 95.9259 | 0.0418 | 2 | 4 | positive regulation of meiosis I |
| GO:2000617 | 0.0016 | 47.9568 | 0.0627 | 2 | 6 | positive regulation of histone H3-K9 acetylation |
| GO:0036006 | 0.0046 | 23.9722 | 0.1044 | 2 | 10 | cellular response to macrophage colony-stimulating factor stimulus |
| GO:0071786 | 0.0056 | 21.3073 | 0.1149 | 2 | 11 | endoplasmic reticulum tubular network organization |
| GO:0061647 | 0.0062 | 8.7572 | 0.3759 | 3 | 36 | histone H3-K9 modification |
| GO:0001956 | 0.0067 | 19.1753 | 0.1253 | 2 | 12 | positive regulation of neurotransmitter secretion |
| GOMFID | Pvalue | OddsRatio | ExpCount | Count | Size | Term |
| GO:0002253 | 1e-04 | 3.2306 | 5.4099 | 16 | 494 | activation of immune response |
| GO:0002429 | 1e-04 | 3.9286 | 3.3182 | 12 | 303 | immune response-activating cell surface receptor signaling pathway |
| GO:0002764 | 1e-04 | 2.9347 | 6.7131 | 18 | 613 | immune response-regulating signaling pathway |
| GO:0046271 | 4e-04 | 182.7412 | 0.0329 | 2 | 3 | phenylpropanoid catabolic process |
| GO:0070340 | 4e-04 | 182.7412 | 0.0329 | 2 | 3 | detection of bacterial lipopeptide |
| GO:0050855 | 5e-04 | 22.9615 | 0.1643 | 3 | 15 | regulation of B cell receptor signaling pathway |
| GO:1901033 | 7e-04 | 91.3647 | 0.0438 | 2 | 4 | positive regulation of response to reactive oxygen species |
| GO:0016045 | 8e-04 | 19.6788 | 0.1862 | 3 | 17 | detection of bacterium |
| GO:0019373 | 9e-04 | 18.3657 | 0.1971 | 3 | 18 | epoxygenase P450 pathway |
| GO:0007160 | 0.0012 | 4.1147 | 2.0807 | 8 | 190 | cell-matrix adhesion |
| GO:0031295 | 0.0012 | 6.8096 | 0.7994 | 5 | 73 | T cell costimulation |
| GO:0006952 | 0.0014 | 1.8956 | 19.2961 | 33 | 1762 | defense response |
| GO:0050852 | 0.0017 | 4.351 | 1.7193 | 7 | 157 | T cell receptor signaling pathway |
| GO:0071221 | 0.0017 | 45.6765 | 0.0657 | 2 | 6 | cellular response to bacterial lipopeptide |
| GO:0032493 | 0.0024 | 36.5388 | 0.0767 | 2 | 7 | response to bacterial lipoprotein |
| GO:2000402 | 0.0024 | 36.5388 | 0.0767 | 2 | 7 | negative regulation of lymphocyte migration |
| GO:0007155 | 0.0026 | 1.9267 | 15.2879 | 27 | 1396 | cell adhesion |
| GO:0009595 | 0.0028 | 11.9714 | 0.2847 | 3 | 26 | detection of biotic stimulus |
| GO:0070527 | 0.0029 | 7.3733 | 0.5914 | 4 | 54 | platelet aggregation |
| GO:0045410 | 0.0032 | 30.4471 | 0.0876 | 2 | 8 | positive regulation of interleukin-6 biosynthetic process |
| GO:1903209 | 0.0041 | 26.0958 | 0.0986 | 2 | 9 | positive regulation of oxidative stress-induced cell death |
| GO:0071466 | 0.0048 | 3.5786 | 2.0698 | 7 | 189 | cellular response to xenobiotic stimulus |
| GO:0032367 | 0.0051 | 22.8324 | 0.1095 | 2 | 10 | intracellular cholesterol transport |
| GO:0042178 | 0.0051 | 22.8324 | 0.1095 | 2 | 10 | xenobiotic catabolic process |
| GO:0032490 | 0.0061 | 20.2941 | 0.1205 | 2 | 11 | detection of molecule of bacterial origin |
| GO:0001935 | 0.007 | 4.4421 | 1.1937 | 5 | 109 | endothelial cell proliferation |
| GO:0001887 | 0.0072 | 4.3995 | 1.2046 | 5 | 110 | selenium compound metabolic process |
| GO:0001956 | 0.0073 | 18.2635 | 0.1314 | 2 | 12 | positive regulation of neurotransmitter secretion |
| GO:0034341 | 0.0077 | 3.6822 | 1.7193 | 6 | 157 | response to interferon-gamma |
| GO:0002684 | 0.0086 | 1.9701 | 9.7247 | 18 | 888 | positive regulation of immune system process |
| GO:0033700 | 0.01 | 15.2176 | 0.1533 | 2 | 14 | phospholipid efflux |
| GOMFID | Pvalue | OddsRatio | ExpCount | Count | Size | Term |
| GO:0002713 | 1e-04 | 48.8616 | 0.0928 | 3 | 9 | negative regulation of B cell mediated immunity |
| GO:0006068 | 0.001 | 64.7542 | 0.0516 | 2 | 5 | ethanol catabolic process |
| GO:0050852 | 0.0012 | 4.6348 | 1.6194 | 7 | 157 | T cell receptor signaling pathway |
| GO:0002924 | 0.0015 | 48.5625 | 0.0619 | 2 | 6 | negative regulation of humoral immune response mediated by circulating immunoglobulin |
| GO:0051955 | 0.0019 | 13.947 | 0.2475 | 3 | 24 | regulation of amino acid transport |
| GO:0014049 | 0.0028 | 32.3708 | 0.0825 | 2 | 8 | positive regulation of glutamate secretion |
| GO:0002440 | 0.0043 | 4.1717 | 1.5266 | 6 | 148 | production of molecular mediator of immune response |
| GO:0002820 | 0.0051 | 9.4419 | 0.3507 | 3 | 34 | negative regulation of adaptive immune response |
| GO:0051924 | 0.0054 | 3.5002 | 2.1145 | 7 | 205 | regulation of calcium ion transport |
| GO:0071786 | 0.0055 | 21.5764 | 0.1135 | 2 | 11 | endoplasmic reticulum tubular network organization |
| GO:0046717 | 0.0061 | 4.5946 | 1.1552 | 5 | 112 | acid secretion |
| GO:0001956 | 0.0065 | 19.4175 | 0.1238 | 2 | 12 | positive regulation of neurotransmitter secretion |
| GO:0071318 | 0.0065 | 19.4175 | 0.1238 | 2 | 12 | cellular response to ATP |
| GO:0034767 | 0.007 | 4.4279 | 1.1965 | 5 | 116 | positive regulation of ion transmembrane transport |
| GO:0015837 | 0.0079 | 5.4402 | 0.7839 | 4 | 76 | amine transport |
| GO:0002889 | 0.008 | 7.9077 | 0.4126 | 3 | 40 | regulation of immunoglobulin mediated immune response |
| GO:0006595 | 0.0086 | 5.2925 | 0.8045 | 4 | 78 | polyamine metabolic process |
| GO:0032845 | 0.0089 | 3.563 | 1.7741 | 6 | 172 | negative regulation of homeostatic process |
| GO:0007155 | 0.0089 | 1.7964 | 14.3991 | 24 | 1396 | cell adhesion |
| GO:0002704 | 0.0092 | 7.5012 | 0.4332 | 3 | 42 | negative regulation of leukocyte mediated immunity |
| GO:0016311 | 0.0097 | 2.5101 | 4.198 | 10 | 407 | dephosphorylation |
| GOMFID | Pvalue | OddsRatio | ExpCount | Count | Size | Term |
| GO:0070489 | 2e-04 | 3.8334 | 3.4382 | 12 | 432 | T cell aggregation |
| GO:0070486 | 2e-04 | 3.7597 | 3.5018 | 12 | 440 | leukocyte aggregation |
| GO:0048869 | 5e-04 | 1.908 | 30.9197 | 48 | 3885 | cellular developmental process |
| GO:0015695 | 5e-04 | 22.513 | 0.1592 | 3 | 20 | organic cation transport |
| GO:0030097 | 5e-04 | 2.9251 | 5.6427 | 15 | 709 | hemopoiesis |
| GO:0007155 | 6e-04 | 2.3334 | 11.1104 | 23 | 1396 | cell adhesion |
| GO:0050896 | 6e-04 | 1.8418 | 63.7336 | 82 | 8008 | response to stimulus |
| GO:0032365 | 7e-04 | 20.1406 | 0.1751 | 3 | 22 | intracellular lipid transport |
| GO:0072488 | 9e-04 | 18.2201 | 0.191 | 3 | 24 | ammonium transmembrane transport |
| GO:0043367 | 0.001 | 10.0664 | 0.4377 | 4 | 55 | CD4-positive, alpha-beta T cell differentiation |
| GO:0042346 | 0.001 | 17.3908 | 0.199 | 3 | 25 | positive regulation of NF-kappaB import into nucleus |
| GO:0002366 | 0.0012 | 4.6565 | 1.6156 | 7 | 203 | leukocyte activation involved in immune response |
| GO:0044699 | 0.0013 | 2.5211 | 100.6613 | 113 | 12847 | single-organism process |
| GO:0046631 | 0.0016 | 6.3231 | 0.8516 | 5 | 107 | alpha-beta T cell activation |
| GO:0002520 | 0.0017 | 2.5737 | 6.359 | 15 | 799 | immune system development |
| GO:0019740 | 0.0017 | 42.2087 | 0.0637 | 2 | 8 | nitrogen utilization |
| GO:1904589 | 0.0027 | 4.6258 | 1.3848 | 6 | 174 | regulation of protein import |
| GO:0032367 | 0.0027 | 31.6524 | 0.0796 | 2 | 10 | intracellular cholesterol transport |
| GO:0055091 | 0.0027 | 31.6524 | 0.0796 | 2 | 10 | phospholipid homeostasis |
| GO:0001775 | 0.0028 | 2.3665 | 7.3698 | 16 | 926 | cell activation |
| GO:0045595 | 0.0028 | 2.1162 | 10.9932 | 21 | 1411 | regulation of cell differentiation |
| GO:0006509 | 0.0031 | 11.2442 | 0.2945 | 3 | 37 | membrane protein ectodomain proteolysis |
| GO:0034374 | 0.0033 | 28.1337 | 0.0875 | 2 | 11 | low-density lipoprotein particle remodeling |
| GO:0030101 | 0.0033 | 7.0228 | 0.6128 | 4 | 77 | natural killer cell activation |
| GO:0002573 | 0.0034 | 4.4132 | 1.4485 | 6 | 182 | myeloid leukocyte differentiation |
| GO:0032374 | 0.0034 | 10.9222 | 0.3024 | 3 | 38 | regulation of cholesterol transport |
| GO:0016337 | 0.0038 | 2.5202 | 5.5632 | 13 | 699 | single organismal cell-cell adhesion |
| GO:0015748 | 0.004 | 6.6562 | 0.6447 | 4 | 81 | organophosphate ester transport |
| GO:0045471 | 0.0041 | 5.0702 | 1.0506 | 5 | 132 | response to ethanol |
| GO:0021762 | 0.0045 | 9.7995 | 0.3343 | 3 | 42 | substantia nigra development |
| GO:0033344 | 0.0045 | 9.7995 | 0.3343 | 3 | 42 | cholesterol efflux |
| GO:0010745 | 0.0046 | 23.0155 | 0.1035 | 2 | 13 | negative regulation of macrophage derived foam cell differentiation |
| GO:0042033 | 0.0046 | 23.0155 | 0.1035 | 2 | 13 | chemokine biosynthetic process |
| GO:1901264 | 0.0048 | 9.5539 | 0.3422 | 3 | 43 | carbohydrate derivative transport |
| GO:0002286 | 0.0049 | 6.2483 | 0.6845 | 4 | 86 | T cell activation involved in immune response |
| GO:0002250 | 0.0052 | 3.2097 | 2.6503 | 8 | 333 | adaptive immune response |
| GO:0033700 | 0.0054 | 21.0962 | 0.1114 | 2 | 14 | phospholipid efflux |
| GO:0042095 | 0.0054 | 21.0962 | 0.1114 | 2 | 14 | interferon-gamma biosynthetic process |
| GO:0042990 | 0.0055 | 6.0266 | 0.7083 | 4 | 89 | regulation of transcription factor import into nucleus |
| GO:0009952 | 0.0057 | 3.9374 | 1.6156 | 6 | 203 | anterior/posterior pattern specification |
| GO:2000026 | 0.0058 | 1.9432 | 12.4554 | 22 | 1565 | regulation of multicellular organismal development |
| GO:0034375 | 0.0062 | 19.4722 | 0.1194 | 2 | 15 | high-density lipoprotein particle remodeling |
| GO:0032330 | 0.0062 | 8.6831 | 0.3741 | 3 | 47 | regulation of chondrocyte differentiation |
| GO:0030217 | 0.0062 | 3.858 | 1.6475 | 6 | 207 | T cell differentiation |
| GO:0034097 | 0.0063 | 2.2822 | 6.6058 | 14 | 830 | response to cytokine |
| GO:0046822 | 0.0064 | 3.8387 | 1.6554 | 6 | 208 | regulation of nucleocytoplasmic transport |
| GO:0002252 | 0.0067 | 2.3411 | 5.9611 | 13 | 749 | immune effector process |
| GO:0009887 | 0.0068 | 2.1933 | 7.3778 | 15 | 927 | organ morphogenesis |
| GO:0046649 | 0.0069 | 2.6656 | 4.0026 | 10 | 517 | lymphocyte activation |
| GO:0042307 | 0.007 | 5.6271 | 0.7561 | 4 | 95 | positive regulation of protein import into nucleus |
| GO:0006855 | 0.007 | 18.0801 | 0.1273 | 2 | 16 | drug transmembrane transport |
| GO:0006995 | 0.007 | 18.0801 | 0.1273 | 2 | 16 | cellular response to nitrogen starvation |
| GO:0032386 | 0.0074 | 2.5001 | 4.6957 | 11 | 590 | regulation of intracellular transport |
| GO:0051094 | 0.0075 | 2.0661 | 8.9138 | 17 | 1120 | positive regulation of developmental process |
| GO:0042493 | 0.0078 | 2.7735 | 3.4461 | 9 | 433 | response to drug |
| GO:0010888 | 0.0079 | 16.8737 | 0.1353 | 2 | 17 | negative regulation of lipid storage |
| GO:0043691 | 0.0079 | 16.8737 | 0.1353 | 2 | 17 | reverse cholesterol transport |
| GO:0072358 | 0.0079 | 2.1532 | 7.5051 | 15 | 943 | cardiovascular system development |
| GO:0001971 | 0.008 | Inf | 0.008 | 1 | 1 | negative regulation of activation of membrane attack complex |
| GO:0003345 | 0.008 | Inf | 0.008 | 1 | 1 | proepicardium cell migration involved in pericardium morphogenesis |
| GO:0009720 | 0.008 | Inf | 0.008 | 1 | 1 | detection of hormone stimulus |
| GO:0032078 | 0.008 | Inf | 0.008 | 1 | 1 | negative regulation of endodeoxyribonuclease activity |
| GO:0034346 | 0.008 | Inf | 0.008 | 1 | 1 | positive regulation of type III interferon production |
| GO:0036138 | 0.008 | Inf | 0.008 | 1 | 1 | peptidyl-histidine hydroxylation |
| GO:0042265 | 0.008 | Inf | 0.008 | 1 | 1 | peptidyl-asparagine hydroxylation |
| GO:0042946 | 0.008 | Inf | 0.008 | 1 | 1 | glucoside transport |
| GO:0046105 | 0.008 | Inf | 0.008 | 1 | 1 | thymidine biosynthetic process |
| GO:0046120 | 0.008 | Inf | 0.008 | 1 | 1 | deoxyribonucleoside biosynthetic process |
| GO:0048621 | 0.008 | Inf | 0.008 | 1 | 1 | post-embryonic digestive tract morphogenesis |
| GO:0051460 | 0.008 | Inf | 0.008 | 1 | 1 | negative regulation of corticotropin secretion |
| GO:0061611 | 0.008 | Inf | 0.008 | 1 | 1 | mannose to fructose-6-phosphate metabolic process |
| GO:0061740 | 0.008 | Inf | 0.008 | 1 | 1 | protein targeting to lysosome involved in chaperone-mediated autophagy |
| GO:0061741 | 0.008 | Inf | 0.008 | 1 | 1 | chaperone-mediated protein transport involved in chaperone-mediated autophagy |
| GO:0072334 | 0.008 | Inf | 0.008 | 1 | 1 | UDP-galactose transmembrane transport |
| GO:1900011 | 0.008 | Inf | 0.008 | 1 | 1 | negative regulation of corticotropin-releasing hormone receptor activity |
| GO:1901291 | 0.008 | Inf | 0.008 | 1 | 1 | negative regulation of double-strand break repair via single-strand annealing |
| GO:1902904 | 0.008 | Inf | 0.008 | 1 | 1 | negative regulation of fibril organization |
| GO:1904764 | 0.008 | Inf | 0.008 | 1 | 1 | chaperone-mediated autophagy translocation complex disassembly |
| GO:2000329 | 0.008 | Inf | 0.008 | 1 | 1 | negative regulation of T-helper 17 cell lineage commitment |
| GO:2001238 | 0.0086 | 7.6382 | 0.4218 | 3 | 53 | positive regulation of extrinsic apoptotic signaling pathway |
| GO:0048646 | 0.0089 | 2.0246 | 9.0809 | 17 | 1141 | anatomical structure formation involved in morphogenesis |
| GOMFID | Pvalue | OddsRatio | ExpCount | Count | Size | Term |
| GO:0002322 | 7e-04 | 81.7533 | 0.0411 | 2 | 5 | B cell proliferation involved in immune response |
| GO:0035609 | 7e-04 | 81.7533 | 0.0411 | 2 | 5 | C-terminal protein deglutamylation |
| GO:0019740 | 0.0018 | 40.8688 | 0.0657 | 2 | 8 | nitrogen utilization |
| GO:0070493 | 0.0029 | 30.6476 | 0.0821 | 2 | 10 | thrombin receptor signaling pathway |
| GO:0046651 | 0.0047 | 3.6056 | 2.0616 | 7 | 251 | lymphocyte proliferation |
| GO:2000515 | 0.0057 | 20.4265 | 0.115 | 2 | 14 | negative regulation of CD4-positive, alpha-beta T cell activation |
| GO:0070661 | 0.0064 | 3.3934 | 2.1848 | 7 | 266 | leukocyte proliferation |
| GO:0006995 | 0.0074 | 17.5062 | 0.1314 | 2 | 16 | cellular response to nitrogen starvation |
| GO:0019731 | 0.008 | 7.8673 | 0.4107 | 3 | 50 | antibacterial humoral response |
| GO:0000256 | 0.0082 | Inf | 0.0082 | 1 | 1 | allantoin catabolic process |
| GO:0002779 | 0.0082 | Inf | 0.0082 | 1 | 1 | antibacterial peptide secretion |
| GO:0019402 | 0.0082 | Inf | 0.0082 | 1 | 1 | galactitol metabolic process |
| GO:0038195 | 0.0082 | Inf | 0.0082 | 1 | 1 | urokinase plasminogen activator signaling pathway |
| GO:0046657 | 0.0082 | Inf | 0.0082 | 1 | 1 | folic acid catabolic process |
| GO:0061170 | 0.0082 | Inf | 0.0082 | 1 | 1 | negative regulation of hair follicle placode formation |
| GO:0070367 | 0.0082 | Inf | 0.0082 | 1 | 1 | negative regulation of hepatocyte differentiation |
| GO:1902747 | 0.0082 | Inf | 0.0082 | 1 | 1 | negative regulation of lens fiber cell differentiation |
| GO:2000329 | 0.0082 | Inf | 0.0082 | 1 | 1 | negative regulation of T-helper 17 cell lineage commitment |
| GO:0001775 | 0.009 | 2.1183 | 7.6056 | 15 | 926 | cell activation |
| GOMFID | Pvalue | OddsRatio | ExpCount | Count | Size | Term |
| GO:0070489 | 0 | 5.6992 | 3.4657 | 17 | 432 | T cell aggregation |
| GO:0070486 | 0 | 5.5885 | 3.5299 | 17 | 440 | leukocyte aggregation |
| GO:0002125 | 0 | 379.9756 | 0.0321 | 3 | 4 | maternal aggressive behavior |
| GO:0046649 | 1e-04 | 3.8667 | 4.0357 | 14 | 517 | lymphocyte activation |
| GO:0032729 | 1e-04 | 11.8809 | 0.4733 | 5 | 59 | positive regulation of interferon-gamma production |
| GO:1903037 | 1e-04 | 4.6766 | 2.3425 | 10 | 292 | regulation of leukocyte cell-cell adhesion |
| GO:0007320 | 1e-04 | 37.9756 | 0.1043 | 3 | 13 | insemination |
| GO:0032740 | 1e-04 | 37.9756 | 0.1043 | 3 | 13 | positive regulation of interleukin-17 production |
| GO:0034110 | 2e-04 | 4.5293 | 2.4147 | 10 | 301 | regulation of homotypic cell-cell adhesion |
| GO:0030225 | 2e-04 | 16.4453 | 0.2808 | 4 | 35 | macrophage differentiation |
| GO:0030155 | 2e-04 | 3.4051 | 4.5457 | 14 | 579 | regulation of cell adhesion |
| GO:2000097 | 2e-04 | 251.2742 | 0.0241 | 2 | 3 | regulation of smooth muscle cell-matrix adhesion |
| GO:0051239 | 2e-04 | 2.1375 | 19.9919 | 36 | 2492 | regulation of multicellular organismal process |
| GO:0016337 | 2e-04 | 3.7404 | 3.5316 | 12 | 463 | single organismal cell-cell adhesion |
| GO:0007155 | 3e-04 | 3.3145 | 4.723 | 14 | 674 | cell adhesion |
| GO:0002521 | 3e-04 | 3.6562 | 3.594 | 12 | 448 | leukocyte differentiation |
| GO:0001775 | 4e-04 | 4.0665 | 2.6936 | 10 | 371 | cell activation |
| GO:0002696 | 4e-04 | 4.4286 | 2.2062 | 9 | 275 | positive regulation of leukocyte activation |
| GO:0007625 | 4e-04 | 25.3089 | 0.1444 | 3 | 18 | grooming behavior |
| GO:0002586 | 4e-04 | 125.629 | 0.0321 | 2 | 4 | regulation of antigen processing and presentation of peptide antigen via MHC class II |
| GO:0050793 | 4e-04 | 2.1573 | 16.6706 | 31 | 2078 | regulation of developmental process |
| GO:0007618 | 4e-04 | 12.7377 | 0.353 | 4 | 44 | mating |
| GO:0071216 | 6e-04 | 5.3322 | 1.42 | 7 | 177 | cellular response to biotic stimulus |
| GO:0008588 | 6e-04 | 83.7473 | 0.0401 | 2 | 5 | release of cytoplasmic sequestered NF-kappaB |
| GO:0022409 | 6e-04 | 4.565 | 1.8933 | 8 | 236 | positive regulation of cell-cell adhesion |
| GO:0045576 | 7e-04 | 10.8357 | 0.4091 | 4 | 51 | mast cell activation |
| GO:0002376 | 7e-04 | 2.0975 | 16.6011 | 30 | 2158 | immune system process |
| GO:0050718 | 8e-04 | 18.9756 | 0.1845 | 3 | 23 | positive regulation of interleukin-1 beta secretion |
| GO:0043124 | 9e-04 | 10.1836 | 0.4332 | 4 | 54 | negative regulation of I-kappaB kinase/NF-kappaB signaling |
| GO:0097211 | 9e-04 | 62.8065 | 0.0481 | 2 | 6 | cellular response to gonadotropin-releasing hormone |
| GO:0002504 | 0.001 | 7.1924 | 0.7541 | 5 | 94 | antigen processing and presentation of peptide or polysaccharide antigen via MHC class II |
| GO:0034105 | 0.001 | 17.2483 | 0.2006 | 3 | 25 | positive regulation of tissue remodeling |
| GO:0032943 | 0.001 | 4.226 | 2.0377 | 8 | 254 | mononuclear cell proliferation |
| GO:0048534 | 0.0011 | 2.7062 | 6.0649 | 15 | 756 | hematopoietic or lymphoid organ development |
| GO:0050865 | 0.0012 | 3.2308 | 3.6823 | 11 | 459 | regulation of cell activation |
| GO:0002685 | 0.0012 | 5.4748 | 1.1793 | 6 | 147 | regulation of leukocyte migration |
| GO:0050856 | 0.0013 | 15.8089 | 0.2166 | 3 | 27 | regulation of T cell receptor signaling pathway |
| GO:0042538 | 0.0013 | 50.2419 | 0.0562 | 2 | 7 | hyperosmotic salinity response |
| GO:0002263 | 0.0013 | 4.5698 | 1.6446 | 7 | 205 | cell activation involved in immune response |
| GO:0071222 | 0.0014 | 5.2856 | 1.2194 | 6 | 152 | cellular response to lipopolysaccharide |
| GO:0002250 | 0.0015 | 3.622 | 2.6715 | 9 | 333 | adaptive immune response |
| GO:0046631 | 0.0017 | 6.2705 | 0.8584 | 5 | 107 | alpha-beta T cell activation |
| GO:0032621 | 0.0017 | 41.8656 | 0.0642 | 2 | 8 | interleukin-18 production |
| GO:0002275 | 0.0018 | 8.3413 | 0.5215 | 4 | 65 | myeloid cell activation involved in immune response |
| GO:0050704 | 0.0021 | 13.0791 | 0.2567 | 3 | 32 | regulation of interleukin-1 secretion |
| GO:0045924 | 0.0022 | 35.8825 | 0.0722 | 2 | 9 | regulation of female receptivity |
| GO:0001773 | 0.0023 | 12.6423 | 0.2647 | 3 | 33 | myeloid dendritic cell activation |
| GO:0033993 | 0.0026 | 2.3809 | 7.3245 | 16 | 913 | response to lipid |
| GO:0051674 | 0.0026 | 2.1668 | 10.1724 | 20 | 1268 | localization of cell |
| GO:2001179 | 0.0028 | 31.3952 | 0.0802 | 2 | 10 | regulation of interleukin-10 secretion |
| GO:0002444 | 0.0029 | 7.2646 | 0.5937 | 4 | 74 | myeloid leukocyte mediated immunity |
| GO:0032732 | 0.003 | 11.4908 | 0.2888 | 3 | 36 | positive regulation of interleukin-1 production |
| GO:0002757 | 0.0032 | 2.9943 | 3.578 | 10 | 446 | immune response-activating signal transduction |
| GO:0030101 | 0.0034 | 6.9647 | 0.6177 | 4 | 77 | natural killer cell activation |
| GO:0040011 | 0.0034 | 1.9587 | 14.2237 | 25 | 1773 | locomotion |
| GO:0030431 | 0.0035 | 10.8328 | 0.3049 | 3 | 38 | sleep |
| GO:0033628 | 0.0037 | 10.5312 | 0.3129 | 3 | 39 | regulation of cell adhesion mediated by integrin |
| GO:0043303 | 0.004 | 10.2459 | 0.3209 | 3 | 40 | mast cell degranulation |
| GO:0045471 | 0.0042 | 5.028 | 1.059 | 5 | 132 | response to ethanol |
| GO:0007160 | 0.0043 | 4.1837 | 1.5243 | 6 | 190 | cell-matrix adhesion |
| GO:0050670 | 0.0043 | 4.1837 | 1.5243 | 6 | 190 | regulation of lymphocyte proliferation |
| GO:0060333 | 0.0046 | 6.3525 | 0.6739 | 4 | 84 | interferon-gamma-mediated signaling pathway |
| GO:0043084 | 0.0047 | 22.8284 | 0.1043 | 2 | 13 | penile erection |
| GO:0050851 | 0.0048 | 4.0936 | 1.5563 | 6 | 194 | antigen receptor-mediated signaling pathway |
| GO:0032613 | 0.0049 | 9.4756 | 0.345 | 3 | 43 | interleukin-10 production |
| GO:0032757 | 0.0049 | 9.4756 | 0.345 | 3 | 43 | positive regulation of interleukin-8 production |
| GO:0002237 | 0.0051 | 3.2125 | 2.6474 | 8 | 330 | response to molecule of bacterial origin |
| GO:0042345 | 0.0053 | 9.2439 | 0.353 | 3 | 44 | regulation of NF-kappaB import into nucleus |
| GO:0070663 | 0.0054 | 3.9863 | 1.5965 | 6 | 199 | regulation of leukocyte proliferation |
| GO:0016477 | 0.0054 | 2.0952 | 9.3541 | 18 | 1166 | cell migration |
| GO:0002768 | 0.0055 | 2.7594 | 3.8668 | 10 | 482 | immune response-regulating cell surface receptor signaling pathway |
| GO:0042711 | 0.0055 | 20.9247 | 0.1123 | 2 | 14 | maternal behavior |
| GO:0048522 | 0.0055 | 1.6331 | 36.2934 | 50 | 4524 | positive regulation of cellular process |
| GO:0010950 | 0.0056 | 4.6925 | 1.1312 | 5 | 141 | positive regulation of endopeptidase activity |
| GO:0019886 | 0.0057 | 5.9769 | 0.714 | 4 | 89 | antigen processing and presentation of exogenous peptide antigen via MHC class II |
| GO:0042102 | 0.0057 | 5.9769 | 0.714 | 4 | 89 | positive regulation of T cell proliferation |
| GO:0032102 | 0.006 | 3.4392 | 2.158 | 7 | 269 | negative regulation of response to external stimulus |
| GO:0009653 | 0.0061 | 1.7385 | 21.4519 | 33 | 2674 | anatomical structure morphogenesis |
| GO:0001890 | 0.0063 | 4.5573 | 1.1632 | 5 | 145 | placenta development |
| GO:0002579 | 0.0063 | 19.3139 | 0.1203 | 2 | 15 | positive regulation of antigen processing and presentation |
| GO:0042993 | 0.0063 | 8.612 | 0.3771 | 3 | 47 | positive regulation of transcription factor import into nucleus |
| GO:0030217 | 0.0065 | 3.8256 | 1.6606 | 6 | 207 | T cell differentiation |
| GO:0032651 | 0.0067 | 8.4201 | 0.3851 | 3 | 48 | regulation of interleukin-1 beta production |
| GO:0050766 | 0.0067 | 8.4201 | 0.3851 | 3 | 48 | positive regulation of phagocytosis |
| GO:0032703 | 0.0071 | 17.9332 | 0.1284 | 2 | 16 | negative regulation of interleukin-2 production |
| GO:0035872 | 0.0079 | 7.8923 | 0.4091 | 3 | 51 | nucleotide-binding domain, leucine rich repeat containing receptor signaling pathway |
| GO:0006928 | 0.008 | 1.8158 | 15.1944 | 25 | 1894 | movement of cell or subcellular component |
| GO:0021993 | 0.008 | Inf | 0.008 | 1 | 1 | initiation of neural tube closure |
| GO:0032498 | 0.008 | Inf | 0.008 | 1 | 1 | detection of muramyl dipeptide |
| GO:0035491 | 0.008 | Inf | 0.008 | 1 | 1 | positive regulation of leukotriene production involved in inflammatory response |
| GO:0035854 | 0.008 | Inf | 0.008 | 1 | 1 | eosinophil fate commitment |
| GO:0045016 | 0.008 | Inf | 0.008 | 1 | 1 | mitochondrial magnesium ion transport |
| GO:0045381 | 0.008 | Inf | 0.008 | 1 | 1 | regulation of interleukin-18 biosynthetic process |
| GO:0045751 | 0.008 | Inf | 0.008 | 1 | 1 | negative regulation of Toll signaling pathway |
| GO:0046618 | 0.008 | Inf | 0.008 | 1 | 1 | drug export |
| GO:0048621 | 0.008 | Inf | 0.008 | 1 | 1 | post-embryonic digestive tract morphogenesis |
| GO:0048685 | 0.008 | Inf | 0.008 | 1 | 1 | negative regulation of collateral sprouting of intact axon in response to injury |
| GO:0051134 | 0.008 | Inf | 0.008 | 1 | 1 | negative regulation of NK T cell activation |
| GO:0051460 | 0.008 | Inf | 0.008 | 1 | 1 | negative regulation of corticotropin secretion |
| GO:0060007 | 0.008 | Inf | 0.008 | 1 | 1 | linear vestibuloocular reflex |
| GO:0060101 | 0.008 | Inf | 0.008 | 1 | 1 | negative regulation of phagocytosis, engulfment |
| GO:0061044 | 0.008 | Inf | 0.008 | 1 | 1 | negative regulation of vascular wound healing |
| GO:1900011 | 0.008 | Inf | 0.008 | 1 | 1 | negative regulation of corticotropin-releasing hormone receptor activity |
| GO:2000363 | 0.008 | Inf | 0.008 | 1 | 1 | positive regulation of prostaglandin-E synthase activity |
| GO:0016045 | 0.008 | 16.7366 | 0.1364 | 2 | 17 | detection of bacterium |
| GO:1903035 | 0.0087 | 4.1942 | 1.2595 | 5 | 157 | negative regulation of response to wounding |
| GO:0042472 | 0.0089 | 5.2334 | 0.8103 | 4 | 101 | inner ear morphogenesis |
| GO:0048562 | 0.0092 | 3.1569 | 2.3425 | 7 | 292 | embryonic organ morphogenesis |
| GO:0031589 | 0.0092 | 5.1704 | 0.8198 | 4 | 106 | cell-substrate adhesion |
| GO:0002683 | 0.0095 | 2.8745 | 2.9442 | 8 | 367 | negative regulation of immune system process |
| GO:0043367 | 0.0098 | 7.2833 | 0.4412 | 3 | 55 | CD4-positive, alpha-beta T cell differentiation |
| GO:0050776 | 0.0099 | 2.0952 | 7.6935 | 15 | 959 | regulation of immune response |
| GO:0050870 | 0.0099 | 5.0657 | 0.8359 | 4 | 107 | positive regulation of T cell activation |
| GO:0045954 | 0.01 | 14.7657 | 0.1524 | 2 | 19 | positive regulation of natural killer cell mediated cytotoxicity |
| GOMFID | Pvalue | OddsRatio | ExpCount | Count | Size | Term |
| GO:2000502 | 2e-04 | 261.916 | 0.0231 | 2 | 3 | negative regulation of natural killer cell chemotaxis |
| GO:1903037 | 4e-04 | 4.345 | 2.2496 | 9 | 292 | regulation of leukocyte cell-cell adhesion |
| GO:0071216 | 4e-04 | 5.5679 | 1.3636 | 7 | 177 | cellular response to biotic stimulus |
| GO:1901623 | 5e-04 | 23.2822 | 0.1541 | 3 | 20 | regulation of lymphocyte chemotaxis |
| GO:0022409 | 5e-04 | 4.7685 | 1.8182 | 8 | 236 | positive regulation of cell-cell adhesion |
| GO:0030593 | 5e-04 | 8.2503 | 0.6625 | 5 | 86 | neutrophil chemotaxis |
| GO:0034110 | 5e-04 | 4.2086 | 2.3189 | 9 | 301 | regulation of homotypic cell-cell adhesion |
| GO:0097186 | 5e-04 | 21.9873 | 0.1618 | 3 | 21 | amelogenesis |
| GO:0034105 | 9e-04 | 17.985 | 0.1926 | 3 | 25 | positive regulation of tissue remodeling |
| GO:0042346 | 9e-04 | 17.985 | 0.1926 | 3 | 25 | positive regulation of NF-kappaB import into nucleus |
| GO:0030155 | 0.001 | 2.9804 | 4.7611 | 13 | 618 | regulation of cell adhesion |
| GO:0002440 | 0.001 | 5.6741 | 1.1402 | 6 | 148 | production of molecular mediator of immune response |
| GO:0002237 | 0.001 | 3.8211 | 2.5423 | 9 | 330 | response to molecule of bacterial origin |
| GO:0032729 | 0.0011 | 9.6535 | 0.4545 | 4 | 59 | positive regulation of interferon-gamma production |
| GO:0071222 | 0.0011 | 5.5172 | 1.171 | 6 | 152 | cellular response to lipopolysaccharide |
| GO:2000402 | 0.0012 | 52.3697 | 0.0539 | 2 | 7 | negative regulation of lymphocyte migration |
| GO:0002696 | 0.0013 | 4.0616 | 2.1186 | 8 | 275 | positive regulation of leukocyte activation |
| GO:0051707 | 0.0014 | 2.5463 | 6.9028 | 16 | 896 | response to other organism |
| GO:0030595 | 0.0016 | 5.1807 | 1.2436 | 6 | 164 | leukocyte chemotaxis |
| GO:0019740 | 0.0016 | 43.6387 | 0.0616 | 2 | 8 | nitrogen utilization |
| GO:0097530 | 0.0016 | 6.3547 | 0.8474 | 5 | 110 | granulocyte migration |
| GO:0042092 | 0.0021 | 13.1822 | 0.2542 | 3 | 33 | type 2 immune response |
| GO:0051249 | 0.0023 | 3.3792 | 2.8582 | 9 | 371 | regulation of lymphocyte activation |
| GO:0043097 | 0.0025 | 32.7248 | 0.077 | 2 | 10 | pyrimidine nucleoside salvage |
| GO:1901222 | 0.0031 | 11.2954 | 0.2928 | 3 | 38 | regulation of NIK/NF-kappaB signaling |
| GO:0046651 | 0.0033 | 3.8606 | 1.9337 | 7 | 251 | lymphocyte proliferation |
| GO:0071622 | 0.0036 | 10.6835 | 0.3082 | 3 | 40 | regulation of granulocyte chemotaxis |
| GO:0045780 | 0.0037 | 26.1765 | 0.0924 | 2 | 12 | positive regulation of bone resorption |
| GO:0071346 | 0.004 | 5.0849 | 1.0478 | 5 | 136 | cellular response to interferon-gamma |
| GO:0002250 | 0.0042 | 3.3242 | 2.5655 | 8 | 333 | adaptive immune response |
| GO:0002689 | 0.0043 | 23.7953 | 0.1002 | 2 | 13 | negative regulation of leukocyte chemotaxis |
| GO:0031274 | 0.0043 | 23.7953 | 0.1002 | 2 | 13 | positive regulation of pseudopodium assembly |
| GO:0032740 | 0.0043 | 23.7953 | 0.1002 | 2 | 13 | positive regulation of interleukin-17 production |
| GO:0042033 | 0.0043 | 23.7953 | 0.1002 | 2 | 13 | chemokine biosynthetic process |
| GO:0051770 | 0.0043 | 23.7953 | 0.1002 | 2 | 13 | positive regulation of nitric-oxide synthase biosynthetic process |
| GO:0040012 | 0.0045 | 2.4672 | 5.6856 | 13 | 738 | regulation of locomotion |
| GO:0070661 | 0.0045 | 3.6335 | 2.0493 | 7 | 266 | leukocyte proliferation |
| GO:0002381 | 0.0047 | 9.6387 | 0.339 | 3 | 44 | immunoglobulin production involved in immunoglobulin mediated immune response |
| GO:0042102 | 0.0049 | 6.2343 | 0.6857 | 4 | 89 | positive regulation of T cell proliferation |
| GO:0002710 | 0.005 | 21.8109 | 0.1079 | 2 | 14 | negative regulation of T cell mediated immunity |
| GO:0042095 | 0.005 | 21.8109 | 0.1079 | 2 | 14 | interferon-gamma biosynthetic process |
| GO:0002703 | 0.0051 | 4.7898 | 1.1094 | 5 | 144 | regulation of leukocyte mediated immunity |
| GO:0002685 | 0.0056 | 4.6877 | 1.1325 | 5 | 147 | regulation of leukocyte migration |
| GO:0043330 | 0.0057 | 8.9798 | 0.3621 | 3 | 47 | response to exogenous dsRNA |
| GO:0090026 | 0.0058 | 20.1319 | 0.1156 | 2 | 15 | positive regulation of monocyte chemotaxis |
| GO:0070489 | 0.0062 | 2.8803 | 3.3282 | 9 | 432 | T cell aggregation |
| GO:0006995 | 0.0066 | 18.6927 | 0.1233 | 2 | 16 | cellular response to nitrogen starvation |
| GO:1904591 | 0.0069 | 5.6341 | 0.755 | 4 | 98 | positive regulation of protein import |
| GO:0070486 | 0.007 | 2.8254 | 3.3898 | 9 | 440 | leukocyte aggregation |
| GO:0007250 | 0.0074 | 17.4454 | 0.131 | 2 | 17 | activation of NF-kappaB-inducing kinase activity |
| GO:0016045 | 0.0074 | 17.4454 | 0.131 | 2 | 17 | detection of bacterium |
| GO:0031268 | 0.0074 | 17.4454 | 0.131 | 2 | 17 | pseudopodium organization |
| GO:0032695 | 0.0074 | 17.4454 | 0.131 | 2 | 17 | negative regulation of interleukin-12 production |
| GO:0043122 | 0.0076 | 3.695 | 1.718 | 6 | 223 | regulation of I-kappaB kinase/NF-kappaB signaling |
| GO:0006218 | 0.0077 | Inf | 0.0077 | 1 | 1 | uridine catabolic process |
| GO:0006599 | 0.0077 | Inf | 0.0077 | 1 | 1 | phosphagen metabolic process |
| GO:0032498 | 0.0077 | Inf | 0.0077 | 1 | 1 | detection of muramyl dipeptide |
| GO:0033552 | 0.0077 | Inf | 0.0077 | 1 | 1 | response to vitamin B3 |
| GO:0034346 | 0.0077 | Inf | 0.0077 | 1 | 1 | positive regulation of type III interferon production |
| GO:0035684 | 0.0077 | Inf | 0.0077 | 1 | 1 | helper T cell extravasation |
| GO:0046314 | 0.0077 | Inf | 0.0077 | 1 | 1 | phosphocreatine biosynthetic process |
| GO:0048685 | 0.0077 | Inf | 0.0077 | 1 | 1 | negative regulation of collateral sprouting of intact axon in response to injury |
| GO:0051460 | 0.0077 | Inf | 0.0077 | 1 | 1 | negative regulation of corticotropin secretion |
| GO:1900011 | 0.0077 | Inf | 0.0077 | 1 | 1 | negative regulation of corticotropin-releasing hormone receptor activity |
| GO:2000363 | 0.0077 | Inf | 0.0077 | 1 | 1 | positive regulation of prostaglandin-E synthase activity |
| GO:1903555 | 0.0077 | 5.4588 | 0.7781 | 4 | 101 | regulation of tumor necrosis factor superfamily cytokine production |
| GO:0006749 | 0.0079 | 7.8992 | 0.4083 | 3 | 53 | glutathione metabolic process |
| GO:0050870 | 0.0085 | 5.2915 | 0.8016 | 4 | 107 | positive regulation of T cell activation |
| GO:0032760 | 0.0087 | 7.5944 | 0.4237 | 3 | 55 | positive regulation of tumor necrosis factor production |
| GO:0030198 | 0.009 | 2.9032 | 2.9198 | 8 | 379 | extracellular matrix organization |
| GO:0050865 | 0.0091 | 2.7027 | 3.5362 | 9 | 459 | regulation of cell activation |
| GO:1904427 | 0.0092 | 7.4506 | 0.4314 | 3 | 56 | positive regulation of calcium ion transmembrane transport |
| GO:0036499 | 0.0092 | 15.391 | 0.1464 | 2 | 19 | PERK-mediated unfolded protein response |
| GO:0046597 | 0.0092 | 15.391 | 0.1464 | 2 | 19 | negative regulation of viral entry into host cell |
| GO:0006954 | 0.0093 | 2.4218 | 4.8459 | 11 | 629 | inflammatory response |
| GO:0008284 | 0.0097 | 2.2275 | 6.2557 | 13 | 812 | positive regulation of cell proliferation |
| GOMFID | Pvalue | OddsRatio | ExpCount | Count | Size | Term |
| GO:0019858 | 5e-04 | 151.951 | 0.0393 | 2 | 3 | cytosine metabolic process |
| GO:0072529 | 9e-04 | 10.564 | 0.4328 | 4 | 33 | pyrimidine-containing compound catabolic process |
| GO:0030814 | 0.0012 | 4.665 | 1.6133 | 7 | 123 | regulation of cAMP metabolic process |
| GO:0001996 | 0.0017 | 50.6438 | 0.0656 | 2 | 5 | positive regulation of heart rate by epinephrine-norepinephrine |
| GO:0035176 | 0.002 | 8.2756 | 0.5378 | 4 | 41 | social behavior |
| GO:0045860 | 0.0022 | 2.318 | 7.8171 | 17 | 596 | positive regulation of protein kinase activity |
| GO:0003062 | 0.0025 | 37.9804 | 0.0787 | 2 | 6 | regulation of heart rate by chemical signal |
| GO:0009967 | 0.0029 | 1.8168 | 18.4673 | 31 | 1408 | positive regulation of signal transduction |
| GO:0090314 | 0.0032 | 11.4384 | 0.3017 | 3 | 23 | positive regulation of protein targeting to membrane |
| GO:0002606 | 0.0034 | 30.3824 | 0.0918 | 2 | 7 | positive regulation of dendritic cell antigen processing and presentation |
| GO:0042048 | 0.0034 | 30.3824 | 0.0918 | 2 | 7 | olfactory behavior |
| GO:0043410 | 0.0044 | 2.2178 | 7.6466 | 16 | 583 | positive regulation of MAPK cascade |
| GO:0051347 | 0.0044 | 2.1094 | 9.0632 | 18 | 691 | positive regulation of transferase activity |
| GO:0006171 | 0.0046 | 4.1218 | 1.5477 | 6 | 118 | cAMP biosynthetic process |
| GO:0031280 | 0.0046 | 9.9445 | 0.341 | 3 | 26 | negative regulation of cyclase activity |
| GO:0050852 | 0.0047 | 3.5997 | 2.0592 | 7 | 157 | T cell receptor signaling pathway |
| GO:0010243 | 0.0051 | 1.9323 | 12.1399 | 22 | 934 | response to organonitrogen compound |
| GO:0006140 | 0.0056 | 3.1548 | 2.6757 | 8 | 204 | regulation of nucleotide metabolic process |
| GO:1901701 | 0.0057 | 1.8564 | 13.798 | 24 | 1052 | cellular response to oxygen-containing compound |
| GO:0051350 | 0.0057 | 9.1478 | 0.3672 | 3 | 28 | negative regulation of lyase activity |
| GO:0001993 | 0.0058 | 21.6989 | 0.118 | 2 | 9 | regulation of systemic arterial blood pressure by norepinephrine-epinephrine |
| GO:0007614 | 0.0058 | 21.6989 | 0.118 | 2 | 9 | short-term memory |
| GO:0009972 | 0.0058 | 21.6989 | 0.118 | 2 | 9 | cytidine deamination |
| GO:0046087 | 0.0058 | 21.6989 | 0.118 | 2 | 9 | cytidine metabolic process |
| GO:0050706 | 0.0063 | 8.7954 | 0.3804 | 3 | 29 | regulation of interleukin-1 beta secretion |
| GO:0030802 | 0.0066 | 3.813 | 1.6657 | 6 | 127 | regulation of cyclic nucleotide biosynthetic process |
| GO:0030166 | 0.0066 | 5.7713 | 0.7476 | 4 | 57 | proteoglycan biosynthetic process |
| GO:0043405 | 0.0069 | 2.3055 | 5.9416 | 13 | 453 | regulation of MAP kinase activity |
| GO:0043114 | 0.007 | 8.4691 | 0.3935 | 3 | 30 | regulation of vascular permeability |
| GO:0043123 | 0.007 | 3.3304 | 2.2166 | 7 | 169 | positive regulation of I-kappaB kinase/NF-kappaB signaling |
| GO:0090263 | 0.0076 | 3.69 | 1.7182 | 6 | 131 | positive regulation of canonical Wnt signaling pathway |
| GO:0001101 | 0.0079 | 2.585 | 4.066 | 10 | 310 | response to acid chemical |
| GO:1900371 | 0.0082 | 3.6314 | 1.7444 | 6 | 133 | regulation of purine nucleotide biosynthetic process |
| GO:0017038 | 0.0083 | 2.5676 | 4.0922 | 10 | 312 | protein import |
| GO:1902531 | 0.0086 | 1.6575 | 20.7233 | 32 | 1580 | regulation of intracellular signal transduction |
| GO:0030208 | 0.0087 | 16.8747 | 0.1443 | 2 | 11 | dermatan sulfate biosynthetic process |
| GO:0034776 | 0.0087 | 16.8747 | 0.1443 | 2 | 11 | response to histamine |
| GO:0046133 | 0.0087 | 16.8747 | 0.1443 | 2 | 11 | pyrimidine ribonucleoside catabolic process |
| GO:0009308 | 0.0088 | 2.8998 | 2.8986 | 8 | 221 | amine metabolic process |
| GO:0045823 | 0.0091 | 7.6207 | 0.4328 | 3 | 33 | positive regulation of heart contraction |
| GO:0001662 | 0.0099 | 7.3744 | 0.4459 | 3 | 34 | behavioral fear response |
| GO:0009164 | 0.0099 | 7.3744 | 0.4459 | 3 | 34 | nucleoside catabolic process |
| GO:0048265 | 0.0099 | 7.3744 | 0.4459 | 3 | 34 | response to pain |
| GO:0006521 | 0.0099 | 5.0957 | 0.8394 | 4 | 64 | regulation of cellular amino acid metabolic process |
| GO:0045761 | 0.0099 | 5.0957 | 0.8394 | 4 | 64 | regulation of adenylate cyclase activity |
| GOMFID | Pvalue | OddsRatio | ExpCount | Count | Size | Term |
| GO:0097021 | 3e-04 | 196.7722 | 0.0306 | 2 | 3 | lymphocyte migration into lymphoid organs |
| GO:0002920 | 0.0015 | 8.8325 | 0.4992 | 4 | 49 | regulation of humoral immune response |
| GO:0072488 | 0.0018 | 14.1265 | 0.2445 | 3 | 24 | ammonium transmembrane transport |
| GO:0002437 | 0.0021 | 8.1094 | 0.5399 | 4 | 53 | inflammatory response to antigenic stimulus |
| GO:0002606 | 0.0021 | 39.3443 | 0.0713 | 2 | 7 | positive regulation of dendritic cell antigen processing and presentation |
| GO:0032649 | 0.0024 | 5.7989 | 0.927 | 5 | 91 | regulation of interferon-gamma production |
| GO:0021700 | 0.0027 | 3.5839 | 2.3736 | 8 | 233 | developmental maturation |
| GO:0019740 | 0.0028 | 32.7848 | 0.0815 | 2 | 8 | nitrogen utilization |
| GO:0050900 | 0.0032 | 2.9726 | 3.5757 | 10 | 351 | leukocyte migration |
| GO:1903725 | 0.0032 | 7.0925 | 0.6112 | 4 | 60 | regulation of phospholipid metabolic process |
| GO:0014911 | 0.0034 | 10.983 | 0.3056 | 3 | 30 | positive regulation of smooth muscle cell migration |
| GO:0043552 | 0.0034 | 10.983 | 0.3056 | 3 | 30 | positive regulation of phosphatidylinositol 3-kinase activity |
| GO:0035589 | 0.0044 | 24.5854 | 0.1019 | 2 | 10 | G-protein coupled purinergic nucleotide receptor signaling pathway |
| GO:0098660 | 0.0046 | 2.2791 | 7.0292 | 15 | 690 | inorganic ion transmembrane transport |
| GO:0006928 | 0.0049 | 1.765 | 19.2945 | 31 | 1894 | movement of cell or subcellular component |
| GO:0040011 | 0.0067 | 1.752 | 18.0619 | 29 | 1773 | locomotion |
| GO:0050921 | 0.0074 | 4.3667 | 1.2123 | 5 | 119 | positive regulation of chemotaxis |
| GO:0032740 | 0.0075 | 17.8769 | 0.1324 | 2 | 13 | positive regulation of interleukin-17 production |
| GO:0071622 | 0.0078 | 8.0095 | 0.4075 | 3 | 40 | regulation of granulocyte chemotaxis |
| GO:0045834 | 0.0091 | 4.1468 | 1.2734 | 5 | 125 | positive regulation of lipid metabolic process |
| GO:0006646 | 0.0099 | 15.1246 | 0.1528 | 2 | 15 | phosphatidylethanolamine biosynthetic process |
| GOMFID | Pvalue | OddsRatio | ExpCount | Count | Size | Term |
| GO:0071285 | 3e-04 | 27.0469 | 0.1343 | 3 | 19 | cellular response to lithium ion |
| GO:0032943 | 4e-04 | 4.8462 | 1.7951 | 8 | 254 | mononuclear cell proliferation |
| GO:0043489 | 0.0015 | 14.91 | 0.2262 | 3 | 32 | RNA stabilization |
| GO:0014823 | 0.0015 | 8.7958 | 0.4947 | 4 | 70 | response to activity |
| GO:2001179 | 0.0021 | 35.75 | 0.0707 | 2 | 10 | regulation of interleukin-10 secretion |
| GO:0042088 | 0.0022 | 12.7132 | 0.2615 | 3 | 37 | T-helper 1 type immune response |
| GO:0050670 | 0.0023 | 4.786 | 1.3428 | 6 | 190 | regulation of lymphocyte proliferation |
| GO:0070663 | 0.0029 | 4.5602 | 1.4064 | 6 | 199 | regulation of leukocyte proliferation |
| GO:0034112 | 0.003 | 4.5364 | 1.4135 | 6 | 200 | positive regulation of homotypic cell-cell adhesion |
| GO:1903039 | 0.0031 | 4.4895 | 1.4276 | 6 | 202 | positive regulation of leukocyte cell-cell adhesion |
| GO:0070935 | 0.0031 | 28.5963 | 0.0848 | 2 | 12 | 3'-UTR-mediated mRNA stabilization |
| GO:0042102 | 0.0036 | 6.8213 | 0.629 | 4 | 89 | positive regulation of T cell proliferation |
| GO:0002381 | 0.0037 | 10.5379 | 0.311 | 3 | 44 | immunoglobulin production involved in immunoglobulin mediated immune response |
| GO:0032649 | 0.0039 | 6.6637 | 0.6431 | 4 | 91 | regulation of interferon-gamma production |
| GO:0035337 | 0.0053 | 9.1891 | 0.3534 | 3 | 50 | fatty-acyl-CoA metabolic process |
| GO:0016045 | 0.0063 | 19.0581 | 0.1201 | 2 | 17 | detection of bacterium |
| GO:0030817 | 0.007 | 5.6227 | 0.7562 | 4 | 107 | regulation of cAMP biosynthetic process |
| GO:0018885 | 0.0071 | Inf | 0.0071 | 1 | 1 | carbon tetrachloride metabolic process |
| GO:0032078 | 0.0071 | Inf | 0.0071 | 1 | 1 | negative regulation of endodeoxyribonuclease activity |
| GO:0034230 | 0.0071 | Inf | 0.0071 | 1 | 1 | enkephalin processing |
| GO:0034231 | 0.0071 | Inf | 0.0071 | 1 | 1 | islet amyloid polypeptide processing |
| GO:0043378 | 0.0071 | Inf | 0.0071 | 1 | 1 | positive regulation of CD8-positive, alpha-beta T cell differentiation |
| GO:1901899 | 0.0071 | Inf | 0.0071 | 1 | 1 | positive regulation of relaxation of cardiac muscle |
| GO:0006959 | 0.0075 | 4.3577 | 1.2156 | 5 | 172 | humoral immune response |
| GO:0035773 | 0.008 | 7.8485 | 0.4099 | 3 | 58 | insulin secretion involved in cellular response to glucose stimulus |
| GO:0015833 | 0.0081 | 3.2439 | 2.2898 | 7 | 324 | peptide transport |
| GO:0051251 | 0.0086 | 3.5951 | 1.7668 | 6 | 250 | positive regulation of lymphocyte activation |
| GO:0071331 | 0.0095 | 5.1218 | 0.8269 | 4 | 117 | cellular response to hexose stimulus |
| GOMFID | Pvalue | OddsRatio | ExpCount | Count | Size | Term |
| GO:0004364 | 8e-04 | 18.8587 | 0.1832 | 3 | 26 | glutathione transferase activity |
| GO:0001760 | 0.007 | Inf | 0.007 | 1 | 1 | aminocarboxymuconate-semialdehyde decarboxylase activity |
| GO:0005298 | 0.007 | Inf | 0.007 | 1 | 1 | proline:sodium symporter activity |
| GO:0008761 | 0.007 | Inf | 0.007 | 1 | 1 | UDP-N-acetylglucosamine 2-epimerase activity |
| GO:0031682 | 0.007 | Inf | 0.007 | 1 | 1 | G-protein gamma-subunit binding |
| GO:0032440 | 0.007 | Inf | 0.007 | 1 | 1 | 2-alkenal reductase [NAD(P)] activity |
| GO:0035717 | 0.007 | Inf | 0.007 | 1 | 1 | chemokine (C-C motif) ligand 7 binding |
| GO:0008327 | 0.0078 | 16.8602 | 0.1339 | 2 | 19 | methyl-CpG binding |
| GOMFID | Pvalue | OddsRatio | ExpCount | Count | Size | Term |
| GO:0004037 | 0.0081 | Inf | 0.0081 | 1 | 1 | allantoicase activity |
| GO:0031704 | 0.0081 | Inf | 0.0081 | 1 | 1 | apelin receptor binding |
| GO:0035757 | 0.0081 | Inf | 0.0081 | 1 | 1 | chemokine (C-C motif) ligand 19 binding |
| GO:0035758 | 0.0081 | Inf | 0.0081 | 1 | 1 | chemokine (C-C motif) ligand 21 binding |
| GO:0036004 | 0.0081 | Inf | 0.0081 | 1 | 1 | GAF domain binding |
| GO:0038117 | 0.0081 | Inf | 0.0081 | 1 | 1 | C-C motif chemokine 19 receptor activity |
| GO:0038121 | 0.0081 | Inf | 0.0081 | 1 | 1 | C-C motif chemokine 21 receptor activity |
| GO:0070002 | 0.0081 | Inf | 0.0081 | 1 | 1 | glutamic-type peptidase activity |
| GO:0070320 | 0.0081 | Inf | 0.0081 | 1 | 1 | inward rectifier potassium channel inhibitor activity |
| GOMFID | Pvalue | OddsRatio | ExpCount | Count | Size | Term |
| GO:0035663 | 2e-04 | 231.2741 | 0.0261 | 2 | 3 | Toll-like receptor 2 binding |
| GO:0001965 | 8e-04 | 19.3955 | 0.1827 | 3 | 21 | G-protein alpha-subunit binding |
| GO:0004062 | 0.0011 | 57.8074 | 0.0522 | 2 | 6 | aryl sulfotransferase activity |
| GO:0015299 | 0.0064 | 19.2593 | 0.1218 | 2 | 14 | solute:proton antiporter activity |
| GO:0001069 | 0.0087 | Inf | 0.0087 | 1 | 1 | regulatory region RNA binding |
| GO:0004034 | 0.0087 | Inf | 0.0087 | 1 | 1 | aldose 1-epimerase activity |
| GO:0004941 | 0.0087 | Inf | 0.0087 | 1 | 1 | beta2-adrenergic receptor activity |
| GO:0031713 | 0.0087 | Inf | 0.0087 | 1 | 1 | B2 bradykinin receptor binding |
| GO:0031764 | 0.0087 | Inf | 0.0087 | 1 | 1 | type 1 galanin receptor binding |
| GO:0031857 | 0.0087 | Inf | 0.0087 | 1 | 1 | type 1 parathyroid hormone receptor binding |
| GO:0035375 | 0.0087 | Inf | 0.0087 | 1 | 1 | zymogen binding |
| GO:0097161 | 0.0087 | Inf | 0.0087 | 1 | 1 | DH domain binding |
| GO:1990631 | 0.0087 | Inf | 0.0087 | 1 | 1 | ErbB-4 class receptor binding |
| GO:0008329 | 0.0094 | 15.4044 | 0.1479 | 2 | 17 | signaling pattern recognition receptor activity |
| GOMFID | Pvalue | OddsRatio | ExpCount | Count | Size | Term |
| GO:0003730 | 3e-04 | 14.2271 | 0.3163 | 4 | 47 | mRNA 3'-UTR binding |
| GO:0015299 | 0.0039 | 25.0497 | 0.0942 | 2 | 14 | solute:proton antiporter activity |
| GO:0090079 | 0.0057 | 20.0359 | 0.1144 | 2 | 17 | translation regulator activity, nucleic acid binding |
| GO:0003692 | 0.0067 | Inf | 0.0067 | 1 | 1 | left-handed Z-DNA binding |
| GO:0004744 | 0.0067 | Inf | 0.0067 | 1 | 1 | retinal isomerase activity |
| GO:0022852 | 0.0067 | Inf | 0.0067 | 1 | 1 | glycine-gated chloride ion channel activity |
| GO:0036470 | 0.0067 | Inf | 0.0067 | 1 | 1 | tyrosine 3-monooxygenase activator activity |
| GO:0036478 | 0.0067 | Inf | 0.0067 | 1 | 1 | L-dopa decarboxylase activator activity |
| GO:0039552 | 0.0067 | Inf | 0.0067 | 1 | 1 | RIG-I binding |
| GO:0044388 | 0.0067 | Inf | 0.0067 | 1 | 1 | small protein activating enzyme binding |
| GO:0047323 | 0.0067 | Inf | 0.0067 | 1 | 1 | [3-methyl-2-oxobutanoate dehydrogenase (acetyl-transferring)] kinase activity |
| GO:0052884 | 0.0067 | Inf | 0.0067 | 1 | 1 | all-trans-retinyl-palmitate hydrolase, 11-cis retinol forming activity |
| GO:0052885 | 0.0067 | Inf | 0.0067 | 1 | 1 | all-trans-retinyl-ester hydrolase, 11-cis retinol forming activity |
| GO:1903135 | 0.0067 | Inf | 0.0067 | 1 | 1 | cupric ion binding |
| GO:1903136 | 0.0067 | Inf | 0.0067 | 1 | 1 | cuprous ion binding |
| GO:1990422 | 0.0067 | Inf | 0.0067 | 1 | 1 | glyoxalase (glycolic acid-forming) activity |
| GO:0030246 | 0.0098 | 3.4952 | 1.8173 | 6 | 270 | carbohydrate binding |
| GOMFID | Pvalue | OddsRatio | ExpCount | Count | Size | Term |
| GO:0004890 | 0.0081 | 16.7562 | 0.1372 | 2 | 16 | GABA-A receptor activity |
| GO:0004034 | 0.0086 | Inf | 0.0086 | 1 | 1 | aldose 1-epimerase activity |
| GO:0030377 | 0.0086 | Inf | 0.0086 | 1 | 1 | urokinase plasminogen activator receptor activity |
| GO:0031855 | 0.0086 | Inf | 0.0086 | 1 | 1 | oxytocin receptor binding |
| GO:0033735 | 0.0086 | Inf | 0.0086 | 1 | 1 | aspartate dehydrogenase activity |
| GO:0033862 | 0.0086 | Inf | 0.0086 | 1 | 1 | UMP kinase activity |
| GO:0046523 | 0.0086 | Inf | 0.0086 | 1 | 1 | S-methyl-5-thioribose-1-phosphate isomerase activity |
| GO:0050459 | 0.0086 | Inf | 0.0086 | 1 | 1 | ethanolamine-phosphate phospho-lyase activity |
| GOMFID | Pvalue | OddsRatio | ExpCount | Count | Size | Term |
| GO:0035663 | 4e-04 | 172.9556 | 0.0347 | 2 | 3 | Toll-like receptor 2 binding |
| GO:0042288 | 0.0011 | 17.3765 | 0.208 | 3 | 18 | MHC class I protein binding |
| GO:0042277 | 0.0015 | 3.5796 | 2.6811 | 9 | 232 | peptide binding |
| GO:0015297 | 0.0018 | 6.2538 | 0.8667 | 5 | 75 | antiporter activity |
| GO:0022803 | 0.004 | 2.5836 | 4.923 | 12 | 426 | passive transmembrane transporter activity |
| GO:0016811 | 0.0054 | 6.1147 | 0.7049 | 4 | 61 | hydrolase activity, acting on carbon-nitrogen (but not peptide) bonds, in linear amides |
| GO:0022838 | 0.0065 | 2.5299 | 4.5878 | 11 | 397 | substrate-specific channel activity |
| GO:0005372 | 0.0081 | 17.2856 | 0.1387 | 2 | 12 | water transmembrane transporter activity |
| GO:0005254 | 0.0092 | 5.1987 | 0.8205 | 4 | 71 | chloride channel activity |
| GOMFID | Pvalue | OddsRatio | ExpCount | Count | Size | Term |
| GO:0042162 | 0.0017 | 14.0885 | 0.24 | 3 | 30 | telomeric DNA binding |
| GO:0004034 | 0.008 | Inf | 0.008 | 1 | 1 | aldose 1-epimerase activity |
| GO:0004037 | 0.008 | Inf | 0.008 | 1 | 1 | allantoicase activity |
| GO:0004964 | 0.008 | Inf | 0.008 | 1 | 1 | luteinizing hormone receptor activity |
| GO:0004990 | 0.008 | Inf | 0.008 | 1 | 1 | oxytocin receptor activity |
| GO:0005115 | 0.008 | Inf | 0.008 | 1 | 1 | receptor tyrosine kinase-like orphan receptor binding |
| GO:0022852 | 0.008 | Inf | 0.008 | 1 | 1 | glycine-gated chloride ion channel activity |
| GO:0035472 | 0.008 | Inf | 0.008 | 1 | 1 | choriogonadotropin hormone receptor activity |
| GO:0038106 | 0.008 | Inf | 0.008 | 1 | 1 | choriogonadotropin hormone binding |
| GO:0039552 | 0.008 | Inf | 0.008 | 1 | 1 | RIG-I binding |
| GO:0047323 | 0.008 | Inf | 0.008 | 1 | 1 | [3-methyl-2-oxobutanoate dehydrogenase (acetyl-transferring)] kinase activity |
| GO:1990631 | 0.008 | Inf | 0.008 | 1 | 1 | ErbB-4 class receptor binding |
| GOMFID | Pvalue | OddsRatio | ExpCount | Count | Size | Term |
| GO:0004984 | 2e-04 | 4.1413 | 2.9131 | 11 | 373 | olfactory receptor activity |
| GO:0099600 | 0.0028 | 2.1963 | 9.5204 | 19 | 1219 | transmembrane receptor activity |
| GO:0003844 | 0.0078 | Inf | 0.0078 | 1 | 1 | 1,4-alpha-glucan branching enzyme activity |
| GO:0004037 | 0.0078 | Inf | 0.0078 | 1 | 1 | allantoicase activity |
| GO:0004874 | 0.0078 | Inf | 0.0078 | 1 | 1 | aryl hydrocarbon receptor activity |
| GO:0004997 | 0.0078 | Inf | 0.0078 | 1 | 1 | thyrotropin-releasing hormone receptor activity |
| GO:0047323 | 0.0078 | Inf | 0.0078 | 1 | 1 | [3-methyl-2-oxobutanoate dehydrogenase (acetyl-transferring)] kinase activity |
| GO:0047341 | 0.0078 | Inf | 0.0078 | 1 | 1 | fucose-1-phosphate guanylyltransferase activity |
| GO:1990631 | 0.0078 | Inf | 0.0078 | 1 | 1 | ErbB-4 class receptor binding |
| GO:0038023 | 0.009 | 1.9853 | 9.8465 | 18 | 1271 | signaling receptor activity |
| GOMFID | Pvalue | OddsRatio | ExpCount | Count | Size | Term |
| GO:0004984 | 9e-04 | 3.5621 | 3.0316 | 10 | 373 | olfactory receptor activity |
| GO:0004871 | 0.004 | 1.98 | 12.8333 | 23 | 1579 | signal transducer activity |
| GO:0003830 | 0.0081 | Inf | 0.0081 | 1 | 1 | beta-1,4-mannosylglycoprotein 4-beta-N-acetylglucosaminyltransferase activity |
| GO:0004512 | 0.0081 | Inf | 0.0081 | 1 | 1 | inositol-3-phosphate synthase activity |
| GO:0031704 | 0.0081 | Inf | 0.0081 | 1 | 1 | apelin receptor binding |
| GO:0031859 | 0.0081 | Inf | 0.0081 | 1 | 1 | platelet activating factor receptor binding |
| GO:0035375 | 0.0081 | Inf | 0.0081 | 1 | 1 | zymogen binding |
| GO:0042497 | 0.0081 | Inf | 0.0081 | 1 | 1 | triacyl lipopeptide binding |
| GO:0052731 | 0.0081 | Inf | 0.0081 | 1 | 1 | phosphocholine phosphatase activity |
| GO:0052732 | 0.0081 | Inf | 0.0081 | 1 | 1 | phosphoethanolamine phosphatase activity |
| GO:0008329 | 0.0082 | 16.5143 | 0.1382 | 2 | 17 | signaling pattern recognition receptor activity |
| GOMFID | Pvalue | OddsRatio | ExpCount | Count | Size | Term |
| GO:0038191 | 0 | 60.5078 | 0.0754 | 3 | 9 | neuropilin binding |
| GO:0030215 | 7e-04 | 20.1537 | 0.176 | 3 | 21 | semaphorin receptor binding |
| GO:0045499 | 0.0015 | 15.1095 | 0.2263 | 3 | 27 | chemorepellent activity |
| GO:0004984 | 0.0042 | 3.0661 | 3.1263 | 9 | 373 | olfactory receptor activity |
| GO:0005549 | 0.0052 | 6.1464 | 0.6957 | 4 | 83 | odorant binding |
| GO:0022804 | 0.006 | 3.1239 | 2.7156 | 8 | 324 | active transmembrane transporter activity |
| GO:0004145 | 0.0084 | Inf | 0.0084 | 1 | 1 | diamine N-acetyltransferase activity |
| GO:0004512 | 0.0084 | Inf | 0.0084 | 1 | 1 | inositol-3-phosphate synthase activity |
| GO:0004964 | 0.0084 | Inf | 0.0084 | 1 | 1 | luteinizing hormone receptor activity |
| GO:0005115 | 0.0084 | Inf | 0.0084 | 1 | 1 | receptor tyrosine kinase-like orphan receptor binding |
| GO:0035472 | 0.0084 | Inf | 0.0084 | 1 | 1 | choriogonadotropin hormone receptor activity |
| GO:0038106 | 0.0084 | Inf | 0.0084 | 1 | 1 | choriogonadotropin hormone binding |
| GO:0050023 | 0.0084 | Inf | 0.0084 | 1 | 1 | L-fuconate dehydratase activity |
| GO:0099516 | 0.0099 | 7.2405 | 0.4442 | 3 | 53 | ion antiporter activity |
| GOMFID | Pvalue | OddsRatio | ExpCount | Count | Size | Term |
| GO:0005549 | 0.0042 | 6.5595 | 0.6535 | 4 | 83 | odorant binding |
| GO:0005115 | 0.0079 | Inf | 0.0079 | 1 | 1 | receptor tyrosine kinase-like orphan receptor binding |
| GO:0050313 | 0.0079 | Inf | 0.0079 | 1 | 1 | sulfur dioxygenase activity |
| GO:0005537 | 0.0096 | 15.0511 | 0.1496 | 2 | 19 | mannose binding |
| GOMFID | Pvalue | OddsRatio | ExpCount | Count | Size | Term |
| GO:0004364 | 0 | 27.9091 | 0.2278 | 5 | 26 | glutathione transferase activity |
| GO:0035663 | 2e-04 | 229.5588 | 0.0263 | 2 | 3 | Toll-like receptor 2 binding |
| GO:0043295 | 0.004 | 25.4935 | 0.0964 | 2 | 11 | glutathione binding |
| GO:0015101 | 0.0065 | 19.1164 | 0.1227 | 2 | 14 | organic cation transmembrane transporter activity |
| GO:0030955 | 0.0074 | 17.6448 | 0.1314 | 2 | 15 | potassium ion binding |
| GO:0004124 | 0.0088 | Inf | 0.0088 | 1 | 1 | cysteine synthase activity |
| GO:0004642 | 0.0088 | Inf | 0.0088 | 1 | 1 | phosphoribosylformylglycinamidine synthase activity |
| GO:0031768 | 0.0088 | Inf | 0.0088 | 1 | 1 | ghrelin receptor binding |
| GO:0032500 | 0.0088 | Inf | 0.0088 | 1 | 1 | muramyl dipeptide binding |
| GO:0035375 | 0.0088 | Inf | 0.0088 | 1 | 1 | zymogen binding |
| GO:0038051 | 0.0088 | Inf | 0.0088 | 1 | 1 | glucocorticoid-activated RNA polymerase II transcription factor binding transcription factor activity |
| GO:0050421 | 0.0088 | Inf | 0.0088 | 1 | 1 | nitrite reductase (NO-forming) activity |
| GO:0050512 | 0.0088 | Inf | 0.0088 | 1 | 1 | lactosylceramide 4-alpha-galactosyltransferase activity |
| GO:0070025 | 0.0088 | Inf | 0.0088 | 1 | 1 | carbon monoxide binding |
| GO:1904047 | 0.0088 | Inf | 0.0088 | 1 | 1 | S-adenosyl-L-methionine binding |
| GO:1990259 | 0.0088 | Inf | 0.0088 | 1 | 1 | histone-glutamine methyltransferase activity |
| GOMFID | Pvalue | OddsRatio | ExpCount | Count | Size | Term |
| GO:0050840 | 0.001 | 9.9511 | 0.4449 | 4 | 49 | extracellular matrix binding |
| GO:0001968 | 0.0023 | 12.8407 | 0.2633 | 3 | 29 | fibronectin binding |
| GO:0030228 | 0.0069 | 18.4326 | 0.1271 | 2 | 14 | lipoprotein particle receptor activity |
| GO:0005115 | 0.0091 | Inf | 0.0091 | 1 | 1 | receptor tyrosine kinase-like orphan receptor binding |
| GO:0031877 | 0.0091 | Inf | 0.0091 | 1 | 1 | somatostatin receptor binding |
| GO:0032440 | 0.0091 | Inf | 0.0091 | 1 | 1 | 2-alkenal reductase [NAD(P)] activity |
| GO:0033823 | 0.0091 | Inf | 0.0091 | 1 | 1 | procollagen glucosyltransferase activity |
| GO:0035755 | 0.0091 | Inf | 0.0091 | 1 | 1 | cardiolipin hydrolase activity |
| GO:0047150 | 0.0091 | Inf | 0.0091 | 1 | 1 | betaine-homocysteine S-methyltransferase activity |
| GOMFID | Pvalue | OddsRatio | ExpCount | Count | Size | Term |
| GO:0035663 | 2e-04 | 247.9365 | 0.0244 | 2 | 3 | Toll-like receptor 2 binding |
| GO:0019534 | 0.001 | 61.9722 | 0.0488 | 2 | 6 | toxin transporter activity |
| GO:0004364 | 0.0012 | 16.2762 | 0.2113 | 3 | 26 | glutathione transferase activity |
| GO:0046920 | 0.0018 | 41.3095 | 0.065 | 2 | 8 | alpha-(1->3)-fucosyltransferase activity |
| GO:0045028 | 0.0028 | 30.9782 | 0.0813 | 2 | 10 | G-protein coupled purinergic nucleotide receptor activity |
| GO:0003823 | 0.0036 | 6.8705 | 0.6258 | 4 | 77 | antigen binding |
| GO:0004642 | 0.0081 | Inf | 0.0081 | 1 | 1 | phosphoribosylformylglycinamidine synthase activity |
| GO:0008445 | 0.0081 | Inf | 0.0081 | 1 | 1 | D-aspartate oxidase activity |
| GO:0008520 | 0.0081 | Inf | 0.0081 | 1 | 1 | L-ascorbate:sodium symporter activity |
| GO:0031768 | 0.0081 | Inf | 0.0081 | 1 | 1 | ghrelin receptor binding |
| GO:0031855 | 0.0081 | Inf | 0.0081 | 1 | 1 | oxytocin receptor binding |
| GO:0032500 | 0.0081 | Inf | 0.0081 | 1 | 1 | muramyl dipeptide binding |
| GO:0035375 | 0.0081 | Inf | 0.0081 | 1 | 1 | zymogen binding |
| GO:1990259 | 0.0081 | Inf | 0.0081 | 1 | 1 | histone-glutamine methyltransferase activity |
| GO:0016502 | 0.0082 | 16.5143 | 0.1382 | 2 | 17 | nucleotide receptor activity |
| GOMFID | Pvalue | OddsRatio | ExpCount | Count | Size | Term |
| GO:0016165 | 1e-04 | Inf | 0.0168 | 2 | 2 | linoleate 13S-lipoxygenase activity |
| GO:0005044 | 5e-04 | 11.872 | 0.3772 | 4 | 45 | scavenger receptor activity |
| GO:0004468 | 7e-04 | 80.0718 | 0.0419 | 2 | 5 | lysine N-acetyltransferase activity, acting on acetyl phosphate as donor |
| GO:0004062 | 0.001 | 60.05 | 0.0503 | 2 | 6 | aryl sulfotransferase activity |
| GO:0019864 | 0.0044 | 24.0108 | 0.1006 | 2 | 12 | IgG binding |
| GO:0016667 | 0.008 | 7.8721 | 0.4107 | 3 | 49 | oxidoreductase activity, acting on a sulfur group of donors |
| GO:0001069 | 0.0084 | Inf | 0.0084 | 1 | 1 | regulatory region RNA binding |
| GO:0031768 | 0.0084 | Inf | 0.0084 | 1 | 1 | ghrelin receptor binding |
| GO:0035375 | 0.0084 | Inf | 0.0084 | 1 | 1 | zymogen binding |
| GO:0036403 | 0.0084 | Inf | 0.0084 | 1 | 1 | arachidonate 8(S)-lipoxygenase activity |
| GO:0047127 | 0.0084 | Inf | 0.0084 | 1 | 1 | thiomorpholine-carboxylate dehydrogenase activity |
| GO:0047198 | 0.0084 | Inf | 0.0084 | 1 | 1 | cysteine-S-conjugate N-acetyltransferase activity |
| GO:0050528 | 0.0084 | Inf | 0.0084 | 1 | 1 | acyloxyacyl hydrolase activity |
| GO:0097689 | 0.0084 | Inf | 0.0084 | 1 | 1 | iron channel activity |
| GO:0008329 | 0.0087 | 16.0021 | 0.1425 | 2 | 17 | signaling pattern recognition receptor activity |
| GOMFID | Pvalue | OddsRatio | ExpCount | Count | Size | Term |
| GO:0004930 | 0 | 3.5627 | 5.1274 | 16 | 784 | G-protein coupled receptor activity |
| GO:0004984 | 2e-04 | 4.5271 | 2.4395 | 10 | 373 | olfactory receptor activity |
| GO:0060089 | 7e-04 | 2.4385 | 9.8625 | 21 | 1508 | molecular transducer activity |
| GO:0099600 | 9e-04 | 2.547 | 7.9724 | 18 | 1219 | transmembrane receptor activity |
| GO:0038023 | 0.0014 | 2.4304 | 8.319 | 18 | 1272 | signaling receptor activity |
| GO:0003939 | 0.0065 | Inf | 0.0065 | 1 | 1 | L-iditol 2-dehydrogenase activity |
| GO:0046526 | 0.0065 | Inf | 0.0065 | 1 | 1 | D-xylulose reductase activity |
| GO:0070224 | 0.0065 | Inf | 0.0065 | 1 | 1 | sulfide:quinone oxidoreductase activity |
| GOMFID | Pvalue | OddsRatio | ExpCount | Count | Size | Term |
| GO:0001164 | 0.0029 | 32.2567 | 0.0828 | 2 | 8 | RNA polymerase I CORE element sequence-specific DNA binding |
| GO:0030957 | 0.0029 | 32.2567 | 0.0828 | 2 | 8 | Tat protein binding |
| GO:0001013 | 0.0037 | 27.6469 | 0.0931 | 2 | 9 | RNA polymerase I regulatory region DNA binding |
| GO:0097153 | 0.0055 | 21.5003 | 0.1138 | 2 | 11 | cysteine-type endopeptidase activity involved in apoptotic process |
| GO:0070034 | 0.0077 | 17.5889 | 0.1345 | 2 | 13 | telomerase RNA binding |
| GOMFID | Pvalue | OddsRatio | ExpCount | Count | Size | Term |
| GO:0008147 | 1e-04 | Inf | 0.0161 | 2 | 2 | structural constituent of bone |
| GO:0043169 | 0.0019 | 1.7586 | 31.9254 | 47 | 3959 | cation binding |
| GO:0051427 | 0.0021 | 4.8532 | 1.3225 | 6 | 164 | hormone receptor binding |
| GO:0005509 | 0.0025 | 2.6479 | 5.3061 | 13 | 658 | calcium ion binding |
| GO:0019955 | 0.0047 | 6.3179 | 0.6774 | 4 | 84 | cytokine binding |
| GO:0003714 | 0.0056 | 3.9434 | 1.6128 | 6 | 200 | transcription corepressor activity |
| GO:0008565 | 0.0076 | 5.4896 | 0.7741 | 4 | 96 | protein transporter activity |
| GO:0000822 | 0.0081 | Inf | 0.0081 | 1 | 1 | inositol hexakisphosphate binding |
| GO:0004489 | 0.0081 | Inf | 0.0081 | 1 | 1 | methylenetetrahydrofolate reductase (NAD(P)H) activity |
| GO:0004807 | 0.0081 | Inf | 0.0081 | 1 | 1 | triose-phosphate isomerase activity |
| GO:0031857 | 0.0081 | Inf | 0.0081 | 1 | 1 | type 1 parathyroid hormone receptor binding |
| GO:0033737 | 0.0081 | Inf | 0.0081 | 1 | 1 | 1-pyrroline dehydrogenase activity |
| GO:0036470 | 0.0081 | Inf | 0.0081 | 1 | 1 | tyrosine 3-monooxygenase activator activity |
| GO:0036478 | 0.0081 | Inf | 0.0081 | 1 | 1 | L-dopa decarboxylase activator activity |
| GO:0044388 | 0.0081 | Inf | 0.0081 | 1 | 1 | small protein activating enzyme binding |
| GO:0097689 | 0.0081 | Inf | 0.0081 | 1 | 1 | iron channel activity |
| GO:1903135 | 0.0081 | Inf | 0.0081 | 1 | 1 | cupric ion binding |
| GO:1903136 | 0.0081 | Inf | 0.0081 | 1 | 1 | cuprous ion binding |
| GO:1990422 | 0.0081 | Inf | 0.0081 | 1 | 1 | glyoxalase (glycolic acid-forming) activity |
| GO:1990595 | 0.0081 | Inf | 0.0081 | 1 | 1 | mast cell secretagogue receptor activity |
| GOMFID | Pvalue | OddsRatio | ExpCount | Count | Size | Term |
| GO:0030957 | 1e-04 | 55.6179 | 0.0869 | 3 | 8 | Tat protein binding |
| GO:0035663 | 3e-04 | 184.3432 | 0.0326 | 2 | 3 | Toll-like receptor 2 binding |
| GO:0043014 | 0.0019 | 13.8911 | 0.2497 | 3 | 23 | alpha-tubulin binding |
| GO:0001164 | 0.0031 | 30.714 | 0.0869 | 2 | 8 | RNA polymerase I CORE element sequence-specific DNA binding |
| GO:0001013 | 0.004 | 26.3246 | 0.0977 | 2 | 9 | RNA polymerase I regulatory region DNA binding |
| GO:0048487 | 0.0045 | 9.9171 | 0.3366 | 3 | 31 | beta-tubulin binding |
| GO:0048156 | 0.006 | 20.4721 | 0.1194 | 2 | 11 | tau protein binding |
| GO:0046983 | 0.009 | 1.8627 | 12.0522 | 21 | 1110 | protein dimerization activity |
| GOMFID | Pvalue | OddsRatio | ExpCount | Count | Size | Term |
| GO:0003993 | 0.0053 | 21.9128 | 0.1118 | 2 | 11 | acid phosphatase activity |
| GO:0015125 | 0.0063 | 19.7203 | 0.1219 | 2 | 12 | bile acid transmembrane transporter activity |
| GO:0001784 | 0.0099 | 15.1665 | 0.1524 | 2 | 15 | phosphotyrosine binding |
| GOMFID | Pvalue | OddsRatio | ExpCount | Count | Size | Term |
| GO:0035925 | 0.0032 | 29.4967 | 0.0874 | 2 | 9 | mRNA 3'-UTR AU-rich region binding |
| GO:0005088 | 0.0068 | 4.4696 | 1.1852 | 5 | 122 | Ras guanyl-nucleotide exchange factor activity |
| GO:0005244 | 0.0075 | 3.7037 | 1.7098 | 6 | 176 | voltage-gated ion channel activity |
| GO:0022836 | 0.0082 | 2.943 | 2.8659 | 8 | 295 | gated channel activity |
| GO:0004395 | 0.0097 | Inf | 0.0097 | 1 | 1 | hexaprenyldihydroxybenzoate methyltransferase activity |
| GO:0008169 | 0.0097 | Inf | 0.0097 | 1 | 1 | C-methyltransferase activity |
| GO:0008425 | 0.0097 | Inf | 0.0097 | 1 | 1 | 2-polyprenyl-6-methoxy-1,4-benzoquinone methyltransferase activity |
| GO:0008689 | 0.0097 | Inf | 0.0097 | 1 | 1 | 3-demethylubiquinone-9 3-O-methyltransferase activity |
| GO:0070287 | 0.0097 | Inf | 0.0097 | 1 | 1 | ferritin receptor activity |
| GO:0098782 | 0.0097 | Inf | 0.0097 | 1 | 1 | mechanically-gated potassium channel activity |
| GOMFID | Pvalue | OddsRatio | ExpCount | Count | Size | Term |
| GO:0005201 | 0.0018 | 8.3984 | 0.519 | 4 | 61 | extracellular matrix structural constituent |
| GO:0004674 | 0.0031 | 3.0058 | 3.5565 | 10 | 418 | protein serine/threonine kinase activity |
| GO:0043295 | 0.0038 | 26.2727 | 0.0936 | 2 | 11 | glutathione binding |
| GO:0004395 | 0.0085 | Inf | 0.0085 | 1 | 1 | hexaprenyldihydroxybenzoate methyltransferase activity |
| GO:0004917 | 0.0085 | Inf | 0.0085 | 1 | 1 | interleukin-7 receptor activity |
| GO:0008169 | 0.0085 | Inf | 0.0085 | 1 | 1 | C-methyltransferase activity |
| GO:0008425 | 0.0085 | Inf | 0.0085 | 1 | 1 | 2-polyprenyl-6-methoxy-1,4-benzoquinone methyltransferase activity |
| GO:0008689 | 0.0085 | Inf | 0.0085 | 1 | 1 | 3-demethylubiquinone-9 3-O-methyltransferase activity |
| GO:0050333 | 0.0085 | Inf | 0.0085 | 1 | 1 | thiamin-triphosphatase activity |
| GO:0070287 | 0.0085 | Inf | 0.0085 | 1 | 1 | ferritin receptor activity |
| GO:0086077 | 0.0085 | Inf | 0.0085 | 1 | 1 | gap junction channel activity involved in AV node cell-bundle of His cell electrical coupling |
| GOMFID | Pvalue | OddsRatio | ExpCount | Count | Size | Term |
| GO:0008147 | 1e-04 | Inf | 0.0151 | 2 | 2 | structural constituent of bone |
| GO:0005149 | 2e-04 | 33.6595 | 0.1133 | 3 | 15 | interleukin-1 receptor binding |
| GO:0005201 | 0.0012 | 9.503 | 0.4609 | 4 | 61 | extracellular matrix structural constituent |
| GO:0005164 | 0.0012 | 16.1431 | 0.2116 | 3 | 28 | tumor necrosis factor receptor binding |
| GO:0042277 | 0.0019 | 4.2792 | 1.753 | 7 | 232 | peptide binding |
| GO:0019825 | 0.0025 | 12.2234 | 0.272 | 3 | 36 | oxygen binding |
| GO:0016641 | 0.0042 | 24.272 | 0.0982 | 2 | 13 | oxidoreductase activity, acting on the CH-NH2 group of donors, oxygen as acceptor |
| GO:0017127 | 0.0042 | 24.272 | 0.0982 | 2 | 13 | cholesterol transporter activity |
| GO:0035257 | 0.0046 | 4.9237 | 1.0805 | 5 | 143 | nuclear hormone receptor binding |
| GO:0015238 | 0.0056 | 20.5352 | 0.1133 | 2 | 15 | drug transmembrane transporter activity |
| GO:0005125 | 0.0058 | 3.9178 | 1.6245 | 6 | 215 | cytokine activity |
| GO:0016298 | 0.0072 | 5.5699 | 0.7632 | 4 | 101 | lipase activity |
| GO:0004476 | 0.0076 | Inf | 0.0076 | 1 | 1 | mannose-6-phosphate isomerase activity |
| GO:0005130 | 0.0076 | Inf | 0.0076 | 1 | 1 | granulocyte colony-stimulating factor receptor binding |
| GO:0005459 | 0.0076 | Inf | 0.0076 | 1 | 1 | UDP-galactose transmembrane transporter activity |
| GO:0008445 | 0.0076 | Inf | 0.0076 | 1 | 1 | D-aspartate oxidase activity |
| GO:0034039 | 0.0076 | Inf | 0.0076 | 1 | 1 | 8-oxo-7,8-dihydroguanine DNA N-glycosylase activity |
| GO:0035755 | 0.0076 | Inf | 0.0076 | 1 | 1 | cardiolipin hydrolase activity |
| GO:0036139 | 0.0076 | Inf | 0.0076 | 1 | 1 | peptidyl-histidine dioxygenase activity |
| GO:0036140 | 0.0076 | Inf | 0.0076 | 1 | 1 | peptidyl-asparagine 3-dioxygenase activity |
| GO:0042947 | 0.0076 | Inf | 0.0076 | 1 | 1 | glucoside transmembrane transporter activity |
| GO:0051424 | 0.0076 | Inf | 0.0076 | 1 | 1 | corticotropin-releasing hormone binding |
| GOMFID | Pvalue | OddsRatio | ExpCount | Count | Size | Term |
| GO:0008519 | 4e-04 | 13.1392 | 0.368 | 4 | 23 | ammonium transmembrane transporter activity |
| GO:0004427 | 0.0015 | 61.98 | 0.064 | 2 | 4 | inorganic diphosphatase activity |
| GO:0042809 | 0.0016 | 15.5472 | 0.24 | 3 | 15 | vitamin D receptor binding |
| GO:0030375 | 0.0025 | 41.3173 | 0.08 | 2 | 5 | thyroid hormone receptor coactivator activity |
| GO:0097110 | 0.0041 | 6.7393 | 0.656 | 4 | 41 | scaffold protein binding |
| GO:0043995 | 0.0051 | 24.7872 | 0.112 | 2 | 7 | histone acetyltransferase activity (H4-K5 specific) |
| GO:0043996 | 0.0051 | 24.7872 | 0.112 | 2 | 7 | histone acetyltransferase activity (H4-K8 specific) |
| GO:0046972 | 0.0051 | 24.7872 | 0.112 | 2 | 7 | histone acetyltransferase activity (H4-K16 specific) |
| GO:0004129 | 0.0057 | 9.3235 | 0.368 | 3 | 23 | cytochrome-c oxidase activity |
| GO:0005096 | 0.0064 | 2.6721 | 3.9362 | 10 | 246 | GTPase activator activity |
| GO:0016675 | 0.0064 | 8.8789 | 0.384 | 3 | 24 | oxidoreductase activity, acting on a heme group of donors |
| GO:0016538 | 0.008 | 8.1058 | 0.416 | 3 | 26 | cyclin-dependent protein serine/threonine kinase regulator activity |
| GOMFID | Pvalue | OddsRatio | ExpCount | Count | Size | Term |
| GO:0004504 | 0.0075 | Inf | 0.0075 | 1 | 1 | peptidylglycine monooxygenase activity |
| GO:0004598 | 0.0075 | Inf | 0.0075 | 1 | 1 | peptidylamidoglycolate lyase activity |
| GO:0031851 | 0.0075 | Inf | 0.0075 | 1 | 1 | kappa-type opioid receptor binding |
| GO:0032500 | 0.0075 | Inf | 0.0075 | 1 | 1 | muramyl dipeptide binding |
| GO:0047150 | 0.0075 | Inf | 0.0075 | 1 | 1 | betaine-homocysteine S-methyltransferase activity |
| GO:1990595 | 0.0075 | Inf | 0.0075 | 1 | 1 | mast cell secretagogue receptor activity |
| GOMFID | Pvalue | OddsRatio | ExpCount | Count | Size | Term |
| GO:0035663 | 2e-04 | 254.0325 | 0.0238 | 2 | 3 | Toll-like receptor 2 binding |
| GO:0048030 | 4e-04 | 127.0081 | 0.0317 | 2 | 4 | disaccharide binding |
| GO:0030246 | 0.0014 | 4.0091 | 2.143 | 8 | 270 | carbohydrate binding |
| GO:0099600 | 0.0015 | 2.2916 | 9.6752 | 20 | 1219 | transmembrane receptor activity |
| GO:0038023 | 0.0024 | 2.1865 | 10.0959 | 20 | 1272 | signaling receptor activity |
| GO:0060089 | 0.0036 | 2.0321 | 11.969 | 22 | 1508 | molecular transducer activity |
| GO:0019864 | 0.0039 | 25.3886 | 0.0952 | 2 | 12 | IgG binding |
| GO:0004034 | 0.0079 | Inf | 0.0079 | 1 | 1 | aldose 1-epimerase activity |
| GO:0016990 | 0.0079 | Inf | 0.0079 | 1 | 1 | arginine deiminase activity |
| GO:0033682 | 0.0079 | Inf | 0.0079 | 1 | 1 | ATP-dependent 5'-3' DNA/RNA helicase activity |
| GO:0033791 | 0.0079 | Inf | 0.0079 | 1 | 1 | 3alpha,7alpha,12alpha-trihydroxy-5beta-cholestanoyl-CoA 24-hydroxylase activity |
| GO:0038051 | 0.0079 | Inf | 0.0079 | 1 | 1 | glucocorticoid-activated RNA polymerase II transcription factor binding transcription factor activity |
| GO:0004984 | 0.0098 | 2.8585 | 2.9605 | 8 | 373 | olfactory receptor activity |
| GOMFID | Pvalue | OddsRatio | ExpCount | Count | Size | Term |
| GO:0042605 | 0 | 27.8804 | 0.1768 | 4 | 24 | peptide antigen binding |
| GO:0035663 | 2e-04 | 274.2456 | 0.0221 | 2 | 3 | Toll-like receptor 2 binding |
| GO:0035727 | 2e-04 | 274.2456 | 0.0221 | 2 | 3 | lysophosphatidic acid binding |
| GO:0033218 | 6e-04 | 4.6142 | 1.8782 | 8 | 255 | amide binding |
| GO:0004181 | 7e-04 | 19.737 | 0.1768 | 3 | 24 | metallocarboxypeptidase activity |
| GO:0019957 | 0.0011 | 54.8351 | 0.0516 | 2 | 7 | C-C chemokine binding |
| GO:0035925 | 0.0019 | 39.1629 | 0.0663 | 2 | 9 | mRNA 3'-UTR AU-rich region binding |
| GO:0048020 | 0.0021 | 12.9433 | 0.2578 | 3 | 35 | CCR chemokine receptor binding |
| GO:0032395 | 0.0023 | 34.2654 | 0.0737 | 2 | 10 | MHC class II receptor activity |
| GO:0018024 | 0.0039 | 10.3493 | 0.3167 | 3 | 43 | histone-lysine N-methyltransferase activity |
| GO:0016805 | 0.0046 | 22.8377 | 0.1031 | 2 | 14 | dipeptidase activity |
| GO:0052742 | 0.006 | 19.5727 | 0.1178 | 2 | 16 | phosphatidylinositol kinase activity |
| GO:0016278 | 0.0074 | 8.1114 | 0.3977 | 3 | 54 | lysine N-methyltransferase activity |
| GO:0001872 | 0.0074 | Inf | 0.0074 | 1 | 1 | (1->3)-beta-D-glucan binding |
| GO:0004124 | 0.0074 | Inf | 0.0074 | 1 | 1 | cysteine synthase activity |
| GO:0004502 | 0.0074 | Inf | 0.0074 | 1 | 1 | kynurenine 3-monooxygenase activity |
| GO:0017005 | 0.0074 | Inf | 0.0074 | 1 | 1 | 3'-tyrosyl-DNA phosphodiesterase activity |
| GO:0031857 | 0.0074 | Inf | 0.0074 | 1 | 1 | type 1 parathyroid hormone receptor binding |
| GO:0047225 | 0.0074 | Inf | 0.0074 | 1 | 1 | acetylgalactosaminyl-O-glycosyl-glycoprotein beta-1,6-N-acetylglucosaminyltransferase activity |
| GO:0050421 | 0.0074 | Inf | 0.0074 | 1 | 1 | nitrite reductase (NO-forming) activity |
| GO:0070025 | 0.0074 | Inf | 0.0074 | 1 | 1 | carbon monoxide binding |
| GO:1904047 | 0.0074 | Inf | 0.0074 | 1 | 1 | S-adenosyl-L-methionine binding |
| GO:1904492 | 0.0074 | Inf | 0.0074 | 1 | 1 | Ac-Asp-Glu binding |
| GO:1904493 | 0.0074 | Inf | 0.0074 | 1 | 1 | tetrahydrofolyl-poly(glutamate) polymer binding |
| GO:1990595 | 0.0074 | Inf | 0.0074 | 1 | 1 | mast cell secretagogue receptor activity |
| GO:1901981 | 0.0075 | 5.4922 | 0.7734 | 4 | 105 | phosphatidylinositol phosphate binding |
| GO:0072341 | 0.0085 | 7.6593 | 0.4198 | 3 | 57 | modified amino acid binding |
| GOMFID | Pvalue | OddsRatio | ExpCount | Count | Size | Term |
| GO:0004065 | 0.001 | 56.086 | 0.0483 | 2 | 8 | arylsulfatase activity |
| GO:0003912 | 0.006 | Inf | 0.006 | 1 | 1 | DNA nucleotidylexotransferase activity |
| GO:0005141 | 0.006 | Inf | 0.006 | 1 | 1 | interleukin-10 receptor binding |
| GO:0005298 | 0.006 | Inf | 0.006 | 1 | 1 | proline:sodium symporter activity |
| GO:0015130 | 0.006 | Inf | 0.006 | 1 | 1 | mevalonate transmembrane transporter activity |
| GO:0032440 | 0.006 | Inf | 0.006 | 1 | 1 | 2-alkenal reductase [NAD(P)] activity |
| GO:0005102 | 0.0097 | 2.0767 | 8.4872 | 16 | 1407 | receptor binding |
| GOMFID | Pvalue | OddsRatio | ExpCount | Count | Size | Term |
| GO:0038023 | 3e-04 | 2.6247 | 9.1267 | 21 | 1272 | signaling receptor activity |
| GO:0008528 | 3e-04 | 7.3743 | 0.8897 | 6 | 124 | G-protein coupled peptide receptor activity |
| GO:0099600 | 4e-04 | 2.5894 | 8.7464 | 20 | 1219 | transmembrane receptor activity |
| GO:0004435 | 0.001 | 17.0302 | 0.2009 | 3 | 28 | phosphatidylinositol phospholipase C activity |
| GO:0004930 | 0.0017 | 2.9342 | 4.4709 | 12 | 659 | G-protein coupled receptor activity |
| GO:0016493 | 0.0032 | 28.155 | 0.0861 | 2 | 12 | C-C chemokine receptor activity |
| GO:0016298 | 0.006 | 5.8787 | 0.7247 | 4 | 101 | lipase activity |
| GO:0004807 | 0.0072 | Inf | 0.0072 | 1 | 1 | triose-phosphate isomerase activity |
| GO:1904399 | 0.0072 | Inf | 0.0072 | 1 | 1 | heparan sulfate binding |
| GO:1990595 | 0.0072 | Inf | 0.0072 | 1 | 1 | mast cell secretagogue receptor activity |
| GO:0004872 | 0.0076 | 4.35 | 1.2239 | 5 | 192 | receptor activity |
| GOMFID | Pvalue | OddsRatio | ExpCount | Count | Size | Term |
| GO:0005549 | 0.0028 | 7.3626 | 0.585 | 4 | 83 | odorant binding |
| GO:0004502 | 0.007 | Inf | 0.007 | 1 | 1 | kynurenine 3-monooxygenase activity |
| GO:0004503 | 0.007 | Inf | 0.007 | 1 | 1 | monophenol monooxygenase activity |
| GO:0004512 | 0.007 | Inf | 0.007 | 1 | 1 | inositol-3-phosphate synthase activity |
| GO:0004557 | 0.007 | Inf | 0.007 | 1 | 1 | alpha-galactosidase activity |
| GO:0004819 | 0.007 | Inf | 0.007 | 1 | 1 | glutamine-tRNA ligase activity |
| GO:0008456 | 0.007 | Inf | 0.007 | 1 | 1 | alpha-N-acetylgalactosaminidase activity |
| GO:0030626 | 0.007 | Inf | 0.007 | 1 | 1 | U12 snRNA binding |
| GO:0045517 | 0.007 | Inf | 0.007 | 1 | 1 | interleukin-20 receptor binding |
| GOMFID | Pvalue | OddsRatio | ExpCount | Count | Size | Term |
| GO:0004984 | 0.0031 | 3.5255 | 2.4395 | 8 | 373 | olfactory receptor activity |
| GO:0072341 | 0.0062 | 8.6622 | 0.3728 | 3 | 57 | modified amino acid binding |
| GO:0004124 | 0.0065 | Inf | 0.0065 | 1 | 1 | cysteine synthase activity |
| GO:0004502 | 0.0065 | Inf | 0.0065 | 1 | 1 | kynurenine 3-monooxygenase activity |
| GO:0004819 | 0.0065 | Inf | 0.0065 | 1 | 1 | glutamine-tRNA ligase activity |
| GO:0015130 | 0.0065 | Inf | 0.0065 | 1 | 1 | mevalonate transmembrane transporter activity |
| GO:0030272 | 0.0065 | Inf | 0.0065 | 1 | 1 | 5-formyltetrahydrofolate cyclo-ligase activity |
| GO:0031695 | 0.0065 | Inf | 0.0065 | 1 | 1 | alpha-2B adrenergic receptor binding |
| GO:0047341 | 0.0065 | Inf | 0.0065 | 1 | 1 | fucose-1-phosphate guanylyltransferase activity |
| GO:0050421 | 0.0065 | Inf | 0.0065 | 1 | 1 | nitrite reductase (NO-forming) activity |
| GO:0070025 | 0.0065 | Inf | 0.0065 | 1 | 1 | carbon monoxide binding |
| GO:1904047 | 0.0065 | Inf | 0.0065 | 1 | 1 | S-adenosyl-L-methionine binding |
| GO:0050699 | 0.009 | 15.4713 | 0.1439 | 2 | 22 | WW domain binding |
| GO:0043168 | 0.0095 | 1.7952 | 16.3699 | 26 | 2503 | anion binding |
| GOMFID | Pvalue | OddsRatio | ExpCount | Count | Size | Term |
| GO:0047372 | 0.0013 | 51.2131 | 0.0551 | 2 | 7 | acylglycerol lipase activity |
| GO:0004865 | 0.0017 | 42.6749 | 0.063 | 2 | 8 | protein serine/threonine phosphatase inhibitor activity |
| GO:0004806 | 0.0053 | 21.3292 | 0.1102 | 2 | 14 | triglyceride lipase activity |
| GO:0004497 | 0.006 | 5.8852 | 0.7244 | 4 | 92 | monooxygenase activity |
| GO:0016705 | 0.0063 | 4.549 | 1.1653 | 5 | 148 | oxidoreductase activity, acting on paired donors, with incorporation or reduction of molecular oxygen |
| GO:0004502 | 0.0079 | Inf | 0.0079 | 1 | 1 | kynurenine 3-monooxygenase activity |
| GO:0004503 | 0.0079 | Inf | 0.0079 | 1 | 1 | monophenol monooxygenase activity |
| GO:0004557 | 0.0079 | Inf | 0.0079 | 1 | 1 | alpha-galactosidase activity |
| GO:0005141 | 0.0079 | Inf | 0.0079 | 1 | 1 | interleukin-10 receptor binding |
| GO:0005335 | 0.0079 | Inf | 0.0079 | 1 | 1 | serotonin:sodium symporter activity |
| GO:0008456 | 0.0079 | Inf | 0.0079 | 1 | 1 | alpha-N-acetylgalactosaminidase activity |
| GO:0019811 | 0.0079 | Inf | 0.0079 | 1 | 1 | cocaine binding |
| GO:0031751 | 0.0079 | Inf | 0.0079 | 1 | 1 | D4 dopamine receptor binding |
| GO:0045517 | 0.0079 | Inf | 0.0079 | 1 | 1 | interleukin-20 receptor binding |
| GO:0046914 | 0.0085 | 1.961 | 10.5426 | 19 | 1339 | transition metal ion binding |
| GO:0004984 | 0.0094 | 2.8833 | 2.9368 | 8 | 373 | olfactory receptor activity |
| GOMFID | Pvalue | OddsRatio | ExpCount | Count | Size | Term |
| GO:0005096 | 1e-04 | 4.8968 | 2.2337 | 10 | 246 | GTPase activator activity |
| GO:0060589 | 4e-04 | 4.0133 | 2.6967 | 10 | 297 | nucleoside-triphosphatase regulator activity |
| GO:0015103 | 0.0024 | 5.793 | 0.9262 | 5 | 102 | inorganic anion transmembrane transporter activity |
| GO:0004872 | 0.0046 | 1.9192 | 13.6926 | 24 | 1508 | receptor activity |
| GO:0015172 | 0.0069 | 18.4326 | 0.1271 | 2 | 14 | acidic amino acid transmembrane transporter activity |
| GO:0004890 | 0.009 | 15.7974 | 0.1453 | 2 | 16 | GABA-A receptor activity |
| GO:0004304 | 0.0091 | Inf | 0.0091 | 1 | 1 | estrone sulfotransferase activity |
| GO:0004334 | 0.0091 | Inf | 0.0091 | 1 | 1 | fumarylacetoacetase activity |
| GO:0004476 | 0.0091 | Inf | 0.0091 | 1 | 1 | mannose-6-phosphate isomerase activity |
| GO:0005141 | 0.0091 | Inf | 0.0091 | 1 | 1 | interleukin-10 receptor binding |
| GO:0005335 | 0.0091 | Inf | 0.0091 | 1 | 1 | serotonin:sodium symporter activity |
| GO:0008108 | 0.0091 | Inf | 0.0091 | 1 | 1 | UDP-glucose:hexose-1-phosphate uridylyltransferase activity |
| GO:0008555 | 0.0091 | Inf | 0.0091 | 1 | 1 | chloride-transporting ATPase activity |
| GO:0015327 | 0.0091 | Inf | 0.0091 | 1 | 1 | cystine:glutamate antiporter activity |
| GO:0019811 | 0.0091 | Inf | 0.0091 | 1 | 1 | cocaine binding |
| GO:1901680 | 0.0091 | Inf | 0.0091 | 1 | 1 | sulfur-containing amino acid secondary active transmembrane transporter activity |
| GO:0004888 | 0.0099 | 1.9171 | 10.6599 | 19 | 1174 | transmembrane signaling receptor activity |
| GOMFID | Pvalue | OddsRatio | ExpCount | Count | Size | Term |
| GO:0030246 | 0.0012 | 4.1154 | 2.0916 | 8 | 270 | carbohydrate binding |
| GO:0016798 | 0.0022 | 5.9199 | 0.9063 | 5 | 117 | hydrolase activity, acting on glycosyl bonds |
| GO:0016805 | 0.0051 | 21.6875 | 0.1085 | 2 | 14 | dipeptidase activity |
| GO:0003844 | 0.0077 | Inf | 0.0077 | 1 | 1 | 1,4-alpha-glucan branching enzyme activity |
| GO:0003944 | 0.0077 | Inf | 0.0077 | 1 | 1 | N-acetylglucosamine-1-phosphodiester alpha-N-acetylglucosaminidase activity |
| GO:0004037 | 0.0077 | Inf | 0.0077 | 1 | 1 | allantoicase activity |
| GO:0008843 | 0.0077 | Inf | 0.0077 | 1 | 1 | endochitinase activity |
| GO:0030272 | 0.0077 | Inf | 0.0077 | 1 | 1 | 5-formyltetrahydrofolate cyclo-ligase activity |
| GO:0030377 | 0.0077 | Inf | 0.0077 | 1 | 1 | urokinase plasminogen activator receptor activity |
| GO:0098619 | 0.0077 | Inf | 0.0077 | 1 | 1 | selenocysteine-tRNA ligase activity |
| GO:1904492 | 0.0077 | Inf | 0.0077 | 1 | 1 | Ac-Asp-Glu binding |
| GO:1904493 | 0.0077 | Inf | 0.0077 | 1 | 1 | tetrahydrofolyl-poly(glutamate) polymer binding |
| GO:0023023 | 0.0093 | 15.3039 | 0.1472 | 2 | 19 | MHC protein complex binding |
| GOMFID | Pvalue | OddsRatio | ExpCount | Count | Size | Term |
| GO:0070051 | 4e-04 | 128.0574 | 0.0315 | 2 | 4 | fibrinogen binding |
| GO:0004304 | 0.0079 | Inf | 0.0079 | 1 | 1 | estrone sulfotransferase activity |
| GO:0008507 | 0.0079 | Inf | 0.0079 | 1 | 1 | sodium:iodide symporter activity |
| GO:0030377 | 0.0079 | Inf | 0.0079 | 1 | 1 | urokinase plasminogen activator receptor activity |
| GO:0031855 | 0.0079 | Inf | 0.0079 | 1 | 1 | oxytocin receptor binding |
| GO:0046964 | 0.0079 | Inf | 0.0079 | 1 | 1 | 3'-phosphoadenosine 5'-phosphosulfate transmembrane transporter activity |
| GOMFID | Pvalue | OddsRatio | ExpCount | Count | Size | Term |
| GO:0008308 | 0.0053 | 21.1545 | 0.1111 | 2 | 14 | voltage-gated anion channel activity |
| GO:0046527 | 0.0061 | 19.526 | 0.1191 | 2 | 15 | glucosyltransferase activity |
| GO:0004304 | 0.0079 | Inf | 0.0079 | 1 | 1 | estrone sulfotransferase activity |
| GO:0016913 | 0.0079 | Inf | 0.0079 | 1 | 1 | follicle-stimulating hormone activity |
| GO:0050512 | 0.0079 | Inf | 0.0079 | 1 | 1 | lactosylceramide 4-alpha-galactosyltransferase activity |
| GOMFID | Pvalue | OddsRatio | ExpCount | Count | Size | Term |
| GO:0004111 | 5e-04 | 83.2394 | 0.0366 | 2 | 6 | creatine kinase activity |
| GO:0031402 | 0.0032 | 27.7323 | 0.0853 | 2 | 14 | sodium ion binding |
| GO:0005132 | 0.0047 | 22.1816 | 0.1036 | 2 | 17 | type I interferon receptor binding |
| GO:0008327 | 0.0059 | 19.5695 | 0.1158 | 2 | 19 | methyl-CpG binding |
| GO:0005248 | 0.0065 | 18.4811 | 0.1219 | 2 | 20 | voltage-gated sodium channel activity |
| GO:0005509 | 0.0067 | 2.6925 | 4.0109 | 10 | 658 | calcium ion binding |
| GOMFID | Pvalue | OddsRatio | ExpCount | Count | Size | Term |
| GO:0005185 | 1e-04 | Inf | 0.0154 | 2 | 2 | neurohypophyseal hormone activity |
| GO:0035325 | 0.0012 | 52.5143 | 0.0538 | 2 | 7 | Toll-like receptor binding |
| GO:0034235 | 0.0016 | 43.7591 | 0.0615 | 2 | 8 | GPI anchor binding |
| GO:0008329 | 0.0074 | 17.4936 | 0.1306 | 2 | 17 | signaling pattern recognition receptor activity |
| GO:0008445 | 0.0077 | Inf | 0.0077 | 1 | 1 | D-aspartate oxidase activity |
| GO:0031855 | 0.0077 | Inf | 0.0077 | 1 | 1 | oxytocin receptor binding |
| GO:0031895 | 0.0077 | Inf | 0.0077 | 1 | 1 | V1B vasopressin receptor binding |
| GO:0035375 | 0.0077 | Inf | 0.0077 | 1 | 1 | zymogen binding |
| GO:0042497 | 0.0077 | Inf | 0.0077 | 1 | 1 | triacyl lipopeptide binding |
| GO:0051424 | 0.0077 | Inf | 0.0077 | 1 | 1 | corticotropin-releasing hormone binding |
| GO:0071886 | 0.0077 | Inf | 0.0077 | 1 | 1 | 1-(4-iodo-2,5-dimethoxyphenyl)propan-2-amine binding |
| GO:0097161 | 0.0077 | Inf | 0.0077 | 1 | 1 | DH domain binding |
| GO:1990631 | 0.0077 | Inf | 0.0077 | 1 | 1 | ErbB-4 class receptor binding |
| GO:0000979 | 0.0087 | 7.6154 | 0.4226 | 3 | 55 | RNA polymerase II core promoter sequence-specific DNA binding |
| GO:0004871 | 0.0087 | 1.8965 | 12.1315 | 21 | 1579 | signal transducer activity |
| GO:0004029 | 0.0092 | 15.4335 | 0.146 | 2 | 19 | aldehyde dehydrogenase (NAD) activity |
| GOMFID | Pvalue | OddsRatio | ExpCount | Count | Size | Term |
| GO:0005509 | 1e-04 | 3.83 | 3.8438 | 13 | 658 | calcium ion binding |
| GO:0004111 | 5e-04 | 86.9611 | 0.035 | 2 | 6 | creatine kinase activity |
| GO:0047760 | 9e-04 | 57.9667 | 0.0467 | 2 | 8 | butyrate-CoA ligase activity |
| GO:0008327 | 0.0054 | 20.4444 | 0.111 | 2 | 19 | methyl-CpG binding |
| GO:0030371 | 0.0054 | 20.4444 | 0.111 | 2 | 19 | translation repressor activity |
| GO:0004489 | 0.0058 | Inf | 0.0058 | 1 | 1 | methylenetetrahydrofolate reductase (NAD(P)H) activity |
| GO:0004979 | 0.0058 | Inf | 0.0058 | 1 | 1 | beta-endorphin receptor activity |
| GO:0034647 | 0.0058 | Inf | 0.0058 | 1 | 1 | histone demethylase activity (H3-trimethyl-K4 specific) |
| GO:0038047 | 0.0058 | Inf | 0.0058 | 1 | 1 | morphine receptor activity |
| GO:0042605 | 0.0086 | 15.7929 | 0.1402 | 2 | 24 | peptide antigen binding |
| GO:0071813 | 0.0086 | 15.7929 | 0.1402 | 2 | 24 | lipoprotein particle binding |
| GOMFID | Pvalue | OddsRatio | ExpCount | Count | Size | Term |
| GO:0005185 | 1e-04 | Inf | 0.0159 | 2 | 2 | neurohypophyseal hormone activity |
| GO:0008147 | 1e-04 | Inf | 0.0159 | 2 | 2 | structural constituent of bone |
| GO:0000979 | 9e-04 | 10.0943 | 0.4365 | 4 | 55 | RNA polymerase II core promoter sequence-specific DNA binding |
| GO:0005102 | 0.0015 | 2.1959 | 11.1674 | 22 | 1407 | receptor binding |
| GO:0032395 | 0.0027 | 31.7398 | 0.0794 | 2 | 10 | MHC class II receptor activity |
| GO:0005246 | 0.0029 | 11.6177 | 0.2857 | 3 | 36 | calcium channel regulator activity |
| GO:0097153 | 0.0033 | 28.2114 | 0.0873 | 2 | 11 | cysteine-type endopeptidase activity involved in apoptotic process |
| GO:0019955 | 0.0045 | 6.4231 | 0.6667 | 4 | 84 | cytokine binding |
| GO:0005509 | 0.0061 | 2.4622 | 5.2226 | 12 | 658 | calcium ion binding |
| GO:0008656 | 0.007 | 18.1301 | 0.127 | 2 | 16 | cysteine-type endopeptidase activator activity involved in apoptotic process |
| GO:0023026 | 0.007 | 18.1301 | 0.127 | 2 | 16 | MHC class II protein complex binding |
| GO:0008445 | 0.0079 | Inf | 0.0079 | 1 | 1 | D-aspartate oxidase activity |
| GO:0017024 | 0.0079 | Inf | 0.0079 | 1 | 1 | myosin I binding |
| GO:0031855 | 0.0079 | Inf | 0.0079 | 1 | 1 | oxytocin receptor binding |
| GO:0031895 | 0.0079 | Inf | 0.0079 | 1 | 1 | V1B vasopressin receptor binding |
| GO:0032500 | 0.0079 | Inf | 0.0079 | 1 | 1 | muramyl dipeptide binding |
| GO:0047323 | 0.0079 | Inf | 0.0079 | 1 | 1 | [3-methyl-2-oxobutanoate dehydrogenase (acetyl-transferring)] kinase activity |
| GO:0048244 | 0.0079 | Inf | 0.0079 | 1 | 1 | phytanoyl-CoA dioxygenase activity |
| GO:0051424 | 0.0079 | Inf | 0.0079 | 1 | 1 | corticotropin-releasing hormone binding |
| GO:1990595 | 0.0079 | Inf | 0.0079 | 1 | 1 | mast cell secretagogue receptor activity |
| GO:0002020 | 0.0091 | 5.1841 | 0.8175 | 4 | 103 | protease binding |
| GOMFID | Pvalue | OddsRatio | ExpCount | Count | Size | Term |
| GO:0004364 | 9e-04 | 17.7028 | 0.1948 | 3 | 26 | glutathione transferase activity |
| GO:0004888 | 0.0028 | 2.2539 | 8.7962 | 18 | 1174 | transmembrane signaling receptor activity |
| GO:0008009 | 0.0055 | 9.0354 | 0.3596 | 3 | 48 | chemokine activity |
| GO:0008656 | 0.0062 | 19.2328 | 0.1199 | 2 | 16 | cysteine-type endopeptidase activator activity involved in apoptotic process |
| GO:0045236 | 0.007 | 17.9494 | 0.1274 | 2 | 17 | CXCR chemokine receptor binding |
| GO:0002196 | 0.0075 | Inf | 0.0075 | 1 | 1 | Ser-tRNA(Ala) hydrolase activity |
| GO:0032500 | 0.0075 | Inf | 0.0075 | 1 | 1 | muramyl dipeptide binding |
| GO:0047323 | 0.0075 | Inf | 0.0075 | 1 | 1 | [3-methyl-2-oxobutanoate dehydrogenase (acetyl-transferring)] kinase activity |
| GO:0051424 | 0.0075 | Inf | 0.0075 | 1 | 1 | corticotropin-releasing hormone binding |
| GO:0098641 | 0.0075 | Inf | 0.0075 | 1 | 1 | cadherin binding involved in cell-cell adhesion |
| GO:0042277 | 0.0076 | 3.7011 | 1.7162 | 6 | 231 | peptide binding |
| GOMFID | Pvalue | OddsRatio | ExpCount | Count | Size | Term |
| GO:0016409 | 0.0038 | 10.5189 | 0.3164 | 3 | 33 | palmitoyltransferase activity |
| GO:0045028 | 0.0039 | 26.1577 | 0.0959 | 2 | 10 | G-protein coupled purinergic nucleotide receptor activity |
| GO:0008191 | 0.0066 | 19.0201 | 0.1246 | 2 | 13 | metalloendopeptidase inhibitor activity |
| GO:0010576 | 0.0077 | 17.434 | 0.1342 | 2 | 14 | metalloenzyme regulator activity |
| GO:0002058 | 0.0096 | Inf | 0.0096 | 1 | 1 | uracil binding |
| GO:0002059 | 0.0096 | Inf | 0.0096 | 1 | 1 | thymine binding |
| GO:0003692 | 0.0096 | Inf | 0.0096 | 1 | 1 | left-handed Z-DNA binding |
| GO:0005034 | 0.0096 | Inf | 0.0096 | 1 | 1 | osmosensor activity |
| GO:0015275 | 0.0096 | Inf | 0.0096 | 1 | 1 | stretch-activated, cation-selective, calcium channel activity |
| GO:0030791 | 0.0096 | Inf | 0.0096 | 1 | 1 | arsenite methyltransferase activity |
| GO:0030792 | 0.0096 | Inf | 0.0096 | 1 | 1 | methylarsonite methyltransferase activity |
| GO:0032500 | 0.0096 | Inf | 0.0096 | 1 | 1 | muramyl dipeptide binding |
| GO:0035757 | 0.0096 | Inf | 0.0096 | 1 | 1 | chemokine (C-C motif) ligand 19 binding |
| GO:0035758 | 0.0096 | Inf | 0.0096 | 1 | 1 | chemokine (C-C motif) ligand 21 binding |
| GO:0038117 | 0.0096 | Inf | 0.0096 | 1 | 1 | C-C motif chemokine 19 receptor activity |
| GO:0038121 | 0.0096 | Inf | 0.0096 | 1 | 1 | C-C motif chemokine 21 receptor activity |
| GO:0052731 | 0.0096 | Inf | 0.0096 | 1 | 1 | phosphocholine phosphatase activity |
| GO:0052732 | 0.0096 | Inf | 0.0096 | 1 | 1 | phosphoethanolamine phosphatase activity |
| GOMFID | Pvalue | OddsRatio | ExpCount | Count | Size | Term |
| GO:0032394 | 1e-04 | Inf | 0.0166 | 2 | 2 | MHC class Ib receptor activity |
| GO:0035575 | 0.0067 | 18.6106 | 0.1248 | 2 | 15 | histone demethylase activity (H4-K20 specific) |
| GO:0008009 | 0.0074 | 8.1109 | 0.3993 | 3 | 48 | chemokine activity |
| GO:0031768 | 0.0083 | Inf | 0.0083 | 1 | 1 | ghrelin receptor binding |
| GO:0036220 | 0.0083 | Inf | 0.0083 | 1 | 1 | ITP diphosphatase activity |
| GO:0036222 | 0.0083 | Inf | 0.0083 | 1 | 1 | XTP diphosphatase activity |
| GO:0061627 | 0.0083 | Inf | 0.0083 | 1 | 1 | S-methylmethionine-homocysteine S-methyltransferase activity |
| GO:1990275 | 0.0083 | Inf | 0.0083 | 1 | 1 | preribosome binding |
| GO:0045236 | 0.0086 | 16.1271 | 0.1414 | 2 | 17 | CXCR chemokine receptor binding |
| GO:0042288 | 0.0096 | 15.1182 | 0.1497 | 2 | 18 | MHC class I protein binding |
| GOMFID | Pvalue | OddsRatio | ExpCount | Count | Size | Term |
| GO:0004427 | 0.001 | 77.3333 | 0.0516 | 2 | 4 | inorganic diphosphatase activity |
| GO:0004126 | 0.0044 | 25.7711 | 0.1031 | 2 | 8 | cytidine deaminase activity |
| GO:0005525 | 0.0048 | 2.6417 | 4.3954 | 11 | 341 | GTP binding |
| GO:0019001 | 0.007 | 2.5021 | 4.6274 | 11 | 359 | guanyl nucleotide binding |
| GO:0016409 | 0.0087 | 7.758 | 0.4254 | 3 | 33 | palmitoyltransferase activity |
| GOMFID | Pvalue | OddsRatio | ExpCount | Count | Size | Term |
| GO:0005104 | 0.0018 | 13.9701 | 0.246 | 3 | 25 | fibroblast growth factor receptor binding |
| GO:0046933 | 0.0033 | 29.1074 | 0.0886 | 2 | 9 | proton-transporting ATP synthase activity, rotational mechanism |
| GO:0005539 | 0.0034 | 3.8346 | 1.9389 | 7 | 197 | glycosaminoglycan binding |
| GO:0008083 | 0.0039 | 4.2607 | 1.496 | 6 | 152 | growth factor activity |
| GO:0016409 | 0.0041 | 10.2395 | 0.3248 | 3 | 33 | palmitoyltransferase activity |
| GO:0045028 | 0.0041 | 25.4673 | 0.0984 | 2 | 10 | G-protein coupled purinergic nucleotide receptor activity |
| GO:0015077 | 0.0063 | 2.8602 | 3.3266 | 9 | 338 | monovalent inorganic cation transmembrane transporter activity |
| GO:0005165 | 0.007 | 18.5181 | 0.1279 | 2 | 13 | neurotrophin receptor binding |
| GO:0005149 | 0.0093 | 15.6672 | 0.1476 | 2 | 15 | interleukin-1 receptor binding |
| GO:0002058 | 0.0098 | Inf | 0.0098 | 1 | 1 | uracil binding |
| GO:0002059 | 0.0098 | Inf | 0.0098 | 1 | 1 | thymine binding |
| GO:0003692 | 0.0098 | Inf | 0.0098 | 1 | 1 | left-handed Z-DNA binding |
| GO:0005034 | 0.0098 | Inf | 0.0098 | 1 | 1 | osmosensor activity |
| GO:0005175 | 0.0098 | Inf | 0.0098 | 1 | 1 | CD27 receptor binding |
| GO:0015275 | 0.0098 | Inf | 0.0098 | 1 | 1 | stretch-activated, cation-selective, calcium channel activity |
| GO:0030791 | 0.0098 | Inf | 0.0098 | 1 | 1 | arsenite methyltransferase activity |
| GO:0030792 | 0.0098 | Inf | 0.0098 | 1 | 1 | methylarsonite methyltransferase activity |
| GO:0031877 | 0.0098 | Inf | 0.0098 | 1 | 1 | somatostatin receptor binding |
| GO:0032500 | 0.0098 | Inf | 0.0098 | 1 | 1 | muramyl dipeptide binding |
| GO:0035757 | 0.0098 | Inf | 0.0098 | 1 | 1 | chemokine (C-C motif) ligand 19 binding |
| GO:0035758 | 0.0098 | Inf | 0.0098 | 1 | 1 | chemokine (C-C motif) ligand 21 binding |
| GO:0038117 | 0.0098 | Inf | 0.0098 | 1 | 1 | C-C motif chemokine 19 receptor activity |
| GO:0038121 | 0.0098 | Inf | 0.0098 | 1 | 1 | C-C motif chemokine 21 receptor activity |
| GO:0052731 | 0.0098 | Inf | 0.0098 | 1 | 1 | phosphocholine phosphatase activity |
| GO:0052732 | 0.0098 | Inf | 0.0098 | 1 | 1 | phosphoethanolamine phosphatase activity |
| GO:0070191 | 0.0098 | Inf | 0.0098 | 1 | 1 | methionine-R-sulfoxide reductase activity |
| GOMFID | Pvalue | OddsRatio | ExpCount | Count | Size | Term |
| GO:0019534 | 0.0015 | 49.0063 | 0.0613 | 2 | 6 | toxin transporter activity |
| GO:0008308 | 0.0087 | 16.327 | 0.1431 | 2 | 14 | voltage-gated anion channel activity |
| GO:0016805 | 0.0087 | 16.327 | 0.1431 | 2 | 14 | dipeptidase activity |
| GOMFID | Pvalue | OddsRatio | ExpCount | Count | Size | Term |
| GO:0005254 | 3e-04 | 9.7402 | 0.568 | 5 | 71 | chloride channel activity |
| GO:0004952 | 0.0013 | 50.3806 | 0.056 | 2 | 7 | dopamine neurotransmitter receptor activity |
| GO:0070888 | 0.0025 | 12.2675 | 0.272 | 3 | 34 | E-box binding |
| GO:0035240 | 0.0027 | 31.4819 | 0.08 | 2 | 10 | dopamine binding |
| GO:0000981 | 0.0032 | 2.6868 | 4.8083 | 12 | 601 | RNA polymerase II transcription factor activity, sequence-specific DNA binding |
| GO:0019531 | 0.0033 | 27.9821 | 0.088 | 2 | 11 | oxalate transmembrane transporter activity |
| GO:0005216 | 0.0039 | 3.1108 | 3.0882 | 9 | 386 | ion channel activity |
| GO:0008509 | 0.0045 | 3.6319 | 2.0481 | 7 | 256 | anion transmembrane transporter activity |
| GO:0008271 | 0.0047 | 22.8915 | 0.104 | 2 | 13 | secondary active sulfate transmembrane transporter activity |
| GO:0004888 | 0.0057 | 2.0858 | 9.3926 | 18 | 1174 | transmembrane signaling receptor activity |
| GO:0015459 | 0.0059 | 8.8372 | 0.368 | 3 | 46 | potassium channel regulator activity |
| GO:0004890 | 0.0071 | 17.9827 | 0.128 | 2 | 16 | GABA-A receptor activity |
| GO:0016638 | 0.0071 | 17.9827 | 0.128 | 2 | 16 | oxidoreductase activity, acting on the CH-NH2 group of donors |
| GO:0022803 | 0.0073 | 2.805 | 3.4082 | 9 | 426 | passive transmembrane transporter activity |
| GO:0015106 | 0.008 | 16.7828 | 0.136 | 2 | 17 | bicarbonate transmembrane transporter activity |
| GO:0004375 | 0.008 | Inf | 0.008 | 1 | 1 | glycine dehydrogenase (decarboxylating) activity |
| GO:0005115 | 0.008 | Inf | 0.008 | 1 | 1 | receptor tyrosine kinase-like orphan receptor binding |
| GO:0030107 | 0.008 | Inf | 0.008 | 1 | 1 | HLA-A specific inhibitory MHC class I receptor activity |
| GO:0022836 | 0.0096 | 3.1321 | 2.3601 | 7 | 295 | gated channel activity |
| GO:0030332 | 0.0099 | 14.8065 | 0.152 | 2 | 19 | cyclin binding |
| GOMFID | Pvalue | OddsRatio | ExpCount | Count | Size | Term |
| GO:0035663 | 4e-04 | 178.9885 | 0.0335 | 2 | 3 | Toll-like receptor 2 binding |
| GO:0005488 | 0.0038 | 2.0009 | 148.4864 | 161 | 13287 | binding |
| GO:0004303 | 0.0053 | 22.3635 | 0.1118 | 2 | 10 | estradiol 17-beta-dehydrogenase activity |
| GO:0019992 | 0.0064 | 19.8774 | 0.1229 | 2 | 11 | diacylglycerol binding |
| GOMFID | Pvalue | OddsRatio | ExpCount | Count | Size | Term |
| GO:0004984 | 1e-04 | 4.6419 | 2.6289 | 11 | 373 | olfactory receptor activity |
| GO:0004930 | 0.0035 | 2.5579 | 5.5257 | 13 | 784 | G-protein coupled receptor activity |
| GO:0004979 | 0.007 | Inf | 0.007 | 1 | 1 | beta-endorphin receptor activity |
| GO:0018585 | 0.007 | Inf | 0.007 | 1 | 1 | fluorene oxygenase activity |
| GO:0031724 | 0.007 | Inf | 0.007 | 1 | 1 | CXCR5 chemokine receptor binding |
| GO:0034039 | 0.007 | Inf | 0.007 | 1 | 1 | 8-oxo-7,8-dihydroguanine DNA N-glycosylase activity |
| GO:0038047 | 0.007 | Inf | 0.007 | 1 | 1 | morphine receptor activity |
| GO:0046523 | 0.007 | Inf | 0.007 | 1 | 1 | S-methyl-5-thioribose-1-phosphate isomerase activity |
| GO:0051424 | 0.007 | Inf | 0.007 | 1 | 1 | corticotropin-releasing hormone binding |
| GO:0070224 | 0.007 | Inf | 0.007 | 1 | 1 | sulfide:quinone oxidoreductase activity |
| GOMFID | Pvalue | OddsRatio | ExpCount | Count | Size | Term |
| GO:0042605 | 6e-04 | 20.6574 | 0.1692 | 3 | 24 | peptide antigen binding |
| GO:0031402 | 0.0042 | 23.893 | 0.0987 | 2 | 14 | sodium ion binding |
| GO:0016917 | 0.0078 | 16.8602 | 0.1339 | 2 | 19 | GABA receptor activity |
| GO:0005248 | 0.0086 | 15.9225 | 0.141 | 2 | 20 | voltage-gated sodium channel activity |
| GO:0005179 | 0.0094 | 5.1361 | 0.8246 | 4 | 117 | hormone activity |
| NA. |
| n/a |
| NA. |
| n/a |
| NA. |
| n/a |
| NA. |
| n/a |
| NA. |
| n/a |
| NA. |
| n/a |
| NA. |
| n/a |
| NA. |
| n/a |
| NA. |
| n/a |
| NA. |
| n/a |
| NA. |
| n/a |
| NA. |
| n/a |
| NA. |
| n/a |
| NA. |
| n/a |
| NA. |
| n/a |
| NA. |
| n/a |
| NA. |
| n/a |
| NA. |
| n/a |
| NA. |
| n/a |
| NA. |
| n/a |
| NA. |
| n/a |
| NA. |
| n/a |
| NA. |
| n/a |
| NA. |
| n/a |
| NA. |
| n/a |
| NA. |
| n/a |
| NA. |
| n/a |
| NA. |
| n/a |
| NA. |
| n/a |
| NA. |
| n/a |
| NA. |
| n/a |
| NA. |
| n/a |
| NA. |
| n/a |
| NA. |
| n/a |
| NA. |
| n/a |
| NA. |
| n/a |
| NA. |
| n/a |
| NA. |
| n/a |
| NA. |
| n/a |
| NA. |
| n/a |
| NA. |
| n/a |
| NA. |
| n/a |
| NA. |
| n/a |
| NA. |
| n/a |
| NA. |
| n/a |
| NA. |
| n/a |
| NA. |
| n/a |
| NA. |
| n/a |
| NA. |
| n/a |
| NA. |
| n/a |
| NA. |
| n/a |
| NA. |
| n/a |
| NA. |
| n/a |
| NA. |
| n/a |
| NA. |
| n/a |
| NA. |
| n/a |
| NA. |
| n/a |
| NA. |
| n/a |
| NA. |
| n/a |
| NA. |
| n/a |
| NA. |
| n/a |
| NA. |
| n/a |
| NA. |
| n/a |
| NA. |
| n/a |
| NA. |
| n/a |
| NA. |
| n/a |
| NA. |
| n/a |
| NA. |
| n/a |
| NA. |
| n/a |
| NA. |
| n/a |
| NA. |
| n/a |
| NA. |
| n/a |
| NA. |
| n/a |
| NA. |
| n/a |
| NA. |
| n/a |
| NA. |
| n/a |
| NA. |
| n/a |
| NA. |
| n/a |
| NA. |
| n/a |
| NA. |
| n/a |
| NA. |
| n/a |
| NA. |
| n/a |
| NA. |
| n/a |
| NA. |
| n/a |
| NA. |
| n/a |
| NA. |
| n/a |
| NA. |
| n/a |
| NA. |
| n/a |
| NA. |
| n/a |
| NA. |
| n/a |
| NA. |
| n/a |
| NA. |
| n/a |
| NA. |
| n/a |
| NA. |
| n/a |
| NA. |
| n/a |
| NA. |
| n/a |
| NA. |
| n/a |
| NA. |
| n/a |
| NA. |
| n/a |
| NA. |
| n/a |
| NA. |
| n/a |
| NA. |
| n/a |
| NA. |
| n/a |
| NA. |
| n/a |
| NA. |
| n/a |
| NA. |
| n/a |
| NA. |
| n/a |
| NA. |
| n/a |
| NA. |
| n/a |
| NA. |
| n/a |
| NA. |
| n/a |
| NA. |
| n/a |
| NA. |
| n/a |
| NA. |
| n/a |
| NA. |
| n/a |
| NA. |
| n/a |
| NA. |
| n/a |
| NA. |
| n/a |
| NA. |
| n/a |
| NA. |
| n/a |
| NA. |
| n/a |
| NA. |
| n/a |
| NA. |
| n/a |
| NA. |
| n/a |
| NA. |
| n/a |
| NA. |
| n/a |
| NA. |
| n/a |
| NA. |
| n/a |
| NA. |
| n/a |
| NA. |
| n/a |
| NA. |
| n/a |
| NA. |
| n/a |
| NA. |
| n/a |
| NA. |
| n/a |
| NA. |
| n/a |
| NA. |
| n/a |
| NA. |
| n/a |
| NA. |
| n/a |
| NA. |
| n/a |
| NA. |
| n/a |
| NA. |
| n/a |
| NA. |
| n/a |
| NA. |
| n/a |
| NA. |
| n/a |
| NA. |
| n/a |
| NA. |
| n/a |
| NA. |
| n/a |
| NA. |
| n/a |
| NA. |
| n/a |
| NA. |
| n/a |
| NA. |
| n/a |
| NA. |
| n/a |
| NA. |
| n/a |
| NA. |
| n/a |
| NA. |
| n/a |
| NA. |
| n/a |
| NA. |
| n/a |
| NA. |
| n/a |
| NA. |
| n/a |
| NA. |
| n/a |
| NA. |
| n/a |
| NA. |
| n/a |
| NA. |
| n/a |
| NA. |
| n/a |
| NA. |
| n/a |
| NA. |
| n/a |
| NA. |
| n/a |
| NA. |
| n/a |
| NA. |
| n/a |
| NA. |
| n/a |
| NA. |
| n/a |
| NA. |
| n/a |
| NA. |
| n/a |
| NA. |
| n/a |
| NA. |
| n/a |
| NA. |
| n/a |
| NA. |
| n/a |
| NA. |
| n/a |
| NA. |
| n/a |
| NA. |
| n/a |
| NA. |
| n/a |
| NA. |
| n/a |
| NA. |
| n/a |
| NA. |
| n/a |
| NA. |
| n/a |
| NA. |
| n/a |
| NA. |
| n/a |
| NA. |
| n/a |
| NA. |
| n/a |
| NA. |
| n/a |
| NA. |
| n/a |
| NA. |
| n/a |
| NA. |
| n/a |
| NA. |
| n/a |
| NA. |
| n/a |
| NA. |
| n/a |
| NA. |
| n/a |
| NA. |
| n/a |
| NA. |
| n/a |
| NA. |
| n/a |
| NA. |
| n/a |
| NA. |
| n/a |
| NA. |
| n/a |
| NA. |
| n/a |
| NA. |
| n/a |
| NA. |
| n/a |
| NA. |
| n/a |
| NA. |
| n/a |
| NA. |
| n/a |
| NA. |
| n/a |
| NA. |
| n/a |
| NA. |
| n/a |
| NA. |
| n/a |
| NA. |
| n/a |
| NA. |
| n/a |
| NA. |
| n/a |
| NA. |
| n/a |
| NA. |
| n/a |
| NA. |
| n/a |
| NA. |
| n/a |
| NA. |
| n/a |
| NA. |
| n/a |
| NA. |
| n/a |
| NA. |
| n/a |
| NA. |
| n/a |
| NA. |
| n/a |
| NA. |
| n/a |
| NA. |
| n/a |
| NA. |
| n/a |
| NA. |
| n/a |
| NA. |
| n/a |
| NA. |
| n/a |
| NA. |
| n/a |
| NA. |
| n/a |
| NA. |
| n/a |
| NA. |
| n/a |
| NA. |
| n/a |
| NA. |
| n/a |
| NA. |
| n/a |
| NA. |
| n/a |
| GOMFID | Pvalue | OddsRatio | ExpCount | Count | Size | Term |
| GO:0050911 | 0 | 17.2374 | 1.5787 | 19 | 370 | detection of chemical stimulus involved in sensory perception of smell |
| GO:0051606 | 0 | 10.3918 | 2.8971 | 21 | 679 | detection of stimulus |
| GO:0007186 | 0 | 7.6049 | 4.9494 | 25 | 1160 | G-protein coupled receptor signaling pathway |
| GO:0050877 | 0 | 6.3399 | 5.1798 | 23 | 1214 | neurological system process |
| GO:0042221 | 2e-04 | 2.5017 | 17.9927 | 32 | 4217 | response to chemical |
| GO:0042742 | 4e-04 | 6.8294 | 0.9728 | 6 | 228 | defense response to bacterium |
| GO:0032501 | 0.0018 | 2.1142 | 28.6765 | 41 | 6721 | multicellular organismal process |
| GO:0021542 | 0.0021 | 34.3341 | 0.0683 | 2 | 16 | dentate gyrus development |
| GO:0044700 | 0.0024 | 2.0598 | 25.1437 | 37 | 5893 | single organism signaling |
| GO:0007154 | 0.0032 | 2.0127 | 25.5063 | 37 | 5978 | cell communication |
| GO:0042502 | 0.0043 | Inf | 0.0043 | 1 | 1 | tyrosine phosphorylation of Stat2 protein |
| GO:0050907 | 0.008 | 16.1654 | 0.1346 | 2 | 43 | detection of chemical stimulus involved in sensory perception |
| GO:0060764 | 0.0085 | 236.8939 | 0.0085 | 1 | 2 | cell-cell signaling involved in mammary gland development |
| GO:1901318 | 0.0085 | 236.8939 | 0.0085 | 1 | 2 | negative regulation of sperm motility |
| GO:1902530 | 0.0085 | 236.8939 | 0.0085 | 1 | 2 | positive regulation of protein linear polyubiquitination |
| GO:0001580 | 0.0087 | 15.4888 | 0.1408 | 2 | 33 | detection of chemical stimulus involved in sensory perception of bitter taste |
| GO:0050794 | 0.0088 | 1.9864 | 41.3187 | 51 | 9684 | regulation of cellular process |
| GOMFID | Pvalue | OddsRatio | ExpCount | Count | Size | Term |
| GO:0007186 | 4e-04 | 2.1821 | 14.1094 | 28 | 1160 | G-protein coupled receptor signaling pathway |
| GO:0009593 | 4e-04 | 2.947 | 5.4856 | 15 | 451 | detection of chemical stimulus |
| GO:0007606 | 6e-04 | 2.8592 | 5.6438 | 15 | 464 | sensory perception of chemical stimulus |
| GO:0050906 | 6e-04 | 2.8592 | 5.6438 | 15 | 464 | detection of stimulus involved in sensory perception |
| GO:0050911 | 6e-04 | 3.1004 | 4.5004 | 13 | 370 | detection of chemical stimulus involved in sensory perception of smell |
| GO:0006396 | 0.0012 | 2.2956 | 9.3901 | 20 | 772 | RNA processing |
| GO:0071706 | 0.0017 | 5.1012 | 1.265 | 6 | 104 | tumor necrosis factor superfamily cytokine production |
| GO:0070098 | 0.0028 | 5.6081 | 0.9609 | 5 | 79 | chemokine-mediated signaling pathway |
| GO:0071347 | 0.0048 | 4.8789 | 1.0947 | 5 | 90 | cellular response to interleukin-1 |
| GO:0032494 | 0.005 | 23.4392 | 0.1095 | 2 | 9 | response to peptidoglycan |
| GO:0050877 | 0.0066 | 1.8142 | 14.7662 | 25 | 1214 | neurological system process |
| GO:0032680 | 0.0069 | 4.4569 | 1.192 | 5 | 98 | regulation of tumor necrosis factor production |
| GO:0006364 | 0.0092 | 3.5356 | 1.788 | 6 | 147 | rRNA processing |
| GO:0090501 | 0.0099 | 4.0612 | 1.3015 | 5 | 107 | RNA phosphodiester bond hydrolysis |
| GO:0007601 | 0.0099 | 3.1009 | 2.3718 | 7 | 195 | visual perception |
| GOMFID | Pvalue | OddsRatio | ExpCount | Count | Size | Term |
| GO:0050911 | 0 | 13.2251 | 2.4505 | 24 | 370 | detection of chemical stimulus involved in sensory perception of smell |
| GO:0009593 | 0 | 10.6595 | 2.9869 | 24 | 451 | detection of chemical stimulus |
| GO:0007606 | 0 | 10.3357 | 3.073 | 24 | 464 | sensory perception of chemical stimulus |
| GO:0050906 | 0 | 10.3357 | 3.073 | 24 | 464 | detection of stimulus involved in sensory perception |
| GO:0007186 | 0 | 5.191 | 7.6826 | 30 | 1160 | G-protein coupled receptor signaling pathway |
| GO:0050877 | 0 | 4.7033 | 8.0402 | 29 | 1214 | neurological system process |
| GO:0000042 | 0 | 60.5517 | 0.1192 | 5 | 18 | protein targeting to Golgi |
| GO:0006891 | 0 | 20.6818 | 0.2848 | 5 | 43 | intra-Golgi vesicle-mediated transport |
| GO:0019731 | 3e-04 | 13.5243 | 0.3311 | 4 | 50 | antibacterial humoral response |
| GO:0019236 | 9e-04 | 61.1529 | 0.0464 | 2 | 7 | response to pheromone |
| GO:0050830 | 0.0017 | 8.5074 | 0.51 | 4 | 77 | defense response to Gram-positive bacterium |
| GO:0008544 | 0.0042 | 3.7054 | 2.02 | 7 | 305 | epidermis development |
| GO:0030730 | 0.0043 | 23.5083 | 0.0993 | 2 | 15 | sequestering of triglyceride |
| GO:0006959 | 0.0057 | 4.667 | 1.1391 | 5 | 172 | humoral immune response |
| GO:0000494 | 0.0066 | Inf | 0.0066 | 1 | 1 | box C/D snoRNA 3'-end processing |
| GO:0007634 | 0.0066 | Inf | 0.0066 | 1 | 1 | optokinetic behavior |
| GO:0021560 | 0.0066 | Inf | 0.0066 | 1 | 1 | abducens nerve development |
| GO:0021599 | 0.0066 | Inf | 0.0066 | 1 | 1 | abducens nerve formation |
| GO:0033967 | 0.0066 | Inf | 0.0066 | 1 | 1 | box C/D snoRNA metabolic process |
| GO:0042666 | 0.0066 | Inf | 0.0066 | 1 | 1 | negative regulation of ectodermal cell fate specification |
| GO:0044795 | 0.0066 | Inf | 0.0066 | 1 | 1 | trans-Golgi network to recycling endosome transport |
| GO:0051673 | 0.0066 | Inf | 0.0066 | 1 | 1 | membrane disruption in other organism |
| GO:0061048 | 0.0066 | Inf | 0.0066 | 1 | 1 | negative regulation of branching involved in lung morphogenesis |
| GO:1990258 | 0.0066 | Inf | 0.0066 | 1 | 1 | histone glutamine methylation |
| GO:2000383 | 0.0066 | Inf | 0.0066 | 1 | 1 | regulation of ectoderm development |
| GO:1903861 | 0.0069 | 17.9723 | 0.1258 | 2 | 19 | positive regulation of dendrite extension |
| GO:0009617 | 0.0081 | 2.7692 | 3.477 | 9 | 525 | response to bacterium |
| GOMFID | Pvalue | OddsRatio | ExpCount | Count | Size | Term |
| GO:0000042 | 0 | 301.25 | 0.0287 | 5 | 18 | protein targeting to Golgi |
| GO:0006891 | 0 | 102.8947 | 0.0685 | 5 | 43 | intra-Golgi vesicle-mediated transport |
| GO:0050911 | 0 | 19.9103 | 0.5891 | 8 | 370 | detection of chemical stimulus involved in sensory perception of smell |
| GO:0009593 | 0 | 16.1838 | 0.718 | 8 | 451 | detection of chemical stimulus |
| GO:0007606 | 0 | 15.709 | 0.7387 | 8 | 464 | sensory perception of chemical stimulus |
| GO:0050906 | 0 | 15.709 | 0.7387 | 8 | 464 | detection of stimulus involved in sensory perception |
| GO:0007186 | 3e-04 | 5.9338 | 1.8468 | 8 | 1160 | G-protein coupled receptor signaling pathway |
| GO:0050877 | 4e-04 | 5.6471 | 1.9328 | 8 | 1214 | neurological system process |
| GO:0072594 | 0.0029 | 5.9616 | 1.0125 | 5 | 636 | establishment of protein localization to organelle |
| GOMFID | Pvalue | OddsRatio | ExpCount | Count | Size | Term |
| GO:0007156 | 0 | 21.3574 | 1.6924 | 26 | 151 | homophilic cell adhesion via plasma membrane adhesion molecules |
| GO:0098609 | 0 | 4.0759 | 9.695 | 33 | 865 | cell-cell adhesion |
| GO:0007186 | 0 | 3.295 | 13.0013 | 36 | 1160 | G-protein coupled receptor signaling pathway |
| GO:0050911 | 0 | 4.596 | 4.147 | 17 | 370 | detection of chemical stimulus involved in sensory perception of smell |
| GO:0022610 | 0 | 2.6679 | 15.7025 | 36 | 1401 | biological adhesion |
| GO:0009593 | 0 | 3.7182 | 5.0548 | 17 | 451 | detection of chemical stimulus |
| GO:0007606 | 0 | 3.607 | 5.2005 | 17 | 464 | sensory perception of chemical stimulus |
| GO:0050906 | 0 | 3.607 | 5.2005 | 17 | 464 | detection of stimulus involved in sensory perception |
| GO:0071880 | 0.001 | 17.9329 | 0.2017 | 3 | 18 | adenylate cyclase-activating adrenergic receptor signaling pathway |
| GO:0035150 | 0.0011 | 4.7225 | 1.5915 | 7 | 142 | regulation of tube size |
| GO:0010841 | 0.0012 | 59.4789 | 0.056 | 2 | 5 | positive regulation of circadian sleep/wake cycle, wakefulness |
| GO:0043567 | 0.0024 | 12.8043 | 0.269 | 3 | 24 | regulation of insulin-like growth factor receptor signaling pathway |
| GO:0003018 | 0.0025 | 4.055 | 1.8381 | 7 | 164 | vascular process in circulatory system |
| GO:0006305 | 0.0029 | 5.5074 | 0.9751 | 5 | 87 | DNA alkylation |
| GO:0016339 | 0.0041 | 10.3386 | 0.325 | 3 | 29 | calcium-dependent cell-cell adhesion via plasma membrane cell adhesion molecules |
| GO:0008343 | 0.0043 | 25.4844 | 0.1009 | 2 | 9 | adult feeding behavior |
| GO:0030307 | 0.005 | 4.0543 | 1.5691 | 6 | 140 | positive regulation of cell growth |
| GO:0061303 | 0.0053 | 22.2974 | 0.1121 | 2 | 10 | cornea development in camera-type eye |
| GO:0044728 | 0.0053 | 4.7498 | 1.1208 | 5 | 100 | DNA methylation or demethylation |
| GO:0006335 | 0.0054 | 9.2673 | 0.3587 | 3 | 32 | DNA replication-dependent nucleosome assembly |
| GO:0045823 | 0.0059 | 8.9578 | 0.3699 | 3 | 33 | positive regulation of heart contraction |
| GO:0045907 | 0.0059 | 8.9578 | 0.3699 | 3 | 33 | positive regulation of vasoconstriction |
| GO:0032776 | 0.007 | 8.3969 | 0.3923 | 3 | 35 | DNA methylation on cytosine |
| GO:0042311 | 0.0075 | 5.532 | 0.7734 | 4 | 69 | vasodilation |
| GO:0042596 | 0.0081 | 7.9019 | 0.4147 | 3 | 37 | fear response |
| GO:0045777 | 0.0081 | 7.9019 | 0.4147 | 3 | 37 | positive regulation of blood pressure |
| GO:0051290 | 0.0088 | 7.6756 | 0.4259 | 3 | 38 | protein heterotetramerization |
| GO:0098542 | 0.0089 | 2.2349 | 6.142 | 13 | 548 | defense response to other organism |
| GO:0050877 | 0.0091 | 1.8095 | 13.6066 | 23 | 1214 | neurological system process |
| GO:0040014 | 0.0091 | 5.21 | 0.8182 | 4 | 73 | regulation of multicellular organism growth |
| GO:0007586 | 0.0099 | 3.4776 | 1.8157 | 6 | 162 | digestion |
| GOMFID | Pvalue | OddsRatio | ExpCount | Count | Size | Term |
| GO:0007186 | 0 | 10.8997 | 2.881 | 18 | 1160 | G-protein coupled receptor signaling pathway |
| GO:0050911 | 0 | 19.0019 | 0.9189 | 12 | 370 | detection of chemical stimulus involved in sensory perception of smell |
| GO:0009593 | 0 | 15.4138 | 1.1201 | 12 | 451 | detection of chemical stimulus |
| GO:0007606 | 0 | 14.9577 | 1.1524 | 12 | 464 | sensory perception of chemical stimulus |
| GO:0050906 | 0 | 14.9577 | 1.1524 | 12 | 464 | detection of stimulus involved in sensory perception |
| GO:0000042 | 0 | 86.9389 | 0.0447 | 3 | 18 | protein targeting to Golgi |
| GO:0050877 | 0 | 5.3474 | 3.0151 | 12 | 1214 | neurological system process |
| GO:0006891 | 2e-04 | 32.55 | 0.1068 | 3 | 43 | intra-Golgi vesicle-mediated transport |
| GO:0031424 | 2e-04 | 28.2935 | 0.1217 | 3 | 49 | keratinization |
| GO:0048247 | 3e-04 | 27.6897 | 0.1242 | 3 | 50 | lymphocyte chemotaxis |
| GO:0018149 | 3e-04 | 25.0192 | 0.1366 | 3 | 55 | peptide cross-linking |
| GO:0002548 | 4e-04 | 23.2262 | 0.1465 | 3 | 59 | monocyte chemotaxis |
| GO:0035574 | 6e-04 | 65.0769 | 0.0373 | 2 | 15 | histone H4-K20 demethylation |
| GO:0007586 | 7e-04 | 11.2159 | 0.4023 | 4 | 162 | digestion |
| GO:0045653 | 9e-04 | 52.8649 | 0.0447 | 2 | 18 | negative regulation of megakaryocyte differentiation |
| GO:0070098 | 0.001 | 17.0921 | 0.1962 | 3 | 79 | chemokine-mediated signaling pathway |
| GO:0030593 | 0.0013 | 15.6436 | 0.2136 | 3 | 86 | neutrophil chemotaxis |
| GO:0071347 | 0.0014 | 14.9205 | 0.2235 | 3 | 90 | cellular response to interleukin-1 |
| GO:0032501 | 0.0022 | 2.6793 | 16.6923 | 26 | 6721 | multicellular organismal process |
| GO:0042502 | 0.0025 | Inf | 0.0025 | 1 | 1 | tyrosine phosphorylation of Stat2 protein |
| GO:0097530 | 0.0025 | 12.116 | 0.2732 | 3 | 110 | granulocyte migration |
| GO:0050729 | 0.0027 | 11.8922 | 0.2782 | 3 | 112 | positive regulation of inflammatory response |
| GO:0006335 | 0.0028 | 28.1694 | 0.0795 | 2 | 32 | DNA replication-dependent nucleosome assembly |
| GO:0016577 | 0.003 | 27.2589 | 0.082 | 2 | 33 | histone demethylation |
| GO:0008214 | 0.0034 | 25.6036 | 0.0869 | 2 | 35 | protein dealkylation |
| GO:0032776 | 0.0034 | 25.6036 | 0.0869 | 2 | 35 | DNA methylation on cytosine |
| GO:0051290 | 0.004 | 23.4655 | 0.0944 | 2 | 38 | protein heterotetramerization |
| GO:0060603 | 0.004 | 23.4655 | 0.0944 | 2 | 38 | mammary gland duct morphogenesis |
| GO:0034080 | 0.0044 | 22.2276 | 0.0993 | 2 | 40 | CENP-A containing nucleosome assembly |
| GO:0071346 | 0.0046 | 9.7312 | 0.3378 | 3 | 136 | cellular response to interferon-gamma |
| GO:0000183 | 0.0046 | 21.6563 | 0.1018 | 2 | 41 | chromatin silencing at rDNA |
| GO:0010868 | 0.005 | 412.1842 | 0.005 | 1 | 2 | negative regulation of triglyceride biosynthetic process |
| GO:0060598 | 0.005 | 412.1842 | 0.005 | 1 | 2 | dichotomous subdivision of terminal units involved in mammary gland duct morphogenesis |
| GO:1901532 | 0.0051 | 20.5972 | 0.1068 | 2 | 43 | regulation of hematopoietic progenitor cell differentiation |
| GO:0034724 | 0.0068 | 17.5856 | 0.1242 | 2 | 50 | DNA replication-independent nucleosome organization |
| GO:0035962 | 0.0074 | 206.0789 | 0.0075 | 1 | 3 | response to interleukin-13 |
| GO:0070374 | 0.0084 | 7.7801 | 0.4197 | 3 | 169 | positive regulation of ERK1 and ERK2 cascade |
| GOMFID | Pvalue | OddsRatio | ExpCount | Count | Size | Term |
| GO:1904431 | 0.001 | 77.495 | 0.0515 | 2 | 4 | positive regulation of t-circle formation |
| GO:0031442 | 0.0012 | 16.6766 | 0.2187 | 3 | 17 | positive regulation of mRNA 3'-end processing |
| GO:0000387 | 0.0017 | 8.6785 | 0.5146 | 4 | 40 | spliceosomal snRNP assembly |
| GO:0010792 | 0.0024 | 38.7425 | 0.0772 | 2 | 6 | DNA double-strand break processing involved in repair via single-strand annealing |
| GO:0032730 | 0.0024 | 38.7425 | 0.0772 | 2 | 6 | positive regulation of interleukin-1 alpha production |
| GO:1903313 | 0.0028 | 7.4358 | 0.5917 | 4 | 46 | positive regulation of mRNA metabolic process |
| GO:0006695 | 0.0031 | 7.2624 | 0.6046 | 4 | 47 | cholesterol biosynthetic process |
| GO:0019827 | 0.0042 | 3.6737 | 2.0196 | 7 | 157 | stem cell population maintenance |
| GO:0098787 | 0.0044 | 25.825 | 0.1029 | 2 | 8 | mRNA cleavage involved in mRNA processing |
| GO:0034976 | 0.005 | 2.9652 | 3.2031 | 9 | 249 | response to endoplasmic reticulum stress |
| GO:0006108 | 0.0056 | 22.1343 | 0.1158 | 2 | 9 | malate metabolic process |
| GO:0008152 | 0.0058 | 1.5515 | 143.7528 | 160 | 11175 | metabolic process |
| GO:0034587 | 0.006 | 8.9727 | 0.373 | 3 | 29 | piRNA metabolic process |
| GO:0006270 | 0.0079 | 8.043 | 0.4116 | 3 | 32 | DNA replication initiation |
| GO:0016114 | 0.0084 | 17.2133 | 0.1415 | 2 | 11 | terpenoid biosynthetic process |
| GO:0090266 | 0.0084 | 17.2133 | 0.1415 | 2 | 11 | regulation of mitotic cell cycle spindle assembly checkpoint |
| GO:0006457 | 0.0085 | 2.9181 | 2.8815 | 8 | 224 | protein folding |
| GO:2001252 | 0.0086 | 3.5917 | 1.7623 | 6 | 137 | positive regulation of chromosome organization |
| GO:0032204 | 0.0093 | 5.199 | 0.8233 | 4 | 64 | regulation of telomere maintenance |
| GOMFID | Pvalue | OddsRatio | ExpCount | Count | Size | Term |
| GO:0007005 | 1e-04 | 2.3625 | 12.3853 | 27 | 723 | mitochondrion organization |
| GO:0071826 | 2e-04 | 3.8278 | 3.3918 | 12 | 198 | ribonucleoprotein complex subunit organization |
| GO:0000027 | 4e-04 | 13.6888 | 0.3597 | 4 | 21 | ribosomal large subunit assembly |
| GO:0006397 | 7e-04 | 2.5813 | 7.0259 | 17 | 413 | mRNA processing |
| GO:0032780 | 0.001 | 19.3296 | 0.2056 | 3 | 12 | negative regulation of ATPase activity |
| GO:0006353 | 0.0012 | 4.713 | 1.6103 | 7 | 94 | DNA-templated transcription, termination |
| GO:0033365 | 0.0013 | 1.9987 | 14.441 | 27 | 843 | protein localization to organelle |
| GO:0097193 | 0.0014 | 2.7992 | 4.9336 | 13 | 288 | intrinsic apoptotic signaling pathway |
| GO:0030150 | 0.0016 | 15.8131 | 0.2398 | 3 | 14 | protein import into mitochondrial matrix |
| GO:0031123 | 0.0021 | 4.2244 | 1.7816 | 7 | 104 | RNA 3'-end processing |
| GO:0098792 | 0.0023 | 4.1385 | 1.8158 | 7 | 106 | xenophagy |
| GO:0034641 | 0.0025 | 1.4258 | 105.0441 | 128 | 6132 | cellular nitrogen compound metabolic process |
| GO:0008152 | 0.0026 | 1.5168 | 191.4332 | 212 | 11175 | metabolic process |
| GO:0043456 | 0.0028 | 38.5293 | 0.0857 | 2 | 5 | regulation of pentose-phosphate shunt |
| GO:0031442 | 0.0028 | 12.4221 | 0.2912 | 3 | 17 | positive regulation of mRNA 3'-end processing |
| GO:0072599 | 0.0028 | 3.9768 | 1.8844 | 7 | 110 | establishment of protein localization to endoplasmic reticulum |
| GO:0090502 | 0.0029 | 5.6024 | 0.9764 | 5 | 57 | RNA phosphodiester bond hydrolysis, endonucleolytic |
| GO:0008380 | 0.0031 | 2.4521 | 6.0299 | 14 | 352 | RNA splicing |
| GO:0045986 | 0.0034 | 11.5932 | 0.3083 | 3 | 18 | negative regulation of smooth muscle contraction |
| GO:0022613 | 0.0035 | 2.4155 | 6.1156 | 14 | 357 | ribonucleoprotein complex biogenesis |
| GO:0034976 | 0.0039 | 2.7222 | 4.2655 | 11 | 249 | response to endoplasmic reticulum stress |
| GO:0032730 | 0.0042 | 28.8951 | 0.1028 | 2 | 6 | positive regulation of interleukin-1 alpha production |
| GO:0071763 | 0.0042 | 28.8951 | 0.1028 | 2 | 6 | nuclear membrane organization |
| GO:0006612 | 0.0043 | 3.0358 | 3.1349 | 9 | 183 | protein targeting to membrane |
| GO:0002697 | 0.0044 | 2.272 | 6.955 | 15 | 406 | regulation of immune effector process |
| GO:0000387 | 0.0047 | 6.4562 | 0.6852 | 4 | 40 | spliceosomal snRNP assembly |
| GO:0045333 | 0.0048 | 2.9838 | 3.1863 | 9 | 186 | cellular respiration |
| GO:0002230 | 0.005 | 3.559 | 2.0899 | 7 | 122 | positive regulation of defense response to virus by host |
| GO:0032049 | 0.0058 | 23.1146 | 0.1199 | 2 | 7 | cardiolipin biosynthetic process |
| GO:2000288 | 0.0058 | 23.1146 | 0.1199 | 2 | 7 | positive regulation of myoblast proliferation |
| GO:0046483 | 0.0059 | 1.3827 | 93.7551 | 114 | 5473 | heterocycle metabolic process |
| GO:0051882 | 0.006 | 9.1502 | 0.3769 | 3 | 22 | mitochondrial depolarization |
| GO:0006733 | 0.0074 | 3.2988 | 2.2441 | 7 | 131 | oxidoreduction coenzyme metabolic process |
| GO:0098787 | 0.0076 | 19.2609 | 0.137 | 2 | 8 | mRNA cleavage involved in mRNA processing |
| GO:0065002 | 0.0078 | 5.5317 | 0.788 | 4 | 46 | intracellular protein transmembrane transport |
| GO:1903313 | 0.0078 | 5.5317 | 0.788 | 4 | 46 | positive regulation of mRNA metabolic process |
| GO:0006414 | 0.0082 | 2.7335 | 3.4604 | 9 | 202 | translational elongation |
| GO:0006614 | 0.0082 | 3.645 | 1.7473 | 6 | 102 | SRP-dependent cotranslational protein targeting to membrane |
| GO:0090304 | 0.0082 | 1.374 | 81.3013 | 100 | 4746 | nucleic acid metabolic process |
| GO:0045730 | 0.0087 | 7.9009 | 0.4283 | 3 | 25 | respiratory burst |
| GO:0008299 | 0.0097 | 7.5569 | 0.4454 | 3 | 26 | isoprenoid biosynthetic process |
| GO:0006415 | 0.0097 | 2.8539 | 2.9464 | 8 | 172 | translational termination |
| GO:0006108 | 0.0097 | 16.5083 | 0.1542 | 2 | 9 | malate metabolic process |
| GO:0006924 | 0.0097 | 16.5083 | 0.1542 | 2 | 9 | activation-induced cell death of T cells |
| GO:0034622 | 0.0097 | 1.7571 | 14.3725 | 24 | 839 | cellular macromolecular complex assembly |
| GO:0070265 | 0.0098 | 5.1619 | 0.8394 | 4 | 49 | necrotic cell death |
| GO:0090501 | 0.0099 | 5.1291 | 0.8437 | 4 | 50 | RNA phosphodiester bond hydrolysis |
| GOMFID | Pvalue | OddsRatio | ExpCount | Count | Size | Term |
| GO:0072703 | 2e-04 | Inf | 0.0293 | 2 | 2 | cellular response to methyl methanesulfonate |
| GO:0045453 | 0.001 | 7.2936 | 0.7616 | 5 | 52 | bone resorption |
| GO:0044260 | 0.0013 | 1.5145 | 116.8821 | 140 | 7980 | cellular macromolecule metabolic process |
| GO:0044271 | 0.0016 | 1.5226 | 66.8484 | 88 | 4564 | cellular nitrogen compound biosynthetic process |
| GO:0032774 | 0.0021 | 1.5395 | 52.8167 | 72 | 3606 | RNA biosynthetic process |
| GO:0030431 | 0.0022 | 8.037 | 0.5566 | 4 | 38 | sleep |
| GO:0001661 | 0.0031 | 33.9232 | 0.0879 | 2 | 6 | conditioned taste aversion |
| GO:0006471 | 0.0034 | 11.3473 | 0.3076 | 3 | 21 | protein ADP-ribosylation |
| GO:0010948 | 0.0037 | 2.9097 | 3.6324 | 10 | 248 | negative regulation of cell cycle process |
| GO:0018130 | 0.0037 | 1.4828 | 59.4078 | 78 | 4056 | heterocycle biosynthetic process |
| GO:0019438 | 0.0038 | 1.4813 | 59.4517 | 78 | 4059 | aromatic compound biosynthetic process |
| GO:0043487 | 0.0042 | 3.6762 | 2.0213 | 7 | 138 | regulation of RNA stability |
| GO:0021894 | 0.0043 | 27.1368 | 0.1025 | 2 | 7 | cerebral cortex GABAergic interneuron development |
| GO:0006807 | 0.0044 | 1.4298 | 93.989 | 114 | 6417 | nitrogen compound metabolic process |
| GO:0045187 | 0.0044 | 10.2112 | 0.3369 | 3 | 23 | regulation of circadian sleep/wake cycle, sleep |
| GO:0006351 | 0.0051 | 1.4843 | 50.9565 | 68 | 3479 | transcription, DNA-templated |
| GO:0090304 | 0.0053 | 1.4389 | 69.5141 | 88 | 4746 | nucleic acid metabolic process |
| GO:1901362 | 0.0055 | 1.4512 | 61.2093 | 79 | 4179 | organic cyclic compound biosynthetic process |
| GO:0048102 | 0.0056 | 22.6126 | 0.1172 | 2 | 8 | autophagic cell death |
| GO:0048771 | 0.0057 | 3.4629 | 2.1384 | 7 | 146 | tissue remodeling |
| GO:0009058 | 0.006 | 1.4124 | 87.0025 | 106 | 5940 | biosynthetic process |
| GO:2000352 | 0.0063 | 8.8776 | 0.3808 | 3 | 26 | negative regulation of endothelial cell apoptotic process |
| GO:0032984 | 0.0067 | 2.5147 | 4.5991 | 11 | 314 | macromolecular complex disassembly |
| GO:0043624 | 0.0069 | 2.639 | 3.984 | 10 | 272 | cellular protein complex disassembly |
| GO:0042036 | 0.007 | 8.5072 | 0.3955 | 3 | 27 | negative regulation of cytokine biosynthetic process |
| GO:0061042 | 0.0072 | 19.381 | 0.1318 | 2 | 9 | vascular wound healing |
| GO:0051348 | 0.0072 | 2.3785 | 5.3022 | 12 | 362 | negative regulation of transferase activity |
| GO:0006518 | 0.0073 | 1.9207 | 10.9998 | 20 | 751 | peptide metabolic process |
| GO:0070124 | 0.0078 | 4.3302 | 1.2303 | 5 | 84 | mitochondrial translational initiation |
| GO:0070125 | 0.0078 | 4.3302 | 1.2303 | 5 | 84 | mitochondrial translational elongation |
| GO:0031145 | 0.0082 | 4.2758 | 1.245 | 5 | 85 | anaphase-promoting complex-dependent proteasomal ubiquitin-dependent protein catabolic process |
| GO:0051782 | 0.0082 | 4.2758 | 1.245 | 5 | 85 | negative regulation of cell division |
| GO:0009303 | 0.0086 | 7.8517 | 0.4248 | 3 | 29 | rRNA transcription |
| GO:0022410 | 0.0086 | 7.8517 | 0.4248 | 3 | 29 | circadian sleep/wake cycle process |
| GO:0070126 | 0.0086 | 4.2228 | 1.2596 | 5 | 86 | mitochondrial translational termination |
| GO:0002634 | 0.0089 | 16.9572 | 0.1465 | 2 | 10 | regulation of germinal center formation |
| GO:0097201 | 0.0089 | 16.9572 | 0.1465 | 2 | 10 | negative regulation of transcription from RNA polymerase II promoter in response to stress |
| GO:2001243 | 0.009 | 4.171 | 1.2743 | 5 | 87 | negative regulation of intrinsic apoptotic signaling pathway |
| GO:1903320 | 0.0092 | 2.5214 | 4.1597 | 10 | 284 | regulation of protein modification by small protein conjugation or removal |
| GO:0031400 | 0.0095 | 1.9784 | 9.0371 | 17 | 617 | negative regulation of protein modification process |
| GOMFID | Pvalue | OddsRatio | ExpCount | Count | Size | Term |
| GO:0050911 | 0 | 13.1796 | 1.508 | 15 | 370 | detection of chemical stimulus involved in sensory perception of smell |
| GO:0009593 | 0 | 11.6506 | 1.8381 | 16 | 451 | detection of chemical stimulus |
| GO:0007606 | 0 | 11.3028 | 1.8911 | 16 | 464 | sensory perception of chemical stimulus |
| GO:0050906 | 0 | 11.3028 | 1.8911 | 16 | 464 | detection of stimulus involved in sensory perception |
| GO:0007186 | 0 | 6.2172 | 4.7278 | 21 | 1160 | G-protein coupled receptor signaling pathway |
| GO:0050877 | 0 | 4.7254 | 4.9478 | 18 | 1214 | neurological system process |
| GO:0019755 | 7e-04 | 63.0282 | 0.0408 | 2 | 10 | one-carbon compound transport |
| GO:0051024 | 7e-04 | 63.0282 | 0.0408 | 2 | 10 | positive regulation of immunoglobulin secretion |
| GO:0015793 | 9e-04 | 56.0215 | 0.0448 | 2 | 11 | glycerol transport |
| GO:0009617 | 0.0013 | 4.1785 | 2.1397 | 8 | 525 | response to bacterium |
| GO:0007154 | 0.0023 | 2.0982 | 24.3643 | 36 | 5978 | cell communication |
| GO:0006925 | 0.0027 | 29.6433 | 0.0774 | 2 | 19 | inflammatory cell apoptotic process |
| GO:0050830 | 0.0038 | 10.3445 | 0.3138 | 3 | 77 | defense response to Gram-positive bacterium |
| GO:0044700 | 0.0038 | 2.0151 | 24.0178 | 35 | 5893 | single organism signaling |
| GO:0072616 | 0.0041 | Inf | 0.0041 | 1 | 1 | interleukin-18 secretion |
| GO:1903036 | 0.0041 | 6.6167 | 0.6521 | 4 | 160 | positive regulation of response to wounding |
| GO:0002690 | 0.0042 | 9.9395 | 0.3261 | 3 | 80 | positive regulation of leukocyte chemotaxis |
| GO:1904037 | 0.0043 | 22.8988 | 0.0978 | 2 | 24 | positive regulation of epithelial cell apoptotic process |
| GO:0051716 | 0.0055 | 1.9581 | 27.3965 | 38 | 6722 | cellular response to stimulus |
| GO:0002446 | 0.0058 | 19.371 | 0.1141 | 2 | 28 | neutrophil mediated immunity |
| GO:0032103 | 0.0063 | 4.5984 | 1.1738 | 5 | 288 | positive regulation of response to external stimulus |
| GO:0098542 | 0.0067 | 3.4272 | 2.2335 | 7 | 548 | defense response to other organism |
| GO:0071887 | 0.0077 | 7.9626 | 0.4035 | 3 | 99 | leukocyte apoptotic process |
| GO:0002384 | 0.0081 | 248.2222 | 0.0082 | 1 | 2 | hepatic immune response |
| GO:0006535 | 0.0081 | 248.2222 | 0.0082 | 1 | 2 | cysteine biosynthetic process from serine |
| GO:0043418 | 0.0081 | 248.2222 | 0.0082 | 1 | 2 | homocysteine catabolic process |
| GO:0048388 | 0.0081 | 248.2222 | 0.0082 | 1 | 2 | endosomal lumen acidification |
| GO:0050864 | 0.0083 | 7.7198 | 0.4157 | 3 | 102 | regulation of B cell activation |
| GO:0002366 | 0.0094 | 5.1725 | 0.8274 | 4 | 203 | leukocyte activation involved in immune response |
| GOMFID | Pvalue | OddsRatio | ExpCount | Count | Size | Term |
| GO:0050911 | 0 | 19.9045 | 0.9661 | 13 | 370 | detection of chemical stimulus involved in sensory perception of smell |
| GO:0009593 | 0 | 16.1376 | 1.1775 | 13 | 451 | detection of chemical stimulus |
| GO:0007606 | 0 | 15.6591 | 1.2115 | 13 | 464 | sensory perception of chemical stimulus |
| GO:0050906 | 0 | 15.6591 | 1.2115 | 13 | 464 | detection of stimulus involved in sensory perception |
| GO:0000042 | 0 | 167.1902 | 0.047 | 5 | 18 | protein targeting to Golgi |
| GO:0007186 | 0 | 8.122 | 3.0287 | 16 | 1160 | G-protein coupled receptor signaling pathway |
| GO:0006891 | 0 | 57.1053 | 0.1123 | 5 | 43 | intra-Golgi vesicle-mediated transport |
| GO:0050877 | 0 | 6.249 | 3.1697 | 14 | 1214 | neurological system process |
| GO:0019740 | 2e-04 | 133.812 | 0.0209 | 2 | 8 | nitrogen utilization |
| GO:0035574 | 7e-04 | 61.7318 | 0.0392 | 2 | 15 | histone H4-K20 demethylation |
| GO:0006995 | 8e-04 | 57.3187 | 0.0418 | 2 | 16 | cellular response to nitrogen starvation |
| GO:0045653 | 0.001 | 50.1474 | 0.047 | 2 | 18 | negative regulation of megakaryocyte differentiation |
| GO:0015695 | 0.0012 | 44.5698 | 0.0522 | 2 | 20 | organic cation transport |
| GO:0072488 | 0.0018 | 36.4569 | 0.0627 | 2 | 24 | ammonium transmembrane transport |
| GO:0006353 | 0.0019 | 13.5087 | 0.2454 | 3 | 94 | DNA-templated transcription, termination |
| GO:2000529 | 0.0026 | Inf | 0.0026 | 1 | 1 | positive regulation of myeloid dendritic cell chemotaxis |
| GO:2000548 | 0.0026 | Inf | 0.0026 | 1 | 1 | negative regulation of dendritic cell dendrite assembly |
| GO:0006335 | 0.0031 | 26.7214 | 0.0836 | 2 | 32 | DNA replication-dependent nucleosome assembly |
| GO:0016577 | 0.0033 | 25.8577 | 0.0862 | 2 | 33 | histone demethylation |
| GO:0008214 | 0.0037 | 24.2875 | 0.0914 | 2 | 35 | protein dealkylation |
| GO:0032776 | 0.0037 | 24.2875 | 0.0914 | 2 | 35 | DNA methylation on cytosine |
| GO:0051290 | 0.0044 | 22.2593 | 0.0992 | 2 | 38 | protein heterotetramerization |
| GO:0000387 | 0.0049 | 21.085 | 0.1044 | 2 | 40 | spliceosomal snRNP assembly |
| GO:0034080 | 0.0049 | 21.085 | 0.1044 | 2 | 40 | CENP-A containing nucleosome assembly |
| GO:0000183 | 0.0051 | 20.5431 | 0.107 | 2 | 41 | chromatin silencing at rDNA |
| GO:0035759 | 0.0052 | 391.525 | 0.0052 | 1 | 2 | mesangial cell-matrix adhesion |
| GO:1901532 | 0.0056 | 19.5385 | 0.1123 | 2 | 43 | regulation of hematopoietic progenitor cell differentiation |
| GO:0072594 | 0.0058 | 4.0903 | 1.6606 | 6 | 636 | establishment of protein localization to organelle |
| GO:2000107 | 0.0061 | 18.6273 | 0.1175 | 2 | 45 | negative regulation of leukocyte apoptotic process |
| GO:0031424 | 0.0072 | 17.0376 | 0.1279 | 2 | 49 | keratinization |
| GO:0034724 | 0.0075 | 16.6816 | 0.1305 | 2 | 50 | DNA replication-independent nucleosome organization |
| GO:0034421 | 0.0078 | 195.75 | 0.0078 | 1 | 3 | post-translational protein acetylation |
| GO:0046013 | 0.0078 | 195.75 | 0.0078 | 1 | 3 | regulation of T cell homeostatic proliferation |
| GO:0000245 | 0.0084 | 15.6973 | 0.1384 | 2 | 53 | spliceosomal complex assembly |
| GO:0018149 | 0.009 | 15.103 | 0.1436 | 2 | 55 | peptide cross-linking |
| GOMFID | Pvalue | OddsRatio | ExpCount | Count | Size | Term |
| GO:0050911 | 0 | 8.392 | 1.7201 | 12 | 370 | detection of chemical stimulus involved in sensory perception of smell |
| GO:0009593 | 0 | 6.8073 | 2.0966 | 12 | 451 | detection of chemical stimulus |
| GO:0007606 | 0 | 6.6058 | 2.157 | 12 | 464 | sensory perception of chemical stimulus |
| GO:0050906 | 0 | 6.6058 | 2.157 | 12 | 464 | detection of stimulus involved in sensory perception |
| GO:0007186 | 0 | 4.2365 | 5.3102 | 18 | 1158 | G-protein coupled receptor signaling pathway |
| GO:0050877 | 4e-04 | 3.1127 | 5.6436 | 15 | 1214 | neurological system process |
| GO:0030593 | 7e-04 | 10.9919 | 0.3998 | 4 | 86 | neutrophil chemotaxis |
| GO:0031424 | 0.0015 | 14.5193 | 0.2278 | 3 | 49 | keratinization |
| GO:0097530 | 0.0017 | 8.49 | 0.5114 | 4 | 110 | granulocyte migration |
| GO:0050729 | 0.0018 | 8.3317 | 0.5207 | 4 | 112 | positive regulation of inflammatory response |
| GO:0018149 | 0.0021 | 12.839 | 0.2557 | 3 | 55 | peptide cross-linking |
| GO:2000678 | 0.0025 | 31.4205 | 0.0744 | 2 | 16 | negative regulation of transcription regulatory region DNA binding |
| GO:0045471 | 0.0033 | 7.0208 | 0.6136 | 4 | 132 | response to ethanol |
| GO:0051102 | 0.0046 | Inf | 0.0046 | 1 | 1 | DNA ligation involved in DNA recombination |
| GO:1990079 | 0.0046 | Inf | 0.0046 | 1 | 1 | cartilage homeostasis |
| GO:0070098 | 0.0059 | 8.7711 | 0.3673 | 3 | 79 | chemokine-mediated signaling pathway |
| GO:0045778 | 0.0072 | 8.1261 | 0.3951 | 3 | 85 | positive regulation of ossification |
| GO:0071347 | 0.0085 | 7.6567 | 0.4184 | 3 | 90 | cellular response to interleukin-1 |
| GO:0006535 | 0.0093 | 217.0694 | 0.0093 | 1 | 2 | cysteine biosynthetic process from serine |
| GO:0035606 | 0.0093 | 217.0694 | 0.0093 | 1 | 2 | peptidyl-cysteine S-trans-nitrosylation |
| GO:0038188 | 0.0093 | 217.0694 | 0.0093 | 1 | 2 | cholecystokinin signaling pathway |
| GO:0043418 | 0.0093 | 217.0694 | 0.0093 | 1 | 2 | homocysteine catabolic process |
| GO:0045113 | 0.0093 | 217.0694 | 0.0093 | 1 | 2 | regulation of integrin biosynthetic process |
| GO:0070488 | 0.0093 | 217.0694 | 0.0093 | 1 | 2 | neutrophil aggregation |
| GO:0030595 | 0.0093 | 5.1795 | 0.8228 | 4 | 177 | leukocyte chemotaxis |
| GOMFID | Pvalue | OddsRatio | ExpCount | Count | Size | Term |
| GO:0071593 | 0 | 5.196 | 4.4395 | 20 | 433 | lymphocyte aggregation |
| GO:0034109 | 0 | 5.6836 | 2.99 | 15 | 301 | homotypic cell-cell adhesion |
| GO:0098602 | 0 | 3.4062 | 7.6691 | 23 | 748 | single organism cell adhesion |
| GO:0007159 | 0 | 5.4567 | 2.6625 | 13 | 268 | leukocyte cell-cell adhesion |
| GO:0006955 | 0 | 2.4256 | 16.7326 | 35 | 1632 | immune response |
| GO:0050863 | 0 | 4.5554 | 2.8913 | 12 | 282 | regulation of T cell activation |
| GO:0030220 | 0 | 26.3728 | 0.1948 | 4 | 19 | platelet formation |
| GO:0098609 | 1e-04 | 2.7597 | 8.8687 | 22 | 865 | cell-cell adhesion |
| GO:0031295 | 1e-04 | 8.9408 | 0.7485 | 6 | 73 | T cell costimulation |
| GO:0018003 | 1e-04 | Inf | 0.0205 | 2 | 2 | peptidyl-lysine N6-acetylation |
| GO:0002694 | 1e-04 | 3.5062 | 4.3574 | 14 | 425 | regulation of leukocyte activation |
| GO:0042110 | 2e-04 | 6.3121 | 1.2111 | 7 | 126 | T cell activation |
| GO:1900424 | 2e-04 | 32.77 | 0.123 | 3 | 12 | regulation of defense response to bacterium |
| GO:0002807 | 3e-04 | 195.4843 | 0.0308 | 2 | 3 | positive regulation of antimicrobial peptide biosynthetic process |
| GO:0002808 | 3e-04 | 195.4843 | 0.0308 | 2 | 3 | regulation of antibacterial peptide biosynthetic process |
| GO:0006965 | 3e-04 | 195.4843 | 0.0308 | 2 | 3 | positive regulation of biosynthetic process of antibacterial peptides active against Gram-positive bacteria |
| GO:0022407 | 5e-04 | 3.3488 | 3.8653 | 12 | 377 | regulation of cell-cell adhesion |
| GO:0002443 | 5e-04 | 3.8178 | 2.8195 | 10 | 275 | leukocyte mediated immunity |
| GO:0001775 | 6e-04 | 2.7677 | 6.2966 | 16 | 643 | cell activation |
| GO:0097029 | 6e-04 | 97.7358 | 0.041 | 2 | 4 | mature conventional dendritic cell differentiation |
| GO:0035855 | 6e-04 | 21.0597 | 0.1743 | 3 | 17 | megakaryocyte development |
| GO:0050867 | 7e-04 | 3.704 | 2.9015 | 10 | 283 | positive regulation of cell activation |
| GO:0002440 | 8e-04 | 4.9649 | 1.5174 | 7 | 148 | production of molecular mediator of immune response |
| GO:0022610 | 0.001 | 2.0777 | 14.3642 | 27 | 1401 | biological adhesion |
| GO:0002455 | 0.0011 | 9.6324 | 0.4614 | 4 | 45 | humoral immune response mediated by circulating immunoglobulin |
| GO:0034341 | 0.0012 | 4.6642 | 1.6097 | 7 | 157 | response to interferon-gamma |
| GO:0035456 | 0.0014 | 15.5127 | 0.2256 | 3 | 22 | response to interferon-beta |
| GO:0002803 | 0.0015 | 48.8616 | 0.0615 | 2 | 6 | positive regulation of antibacterial peptide production |
| GO:0002920 | 0.0016 | 8.774 | 0.5024 | 4 | 49 | regulation of humoral immune response |
| GO:0002253 | 0.0017 | 2.7504 | 5.0649 | 13 | 494 | activation of immune response |
| GO:0002684 | 0.0019 | 2.2593 | 9.1045 | 19 | 888 | positive regulation of immune system process |
| GO:0002760 | 0.0021 | 39.0868 | 0.0718 | 2 | 7 | positive regulation of antimicrobial humoral response |
| GO:0002784 | 0.0021 | 39.0868 | 0.0718 | 2 | 7 | regulation of antimicrobial peptide production |
| GO:0045217 | 0.0021 | 39.0868 | 0.0718 | 2 | 7 | cell-cell junction maintenance |
| GO:0050862 | 0.0021 | 39.0868 | 0.0718 | 2 | 7 | positive regulation of T cell receptor signaling pathway |
| GO:0042035 | 0.0028 | 5.565 | 0.9638 | 5 | 94 | regulation of cytokine biosynthetic process |
| GO:0015684 | 0.0028 | 32.5702 | 0.082 | 2 | 8 | ferrous iron transport |
| GO:0035234 | 0.0028 | 32.5702 | 0.082 | 2 | 8 | ectopic germ cell programmed cell death |
| GO:0019221 | 0.0029 | 2.4835 | 6.0287 | 14 | 588 | cytokine-mediated signaling pathway |
| GO:0019083 | 0.0031 | 3.9012 | 1.907 | 7 | 186 | viral transcription |
| GO:0032611 | 0.0031 | 7.1741 | 0.6049 | 4 | 59 | interleukin-1 beta production |
| GO:0019724 | 0.0034 | 5.3243 | 1.0048 | 5 | 98 | B cell mediated immunity |
| GO:0006952 | 0.0035 | 2.0236 | 11.8556 | 22 | 1214 | defense response |
| GO:0051873 | 0.0036 | 27.9155 | 0.0923 | 2 | 9 | killing by host of symbiont cells |
| GO:0060586 | 0.0036 | 27.9155 | 0.0923 | 2 | 9 | multicellular organismal iron ion homeostasis |
| GO:2000508 | 0.0036 | 27.9155 | 0.0923 | 2 | 9 | regulation of dendritic cell chemotaxis |
| GO:0032642 | 0.0037 | 6.8017 | 0.6357 | 4 | 62 | regulation of chemokine production |
| GO:0002823 | 0.0039 | 10.5203 | 0.3178 | 3 | 31 | negative regulation of adaptive immune response based on somatic recombination of immune receptors built from immunoglobulin superfamily domains |
| GO:0002429 | 0.0041 | 3.0709 | 3.1066 | 9 | 303 | immune response-activating cell surface receptor signaling pathway |
| GO:0002244 | 0.0041 | 4.2281 | 1.5072 | 6 | 147 | hematopoietic progenitor cell differentiation |
| GO:0044419 | 0.0041 | 2.1899 | 8.3253 | 17 | 812 | interspecies interaction between organisms |
| GO:0098542 | 0.0043 | 2.4639 | 5.6185 | 13 | 548 | defense response to other organism |
| GO:0051251 | 0.0043 | 3.3058 | 2.5632 | 8 | 250 | positive regulation of lymphocyte activation |
| GO:0035518 | 0.0045 | 24.4245 | 0.1025 | 2 | 10 | histone H2A monoubiquitination |
| GO:0070493 | 0.0045 | 24.4245 | 0.1025 | 2 | 10 | thrombin receptor signaling pathway |
| GO:0071281 | 0.0045 | 24.4245 | 0.1025 | 2 | 10 | cellular response to iron ion |
| GO:0097201 | 0.0045 | 24.4245 | 0.1025 | 2 | 10 | negative regulation of transcription from RNA polymerase II promoter in response to stress |
| GO:0034112 | 0.0046 | 3.6149 | 2.0506 | 7 | 200 | positive regulation of homotypic cell-cell adhesion |
| GO:0001816 | 0.0047 | 2.3473 | 6.3567 | 14 | 620 | cytokine production |
| GO:1903039 | 0.0048 | 3.5774 | 2.0711 | 7 | 202 | positive regulation of leukocyte cell-cell adhesion |
| GO:0002706 | 0.0049 | 4.8517 | 1.0971 | 5 | 107 | regulation of lymphocyte mediated immunity |
| GO:0042107 | 0.0051 | 4.8043 | 1.1073 | 5 | 108 | cytokine metabolic process |
| GO:0044033 | 0.0055 | 3.4868 | 2.1223 | 7 | 207 | multi-organism metabolic process |
| GO:0050729 | 0.0059 | 4.6235 | 1.1483 | 5 | 112 | positive regulation of inflammatory response |
| GO:0016032 | 0.006 | 2.1522 | 7.9357 | 16 | 774 | viral process |
| GO:0044458 | 0.0064 | 19.5371 | 0.123 | 2 | 12 | motile cilium assembly |
| GO:0033077 | 0.0067 | 5.7133 | 0.7485 | 4 | 73 | T cell differentiation in thymus |
| GO:0002819 | 0.0071 | 4.4156 | 1.1996 | 5 | 117 | regulation of adaptive immune response |
| GO:0002295 | 0.0076 | 17.7599 | 0.1333 | 2 | 13 | T-helper cell lineage commitment |
| GO:0030836 | 0.0076 | 17.7599 | 0.1333 | 2 | 13 | positive regulation of actin filament depolymerization |
| GO:0031274 | 0.0076 | 17.7599 | 0.1333 | 2 | 13 | positive regulation of pseudopodium assembly |
| GO:0045086 | 0.0076 | 17.7599 | 0.1333 | 2 | 13 | positive regulation of interleukin-2 biosynthetic process |
| GO:0071243 | 0.0076 | 17.7599 | 0.1333 | 2 | 13 | cellular response to arsenic-containing substance |
| GO:0097192 | 0.0077 | 5.4742 | 0.7792 | 4 | 76 | extrinsic apoptotic signaling pathway in absence of ligand |
| GO:0048872 | 0.0078 | 3.2557 | 2.2659 | 7 | 221 | homeostasis of number of cells |
| GO:0050854 | 0.0079 | 7.9567 | 0.4101 | 3 | 40 | regulation of antigen receptor-mediated signaling pathway |
| GO:0071622 | 0.0079 | 7.9567 | 0.4101 | 3 | 40 | regulation of granulocyte chemotaxis |
| GO:0009617 | 0.0079 | 2.3594 | 5.3827 | 12 | 525 | response to bacterium |
| GO:0050830 | 0.0081 | 5.3988 | 0.7895 | 4 | 77 | defense response to Gram-positive bacterium |
| GO:0042098 | 0.0084 | 3.6075 | 1.7532 | 6 | 171 | T cell proliferation |
| GO:0001660 | 0.0088 | 16.2788 | 0.1435 | 2 | 14 | fever generation |
| GO:0002363 | 0.0088 | 16.2788 | 0.1435 | 2 | 14 | alpha-beta T cell lineage commitment |
| GO:0051818 | 0.0088 | 16.2788 | 0.1435 | 2 | 14 | disruption of cells of other organism involved in symbiotic interaction |
| GO:0045058 | 0.0091 | 7.5477 | 0.4306 | 3 | 42 | T cell selection |
| GO:0002697 | 0.0091 | 2.5329 | 4.1626 | 10 | 406 | regulation of immune effector process |
| GO:0002690 | 0.0092 | 5.1847 | 0.8202 | 4 | 80 | positive regulation of leukocyte chemotaxis |
| GOMFID | Pvalue | OddsRatio | ExpCount | Count | Size | Term |
| GO:0007606 | 0 | 7.4775 | 3.4572 | 21 | 464 | sensory perception of chemical stimulus |
| GO:0050911 | 0 | 8.4152 | 2.7568 | 19 | 370 | detection of chemical stimulus involved in sensory perception of smell |
| GO:0009593 | 0 | 7.25 | 3.3603 | 20 | 451 | detection of chemical stimulus |
| GO:0050906 | 0 | 7.0317 | 3.4572 | 20 | 464 | detection of stimulus involved in sensory perception |
| GO:0007186 | 0 | 3.1094 | 8.6429 | 23 | 1160 | G-protein coupled receptor signaling pathway |
| GO:0050877 | 1e-04 | 2.7964 | 9.0453 | 22 | 1214 | neurological system process |
| GO:0002807 | 2e-04 | 271.0435 | 0.0224 | 2 | 3 | positive regulation of antimicrobial peptide biosynthetic process |
| GO:0002808 | 2e-04 | 271.0435 | 0.0224 | 2 | 3 | regulation of antibacterial peptide biosynthetic process |
| GO:0006965 | 2e-04 | 271.0435 | 0.0224 | 2 | 3 | positive regulation of biosynthetic process of antibacterial peptides active against Gram-positive bacteria |
| GO:0071294 | 2e-04 | 31.5243 | 0.1192 | 3 | 16 | cellular response to zinc ion |
| GO:0042742 | 3e-04 | 7.0636 | 0.927 | 6 | 128 | defense response to bacterium |
| GO:0051707 | 3e-04 | 2.8444 | 6.6759 | 17 | 896 | response to other organism |
| GO:0035455 | 4e-04 | 25.6086 | 0.1416 | 3 | 19 | response to interferon-alpha |
| GO:0019731 | 5e-04 | 11.9584 | 0.3725 | 4 | 50 | antibacterial humoral response |
| GO:0009607 | 5e-04 | 2.7258 | 6.9442 | 17 | 932 | response to biotic stimulus |
| GO:0002803 | 8e-04 | 67.7478 | 0.0447 | 2 | 6 | positive regulation of antibacterial peptide production |
| GO:0002760 | 0.0011 | 54.1948 | 0.0522 | 2 | 7 | positive regulation of antimicrobial humoral response |
| GO:0002784 | 0.0011 | 54.1948 | 0.0522 | 2 | 7 | regulation of antimicrobial peptide production |
| GO:0001913 | 0.0016 | 14.6222 | 0.231 | 3 | 31 | T cell mediated cytotoxicity |
| GO:0031640 | 0.0017 | 14.1171 | 0.2384 | 3 | 32 | killing of cells of other organism |
| GO:0006415 | 0.0018 | 5.0212 | 1.2815 | 6 | 172 | translational termination |
| GO:0045087 | 0.002 | 2.4634 | 7.1561 | 16 | 989 | innate immune response |
| GO:0001906 | 0.0024 | 7.7131 | 0.5601 | 4 | 77 | cell killing |
| GO:0006612 | 0.0025 | 4.7058 | 1.3635 | 6 | 183 | protein targeting to membrane |
| GO:0050830 | 0.0026 | 7.5224 | 0.5737 | 4 | 77 | defense response to Gram-positive bacterium |
| GO:0019083 | 0.0027 | 4.6264 | 1.3858 | 6 | 186 | viral transcription |
| GO:0051607 | 0.003 | 3.5239 | 2.429 | 8 | 326 | defense response to virus |
| GO:0006413 | 0.0031 | 3.9196 | 1.9074 | 7 | 256 | translational initiation |
| GO:0050832 | 0.0033 | 11.059 | 0.298 | 3 | 40 | defense response to fungus |
| GO:0060337 | 0.0033 | 7.0379 | 0.611 | 4 | 82 | type I interferon signaling pathway |
| GO:1900424 | 0.0035 | 27.0887 | 0.0894 | 2 | 12 | regulation of defense response to bacterium |
| GO:0016259 | 0.0036 | 6.8611 | 0.6259 | 4 | 84 | selenocysteine metabolic process |
| GO:0034340 | 0.0039 | 6.6929 | 0.6408 | 4 | 86 | response to type I interferon |
| GO:0006414 | 0.004 | 4.2443 | 1.5051 | 6 | 202 | translational elongation |
| GO:0044033 | 0.0045 | 4.1374 | 1.5423 | 6 | 207 | multi-organism metabolic process |
| GO:0055072 | 0.0046 | 6.3799 | 0.6706 | 4 | 90 | iron ion homeostasis |
| GO:0019058 | 0.0053 | 2.9584 | 3.2486 | 9 | 436 | viral life cycle |
| GO:0071276 | 0.0054 | 20.8334 | 0.1118 | 2 | 15 | cellular response to cadmium ion |
| GO:0006614 | 0.0071 | 5.5944 | 0.76 | 4 | 102 | SRP-dependent cotranslational protein targeting to membrane |
| GO:0014057 | 0.0075 | Inf | 0.0075 | 1 | 1 | positive regulation of acetylcholine secretion, neurotransmission |
| GO:1901986 | 0.0075 | Inf | 0.0075 | 1 | 1 | response to ketamine |
| GO:1903488 | 0.0075 | Inf | 0.0075 | 1 | 1 | negative regulation of lactation |
| GO:1904010 | 0.0075 | Inf | 0.0075 | 1 | 1 | response to Aroclor 1254 |
| GO:0043241 | 0.0077 | 3.2759 | 2.265 | 7 | 304 | protein complex disassembly |
| GO:0030903 | 0.0087 | 15.9274 | 0.1416 | 2 | 19 | notochord development |
| GO:0046597 | 0.0087 | 15.9274 | 0.1416 | 2 | 19 | negative regulation of viral entry into host cell |
| GO:0070207 | 0.0087 | 15.9274 | 0.1416 | 2 | 19 | protein homotrimerization |
| GO:0072599 | 0.0092 | 5.1695 | 0.8196 | 4 | 110 | establishment of protein localization to endoplasmic reticulum |
| GO:0006959 | 0.0093 | 4.1218 | 1.2815 | 5 | 172 | humoral immune response |
| GO:0050729 | 0.0098 | 5.0731 | 0.8345 | 4 | 112 | positive regulation of inflammatory response |
| GOMFID | Pvalue | OddsRatio | ExpCount | Count | Size | Term |
| GO:0050911 | 0 | 6.3084 | 2.3798 | 13 | 370 | detection of chemical stimulus involved in sensory perception of smell |
| GO:0009593 | 0 | 5.1145 | 2.9008 | 13 | 451 | detection of chemical stimulus |
| GO:0007606 | 0 | 4.9628 | 2.9844 | 13 | 464 | sensory perception of chemical stimulus |
| GO:0050906 | 0 | 4.9628 | 2.9844 | 13 | 464 | detection of stimulus involved in sensory perception |
| GO:0000184 | 1e-04 | 9.0608 | 0.7332 | 6 | 114 | nuclear-transcribed mRNA catabolic process, nonsense-mediated decay |
| GO:0016259 | 2e-04 | 10.234 | 0.5403 | 5 | 84 | selenocysteine metabolic process |
| GO:0021569 | 2e-04 | 157.5758 | 0.0257 | 2 | 4 | rhombomere 3 development |
| GO:0006402 | 3e-04 | 5.8837 | 1.2992 | 7 | 202 | mRNA catabolic process |
| GO:0006614 | 5e-04 | 8.3253 | 0.6561 | 5 | 102 | SRP-dependent cotranslational protein targeting to membrane |
| GO:0072599 | 7e-04 | 7.687 | 0.7075 | 5 | 110 | establishment of protein localization to endoplasmic reticulum |
| GO:0007186 | 0.0011 | 2.5601 | 7.461 | 17 | 1160 | G-protein coupled receptor signaling pathway |
| GO:0007618 | 0.0028 | 11.6185 | 0.283 | 3 | 44 | mating |
| GO:0034655 | 0.0032 | 3.5121 | 2.4506 | 8 | 381 | nucleobase-containing compound catabolic process |
| GO:0015671 | 0.0041 | 24.2253 | 0.0965 | 2 | 15 | oxygen transport |
| GO:0050877 | 0.0045 | 2.2632 | 7.8083 | 16 | 1214 | neurological system process |
| GO:0006415 | 0.0051 | 4.8138 | 1.1063 | 5 | 172 | translational termination |
| GO:0006397 | 0.0058 | 3.1636 | 2.7078 | 8 | 421 | mRNA processing |
| GO:0007634 | 0.0064 | Inf | 0.0064 | 1 | 1 | optokinetic behavior |
| GO:0018070 | 0.0064 | Inf | 0.0064 | 1 | 1 | peptidyl-serine phosphopantetheinylation |
| GO:0019428 | 0.0064 | Inf | 0.0064 | 1 | 1 | allantoin biosynthetic process |
| GO:0019628 | 0.0064 | Inf | 0.0064 | 1 | 1 | urate catabolic process |
| GO:0019878 | 0.0064 | Inf | 0.0064 | 1 | 1 | lysine biosynthetic process via aminoadipic acid |
| GO:0021560 | 0.0064 | Inf | 0.0064 | 1 | 1 | abducens nerve development |
| GO:0021599 | 0.0064 | Inf | 0.0064 | 1 | 1 | abducens nerve formation |
| GO:0035645 | 0.0064 | Inf | 0.0064 | 1 | 1 | enteric smooth muscle cell differentiation |
| GO:0045407 | 0.0064 | Inf | 0.0064 | 1 | 1 | positive regulation of interleukin-5 biosynthetic process |
| GO:2000872 | 0.0064 | Inf | 0.0064 | 1 | 1 | positive regulation of progesterone secretion |
| GO:0048025 | 0.0065 | 18.5205 | 0.1222 | 2 | 19 | negative regulation of mRNA splicing, via spliceosome |
| GO:0006612 | 0.0065 | 4.5131 | 1.177 | 5 | 183 | protein targeting to membrane |
| GO:0019083 | 0.007 | 4.4374 | 1.1963 | 5 | 186 | viral transcription |
| GO:0016070 | 0.0078 | 1.6949 | 27.4127 | 39 | 4262 | RNA metabolic process |
| GO:0090103 | 0.0079 | 16.5688 | 0.1351 | 2 | 21 | cochlea morphogenesis |
| GO:0051028 | 0.0082 | 5.3653 | 0.7911 | 4 | 123 | mRNA transport |
| GO:0042744 | 0.0095 | 14.9889 | 0.1479 | 2 | 23 | hydrogen peroxide catabolic process |
| GO:0006414 | 0.0098 | 4.0728 | 1.2992 | 5 | 202 | translational elongation |
| GOMFID | Pvalue | OddsRatio | ExpCount | Count | Size | Term |
| GO:0050911 | 1e-04 | 4.983 | 2.2384 | 10 | 370 | detection of chemical stimulus involved in sensory perception of smell |
| GO:0007186 | 2e-04 | 3.003 | 6.9384 | 18 | 1159 | G-protein coupled receptor signaling pathway |
| GO:0045986 | 2e-04 | 33.8978 | 0.1089 | 3 | 18 | negative regulation of smooth muscle contraction |
| GO:0009593 | 4e-04 | 4.0462 | 2.7285 | 10 | 451 | detection of chemical stimulus |
| GO:0007606 | 5e-04 | 3.9269 | 2.8071 | 10 | 464 | sensory perception of chemical stimulus |
| GO:0050906 | 5e-04 | 3.9269 | 2.8071 | 10 | 464 | detection of stimulus involved in sensory perception |
| GO:2000252 | 0.001 | 55.9211 | 0.0484 | 2 | 8 | negative regulation of feeding behavior |
| GO:0071318 | 0.0023 | 33.5441 | 0.0726 | 2 | 12 | cellular response to ATP |
| GO:0055119 | 0.0041 | 23.9539 | 0.0968 | 2 | 16 | relaxation of cardiac muscle |
| GO:0006413 | 0.0046 | 4.1415 | 1.5487 | 6 | 256 | translational initiation |
| GO:0048661 | 0.0052 | 9.2211 | 0.3509 | 3 | 58 | positive regulation of smooth muscle cell proliferation |
| GO:0019391 | 0.006 | Inf | 0.006 | 1 | 1 | glucuronoside catabolic process |
| GO:0031989 | 0.006 | Inf | 0.006 | 1 | 1 | bombesin receptor signaling pathway |
| GO:0033552 | 0.006 | Inf | 0.006 | 1 | 1 | response to vitamin B3 |
| GO:0035684 | 0.006 | Inf | 0.006 | 1 | 1 | helper T cell extravasation |
| GO:2000872 | 0.006 | Inf | 0.006 | 1 | 1 | positive regulation of progesterone secretion |
| GO:0010714 | 0.0084 | 15.9621 | 0.1391 | 2 | 23 | positive regulation of collagen metabolic process |
| GOMFID | Pvalue | OddsRatio | ExpCount | Count | Size | Term |
| GO:0050911 | 0 | 12.667 | 1.131 | 11 | 370 | detection of chemical stimulus involved in sensory perception of smell |
| GO:0009593 | 0 | 10.2804 | 1.3786 | 11 | 451 | detection of chemical stimulus |
| GO:0007606 | 0 | 9.9769 | 1.4183 | 11 | 464 | sensory perception of chemical stimulus |
| GO:0050906 | 0 | 9.9769 | 1.4183 | 11 | 464 | detection of stimulus involved in sensory perception |
| GO:0007186 | 0 | 6.3422 | 3.5458 | 16 | 1160 | G-protein coupled receptor signaling pathway |
| GO:0050877 | 0 | 4.4701 | 3.7109 | 13 | 1214 | neurological system process |
| GO:0007586 | 1e-04 | 11.4783 | 0.4952 | 5 | 162 | digestion |
| GO:0032776 | 2e-04 | 32.5479 | 0.107 | 3 | 35 | DNA methylation on cytosine |
| GO:0000183 | 3e-04 | 27.3982 | 0.1253 | 3 | 41 | chromatin silencing at rDNA |
| GO:0032501 | 7e-04 | 2.6808 | 20.5444 | 32 | 6721 | multicellular organismal process |
| GO:0045814 | 0.0012 | 9.5906 | 0.4616 | 4 | 151 | negative regulation of gene expression, epigenetic |
| GO:0045815 | 0.0017 | 14.0369 | 0.2354 | 3 | 77 | positive regulation of gene expression, epigenetic |
| GO:0006305 | 0.0024 | 12.3579 | 0.2659 | 3 | 87 | DNA alkylation |
| GO:0044700 | 0.0027 | 2.3369 | 18.0134 | 28 | 5893 | single organism signaling |
| GO:0021509 | 0.0031 | Inf | 0.0031 | 1 | 1 | roof plate formation |
| GO:0042502 | 0.0031 | Inf | 0.0031 | 1 | 1 | tyrosine phosphorylation of Stat2 protein |
| GO:0071881 | 0.0031 | Inf | 0.0031 | 1 | 1 | adenylate cyclase-inhibiting adrenergic receptor signaling pathway |
| GO:0071882 | 0.0031 | Inf | 0.0031 | 1 | 1 | phospholipase C-activating adrenergic receptor signaling pathway |
| GO:2001051 | 0.0031 | Inf | 0.0031 | 1 | 1 | positive regulation of tendon cell differentiation |
| GO:0007154 | 0.0034 | 2.2835 | 18.2732 | 28 | 5978 | cell communication |
| GO:0006140 | 0.0034 | 7.025 | 0.6236 | 4 | 204 | regulation of nucleotide metabolic process |
| GO:0044728 | 0.0035 | 10.6928 | 0.3057 | 3 | 100 | DNA methylation or demethylation |
| GO:0045909 | 0.0038 | 24.2655 | 0.0917 | 2 | 30 | positive regulation of vasodilation |
| GO:0050878 | 0.0051 | 3.6861 | 2.1397 | 7 | 700 | regulation of body fluid levels |
| GO:0016458 | 0.0053 | 6.2064 | 0.7031 | 4 | 230 | gene silencing |
| GO:0042596 | 0.0057 | 19.4037 | 0.1131 | 2 | 37 | fear response |
| GO:0006334 | 0.006 | 8.778 | 0.3699 | 3 | 121 | nucleosome assembly |
| GO:0044338 | 0.0061 | 333.0638 | 0.0061 | 1 | 2 | canonical Wnt signaling pathway involved in mesenchymal stem cell differentiation |
| GO:0048866 | 0.0061 | 333.0638 | 0.0061 | 1 | 2 | stem cell fate specification |
| GO:0070473 | 0.0061 | 333.0638 | 0.0061 | 1 | 2 | negative regulation of uterine smooth muscle contraction |
| GO:2000552 | 0.0061 | 333.0638 | 0.0061 | 1 | 2 | negative regulation of T-helper 2 cell cytokine production |
| GO:2000663 | 0.0061 | 333.0638 | 0.0061 | 1 | 2 | negative regulation of interleukin-5 secretion |
| GO:2000666 | 0.0061 | 333.0638 | 0.0061 | 1 | 2 | negative regulation of interleukin-13 secretion |
| GO:0030814 | 0.0063 | 8.6306 | 0.376 | 3 | 123 | regulation of cAMP metabolic process |
| GO:0007596 | 0.0063 | 3.9682 | 1.6812 | 6 | 550 | blood coagulation |
| GO:0034421 | 0.0091 | 166.5213 | 0.0092 | 1 | 3 | post-translational protein acetylation |
| GO:0035425 | 0.0091 | 166.5213 | 0.0092 | 1 | 3 | autocrine signaling |
| GO:0035483 | 0.0091 | 166.5213 | 0.0092 | 1 | 3 | gastric emptying |
| GO:0044339 | 0.0091 | 166.5213 | 0.0092 | 1 | 3 | canonical Wnt signaling pathway involved in osteoblast differentiation |
| GO:0071878 | 0.0091 | 166.5213 | 0.0092 | 1 | 3 | negative regulation of adrenergic receptor signaling pathway |
| GO:0071883 | 0.0091 | 166.5213 | 0.0092 | 1 | 3 | activation of MAPK activity by adrenergic receptor signaling pathway |
| GOMFID | Pvalue | OddsRatio | ExpCount | Count | Size | Term |
| GO:0009593 | 0 | 13.2179 | 2.9869 | 28 | 451 | detection of chemical stimulus |
| GO:0050911 | 0 | 14.782 | 2.4505 | 26 | 370 | detection of chemical stimulus involved in sensory perception of smell |
| GO:0007606 | 0 | 12.8128 | 3.073 | 28 | 464 | sensory perception of chemical stimulus |
| GO:0050906 | 0 | 12.8128 | 3.073 | 28 | 464 | detection of stimulus involved in sensory perception |
| GO:0050877 | 0 | 5.9352 | 8.0402 | 34 | 1214 | neurological system process |
| GO:0007186 | 0 | 5.7017 | 7.6826 | 32 | 1160 | G-protein coupled receptor signaling pathway |
| GO:0031424 | 0 | 22.149 | 0.3245 | 6 | 49 | keratinization |
| GO:0018149 | 0 | 19.4294 | 0.3643 | 6 | 55 | peptide cross-linking |
| GO:0043588 | 2e-04 | 5.3556 | 1.6359 | 8 | 247 | skin development |
| GO:0009913 | 0.0014 | 5.3345 | 1.212 | 6 | 183 | epidermal cell differentiation |
| GO:0032501 | 0.0051 | 1.691 | 44.5128 | 58 | 6721 | multicellular organismal process |
| GO:0010224 | 0.0055 | 20.3712 | 0.1126 | 2 | 17 | response to UV-B |
| GO:0034199 | 0.0055 | 20.3712 | 0.1126 | 2 | 17 | activation of protein kinase A activity |
| GO:0019373 | 0.0062 | 19.0968 | 0.1192 | 2 | 18 | epoxygenase P450 pathway |
| GO:0002264 | 0.0066 | Inf | 0.0066 | 1 | 1 | endothelial cell activation involved in immune response |
| GO:0018153 | 0.0066 | Inf | 0.0066 | 1 | 1 | isopeptide cross-linking via N6-(L-isoglutamyl)-L-lysine |
| GO:0042666 | 0.0066 | Inf | 0.0066 | 1 | 1 | negative regulation of ectodermal cell fate specification |
| GO:0042930 | 0.0066 | Inf | 0.0066 | 1 | 1 | enterobactin transport |
| GO:0051729 | 0.0066 | Inf | 0.0066 | 1 | 1 | germline cell cycle switching, mitotic to meiotic cell cycle |
| GO:0060184 | 0.0066 | Inf | 0.0066 | 1 | 1 | cell cycle switching |
| GO:2000383 | 0.0066 | Inf | 0.0066 | 1 | 1 | regulation of ectoderm development |
| GO:1903020 | 0.0069 | 17.9723 | 0.1258 | 2 | 19 | positive regulation of glycoprotein metabolic process |
| GOMFID | Pvalue | OddsRatio | ExpCount | Count | Size | Term |
| GO:0006891 | 1e-04 | 22.5193 | 0.2054 | 4 | 43 | intra-Golgi vesicle-mediated transport |
| GO:0000042 | 1e-04 | 43.3694 | 0.086 | 3 | 18 | protein targeting to Golgi |
| GO:0007186 | 1e-04 | 3.4334 | 5.5403 | 16 | 1160 | G-protein coupled receptor signaling pathway |
| GO:0007606 | 4e-04 | 4.5474 | 2.2161 | 9 | 464 | sensory perception of chemical stimulus |
| GO:0050911 | 4e-04 | 5.0354 | 1.7672 | 8 | 370 | detection of chemical stimulus involved in sensory perception of smell |
| GO:0019740 | 6e-04 | 71.3333 | 0.0382 | 2 | 8 | nitrogen utilization |
| GO:0070316 | 8e-04 | 61.1389 | 0.043 | 2 | 9 | regulation of G0 to G1 transition |
| GO:0071347 | 9e-04 | 10.1815 | 0.4299 | 4 | 90 | cellular response to interleukin-1 |
| GO:0071356 | 0.0013 | 5.4373 | 1.2036 | 6 | 252 | cellular response to tumor necrosis factor |
| GO:0009593 | 0.0014 | 4.0929 | 2.154 | 8 | 451 | detection of chemical stimulus |
| GO:0050906 | 0.0016 | 3.9728 | 2.2161 | 8 | 464 | detection of stimulus involved in sensory perception |
| GO:0035574 | 0.0023 | 32.9083 | 0.0716 | 2 | 15 | histone H4-K20 demethylation |
| GO:0006995 | 0.0026 | 30.5558 | 0.0764 | 2 | 16 | cellular response to nitrogen starvation |
| GO:0045830 | 0.0026 | 30.5558 | 0.0764 | 2 | 16 | positive regulation of isotype switching |
| GO:0045653 | 0.0033 | 26.7329 | 0.086 | 2 | 18 | negative regulation of megakaryocyte differentiation |
| GO:0015695 | 0.004 | 23.7595 | 0.0955 | 2 | 20 | organic cation transport |
| GO:0043048 | 0.0048 | Inf | 0.0048 | 1 | 1 | dolichyl monophosphate biosynthetic process |
| GO:0043538 | 0.0048 | Inf | 0.0048 | 1 | 1 | regulation of actin phosphorylation |
| GO:1990079 | 0.0048 | Inf | 0.0048 | 1 | 1 | cartilage homeostasis |
| GO:1990402 | 0.0048 | Inf | 0.0048 | 1 | 1 | embryonic liver development |
| GO:0002821 | 0.0049 | 9.3955 | 0.3439 | 3 | 72 | positive regulation of adaptive immune response |
| GO:0072488 | 0.0058 | 19.4346 | 0.1146 | 2 | 24 | ammonium transmembrane transport |
| GO:0070098 | 0.0064 | 8.5263 | 0.3773 | 3 | 79 | chemokine-mediated signaling pathway |
| GO:0002705 | 0.0071 | 8.2009 | 0.3916 | 3 | 82 | positive regulation of leukocyte mediated immunity |
| GO:0002714 | 0.0073 | 17.0992 | 0.129 | 2 | 27 | positive regulation of B cell mediated immunity |
| GO:0030593 | 0.0081 | 7.8037 | 0.4107 | 3 | 86 | neutrophil chemotaxis |
| GO:0031669 | 0.0092 | 5.1844 | 0.8215 | 4 | 172 | cellular response to nutrient levels |
| GO:0002522 | 0.0095 | 211.1757 | 0.0096 | 1 | 2 | leukocyte migration involved in immune response |
| GO:0006601 | 0.0095 | 211.1757 | 0.0096 | 1 | 2 | creatine biosynthetic process |
| GO:0006880 | 0.0095 | 211.1757 | 0.0096 | 1 | 2 | intracellular sequestering of iron ion |
| GO:0014718 | 0.0095 | 211.1757 | 0.0096 | 1 | 2 | positive regulation of satellite cell activation involved in skeletal muscle regeneration |
| GO:0048627 | 0.0095 | 211.1757 | 0.0096 | 1 | 2 | myoblast development |
| GOMFID | Pvalue | OddsRatio | ExpCount | Count | Size | Term |
| GO:0007186 | 0 | 4.2557 | 7.6765 | 26 | 1159 | G-protein coupled receptor signaling pathway |
| GO:0000042 | 0 | 59.9423 | 0.1204 | 5 | 18 | protein targeting to Golgi |
| GO:0050911 | 0 | 5.4929 | 2.474 | 12 | 370 | detection of chemical stimulus involved in sensory perception of smell |
| GO:0006891 | 0 | 20.4737 | 0.2875 | 5 | 43 | intra-Golgi vesicle-mediated transport |
| GO:0009593 | 0 | 4.8908 | 3.0157 | 13 | 451 | detection of chemical stimulus |
| GO:0007606 | 0 | 4.7458 | 3.1026 | 13 | 464 | sensory perception of chemical stimulus |
| GO:0050906 | 0 | 4.7458 | 3.1026 | 13 | 464 | detection of stimulus involved in sensory perception |
| GO:0051024 | 0 | 65.5084 | 0.0669 | 3 | 10 | positive regulation of immunoglobulin secretion |
| GO:0032501 | 1e-04 | 2.0965 | 44.9408 | 64 | 6721 | multicellular organismal process |
| GO:0060968 | 2e-04 | 16.6561 | 0.2742 | 4 | 41 | regulation of gene silencing |
| GO:0002637 | 2e-04 | 15.7999 | 0.2875 | 4 | 43 | regulation of immunoglobulin production |
| GO:0001992 | 3e-04 | 151.4175 | 0.0267 | 2 | 4 | regulation of systemic arterial blood pressure by vasopressin |
| GO:0035992 | 3e-04 | 151.4175 | 0.0267 | 2 | 4 | tendon formation |
| GO:0050877 | 4e-04 | 2.6628 | 8.1176 | 19 | 1214 | neurological system process |
| GO:0048865 | 4e-04 | 100.9385 | 0.0334 | 2 | 5 | stem cell fate commitment |
| GO:0007267 | 7e-04 | 2.6141 | 7.7699 | 18 | 1162 | cell-cell signaling |
| GO:0002702 | 0.001 | 9.924 | 0.4413 | 4 | 66 | positive regulation of production of molecular mediator of immune response |
| GO:0006335 | 0.0013 | 15.7901 | 0.214 | 3 | 32 | DNA replication-dependent nucleosome assembly |
| GO:0043588 | 0.0013 | 4.5708 | 1.6516 | 7 | 247 | skin development |
| GO:0045924 | 0.0015 | 43.2483 | 0.0602 | 2 | 9 | regulation of female receptivity |
| GO:0032776 | 0.0016 | 14.307 | 0.234 | 3 | 35 | DNA methylation on cytosine |
| GO:0051290 | 0.0021 | 13.0782 | 0.2541 | 3 | 38 | protein heterotetramerization |
| GO:0031497 | 0.0024 | 5.7701 | 0.9294 | 5 | 139 | chromatin assembly |
| GO:0023052 | 0.0025 | 1.7668 | 39.4444 | 54 | 5899 | signaling |
| GO:0000183 | 0.0026 | 12.0433 | 0.2742 | 3 | 41 | chromatin silencing at rDNA |
| GO:0034728 | 0.0031 | 5.4423 | 0.9829 | 5 | 147 | nucleosome organization |
| GO:0043568 | 0.0033 | 27.5146 | 0.0869 | 2 | 13 | positive regulation of insulin-like growth factor receptor signaling pathway |
| GO:0048598 | 0.0055 | 2.7695 | 3.8879 | 10 | 587 | embryonic morphogenesis |
| GO:0065004 | 0.0055 | 4.7055 | 1.13 | 5 | 169 | protein-DNA complex assembly |
| GO:0002697 | 0.0059 | 3.1498 | 2.7148 | 8 | 406 | regulation of immune effector process |
| GO:0030888 | 0.0059 | 8.793 | 0.3678 | 3 | 55 | regulation of B cell proliferation |
| GO:0001574 | 0.0063 | 18.9102 | 0.1204 | 2 | 18 | ganglioside biosynthetic process |
| GO:0007625 | 0.0063 | 18.9102 | 0.1204 | 2 | 18 | grooming behavior |
| GO:0071880 | 0.0063 | 18.9102 | 0.1204 | 2 | 18 | adenylate cyclase-activating adrenergic receptor signaling pathway |
| GO:0045995 | 0.0063 | 5.7882 | 0.7355 | 4 | 110 | regulation of embryonic development |
| GO:0002642 | 0.0067 | Inf | 0.0067 | 1 | 1 | positive regulation of immunoglobulin biosynthetic process |
| GO:0006669 | 0.0067 | Inf | 0.0067 | 1 | 1 | sphinganine-1-phosphate biosynthetic process |
| GO:0008052 | 0.0067 | Inf | 0.0067 | 1 | 1 | sensory organ boundary specification |
| GO:0010900 | 0.0067 | Inf | 0.0067 | 1 | 1 | negative regulation of phosphatidylcholine catabolic process |
| GO:0021509 | 0.0067 | Inf | 0.0067 | 1 | 1 | roof plate formation |
| GO:0031989 | 0.0067 | Inf | 0.0067 | 1 | 1 | bombesin receptor signaling pathway |
| GO:0042666 | 0.0067 | Inf | 0.0067 | 1 | 1 | negative regulation of ectodermal cell fate specification |
| GO:0045575 | 0.0067 | Inf | 0.0067 | 1 | 1 | basophil activation |
| GO:0048613 | 0.0067 | Inf | 0.0067 | 1 | 1 | embryonic ectodermal digestive tract morphogenesis |
| GO:0060446 | 0.0067 | Inf | 0.0067 | 1 | 1 | branching involved in open tracheal system development |
| GO:0071881 | 0.0067 | Inf | 0.0067 | 1 | 1 | adenylate cyclase-inhibiting adrenergic receptor signaling pathway |
| GO:0071882 | 0.0067 | Inf | 0.0067 | 1 | 1 | phospholipase C-activating adrenergic receptor signaling pathway |
| GO:2000383 | 0.0067 | Inf | 0.0067 | 1 | 1 | regulation of ectoderm development |
| GO:2001051 | 0.0067 | Inf | 0.0067 | 1 | 1 | positive regulation of tendon cell differentiation |
| GO:0032095 | 0.007 | 17.7967 | 0.127 | 2 | 19 | regulation of response to food |
| GO:0001704 | 0.0081 | 5.3792 | 0.789 | 4 | 118 | formation of primary germ layer |
| GO:0007617 | 0.0094 | 15.1243 | 0.1471 | 2 | 22 | mating behavior |
| GO:0032967 | 0.0094 | 15.1243 | 0.1471 | 2 | 22 | positive regulation of collagen biosynthetic process |
| GO:0007565 | 0.0098 | 4.0765 | 1.2972 | 5 | 194 | female pregnancy |
| GO:0007416 | 0.0099 | 5.0657 | 0.8358 | 4 | 125 | synapse assembly |
| GOMFID | Pvalue | OddsRatio | ExpCount | Count | Size | Term |
| GO:0031123 | 0 | 5.8629 | 1.9074 | 10 | 104 | RNA 3'-end processing |
| GO:0031442 | 2e-04 | 16.6869 | 0.3118 | 4 | 17 | positive regulation of mRNA 3'-end processing |
| GO:0022904 | 4e-04 | 4.4075 | 2.2192 | 9 | 121 | respiratory electron transport chain |
| GO:0000027 | 5e-04 | 12.7572 | 0.3851 | 4 | 21 | ribosomal large subunit assembly |
| GO:0031396 | 0.0012 | 2.856 | 4.8419 | 13 | 264 | regulation of protein ubiquitination |
| GO:1903313 | 0.0015 | 6.625 | 0.8437 | 5 | 46 | positive regulation of mRNA metabolic process |
| GO:0050684 | 0.0019 | 4.2897 | 1.7607 | 7 | 96 | regulation of mRNA processing |
| GO:0032446 | 0.002 | 1.9094 | 15.6077 | 28 | 851 | protein modification by small protein conjugation |
| GO:0019083 | 0.0023 | 3.1146 | 3.4113 | 10 | 186 | viral transcription |
| GO:0043456 | 0.0032 | 35.9254 | 0.0917 | 2 | 5 | regulation of pentose-phosphate shunt |
| GO:0098789 | 0.0032 | 35.9254 | 0.0917 | 2 | 5 | pre-mRNA cleavage required for polyadenylation |
| GO:0042304 | 0.0033 | 7.223 | 0.6236 | 4 | 34 | regulation of fatty acid biosynthetic process |
| GO:0045047 | 0.0034 | 3.8539 | 1.9441 | 7 | 106 | protein targeting to ER |
| GO:0008535 | 0.0034 | 11.5797 | 0.3118 | 3 | 17 | respiratory chain complex IV assembly |
| GO:0019748 | 0.0036 | 5.3225 | 1.0271 | 5 | 56 | secondary metabolic process |
| GO:0071826 | 0.0036 | 2.9135 | 3.6314 | 10 | 198 | ribonucleoprotein complex subunit organization |
| GO:0006091 | 0.0039 | 2.1809 | 8.2165 | 17 | 448 | generation of precursor metabolites and energy |
| GO:0055114 | 0.004 | 1.7557 | 18.7439 | 31 | 1022 | oxidation-reduction process |
| GO:0044265 | 0.0044 | 1.7983 | 16.4881 | 28 | 899 | cellular macromolecule catabolic process |
| GO:0044237 | 0.0045 | 1.414 | 163.8968 | 185 | 9226 | cellular metabolic process |
| GO:0032730 | 0.0048 | 26.9423 | 0.11 | 2 | 6 | positive regulation of interleukin-1 alpha production |
| GO:0044033 | 0.005 | 2.7787 | 3.7965 | 10 | 207 | multi-organism metabolic process |
| GO:0015931 | 0.0058 | 2.8928 | 3.2829 | 9 | 179 | nucleobase-containing compound transport |
| GO:0045333 | 0.0061 | 4.6359 | 1.1638 | 5 | 65 | cellular respiration |
| GO:0010498 | 0.0061 | 2.1857 | 7.2078 | 15 | 393 | proteasomal protein catabolic process |
| GO:0072655 | 0.0067 | 2.8255 | 3.3563 | 9 | 183 | establishment of protein localization to mitochondrion |
| GO:0006368 | 0.0073 | 3.7486 | 1.7057 | 6 | 93 | transcription elongation from RNA polymerase II promoter |
| GO:0030433 | 0.0077 | 4.3751 | 1.2288 | 5 | 67 | ER-associated ubiquitin-dependent protein catabolic process |
| GO:0007005 | 0.0081 | 1.8636 | 11.8384 | 21 | 654 | mitochondrion organization |
| GO:0019827 | 0.0085 | 2.9273 | 2.8794 | 8 | 157 | stem cell population maintenance |
| GO:0033108 | 0.0087 | 4.2378 | 1.2655 | 5 | 69 | mitochondrial respiratory chain complex assembly |
| GO:0042787 | 0.0091 | 2.685 | 3.5214 | 9 | 192 | protein ubiquitination involved in ubiquitin-dependent protein catabolic process |
| GO:1902600 | 0.0093 | 3.5437 | 1.7974 | 6 | 98 | hydrogen ion transmembrane transport |
| GOMFID | Pvalue | OddsRatio | ExpCount | Count | Size | Term |
| GO:0004984 | 0 | 16.268 | 1.6447 | 19 | 370 | olfactory receptor activity |
| GO:0004930 | 0 | 10.2838 | 3.4716 | 24 | 781 | G-protein coupled receptor activity |
| GO:0099600 | 0 | 6.7576 | 5.4051 | 25 | 1216 | transmembrane receptor activity |
| GO:0038023 | 0 | 6.4461 | 5.6407 | 25 | 1269 | signaling receptor activity |
| GO:0060089 | 0 | 5.3296 | 6.6897 | 25 | 1505 | molecular transducer activity |
| GO:0005549 | 5e-04 | 11.967 | 0.3689 | 4 | 83 | odorant binding |
| GO:0033038 | 0.0028 | 28.7904 | 0.08 | 2 | 18 | bitter taste receptor activity |
| GO:0042163 | 0.0044 | Inf | 0.0044 | 1 | 1 | interleukin-12 beta subunit binding |
| GO:0045513 | 0.0044 | Inf | 0.0044 | 1 | 1 | interleukin-27 binding |
| GO:0004866 | 0.0054 | 6.1094 | 0.7023 | 4 | 158 | endopeptidase inhibitor activity |
| GO:0038100 | 0.0089 | 227.2029 | 0.0089 | 1 | 2 | nodal binding |
| GOMFID | Pvalue | OddsRatio | ExpCount | Count | Size | Term |
| GO:0004984 | 1e-04 | 4.1234 | 3.1953 | 12 | 370 | olfactory receptor activity |
| GO:0005125 | 6e-04 | 4.6513 | 1.8567 | 8 | 215 | cytokine activity |
| GO:0005549 | 8e-04 | 7.6013 | 0.7168 | 5 | 83 | odorant binding |
| GO:0035259 | 0.0054 | 21.1682 | 0.1123 | 2 | 13 | glucocorticoid receptor binding |
| GO:0070696 | 0.0063 | 19.403 | 0.1209 | 2 | 14 | transmembrane receptor protein serine/threonine kinase binding |
| GO:0003735 | 0.0069 | 3.7663 | 1.684 | 6 | 195 | structural constituent of ribosome |
| GO:0050811 | 0.0072 | 17.9093 | 0.1295 | 2 | 15 | GABA receptor binding |
| GO:0004124 | 0.0086 | Inf | 0.0086 | 1 | 1 | cysteine synthase activity |
| GO:0004380 | 0.0086 | Inf | 0.0086 | 1 | 1 | glycoprotein-fucosylgalactoside alpha-N-acetylgalactosaminyltransferase activity |
| GO:0004381 | 0.0086 | Inf | 0.0086 | 1 | 1 | fucosylgalactoside 3-alpha-galactosyltransferase activity |
| GO:0004516 | 0.0086 | Inf | 0.0086 | 1 | 1 | nicotinate phosphoribosyltransferase activity |
| GO:0005144 | 0.0086 | Inf | 0.0086 | 1 | 1 | interleukin-13 receptor binding |
| GO:0022894 | 0.0086 | Inf | 0.0086 | 1 | 1 | Intermediate conductance calcium-activated potassium channel activity |
| GO:0031857 | 0.0086 | Inf | 0.0086 | 1 | 1 | type 1 parathyroid hormone receptor binding |
| GO:0050421 | 0.0086 | Inf | 0.0086 | 1 | 1 | nitrite reductase (NO-forming) activity |
| GO:0070025 | 0.0086 | Inf | 0.0086 | 1 | 1 | carbon monoxide binding |
| GO:0097689 | 0.0086 | Inf | 0.0086 | 1 | 1 | iron channel activity |
| GO:1904047 | 0.0086 | Inf | 0.0086 | 1 | 1 | S-adenosyl-L-methionine binding |
| GO:0005160 | 0.0087 | 7.6329 | 0.4232 | 3 | 49 | transforming growth factor beta receptor binding |
| GO:0051428 | 0.0092 | 15.5194 | 0.1468 | 2 | 17 | peptide hormone receptor binding |
| GOMFID | Pvalue | OddsRatio | ExpCount | Count | Size | Term |
| GO:0004984 | 0 | 8.8657 | 2.2085 | 16 | 370 | olfactory receptor activity |
| GO:0004930 | 0 | 5.2893 | 4.6618 | 20 | 781 | G-protein coupled receptor activity |
| GO:0099600 | 0 | 3.7004 | 7.2583 | 22 | 1216 | transmembrane receptor activity |
| GO:0038023 | 0 | 3.5302 | 7.5747 | 22 | 1269 | signaling receptor activity |
| GO:0060089 | 0 | 3.0978 | 8.9834 | 23 | 1505 | molecular transducer activity |
| GO:0005549 | 1e-04 | 11.2187 | 0.4954 | 5 | 83 | odorant binding |
| GO:0001846 | 0.0019 | 37.7899 | 0.0657 | 2 | 11 | opsonin binding |
| GO:0001848 | 0.0056 | 19.9962 | 0.1134 | 2 | 19 | complement binding |
| GO:0004607 | 0.006 | Inf | 0.006 | 1 | 1 | phosphatidylcholine-sterol O-acyltransferase activity |
| GO:0017188 | 0.006 | Inf | 0.006 | 1 | 1 | aspartate N-acetyltransferase activity |
| GO:0033981 | 0.006 | Inf | 0.006 | 1 | 1 | D-dopachrome decarboxylase activity |
| GO:0043532 | 0.006 | Inf | 0.006 | 1 | 1 | angiostatin binding |
| GO:0071796 | 0.006 | Inf | 0.006 | 1 | 1 | K6-linked polyubiquitin binding |
| GO:0042605 | 0.0089 | 15.4466 | 0.1433 | 2 | 24 | peptide antigen binding |
| GOMFID | Pvalue | OddsRatio | ExpCount | Count | Size | Term |
| GO:0004930 | 0 | 3.2457 | 6.2488 | 18 | 781 | G-protein coupled receptor activity |
| GO:0001601 | 4e-04 | 125.9677 | 0.032 | 2 | 4 | peptide YY receptor activity |
| GO:0001602 | 4e-04 | 125.9677 | 0.032 | 2 | 4 | pancreatic polypeptide receptor activity |
| GO:0004984 | 8e-04 | 3.6547 | 2.9604 | 10 | 370 | olfactory receptor activity |
| GO:0099600 | 0.0016 | 2.2758 | 9.7292 | 20 | 1216 | transmembrane receptor activity |
| GO:0005549 | 0.0044 | 6.4507 | 0.6641 | 4 | 83 | odorant binding |
| GO:0038023 | 0.0058 | 2.0416 | 10.1533 | 19 | 1269 | signaling receptor activity |
| GO:0035575 | 0.0062 | 19.366 | 0.12 | 2 | 15 | histone demethylase activity (H4-K20 specific) |
| GO:0008009 | 0.0067 | 8.4428 | 0.384 | 3 | 48 | chemokine activity |
| GO:0004946 | 0.008 | Inf | 0.008 | 1 | 1 | bombesin receptor activity |
| GO:0005307 | 0.008 | Inf | 0.008 | 1 | 1 | choline:sodium symporter activity |
| GO:0044377 | 0.008 | Inf | 0.008 | 1 | 1 | RNA polymerase II core promoter proximal region sequence-specific DNA binding, bending |
| GO:0016894 | 0.0099 | 14.8055 | 0.152 | 2 | 19 | endonuclease activity, active with either ribo- or deoxyribonucleic acids and producing 3'-phosphomonoesters |
| GOMFID | Pvalue | OddsRatio | ExpCount | Count | Size | Term |
| GO:0004984 | 0 | 8.4783 | 1.9971 | 14 | 370 | olfactory receptor activity |
| GO:0004930 | 0 | 4.5158 | 4.2155 | 16 | 781 | G-protein coupled receptor activity |
| GO:0008009 | 1e-04 | 17.5297 | 0.2591 | 4 | 48 | chemokine activity |
| GO:0099600 | 2e-04 | 3.0158 | 6.5634 | 17 | 1216 | transmembrane receptor activity |
| GO:0038023 | 4e-04 | 2.8776 | 6.8494 | 17 | 1269 | signaling receptor activity |
| GO:0001664 | 0.0023 | 4.7994 | 1.3494 | 6 | 250 | G-protein coupled receptor binding |
| GO:0060089 | 0.0025 | 2.3816 | 8.1233 | 17 | 1505 | molecular transducer activity |
| GO:0035575 | 0.0029 | 29.0083 | 0.081 | 2 | 15 | histone demethylase activity (H4-K20 specific) |
| GO:0045236 | 0.0037 | 25.1373 | 0.0918 | 2 | 17 | CXCR chemokine receptor binding |
| GO:0005212 | 0.0051 | 20.9438 | 0.108 | 2 | 20 | structural constituent of eye lens |
| GO:0000210 | 0.0054 | Inf | 0.0054 | 1 | 1 | NAD+ diphosphatase activity |
| GO:0005144 | 0.0054 | Inf | 0.0054 | 1 | 1 | interleukin-13 receptor binding |
| GO:0035755 | 0.0054 | Inf | 0.0054 | 1 | 1 | cardiolipin hydrolase activity |
| GO:0001965 | 0.0057 | 19.8402 | 0.1133 | 2 | 21 | G-protein alpha-subunit binding |
| GOMFID | Pvalue | OddsRatio | ExpCount | Count | Size | Term |
| GO:0008009 | 4e-04 | 8.9662 | 0.6279 | 5 | 48 | chemokine activity |
| GO:0004984 | 0.0012 | 2.8651 | 4.84 | 13 | 370 | olfactory receptor activity |
| GO:0001664 | 0.0017 | 3.253 | 3.2703 | 10 | 250 | G-protein coupled receptor binding |
| GO:0031726 | 0.0025 | 38.0833 | 0.0785 | 2 | 6 | CCR1 chemokine receptor binding |
| GO:0004930 | 0.0069 | 1.9707 | 10.2163 | 19 | 781 | G-protein coupled receptor activity |
| GO:0004843 | 0.0098 | 5.1096 | 0.8372 | 4 | 64 | thiol-dependent ubiquitin-specific protease activity |
| GOMFID | Pvalue | OddsRatio | ExpCount | Count | Size | Term |
| GO:0004984 | 0 | 4.8293 | 2.7724 | 12 | 370 | olfactory receptor activity |
| GO:0004859 | 0.0029 | 29.9253 | 0.0824 | 2 | 11 | phospholipase inhibitor activity |
| GO:0005549 | 0.0035 | 6.907 | 0.6219 | 4 | 83 | odorant binding |
| GO:0004930 | 0.0057 | 2.3959 | 5.852 | 13 | 781 | G-protein coupled receptor activity |
| GO:0004081 | 0.0075 | Inf | 0.0075 | 1 | 1 | bis(5'-nucleosyl)-tetraphosphatase (asymmetrical) activity |
| GO:0005144 | 0.0075 | Inf | 0.0075 | 1 | 1 | interleukin-13 receptor binding |
| GO:0008803 | 0.0075 | Inf | 0.0075 | 1 | 1 | bis(5'-nucleosyl)-tetraphosphatase (symmetrical) activity |
| GO:0018738 | 0.0075 | Inf | 0.0075 | 1 | 1 | S-formylglutathione hydrolase activity |
| GO:0033981 | 0.0075 | Inf | 0.0075 | 1 | 1 | D-dopachrome decarboxylase activity |
| GO:0042922 | 0.0075 | Inf | 0.0075 | 1 | 1 | neuromedin U receptor binding |
| GOMFID | Pvalue | OddsRatio | ExpCount | Count | Size | Term |
| GO:0004984 | 0 | 7.0276 | 1.9971 | 12 | 370 | olfactory receptor activity |
| GO:0004930 | 0 | 4.5158 | 4.2155 | 16 | 781 | G-protein coupled receptor activity |
| GO:0008009 | 1e-04 | 17.5297 | 0.2591 | 4 | 48 | chemokine activity |
| GO:0008821 | 4e-04 | 94.3313 | 0.0324 | 2 | 6 | crossover junction endodeoxyribonuclease activity |
| GO:0017108 | 4e-04 | 94.3313 | 0.0324 | 2 | 6 | 5'-flap endonuclease activity |
| GO:0099600 | 7e-04 | 2.7948 | 6.5634 | 16 | 1216 | transmembrane receptor activity |
| GO:0005549 | 0.0011 | 9.7415 | 0.448 | 4 | 83 | odorant binding |
| GO:0038023 | 0.0011 | 2.6668 | 6.8494 | 16 | 1269 | signaling receptor activity |
| GO:0005126 | 0.0032 | 4.4994 | 1.4357 | 6 | 266 | cytokine receptor binding |
| GO:0045236 | 0.0037 | 25.1373 | 0.0918 | 2 | 17 | CXCR chemokine receptor binding |
| GO:0016894 | 0.0046 | 22.1772 | 0.1026 | 2 | 19 | endonuclease activity, active with either ribo- or deoxyribonucleic acids and producing 3'-phosphomonoesters |
| GO:0003948 | 0.0054 | Inf | 0.0054 | 1 | 1 | N4-(beta-N-acetylglucosaminyl)-L-asparaginase activity |
| GO:0060089 | 0.0062 | 2.2073 | 8.1233 | 16 | 1505 | molecular transducer activity |
| GOMFID | Pvalue | OddsRatio | ExpCount | Count | Size | Term |
| GO:0004984 | 0 | 5.1971 | 2.8194 | 13 | 370 | olfactory receptor activity |
| GO:0004930 | 0 | 3.4381 | 5.9512 | 18 | 781 | G-protein coupled receptor activity |
| GO:0005549 | 0 | 10.6295 | 0.6325 | 6 | 83 | odorant binding |
| GO:0099600 | 8e-04 | 2.4134 | 9.2659 | 20 | 1216 | transmembrane receptor activity |
| GO:0038023 | 0.0033 | 2.1638 | 9.6698 | 19 | 1269 | signaling receptor activity |
| GO:0060089 | 0.0046 | 2.0217 | 11.4681 | 21 | 1505 | molecular transducer activity |
| GO:0018738 | 0.0076 | Inf | 0.0076 | 1 | 1 | S-formylglutathione hydrolase activity |
| GO:0033735 | 0.0076 | Inf | 0.0076 | 1 | 1 | aspartate dehydrogenase activity |
| GO:0047273 | 0.0076 | Inf | 0.0076 | 1 | 1 | galactosylgalactosylglucosylceramide beta-D-acetylgalactosaminyltransferase activity |
| GO:0047280 | 0.0076 | Inf | 0.0076 | 1 | 1 | nicotinamide phosphoribosyltransferase activity |
| GO:0033038 | 0.0081 | 16.5381 | 0.1372 | 2 | 18 | bitter taste receptor activity |
| GOMFID | Pvalue | OddsRatio | ExpCount | Count | Size | Term |
| GO:0004984 | 0 | 11.525 | 2.7254 | 24 | 370 | olfactory receptor activity |
| GO:0004930 | 0 | 6.9122 | 5.7529 | 30 | 781 | G-protein coupled receptor activity |
| GO:0099600 | 0 | 4.6486 | 8.9571 | 32 | 1216 | transmembrane receptor activity |
| GO:0038023 | 0 | 4.4332 | 9.3475 | 32 | 1269 | signaling receptor activity |
| GO:0060089 | 0 | 3.6618 | 11.0859 | 32 | 1505 | molecular transducer activity |
| GO:0005549 | 0 | 11.0189 | 0.6114 | 6 | 83 | odorant binding |
| GO:0016409 | 0.0018 | 13.8071 | 0.2431 | 3 | 33 | palmitoyltransferase activity |
| GO:0000210 | 0.0074 | Inf | 0.0074 | 1 | 1 | NAD+ diphosphatase activity |
| GO:0003974 | 0.0074 | Inf | 0.0074 | 1 | 1 | UDP-N-acetylglucosamine 4-epimerase activity |
| GO:0003978 | 0.0074 | Inf | 0.0074 | 1 | 1 | UDP-glucose 4-epimerase activity |
| GO:0047224 | 0.0074 | Inf | 0.0074 | 1 | 1 | acetylgalactosaminyl-O-glycosyl-glycoprotein beta-1,3-N-acetylglucosaminyltransferase activity |
| GO:0047860 | 0.0074 | Inf | 0.0074 | 1 | 1 | diiodophenylpyruvate reductase activity |
| GO:0072541 | 0.0074 | Inf | 0.0074 | 1 | 1 | peroxynitrite reductase activity |
| GO:1990259 | 0.0074 | Inf | 0.0074 | 1 | 1 | histone-glutamine methyltransferase activity |
| GOMFID | Pvalue | OddsRatio | ExpCount | Count | Size | Term |
| GO:0004984 | 0 | 8.6456 | 3.2893 | 23 | 370 | olfactory receptor activity |
| GO:0004930 | 0 | 4.4868 | 6.9431 | 26 | 781 | G-protein coupled receptor activity |
| GO:0099600 | 0 | 3.7606 | 10.8103 | 33 | 1216 | transmembrane receptor activity |
| GO:0038023 | 0 | 3.5862 | 11.2814 | 33 | 1269 | signaling receptor activity |
| GO:0060089 | 0 | 2.9618 | 13.3795 | 33 | 1505 | molecular transducer activity |
| GO:0005549 | 0 | 10.7562 | 0.7379 | 7 | 83 | odorant binding |
| GO:0032395 | 1e-04 | 48.804 | 0.0889 | 3 | 10 | MHC class II receptor activity |
| GO:0003954 | 0.0043 | 10.0305 | 0.3289 | 3 | 37 | NADH dehydrogenase activity |
| GO:0008137 | 0.0043 | 10.0305 | 0.3289 | 3 | 37 | NADH dehydrogenase (ubiquinone) activity |
| GO:0005130 | 0.0089 | Inf | 0.0089 | 1 | 1 | granulocyte colony-stimulating factor receptor binding |
| GO:0005140 | 0.0089 | Inf | 0.0089 | 1 | 1 | interleukin-9 receptor binding |
| GO:0005459 | 0.0089 | Inf | 0.0089 | 1 | 1 | UDP-galactose transmembrane transporter activity |
| GO:0008531 | 0.0089 | Inf | 0.0089 | 1 | 1 | riboflavin kinase activity |
| GO:0008613 | 0.0089 | Inf | 0.0089 | 1 | 1 | diuretic hormone activity |
| GO:0033735 | 0.0089 | Inf | 0.0089 | 1 | 1 | aspartate dehydrogenase activity |
| GO:0038164 | 0.0089 | Inf | 0.0089 | 1 | 1 | thrombopoietin receptor activity |
| GO:0045130 | 0.0089 | Inf | 0.0089 | 1 | 1 | keratan sulfotransferase activity |
| GO:1990259 | 0.0089 | Inf | 0.0089 | 1 | 1 | histone-glutamine methyltransferase activity |
| GO:0008301 | 0.0098 | 15.0657 | 0.1511 | 2 | 17 | DNA binding, bending |
| GOMFID | Pvalue | OddsRatio | ExpCount | Count | Size | Term |
| GO:0004984 | 0 | 14.7457 | 2.2555 | 24 | 370 | olfactory receptor activity |
| GO:0004930 | 0 | 7.1684 | 4.6448 | 25 | 778 | G-protein coupled receptor activity |
| GO:0099600 | 0 | 4.7598 | 7.4128 | 27 | 1216 | transmembrane receptor activity |
| GO:0038023 | 0 | 4.54 | 7.7358 | 27 | 1269 | signaling receptor activity |
| GO:0060089 | 0 | 3.7526 | 9.1745 | 27 | 1505 | molecular transducer activity |
| GO:0005549 | 0 | 16.1195 | 0.506 | 7 | 83 | odorant binding |
| GO:0016503 | 1e-04 | 333 | 0.0183 | 2 | 3 | pheromone receptor activity |
| GO:0033735 | 0.0061 | Inf | 0.0061 | 1 | 1 | aspartate dehydrogenase activity |
| GO:1990259 | 0.0061 | Inf | 0.0061 | 1 | 1 | histone-glutamine methyltransferase activity |
| GOMFID | Pvalue | OddsRatio | ExpCount | Count | Size | Term |
| GO:0004984 | 0 | 22.6343 | 0.5404 | 8 | 370 | olfactory receptor activity |
| GO:0004930 | 0 | 10.3162 | 1.1407 | 8 | 781 | G-protein coupled receptor activity |
| GO:0099600 | 2e-04 | 6.4093 | 1.776 | 8 | 1216 | transmembrane receptor activity |
| GO:0038023 | 3e-04 | 6.1175 | 1.8534 | 8 | 1269 | signaling receptor activity |
| GO:0060089 | 9e-04 | 5.069 | 2.1981 | 8 | 1505 | molecular transducer activity |
| GO:0038100 | 0.0029 | 714.7273 | 0.0029 | 1 | 2 | nodal binding |
| GO:0008508 | 0.0073 | 178.6477 | 0.0073 | 1 | 5 | bile acid:sodium symporter activity |
| GOMFID | Pvalue | OddsRatio | ExpCount | Count | Size | Term |
| GO:0005509 | 0 | 4.3853 | 7.7717 | 29 | 658 | calcium ion binding |
| GO:0004930 | 0 | 3.3959 | 9.0808 | 27 | 777 | G-protein coupled receptor activity |
| GO:0004984 | 0 | 4.334 | 4.3701 | 17 | 370 | olfactory receptor activity |
| GO:0099600 | 0 | 2.5233 | 14.3622 | 32 | 1216 | transmembrane receptor activity |
| GO:0038023 | 0 | 2.4063 | 14.9882 | 32 | 1269 | signaling receptor activity |
| GO:0060089 | 4e-04 | 2.0646 | 17.7756 | 33 | 1505 | molecular transducer activity |
| GO:0016520 | 8e-04 | 84.5652 | 0.0472 | 2 | 4 | growth hormone-releasing hormone receptor activity |
| GO:0051380 | 8e-04 | 84.5652 | 0.0472 | 2 | 4 | norepinephrine binding |
| GO:0005109 | 8e-04 | 10.6662 | 0.4252 | 4 | 36 | frizzled binding |
| GO:0051379 | 0.002 | 42.2772 | 0.0709 | 2 | 6 | epinephrine binding |
| GO:0005179 | 0.0027 | 4.6399 | 1.3819 | 6 | 117 | hormone activity |
| GO:0004935 | 0.0047 | 24.1537 | 0.1063 | 2 | 9 | adrenergic receptor activity |
| GOMFID | Pvalue | OddsRatio | ExpCount | Count | Size | Term |
| GO:0004984 | 0 | 9.1629 | 1.0573 | 8 | 370 | olfactory receptor activity |
| GO:0004930 | 3e-04 | 4.8352 | 2.2317 | 9 | 781 | G-protein coupled receptor activity |
| GO:0099600 | 5e-04 | 3.8926 | 3.4747 | 11 | 1216 | transmembrane receptor activity |
| GO:0038023 | 7e-04 | 3.7149 | 3.6262 | 11 | 1269 | signaling receptor activity |
| GO:0060089 | 0.0028 | 3.077 | 4.3005 | 11 | 1505 | molecular transducer activity |
| GO:0033981 | 0.0029 | Inf | 0.0029 | 1 | 1 | D-dopachrome decarboxylase activity |
| GO:0038100 | 0.0057 | 356.8636 | 0.0057 | 1 | 2 | nodal binding |
| GO:0004167 | 0.0085 | 178.4205 | 0.0086 | 1 | 3 | dopachrome isomerase activity |
| GOMFID | Pvalue | OddsRatio | ExpCount | Count | Size | Term |
| GO:0004930 | 0 | 3.3347 | 7.1415 | 21 | 781 | G-protein coupled receptor activity |
| GO:0038023 | 0 | 2.6685 | 11.6038 | 27 | 1269 | signaling receptor activity |
| GO:0004984 | 0 | 4.2383 | 3.3833 | 13 | 370 | olfactory receptor activity |
| GO:0099600 | 0 | 2.6689 | 11.1191 | 26 | 1216 | transmembrane receptor activity |
| GO:0060089 | 1e-04 | 2.4138 | 13.7617 | 29 | 1505 | molecular transducer activity |
| GO:0008198 | 9e-04 | 18.4232 | 0.192 | 3 | 21 | ferrous iron binding |
| GO:0005549 | 0.001 | 7.1601 | 0.759 | 5 | 83 | odorant binding |
| GO:0019957 | 0.0012 | 55.3191 | 0.0545 | 2 | 6 | C-C chemokine binding |
| GO:0004950 | 0.0013 | 15.7882 | 0.2195 | 3 | 24 | chemokine receptor activity |
| GO:0048306 | 0.0023 | 7.793 | 0.5578 | 4 | 61 | calcium-dependent protein binding |
| GO:0032395 | 0.0036 | 27.4577 | 0.0914 | 2 | 10 | MHC class II receptor activity |
| GO:0048020 | 0.004 | 10.3537 | 0.32 | 3 | 35 | CCR chemokine receptor binding |
| GO:0005125 | 0.004 | 4.2507 | 1.4998 | 6 | 167 | cytokine activity |
| GO:0004859 | 0.0043 | 24.4053 | 0.1006 | 2 | 11 | phospholipase inhibitor activity |
| GO:0003823 | 0.0054 | 6.0787 | 0.7041 | 4 | 77 | antigen binding |
| GO:0044548 | 0.0061 | 19.9654 | 0.1189 | 2 | 13 | S100 protein binding |
| GO:0019955 | 0.0074 | 5.5443 | 0.7681 | 4 | 84 | cytokine binding |
| GO:0005149 | 0.0081 | 16.8917 | 0.1372 | 2 | 15 | interleukin-1 receptor binding |
| GO:0004398 | 0.0091 | Inf | 0.0091 | 1 | 1 | histidine decarboxylase activity |
| GO:0004853 | 0.0091 | Inf | 0.0091 | 1 | 1 | uroporphyrinogen decarboxylase activity |
| GO:0005140 | 0.0091 | Inf | 0.0091 | 1 | 1 | interleukin-9 receptor binding |
| GO:0008493 | 0.0091 | Inf | 0.0091 | 1 | 1 | tetracycline transporter activity |
| GO:0016497 | 0.0091 | Inf | 0.0091 | 1 | 1 | substance K receptor activity |
| GO:0022894 | 0.0091 | Inf | 0.0091 | 1 | 1 | Intermediate conductance calcium-activated potassium channel activity |
| GO:0033676 | 0.0091 | Inf | 0.0091 | 1 | 1 | double-stranded DNA-dependent ATPase activity |
| GO:0035438 | 0.0091 | Inf | 0.0091 | 1 | 1 | cyclic-di-GMP binding |
| GO:0035757 | 0.0091 | Inf | 0.0091 | 1 | 1 | chemokine (C-C motif) ligand 19 binding |
| GO:0035758 | 0.0091 | Inf | 0.0091 | 1 | 1 | chemokine (C-C motif) ligand 21 binding |
| GO:0038117 | 0.0091 | Inf | 0.0091 | 1 | 1 | C-C motif chemokine 19 receptor activity |
| GO:0038121 | 0.0091 | Inf | 0.0091 | 1 | 1 | C-C motif chemokine 21 receptor activity |
| GO:0061507 | 0.0091 | Inf | 0.0091 | 1 | 1 | cyclic-GMP-AMP binding |
| GO:0097689 | 0.0091 | Inf | 0.0091 | 1 | 1 | iron channel activity |
| GO:0008009 | 0.0096 | 7.3565 | 0.4389 | 3 | 48 | chemokine activity |
| GO:0016830 | 0.0096 | 7.3565 | 0.4389 | 3 | 48 | carbon-carbon lyase activity |
| GOMFID | Pvalue | OddsRatio | ExpCount | Count | Size | Term |
| GO:0004984 | 0 | 8.2882 | 2.185 | 15 | 370 | olfactory receptor activity |
| GO:0004930 | 0 | 4.6842 | 4.6122 | 18 | 781 | G-protein coupled receptor activity |
| GO:0005549 | 1e-04 | 11.3469 | 0.4902 | 5 | 83 | odorant binding |
| GO:0099600 | 2e-04 | 2.8962 | 7.1811 | 18 | 1216 | transmembrane receptor activity |
| GO:0038023 | 4e-04 | 2.7634 | 7.4941 | 18 | 1269 | signaling receptor activity |
| GO:0060089 | 0.0011 | 2.4482 | 8.8878 | 19 | 1505 | molecular transducer activity |
| GO:0005112 | 0.0055 | 20.2172 | 0.1122 | 2 | 19 | Notch binding |
| GO:0050683 | 0.0059 | Inf | 0.0059 | 1 | 1 | AF-1 domain binding |
| GOMFID | Pvalue | OddsRatio | ExpCount | Count | Size | Term |
| GO:0004984 | 0 | 20.585 | 0.8693 | 12 | 370 | olfactory receptor activity |
| GO:0004556 | 0 | 693.0441 | 0.0117 | 3 | 5 | alpha-amylase activity |
| GO:0004930 | 0 | 9.3266 | 1.835 | 12 | 781 | G-protein coupled receptor activity |
| GO:0099600 | 0 | 5.7835 | 2.857 | 12 | 1216 | transmembrane receptor activity |
| GO:0038023 | 0 | 5.5194 | 2.9815 | 12 | 1269 | signaling receptor activity |
| GO:0005549 | 0 | 23.9847 | 0.195 | 4 | 83 | odorant binding |
| GO:0048020 | 1e-04 | 43.2325 | 0.0822 | 3 | 35 | CCR chemokine receptor binding |
| GO:0060089 | 1e-04 | 4.5711 | 3.536 | 12 | 1505 | molecular transducer activity |
| GO:0008009 | 2e-04 | 30.7176 | 0.1128 | 3 | 48 | chemokine activity |
| GO:0035575 | 6e-04 | 69.0022 | 0.0352 | 2 | 15 | histone demethylase activity (H4-K20 specific) |
| GO:0004553 | 0.0012 | 15.8458 | 0.2115 | 3 | 90 | hydrolase activity, hydrolyzing O-glycosyl compounds |
| GO:0032451 | 0.0034 | 25.5935 | 0.0869 | 2 | 37 | demethylase activity |
| GOMFID | Pvalue | OddsRatio | ExpCount | Count | Size | Term |
| GO:0008821 | 0 | 75.4175 | 0.0796 | 3 | 6 | crossover junction endodeoxyribonuclease activity |
| GO:0016893 | 0.0014 | 9.1684 | 0.491 | 4 | 37 | endonuclease activity, active with either ribo- or deoxyribonucleic acids and producing 5'-phosphomonoesters |
| GO:0016894 | 0.0019 | 14.1289 | 0.2522 | 3 | 19 | endonuclease activity, active with either ribo- or deoxyribonucleic acids and producing 3'-phosphomonoesters |
| GO:0004062 | 0.0025 | 37.5242 | 0.0796 | 2 | 6 | aryl sulfotransferase activity |
| GO:0017108 | 0.0025 | 37.5242 | 0.0796 | 2 | 6 | 5'-flap endonuclease activity |
| GO:0042287 | 0.0053 | 9.4144 | 0.3583 | 3 | 27 | MHC protein binding |
| GO:0004596 | 0.0059 | 21.4382 | 0.1194 | 2 | 9 | peptide alpha-N-acetyltransferase activity |
| GOMFID | Pvalue | OddsRatio | ExpCount | Count | Size | Term |
| GO:0004984 | 4e-04 | 3.7389 | 3.1953 | 11 | 370 | olfactory receptor activity |
| GO:0099600 | 0.0017 | 2.2031 | 10.5014 | 21 | 1216 | transmembrane receptor activity |
| GO:0005125 | 0.0026 | 4.0186 | 1.8567 | 7 | 215 | cytokine activity |
| GO:0038023 | 0.0029 | 2.1018 | 10.9591 | 21 | 1269 | signaling receptor activity |
| GO:0004930 | 0.0031 | 2.4026 | 6.7447 | 15 | 781 | G-protein coupled receptor activity |
| GO:0035575 | 0.0072 | 17.9093 | 0.1295 | 2 | 15 | histone demethylase activity (H4-K20 specific) |
| GO:0004584 | 0.0086 | Inf | 0.0086 | 1 | 1 | dolichyl-phosphate-mannose-glycolipid alpha-mannosyltransferase activity |
| GO:0004603 | 0.0086 | Inf | 0.0086 | 1 | 1 | phenylethanolamine N-methyltransferase activity |
| GO:0005018 | 0.0086 | Inf | 0.0086 | 1 | 1 | platelet-derived growth factor alpha-receptor activity |
| GO:0008962 | 0.0086 | Inf | 0.0086 | 1 | 1 | phosphatidylglycerophosphatase activity |
| GO:0015112 | 0.0086 | Inf | 0.0086 | 1 | 1 | nitrate transmembrane transporter activity |
| GO:0016497 | 0.0086 | Inf | 0.0086 | 1 | 1 | substance K receptor activity |
| GO:0033682 | 0.0086 | Inf | 0.0086 | 1 | 1 | ATP-dependent 5'-3' DNA/RNA helicase activity |
| GO:0035755 | 0.0086 | Inf | 0.0086 | 1 | 1 | cardiolipin hydrolase activity |
| GO:0042163 | 0.0086 | Inf | 0.0086 | 1 | 1 | interleukin-12 beta subunit binding |
| GO:0045513 | 0.0086 | Inf | 0.0086 | 1 | 1 | interleukin-27 binding |
| GO:0072572 | 0.0086 | Inf | 0.0086 | 1 | 1 | poly-ADP-D-ribose binding |
| GO:0005132 | 0.0092 | 15.5194 | 0.1468 | 2 | 17 | type I interferon receptor binding |
| GO:0045236 | 0.0092 | 15.5194 | 0.1468 | 2 | 17 | CXCR chemokine receptor binding |
| GOMFID | Pvalue | OddsRatio | ExpCount | Count | Size | Term |
| GO:0015266 | 8e-04 | 20.9296 | 0.1956 | 3 | 11 | protein channel activity |
| GO:0004521 | 0.0016 | 6.5222 | 0.8534 | 5 | 48 | endoribonuclease activity |
| GO:0004518 | 0.0018 | 3.2366 | 3.2893 | 10 | 185 | nuclease activity |
| GO:0004082 | 0.0018 | 55.6331 | 0.0711 | 2 | 4 | bisphosphoglycerate mutase activity |
| GO:0046538 | 0.0018 | 55.6331 | 0.0711 | 2 | 4 | 2,3-bisphosphoglycerate-dependent phosphoglycerate mutase activity |
| GO:0003735 | 0.0026 | 3.0597 | 3.4671 | 10 | 195 | structural constituent of ribosome |
| GO:0004083 | 0.003 | 37.0863 | 0.0889 | 2 | 5 | bisphosphoglycerate 2-phosphatase activity |
| GO:0016893 | 0.0041 | 6.7787 | 0.6579 | 4 | 37 | endonuclease activity, active with either ribo- or deoxyribonucleic acids and producing 5'-phosphomonoesters |
| GO:0030620 | 0.0045 | 27.8129 | 0.1067 | 2 | 6 | U2 snRNA binding |
| GO:0022884 | 0.0058 | 9.296 | 0.3734 | 3 | 21 | macromolecule transmembrane transporter activity |
| GO:0003756 | 0.0067 | 8.8062 | 0.3912 | 3 | 22 | protein disulfide isomerase activity |
| GO:0008199 | 0.0082 | 18.5396 | 0.1422 | 2 | 8 | ferric iron binding |
| GO:0015450 | 0.0082 | 18.5396 | 0.1422 | 2 | 8 | P-P-bond-hydrolysis-driven protein transmembrane transporter activity |
| GO:0016175 | 0.0082 | 18.5396 | 0.1422 | 2 | 8 | superoxide-generating NADPH oxidase activity |
| GO:0044822 | 0.0099 | 1.6374 | 19.9848 | 31 | 1124 | poly(A) RNA binding |
| GOMFID | Pvalue | OddsRatio | ExpCount | Count | Size | Term |
| GO:0004659 | 4e-04 | 25.4224 | 0.1511 | 3 | 14 | prenyltransferase activity |
| GO:0051117 | 0.0012 | 6.8112 | 0.7988 | 5 | 74 | ATPase binding |
| GO:0004062 | 0.0017 | 46.3512 | 0.0648 | 2 | 6 | aryl sulfotransferase activity |
| GO:0042287 | 0.003 | 11.6422 | 0.2915 | 3 | 27 | MHC protein binding |
| GO:0004596 | 0.004 | 26.4813 | 0.0972 | 2 | 9 | peptide alpha-N-acetyltransferase activity |
| GO:0010485 | 0.0097 | 15.4425 | 0.1511 | 2 | 14 | H4 histone acetyltransferase activity |
| GOMFID | Pvalue | OddsRatio | ExpCount | Count | Size | Term |
| GO:0004930 | 0 | 5.6658 | 6.0008 | 27 | 781 | G-protein coupled receptor activity |
| GO:0004984 | 0 | 7.5836 | 2.8429 | 18 | 370 | olfactory receptor activity |
| GO:0038023 | 0 | 3.6573 | 9.7504 | 29 | 1269 | signaling receptor activity |
| GO:0099600 | 0 | 3.6593 | 9.3432 | 28 | 1216 | transmembrane receptor activity |
| GO:0060089 | 0 | 3.0221 | 11.5637 | 29 | 1505 | molecular transducer activity |
| GO:0001601 | 3e-04 | 131.3025 | 0.0307 | 2 | 4 | peptide YY receptor activity |
| GO:0005549 | 4e-04 | 8.5925 | 0.6377 | 5 | 83 | odorant binding |
| GO:0004865 | 0.0016 | 43.7563 | 0.0615 | 2 | 8 | protein serine/threonine phosphatase inhibitor activity |
| GO:0019212 | 0.0026 | 12.0139 | 0.2766 | 3 | 36 | phosphatase inhibitor activity |
| GO:0001664 | 0.0032 | 3.8874 | 1.9209 | 7 | 250 | G-protein coupled receptor binding |
| GO:1901338 | 0.0058 | 20.1862 | 0.1153 | 2 | 15 | catecholamine binding |
| GO:0045236 | 0.0074 | 17.4924 | 0.1306 | 2 | 17 | CXCR chemokine receptor binding |
| GO:0051428 | 0.0074 | 17.4924 | 0.1306 | 2 | 17 | peptide hormone receptor binding |
| GO:0001872 | 0.0077 | Inf | 0.0077 | 1 | 1 | (1->3)-beta-D-glucan binding |
| GO:0004124 | 0.0077 | Inf | 0.0077 | 1 | 1 | cysteine synthase activity |
| GO:0031751 | 0.0077 | Inf | 0.0077 | 1 | 1 | D4 dopamine receptor binding |
| GO:0031857 | 0.0077 | Inf | 0.0077 | 1 | 1 | type 1 parathyroid hormone receptor binding |
| GO:0050421 | 0.0077 | Inf | 0.0077 | 1 | 1 | nitrite reductase (NO-forming) activity |
| GO:0050683 | 0.0077 | Inf | 0.0077 | 1 | 1 | AF-1 domain binding |
| GO:0070025 | 0.0077 | Inf | 0.0077 | 1 | 1 | carbon monoxide binding |
| GO:0070180 | 0.0077 | Inf | 0.0077 | 1 | 1 | large ribosomal subunit rRNA binding |
| GO:1904047 | 0.0077 | Inf | 0.0077 | 1 | 1 | S-adenosyl-L-methionine binding |
| GOMFID | Pvalue | OddsRatio | ExpCount | Count | Size | Term |
| GO:0004984 | 0 | 5.1732 | 2.608 | 12 | 370 | olfactory receptor activity |
| GO:0030492 | 5e-04 | 95.6208 | 0.0352 | 2 | 5 | hemoglobin binding |
| GO:0001872 | 0.007 | Inf | 0.007 | 1 | 1 | (1->3)-beta-D-glucan binding |
| GO:0018455 | 0.007 | Inf | 0.007 | 1 | 1 | alcohol dehydrogenase [NAD(P)+] activity |
| GO:0032542 | 0.007 | Inf | 0.007 | 1 | 1 | sulfiredoxin activity |
| GO:0047734 | 0.007 | Inf | 0.007 | 1 | 1 | CDP-glycerol diphosphatase activity |
| GO:0004930 | 0.0089 | 2.3435 | 5.5049 | 12 | 781 | G-protein coupled receptor activity |
| GOMFID | Pvalue | OddsRatio | ExpCount | Count | Size | Term |
| GO:0008147 | 0 | Inf | 0.0103 | 2 | 2 | structural constituent of bone |
| GO:0042605 | 2e-04 | 28.6557 | 0.1234 | 3 | 24 | peptide antigen binding |
| GO:0005126 | 4e-04 | 5.6275 | 1.3682 | 7 | 266 | cytokine receptor binding |
| GO:0004984 | 6e-04 | 4.6333 | 1.9031 | 8 | 370 | olfactory receptor activity |
| GO:0030881 | 9e-04 | 56.6365 | 0.0463 | 2 | 9 | beta-2-microglobulin binding |
| GO:0008009 | 0.0019 | 13.3521 | 0.2469 | 3 | 48 | chemokine activity |
| GO:0003727 | 0.0035 | 10.7218 | 0.3035 | 3 | 59 | single-stranded RNA binding |
| GO:0030731 | 0.0051 | Inf | 0.0051 | 1 | 1 | guanidinoacetate N-methyltransferase activity |
| GO:0033676 | 0.0051 | Inf | 0.0051 | 1 | 1 | double-stranded DNA-dependent ATPase activity |
| GO:0035755 | 0.0051 | Inf | 0.0051 | 1 | 1 | cardiolipin hydrolase activity |
| GO:0005164 | 0.0091 | 15.2298 | 0.144 | 2 | 28 | tumor necrosis factor receptor binding |
| GO:0001664 | 0.0093 | 4.1412 | 1.2859 | 5 | 250 | G-protein coupled receptor binding |
| GO:0003697 | 0.0096 | 7.31 | 0.4372 | 3 | 85 | single-stranded DNA binding |
| GO:0005125 | 0.0096 | 5.1265 | 0.8297 | 4 | 167 | cytokine activity |
| GOMFID | Pvalue | OddsRatio | ExpCount | Count | Size | Term |
| GO:0045545 | 0.002 | 45.9793 | 0.0721 | 2 | 5 | syndecan binding |
| GO:0003735 | 0.0021 | 3.4037 | 2.8108 | 9 | 195 | structural constituent of ribosome |
| GO:0022829 | 0.0037 | 10.9272 | 0.3171 | 3 | 22 | wide pore channel activity |
| GO:0003677 | 0.0061 | 1.5533 | 33.6291 | 48 | 2333 | DNA binding |
| GO:0046703 | 0.007 | 19.7003 | 0.1297 | 2 | 9 | natural killer cell lectin-like receptor binding |
| GO:0000977 | 0.0072 | 2.0917 | 8.0577 | 16 | 559 | RNA polymerase II regulatory region sequence-specific DNA binding |
| GO:0001055 | 0.0086 | 17.2367 | 0.1441 | 2 | 10 | RNA polymerase II activity |
| GO:0016407 | 0.0097 | 4.0901 | 1.2973 | 5 | 90 | acetyltransferase activity |
| GOMFID | Pvalue | OddsRatio | ExpCount | Count | Size | Term |
| GO:0004984 | 0 | 13.4947 | 1.4802 | 15 | 370 | olfactory receptor activity |
| GO:0004930 | 0 | 6.6394 | 3.1244 | 16 | 781 | G-protein coupled receptor activity |
| GO:0099600 | 0 | 4.8371 | 4.8646 | 18 | 1216 | transmembrane receptor activity |
| GO:0038023 | 0 | 4.6152 | 5.0766 | 18 | 1269 | signaling receptor activity |
| GO:0060089 | 0 | 3.8192 | 6.0208 | 18 | 1505 | molecular transducer activity |
| GO:0005125 | 2e-04 | 7.7945 | 0.8601 | 6 | 215 | cytokine activity |
| GO:0015144 | 4e-04 | 24.4578 | 0.14 | 3 | 35 | carbohydrate transmembrane transporter activity |
| GO:0005126 | 7e-04 | 6.2449 | 1.0641 | 6 | 266 | cytokine receptor binding |
| GO:0015250 | 8e-04 | 57.1075 | 0.044 | 2 | 11 | water channel activity |
| GO:0015254 | 8e-04 | 57.1075 | 0.044 | 2 | 11 | glycerol channel activity |
| GO:0015166 | 0.001 | 51.3934 | 0.048 | 2 | 12 | polyol transmembrane transporter activity |
| GO:1901618 | 0.0011 | 16.2885 | 0.204 | 3 | 51 | organic hydroxy compound transmembrane transporter activity |
| GO:0060589 | 0.0012 | 5.5685 | 1.1882 | 6 | 297 | nucleoside-triphosphatase regulator activity |
| GO:0045236 | 0.0021 | 34.2514 | 0.068 | 2 | 17 | CXCR chemokine receptor binding |
| GO:0005096 | 0.003 | 5.5244 | 0.9841 | 5 | 246 | GTPase activator activity |
| GO:0008083 | 0.0032 | 7.1173 | 0.6081 | 4 | 152 | growth factor activity |
| GO:0004124 | 0.004 | Inf | 0.004 | 1 | 1 | cysteine synthase activity |
| GO:0031851 | 0.004 | Inf | 0.004 | 1 | 1 | kappa-type opioid receptor binding |
| GO:0031857 | 0.004 | Inf | 0.004 | 1 | 1 | type 1 parathyroid hormone receptor binding |
| GO:0050421 | 0.004 | Inf | 0.004 | 1 | 1 | nitrite reductase (NO-forming) activity |
| GO:0070025 | 0.004 | Inf | 0.004 | 1 | 1 | carbon monoxide binding |
| GO:1904047 | 0.004 | Inf | 0.004 | 1 | 1 | S-adenosyl-L-methionine binding |
| GO:0004122 | 0.008 | 252.9677 | 0.008 | 1 | 2 | cystathionine beta-synthase activity |
| GO:0008260 | 0.008 | 252.9677 | 0.008 | 1 | 2 | 3-oxoacid CoA-transferase activity |
| GO:0017077 | 0.008 | 252.9677 | 0.008 | 1 | 2 | oxidative phosphorylation uncoupler activity |
| GO:0038100 | 0.008 | 252.9677 | 0.008 | 1 | 2 | nodal binding |
| GO:0070026 | 0.008 | 252.9677 | 0.008 | 1 | 2 | nitric oxide binding |
| GO:0071568 | 0.008 | 252.9677 | 0.008 | 1 | 2 | UFM1 transferase activity |
| GOMFID | Pvalue | OddsRatio | ExpCount | Count | Size | Term |
| GO:0004984 | 0 | 19.2734 | 0.9868 | 13 | 370 | olfactory receptor activity |
| GO:0004930 | 0 | 8.7192 | 2.0829 | 13 | 781 | G-protein coupled receptor activity |
| GO:0099600 | 0 | 6.0333 | 3.2431 | 14 | 1216 | transmembrane receptor activity |
| GO:0038023 | 0 | 5.7574 | 3.3844 | 14 | 1269 | signaling receptor activity |
| GO:0060089 | 0 | 4.7669 | 4.0138 | 14 | 1505 | molecular transducer activity |
| GO:0035575 | 7e-04 | 60.3577 | 0.04 | 2 | 15 | histone demethylase activity (H4-K20 specific) |
| GO:0005549 | 0.0014 | 15.025 | 0.2214 | 3 | 83 | odorant binding |
| GO:0008519 | 0.0017 | 37.3452 | 0.0613 | 2 | 23 | ammonium transmembrane transporter activity |
| GO:0031851 | 0.0027 | Inf | 0.0027 | 1 | 1 | kappa-type opioid receptor binding |
| GO:0032451 | 0.0044 | 22.3871 | 0.0987 | 2 | 37 | demethylase activity |
| GO:0031732 | 0.0053 | 383.0488 | 0.0053 | 1 | 2 | CCR7 chemokine receptor binding |
| GOMFID | Pvalue | OddsRatio | ExpCount | Count | Size | Term |
| GO:0004984 | 0 | 9.0097 | 1.6212 | 12 | 370 | olfactory receptor activity |
| GO:0004930 | 0 | 4.5071 | 3.422 | 13 | 781 | G-protein coupled receptor activity |
| GO:0005549 | 0 | 15.626 | 0.3637 | 5 | 83 | odorant binding |
| GO:0001664 | 8e-04 | 6.0246 | 1.0954 | 6 | 250 | G-protein coupled receptor binding |
| GO:0005126 | 0.0011 | 5.648 | 1.1655 | 6 | 266 | cytokine receptor binding |
| GO:0008009 | 0.0012 | 15.7919 | 0.2103 | 3 | 48 | chemokine activity |
| GO:0099600 | 0.0021 | 2.7934 | 5.3279 | 13 | 1216 | transmembrane receptor activity |
| GO:0038023 | 0.0031 | 2.6658 | 5.5601 | 13 | 1269 | signaling receptor activity |
| GO:0000224 | 0.0044 | Inf | 0.0044 | 1 | 1 | peptide-N4-(N-acetyl-beta-glucosaminyl)asparagine amidase activity |
| GO:0004124 | 0.0044 | Inf | 0.0044 | 1 | 1 | cysteine synthase activity |
| GO:0015054 | 0.0044 | Inf | 0.0044 | 1 | 1 | gastrin receptor activity |
| GO:0031741 | 0.0044 | Inf | 0.0044 | 1 | 1 | type B gastrin/cholecystokinin receptor binding |
| GO:0031851 | 0.0044 | Inf | 0.0044 | 1 | 1 | kappa-type opioid receptor binding |
| GO:0031857 | 0.0044 | Inf | 0.0044 | 1 | 1 | type 1 parathyroid hormone receptor binding |
| GO:0050421 | 0.0044 | Inf | 0.0044 | 1 | 1 | nitrite reductase (NO-forming) activity |
| GO:0070025 | 0.0044 | Inf | 0.0044 | 1 | 1 | carbon monoxide binding |
| GO:1904047 | 0.0044 | Inf | 0.0044 | 1 | 1 | S-adenosyl-L-methionine binding |
| GO:0004122 | 0.0087 | 230.5588 | 0.0088 | 1 | 2 | cystathionine beta-synthase activity |
| GO:0004951 | 0.0087 | 230.5588 | 0.0088 | 1 | 2 | cholecystokinin receptor activity |
| GO:0005153 | 0.0087 | 230.5588 | 0.0088 | 1 | 2 | interleukin-8 receptor binding |
| GO:0070026 | 0.0087 | 230.5588 | 0.0088 | 1 | 2 | nitric oxide binding |
| GOMFID | Pvalue | OddsRatio | ExpCount | Count | Size | Term |
| GO:0004984 | 0 | 7.3357 | 2.2555 | 14 | 370 | olfactory receptor activity |
| GO:0004930 | 0 | 4.8217 | 4.761 | 19 | 781 | G-protein coupled receptor activity |
| GO:0099600 | 0 | 3.8186 | 7.4128 | 23 | 1216 | transmembrane receptor activity |
| GO:0038023 | 0 | 3.6428 | 7.7358 | 23 | 1269 | signaling receptor activity |
| GO:0042605 | 0 | 33.9826 | 0.1463 | 4 | 24 | peptide antigen binding |
| GO:0060089 | 0 | 3.0125 | 9.1745 | 23 | 1505 | molecular transducer activity |
| GO:0032395 | 0.0016 | 41.6064 | 0.061 | 2 | 10 | MHC class II receptor activity |
| GO:0005549 | 0.0016 | 8.5707 | 0.506 | 4 | 83 | odorant binding |
| GO:0042974 | 0.0028 | 11.7097 | 0.2804 | 3 | 46 | retinoic acid receptor binding |
| GO:0005243 | 0.0037 | 25.5957 | 0.0914 | 2 | 15 | gap junction channel activity |
| GO:0051428 | 0.0047 | 22.1801 | 0.1036 | 2 | 17 | peptide hormone receptor binding |
| GO:0004124 | 0.0061 | Inf | 0.0061 | 1 | 1 | cysteine synthase activity |
| GO:0004380 | 0.0061 | Inf | 0.0061 | 1 | 1 | glycoprotein-fucosylgalactoside alpha-N-acetylgalactosaminyltransferase activity |
| GO:0004381 | 0.0061 | Inf | 0.0061 | 1 | 1 | fucosylgalactoside 3-alpha-galactosyltransferase activity |
| GO:0008613 | 0.0061 | Inf | 0.0061 | 1 | 1 | diuretic hormone activity |
| GO:0015052 | 0.0061 | Inf | 0.0061 | 1 | 1 | beta3-adrenergic receptor activity |
| GO:0015054 | 0.0061 | Inf | 0.0061 | 1 | 1 | gastrin receptor activity |
| GO:0017188 | 0.0061 | Inf | 0.0061 | 1 | 1 | aspartate N-acetyltransferase activity |
| GO:0031741 | 0.0061 | Inf | 0.0061 | 1 | 1 | type B gastrin/cholecystokinin receptor binding |
| GO:0031857 | 0.0061 | Inf | 0.0061 | 1 | 1 | type 1 parathyroid hormone receptor binding |
| GO:0050421 | 0.0061 | Inf | 0.0061 | 1 | 1 | nitrite reductase (NO-forming) activity |
| GO:0070025 | 0.0061 | Inf | 0.0061 | 1 | 1 | carbon monoxide binding |
| GO:0097260 | 0.0061 | Inf | 0.0061 | 1 | 1 | eoxin A4 synthase activity |
| GO:1904047 | 0.0061 | Inf | 0.0061 | 1 | 1 | S-adenosyl-L-methionine binding |
| GOMFID | Pvalue | OddsRatio | ExpCount | Count | Size | Term |
| GO:0004984 | 0 | 11.3456 | 2.0441 | 18 | 370 | olfactory receptor activity |
| GO:0004930 | 0 | 6.2385 | 4.3146 | 21 | 781 | G-protein coupled receptor activity |
| GO:0099600 | 0 | 4.3583 | 6.7178 | 23 | 1216 | transmembrane receptor activity |
| GO:0038023 | 0 | 4.1576 | 7.0106 | 23 | 1269 | signaling receptor activity |
| GO:0060089 | 0 | 3.4383 | 8.3144 | 23 | 1505 | molecular transducer activity |
| GO:0004607 | 0.0055 | Inf | 0.0055 | 1 | 1 | phosphatidylcholine-sterol O-acyltransferase activity |
| GO:0018169 | 0.0055 | Inf | 0.0055 | 1 | 1 | ribosomal S6-glutamic acid ligase activity |
| GO:0031710 | 0.0055 | Inf | 0.0055 | 1 | 1 | neuromedin B receptor binding |
| GO:0034353 | 0.0055 | Inf | 0.0055 | 1 | 1 | RNA pyrophosphohydrolase activity |
| GOMFID | Pvalue | OddsRatio | ExpCount | Count | Size | Term |
| GO:0032395 | 1e-04 | 42.5323 | 0.1016 | 3 | 10 | MHC class II receptor activity |
| GO:0004468 | 0.001 | 65.7595 | 0.0508 | 2 | 5 | lysine N-acetyltransferase activity, acting on acetyl phosphate as donor |
| GO:0019957 | 0.0021 | 39.4506 | 0.0711 | 2 | 7 | C-C chemokine binding |
| GO:0030881 | 0.0035 | 28.1754 | 0.0914 | 2 | 9 | beta-2-microglobulin binding |
| GO:0016831 | 0.0053 | 9.289 | 0.3556 | 3 | 35 | carboxy-lyase activity |
| GO:0097153 | 0.0053 | 21.9114 | 0.1118 | 2 | 11 | cysteine-type endopeptidase activity involved in apoptotic process |
| GO:0003823 | 0.0078 | 5.4496 | 0.7823 | 4 | 77 | antigen binding |
| GO:0005149 | 0.0099 | 15.1655 | 0.1524 | 2 | 15 | interleukin-1 receptor binding |
| GOMFID | Pvalue | OddsRatio | ExpCount | Count | Size | Term |
| GO:0004984 | 0 | 12.4005 | 2.3495 | 22 | 370 | olfactory receptor activity |
| GO:0004930 | 0 | 6.5661 | 4.9594 | 25 | 781 | G-protein coupled receptor activity |
| GO:0099600 | 0 | 5.226 | 7.7216 | 30 | 1216 | transmembrane receptor activity |
| GO:0038023 | 0 | 4.9841 | 8.0582 | 30 | 1269 | signaling receptor activity |
| GO:0060089 | 0 | 4.5286 | 9.5568 | 32 | 1505 | molecular transducer activity |
| GO:0005549 | 0 | 15.4222 | 0.5271 | 7 | 83 | odorant binding |
| GO:0032395 | 0 | 69.106 | 0.0635 | 3 | 10 | MHC class II receptor activity |
| GO:0003823 | 0.0015 | 8.8898 | 0.489 | 4 | 77 | antigen binding |
| GO:0008613 | 0.0064 | Inf | 0.0064 | 1 | 1 | diuretic hormone activity |
| GO:0033798 | 0.0064 | Inf | 0.0064 | 1 | 1 | thyroxine 5-deiodinase activity |
| GO:0035730 | 0.0064 | Inf | 0.0064 | 1 | 1 | S-nitrosoglutathione binding |
| GO:0035731 | 0.0064 | Inf | 0.0064 | 1 | 1 | dinitrosyl-iron complex binding |
| GO:1990259 | 0.0064 | Inf | 0.0064 | 1 | 1 | histone-glutamine methyltransferase activity |
| GO:0017091 | 0.0093 | 15.1866 | 0.1461 | 2 | 23 | AU-rich element binding |
| GOMFID | Pvalue | OddsRatio | ExpCount | Count | Size | Term |
| GO:0004984 | 0 | 13.3996 | 1.3862 | 14 | 370 | olfactory receptor activity |
| GO:0005549 | 0 | 32.6567 | 0.311 | 8 | 83 | odorant binding |
| GO:0004930 | 0 | 7.259 | 2.926 | 16 | 781 | G-protein coupled receptor activity |
| GO:0099600 | 0 | 4.8916 | 4.5558 | 17 | 1216 | transmembrane receptor activity |
| GO:0038023 | 0 | 4.2869 | 4.7543 | 16 | 1269 | signaling receptor activity |
| GO:0060089 | 0 | 3.8629 | 5.6385 | 17 | 1505 | molecular transducer activity |
| GO:0008768 | 0.0037 | Inf | 0.0037 | 1 | 1 | UDP-sugar diphosphatase activity |
| GO:0001179 | 0.0075 | 270.4828 | 0.0075 | 1 | 2 | RNA polymerase I transcription factor binding |
| GO:0004122 | 0.0075 | 270.4828 | 0.0075 | 1 | 2 | cystathionine beta-synthase activity |
| GO:0008147 | 0.0075 | 270.4828 | 0.0075 | 1 | 2 | structural constituent of bone |
| GO:0003755 | 0.0098 | 14.4515 | 0.1499 | 2 | 40 | peptidyl-prolyl cis-trans isomerase activity |
| GOMFID | Pvalue | OddsRatio | ExpCount | Count | Size | Term |
| GO:0004984 | 0 | 8.994 | 2.608 | 19 | 370 | olfactory receptor activity |
| GO:0004930 | 0 | 5.1304 | 5.5049 | 23 | 781 | G-protein coupled receptor activity |
| GO:0099600 | 0 | 3.7135 | 8.571 | 26 | 1216 | transmembrane receptor activity |
| GO:0038023 | 0 | 3.3634 | 8.9446 | 25 | 1269 | signaling receptor activity |
| GO:0060089 | 0 | 3.0792 | 10.608 | 27 | 1505 | molecular transducer activity |
| GO:0005549 | 0 | 11.5473 | 0.585 | 6 | 83 | odorant binding |
| GO:0004522 | 3e-04 | 143.4404 | 0.0282 | 2 | 4 | ribonuclease A activity |
| GO:0001055 | 0.0021 | 35.8463 | 0.0705 | 2 | 10 | RNA polymerase II activity |
| GO:0001054 | 0.0031 | 28.6734 | 0.0846 | 2 | 12 | RNA polymerase I activity |
| GO:0001784 | 0.0049 | 22.0522 | 0.1057 | 2 | 15 | phosphotyrosine binding |
| GO:0001056 | 0.007 | 17.914 | 0.1269 | 2 | 18 | RNA polymerase III activity |
| GO:0003948 | 0.007 | Inf | 0.007 | 1 | 1 | N4-(beta-N-acetylglucosaminyl)-L-asparaginase activity |
| GO:0005141 | 0.007 | Inf | 0.007 | 1 | 1 | interleukin-10 receptor binding |
| GO:0030294 | 0.007 | Inf | 0.007 | 1 | 1 | receptor signaling protein tyrosine kinase inhibitor activity |
| GO:0044736 | 0.007 | Inf | 0.007 | 1 | 1 | acid-sensing ion channel activity |
| GO:0016894 | 0.0078 | 16.8591 | 0.1339 | 2 | 19 | endonuclease activity, active with either ribo- or deoxyribonucleic acids and producing 3'-phosphomonoesters |
| GOMFID | Pvalue | OddsRatio | ExpCount | Count | Size | Term |
| GO:0004983 | 0.0018 | 39.095 | 0.0648 | 2 | 10 | neuropeptide Y receptor activity |
| GO:0032395 | 0.0018 | 39.095 | 0.0648 | 2 | 10 | MHC class II receptor activity |
| GO:0019864 | 0.0026 | 31.272 | 0.0777 | 2 | 12 | IgG binding |
| GO:0004984 | 0.0028 | 3.5933 | 2.3965 | 8 | 370 | olfactory receptor activity |
| GO:0008191 | 0.0031 | 28.4273 | 0.0842 | 2 | 13 | metalloendopeptidase inhibitor activity |
| GO:0010576 | 0.0036 | 26.0567 | 0.0907 | 2 | 14 | metalloenzyme regulator activity |
| GO:0005528 | 0.0059 | 19.5375 | 0.1166 | 2 | 18 | FK506 binding |
| GO:0005141 | 0.0065 | Inf | 0.0065 | 1 | 1 | interleukin-10 receptor binding |
| GO:0008768 | 0.0065 | Inf | 0.0065 | 1 | 1 | UDP-sugar diphosphatase activity |
| GO:0030294 | 0.0065 | Inf | 0.0065 | 1 | 1 | receptor signaling protein tyrosine kinase inhibitor activity |
| GO:0031861 | 0.0065 | Inf | 0.0065 | 1 | 1 | prolactin-releasing peptide receptor binding |
| GOMFID | Pvalue | OddsRatio | ExpCount | Count | Size | Term |
| GO:0004984 | 0 | 7.799 | 2.9369 | 19 | 370 | olfactory receptor activity |
| GO:0004930 | 0 | 3.7199 | 6.1992 | 20 | 781 | G-protein coupled receptor activity |
| GO:0099600 | 0 | 2.8768 | 9.652 | 24 | 1216 | transmembrane receptor activity |
| GO:0038023 | 1e-04 | 2.6018 | 10.0727 | 23 | 1269 | signaling receptor activity |
| GO:0060089 | 3e-04 | 2.389 | 11.946 | 25 | 1505 | molecular transducer activity |
| GO:0005549 | 5e-04 | 8.304 | 0.6588 | 5 | 83 | odorant binding |
| GO:0003735 | 0.0046 | 4.1174 | 1.5478 | 6 | 195 | structural constituent of ribosome |
| GO:0005125 | 0.0074 | 3.7185 | 1.7066 | 6 | 215 | cytokine activity |
| GO:0003948 | 0.0079 | Inf | 0.0079 | 1 | 1 | N4-(beta-N-acetylglucosaminyl)-L-asparaginase activity |
| GO:0016497 | 0.0079 | Inf | 0.0079 | 1 | 1 | substance K receptor activity |
| GO:0016913 | 0.0079 | Inf | 0.0079 | 1 | 1 | follicle-stimulating hormone activity |
| GO:0030294 | 0.0079 | Inf | 0.0079 | 1 | 1 | receptor signaling protein tyrosine kinase inhibitor activity |
| GO:0044736 | 0.0079 | Inf | 0.0079 | 1 | 1 | acid-sensing ion channel activity |
| GOMFID | Pvalue | OddsRatio | ExpCount | Count | Size | Term |
| GO:0004984 | 0 | 5.7967 | 2.561 | 13 | 370 | olfactory receptor activity |
| GO:0004930 | 3e-04 | 3.0984 | 5.4057 | 15 | 781 | G-protein coupled receptor activity |
| GO:0050733 | 7e-04 | 73.0607 | 0.0415 | 2 | 6 | RS domain binding |
| GO:0019825 | 0.002 | 13.3842 | 0.2492 | 3 | 36 | oxygen binding |
| GO:0045294 | 0.0021 | 36.521 | 0.0692 | 2 | 10 | alpha-catenin binding |
| GO:0003735 | 0.0024 | 4.7619 | 1.3497 | 6 | 195 | structural constituent of ribosome |
| GO:0019864 | 0.003 | 29.2131 | 0.0831 | 2 | 12 | IgG binding |
| GO:0099600 | 0.0041 | 2.2254 | 8.4166 | 17 | 1216 | transmembrane receptor activity |
| GO:0005344 | 0.0041 | 24.3411 | 0.0969 | 2 | 14 | oxygen transporter activity |
| GO:0038023 | 0.0062 | 2.1234 | 8.7834 | 17 | 1269 | signaling receptor activity |
| GO:0004853 | 0.0069 | Inf | 0.0069 | 1 | 1 | uroporphyrinogen decarboxylase activity |
| GO:0005140 | 0.0069 | Inf | 0.0069 | 1 | 1 | interleukin-9 receptor binding |
| GO:0008254 | 0.0069 | Inf | 0.0069 | 1 | 1 | 3'-nucleotidase activity |
| GO:0008897 | 0.0069 | Inf | 0.0069 | 1 | 1 | holo-[acyl-carrier-protein] synthase activity |
| GOMFID | Pvalue | OddsRatio | ExpCount | Count | Size | Term |
| GO:0004930 | 0 | 4.6362 | 6.4968 | 25 | 781 | G-protein coupled receptor activity |
| GO:0004984 | 0 | 5.9987 | 3.0779 | 16 | 370 | olfactory receptor activity |
| GO:0099600 | 0 | 3.1503 | 10.1153 | 27 | 1216 | transmembrane receptor activity |
| GO:0038023 | 0 | 3.0048 | 10.5562 | 27 | 1269 | signaling receptor activity |
| GO:0060089 | 1e-04 | 2.4836 | 12.5194 | 27 | 1505 | molecular transducer activity |
| GO:0004938 | 2e-04 | 242.1085 | 0.025 | 2 | 3 | alpha2-adrenergic receptor activity |
| GO:0004082 | 4e-04 | 121.0465 | 0.0333 | 2 | 4 | bisphosphoglycerate mutase activity |
| GO:0046538 | 4e-04 | 121.0465 | 0.0333 | 2 | 4 | 2,3-bisphosphoglycerate-dependent phosphoglycerate mutase activity |
| GO:0004083 | 7e-04 | 80.6925 | 0.0416 | 2 | 5 | bisphosphoglycerate 2-phosphatase activity |
| GO:0051379 | 0.001 | 60.5155 | 0.0499 | 2 | 6 | epinephrine binding |
| GO:0004935 | 0.0024 | 34.5736 | 0.0749 | 2 | 9 | adrenergic receptor activity |
| GO:0043295 | 0.0036 | 26.8872 | 0.0915 | 2 | 11 | glutathione binding |
| GO:0019864 | 0.0043 | 24.1969 | 0.0998 | 2 | 12 | IgG binding |
| GO:0004420 | 0.0083 | Inf | 0.0083 | 1 | 1 | hydroxymethylglutaryl-CoA reductase (NADPH) activity |
| GO:0042282 | 0.0083 | Inf | 0.0083 | 1 | 1 | hydroxymethylglutaryl-CoA reductase activity |
| GO:0050144 | 0.0083 | Inf | 0.0083 | 1 | 1 | nucleoside deoxyribosyltransferase activity |
| GO:0070694 | 0.0083 | Inf | 0.0083 | 1 | 1 | deoxyribonucleoside 5'-monophosphate N-glycosidase activity |
| GOMFID | Pvalue | OddsRatio | ExpCount | Count | Size | Term |
| GO:0099600 | 0 | 3.4334 | 7.3355 | 21 | 1216 | transmembrane receptor activity |
| GO:0005549 | 0 | 13.6372 | 0.5007 | 6 | 83 | odorant binding |
| GO:0004930 | 0 | 4.2104 | 3.8266 | 14 | 657 | G-protein coupled receptor activity |
| GO:0038023 | 1e-04 | 3.0753 | 7.6553 | 20 | 1269 | signaling receptor activity |
| GO:0060089 | 1e-04 | 2.8796 | 9.0789 | 22 | 1505 | molecular transducer activity |
| GO:0004984 | 1e-04 | 4.9977 | 2.232 | 10 | 370 | olfactory receptor activity |
| GO:0016175 | 0.001 | 56.0824 | 0.0483 | 2 | 8 | superoxide-generating NADPH oxidase activity |
| GO:0003743 | 0.0027 | 11.8377 | 0.2775 | 3 | 46 | translation initiation factor activity |
| GO:0035091 | 0.0054 | 4.7489 | 1.122 | 5 | 186 | phosphatidylinositol binding |
| GO:0043325 | 0.0058 | 19.7799 | 0.1146 | 2 | 19 | phosphatidylinositol-3,4-bisphosphate binding |
| GO:0008528 | 0.0067 | 5.6897 | 0.748 | 4 | 124 | G-protein coupled peptide receptor activity |
| GOMFID | Pvalue | OddsRatio | ExpCount | Count | Size | Term |
| GO:0004984 | 0 | 10.9709 | 1.7386 | 15 | 370 | olfactory receptor activity |
| GO:0004930 | 0 | 5.3762 | 3.6699 | 16 | 781 | G-protein coupled receptor activity |
| GO:0099600 | 0 | 4.1781 | 5.714 | 19 | 1216 | transmembrane receptor activity |
| GO:0060089 | 0 | 3.5388 | 7.072 | 20 | 1505 | molecular transducer activity |
| GO:0038023 | 0 | 3.7058 | 5.963 | 18 | 1269 | signaling receptor activity |
| GO:0005549 | 0 | 14.489 | 0.39 | 5 | 83 | odorant binding |
| GO:0001784 | 0.0022 | 33.4637 | 0.0705 | 2 | 15 | phosphotyrosine binding |
| GO:0003948 | 0.0047 | Inf | 0.0047 | 1 | 1 | N4-(beta-N-acetylglucosaminyl)-L-asparaginase activity |
| GO:0030294 | 0.0047 | Inf | 0.0047 | 1 | 1 | receptor signaling protein tyrosine kinase inhibitor activity |
| GO:0047166 | 0.0047 | Inf | 0.0047 | 1 | 1 | 1-alkenylglycerophosphoethanolamine O-acyltransferase activity |
| GO:0005154 | 0.0087 | 15.5218 | 0.141 | 2 | 30 | epidermal growth factor receptor binding |
| GO:0004756 | 0.0094 | 214.6986 | 0.0094 | 1 | 2 | selenide, water dikinase activity |
| GO:0008263 | 0.0094 | 214.6986 | 0.0094 | 1 | 2 | pyrimidine-specific mismatch base pair DNA N-glycosylase activity |
| GO:0017098 | 0.0094 | 214.6986 | 0.0094 | 1 | 2 | sulfonylurea receptor binding |
| GO:0033906 | 0.0094 | 214.6986 | 0.0094 | 1 | 2 | hyaluronoglucuronidase activity |
| GOMFID | Pvalue | OddsRatio | ExpCount | Count | Size | Term |
| GO:0004984 | 1e-04 | 4.9393 | 2.2555 | 10 | 370 | olfactory receptor activity |
| GO:0008144 | 0.004 | 6.6283 | 0.6462 | 4 | 106 | drug binding |
| GO:0004930 | 0.0052 | 2.8056 | 3.8687 | 10 | 657 | G-protein coupled receptor activity |
| GO:0005179 | 0.0057 | 5.9788 | 0.7132 | 4 | 117 | hormone activity |
| GO:0004946 | 0.0061 | Inf | 0.0061 | 1 | 1 | bombesin receptor activity |
| GO:0005307 | 0.0061 | Inf | 0.0061 | 1 | 1 | choline:sodium symporter activity |
| GO:0047166 | 0.0061 | Inf | 0.0061 | 1 | 1 | 1-alkenylglycerophosphoethanolamine O-acyltransferase activity |
| GO:0005212 | 0.0065 | 18.4799 | 0.1219 | 2 | 20 | structural constituent of eye lens |
| GO:0099600 | 0.0066 | 2.2282 | 7.4128 | 15 | 1216 | transmembrane receptor activity |
| GO:0003735 | 0.0068 | 4.4714 | 1.1887 | 5 | 195 | structural constituent of ribosome |
| GO:0008528 | 0.007 | 5.6275 | 0.7559 | 4 | 124 | G-protein coupled peptide receptor activity |
| GO:0038023 | 0.0097 | 2.1262 | 7.7358 | 15 | 1269 | signaling receptor activity |
| GOMFID | Pvalue | OddsRatio | ExpCount | Count | Size | Term |
| GO:0004984 | 0 | 26.1198 | 0.4934 | 8 | 370 | olfactory receptor activity |
| GO:0004556 | 0 | 1310.4167 | 0.0067 | 3 | 5 | alpha-amylase activity |
| GO:0004930 | 0 | 11.9049 | 1.0415 | 8 | 781 | G-protein coupled receptor activity |
| GO:0099600 | 1e-04 | 7.3963 | 1.6215 | 8 | 1216 | transmembrane receptor activity |
| GO:0038023 | 1e-04 | 7.0596 | 1.6922 | 8 | 1269 | signaling receptor activity |
| GO:0004553 | 2e-04 | 29.9617 | 0.12 | 3 | 90 | hydrolase activity, hydrolyzing O-glycosyl compounds |
| GO:0060089 | 4e-04 | 5.8496 | 2.0069 | 8 | 1505 | molecular transducer activity |
| GO:0005153 | 0.0027 | 786.3 | 0.0027 | 1 | 2 | interleukin-8 receptor binding |
| GOMFID | Pvalue | OddsRatio | ExpCount | Count | Size | Term |
| GO:0005125 | 0 | 12.7617 | 0.7339 | 8 | 167 | cytokine activity |
| GO:0005126 | 0 | 8.325 | 1.0992 | 8 | 247 | cytokine receptor binding |
| GO:0008009 | 1e-04 | 20.5942 | 0.2225 | 4 | 48 | chemokine activity |
| GO:0046977 | 4e-04 | 88.2817 | 0.0324 | 2 | 7 | TAP binding |
| GO:0048020 | 6e-04 | 20.9504 | 0.1622 | 3 | 35 | CCR chemokine receptor binding |
| GO:0042834 | 0.0011 | 49.0329 | 0.051 | 2 | 11 | peptidoglycan binding |
| GO:0004984 | 0.0016 | 4.4738 | 1.7151 | 7 | 370 | olfactory receptor activity |
| GO:0005132 | 0.0028 | 29.4085 | 0.0788 | 2 | 17 | type I interferon receptor binding |
| GO:0004930 | 0.0031 | 3.0684 | 3.6203 | 10 | 781 | G-protein coupled receptor activity |
| GO:0052899 | 0.0046 | Inf | 0.0046 | 1 | 1 | N(1),N(12)-diacetylspermine:oxygen oxidoreductase (3-acetamidopropanal-forming) activity |
| GO:0052902 | 0.0046 | Inf | 0.0046 | 1 | 1 | spermidine:oxygen oxidoreductase (3-aminopropanal-forming) activity |
| GO:0052903 | 0.0046 | Inf | 0.0046 | 1 | 1 | N1-acetylspermine:oxygen oxidoreductase (3-acetamidopropanal-forming) activity |
| GO:0052904 | 0.0046 | Inf | 0.0046 | 1 | 1 | N1-acetylspermidine:oxygen oxidoreductase (3-acetamidopropanal-forming) activity |
| GO:0042605 | 0.0055 | 20.0423 | 0.1113 | 2 | 24 | peptide antigen binding |
| GO:0001664 | 0.0061 | 4.6309 | 1.1589 | 5 | 250 | G-protein coupled receptor binding |
| GO:0005164 | 0.0074 | 16.9545 | 0.1298 | 2 | 28 | tumor necrosis factor receptor binding |
| GO:0004122 | 0.0092 | 217.6944 | 0.0093 | 1 | 2 | cystathionine beta-synthase activity |
| GO:0005135 | 0.0092 | 217.6944 | 0.0093 | 1 | 2 | interleukin-3 receptor binding |
| GO:0005153 | 0.0092 | 217.6944 | 0.0093 | 1 | 2 | interleukin-8 receptor binding |
| GO:0010385 | 0.0092 | 217.6944 | 0.0093 | 1 | 2 | double-stranded methylated DNA binding |
| GO:0046592 | 0.0092 | 217.6944 | 0.0093 | 1 | 2 | polyamine oxidase activity |
| GO:0046980 | 0.0092 | 217.6944 | 0.0093 | 1 | 2 | tapasin binding |
| GO:0052901 | 0.0092 | 217.6944 | 0.0093 | 1 | 2 | spermine:oxygen oxidoreductase (spermidine-forming) activity |
| GO:0071862 | 0.0092 | 217.6944 | 0.0093 | 1 | 2 | protein phosphatase type 1 activator activity |
| GOMFID | Pvalue | OddsRatio | ExpCount | Count | Size | Term |
| GO:0004984 | 0 | 12.7043 | 1.1278 | 11 | 370 | olfactory receptor activity |
| GO:0004556 | 0 | 523.2667 | 0.0152 | 3 | 5 | alpha-amylase activity |
| GO:0004930 | 0 | 7.2216 | 2.3805 | 13 | 781 | G-protein coupled receptor activity |
| GO:0099600 | 0 | 4.476 | 3.7064 | 13 | 1216 | transmembrane receptor activity |
| GO:0038023 | 1e-04 | 4.2714 | 3.8679 | 13 | 1269 | signaling receptor activity |
| GO:0060089 | 4e-04 | 3.537 | 4.5872 | 13 | 1505 | molecular transducer activity |
| GO:0004553 | 0.0026 | 11.964 | 0.2743 | 3 | 90 | hydrolase activity, hydrolyzing O-glycosyl compounds |
| GO:0005125 | 0.0041 | 6.6734 | 0.6553 | 4 | 215 | cytokine activity |
| GO:0031696 | 0.0061 | 334.0213 | 0.0061 | 1 | 2 | alpha-2C adrenergic receptor binding |
| GO:0046811 | 0.0061 | 334.0213 | 0.0061 | 1 | 2 | histone deacetylase inhibitor activity |
| GO:0001664 | 0.007 | 5.711 | 0.762 | 4 | 250 | G-protein coupled receptor binding |
| GO:0004938 | 0.0091 | 167 | 0.0091 | 1 | 3 | alpha2-adrenergic receptor activity |
| GO:0031692 | 0.0091 | 167 | 0.0091 | 1 | 3 | alpha-1B adrenergic receptor binding |
| GO:0032795 | 0.0091 | 167 | 0.0091 | 1 | 3 | heterotrimeric G-protein binding |
| GOMFID | Pvalue | OddsRatio | ExpCount | Count | Size | Term |
| GO:0008140 | 0.0014 | 44.9741 | 0.0565 | 2 | 10 | cAMP response element binding protein binding |
| GO:0001664 | 0.0029 | 4.567 | 1.4129 | 6 | 250 | G-protein coupled receptor binding |
| GO:0035575 | 0.0032 | 27.6676 | 0.0848 | 2 | 15 | histone demethylase activity (H4-K20 specific) |
| GO:0052689 | 0.0045 | 6.4169 | 0.6669 | 4 | 118 | carboxylic ester hydrolase activity |
| GO:0004984 | 0.0049 | 3.5971 | 2.0911 | 7 | 370 | olfactory receptor activity |
| GO:0004607 | 0.0057 | Inf | 0.0057 | 1 | 1 | phosphatidylcholine-sterol O-acyltransferase activity |
| GO:0004778 | 0.0057 | Inf | 0.0057 | 1 | 1 | succinyl-CoA hydrolase activity |
| GO:0015054 | 0.0057 | Inf | 0.0057 | 1 | 1 | gastrin receptor activity |
| GO:0031741 | 0.0057 | Inf | 0.0057 | 1 | 1 | type B gastrin/cholecystokinin receptor binding |
| GO:0036455 | 0.0057 | Inf | 0.0057 | 1 | 1 | iron-sulfur transferase activity |
| GO:0043532 | 0.0057 | Inf | 0.0057 | 1 | 1 | angiostatin binding |
| GO:0099600 | 0.008 | 2.2451 | 6.8722 | 14 | 1216 | transmembrane receptor activity |
| GOMFID | Pvalue | OddsRatio | ExpCount | Count | Size | Term |
| GO:0004930 | 0 | 6.2119 | 4.9594 | 24 | 781 | G-protein coupled receptor activity |
| GO:0004984 | 0 | 8.8745 | 2.3495 | 17 | 370 | olfactory receptor activity |
| GO:0099600 | 0 | 4.7334 | 7.7216 | 28 | 1216 | transmembrane receptor activity |
| GO:0038023 | 0 | 4.5147 | 8.0582 | 28 | 1269 | signaling receptor activity |
| GO:0060089 | 0 | 3.7312 | 9.5568 | 28 | 1505 | molecular transducer activity |
| GO:0005125 | 1e-04 | 6.4865 | 1.3653 | 8 | 215 | cytokine activity |
| GO:0005549 | 0.0019 | 8.2115 | 0.5271 | 4 | 83 | odorant binding |
| GO:0034236 | 0.004 | 24.5447 | 0.0953 | 2 | 15 | protein kinase A catalytic subunit binding |
| GO:0035575 | 0.004 | 24.5447 | 0.0953 | 2 | 15 | histone demethylase activity (H4-K20 specific) |
| GO:0005132 | 0.0051 | 21.2694 | 0.108 | 2 | 17 | type I interferon receptor binding |
| GO:0004853 | 0.0064 | Inf | 0.0064 | 1 | 1 | uroporphyrinogen decarboxylase activity |
| GO:0005130 | 0.0064 | Inf | 0.0064 | 1 | 1 | granulocyte colony-stimulating factor receptor binding |
| GO:0042163 | 0.0064 | Inf | 0.0064 | 1 | 1 | interleukin-12 beta subunit binding |
| GO:0045513 | 0.0064 | Inf | 0.0064 | 1 | 1 | interleukin-27 binding |
| GO:0004129 | 0.0093 | 15.1866 | 0.1461 | 2 | 23 | cytochrome-c oxidase activity |
| GOMFID | Pvalue | OddsRatio | ExpCount | Count | Size | Term |
| GO:0004984 | 0 | 11.5055 | 0.6579 | 6 | 370 | olfactory receptor activity |
| GO:0099600 | 2e-04 | 5.6956 | 2.1621 | 9 | 1216 | transmembrane receptor activity |
| GO:0038023 | 2e-04 | 5.4361 | 2.2563 | 9 | 1269 | signaling receptor activity |
| GO:0004930 | 3e-04 | 6.4367 | 1.3886 | 7 | 781 | G-protein coupled receptor activity |
| GO:0060089 | 8e-04 | 4.5038 | 2.6759 | 9 | 1505 | molecular transducer activity |
| GO:0005130 | 0.0018 | Inf | 0.0018 | 1 | 1 | granulocyte colony-stimulating factor receptor binding |
| GO:0033981 | 0.0018 | Inf | 0.0018 | 1 | 1 | D-dopachrome decarboxylase activity |
| GO:0008009 | 0.0033 | 26.2107 | 0.0853 | 2 | 48 | chemokine activity |
| GO:0004657 | 0.0036 | 582.1852 | 0.0036 | 1 | 2 | proline dehydrogenase activity |
| GO:0005153 | 0.0036 | 582.1852 | 0.0036 | 1 | 2 | interleukin-8 receptor binding |
| GO:0004167 | 0.0053 | 291.0741 | 0.0053 | 1 | 3 | dopachrome isomerase activity |
| GO:0031727 | 0.0071 | 194.037 | 0.0071 | 1 | 4 | CCR2 chemokine receptor binding |
| GO:0005102 | 0.0099 | 3.4095 | 2.5017 | 7 | 1407 | receptor binding |
| GOMFID | Pvalue | OddsRatio | ExpCount | Count | Size | Term |
| GO:0004984 | 0 | 12.5041 | 1.7856 | 17 | 370 | olfactory receptor activity |
| GO:0004930 | 0 | 6.9978 | 3.7691 | 20 | 781 | G-protein coupled receptor activity |
| GO:0099600 | 0 | 4.6256 | 5.8684 | 21 | 1216 | transmembrane receptor activity |
| GO:0038023 | 0 | 4.4129 | 6.1242 | 21 | 1269 | signaling receptor activity |
| GO:0060089 | 0 | 3.6504 | 7.2631 | 21 | 1505 | molecular transducer activity |
| GO:0005549 | 7e-04 | 10.9655 | 0.4006 | 4 | 83 | odorant binding |
| GO:0008903 | 0.0048 | Inf | 0.0048 | 1 | 1 | hydroxypyruvate isomerase activity |
| GO:0038062 | 0.0096 | 208.9467 | 0.0097 | 1 | 2 | protein tyrosine kinase collagen receptor activity |
| GO:0017080 | 0.0098 | 14.5788 | 0.1496 | 2 | 31 | sodium channel regulator activity |
| GOMFID | Pvalue | OddsRatio | ExpCount | Count | Size | Term |
| GO:0004984 | 0 | 14.8256 | 2.4435 | 26 | 370 | olfactory receptor activity |
| GO:0004930 | 0 | 7.2857 | 5.1577 | 28 | 781 | G-protein coupled receptor activity |
| GO:0099600 | 0 | 4.7094 | 8.0305 | 29 | 1216 | transmembrane receptor activity |
| GO:0060089 | 0 | 4.0824 | 9.939 | 31 | 1505 | molecular transducer activity |
| GO:0038023 | 0 | 4.2759 | 8.3805 | 28 | 1269 | signaling receptor activity |
| GO:0005549 | 0.0022 | 7.881 | 0.5481 | 4 | 83 | odorant binding |
| GO:0008392 | 0.0043 | 23.5762 | 0.0991 | 2 | 15 | arachidonic acid epoxygenase activity |
| GO:0030294 | 0.0066 | Inf | 0.0066 | 1 | 1 | receptor signaling protein tyrosine kinase inhibitor activity |
| GO:0031771 | 0.0066 | Inf | 0.0066 | 1 | 1 | type 1 hypocretin receptor binding |
| GO:0031772 | 0.0066 | Inf | 0.0066 | 1 | 1 | type 2 hypocretin receptor binding |
| GO:0042931 | 0.0066 | Inf | 0.0066 | 1 | 1 | enterobactin transporter activity |
| GO:0005112 | 0.0069 | 18.0242 | 0.1255 | 2 | 19 | Notch binding |
| GO:0005179 | 0.0075 | 5.4977 | 0.7727 | 4 | 117 | hormone activity |
| GO:0001965 | 0.0084 | 16.1249 | 0.1387 | 2 | 21 | G-protein alpha-subunit binding |
| GOMFID | Pvalue | OddsRatio | ExpCount | Count | Size | Term |
| GO:0042813 | 1e-04 | 21.8399 | 0.2311 | 4 | 20 | Wnt-activated receptor activity |
| GO:0004930 | 3e-04 | 2.5411 | 9.026 | 21 | 781 | G-protein coupled receptor activity |
| GO:0017147 | 4e-04 | 13.4313 | 0.3467 | 4 | 30 | Wnt-protein binding |
| GO:0005243 | 6e-04 | 21.7235 | 0.1734 | 3 | 15 | gap junction channel activity |
| GO:0061133 | 0.0019 | 43.2278 | 0.0693 | 2 | 6 | endopeptidase activator activity |
| GO:0004984 | 0.0039 | 2.7249 | 4.2761 | 11 | 370 | olfactory receptor activity |
| GO:0005246 | 0.0082 | 7.8888 | 0.4161 | 3 | 36 | calcium channel regulator activity |
| GO:0031996 | 0.0095 | 15.7121 | 0.1502 | 2 | 13 | thioesterase binding |
| GOMFID | Pvalue | OddsRatio | ExpCount | Count | Size | Term |
| GO:0004984 | 0 | 16.268 | 1.6447 | 19 | 370 | olfactory receptor activity |
| GO:0004930 | 0 | 10.2838 | 3.4716 | 24 | 781 | G-protein coupled receptor activity |
| GO:0099600 | 0 | 6.7576 | 5.4051 | 25 | 1216 | transmembrane receptor activity |
| GO:0038023 | 0 | 6.4461 | 5.6407 | 25 | 1269 | signaling receptor activity |
| GO:0060089 | 0 | 5.3296 | 6.6897 | 25 | 1505 | molecular transducer activity |
| GO:0005549 | 0 | 15.3846 | 0.3689 | 5 | 83 | odorant binding |
| GO:1901338 | 0.002 | 35.4412 | 0.0667 | 2 | 15 | catecholamine binding |
| GO:0033038 | 0.0028 | 28.7904 | 0.08 | 2 | 18 | bitter taste receptor activity |
| GO:0004603 | 0.0044 | Inf | 0.0044 | 1 | 1 | phenylethanolamine N-methyltransferase activity |
| GO:0008903 | 0.0044 | Inf | 0.0044 | 1 | 1 | hydroxypyruvate isomerase activity |
| GO:0004821 | 0.0089 | 227.2029 | 0.0089 | 1 | 2 | histidine-tRNA ligase activity |
| GO:0005147 | 0.0089 | 227.2029 | 0.0089 | 1 | 2 | oncostatin-M receptor binding |
| GO:0031696 | 0.0089 | 227.2029 | 0.0089 | 1 | 2 | alpha-2C adrenergic receptor binding |
| GO:0038062 | 0.0089 | 227.2029 | 0.0089 | 1 | 2 | protein tyrosine kinase collagen receptor activity |
| GOMFID | Pvalue | OddsRatio | ExpCount | Count | Size | Term |
| GO:0004930 | 1e-04 | 4.0819 | 3.422 | 12 | 781 | G-protein coupled receptor activity |
| GO:0005126 | 2e-04 | 6.7219 | 1.1655 | 7 | 266 | cytokine receptor binding |
| GO:0004984 | 2e-04 | 5.5491 | 1.6212 | 8 | 370 | olfactory receptor activity |
| GO:0099600 | 7e-04 | 3.0658 | 5.3279 | 14 | 1216 | transmembrane receptor activity |
| GO:0038023 | 0.001 | 2.9255 | 5.5601 | 14 | 1269 | signaling receptor activity |
| GO:0008009 | 0.0012 | 15.7919 | 0.2103 | 3 | 48 | chemokine activity |
| GO:0035575 | 0.0019 | 35.9724 | 0.0657 | 2 | 15 | histone demethylase activity (H4-K20 specific) |
| GO:0004168 | 0.0044 | Inf | 0.0044 | 1 | 1 | dolichol kinase activity |
| GO:0004380 | 0.0044 | Inf | 0.0044 | 1 | 1 | glycoprotein-fucosylgalactoside alpha-N-acetylgalactosaminyltransferase activity |
| GO:0004381 | 0.0044 | Inf | 0.0044 | 1 | 1 | fucosylgalactoside 3-alpha-galactosyltransferase activity |
| GO:0008613 | 0.0044 | Inf | 0.0044 | 1 | 1 | diuretic hormone activity |
| GO:0030731 | 0.0044 | Inf | 0.0044 | 1 | 1 | guanidinoacetate N-methyltransferase activity |
| GO:0042163 | 0.0044 | Inf | 0.0044 | 1 | 1 | interleukin-12 beta subunit binding |
| GO:0045513 | 0.0044 | Inf | 0.0044 | 1 | 1 | interleukin-27 binding |
| GO:1990081 | 0.0044 | Inf | 0.0044 | 1 | 1 | trimethylamine receptor activity |
| GO:0008519 | 0.0045 | 22.2573 | 0.1008 | 2 | 23 | ammonium transmembrane transporter activity |
| GO:0060089 | 0.0051 | 2.4222 | 6.5942 | 14 | 1505 | molecular transducer activity |
| GO:0005125 | 0.0053 | 6.1235 | 0.702 | 4 | 167 | cytokine activity |
| GO:0005164 | 0.0066 | 17.9713 | 0.1227 | 2 | 28 | tumor necrosis factor receptor binding |
| GO:0001632 | 0.0087 | 230.5588 | 0.0088 | 1 | 2 | leukotriene B4 receptor activity |
| GO:0005153 | 0.0087 | 230.5588 | 0.0088 | 1 | 2 | interleukin-8 receptor binding |
| GO:0008147 | 0.0087 | 230.5588 | 0.0088 | 1 | 2 | structural constituent of bone |
| GO:0008263 | 0.0087 | 230.5588 | 0.0088 | 1 | 2 | pyrimidine-specific mismatch base pair DNA N-glycosylase activity |
| GOMFID | Pvalue | OddsRatio | ExpCount | Count | Size | Term |
| GO:0004984 | 0 | 11.7492 | 1.1982 | 11 | 370 | olfactory receptor activity |
| GO:0099600 | 0 | 4.5629 | 3.938 | 14 | 1216 | transmembrane receptor activity |
| GO:0004930 | 0 | 5.4752 | 2.4767 | 11 | 780 | G-protein coupled receptor activity |
| GO:0038023 | 0 | 4.3542 | 4.1097 | 14 | 1269 | signaling receptor activity |
| GO:0060089 | 2e-04 | 3.6051 | 4.874 | 14 | 1505 | molecular transducer activity |
| GO:0005549 | 0.0025 | 12.2008 | 0.2688 | 3 | 83 | odorant binding |
| GO:0008519 | 0.0025 | 30.4684 | 0.0745 | 2 | 23 | ammonium transmembrane transporter activity |
| GO:0001616 | 0.0032 | Inf | 0.0032 | 1 | 1 | growth hormone secretagogue receptor activity |
| GO:0004168 | 0.0032 | Inf | 0.0032 | 1 | 1 | dolichol kinase activity |
| GO:0031851 | 0.0032 | Inf | 0.0032 | 1 | 1 | kappa-type opioid receptor binding |
| GO:0001567 | 0.0065 | 313.92 | 0.0065 | 1 | 2 | cholesterol 25-hydroxylase activity |
| GO:0050997 | 0.0078 | 16.3872 | 0.1328 | 2 | 41 | quaternary ammonium group binding |
| GO:0031720 | 0.0097 | 156.95 | 0.0097 | 1 | 3 | haptoglobin binding |
| GO:0070653 | 0.0097 | 156.95 | 0.0097 | 1 | 3 | high-density lipoprotein particle receptor binding |
| GOMFID | Pvalue | OddsRatio | ExpCount | Count | Size | Term |
| GO:0099600 | 0 | 4.4978 | 7.7216 | 27 | 1216 | transmembrane receptor activity |
| GO:0004930 | 0 | 5.2814 | 4.9038 | 21 | 780 | G-protein coupled receptor activity |
| GO:0038023 | 0 | 4.2901 | 8.0582 | 27 | 1269 | signaling receptor activity |
| GO:0060089 | 0 | 3.7312 | 9.5568 | 28 | 1505 | molecular transducer activity |
| GO:0004984 | 0 | 5.824 | 2.3495 | 12 | 370 | olfactory receptor activity |
| GO:0046982 | 6e-04 | 3.8494 | 2.8512 | 10 | 449 | protein heterodimerization activity |
| GO:0001664 | 0.0011 | 4.7717 | 1.5875 | 7 | 250 | G-protein coupled receptor binding |
| GO:0070888 | 0.0013 | 15.5806 | 0.2159 | 3 | 34 | E-box binding |
| GO:0003705 | 0.003 | 7.2028 | 0.5969 | 4 | 94 | transcription factor activity, RNA polymerase II distal enhancer sequence-specific binding |
| GO:1901338 | 0.004 | 24.5447 | 0.0953 | 2 | 15 | catecholamine binding |
| GO:0001616 | 0.0064 | Inf | 0.0064 | 1 | 1 | growth hormone secretagogue receptor activity |
| GO:0003947 | 0.0064 | Inf | 0.0064 | 1 | 1 | (N-acetylneuraminyl)-galactosylglucosylceramide N-acetylgalactosaminyltransferase activity |
| GO:0004946 | 0.0064 | Inf | 0.0064 | 1 | 1 | bombesin receptor activity |
| GO:0031851 | 0.0064 | Inf | 0.0064 | 1 | 1 | kappa-type opioid receptor binding |
| GO:0070405 | 0.0065 | 8.4596 | 0.381 | 3 | 60 | ammonium ion binding |
| GO:0005126 | 0.007 | 3.7777 | 1.6891 | 6 | 266 | cytokine receptor binding |
| GO:0042813 | 0.007 | 17.7211 | 0.127 | 2 | 20 | Wnt-activated receptor activity |
| GO:0043565 | 0.01 | 2.2365 | 6.3056 | 13 | 993 | sequence-specific DNA binding |
| GOMFID | Pvalue | OddsRatio | ExpCount | Count | Size | Term |
| GO:0008121 | 2e-04 | 40.5288 | 0.1285 | 3 | 7 | ubiquinol-cytochrome-c reductase activity |
| GO:0016679 | 3e-04 | 32.421 | 0.1468 | 3 | 8 | oxidoreductase activity, acting on diphenols and related substances as donors |
| GO:0004659 | 0.0019 | 14.7311 | 0.2569 | 3 | 14 | prenyltransferase activity |
| GO:0004082 | 0.002 | 53.8571 | 0.0734 | 2 | 4 | bisphosphoglycerate mutase activity |
| GO:0046538 | 0.002 | 53.8571 | 0.0734 | 2 | 4 | 2,3-bisphosphoglycerate-dependent phosphoglycerate mutase activity |
| GO:0004083 | 0.0032 | 35.9024 | 0.0918 | 2 | 5 | bisphosphoglycerate 2-phosphatase activity |
| GO:1990050 | 0.0032 | 35.9024 | 0.0918 | 2 | 5 | phosphatidic acid transporter activity |
| GO:0004062 | 0.0048 | 26.9251 | 0.1101 | 2 | 6 | aryl sulfotransferase activity |
| GO:0050543 | 0.0048 | 26.9251 | 0.1101 | 2 | 6 | icosatetraenoic acid binding |
| GO:0044822 | 0.005 | 1.6976 | 20.6271 | 33 | 1124 | poly(A) RNA binding |
| GO:0061630 | 0.0068 | 2.8236 | 3.3583 | 9 | 183 | ubiquitin protein ligase activity |
| GO:0051537 | 0.0073 | 8.5241 | 0.4037 | 3 | 22 | 2 iron, 2 sulfur cluster binding |
| GO:0015450 | 0.0087 | 17.9477 | 0.1468 | 2 | 8 | P-P-bond-hydrolysis-driven protein transmembrane transporter activity |
| GOMFID | Pvalue | OddsRatio | ExpCount | Count | Size | Term |
| GO:0004984 | 0 | 17.4239 | 1.4802 | 18 | 370 | olfactory receptor activity |
| GO:0004930 | 0 | 7.8228 | 3.1244 | 18 | 781 | G-protein coupled receptor activity |
| GO:0099600 | 0 | 4.8371 | 4.8646 | 18 | 1216 | transmembrane receptor activity |
| GO:0038023 | 0 | 4.6152 | 5.0766 | 18 | 1269 | signaling receptor activity |
| GO:0060089 | 0 | 4.1261 | 6.0208 | 19 | 1505 | molecular transducer activity |
| GO:0005549 | 3e-04 | 13.3928 | 0.332 | 4 | 83 | odorant binding |
| GO:0008009 | 9e-04 | 17.3778 | 0.192 | 3 | 48 | chemokine activity |
| GO:0004573 | 0.004 | Inf | 0.004 | 1 | 1 | mannosyl-oligosaccharide glucosidase activity |
| GO:0005140 | 0.004 | Inf | 0.004 | 1 | 1 | interleukin-9 receptor binding |
| GO:0008613 | 0.004 | Inf | 0.004 | 1 | 1 | diuretic hormone activity |
| GO:0004739 | 0.008 | 252.9677 | 0.008 | 1 | 2 | pyruvate dehydrogenase (acetyl-transferring) activity |
| GO:0005153 | 0.008 | 252.9677 | 0.008 | 1 | 2 | interleukin-8 receptor binding |
| GO:0038100 | 0.008 | 252.9677 | 0.008 | 1 | 2 | nodal binding |
| GO:0048020 | 0.0086 | 15.5509 | 0.14 | 2 | 35 | CCR chemokine receptor binding |
| GOMFID | Pvalue | OddsRatio | ExpCount | Count | Size | Term |
| GO:0004984 | 0 | 26.1467 | 0.6814 | 11 | 370 | olfactory receptor activity |
| GO:0004930 | 0 | 13.7229 | 1.4382 | 12 | 781 | G-protein coupled receptor activity |
| GO:0099600 | 0 | 9.804 | 2.2393 | 13 | 1216 | transmembrane receptor activity |
| GO:0038023 | 0 | 9.356 | 2.3369 | 13 | 1269 | signaling receptor activity |
| GO:0060089 | 0 | 7.7476 | 2.7715 | 13 | 1505 | molecular transducer activity |
| GO:0030172 | 0.0055 | 280.6607 | 0.0055 | 1 | 3 | troponin C binding |
| GO:0001601 | 0.0073 | 187.0952 | 0.0074 | 1 | 4 | peptide YY receptor activity |
| GO:0001602 | 0.0073 | 187.0952 | 0.0074 | 1 | 4 | pancreatic polypeptide receptor activity |
| GO:0031014 | 0.0073 | 187.0952 | 0.0074 | 1 | 4 | troponin T binding |
| NA. |
| n/a |
| NA. |
| n/a |
| NA. |
| n/a |
| NA. |
| n/a |
| NA. |
| n/a |
| NA. |
| n/a |
| NA. |
| n/a |
| NA. |
| n/a |
| NA. |
| n/a |
| NA. |
| n/a |
| NA. |
| n/a |
| NA. |
| n/a |
| NA. |
| n/a |
| NA. |
| n/a |
| NA. |
| n/a |
| NA. |
| n/a |
| NA. |
| n/a |
| NA. |
| n/a |
| NA. |
| n/a |
| NA. |
| n/a |
| NA. |
| n/a |
| NA. |
| n/a |
| NA. |
| n/a |
| NA. |
| n/a |
| NA. |
| n/a |
| NA. |
| n/a |
| NA. |
| n/a |
| NA. |
| n/a |
| NA. |
| n/a |
| NA. |
| n/a |
| NA. |
| n/a |
| NA. |
| n/a |
| NA. |
| n/a |
| NA. |
| n/a |
| NA. |
| n/a |
| NA. |
| n/a |
| NA. |
| n/a |
| NA. |
| n/a |
| NA. |
| n/a |
| NA. |
| n/a |
| NA. |
| n/a |
| NA. |
| n/a |
| NA. |
| n/a |
| NA. |
| n/a |
| NA. |
| n/a |
| NA. |
| n/a |
| NA. |
| n/a |
| NA. |
| n/a |
| NA. |
| n/a |
| NA. |
| n/a |
| NA. |
| n/a |
| NA. |
| n/a |
| NA. |
| n/a |
| NA. |
| n/a |
| NA. |
| n/a |
| NA. |
| n/a |
| NA. |
| n/a |
| NA. |
| n/a |
| NA. |
| n/a |
| NA. |
| n/a |
| NA. |
| n/a |
| NA. |
| n/a |
| NA. |
| n/a |
| NA. |
| n/a |
| NA. |
| n/a |
| NA. |
| n/a |
| NA. |
| n/a |
| NA. |
| n/a |
| NA. |
| n/a |
| NA. |
| n/a |
| NA. |
| n/a |
| NA. |
| n/a |
| NA. |
| n/a |
| NA. |
| n/a |
| NA. |
| n/a |
| NA. |
| n/a |
| NA. |
| n/a |
| NA. |
| n/a |
| NA. |
| n/a |
| NA. |
| n/a |
| NA. |
| n/a |
| NA. |
| n/a |
| NA. |
| n/a |
| NA. |
| n/a |
| NA. |
| n/a |
| NA. |
| n/a |
| NA. |
| n/a |
| NA. |
| n/a |
| NA. |
| n/a |
| NA. |
| n/a |
| NA. |
| n/a |
| NA. |
| n/a |
| NA. |
| n/a |
| NA. |
| n/a |
| NA. |
| n/a |
| NA. |
| n/a |
| NA. |
| n/a |
| NA. |
| n/a |
| NA. |
| n/a |
| NA. |
| n/a |
| NA. |
| n/a |
| NA. |
| n/a |
| NA. |
| n/a |
| NA. |
| n/a |
| NA. |
| n/a |
| NA. |
| n/a |
| NA. |
| n/a |
| NA. |
| n/a |
| NA. |
| n/a |
| NA. |
| n/a |
| NA. |
| n/a |
| NA. |
| n/a |
| NA. |
| n/a |
| NA. |
| n/a |
| NA. |
| n/a |
| NA. |
| n/a |
| NA. |
| n/a |
| NA. |
| n/a |
| NA. |
| n/a |
| NA. |
| n/a |
| NA. |
| n/a |
| NA. |
| n/a |
| NA. |
| n/a |
| NA. |
| n/a |
| NA. |
| n/a |
| NA. |
| n/a |
| NA. |
| n/a |
| NA. |
| n/a |
| NA. |
| n/a |
| NA. |
| n/a |
| NA. |
| n/a |
| NA. |
| n/a |
| NA. |
| n/a |
| NA. |
| n/a |
| NA. |
| n/a |
| NA. |
| n/a |
| NA. |
| n/a |
| NA. |
| n/a |
| NA. |
| n/a |
| NA. |
| n/a |
| NA. |
| n/a |
| NA. |
| n/a |
| NA. |
| n/a |
| NA. |
| n/a |
| NA. |
| n/a |
| NA. |
| n/a |
| NA. |
| n/a |
| NA. |
| n/a |
| NA. |
| n/a |
| NA. |
| n/a |
| NA. |
| n/a |
| NA. |
| n/a |
| NA. |
| n/a |
| NA. |
| n/a |
| NA. |
| n/a |
| NA. |
| n/a |
| NA. |
| n/a |
| NA. |
| n/a |
| NA. |
| n/a |
| NA. |
| n/a |
| NA. |
| n/a |
| NA. |
| n/a |
| NA. |
| n/a |
| NA. |
| n/a |
| NA. |
| n/a |
| NA. |
| n/a |
| NA. |
| n/a |
| NA. |
| n/a |
| NA. |
| n/a |
| NA. |
| n/a |
| NA. |
| n/a |
| NA. |
| n/a |
| NA. |
| n/a |
| NA. |
| n/a |
| NA. |
| n/a |
| NA. |
| n/a |
| NA. |
| n/a |
| NA. |
| n/a |
| NA. |
| n/a |
| NA. |
| n/a |
| NA. |
| n/a |
| NA. |
| n/a |
| NA. |
| n/a |
| NA. |
| n/a |
| NA. |
| n/a |
| NA. |
| n/a |
| NA. |
| n/a |
| NA. |
| n/a |
| NA. |
| n/a |
| NA. |
| n/a |
| NA. |
| n/a |
| NA. |
| n/a |
| NA. |
| n/a |
| NA. |
| n/a |
| NA. |
| n/a |
| NA. |
| n/a |
| NA. |
| n/a |
| NA. |
| n/a |
| NA. |
| n/a |
| NA. |
| n/a |
| NA. |
| n/a |
| NA. |
| n/a |
| NA. |
| n/a |
| NA. |
| n/a |
| NA. |
| n/a |
| NA. |
| n/a |
| NA. |
| n/a |
| NA. |
| n/a |
| NA. |
| n/a |
| NA. |
| n/a |
| NA. |
| n/a |
| NA. |
| n/a |
| NA. |
| n/a |
| NA. |
| n/a |
| NA. |
| n/a |
| NA. |
| n/a |
| NA. |
| n/a |
| NA. |
| n/a |
| NA. |
| n/a |
| NA. |
| n/a |
| NA. |
| n/a |
| NA. |
| n/a |
| NA. |
| n/a |
| NA. |
| n/a |
| NA. |
| n/a |
| NA. |
| n/a |
| NA. |
| n/a |
| NA. |
| n/a |
| NA. |
| n/a |
| NA. |
| n/a |
| NA. |
| n/a |
| NA. |
| n/a |
| NA. |
| n/a |
| NA. |
| n/a |
| NA. |
| n/a |
| NA. |
| n/a |
| NA. |
| n/a |
| NA. |
| n/a |
| NA. |
| n/a |
| NA. |
| n/a |
| GOMFID | Pvalue | OddsRatio | ExpCount | Count | Size | Term |
| GO:1901844 | 3e-04 | 32.8979 | 0.1364 | 3 | 9 | regulation of cell communication by electrical coupling involved in cardiac conduction |
| GO:0060669 | 6e-04 | 12.0016 | 0.394 | 4 | 26 | embryonic placenta morphogenesis |
| GO:0060670 | 9e-04 | 19.7336 | 0.197 | 3 | 13 | branching involved in labyrinthine layer morphogenesis |
| GO:0045655 | 0.0011 | 17.9385 | 0.2121 | 3 | 14 | regulation of monocyte differentiation |
| GO:0007161 | 0.0013 | 65.5339 | 0.0606 | 2 | 4 | calcium-independent cell-matrix adhesion |
| GO:1903361 | 0.0013 | 65.5339 | 0.0606 | 2 | 4 | protein localization to basolateral plasma membrane |
| GO:0097211 | 0.0033 | 32.7627 | 0.0909 | 2 | 6 | cellular response to gonadotropin-releasing hormone |
| GO:1901897 | 0.0033 | 32.7627 | 0.0909 | 2 | 6 | regulation of relaxation of cardiac muscle |
| GO:0022610 | 0.0041 | 1.7192 | 21.23 | 34 | 1401 | biological adhesion |
| GO:0086103 | 0.0046 | 26.2085 | 0.1061 | 2 | 7 | G-protein coupled receptor signaling pathway involved in heart process |
| GO:0045672 | 0.0049 | 9.8604 | 0.3485 | 3 | 23 | positive regulation of osteoclast differentiation |
| GO:0051354 | 0.0049 | 9.8604 | 0.3485 | 3 | 23 | negative regulation of oxidoreductase activity |
| GO:0060711 | 0.0051 | 6.2784 | 0.6971 | 4 | 46 | labyrinthine layer development |
| GO:0031589 | 0.0056 | 2.5815 | 4.4854 | 11 | 296 | cell-substrate adhesion |
| GO:0033483 | 0.006 | 21.839 | 0.1212 | 2 | 8 | gas homeostasis |
| GO:0098609 | 0.0063 | 1.8582 | 13.1077 | 23 | 865 | cell-cell adhesion |
| GO:0007162 | 0.0065 | 2.8418 | 3.3338 | 9 | 220 | negative regulation of cell adhesion |
| GO:0010644 | 0.0069 | 8.5726 | 0.394 | 3 | 26 | cell communication by electrical coupling |
| GO:0060638 | 0.0077 | 18.7179 | 0.1364 | 2 | 9 | mesenchymal-epithelial cell signaling |
| GO:0060249 | 0.0079 | 2.3484 | 5.3643 | 12 | 354 | anatomical structure homeostasis |
| GO:0032507 | 0.0081 | 4.2893 | 1.2426 | 5 | 82 | maintenance of protein location in cell |
| GO:1903706 | 0.0082 | 2.4417 | 4.7279 | 11 | 312 | regulation of hemopoiesis |
| GO:0006749 | 0.0084 | 5.379 | 0.8031 | 4 | 53 | glutathione metabolic process |
| GO:0060443 | 0.0084 | 5.379 | 0.8031 | 4 | 53 | mammary gland morphogenesis |
| GO:0001953 | 0.0085 | 7.8858 | 0.4243 | 3 | 28 | negative regulation of cell-matrix adhesion |
| GO:0010469 | 0.0088 | 3.5781 | 1.773 | 6 | 117 | regulation of receptor activity |
| GO:2001257 | 0.009 | 4.1802 | 1.2729 | 5 | 84 | regulation of cation channel activity |
| GO:0045638 | 0.0094 | 4.1277 | 1.288 | 5 | 85 | negative regulation of myeloid cell differentiation |
| GO:0001921 | 0.0095 | 16.3771 | 0.1515 | 2 | 10 | positive regulation of receptor recycling |
| GO:0010759 | 0.0095 | 16.3771 | 0.1515 | 2 | 10 | positive regulation of macrophage chemotaxis |
| GO:0021932 | 0.0095 | 16.3771 | 0.1515 | 2 | 10 | hindbrain radial glia guided cell migration |
| GO:0042738 | 0.0095 | 16.3771 | 0.1515 | 2 | 10 | exogenous drug catabolic process |
| GO:0045019 | 0.0095 | 16.3771 | 0.1515 | 2 | 10 | negative regulation of nitric oxide biosynthetic process |
| GOMFID | Pvalue | OddsRatio | ExpCount | Count | Size | Term |
| GO:0002877 | 7e-04 | 125.6667 | 0.0474 | 2 | 3 | regulation of acute inflammatory response to non-antigenic stimulus |
| GO:0030259 | 7e-04 | 125.6667 | 0.0474 | 2 | 3 | lipid glycosylation |
| GO:0001895 | 0.001 | 5.7821 | 1.1369 | 6 | 72 | retina homeostasis |
| GO:0031032 | 0.002 | 3.7835 | 2.258 | 8 | 143 | actomyosin structure organization |
| GO:0002725 | 0.0024 | 41.8835 | 0.079 | 2 | 5 | negative regulation of T cell cytokine production |
| GO:0002861 | 0.0031 | 11.8179 | 0.3 | 3 | 19 | regulation of inflammatory response to antigenic stimulus |
| GO:0006955 | 0.0032 | 1.675 | 25.7695 | 40 | 1632 | immune response |
| GO:0042742 | 0.0034 | 2.9373 | 3.6002 | 10 | 228 | defense response to bacterium |
| GO:0001954 | 0.0039 | 6.8325 | 0.6474 | 4 | 41 | positive regulation of cell-matrix adhesion |
| GO:0090102 | 0.0039 | 6.8325 | 0.6474 | 4 | 41 | cochlea development |
| GO:0051707 | 0.0041 | 1.8775 | 14.148 | 25 | 896 | response to other organism |
| GO:0006952 | 0.0042 | 1.6285 | 27.8222 | 42 | 1762 | defense response |
| GO:0022610 | 0.0044 | 1.6952 | 22.122 | 35 | 1401 | biological adhesion |
| GO:0022011 | 0.0048 | 9.9499 | 0.3474 | 3 | 22 | myelination in peripheral nervous system |
| GO:0035524 | 0.0049 | 25.1268 | 0.1105 | 2 | 7 | proline transmembrane transport |
| GO:0003008 | 0.0053 | 1.5885 | 29.875 | 44 | 1892 | system process |
| GO:0007186 | 0.0053 | 1.7399 | 18.3639 | 30 | 1163 | G-protein coupled receptor signaling pathway |
| GO:0036065 | 0.0055 | 9.4518 | 0.3632 | 3 | 23 | fucosylation |
| GO:0051354 | 0.0055 | 9.4518 | 0.3632 | 3 | 23 | negative regulation of oxidoreductase activity |
| GO:0060384 | 0.0055 | 9.4518 | 0.3632 | 3 | 23 | innervation |
| GO:0001894 | 0.0055 | 3.497 | 2.1206 | 7 | 137 | tissue homeostasis |
| GO:0043588 | 0.006 | 2.6985 | 3.9002 | 10 | 247 | skin development |
| GO:0022408 | 0.0061 | 3.4247 | 2.1632 | 7 | 137 | negative regulation of cell-cell adhesion |
| GO:0032909 | 0.0065 | 20.9377 | 0.1263 | 2 | 8 | regulation of transforming growth factor beta2 production |
| GO:0009607 | 0.0067 | 1.7985 | 14.7164 | 25 | 932 | response to biotic stimulus |
| GO:0031424 | 0.0074 | 5.6149 | 0.7737 | 4 | 49 | keratinization |
| GO:0098602 | 0.0078 | 1.8745 | 11.811 | 21 | 748 | single organism cell adhesion |
| GO:0007600 | 0.0078 | 1.7966 | 14.1164 | 24 | 894 | sensory perception |
| GO:2000508 | 0.0083 | 17.9454 | 0.1421 | 2 | 9 | regulation of dendritic cell chemotaxis |
| GO:0010837 | 0.0086 | 7.8745 | 0.4263 | 3 | 27 | regulation of keratinocyte proliferation |
| GO:0006901 | 0.0091 | 4.1645 | 1.279 | 5 | 81 | vesicle coating |
| GO:0008544 | 0.0093 | 2.3939 | 4.816 | 11 | 305 | epidermis development |
| GOMFID | Pvalue | OddsRatio | ExpCount | Count | Size | Term |
| GO:0042088 | 0 | 10.9153 | 0.6573 | 6 | 37 | T-helper 1 type immune response |
| GO:0016045 | 2e-04 | 17.2464 | 0.302 | 4 | 17 | detection of bacterium |
| GO:0050707 | 3e-04 | 4.2426 | 2.558 | 10 | 144 | regulation of cytokine secretion |
| GO:0001910 | 3e-04 | 7.5126 | 0.906 | 6 | 51 | regulation of leukocyte mediated cytotoxicity |
| GO:1903976 | 3e-04 | Inf | 0.0355 | 2 | 2 | negative regulation of glial cell migration |
| GO:0009611 | 4e-04 | 1.9978 | 18.4034 | 34 | 1036 | response to wounding |
| GO:0031343 | 6e-04 | 8.2616 | 0.6928 | 5 | 39 | positive regulation of cell killing |
| GO:0030817 | 6e-04 | 4.5706 | 1.9007 | 8 | 107 | regulation of cAMP biosynthetic process |
| GO:0098581 | 7e-04 | 11.7956 | 0.4086 | 4 | 23 | detection of external biotic stimulus |
| GO:0050854 | 7e-04 | 8.025 | 0.7106 | 5 | 40 | regulation of antigen receptor-mediated signaling pathway |
| GO:0070340 | 9e-04 | 111.3791 | 0.0533 | 2 | 3 | detection of bacterial lipopeptide |
| GO:0007155 | 9e-04 | 1.7891 | 24.7984 | 41 | 1396 | cell adhesion |
| GO:0002250 | 9e-04 | 2.6996 | 5.9154 | 15 | 333 | adaptive immune response |
| GO:0002449 | 0.0011 | 3.2398 | 3.6238 | 11 | 204 | lymphocyte mediated immunity |
| GO:0002696 | 0.0013 | 2.8288 | 4.8851 | 13 | 275 | positive regulation of leukocyte activation |
| GO:0031347 | 0.0013 | 2.0253 | 13.696 | 26 | 771 | regulation of defense response |
| GO:0032823 | 0.0014 | 16.7576 | 0.2309 | 3 | 13 | regulation of natural killer cell differentiation |
| GO:0051464 | 0.0018 | 55.6859 | 0.0711 | 2 | 4 | positive regulation of cortisol secretion |
| GO:0070668 | 0.0018 | 55.6859 | 0.0711 | 2 | 4 | positive regulation of mast cell proliferation |
| GO:0032675 | 0.0019 | 4.2897 | 1.7586 | 7 | 99 | regulation of interleukin-6 production |
| GO:0032729 | 0.002 | 6.1441 | 0.8999 | 5 | 51 | positive regulation of interferon-gamma production |
| GO:0030808 | 0.0026 | 3.6138 | 2.3626 | 8 | 133 | regulation of nucleotide biosynthetic process |
| GO:0050870 | 0.0027 | 3.0461 | 3.4817 | 10 | 196 | positive regulation of T cell activation |
| GO:0042089 | 0.0028 | 3.9846 | 1.883 | 7 | 106 | cytokine biosynthetic process |
| GO:0006968 | 0.0029 | 5.612 | 0.977 | 5 | 55 | cellular defense response |
| GO:0002715 | 0.003 | 7.4652 | 0.604 | 4 | 34 | regulation of natural killer cell mediated immunity |
| GO:0061737 | 0.003 | 37.1215 | 0.0888 | 2 | 5 | leukotriene signaling pathway |
| GO:0007597 | 0.0031 | 11.9666 | 0.302 | 3 | 17 | blood coagulation, intrinsic pathway |
| GO:0006525 | 0.0037 | 11.1681 | 0.3198 | 3 | 18 | arginine metabolic process |
| GO:0046641 | 0.0037 | 11.1681 | 0.3198 | 3 | 18 | positive regulation of alpha-beta T cell proliferation |
| GO:0042534 | 0.0044 | 10.4694 | 0.3375 | 3 | 19 | regulation of tumor necrosis factor biosynthetic process |
| GO:0045954 | 0.0044 | 10.4694 | 0.3375 | 3 | 19 | positive regulation of natural killer cell mediated cytotoxicity |
| GO:0071221 | 0.0045 | 27.8394 | 0.1066 | 2 | 6 | cellular response to bacterial lipopeptide |
| GO:0002682 | 0.0046 | 1.6306 | 26.2195 | 40 | 1476 | regulation of immune system process |
| GO:0030168 | 0.0048 | 2.642 | 4.3877 | 11 | 247 | platelet activation |
| GO:0046058 | 0.0048 | 3.2468 | 2.6113 | 8 | 147 | cAMP metabolic process |
| GO:0052652 | 0.0048 | 3.2468 | 2.6113 | 8 | 147 | cyclic purine nucleotide metabolic process |
| GO:0032816 | 0.0051 | 9.8529 | 0.3553 | 3 | 20 | positive regulation of natural killer cell activation |
| GO:0030799 | 0.0052 | 3.2003 | 2.6468 | 8 | 149 | regulation of cyclic nucleotide metabolic process |
| GO:0045089 | 0.0053 | 2.3832 | 5.7377 | 13 | 323 | positive regulation of innate immune response |
| GO:0014013 | 0.0053 | 4.0144 | 1.5988 | 6 | 90 | regulation of gliogenesis |
| GO:0002699 | 0.0056 | 3.1552 | 2.6824 | 8 | 151 | positive regulation of immune effector process |
| GO:0043207 | 0.0059 | 1.7951 | 15.308 | 26 | 873 | response to external biotic stimulus |
| GO:0032493 | 0.0062 | 22.27 | 0.1243 | 2 | 7 | response to bacterial lipoprotein |
| GO:0050861 | 0.0062 | 22.27 | 0.1243 | 2 | 7 | positive regulation of B cell receptor signaling pathway |
| GO:2000848 | 0.0062 | 22.27 | 0.1243 | 2 | 7 | positive regulation of corticosteroid hormone secretion |
| GO:0002757 | 0.0062 | 2.1218 | 7.9227 | 16 | 446 | immune response-activating signal transduction |
| GO:0032660 | 0.0067 | 8.8146 | 0.3908 | 3 | 22 | regulation of interleukin-17 production |
| GO:0051249 | 0.0067 | 2.2301 | 6.5904 | 14 | 371 | regulation of lymphocyte activation |
| GO:0071219 | 0.0076 | 2.9864 | 2.8245 | 8 | 159 | cellular response to molecule of bacterial origin |
| GO:0016525 | 0.0076 | 4.3804 | 1.2257 | 5 | 69 | negative regulation of angiogenesis |
| GO:0007565 | 0.008 | 2.7463 | 3.4462 | 9 | 194 | female pregnancy |
| GO:0050865 | 0.0081 | 2.0577 | 8.1536 | 16 | 459 | regulation of cell activation |
| GO:0007100 | 0.0082 | 18.5572 | 0.1421 | 2 | 8 | mitotic centrosome separation |
| GO:0019740 | 0.0082 | 18.5572 | 0.1421 | 2 | 8 | nitrogen utilization |
| GO:0045410 | 0.0082 | 18.5572 | 0.1421 | 2 | 8 | positive regulation of interleukin-6 biosynthetic process |
| GO:1902715 | 0.0082 | 18.5572 | 0.1421 | 2 | 8 | positive regulation of interferon-gamma secretion |
| GO:0009617 | 0.0084 | 2.0026 | 8.9043 | 17 | 508 | response to bacterium |
| GO:0098542 | 0.0093 | 1.9385 | 9.7346 | 18 | 548 | defense response to other organism |
| GO:0070663 | 0.0093 | 2.6732 | 3.535 | 9 | 199 | regulation of leukocyte proliferation |
| GO:0022409 | 0.0097 | 2.5004 | 4.1923 | 10 | 236 | positive regulation of cell-cell adhesion |
| GOMFID | Pvalue | OddsRatio | ExpCount | Count | Size | Term |
| GO:0050729 | 0 | 6.5513 | 1.8969 | 11 | 112 | positive regulation of inflammatory response |
| GO:0018003 | 3e-04 | Inf | 0.0339 | 2 | 2 | peptidyl-lysine N6-acetylation |
| GO:0002378 | 8e-04 | 116.9621 | 0.0508 | 2 | 3 | immunoglobulin biosynthetic process |
| GO:0010980 | 8e-04 | 116.9621 | 0.0508 | 2 | 3 | positive regulation of vitamin D 24-hydroxylase activity |
| GO:2000525 | 8e-04 | 116.9621 | 0.0508 | 2 | 3 | positive regulation of T cell costimulation |
| GO:1903034 | 0.0012 | 2.5364 | 6.7067 | 16 | 396 | regulation of response to wounding |
| GO:0002408 | 0.0017 | 58.4773 | 0.0677 | 2 | 4 | myeloid dendritic cell chemotaxis |
| GO:0045851 | 0.002 | 8.4035 | 0.542 | 4 | 32 | pH reduction |
| GO:0007042 | 0.0028 | 38.9823 | 0.0847 | 2 | 5 | lysosomal lumen acidification |
| GO:0032101 | 0.0033 | 1.8877 | 14.6329 | 26 | 864 | regulation of response to external stimulus |
| GO:0002826 | 0.0041 | 29.2348 | 0.1016 | 2 | 6 | negative regulation of T-helper 1 type immune response |
| GO:0043547 | 0.0044 | 2.151 | 8.3326 | 17 | 492 | positive regulation of GTPase activity |
| GO:0050911 | 0.0047 | 2.3338 | 6.3172 | 14 | 373 | detection of chemical stimulus involved in sensory perception of smell |
| GO:0070131 | 0.0057 | 23.3864 | 0.1186 | 2 | 7 | positive regulation of mitochondrial translation |
| GO:1904353 | 0.0058 | 9.2582 | 0.3726 | 3 | 22 | regulation of telomere capping |
| GO:0017004 | 0.0066 | 8.7947 | 0.3895 | 3 | 23 | cytochrome complex assembly |
| GO:0071621 | 0.0074 | 3.7275 | 1.7106 | 6 | 101 | granulocyte chemotaxis |
| GO:0030643 | 0.0075 | 19.4874 | 0.1355 | 2 | 8 | cellular phosphate ion homeostasis |
| GO:0000041 | 0.0078 | 3.6885 | 1.7275 | 6 | 102 | transition metal ion transport |
| GO:0032825 | 0.0095 | 16.7024 | 0.1524 | 2 | 9 | positive regulation of natural killer cell differentiation |
| GO:0042363 | 0.0095 | 16.7024 | 0.1524 | 2 | 9 | fat-soluble vitamin catabolic process |
| GOMFID | Pvalue | OddsRatio | ExpCount | Count | Size | Term |
| GO:0019858 | 0.0013 | 95.2322 | 0.0621 | 2 | 3 | cytosine metabolic process |
| GO:0070340 | 0.0013 | 95.2322 | 0.0621 | 2 | 3 | detection of bacterial lipopeptide |
| GO:0032490 | 0.0013 | 17.9033 | 0.2276 | 3 | 11 | detection of molecule of bacterial origin |
| GO:0033160 | 0.0013 | 17.9033 | 0.2276 | 3 | 11 | positive regulation of protein import into nucleus, translocation |
| GO:0070633 | 0.0017 | 15.913 | 0.2483 | 3 | 12 | transepithelial transport |
| GO:0006952 | 0.002 | 1.5951 | 36.4606 | 54 | 1762 | defense response |
| GO:0007342 | 0.0022 | 14.3208 | 0.269 | 3 | 13 | fusion of sperm to egg plasma membrane |
| GO:0046688 | 0.0022 | 8.3207 | 0.5587 | 4 | 27 | response to copper ion |
| GO:0023052 | 0.0026 | 1.3813 | 122.1285 | 147 | 5902 | signaling |
| GO:0043330 | 0.0028 | 5.7065 | 0.9726 | 5 | 47 | response to exogenous dsRNA |
| GO:0006959 | 0.0031 | 2.9824 | 3.5591 | 10 | 172 | humoral immune response |
| GO:0070849 | 0.0032 | 7.3592 | 0.6208 | 4 | 30 | response to epidermal growth factor |
| GO:0001833 | 0.0033 | 11.9325 | 0.3104 | 3 | 15 | inner cell mass cell proliferation |
| GO:0044344 | 0.0037 | 2.3218 | 6.8079 | 15 | 329 | cellular response to fibroblast growth factor stimulus |
| GO:0071225 | 0.0041 | 31.7399 | 0.1035 | 2 | 5 | cellular response to muramyl dipeptide |
| GO:0031571 | 0.0046 | 4.1739 | 1.552 | 6 | 75 | mitotic G1 DNA damage checkpoint |
| GO:0006749 | 0.0047 | 4.9912 | 1.0967 | 5 | 53 | glutathione metabolic process |
| GO:0016045 | 0.0048 | 10.2265 | 0.3518 | 3 | 17 | detection of bacterium |
| GO:0045408 | 0.0048 | 10.2265 | 0.3518 | 3 | 17 | regulation of interleukin-6 biosynthetic process |
| GO:0090068 | 0.0048 | 2.5144 | 5.0283 | 12 | 243 | positive regulation of cell cycle process |
| GO:0038061 | 0.0055 | 3.5048 | 2.1314 | 7 | 103 | NIK/NF-kappaB signaling |
| GO:0035590 | 0.0057 | 9.5441 | 0.3725 | 3 | 18 | purinergic nucleotide receptor signaling pathway |
| GO:0045076 | 0.0057 | 9.5441 | 0.3725 | 3 | 18 | regulation of interleukin-2 biosynthetic process |
| GO:0007165 | 0.0057 | 1.3453 | 112.7961 | 135 | 5451 | signal transduction |
| GO:0070098 | 0.0059 | 3.9442 | 1.6347 | 6 | 79 | chemokine-mediated signaling pathway |
| GO:0006360 | 0.0059 | 4.6967 | 1.1588 | 5 | 56 | transcription from RNA polymerase I promoter |
| GO:0046069 | 0.0061 | 23.8034 | 0.1242 | 2 | 6 | cGMP catabolic process |
| GO:0048304 | 0.0061 | 23.8034 | 0.1242 | 2 | 6 | positive regulation of isotype switching to IgG isotypes |
| GO:0071221 | 0.0061 | 23.8034 | 0.1242 | 2 | 6 | cellular response to bacterial lipopeptide |
| GO:0071356 | 0.0064 | 2.4187 | 5.2146 | 12 | 252 | cellular response to tumor necrosis factor |
| GO:0042089 | 0.0065 | 3.3979 | 2.1934 | 7 | 106 | cytokine biosynthetic process |
| GO:0044774 | 0.0065 | 3.3979 | 2.1934 | 7 | 106 | mitotic DNA integrity checkpoint |
| GO:0043488 | 0.0071 | 3.0312 | 2.7935 | 8 | 135 | regulation of mRNA stability |
| GO:0032611 | 0.0074 | 4.4349 | 1.2209 | 5 | 59 | interleukin-1 beta production |
| GO:0045089 | 0.0076 | 2.1957 | 6.6838 | 14 | 323 | positive regulation of innate immune response |
| GO:0034097 | 0.0076 | 1.7138 | 17.175 | 28 | 830 | response to cytokine |
| GO:0015695 | 0.0077 | 8.4202 | 0.4139 | 3 | 20 | organic cation transport |
| GO:0033238 | 0.0083 | 3.6432 | 1.7589 | 6 | 85 | regulation of cellular amine metabolic process |
| GO:0002606 | 0.0084 | 19.0415 | 0.1448 | 2 | 7 | positive regulation of dendritic cell antigen processing and presentation |
| GO:0032493 | 0.0084 | 19.0415 | 0.1448 | 2 | 7 | response to bacterial lipoprotein |
| GO:0097011 | 0.0084 | 19.0415 | 0.1448 | 2 | 7 | cellular response to granulocyte macrophage colony-stimulating factor stimulus |
| GO:1900044 | 0.0084 | 19.0415 | 0.1448 | 2 | 7 | regulation of protein K63-linked ubiquitination |
| GO:0070374 | 0.0087 | 2.7094 | 3.4971 | 9 | 169 | positive regulation of ERK1 and ERK2 cascade |
| GO:0030593 | 0.0088 | 3.5974 | 1.7796 | 6 | 86 | neutrophil chemotaxis |
| GO:0046580 | 0.01 | 5.1676 | 0.8484 | 4 | 41 | negative regulation of Ras protein signal transduction |
| GOMFID | Pvalue | OddsRatio | ExpCount | Count | Size | Term |
| GO:0007156 | 0 | 5.0985 | 2.6054 | 12 | 151 | homophilic cell adhesion via plasma membrane adhesion molecules |
| GO:0048704 | 0 | 6.1309 | 1.6392 | 9 | 95 | embryonic skeletal system morphogenesis |
| GO:0022610 | 3e-04 | 1.8997 | 24.1736 | 42 | 1401 | biological adhesion |
| GO:0021602 | 3e-04 | 14.4373 | 0.3451 | 4 | 20 | cranial nerve morphogenesis |
| GO:0061138 | 6e-04 | 3.4875 | 3.3819 | 11 | 196 | morphogenesis of a branching epithelium |
| GO:0043009 | 8e-04 | 2.2468 | 10.4563 | 22 | 606 | chordate embryonic development |
| GO:0030878 | 0.001 | 10.4957 | 0.4486 | 4 | 26 | thyroid gland development |
| GO:0046952 | 0.0017 | 57.3717 | 0.069 | 2 | 4 | ketone body catabolic process |
| GO:1900020 | 0.0017 | 57.3717 | 0.069 | 2 | 4 | positive regulation of protein kinase C activity |
| GO:0098609 | 0.0021 | 1.9275 | 14.9252 | 27 | 865 | cell-cell adhesion |
| GO:0010092 | 0.0021 | 8.2434 | 0.5521 | 4 | 32 | specification of organ identity |
| GO:0060443 | 0.0022 | 6.0256 | 0.9145 | 5 | 53 | mammary gland morphogenesis |
| GO:0060688 | 0.0022 | 6.0256 | 0.9145 | 5 | 53 | regulation of morphogenesis of a branching structure |
| GO:0032504 | 0.0027 | 1.9715 | 12.9237 | 24 | 749 | multicellular organism reproduction |
| GO:0061302 | 0.0029 | 38.2454 | 0.0863 | 2 | 5 | smooth muscle cell-matrix adhesion |
| GO:0048568 | 0.0033 | 2.2822 | 7.4022 | 16 | 429 | embryonic organ development |
| GO:0090190 | 0.0034 | 11.5075 | 0.3106 | 3 | 18 | positive regulation of branching involved in ureteric bud morphogenesis |
| GO:0070911 | 0.0037 | 5.2563 | 1.0353 | 5 | 60 | global genome nucleotide-excision repair |
| GO:0048305 | 0.004 | 10.7875 | 0.3278 | 3 | 19 | immunoglobulin secretion |
| GO:0048743 | 0.0043 | 28.6822 | 0.1035 | 2 | 6 | positive regulation of skeletal muscle fiber development |
| GO:1903532 | 0.0045 | 2.4344 | 5.625 | 13 | 326 | positive regulation of secretion by cell |
| GO:0034103 | 0.0046 | 4.9835 | 1.087 | 5 | 63 | regulation of tissue remodeling |
| GO:0021801 | 0.0047 | 10.1523 | 0.3451 | 3 | 20 | cerebral cortex radial glia guided migration |
| GO:2000050 | 0.0047 | 10.1523 | 0.3451 | 3 | 20 | regulation of non-canonical Wnt signaling pathway |
| GO:0051932 | 0.0049 | 6.4082 | 0.6902 | 4 | 40 | synaptic transmission, GABAergic |
| GO:0060415 | 0.0052 | 4.8167 | 1.1215 | 5 | 65 | muscle tissue morphogenesis |
| GO:0042048 | 0.0059 | 22.9442 | 0.1208 | 2 | 7 | olfactory behavior |
| GO:0060406 | 0.0059 | 22.9442 | 0.1208 | 2 | 7 | positive regulation of penile erection |
| GO:0008347 | 0.0063 | 5.9141 | 0.7419 | 4 | 43 | glial cell migration |
| GO:0021795 | 0.0063 | 5.9141 | 0.7419 | 4 | 43 | cerebral cortex cell migration |
| GO:1902105 | 0.0067 | 2.6498 | 3.9685 | 10 | 230 | regulation of leukocyte differentiation |
| GO:0021675 | 0.0067 | 4.5145 | 1.1906 | 5 | 69 | nerve development |
| GO:0045191 | 0.007 | 8.6278 | 0.3969 | 3 | 23 | regulation of isotype switching |
| GO:0060713 | 0.007 | 8.6278 | 0.3969 | 3 | 23 | labyrinthine layer morphogenesis |
| GO:0010635 | 0.0078 | 19.119 | 0.138 | 2 | 8 | regulation of mitochondrial fusion |
| GO:0007194 | 0.0079 | 8.2164 | 0.4141 | 3 | 24 | negative regulation of adenylate cyclase activity |
| GO:0007620 | 0.0079 | 8.2164 | 0.4141 | 3 | 24 | copulation |
| GO:0030728 | 0.0079 | 8.2164 | 0.4141 | 3 | 24 | ovulation |
| GO:0061180 | 0.0081 | 4.3115 | 1.2423 | 5 | 72 | mammary gland epithelium development |
| GO:0046427 | 0.0085 | 4.2478 | 1.2596 | 5 | 73 | positive regulation of JAK-STAT cascade |
| GO:0042749 | 0.0088 | 7.8424 | 0.4314 | 3 | 25 | regulation of circadian sleep/wake cycle |
| GO:0061217 | 0.0088 | 7.8424 | 0.4314 | 3 | 25 | regulation of mesonephros development |
| GO:0010810 | 0.0091 | 2.8858 | 2.916 | 8 | 169 | regulation of cell-substrate adhesion |
| GO:0002701 | 0.0099 | 7.501 | 0.4486 | 3 | 26 | negative regulation of production of molecular mediator of immune response |
| GO:0060444 | 0.0099 | 7.501 | 0.4486 | 3 | 26 | branching involved in mammary gland duct morphogenesis |
| GO:0007442 | 0.0099 | 16.3866 | 0.1553 | 2 | 9 | hindgut morphogenesis |
| GO:0060638 | 0.0099 | 16.3866 | 0.1553 | 2 | 9 | mesenchymal-epithelial cell signaling |
| GOMFID | Pvalue | OddsRatio | ExpCount | Count | Size | Term |
| GO:0006955 | 0 | 3.1879 | 7.5814 | 22 | 399 | immune response |
| GO:0045321 | 1e-04 | 2.2669 | 14.2897 | 30 | 697 | leukocyte activation |
| GO:0032661 | 2e-04 | 48.2163 | 0.123 | 3 | 6 | regulation of interleukin-18 production |
| GO:0045087 | 2e-04 | 1.9665 | 22.0393 | 40 | 1075 | innate immune response |
| GO:0043123 | 2e-04 | 3.7543 | 3.4648 | 12 | 169 | positive regulation of I-kappaB kinase/NF-kappaB signaling |
| GO:0071219 | 3e-04 | 36.8637 | 0.1409 | 3 | 7 | cellular response to molecule of bacterial origin |
| GO:0002252 | 4e-04 | 2.0955 | 15.3558 | 30 | 749 | immune effector process |
| GO:0002764 | 4e-04 | 2.2142 | 12.5676 | 26 | 613 | immune response-regulating signaling pathway |
| GO:0007625 | 4e-04 | 13.8095 | 0.369 | 4 | 18 | grooming behavior |
| GO:0002684 | 7e-04 | 1.9404 | 18.2055 | 33 | 888 | positive regulation of immune system process |
| GO:1904591 | 9e-04 | 4.3295 | 2.0092 | 8 | 98 | positive regulation of protein import |
| GO:0044744 | 0.0012 | 2.7405 | 5.433 | 14 | 265 | protein targeting to nucleus |
| GO:1902593 | 0.0012 | 2.7405 | 5.433 | 14 | 265 | single-organism nuclear import |
| GO:0018125 | 0.0012 | 96.1437 | 0.0615 | 2 | 3 | peptidyl-cysteine methylation |
| GO:0019858 | 0.0012 | 96.1437 | 0.0615 | 2 | 3 | cytosine metabolic process |
| GO:0070340 | 0.0012 | 96.1437 | 0.0615 | 2 | 3 | detection of bacterial lipopeptide |
| GO:0032490 | 0.0012 | 18.0752 | 0.2255 | 3 | 11 | detection of molecule of bacterial origin |
| GO:0033160 | 0.0012 | 18.0752 | 0.2255 | 3 | 11 | positive regulation of protein import into nucleus, translocation |
| GO:0042089 | 0.0015 | 3.974 | 2.1732 | 8 | 106 | cytokine biosynthetic process |
| GO:0042110 | 0.0015 | 2.2731 | 8.8567 | 19 | 432 | T cell activation |
| GO:0071593 | 0.0016 | 2.2674 | 8.8772 | 19 | 433 | lymphocyte aggregation |
| GO:0070633 | 0.0016 | 16.0658 | 0.246 | 3 | 12 | transepithelial transport |
| GO:0046824 | 0.0019 | 3.8172 | 2.2552 | 8 | 110 | positive regulation of nucleocytoplasmic transport |
| GO:0002125 | 0.0024 | 48.0688 | 0.082 | 2 | 4 | maternal aggressive behavior |
| GO:0042306 | 0.0027 | 3.0497 | 3.4853 | 10 | 170 | regulation of protein import into nucleus |
| GO:0010033 | 0.0028 | 1.4646 | 59.7215 | 80 | 2913 | response to organic substance |
| GO:0048583 | 0.0029 | 1.4304 | 72.4941 | 94 | 3536 | regulation of response to stimulus |
| GO:0007154 | 0.003 | 1.375 | 122.6208 | 147 | 5981 | cell communication |
| GO:1900182 | 0.0031 | 3.5056 | 2.4397 | 8 | 119 | positive regulation of protein localization to nucleus |
| GO:0044700 | 0.0032 | 1.3722 | 120.8781 | 145 | 5896 | single organism signaling |
| GO:0034109 | 0.0036 | 2.0519 | 10.2714 | 20 | 501 | homotypic cell-cell adhesion |
| GO:0007159 | 0.0039 | 2.0763 | 9.6358 | 19 | 470 | leukocyte cell-cell adhesion |
| GO:0032680 | 0.004 | 3.7346 | 2.0092 | 7 | 98 | regulation of tumor necrosis factor production |
| GO:0008588 | 0.004 | 32.0438 | 0.1025 | 2 | 5 | release of cytoplasmic sequestered NF-kappaB |
| GO:0045345 | 0.004 | 32.0438 | 0.1025 | 2 | 5 | positive regulation of MHC class I biosynthetic process |
| GO:0071222 | 0.0041 | 3.0646 | 3.1163 | 9 | 152 | cellular response to lipopolysaccharide |
| GO:0035556 | 0.0042 | 1.465 | 51.7053 | 70 | 2522 | intracellular signal transduction |
| GO:0016045 | 0.0047 | 10.3247 | 0.3485 | 3 | 17 | detection of bacterium |
| GO:0072576 | 0.0047 | 10.3247 | 0.3485 | 3 | 17 | liver morphogenesis |
| GO:0035590 | 0.0055 | 9.6357 | 0.369 | 3 | 18 | purinergic nucleotide receptor signaling pathway |
| GO:0071706 | 0.0056 | 3.5022 | 2.1322 | 7 | 104 | tumor necrosis factor superfamily cytokine production |
| GO:0046632 | 0.0056 | 3.9824 | 1.6196 | 6 | 79 | alpha-beta T cell differentiation |
| GO:0045409 | 0.006 | 24.0312 | 0.123 | 2 | 6 | negative regulation of interleukin-6 biosynthetic process |
| GO:0071221 | 0.006 | 24.0312 | 0.123 | 2 | 6 | cellular response to bacterial lipopeptide |
| GO:0002253 | 0.0066 | 1.9682 | 10.1278 | 19 | 494 | activation of immune response |
| GO:0031349 | 0.0067 | 2.0511 | 8.6927 | 17 | 424 | positive regulation of defense response |
| GO:0002377 | 0.0067 | 3.8245 | 1.6811 | 6 | 82 | immunoglobulin production |
| GO:0032611 | 0.0071 | 4.4777 | 1.2096 | 5 | 59 | interleukin-1 beta production |
| GO:0015695 | 0.0075 | 8.501 | 0.41 | 3 | 20 | organic cation transport |
| GO:0032493 | 0.0082 | 19.2237 | 0.1435 | 2 | 7 | response to bacterial lipoprotein |
| GO:0042538 | 0.0082 | 19.2237 | 0.1435 | 2 | 7 | hyperosmotic salinity response |
| GO:0046598 | 0.0082 | 19.2237 | 0.1435 | 2 | 7 | positive regulation of viral entry into host cell |
| GO:0097011 | 0.0082 | 19.2237 | 0.1435 | 2 | 7 | cellular response to granulocyte macrophage colony-stimulating factor stimulus |
| GO:0009074 | 0.0086 | 8.0282 | 0.4305 | 3 | 21 | aromatic amino acid family catabolic process |
| GO:0002250 | 0.009 | 2.1466 | 6.8271 | 14 | 333 | adaptive immune response |
| GO:0043410 | 0.0091 | 1.84 | 11.9525 | 21 | 583 | positive regulation of MAPK cascade |
| GO:0051716 | 0.0096 | 1.3104 | 137.8536 | 159 | 6724 | cellular response to stimulus |
| GO:0030098 | 0.0097 | 2.1975 | 6.1915 | 13 | 302 | lymphocyte differentiation |
| GO:0002429 | 0.0099 | 2.1897 | 6.212 | 13 | 303 | immune response-activating cell surface receptor signaling pathway |
| GO:0032088 | 0.01 | 4.0969 | 1.3121 | 5 | 64 | negative regulation of NF-kappaB transcription factor activity |
| GOMFID | Pvalue | OddsRatio | ExpCount | Count | Size | Term |
| GO:0009611 | 1e-04 | 2.2769 | 15.3434 | 32 | 877 | response to wounding |
| GO:0002263 | 1e-04 | 3.8632 | 3.6547 | 13 | 205 | cell activation involved in immune response |
| GO:0001816 | 1e-04 | 2.4437 | 11.0531 | 25 | 620 | cytokine production |
| GO:0050865 | 2e-04 | 2.6261 | 8.1829 | 20 | 459 | regulation of cell activation |
| GO:0018003 | 3e-04 | Inf | 0.0357 | 2 | 2 | peptidyl-lysine N6-acetylation |
| GO:0030856 | 4e-04 | 4.4607 | 2.1928 | 9 | 123 | regulation of epithelial cell differentiation |
| GO:0002682 | 5e-04 | 1.822 | 26.3135 | 44 | 1476 | regulation of immune system process |
| GO:0002520 | 5e-04 | 2.112 | 14.2442 | 28 | 799 | immune system development |
| GO:0043372 | 6e-04 | 12.4058 | 0.3922 | 4 | 22 | positive regulation of CD4-positive, alpha-beta T cell differentiation |
| GO:0009607 | 6e-04 | 2.007 | 16.6153 | 31 | 932 | response to biotic stimulus |
| GO:0043303 | 7e-04 | 7.9953 | 0.7131 | 5 | 40 | mast cell degranulation |
| GO:1902105 | 9e-04 | 3.1236 | 4.1003 | 12 | 230 | regulation of leukocyte differentiation |
| GO:0007596 | 9e-04 | 2.2833 | 9.8052 | 21 | 550 | blood coagulation |
| GO:0019065 | 9e-04 | 110.9712 | 0.0535 | 2 | 3 | receptor-mediated endocytosis of virus by host cell |
| GO:0034112 | 9e-04 | 3.2967 | 3.5655 | 11 | 200 | positive regulation of homotypic cell-cell adhesion |
| GO:0002250 | 0.001 | 2.6892 | 5.9366 | 15 | 333 | adaptive immune response |
| GO:1903039 | 0.001 | 3.2617 | 3.6012 | 11 | 202 | positive regulation of leukocyte cell-cell adhesion |
| GO:0042102 | 0.0011 | 4.798 | 1.5867 | 7 | 89 | positive regulation of T cell proliferation |
| GO:0045597 | 0.0011 | 2.0924 | 12.7638 | 25 | 728 | positive regulation of cell differentiation |
| GO:0002285 | 0.0011 | 3.7616 | 2.5672 | 9 | 144 | lymphocyte activation involved in immune response |
| GO:0050871 | 0.0011 | 5.608 | 1.1766 | 6 | 66 | positive regulation of B cell activation |
| GO:0002696 | 0.0014 | 2.818 | 4.9026 | 13 | 275 | positive regulation of leukocyte activation |
| GO:0002376 | 0.0014 | 2.128 | 11.6131 | 23 | 714 | immune system process |
| GO:0051707 | 0.0014 | 1.9402 | 15.9735 | 29 | 896 | response to other organism |
| GO:0019372 | 0.0014 | 16.696 | 0.2318 | 3 | 13 | lipoxygenase pathway |
| GO:0032823 | 0.0014 | 16.696 | 0.2318 | 3 | 13 | regulation of natural killer cell differentiation |
| GO:0050793 | 0.0016 | 1.6195 | 37.0457 | 55 | 2078 | regulation of developmental process |
| GO:0002699 | 0.0016 | 3.5746 | 2.692 | 9 | 151 | positive regulation of immune effector process |
| GO:0045087 | 0.0016 | 1.8443 | 19.1647 | 33 | 1075 | innate immune response |
| GO:0032946 | 0.0016 | 3.9159 | 2.1928 | 8 | 123 | positive regulation of mononuclear cell proliferation |
| GO:0050863 | 0.0017 | 2.7434 | 5.0274 | 13 | 282 | regulation of T cell activation |
| GO:0050878 | 0.0017 | 2.0456 | 12.4793 | 24 | 700 | regulation of body fluid levels |
| GO:0048856 | 0.0017 | 1.4516 | 88.5496 | 112 | 4967 | anatomical structure development |
| GO:0032252 | 0.0019 | 55.482 | 0.0713 | 2 | 4 | secretory granule localization |
| GO:0070668 | 0.0019 | 55.482 | 0.0713 | 2 | 4 | positive regulation of mast cell proliferation |
| GO:0002444 | 0.002 | 4.9457 | 1.3192 | 6 | 74 | myeloid leukocyte mediated immunity |
| GO:0045576 | 0.0021 | 6.0791 | 0.9092 | 5 | 51 | mast cell activation |
| GO:0006897 | 0.0021 | 2.1171 | 10.5183 | 21 | 590 | endocytosis |
| GO:0045603 | 0.0022 | 13.9116 | 0.2674 | 3 | 15 | positive regulation of endothelial cell differentiation |
| GO:0030101 | 0.0025 | 4.7358 | 1.3727 | 6 | 77 | natural killer cell activation |
| GO:0045785 | 0.0026 | 2.417 | 6.5606 | 15 | 368 | positive regulation of cell adhesion |
| GO:0033622 | 0.0026 | 12.8406 | 0.2852 | 3 | 16 | integrin activation |
| GO:0042742 | 0.0027 | 2.866 | 4.0647 | 11 | 228 | defense response to bacterium |
| GO:0045639 | 0.0027 | 4.6697 | 1.3906 | 6 | 78 | positive regulation of myeloid cell differentiation |
| GO:0006911 | 0.0027 | 7.6947 | 0.5883 | 4 | 33 | phagocytosis, engulfment |
| GO:0045621 | 0.003 | 4.5429 | 1.4262 | 6 | 80 | positive regulation of lymphocyte differentiation |
| GO:0006952 | 0.003 | 2.0172 | 11.5979 | 22 | 687 | defense response |
| GO:0045588 | 0.0031 | 36.9856 | 0.0891 | 2 | 5 | positive regulation of gamma-delta T cell differentiation |
| GO:0051122 | 0.0031 | 36.9856 | 0.0891 | 2 | 5 | hepoxilin biosynthetic process |
| GO:0070663 | 0.0031 | 2.9859 | 3.5477 | 10 | 199 | regulation of leukocyte proliferation |
| GO:0007597 | 0.0032 | 11.9226 | 0.3031 | 3 | 17 | blood coagulation, intrinsic pathway |
| GO:0022407 | 0.0032 | 2.3555 | 6.721 | 15 | 377 | regulation of cell-cell adhesion |
| GO:0003158 | 0.0034 | 3.8522 | 1.9432 | 7 | 109 | endothelium development |
| GO:0006525 | 0.0038 | 11.1271 | 0.3209 | 3 | 18 | arginine metabolic process |
| GO:1901741 | 0.0038 | 11.1271 | 0.3209 | 3 | 18 | positive regulation of myoblast fusion |
| GO:2000514 | 0.0041 | 6.7602 | 0.6596 | 4 | 37 | regulation of CD4-positive, alpha-beta T cell activation |
| GO:0060836 | 0.0045 | 27.7374 | 0.107 | 2 | 6 | lymphatic endothelial cell differentiation |
| GO:0070383 | 0.0045 | 27.7374 | 0.107 | 2 | 6 | DNA cytosine deamination |
| GO:0050727 | 0.0046 | 2.5325 | 4.9917 | 12 | 280 | regulation of inflammatory response |
| GO:0048583 | 0.0047 | 1.4355 | 63.0383 | 82 | 3536 | regulation of response to stimulus |
| GO:0050715 | 0.0047 | 4.1261 | 1.5584 | 6 | 88 | positive regulation of cytokine secretion |
| GO:0006833 | 0.005 | 6.3731 | 0.6953 | 4 | 39 | water transport |
| GO:0015695 | 0.0051 | 9.8167 | 0.3566 | 3 | 20 | organic cation transport |
| GO:0002573 | 0.0054 | 2.9281 | 3.2446 | 9 | 182 | myeloid leukocyte differentiation |
| GO:0032103 | 0.0057 | 2.4578 | 5.1343 | 12 | 288 | positive regulation of response to external stimulus |
| GO:0002275 | 0.006 | 4.6564 | 1.1588 | 5 | 65 | myeloid cell activation involved in immune response |
| GO:0015840 | 0.0063 | 22.1885 | 0.1248 | 2 | 7 | urea transport |
| GO:0035360 | 0.0063 | 22.1885 | 0.1248 | 2 | 7 | positive regulation of peroxisome proliferator activated receptor signaling pathway |
| GO:0045630 | 0.0063 | 22.1885 | 0.1248 | 2 | 7 | positive regulation of T-helper 2 cell differentiation |
| GO:0046010 | 0.0063 | 22.1885 | 0.1248 | 2 | 7 | positive regulation of circadian sleep/wake cycle, non-REM sleep |
| GO:0097011 | 0.0063 | 22.1885 | 0.1248 | 2 | 7 | cellular response to granulocyte macrophage colony-stimulating factor stimulus |
| GO:2001300 | 0.0063 | 22.1885 | 0.1248 | 2 | 7 | lipoxin metabolic process |
| GO:0030097 | 0.0067 | 1.9693 | 10.1481 | 19 | 579 | hemopoiesis |
| GO:0071731 | 0.0067 | 8.7823 | 0.3922 | 3 | 22 | response to nitric oxide |
| GO:0050670 | 0.0071 | 2.7972 | 3.3872 | 9 | 190 | regulation of lymphocyte proliferation |
| GO:0045577 | 0.0076 | 8.3426 | 0.41 | 3 | 23 | regulation of B cell differentiation |
| GO:0050718 | 0.0076 | 8.3426 | 0.41 | 3 | 23 | positive regulation of interleukin-1 beta secretion |
| GO:0002294 | 0.0077 | 5.5746 | 0.7844 | 4 | 44 | CD4-positive, alpha-beta T cell differentiation involved in immune response |
| GO:0098602 | 0.0079 | 1.8147 | 13.335 | 23 | 748 | single organism cell adhesion |
| GO:1903036 | 0.008 | 2.9555 | 2.8524 | 8 | 160 | positive regulation of response to wounding |
| GO:0032680 | 0.0082 | 3.6498 | 1.7471 | 6 | 98 | regulation of tumor necrosis factor production |
| GO:0051240 | 0.0082 | 1.5941 | 24.6377 | 37 | 1382 | positive regulation of multicellular organismal process |
| GO:0001955 | 0.0083 | 18.4892 | 0.1426 | 2 | 8 | blood vessel maturation |
| GO:0007343 | 0.0083 | 18.4892 | 0.1426 | 2 | 8 | egg activation |
| GO:0019740 | 0.0083 | 18.4892 | 0.1426 | 2 | 8 | nitrogen utilization |
| GO:0060534 | 0.0083 | 18.4892 | 0.1426 | 2 | 8 | trachea cartilage development |
| GO:0061085 | 0.0083 | 18.4892 | 0.1426 | 2 | 8 | regulation of histone H3-K27 methylation |
| GO:0071447 | 0.0083 | 18.4892 | 0.1426 | 2 | 8 | cellular response to hydroperoxide |
| GO:0072672 | 0.0083 | 18.4892 | 0.1426 | 2 | 8 | neutrophil extravasation |
| GO:1902715 | 0.0083 | 18.4892 | 0.1426 | 2 | 8 | positive regulation of interferon-gamma secretion |
| GO:2000270 | 0.0083 | 18.4892 | 0.1426 | 2 | 8 | negative regulation of fibroblast apoptotic process |
| GO:0002287 | 0.0083 | 5.4383 | 0.8022 | 4 | 45 | alpha-beta T cell activation involved in immune response |
| GO:0046637 | 0.0083 | 5.4383 | 0.8022 | 4 | 45 | regulation of alpha-beta T cell differentiation |
| GO:0032675 | 0.0086 | 3.6103 | 1.7649 | 6 | 99 | regulation of interleukin-6 production |
| GO:1903707 | 0.0087 | 3.1901 | 2.3176 | 7 | 130 | negative regulation of hemopoiesis |
| GO:0050778 | 0.0088 | 1.878 | 11.1779 | 20 | 627 | positive regulation of immune response |
| GO:0045622 | 0.0096 | 7.5832 | 0.4457 | 3 | 25 | regulation of T-helper cell differentiation |
| GO:0045730 | 0.0096 | 7.5832 | 0.4457 | 3 | 25 | respiratory burst |
| GO:0031295 | 0.0097 | 4.1064 | 1.3014 | 5 | 73 | T cell costimulation |
| GO:0016477 | 0.0098 | 1.6262 | 20.787 | 32 | 1166 | cell migration |
| GOMFID | Pvalue | OddsRatio | ExpCount | Count | Size | Term |
| GO:0007186 | 0 | 3.0672 | 14.8159 | 39 | 1071 | G-protein coupled receptor signaling pathway |
| GO:0009593 | 0 | 4.0573 | 6.3883 | 23 | 454 | detection of chemical stimulus |
| GO:0050906 | 0 | 3.9351 | 6.5712 | 23 | 467 | detection of stimulus involved in sensory perception |
| GO:0050911 | 0 | 4.2654 | 5.2485 | 20 | 373 | detection of chemical stimulus involved in sensory perception of smell |
| GO:0007606 | 0 | 3.7364 | 6.5712 | 22 | 467 | sensory perception of chemical stimulus |
| GO:0050877 | 0 | 2.3569 | 17.1245 | 36 | 1217 | neurological system process |
| GO:0018003 | 2e-04 | Inf | 0.0281 | 2 | 2 | peptidyl-lysine N6-acetylation |
| GO:0097039 | 0.0019 | 47.1294 | 0.0704 | 2 | 5 | protein linear polyubiquitination |
| GO:0070286 | 0.003 | 11.8249 | 0.2955 | 3 | 21 | axonemal dynein complex assembly |
| GO:0009913 | 0.0044 | 3.2858 | 2.575 | 8 | 183 | epidermal cell differentiation |
| GO:0031424 | 0.0049 | 6.3246 | 0.6895 | 4 | 49 | keratinization |
| GO:0007156 | 0.0056 | 3.4848 | 2.1247 | 7 | 151 | homophilic cell adhesion via plasma membrane adhesion molecules |
| GO:0008542 | 0.0061 | 5.9282 | 0.7317 | 4 | 52 | visual learning |
| GO:0031943 | 0.0066 | 20.1931 | 0.1266 | 2 | 9 | regulation of glucocorticoid metabolic process |
| GO:0007218 | 0.0096 | 4.097 | 1.2945 | 5 | 92 | neuropeptide signaling pathway |
| GO:0048703 | 0.01 | 15.7037 | 0.1548 | 2 | 11 | embryonic viscerocranium morphogenesis |
| GOMFID | Pvalue | OddsRatio | ExpCount | Count | Size | Term |
| GO:0051094 | 3e-04 | 2.1763 | 14.6186 | 29 | 1120 | positive regulation of developmental process |
| GO:0001878 | 6e-04 | 23.0064 | 0.1697 | 3 | 13 | response to yeast |
| GO:0006063 | 6e-04 | 11.8446 | 0.3916 | 4 | 30 | uronic acid metabolic process |
| GO:0043305 | 0.0017 | 50.8966 | 0.0653 | 2 | 5 | negative regulation of mast cell degranulation |
| GO:0051240 | 0.002 | 1.866 | 18.0383 | 31 | 1382 | positive regulation of multicellular organismal process |
| GO:0050858 | 0.0021 | 13.5271 | 0.261 | 3 | 20 | negative regulation of antigen receptor-mediated signaling pathway |
| GO:0071248 | 0.0022 | 4.148 | 1.8012 | 7 | 138 | cellular response to metal ion |
| GO:2000107 | 0.0028 | 7.5039 | 0.5874 | 4 | 45 | negative regulation of leukocyte apoptotic process |
| GO:0044708 | 0.0034 | 2.5238 | 5.4559 | 13 | 418 | single-organism behavior |
| GO:0046635 | 0.0035 | 6.991 | 0.6265 | 4 | 48 | positive regulation of alpha-beta T cell activation |
| GO:0001556 | 0.0036 | 10.9477 | 0.3133 | 3 | 24 | oocyte maturation |
| GO:0052695 | 0.0041 | 10.4494 | 0.3263 | 3 | 25 | cellular glucuronidation |
| GO:0035234 | 0.0045 | 25.4433 | 0.1044 | 2 | 8 | ectopic germ cell programmed cell death |
| GO:0046007 | 0.0045 | 25.4433 | 0.1044 | 2 | 8 | negative regulation of activated T cell proliferation |
| GO:1902715 | 0.0045 | 25.4433 | 0.1044 | 2 | 8 | positive regulation of interferon-gamma secretion |
| GO:0008344 | 0.0048 | 4.8804 | 1.0964 | 5 | 84 | adult locomotory behavior |
| GO:0002507 | 0.0051 | 9.5774 | 0.3524 | 3 | 27 | tolerance induction |
| GO:0010388 | 0.0057 | 21.8072 | 0.1175 | 2 | 9 | cullin deneddylation |
| GO:0019732 | 0.0057 | 21.8072 | 0.1175 | 2 | 9 | antifungal humoral response |
| GO:0033004 | 0.0057 | 21.8072 | 0.1175 | 2 | 9 | negative regulation of mast cell activation |
| GO:0009072 | 0.0062 | 8.8395 | 0.3785 | 3 | 29 | aromatic amino acid family metabolic process |
| GO:0010226 | 0.0062 | 8.8395 | 0.3785 | 3 | 29 | response to lithium ion |
| GO:1902107 | 0.0064 | 3.8324 | 1.6576 | 6 | 127 | positive regulation of leukocyte differentiation |
| GO:2000026 | 0.007 | 1.6854 | 20.4269 | 32 | 1565 | regulation of multicellular organismal development |
| GO:0006703 | 0.0071 | 19.08 | 0.1305 | 2 | 10 | estrogen biosynthetic process |
| GO:0050808 | 0.0073 | 3.0004 | 2.8063 | 8 | 215 | synapse organization |
| GO:0046395 | 0.0086 | 2.9147 | 2.8846 | 8 | 221 | carboxylic acid catabolic process |
| GO:0050907 | 0.0086 | 2.3234 | 5.4298 | 12 | 416 | detection of chemical stimulus involved in sensory perception |
| GO:0070129 | 0.0086 | 16.9589 | 0.1436 | 2 | 11 | regulation of mitochondrial translation |
| GO:0042181 | 0.009 | 7.6589 | 0.4307 | 3 | 33 | ketone biosynthetic process |
| GO:0007186 | 0.0094 | 1.753 | 15.1799 | 25 | 1163 | G-protein coupled receptor signaling pathway |
| GOMFID | Pvalue | OddsRatio | ExpCount | Count | Size | Term |
| GO:0001956 | 1e-04 | 24.2539 | 0.2453 | 4 | 12 | positive regulation of neurotransmitter secretion |
| GO:0070458 | 0.0012 | 96.4514 | 0.0613 | 2 | 3 | cellular detoxification of nitrogen compound |
| GO:0010935 | 0.0021 | 14.5047 | 0.2657 | 3 | 13 | regulation of macrophage cytokine production |
| GO:1902803 | 0.0024 | 8.0762 | 0.5723 | 4 | 28 | regulation of synaptic vesicle transport |
| GO:0018916 | 0.0024 | 48.2226 | 0.0818 | 2 | 4 | nitrobenzene metabolic process |
| GO:0060686 | 0.0024 | 48.2226 | 0.0818 | 2 | 4 | negative regulation of prostatic bud formation |
| GO:0060903 | 0.0024 | 48.2226 | 0.0818 | 2 | 4 | positive regulation of meiosis I |
| GO:0051446 | 0.0032 | 12.0857 | 0.3066 | 3 | 15 | positive regulation of meiotic cell cycle |
| GO:0010807 | 0.004 | 32.1463 | 0.1022 | 2 | 5 | regulation of synaptic vesicle priming |
| GO:0042760 | 0.004 | 32.1463 | 0.1022 | 2 | 5 | very long-chain fatty acid catabolic process |
| GO:0050852 | 0.005 | 2.9698 | 3.2088 | 9 | 157 | T cell receptor signaling pathway |
| GO:0000966 | 0.0059 | 24.1082 | 0.1226 | 2 | 6 | RNA 5'-end processing |
| GO:2000617 | 0.0059 | 24.1082 | 0.1226 | 2 | 6 | positive regulation of histone H3-K9 acetylation |
| GO:0002318 | 0.0082 | 19.2853 | 0.1431 | 2 | 7 | myeloid progenitor cell differentiation |
| GO:1902474 | 0.0082 | 19.2853 | 0.1431 | 2 | 7 | positive regulation of protein localization to synapse |
| GO:0061082 | 0.0098 | 7.6296 | 0.4496 | 3 | 22 | myeloid leukocyte cytokine production |
| GO:0006521 | 0.0099 | 4.1102 | 1.308 | 5 | 64 | regulation of cellular amino acid metabolic process |
| GOMFID | Pvalue | OddsRatio | ExpCount | Count | Size | Term |
| GO:0032496 | 2e-04 | 3.9292 | 3.031 | 11 | 166 | response to lipopolysaccharide |
| GO:0071550 | 5e-04 | 26.6574 | 0.1673 | 3 | 9 | death-inducing signaling complex assembly |
| GO:0035999 | 7e-04 | 22.8478 | 0.1859 | 3 | 10 | tetrahydrofolate interconversion |
| GO:0001556 | 9e-04 | 10.6903 | 0.4462 | 4 | 24 | oocyte maturation |
| GO:0043207 | 0.0013 | 1.9236 | 16.6581 | 30 | 896 | response to external biotic stimulus |
| GO:0010038 | 0.0015 | 2.5707 | 6.191 | 15 | 333 | response to metal ion |
| GO:0019934 | 0.0016 | 15.9903 | 0.2417 | 3 | 13 | cGMP-mediated signaling |
| GO:0009611 | 0.0017 | 1.8307 | 19.2609 | 33 | 1036 | response to wounding |
| GO:0009617 | 0.002 | 2.1708 | 9.7606 | 20 | 525 | response to bacterium |
| GO:0002573 | 0.0022 | 3.1424 | 3.3837 | 10 | 182 | myeloid leukocyte differentiation |
| GO:0050727 | 0.0023 | 2.6433 | 5.2057 | 13 | 280 | regulation of inflammatory response |
| GO:0050860 | 0.003 | 12.2978 | 0.2975 | 3 | 16 | negative regulation of T cell receptor signaling pathway |
| GO:0042092 | 0.0031 | 7.3683 | 0.6135 | 4 | 33 | type 2 immune response |
| GO:0036462 | 0.0033 | 35.4276 | 0.093 | 2 | 5 | TRAIL-activated apoptotic signaling pathway |
| GO:0014829 | 0.0036 | 11.4187 | 0.3161 | 3 | 17 | vascular smooth muscle contraction |
| GO:1902041 | 0.0038 | 5.248 | 1.0411 | 5 | 56 | regulation of extrinsic apoptotic signaling pathway via death domain receptors |
| GO:0030817 | 0.0038 | 3.7613 | 1.9893 | 7 | 107 | regulation of cAMP biosynthetic process |
| GO:0021700 | 0.0043 | 2.6788 | 4.3318 | 11 | 233 | developmental maturation |
| GO:0043123 | 0.0044 | 3.0319 | 3.142 | 9 | 169 | positive regulation of I-kappaB kinase/NF-kappaB signaling |
| GO:0014070 | 0.0044 | 1.7761 | 17.2902 | 29 | 930 | response to organic cyclic compound |
| GO:0086073 | 0.0049 | 26.569 | 0.1115 | 2 | 6 | bundle of His cell-Purkinje myocyte adhesion involved in cell communication |
| GO:0006140 | 0.0049 | 2.782 | 3.7927 | 10 | 204 | regulation of nucleotide metabolic process |
| GO:0009067 | 0.0049 | 9.9901 | 0.3532 | 3 | 19 | aspartate family amino acid biosynthetic process |
| GO:0045936 | 0.0055 | 2.0094 | 9.9465 | 19 | 535 | negative regulation of phosphate metabolic process |
| GO:0031649 | 0.0057 | 9.4018 | 0.3718 | 3 | 20 | heat generation |
| GO:0045649 | 0.0057 | 9.4018 | 0.3718 | 3 | 20 | regulation of macrophage differentiation |
| GO:0046058 | 0.0062 | 3.0956 | 2.733 | 8 | 147 | cAMP metabolic process |
| GO:0052652 | 0.0062 | 3.0956 | 2.733 | 8 | 147 | cyclic purine nucleotide metabolic process |
| GO:0006919 | 0.0063 | 3.8751 | 1.6547 | 6 | 89 | activation of cysteine-type endopeptidase activity involved in apoptotic process |
| GO:0042347 | 0.0066 | 8.8789 | 0.3904 | 3 | 21 | negative regulation of NF-kappaB import into nucleus |
| GO:1900543 | 0.0067 | 4.534 | 1.1899 | 5 | 64 | negative regulation of purine nucleotide metabolic process |
| GO:0042048 | 0.0068 | 21.2538 | 0.1301 | 2 | 7 | olfactory behavior |
| GO:0045630 | 0.0068 | 21.2538 | 0.1301 | 2 | 7 | positive regulation of T-helper 2 cell differentiation |
| GO:1900165 | 0.0068 | 21.2538 | 0.1301 | 2 | 7 | negative regulation of interleukin-6 secretion |
| GO:1903430 | 0.0068 | 21.2538 | 0.1301 | 2 | 7 | negative regulation of cell maturation |
| GO:0006952 | 0.0069 | 1.5323 | 32.7584 | 47 | 1762 | defense response |
| GO:0007156 | 0.0073 | 3.0082 | 2.8073 | 8 | 151 | homophilic cell adhesion via plasma membrane adhesion molecules |
| GO:0031638 | 0.0075 | 3.2964 | 2.2496 | 7 | 121 | zymogen activation |
| GO:0071222 | 0.0076 | 2.9871 | 2.8259 | 8 | 152 | cellular response to lipopolysaccharide |
| GO:0030500 | 0.0076 | 4.3848 | 1.227 | 5 | 66 | regulation of bone mineralization |
| GO:0032103 | 0.0078 | 2.3506 | 5.3544 | 12 | 288 | positive regulation of response to external stimulus |
| GO:0050794 | 0.0086 | 1.3582 | 180.097 | 200 | 9687 | regulation of cellular process |
| GO:0007189 | 0.0086 | 4.2451 | 1.2642 | 5 | 68 | adenylate cyclase-activating G-protein coupled receptor signaling pathway |
| GO:0032817 | 0.009 | 17.7103 | 0.1487 | 2 | 8 | regulation of natural killer cell proliferation |
| GO:0060312 | 0.009 | 17.7103 | 0.1487 | 2 | 8 | regulation of blood vessel remodeling |
| GO:0071241 | 0.0095 | 2.8665 | 2.9375 | 8 | 158 | cellular response to inorganic substance |
| GO:0007620 | 0.0096 | 7.609 | 0.4462 | 3 | 24 | copulation |
| GOMFID | Pvalue | OddsRatio | ExpCount | Count | Size | Term |
| GO:0001956 | 1e-04 | 20.4813 | 0.2888 | 4 | 12 | positive regulation of neurotransmitter secretion |
| GO:0002429 | 4e-04 | 2.6391 | 7.2924 | 18 | 303 | immune response-activating cell surface receptor signaling pathway |
| GO:0001773 | 0.0011 | 7.3248 | 0.7942 | 5 | 33 | myeloid dendritic cell activation |
| GO:0042178 | 0.0015 | 17.5097 | 0.2407 | 3 | 10 | xenobiotic catabolic process |
| GO:0046271 | 0.0017 | 81.5266 | 0.0722 | 2 | 3 | phenylpropanoid catabolic process |
| GO:0070340 | 0.0017 | 81.5266 | 0.0722 | 2 | 3 | detection of bacterial lipopeptide |
| GO:0070458 | 0.0017 | 81.5266 | 0.0722 | 2 | 3 | cellular detoxification of nitrogen compound |
| GO:0046164 | 0.0018 | 5.1344 | 1.2996 | 6 | 54 | alcohol catabolic process |
| GO:0032490 | 0.002 | 15.32 | 0.2647 | 3 | 11 | detection of molecule of bacterial origin |
| GO:1900409 | 0.002 | 15.32 | 0.2647 | 3 | 11 | positive regulation of cellular response to oxidative stress |
| GO:0002253 | 0.002 | 2.0437 | 11.8892 | 23 | 494 | activation of immune response |
| GO:0050707 | 0.0026 | 3.0812 | 3.4657 | 10 | 144 | regulation of cytokine secretion |
| GO:0009595 | 0.0032 | 7.4409 | 0.6257 | 4 | 26 | detection of biotic stimulus |
| GO:0010935 | 0.0033 | 12.2544 | 0.3129 | 3 | 13 | regulation of macrophage cytokine production |
| GO:0048172 | 0.0033 | 12.2544 | 0.3129 | 3 | 13 | regulation of short-term neuronal synaptic plasticity |
| GO:0018916 | 0.0034 | 40.7606 | 0.0963 | 2 | 4 | nitrobenzene metabolic process |
| GO:0042699 | 0.0034 | 40.7606 | 0.0963 | 2 | 4 | follicle-stimulating hormone signaling pathway |
| GO:1901033 | 0.0034 | 40.7606 | 0.0963 | 2 | 4 | positive regulation of response to reactive oxygen species |
| GO:0002764 | 0.0038 | 1.8549 | 14.7532 | 26 | 613 | immune response-regulating signaling pathway |
| GO:1902803 | 0.0043 | 6.82 | 0.6739 | 4 | 28 | regulation of synaptic vesicle transport |
| GO:0006521 | 0.0043 | 4.2464 | 1.5403 | 6 | 64 | regulation of cellular amino acid metabolic process |
| GO:0050852 | 0.0047 | 2.8063 | 3.7786 | 10 | 157 | T cell receptor signaling pathway |
| GO:0001935 | 0.0048 | 3.2597 | 2.6233 | 8 | 109 | endothelial cell proliferation |
| GO:0050855 | 0.0051 | 10.2107 | 0.361 | 3 | 15 | regulation of B cell receptor signaling pathway |
| GO:0006068 | 0.0055 | 27.172 | 0.1203 | 2 | 5 | ethanol catabolic process |
| GO:0010807 | 0.0055 | 27.172 | 0.1203 | 2 | 5 | regulation of synaptic vesicle priming |
| GO:0042256 | 0.0055 | 27.172 | 0.1203 | 2 | 5 | mature ribosome assembly |
| GO:0042760 | 0.0055 | 27.172 | 0.1203 | 2 | 5 | very long-chain fatty acid catabolic process |
| GO:0048680 | 0.0055 | 27.172 | 0.1203 | 2 | 5 | positive regulation of axon regeneration |
| GO:1900227 | 0.0055 | 27.172 | 0.1203 | 2 | 5 | positive regulation of NLRP3 inflammasome complex assembly |
| GO:0030219 | 0.0063 | 4.6563 | 1.1793 | 5 | 49 | megakaryocyte differentiation |
| GO:0016045 | 0.0073 | 8.7509 | 0.4091 | 3 | 17 | detection of bacterium |
| GO:0051084 | 0.0075 | 4.4533 | 1.2274 | 5 | 51 | 'de novo' posttranslational protein folding |
| GO:0032715 | 0.0078 | 5.6423 | 0.7942 | 4 | 33 | negative regulation of interleukin-6 production |
| GO:0001755 | 0.0081 | 4.3583 | 1.2515 | 5 | 52 | neural crest cell migration |
| GO:0071221 | 0.0081 | 20.3777 | 0.1444 | 2 | 6 | cellular response to bacterial lipopeptide |
| GO:0019373 | 0.0086 | 8.1669 | 0.4332 | 3 | 18 | epoxygenase P450 pathway |
| GO:0042762 | 0.0086 | 8.1669 | 0.4332 | 3 | 18 | regulation of sulfur metabolic process |
| GO:0000165 | 0.0096 | 1.6331 | 19.8795 | 31 | 826 | MAPK cascade |
| GO:0006954 | 0.0099 | 1.7265 | 15.1383 | 25 | 629 | inflammatory response |
| GOMFID | Pvalue | OddsRatio | ExpCount | Count | Size | Term |
| GO:0002713 | 8e-04 | 22.8586 | 0.1943 | 3 | 9 | negative regulation of B cell mediated immunity |
| GO:0070340 | 0.0014 | 91.1929 | 0.0648 | 2 | 3 | detection of bacterial lipopeptide |
| GO:0006805 | 0.0023 | 2.9283 | 3.9931 | 11 | 185 | xenobiotic metabolic process |
| GO:0009410 | 0.0035 | 2.7673 | 4.2089 | 11 | 195 | response to xenobiotic stimulus |
| GO:0014048 | 0.0037 | 11.4249 | 0.3238 | 3 | 15 | regulation of glutamate secretion |
| GO:0008380 | 0.0042 | 2.216 | 7.5976 | 16 | 352 | RNA splicing |
| GO:0006068 | 0.0044 | 30.3937 | 0.1079 | 2 | 5 | ethanol catabolic process |
| GO:0042760 | 0.0044 | 30.3937 | 0.1079 | 2 | 5 | very long-chain fatty acid catabolic process |
| GO:0016045 | 0.0054 | 9.7915 | 0.3669 | 3 | 17 | detection of bacterium |
| GO:0045408 | 0.0054 | 9.7915 | 0.3669 | 3 | 17 | regulation of interleukin-6 biosynthetic process |
| GO:0002820 | 0.0059 | 6.1043 | 0.7339 | 4 | 34 | negative regulation of adaptive immune response |
| GO:0043331 | 0.0063 | 3.8817 | 1.662 | 6 | 77 | response to dsRNA |
| GO:0000966 | 0.0066 | 22.7938 | 0.1295 | 2 | 6 | RNA 5'-end processing |
| GO:0002924 | 0.0066 | 22.7938 | 0.1295 | 2 | 6 | negative regulation of humoral immune response mediated by circulating immunoglobulin |
| GO:0071221 | 0.0066 | 22.7938 | 0.1295 | 2 | 6 | cellular response to bacterial lipopeptide |
| GO:2000617 | 0.0066 | 22.7938 | 0.1295 | 2 | 6 | positive regulation of histone H3-K9 acetylation |
| GO:0006595 | 0.0068 | 3.8276 | 1.6836 | 6 | 78 | polyamine metabolic process |
| GO:0090630 | 0.0073 | 5.722 | 0.777 | 4 | 36 | activation of GTPase activity |
| GO:0032635 | 0.0077 | 3.2851 | 2.2663 | 7 | 105 | interleukin-6 production |
| GO:0007033 | 0.009 | 2.9003 | 2.9139 | 8 | 135 | vacuole organization |
| GO:0032493 | 0.0091 | 18.2338 | 0.1511 | 2 | 7 | response to bacterial lipoprotein |
| GO:0039702 | 0.0099 | 7.6136 | 0.4533 | 3 | 21 | viral budding via host ESCRT complex |
| GOMFID | Pvalue | OddsRatio | ExpCount | Count | Size | Term |
| GO:0010771 | 9e-04 | 4.3488 | 1.9918 | 8 | 109 | negative regulation of cell morphogenesis involved in differentiation |
| GO:0010226 | 0.0018 | 8.7033 | 0.5299 | 4 | 29 | response to lithium ion |
| GO:0007156 | 0.0018 | 3.483 | 2.7593 | 9 | 151 | homophilic cell adhesion via plasma membrane adhesion molecules |
| GO:0030335 | 0.0019 | 2.4147 | 7.0169 | 16 | 384 | positive regulation of cell migration |
| GO:2001187 | 0.0019 | 54.0947 | 0.0731 | 2 | 4 | positive regulation of CD8-positive, alpha-beta T cell activation |
| GO:0007267 | 0.0024 | 1.7613 | 21.2335 | 35 | 1162 | cell-cell signaling |
| GO:0035023 | 0.0027 | 4.0326 | 1.8639 | 7 | 102 | regulation of Rho protein signal transduction |
| GO:0007155 | 0.0029 | 1.6795 | 25.5095 | 40 | 1396 | cell adhesion |
| GO:0061302 | 0.0032 | 36.0608 | 0.0914 | 2 | 5 | smooth muscle cell-matrix adhesion |
| GO:0014909 | 0.0032 | 5.45 | 1.005 | 5 | 55 | smooth muscle cell migration |
| GO:2000145 | 0.0034 | 1.9575 | 12.4258 | 23 | 680 | regulation of cell motility |
| GO:0051272 | 0.0034 | 2.2692 | 7.4372 | 16 | 407 | positive regulation of cellular component movement |
| GO:2000503 | 0.0048 | 27.0439 | 0.1096 | 2 | 6 | positive regulation of natural killer cell chemotaxis |
| GO:0051093 | 0.005 | 1.8405 | 14.3445 | 25 | 785 | negative regulation of developmental process |
| GO:0002076 | 0.0055 | 9.5704 | 0.3655 | 3 | 20 | osteoblast development |
| GO:0045668 | 0.0059 | 6.0397 | 0.7309 | 4 | 40 | negative regulation of osteoblast differentiation |
| GO:0050921 | 0.0062 | 3.4167 | 2.1745 | 7 | 119 | positive regulation of chemotaxis |
| GO:0048485 | 0.0063 | 9.0381 | 0.3837 | 3 | 21 | sympathetic nervous system development |
| GO:0043615 | 0.0066 | 21.6337 | 0.1279 | 2 | 7 | astrocyte cell migration |
| GO:0051241 | 0.0067 | 1.7197 | 17.8164 | 29 | 975 | negative regulation of multicellular organismal process |
| GO:0045577 | 0.0082 | 8.1333 | 0.4203 | 3 | 23 | regulation of B cell differentiation |
| GO:0030210 | 0.0087 | 18.0269 | 0.1462 | 2 | 8 | heparin biosynthetic process |
| GO:0045617 | 0.0087 | 18.0269 | 0.1462 | 2 | 8 | negative regulation of keratinocyte differentiation |
| GO:0048701 | 0.009 | 5.3014 | 0.8223 | 4 | 45 | embryonic cranial skeleton morphogenesis |
| GOMFID | Pvalue | OddsRatio | ExpCount | Count | Size | Term |
| GO:0071285 | 4e-04 | 14.3599 | 0.3508 | 4 | 19 | cellular response to lithium ion |
| GO:1901623 | 4e-04 | 13.4615 | 0.3693 | 4 | 20 | regulation of lymphocyte chemotaxis |
| GO:0050808 | 7e-04 | 3.2349 | 3.9698 | 12 | 215 | synapse organization |
| GO:0030887 | 0.001 | 107.0486 | 0.0554 | 2 | 3 | positive regulation of myeloid dendritic cell activation |
| GO:2000502 | 0.001 | 107.0486 | 0.0554 | 2 | 3 | negative regulation of natural killer cell chemotaxis |
| GO:0050773 | 0.001 | 4.2176 | 2.0495 | 8 | 111 | regulation of dendrite development |
| GO:0016199 | 0.002 | 53.5208 | 0.0739 | 2 | 4 | axon midline choice point recognition |
| GO:0072592 | 0.002 | 53.5208 | 0.0739 | 2 | 4 | oxygen metabolic process |
| GO:1903977 | 0.002 | 53.5208 | 0.0739 | 2 | 4 | positive regulation of glial cell migration |
| GO:0050922 | 0.002 | 6.1292 | 0.9047 | 5 | 49 | negative regulation of chemotaxis |
| GO:0051963 | 0.0021 | 4.9136 | 1.3294 | 6 | 72 | regulation of synapse assembly |
| GO:0060999 | 0.0021 | 8.2786 | 0.5539 | 4 | 30 | positive regulation of dendritic spine development |
| GO:0051346 | 0.0022 | 2.3812 | 7.1087 | 16 | 385 | negative regulation of hydrolase activity |
| GO:0071697 | 0.0029 | 12.3852 | 0.2954 | 3 | 16 | ectodermal placode morphogenesis |
| GO:0030910 | 0.0033 | 35.6782 | 0.0923 | 2 | 5 | olfactory placode formation |
| GO:0061197 | 0.0033 | 35.6782 | 0.0923 | 2 | 5 | fungiform papilla morphogenesis |
| GO:0071698 | 0.0033 | 35.6782 | 0.0923 | 2 | 5 | olfactory placode development |
| GO:0022604 | 0.0042 | 2.109 | 8.9921 | 18 | 487 | regulation of cell morphogenesis |
| GO:0048640 | 0.0043 | 4.2086 | 1.5325 | 6 | 83 | negative regulation of developmental growth |
| GO:0097070 | 0.0049 | 26.7569 | 0.1108 | 2 | 6 | ductus arteriosus closure |
| GO:0050795 | 0.0054 | 2.5917 | 4.4684 | 11 | 242 | regulation of behavior |
| GO:0033993 | 0.0059 | 1.7547 | 16.8579 | 28 | 913 | response to lipid |
| GO:0010976 | 0.0065 | 2.6632 | 3.9514 | 10 | 214 | positive regulation of neuron projection development |
| GO:0051124 | 0.0067 | 21.4042 | 0.1292 | 2 | 7 | synaptic growth at neuromuscular junction |
| GO:0051823 | 0.0067 | 21.4042 | 0.1292 | 2 | 7 | regulation of synapse structural plasticity |
| GO:0071670 | 0.0067 | 21.4042 | 0.1292 | 2 | 7 | smooth muscle cell chemotaxis |
| GO:2000402 | 0.0067 | 21.4042 | 0.1292 | 2 | 7 | negative regulation of lymphocyte migration |
| GO:0050770 | 0.0076 | 2.9877 | 2.825 | 8 | 153 | regulation of axonogenesis |
| GO:0006975 | 0.0088 | 17.8356 | 0.1477 | 2 | 8 | DNA damage induced protein phosphorylation |
| GO:0010951 | 0.0094 | 2.5132 | 4.1729 | 10 | 226 | negative regulation of endopeptidase activity |
| GO:0060143 | 0.0095 | 7.663 | 0.4431 | 3 | 24 | positive regulation of syncytium formation by plasma membrane fusion |
| GO:0050803 | 0.0097 | 2.5015 | 4.1914 | 10 | 227 | regulation of synapse structure or activity |
| GOMFID | Pvalue | OddsRatio | ExpCount | Count | Size | Term |
| GO:0050896 | 0 | 1.859 | 138.1745 | 178 | 8008 | response to stimulus |
| GO:0019442 | 3e-04 | Inf | 0.0345 | 2 | 2 | tryptophan catabolic process to acetyl-CoA |
| GO:0034103 | 7e-04 | 6.1084 | 1.087 | 6 | 63 | regulation of tissue remodeling |
| GO:0042346 | 8e-04 | 10.9963 | 0.4314 | 4 | 25 | positive regulation of NF-kappaB import into nucleus |
| GO:1902564 | 9e-04 | 114.7509 | 0.0518 | 2 | 3 | negative regulation of neutrophil activation |
| GO:2000504 | 9e-04 | 114.7509 | 0.0518 | 2 | 3 | positive regulation of blood vessel remodeling |
| GO:0002263 | 9e-04 | 3.3238 | 3.5372 | 11 | 205 | cell activation involved in immune response |
| GO:0007166 | 0.0014 | 1.574 | 46.363 | 66 | 2687 | cell surface receptor signaling pathway |
| GO:0002125 | 0.0017 | 57.3717 | 0.069 | 2 | 4 | maternal aggressive behavior |
| GO:0048553 | 0.0017 | 57.3717 | 0.069 | 2 | 4 | negative regulation of metalloenzyme activity |
| GO:0015850 | 0.0017 | 3.038 | 3.8478 | 11 | 223 | organic hydroxy compound transport |
| GO:0044707 | 0.0019 | 1.4415 | 100.456 | 124 | 5822 | single-multicellular organism process |
| GO:0030101 | 0.0021 | 4.8995 | 1.3286 | 6 | 77 | natural killer cell activation |
| GO:0045321 | 0.0023 | 2.0311 | 12.0264 | 23 | 697 | leukocyte activation |
| GO:0006855 | 0.0024 | 13.2796 | 0.2761 | 3 | 16 | drug transmembrane transport |
| GO:0007154 | 0.0027 | 1.4218 | 103.1995 | 126 | 5981 | cell communication |
| GO:0010033 | 0.0027 | 1.5123 | 50.2625 | 69 | 2913 | response to organic substance |
| GO:1904892 | 0.0029 | 3.5536 | 2.3984 | 8 | 139 | regulation of STAT cascade |
| GO:0042908 | 0.0029 | 38.2454 | 0.0863 | 2 | 5 | xenobiotic transport |
| GO:0061737 | 0.0029 | 38.2454 | 0.0863 | 2 | 5 | leukotriene signaling pathway |
| GO:0002520 | 0.003 | 1.925 | 13.7864 | 25 | 799 | immune system development |
| GO:0044700 | 0.0032 | 1.4122 | 101.7328 | 124 | 5896 | single organism signaling |
| GO:0070887 | 0.0035 | 1.5043 | 48.0884 | 66 | 2787 | cellular response to chemical stimulus |
| GO:0002285 | 0.0035 | 3.4218 | 2.4847 | 8 | 144 | lymphocyte activation involved in immune response |
| GO:0032374 | 0.004 | 6.7861 | 0.6557 | 4 | 38 | regulation of cholesterol transport |
| GO:0006620 | 0.0043 | 28.6822 | 0.1035 | 2 | 6 | posttranslational protein targeting to membrane |
| GO:0050777 | 0.0044 | 3.6605 | 2.036 | 7 | 118 | negative regulation of immune response |
| GO:0042990 | 0.0044 | 4.1879 | 1.5357 | 6 | 89 | regulation of transcription factor import into nucleus |
| GO:0002076 | 0.0047 | 10.1523 | 0.3451 | 3 | 20 | osteoblast development |
| GO:0015695 | 0.0047 | 10.1523 | 0.3451 | 3 | 20 | organic cation transport |
| GO:0002521 | 0.005 | 2.1791 | 7.73 | 16 | 448 | leukocyte differentiation |
| GO:0009968 | 0.0052 | 1.7409 | 18.2898 | 30 | 1060 | negative regulation of signal transduction |
| GO:0030814 | 0.0055 | 3.5016 | 2.1223 | 7 | 123 | regulation of cAMP metabolic process |
| GO:0021762 | 0.0058 | 6.0702 | 0.7247 | 4 | 42 | substantia nigra development |
| GO:0019441 | 0.0059 | 22.9442 | 0.1208 | 2 | 7 | tryptophan catabolic process to kynurenine |
| GO:0036089 | 0.0059 | 22.9442 | 0.1208 | 2 | 7 | cleavage furrow formation |
| GO:0032365 | 0.0061 | 9.0825 | 0.3796 | 3 | 22 | intracellular lipid transport |
| GO:0022603 | 0.0062 | 1.7875 | 15.3738 | 26 | 891 | regulation of anatomical structure morphogenesis |
| GO:0048536 | 0.0063 | 5.9141 | 0.7419 | 4 | 43 | spleen development |
| GO:0034109 | 0.0063 | 2.0675 | 8.6445 | 17 | 501 | homotypic cell-cell adhesion |
| GO:0044767 | 0.0064 | 1.3758 | 94.9 | 115 | 5500 | single-organism developmental process |
| GO:0006954 | 0.0065 | 1.9398 | 10.8531 | 20 | 629 | inflammatory response |
| GO:0045595 | 0.0067 | 1.6097 | 25.1571 | 38 | 1458 | regulation of cell differentiation |
| GO:0042537 | 0.007 | 8.6278 | 0.3969 | 3 | 23 | benzene-containing compound metabolic process |
| GO:0043252 | 0.007 | 8.6278 | 0.3969 | 3 | 23 | sodium-independent organic anion transport |
| GO:0043949 | 0.007 | 8.6278 | 0.3969 | 3 | 23 | regulation of cAMP-mediated signaling |
| GO:0002887 | 0.0078 | 19.119 | 0.138 | 2 | 8 | negative regulation of myeloid leukocyte mediated immunity |
| GO:0014049 | 0.0078 | 19.119 | 0.138 | 2 | 8 | positive regulation of glutamate secretion |
| GO:0019740 | 0.0078 | 19.119 | 0.138 | 2 | 8 | nitrogen utilization |
| GO:0043301 | 0.0078 | 19.119 | 0.138 | 2 | 8 | negative regulation of leukocyte degranulation |
| GO:0072488 | 0.0079 | 8.2164 | 0.4141 | 3 | 24 | ammonium transmembrane transport |
| GO:0045471 | 0.008 | 3.2476 | 2.2776 | 7 | 132 | response to ethanol |
| GO:0065007 | 0.0082 | 1.406 | 184.5547 | 203 | 10696 | biological regulation |
| GO:0042110 | 0.0082 | 2.1102 | 7.454 | 15 | 432 | T cell activation |
| GO:0071593 | 0.0084 | 2.105 | 7.4712 | 15 | 433 | lymphocyte aggregation |
| GO:0002443 | 0.0084 | 2.4312 | 4.745 | 11 | 275 | leukocyte mediated immunity |
| GO:0046427 | 0.0085 | 4.2478 | 1.2596 | 5 | 73 | positive regulation of JAK-STAT cascade |
| GO:0071345 | 0.0085 | 1.827 | 12.6648 | 22 | 734 | cellular response to cytokine stimulus |
| GO:0043330 | 0.0086 | 5.3626 | 0.811 | 4 | 47 | response to exogenous dsRNA |
| GO:0009952 | 0.0088 | 2.6987 | 3.5027 | 9 | 203 | anterior/posterior pattern specification |
| GO:0006956 | 0.0093 | 5.2404 | 0.8282 | 4 | 48 | complement activation |
| GO:0002460 | 0.0096 | 2.6571 | 3.5544 | 9 | 206 | adaptive immune response based on somatic recombination of immune receptors built from immunoglobulin superfamily domains |
| GOMFID | Pvalue | OddsRatio | ExpCount | Count | Size | Term |
| GO:0002683 | 1e-04 | 3.1766 | 5.4445 | 16 | 367 | negative regulation of immune system process |
| GO:0002506 | 2e-04 | Inf | 0.0297 | 2 | 2 | polysaccharide assembly with MHC class II protein complex |
| GO:0071823 | 2e-04 | Inf | 0.0297 | 2 | 2 | protein-carbohydrate complex subunit organization |
| GO:0003350 | 7e-04 | 133.9567 | 0.0445 | 2 | 3 | pulmonary myocardium development |
| GO:0009449 | 7e-04 | 133.9567 | 0.0445 | 2 | 3 | gamma-aminobutyric acid biosynthetic process |
| GO:0071242 | 0.0012 | 9.6351 | 0.4747 | 4 | 32 | cellular response to ammonium ion |
| GO:0002503 | 0.0013 | 66.974 | 0.0593 | 2 | 4 | peptide antigen assembly with MHC class II protein complex |
| GO:0008628 | 0.0013 | 66.974 | 0.0593 | 2 | 4 | hormone-mediated apoptotic signaling pathway |
| GO:1903301 | 0.0013 | 66.974 | 0.0593 | 2 | 4 | positive regulation of hexokinase activity |
| GO:1903318 | 0.0014 | 9.3022 | 0.4896 | 4 | 33 | negative regulation of protein maturation |
| GO:0006959 | 0.0016 | 4.4295 | 1.6974 | 7 | 116 | humoral immune response |
| GO:0002396 | 0.0021 | 44.6465 | 0.0742 | 2 | 5 | MHC protein complex assembly |
| GO:0006003 | 0.0021 | 44.6465 | 0.0742 | 2 | 5 | fructose 2,6-bisphosphate metabolic process |
| GO:0061737 | 0.0021 | 44.6465 | 0.0742 | 2 | 5 | leukotriene signaling pathway |
| GO:0043615 | 0.0044 | 26.7844 | 0.1038 | 2 | 7 | astrocyte cell migration |
| GO:0031295 | 0.0046 | 4.9681 | 1.083 | 5 | 73 | T cell costimulation |
| GO:0042493 | 0.0053 | 2.2968 | 6.4236 | 14 | 433 | response to drug |
| GO:0019740 | 0.0058 | 22.3189 | 0.1187 | 2 | 8 | nitrogen utilization |
| GO:0032673 | 0.0058 | 9.1607 | 0.3709 | 3 | 25 | regulation of interleukin-4 production |
| GO:0035774 | 0.0065 | 8.7618 | 0.3857 | 3 | 26 | positive regulation of insulin secretion involved in cellular response to glucose stimulus |
| GO:0001714 | 0.0074 | 19.1293 | 0.1335 | 2 | 9 | endodermal cell fate specification |
| GO:0002778 | 0.0074 | 19.1293 | 0.1335 | 2 | 9 | antibacterial peptide production |
| GO:0048311 | 0.0074 | 19.1293 | 0.1335 | 2 | 9 | mitochondrion distribution |
| GO:0048845 | 0.0074 | 19.1293 | 0.1335 | 2 | 9 | venous blood vessel morphogenesis |
| GO:0097341 | 0.0074 | 19.1293 | 0.1335 | 2 | 9 | zymogen inhibition |
| GO:1990001 | 0.0074 | 19.1293 | 0.1335 | 2 | 9 | inhibition of cysteine-type endopeptidase activity involved in apoptotic process |
| GO:0060333 | 0.0082 | 4.2733 | 1.2461 | 5 | 84 | interferon-gamma-mediated signaling pathway |
| GO:0022409 | 0.0088 | 2.6985 | 3.5011 | 9 | 236 | positive regulation of cell-cell adhesion |
| GO:0001963 | 0.0089 | 7.7493 | 0.4302 | 3 | 29 | synaptic transmission, dopaminergic |
| GO:0034341 | 0.009 | 3.164 | 2.3291 | 7 | 157 | response to interferon-gamma |
| GO:0006600 | 0.0091 | 16.737 | 0.1484 | 2 | 10 | creatine metabolic process |
| GO:0035589 | 0.0091 | 16.737 | 0.1484 | 2 | 10 | G-protein coupled purinergic nucleotide receptor signaling pathway |
| GO:0045916 | 0.0091 | 16.737 | 0.1484 | 2 | 10 | negative regulation of complement activation |
| GO:2000425 | 0.0091 | 16.737 | 0.1484 | 2 | 10 | regulation of apoptotic cell clearance |
| GO:2001179 | 0.0091 | 16.737 | 0.1484 | 2 | 10 | regulation of interleukin-10 secretion |
| GO:0019730 | 0.0095 | 5.18 | 0.8308 | 4 | 56 | antimicrobial humoral response |
| GO:0019748 | 0.0095 | 5.18 | 0.8308 | 4 | 56 | secondary metabolic process |
| GOMFID | Pvalue | OddsRatio | ExpCount | Count | Size | Term |
| GO:0032943 | 0 | 4.1771 | 3.3962 | 13 | 254 | mononuclear cell proliferation |
| GO:0032661 | 0 | 74.8454 | 0.0802 | 3 | 6 | regulation of interleukin-18 production |
| GO:0006968 | 1e-04 | 9.2719 | 0.7354 | 6 | 55 | cellular defense response |
| GO:0045354 | 0.001 | 74.4904 | 0.0535 | 2 | 4 | regulation of interferon-alpha biosynthetic process |
| GO:0001952 | 0.0012 | 5.5287 | 1.1766 | 6 | 88 | regulation of cell-matrix adhesion |
| GO:0030889 | 0.0012 | 17.2609 | 0.2139 | 3 | 16 | negative regulation of B cell proliferation |
| GO:0070663 | 0.0015 | 3.6071 | 2.6608 | 9 | 199 | regulation of leukocyte proliferation |
| GO:0045663 | 0.0026 | 12.4622 | 0.2808 | 3 | 21 | positive regulation of myoblast differentiation |
| GO:0050900 | 0.0028 | 2.7098 | 4.6931 | 12 | 351 | leukocyte migration |
| GO:0050853 | 0.003 | 7.3194 | 0.6017 | 4 | 45 | B cell receptor signaling pathway |
| GO:0006955 | 0.0033 | 1.7406 | 21.821 | 35 | 1632 | immune response |
| GO:0046642 | 0.0036 | 29.7904 | 0.0936 | 2 | 7 | negative regulation of alpha-beta T cell proliferation |
| GO:0050670 | 0.0041 | 3.3324 | 2.5404 | 8 | 190 | regulation of lymphocyte proliferation |
| GO:0085029 | 0.0044 | 10.1937 | 0.3343 | 3 | 25 | extracellular matrix assembly |
| GO:0031666 | 0.0047 | 24.8237 | 0.107 | 2 | 8 | positive regulation of lipopolysaccharide-mediated signaling pathway |
| GO:0002377 | 0.0048 | 4.8841 | 1.0964 | 5 | 82 | immunoglobulin production |
| GO:0045321 | 0.0059 | 2.0458 | 9.3194 | 18 | 697 | leukocyte activation |
| GO:0031589 | 0.0066 | 2.6591 | 3.9577 | 10 | 296 | cell-substrate adhesion |
| GO:0048387 | 0.0067 | 8.6232 | 0.3877 | 3 | 29 | negative regulation of retinoic acid receptor signaling pathway |
| GO:0002003 | 0.0075 | 18.6154 | 0.1337 | 2 | 10 | angiotensin maturation |
| GO:0007253 | 0.0075 | 18.6154 | 0.1337 | 2 | 10 | cytoplasmic sequestering of NF-kappaB |
| GO:0042113 | 0.0078 | 2.9687 | 2.8346 | 8 | 212 | B cell activation |
| GO:0032611 | 0.008 | 5.4514 | 0.7889 | 4 | 59 | interleukin-1 beta production |
| GO:0050771 | 0.008 | 5.4514 | 0.7889 | 4 | 59 | negative regulation of axonogenesis |
| GO:0006935 | 0.008 | 1.906 | 11.111 | 20 | 831 | chemotaxis |
| GO:0042098 | 0.0082 | 3.2237 | 2.2864 | 7 | 171 | T cell proliferation |
| GO:0048704 | 0.0089 | 4.1751 | 1.2702 | 5 | 95 | embryonic skeletal system morphogenesis |
| GO:0060135 | 0.0089 | 5.2594 | 0.8156 | 4 | 61 | maternal process involved in female pregnancy |
| GO:0045351 | 0.009 | 16.5459 | 0.1471 | 2 | 11 | type I interferon biosynthetic process |
| GO:0016485 | 0.0094 | 2.5156 | 4.1717 | 10 | 312 | protein processing |
| GO:0032715 | 0.0096 | 7.4715 | 0.4412 | 3 | 33 | negative regulation of interleukin-6 production |
| GOMFID | Pvalue | OddsRatio | ExpCount | Count | Size | Term |
| GO:0002376 | 0 | 1.8574 | 39.5486 | 64 | 2525 | immune system process |
| GO:0018003 | 2e-04 | Inf | 0.0313 | 2 | 2 | peptidyl-lysine N6-acetylation |
| GO:0002829 | 6e-04 | 23.8457 | 0.1723 | 3 | 11 | negative regulation of type 2 immune response |
| GO:0007186 | 6e-04 | 1.9647 | 18.2158 | 33 | 1163 | G-protein coupled receptor signaling pathway |
| GO:0015850 | 8e-04 | 3.3667 | 3.4928 | 11 | 223 | organic hydroxy compound transport |
| GO:0006950 | 0.0012 | 1.5407 | 60.6151 | 82 | 3870 | response to stress |
| GO:0045087 | 0.0015 | 1.9159 | 16.8375 | 30 | 1075 | innate immune response |
| GO:0009607 | 0.0015 | 1.9828 | 14.5977 | 27 | 932 | response to biotic stimulus |
| GO:0051707 | 0.0018 | 1.9819 | 14.0339 | 26 | 896 | response to other organism |
| GO:0007154 | 0.0021 | 1.4598 | 93.6792 | 116 | 5981 | cell communication |
| GO:0032943 | 0.0023 | 2.9312 | 3.9784 | 11 | 254 | mononuclear cell proliferation |
| GO:0050859 | 0.0024 | 42.2322 | 0.0783 | 2 | 5 | negative regulation of B cell receptor signaling pathway |
| GO:1901741 | 0.0026 | 12.7119 | 0.2819 | 3 | 18 | positive regulation of myoblast fusion |
| GO:0044700 | 0.0027 | 1.4456 | 92.3479 | 114 | 5896 | single organism signaling |
| GO:0050670 | 0.0031 | 3.2056 | 2.9759 | 9 | 190 | regulation of lymphocyte proliferation |
| GO:1990089 | 0.0031 | 7.2845 | 0.6108 | 4 | 39 | response to nerve growth factor |
| GO:0048678 | 0.0033 | 5.4156 | 1.0024 | 5 | 64 | response to axon injury |
| GO:0050854 | 0.0034 | 7.0817 | 0.6265 | 4 | 40 | regulation of antigen receptor-mediated signaling pathway |
| GO:0048293 | 0.0035 | 31.6721 | 0.094 | 2 | 6 | regulation of isotype switching to IgE isotypes |
| GO:0045595 | 0.0041 | 1.6923 | 22.8364 | 36 | 1458 | regulation of cell differentiation |
| GO:0060004 | 0.0041 | 10.5912 | 0.3289 | 3 | 21 | reflex |
| GO:0002443 | 0.0041 | 2.6943 | 4.3073 | 11 | 275 | leukocyte mediated immunity |
| GO:0070663 | 0.0042 | 3.052 | 3.1169 | 9 | 199 | regulation of leukocyte proliferation |
| GO:0002367 | 0.0042 | 5.0705 | 1.0651 | 5 | 68 | cytokine production involved in immune response |
| GO:0015844 | 0.0042 | 5.0705 | 1.0651 | 5 | 68 | monoamine transport |
| GO:0002700 | 0.0044 | 4.1761 | 1.535 | 6 | 98 | regulation of production of molecular mediator of immune response |
| GO:0016525 | 0.0045 | 4.9909 | 1.0807 | 5 | 69 | negative regulation of angiogenesis |
| GO:0014823 | 0.0048 | 4.9138 | 1.0964 | 5 | 70 | response to activity |
| GO:0071670 | 0.0049 | 25.3361 | 0.1096 | 2 | 7 | smooth muscle cell chemotaxis |
| GO:0090050 | 0.0049 | 25.3361 | 0.1096 | 2 | 7 | positive regulation of cell migration involved in sprouting angiogenesis |
| GO:0030808 | 0.005 | 3.5644 | 2.0832 | 7 | 133 | regulation of nucleotide biosynthetic process |
| GO:0071346 | 0.0056 | 3.4808 | 2.1301 | 7 | 136 | cellular response to interferon-gamma |
| GO:1902715 | 0.0064 | 21.112 | 0.1253 | 2 | 8 | positive regulation of interferon-gamma secretion |
| GO:0032651 | 0.0067 | 5.7911 | 0.7518 | 4 | 48 | regulation of interleukin-1 beta production |
| GO:0002822 | 0.0067 | 3.8017 | 1.6759 | 6 | 107 | regulation of adaptive immune response based on somatic recombination of immune receptors built from immunoglobulin superfamily domains |
| GO:0030817 | 0.0067 | 3.8017 | 1.6759 | 6 | 107 | regulation of cAMP biosynthetic process |
| GO:1901343 | 0.0068 | 4.4968 | 1.1904 | 5 | 76 | negative regulation of vasculature development |
| GO:0050808 | 0.0069 | 2.812 | 3.3675 | 9 | 215 | synapse organization |
| GO:0030101 | 0.0072 | 4.4341 | 1.206 | 5 | 77 | natural killer cell activation |
| GO:0001906 | 0.0074 | 3.7274 | 1.7072 | 6 | 109 | cell killing |
| GO:0050707 | 0.0076 | 3.2758 | 2.2554 | 7 | 144 | regulation of cytokine secretion |
| GO:0060041 | 0.0076 | 3.2758 | 2.2554 | 7 | 144 | retina development in camera-type eye |
| GO:0044707 | 0.0079 | 1.3803 | 91.1888 | 110 | 5822 | single-multicellular organism process |
| GO:0048384 | 0.0082 | 5.4204 | 0.7988 | 4 | 51 | retinoic acid receptor signaling pathway |
| GO:0052652 | 0.0085 | 3.205 | 2.3024 | 7 | 147 | cyclic purine nucleotide metabolic process |
| GO:0050789 | 0.0086 | 1.4123 | 160.0739 | 178 | 10220 | regulation of biological process |
| GO:0009306 | 0.0088 | 2.094 | 7.5181 | 15 | 480 | protein secretion |
| GO:0030799 | 0.0091 | 3.1595 | 2.3338 | 7 | 149 | regulation of cyclic nucleotide metabolic process |
| GO:0060142 | 0.0093 | 7.6222 | 0.4386 | 3 | 28 | regulation of syncytium formation by plasma membrane fusion |
| GO:0051094 | 0.0095 | 1.69 | 17.5423 | 28 | 1120 | positive regulation of developmental process |
| GO:0042742 | 0.0099 | 2.6428 | 3.5711 | 9 | 228 | defense response to bacterium |
| GOMFID | Pvalue | OddsRatio | ExpCount | Count | Size | Term |
| GO:0007156 | 0 | 5.1799 | 2.567 | 12 | 151 | homophilic cell adhesion via plasma membrane adhesion molecules |
| GO:0098609 | 1e-04 | 2.3003 | 14.7049 | 31 | 865 | cell-cell adhesion |
| GO:0022610 | 8e-04 | 1.8227 | 23.8168 | 40 | 1401 | biological adhesion |
| GO:0006493 | 0.0012 | 4.6965 | 1.615 | 7 | 95 | protein O-linked glycosylation |
| GO:0051770 | 0.0012 | 17.533 | 0.221 | 3 | 13 | positive regulation of nitric-oxide synthase biosynthetic process |
| GO:0089711 | 0.0012 | 17.533 | 0.221 | 3 | 13 | L-glutamate transmembrane transport |
| GO:0016339 | 0.0014 | 9.3773 | 0.493 | 4 | 29 | calcium-dependent cell-cell adhesion via plasma membrane cell adhesion molecules |
| GO:0060278 | 0.0017 | 58.2528 | 0.068 | 2 | 4 | regulation of ovulation |
| GO:0071242 | 0.002 | 8.371 | 0.544 | 4 | 32 | cellular response to ammonium ion |
| GO:0009298 | 0.0028 | 38.8327 | 0.085 | 2 | 5 | GDP-mannose biosynthetic process |
| GO:0030311 | 0.0028 | 38.8327 | 0.085 | 2 | 5 | poly-N-acetyllactosamine biosynthetic process |
| GO:0009438 | 0.0041 | 29.1226 | 0.102 | 2 | 6 | methylglyoxal metabolic process |
| GO:0070432 | 0.0041 | 29.1226 | 0.102 | 2 | 6 | regulation of nucleotide-binding oligomerization domain containing 2 signaling pathway |
| GO:0071498 | 0.0045 | 10.3088 | 0.34 | 3 | 20 | cellular response to fluid shear stress |
| GO:0032649 | 0.0046 | 4.1525 | 1.547 | 6 | 91 | regulation of interferon-gamma production |
| GO:0007218 | 0.0048 | 4.104 | 1.564 | 6 | 92 | neuropeptide signaling pathway |
| GO:0098656 | 0.0049 | 2.7815 | 3.791 | 10 | 223 | anion transmembrane transport |
| GO:0007600 | 0.0053 | 1.811 | 15.1979 | 26 | 894 | sensory perception |
| GO:0007416 | 0.0055 | 3.4957 | 2.125 | 7 | 125 | synapse assembly |
| GO:0006013 | 0.0057 | 23.2966 | 0.119 | 2 | 7 | mannose metabolic process |
| GO:0060017 | 0.0057 | 23.2966 | 0.119 | 2 | 7 | parathyroid gland development |
| GO:0007268 | 0.0066 | 1.9025 | 11.6279 | 21 | 684 | synaptic transmission |
| GO:0099536 | 0.0066 | 1.9025 | 11.6279 | 21 | 684 | synaptic signaling |
| GO:0006706 | 0.0067 | 8.7608 | 0.391 | 3 | 23 | steroid catabolic process |
| GO:0032800 | 0.0067 | 8.7608 | 0.391 | 3 | 23 | receptor biosynthetic process |
| GO:0045348 | 0.0075 | 19.4126 | 0.136 | 2 | 8 | positive regulation of MHC class II biosynthetic process |
| GO:0015800 | 0.0085 | 7.9633 | 0.425 | 3 | 25 | acidic amino acid transport |
| GO:0030878 | 0.0095 | 7.6166 | 0.442 | 3 | 26 | thyroid gland development |
| GO:0030574 | 0.0095 | 4.1307 | 1.292 | 5 | 76 | collagen catabolic process |
| GO:0007040 | 0.0095 | 5.2029 | 0.833 | 4 | 49 | lysosome organization |
| GO:0035729 | 0.0096 | 16.6383 | 0.153 | 2 | 9 | cellular response to hepatocyte growth factor stimulus |
| GOMFID | Pvalue | OddsRatio | ExpCount | Count | Size | Term |
| GO:0002051 | 9e-04 | 112.6204 | 0.0527 | 2 | 3 | osteoblast fate commitment |
| GO:0030887 | 9e-04 | 112.6204 | 0.0527 | 2 | 3 | positive regulation of myeloid dendritic cell activation |
| GO:2000502 | 9e-04 | 112.6204 | 0.0527 | 2 | 3 | negative regulation of natural killer cell chemotaxis |
| GO:0042481 | 0.001 | 10.2995 | 0.4569 | 4 | 26 | regulation of odontogenesis |
| GO:0071603 | 0.0018 | 56.3066 | 0.0703 | 2 | 4 | endothelial cell-cell adhesion |
| GO:0002322 | 0.003 | 37.5353 | 0.0879 | 2 | 5 | B cell proliferation involved in immune response |
| GO:0035609 | 0.003 | 37.5353 | 0.0879 | 2 | 5 | C-terminal protein deglutamylation |
| GO:0098535 | 0.003 | 37.5353 | 0.0879 | 2 | 5 | de novo centriole assembly |
| GO:0006959 | 0.0034 | 3.1572 | 3.0225 | 9 | 172 | humoral immune response |
| GO:0006704 | 0.0036 | 11.293 | 0.3163 | 3 | 18 | glucocorticoid biosynthetic process |
| GO:0002684 | 0.0039 | 1.8348 | 15.6047 | 27 | 888 | positive regulation of immune system process |
| GO:1901623 | 0.0049 | 9.9632 | 0.3515 | 3 | 20 | regulation of lymphocyte chemotaxis |
| GO:0002223 | 0.0051 | 3.559 | 2.0912 | 7 | 119 | stimulatory C-type lectin receptor signaling pathway |
| GO:0014745 | 0.0061 | 22.5182 | 0.123 | 2 | 7 | negative regulation of muscle adaptation |
| GO:2000402 | 0.0061 | 22.5182 | 0.123 | 2 | 7 | negative regulation of lymphocyte migration |
| GO:0007214 | 0.0065 | 8.9132 | 0.3866 | 3 | 22 | gamma-aminobutyric acid signaling pathway |
| GO:0001775 | 0.0068 | 1.7527 | 16.2725 | 27 | 926 | cell activation |
| GO:0050715 | 0.0069 | 3.7877 | 1.687 | 6 | 96 | positive regulation of cytokine secretion |
| GO:0019740 | 0.008 | 18.764 | 0.1406 | 2 | 8 | nitrogen utilization |
| GO:0035581 | 0.008 | 18.764 | 0.1406 | 2 | 8 | sequestering of extracellular ligand from receptor |
| GO:0006955 | 0.009 | 1.5846 | 24.8294 | 37 | 1455 | immune response |
| GOMFID | Pvalue | OddsRatio | ExpCount | Count | Size | Term |
| GO:0006554 | 9e-04 | 19.5577 | 0.2032 | 3 | 12 | lysine catabolic process |
| GO:0055099 | 0.0017 | 58.4773 | 0.0677 | 2 | 4 | response to high density lipoprotein particle |
| GO:0097056 | 0.0017 | 58.4773 | 0.0677 | 2 | 4 | selenocysteinyl-tRNA(Sec) biosynthetic process |
| GO:0050427 | 0.0038 | 10.9962 | 0.3218 | 3 | 19 | 3'-phosphoadenosine 5'-phosphosulfate metabolic process |
| GO:0090102 | 0.005 | 6.3557 | 0.6944 | 4 | 41 | cochlea development |
| GO:0048050 | 0.0057 | 23.3864 | 0.1186 | 2 | 7 | post-embryonic eye morphogenesis |
| GO:0050715 | 0.0058 | 3.9359 | 1.6259 | 6 | 96 | positive regulation of cytokine secretion |
| GO:0007214 | 0.0058 | 9.2582 | 0.3726 | 3 | 22 | gamma-aminobutyric acid signaling pathway |
| GO:0008210 | 0.0058 | 9.2582 | 0.3726 | 3 | 22 | estrogen metabolic process |
| GO:0014823 | 0.0066 | 4.5314 | 1.1855 | 5 | 70 | response to activity |
| GO:0045924 | 0.0095 | 16.7024 | 0.1524 | 2 | 9 | regulation of female receptivity |
| GOMFID | Pvalue | OddsRatio | ExpCount | Count | Size | Term |
| GO:0006955 | 0 | 2.4519 | 22.5544 | 48 | 1427 | immune response |
| GO:0002125 | 0 | 183.1897 | 0.0652 | 3 | 4 | maternal aggressive behavior |
| GO:0002684 | 0 | 2.4356 | 14.474 | 32 | 888 | positive regulation of immune system process |
| GO:0002443 | 0 | 3.6363 | 4.4824 | 15 | 275 | leukocyte mediated immunity |
| GO:0002275 | 1e-04 | 7.4605 | 1.0595 | 7 | 65 | myeloid cell activation involved in immune response |
| GO:0016045 | 1e-04 | 18.8486 | 0.2771 | 4 | 17 | detection of bacterium |
| GO:0007155 | 3e-04 | 1.9248 | 22.7541 | 40 | 1396 | cell adhesion |
| GO:0060333 | 4e-04 | 5.6126 | 1.3692 | 7 | 84 | interferon-gamma-mediated signaling pathway |
| GO:0043252 | 5e-04 | 12.8914 | 0.3749 | 4 | 23 | sodium-independent organic anion transport |
| GO:0098581 | 5e-04 | 12.8914 | 0.3749 | 4 | 23 | detection of external biotic stimulus |
| GO:0002253 | 5e-04 | 2.5274 | 8.052 | 19 | 494 | activation of immune response |
| GO:0002263 | 6e-04 | 3.5307 | 3.3414 | 11 | 205 | cell activation involved in immune response |
| GO:1902564 | 8e-04 | 121.6457 | 0.0489 | 2 | 3 | negative regulation of neutrophil activation |
| GO:0002455 | 8e-04 | 7.6743 | 0.7335 | 5 | 45 | humoral immune response mediated by circulating immunoglobulin |
| GO:0070486 | 9e-04 | 2.5269 | 7.1718 | 17 | 440 | leukocyte aggregation |
| GO:0002764 | 0.0011 | 2.2428 | 9.9916 | 21 | 613 | immune response-regulating signaling pathway |
| GO:0036230 | 0.0012 | 9.7937 | 0.4727 | 4 | 29 | granulocyte activation |
| GO:0031295 | 0.0012 | 5.5103 | 1.1899 | 6 | 73 | T cell costimulation |
| GO:0002429 | 0.0015 | 2.7967 | 4.9387 | 13 | 303 | immune response-activating cell surface receptor signaling pathway |
| GO:0006954 | 0.0015 | 2.1814 | 10.2524 | 21 | 629 | inflammatory response |
| GO:0006663 | 0.0016 | 60.8189 | 0.0652 | 2 | 4 | platelet activating factor biosynthetic process |
| GO:0010693 | 0.0016 | 60.8189 | 0.0652 | 2 | 4 | negative regulation of alkaline phosphatase activity |
| GO:0070668 | 0.0016 | 60.8189 | 0.0652 | 2 | 4 | positive regulation of mast cell proliferation |
| GO:0034112 | 0.0017 | 3.2649 | 3.2599 | 10 | 200 | positive regulation of homotypic cell-cell adhesion |
| GO:1903039 | 0.0018 | 3.2304 | 3.2925 | 10 | 202 | positive regulation of leukocyte cell-cell adhesion |
| GO:0006950 | 0.0018 | 1.5046 | 63.0791 | 84 | 3870 | response to stress |
| GO:0033003 | 0.0022 | 8.1587 | 0.5542 | 4 | 34 | regulation of mast cell activation |
| GO:0007154 | 0.0023 | 1.4436 | 97.4873 | 120 | 5981 | cell communication |
| GO:0050867 | 0.0024 | 2.7546 | 4.6128 | 12 | 283 | positive regulation of cell activation |
| GO:0002730 | 0.0026 | 40.5433 | 0.0815 | 2 | 5 | regulation of dendritic cell cytokine production |
| GO:0010756 | 0.0026 | 40.5433 | 0.0815 | 2 | 5 | positive regulation of plasminogen activation |
| GO:0042908 | 0.0026 | 40.5433 | 0.0815 | 2 | 5 | xenobiotic transport |
| GO:0009607 | 0.0027 | 1.8949 | 15.1911 | 27 | 932 | response to biotic stimulus |
| GO:0051251 | 0.0027 | 2.8575 | 4.0749 | 11 | 250 | positive regulation of lymphocyte activation |
| GO:1903725 | 0.0029 | 5.5759 | 0.978 | 5 | 60 | regulation of phospholipid metabolic process |
| GO:0007625 | 0.0029 | 12.2016 | 0.2934 | 3 | 18 | grooming behavior |
| GO:0051707 | 0.0031 | 1.8945 | 14.6044 | 26 | 896 | response to other organism |
| GO:0019886 | 0.0033 | 4.4435 | 1.4507 | 6 | 89 | antigen processing and presentation of exogenous peptide antigen via MHC class II |
| GO:0034341 | 0.0042 | 3.3126 | 2.559 | 8 | 157 | response to interferon-gamma |
| GO:0042742 | 0.0043 | 2.8403 | 3.7163 | 10 | 228 | defense response to bacterium |
| GO:0002504 | 0.0044 | 4.1896 | 1.5322 | 6 | 94 | antigen processing and presentation of peptide or polysaccharide antigen via MHC class II |
| GO:0002694 | 0.0045 | 2.3472 | 6.2871 | 14 | 391 | regulation of leukocyte activation |
| GO:0070489 | 0.005 | 2.2438 | 7.0414 | 15 | 432 | T cell aggregation |
| GO:0015844 | 0.005 | 4.8653 | 1.1084 | 5 | 68 | monoamine transport |
| GO:0032613 | 0.0052 | 6.2723 | 0.7009 | 4 | 43 | interleukin-10 production |
| GO:0007197 | 0.0053 | 24.3228 | 0.1141 | 2 | 7 | adenylate cyclase-inhibiting G-protein coupled acetylcholine receptor signaling pathway |
| GO:0042538 | 0.0053 | 24.3228 | 0.1141 | 2 | 7 | hyperosmotic salinity response |
| GO:0046598 | 0.0053 | 24.3228 | 0.1141 | 2 | 7 | positive regulation of viral entry into host cell |
| GO:0019724 | 0.0053 | 4.0064 | 1.5974 | 6 | 98 | B cell mediated immunity |
| GO:0016337 | 0.0054 | 2.4761 | 5.1044 | 12 | 322 | single organismal cell-cell adhesion |
| GO:0015893 | 0.006 | 9.1482 | 0.3749 | 3 | 23 | drug transport |
| GO:0050853 | 0.0061 | 5.9655 | 0.7335 | 4 | 45 | B cell receptor signaling pathway |
| GO:0044700 | 0.0062 | 1.3862 | 96.1019 | 116 | 5896 | single organism signaling |
| GO:0032418 | 0.0066 | 5.8231 | 0.7498 | 4 | 46 | lysosome localization |
| GO:0050432 | 0.0066 | 5.8231 | 0.7498 | 4 | 46 | catecholamine secretion |
| GO:0050982 | 0.0066 | 5.8231 | 0.7498 | 4 | 46 | detection of mechanical stimulus |
| GO:0050863 | 0.0067 | 2.5148 | 4.5965 | 11 | 282 | regulation of T cell activation |
| GO:0007620 | 0.0067 | 8.712 | 0.3912 | 3 | 24 | copulation |
| GO:0002521 | 0.0069 | 2.1586 | 7.3022 | 15 | 448 | leukocyte differentiation |
| GO:0002887 | 0.0069 | 20.2677 | 0.1304 | 2 | 8 | negative regulation of myeloid leukocyte mediated immunity |
| GO:0007207 | 0.0069 | 20.2677 | 0.1304 | 2 | 8 | phospholipase C-activating G-protein coupled acetylcholine receptor signaling pathway |
| GO:0019740 | 0.0069 | 20.2677 | 0.1304 | 2 | 8 | nitrogen utilization |
| GO:0034351 | 0.0069 | 20.2677 | 0.1304 | 2 | 8 | negative regulation of glial cell apoptotic process |
| GO:0043301 | 0.0069 | 20.2677 | 0.1304 | 2 | 8 | negative regulation of leukocyte degranulation |
| GO:0060312 | 0.0069 | 20.2677 | 0.1304 | 2 | 8 | regulation of blood vessel remodeling |
| GO:0060907 | 0.0069 | 20.2677 | 0.1304 | 2 | 8 | positive regulation of macrophage cytokine production |
| GO:0006909 | 0.007 | 2.8068 | 3.374 | 9 | 207 | phagocytosis |
| GO:0042346 | 0.0076 | 8.3155 | 0.4075 | 3 | 25 | positive regulation of NF-kappaB import into nucleus |
| GO:0030307 | 0.0081 | 3.2376 | 2.2819 | 7 | 140 | positive regulation of cell growth |
| GO:0046488 | 0.0084 | 3.2132 | 2.2982 | 7 | 141 | phosphatidylinositol metabolic process |
| GO:0045321 | 0.0086 | 5.3397 | 0.8093 | 4 | 53 | leukocyte activation |
| GO:0042220 | 0.0088 | 5.3154 | 0.815 | 4 | 50 | response to cocaine |
| GO:0045924 | 0.0088 | 17.3712 | 0.1467 | 2 | 9 | regulation of female receptivity |
| GO:0050966 | 0.0088 | 17.3712 | 0.1467 | 2 | 9 | detection of mechanical stimulus involved in sensory perception of pain |
| GO:0046649 | 0.0089 | 2.3081 | 5.4529 | 12 | 344 | lymphocyte activation |
| GO:0022407 | 0.0091 | 2.2172 | 6.1449 | 13 | 377 | regulation of cell-cell adhesion |
| GOMFID | Pvalue | OddsRatio | ExpCount | Count | Size | Term |
| GO:0002376 | 0 | 1.847 | 45.9792 | 74 | 2525 | immune system process |
| GO:0002125 | 0 | 163.4523 | 0.0728 | 3 | 4 | maternal aggressive behavior |
| GO:0070489 | 0 | 2.8939 | 7.8665 | 21 | 432 | T cell aggregation |
| GO:0050718 | 0 | 15.2254 | 0.4188 | 5 | 23 | positive regulation of interleukin-1 beta secretion |
| GO:0070486 | 1e-04 | 2.8371 | 8.0122 | 21 | 440 | leukocyte aggregation |
| GO:0007320 | 1e-04 | 24.2884 | 0.2367 | 4 | 13 | insemination |
| GO:0050854 | 1e-04 | 9.6971 | 0.7284 | 6 | 40 | regulation of antigen receptor-mediated signaling pathway |
| GO:0052652 | 1e-04 | 4.4953 | 2.6768 | 11 | 147 | cyclic purine nucleotide metabolic process |
| GO:0002694 | 1e-04 | 2.7875 | 7.7391 | 20 | 425 | regulation of leukocyte activation |
| GO:0002275 | 2e-04 | 6.6453 | 1.1836 | 7 | 65 | myeloid cell activation involved in immune response |
| GO:0050861 | 2e-04 | 40.8551 | 0.1275 | 3 | 7 | positive regulation of B cell receptor signaling pathway |
| GO:0006954 | 2e-04 | 2.3496 | 11.4538 | 25 | 629 | inflammatory response |
| GO:0098609 | 2e-04 | 2.1261 | 15.7513 | 31 | 865 | cell-cell adhesion |
| GO:0050704 | 3e-04 | 10.1443 | 0.5827 | 5 | 32 | regulation of interleukin-1 secretion |
| GO:0045576 | 3e-04 | 7.3214 | 0.9287 | 6 | 51 | mast cell activation |
| GO:0002237 | 4e-04 | 2.8509 | 6.0092 | 16 | 330 | response to molecule of bacterial origin |
| GO:0002263 | 4e-04 | 3.4553 | 3.733 | 12 | 205 | cell activation involved in immune response |
| GO:2000146 | 4e-04 | 3.4553 | 3.733 | 12 | 205 | negative regulation of cell motility |
| GO:0050920 | 4e-04 | 3.6757 | 3.2231 | 11 | 177 | regulation of chemotaxis |
| GO:0032732 | 5e-04 | 8.8331 | 0.6555 | 5 | 36 | positive regulation of interleukin-1 production |
| GO:0002577 | 5e-04 | 12.8519 | 0.3824 | 4 | 21 | regulation of antigen processing and presentation |
| GO:0098602 | 6e-04 | 2.1253 | 13.6208 | 27 | 748 | single organism cell adhesion |
| GO:0030431 | 6e-04 | 8.2967 | 0.692 | 5 | 38 | sleep |
| GO:0046390 | 6e-04 | 3.077 | 4.516 | 13 | 248 | ribose phosphate biosynthetic process |
| GO:0050863 | 7e-04 | 2.91 | 5.1351 | 14 | 282 | regulation of T cell activation |
| GO:0032729 | 7e-04 | 6.2131 | 1.0744 | 6 | 59 | positive regulation of interferon-gamma production |
| GO:0050867 | 7e-04 | 2.899 | 5.1533 | 14 | 283 | positive regulation of cell activation |
| GO:0043303 | 8e-04 | 7.8216 | 0.7284 | 5 | 40 | mast cell degranulation |
| GO:0034695 | 9e-04 | 10.922 | 0.437 | 4 | 24 | response to prostaglandin E |
| GO:0050896 | 9e-04 | 1.4734 | 142.6566 | 169 | 7938 | response to stimulus |
| GO:0051707 | 0.001 | 1.9695 | 16.3158 | 30 | 896 | response to other organism |
| GO:0051270 | 0.001 | 2.0718 | 13.4023 | 26 | 736 | regulation of cellular component movement |
| GO:1901628 | 0.001 | 108.5845 | 0.0546 | 2 | 3 | positive regulation of postsynaptic membrane organization |
| GO:1902564 | 0.001 | 108.5845 | 0.0546 | 2 | 3 | negative regulation of neutrophil activation |
| GO:2000097 | 0.001 | 108.5845 | 0.0546 | 2 | 3 | regulation of smooth muscle cell-matrix adhesion |
| GO:0032757 | 0.0011 | 7.2027 | 0.783 | 5 | 43 | positive regulation of interleukin-8 production |
| GO:0007618 | 0.0012 | 7.0175 | 0.8012 | 5 | 44 | mating |
| GO:0002444 | 0.0012 | 5.523 | 1.194 | 6 | 66 | myeloid leukocyte mediated immunity |
| GO:0009152 | 0.0013 | 2.9846 | 4.2793 | 12 | 235 | purine ribonucleotide biosynthetic process |
| GO:0032102 | 0.0013 | 2.8207 | 4.8984 | 13 | 269 | negative regulation of response to external stimulus |
| GO:0007165 | 0.0014 | 1.4503 | 99.2605 | 124 | 5451 | signal transduction |
| GO:0002429 | 0.0014 | 2.6948 | 5.5175 | 14 | 303 | immune response-activating cell surface receptor signaling pathway |
| GO:0007155 | 0.0014 | 2.4978 | 6.8203 | 16 | 403 | cell adhesion |
| GO:0002689 | 0.0015 | 16.3357 | 0.2367 | 3 | 13 | negative regulation of leukocyte chemotaxis |
| GO:0032740 | 0.0015 | 16.3357 | 0.2367 | 3 | 13 | positive regulation of interleukin-17 production |
| GO:0060099 | 0.0015 | 16.3357 | 0.2367 | 3 | 13 | regulation of phagocytosis, engulfment |
| GO:0071216 | 0.0015 | 3.3093 | 3.2231 | 10 | 177 | cellular response to biotic stimulus |
| GO:0051674 | 0.0016 | 1.7677 | 23.0898 | 38 | 1268 | localization of cell |
| GO:0002504 | 0.0016 | 4.4218 | 1.7117 | 7 | 94 | antigen processing and presentation of peptide or polysaccharide antigen via MHC class II |
| GO:0001525 | 0.0017 | 2.3792 | 7.5752 | 17 | 416 | angiogenesis |
| GO:0032651 | 0.0017 | 6.3631 | 0.8741 | 5 | 48 | regulation of interleukin-1 beta production |
| GO:0050766 | 0.0017 | 6.3631 | 0.8741 | 5 | 48 | positive regulation of phagocytosis |
| GO:0007610 | 0.0018 | 2.0082 | 13.2384 | 25 | 727 | behavior |
| GO:0033700 | 0.0019 | 14.8497 | 0.2549 | 3 | 14 | phospholipid efflux |
| GO:0050965 | 0.0019 | 14.8497 | 0.2549 | 3 | 14 | detection of temperature stimulus involved in sensory perception of pain |
| GO:0071222 | 0.0019 | 3.4711 | 2.7679 | 9 | 152 | cellular response to lipopolysaccharide |
| GO:0002586 | 0.0019 | 54.2887 | 0.0728 | 2 | 4 | regulation of antigen processing and presentation of peptide antigen via MHC class II |
| GO:0030810 | 0.002 | 4.2736 | 1.7663 | 7 | 97 | positive regulation of nucleotide biosynthetic process |
| GO:1900544 | 0.0021 | 3.7639 | 2.2762 | 8 | 125 | positive regulation of purine nucleotide metabolic process |
| GO:0097529 | 0.0022 | 3.3991 | 2.8225 | 9 | 155 | myeloid leukocyte migration |
| GO:0030802 | 0.0023 | 3.7001 | 2.3126 | 8 | 127 | regulation of cyclic nucleotide biosynthetic process |
| GO:0030819 | 0.0023 | 4.8378 | 1.3475 | 6 | 74 | positive regulation of cAMP biosynthetic process |
| GO:0072522 | 0.0025 | 2.7468 | 4.6252 | 12 | 254 | purine-containing compound biosynthetic process |
| GO:0030801 | 0.0025 | 4.0907 | 1.8392 | 7 | 101 | positive regulation of cyclic nucleotide metabolic process |
| GO:0023052 | 0.0025 | 1.4131 | 107.4731 | 131 | 5902 | signaling |
| GO:0030334 | 0.0028 | 2.0275 | 11.4881 | 22 | 635 | regulation of cell migration |
| GO:0009886 | 0.0028 | 12.5635 | 0.2914 | 3 | 16 | post-embryonic morphogenesis |
| GO:1900371 | 0.003 | 3.5212 | 2.4219 | 8 | 133 | regulation of purine nucleotide biosynthetic process |
| GO:0060326 | 0.0031 | 2.8024 | 4.1518 | 11 | 228 | cell chemotaxis |
| GO:0045785 | 0.0032 | 2.3625 | 6.7011 | 15 | 368 | positive regulation of cell adhesion |
| GO:0070542 | 0.0032 | 4.505 | 1.4386 | 6 | 79 | response to fatty acid |
| GO:0008588 | 0.0032 | 36.1901 | 0.091 | 2 | 5 | release of cytoplasmic sequestered NF-kappaB |
| GO:0036462 | 0.0032 | 36.1901 | 0.091 | 2 | 5 | TRAIL-activated apoptotic signaling pathway |
| GO:0042908 | 0.0032 | 36.1901 | 0.091 | 2 | 5 | xenobiotic transport |
| GO:0061737 | 0.0032 | 36.1901 | 0.091 | 2 | 5 | leukotriene signaling pathway |
| GO:0043367 | 0.0032 | 5.4698 | 1.0015 | 5 | 55 | CD4-positive, alpha-beta T cell differentiation |
| GO:0002250 | 0.0033 | 2.4365 | 6.0638 | 14 | 333 | adaptive immune response |
| GO:1902105 | 0.0034 | 2.7764 | 4.1882 | 11 | 230 | regulation of leukocyte differentiation |
| GO:1901293 | 0.0034 | 2.5198 | 5.4447 | 13 | 299 | nucleoside phosphate biosynthetic process |
| GO:0046631 | 0.0034 | 3.8437 | 1.9484 | 7 | 107 | alpha-beta T cell activation |
| GO:0001775 | 0.0034 | 2.1573 | 8.8223 | 18 | 513 | cell activation |
| GO:0030225 | 0.0036 | 7.0414 | 0.6373 | 4 | 35 | macrophage differentiation |
| GO:0030098 | 0.0037 | 2.4932 | 5.4993 | 13 | 302 | lymphocyte differentiation |
| GO:0034112 | 0.0037 | 2.9043 | 3.6419 | 10 | 200 | positive regulation of homotypic cell-cell adhesion |
| GO:0010810 | 0.0038 | 3.0988 | 3.0774 | 9 | 169 | regulation of cell-substrate adhesion |
| GO:0043123 | 0.0038 | 3.0988 | 3.0774 | 9 | 169 | positive regulation of I-kappaB kinase/NF-kappaB signaling |
| GO:0022407 | 0.0039 | 2.3024 | 6.865 | 15 | 377 | regulation of cell-cell adhesion |
| GO:0007625 | 0.004 | 10.8869 | 0.3278 | 3 | 18 | grooming behavior |
| GO:0051240 | 0.004 | 1.655 | 25.1657 | 39 | 1382 | positive regulation of multicellular organismal process |
| GO:1903039 | 0.004 | 2.8736 | 3.6783 | 10 | 202 | positive regulation of leukocyte cell-cell adhesion |
| GO:0002687 | 0.004 | 3.731 | 2.0031 | 7 | 110 | positive regulation of leukocyte migration |
| GO:0060333 | 0.0043 | 4.2148 | 1.5296 | 6 | 84 | interferon-gamma-mediated signaling pathway |
| GO:0010950 | 0.0043 | 3.3076 | 2.5676 | 8 | 141 | positive regulation of endopeptidase activity |
| GO:0042088 | 0.0044 | 6.6138 | 0.6738 | 4 | 37 | T-helper 1 type immune response |
| GO:0002686 | 0.0045 | 10.3085 | 0.3426 | 3 | 19 | negative regulation of leukocyte migration |
| GO:0016048 | 0.0047 | 10.2058 | 0.346 | 3 | 19 | detection of temperature stimulus |
| GO:0032661 | 0.0047 | 27.1408 | 0.1093 | 2 | 6 | regulation of interleukin-18 production |
| GO:0097211 | 0.0047 | 27.1408 | 0.1093 | 2 | 6 | cellular response to gonadotropin-releasing hormone |
| GO:0042475 | 0.0048 | 4.1089 | 1.566 | 6 | 86 | odontogenesis of dentin-containing tooth |
| GO:0033280 | 0.0049 | 6.4189 | 0.692 | 4 | 38 | response to vitamin D |
| GO:0006887 | 0.005 | 2.3107 | 6.3734 | 14 | 350 | exocytosis |
| GO:0048771 | 0.0053 | 3.1867 | 2.6586 | 8 | 146 | tissue remodeling |
| GO:0090025 | 0.0054 | 9.6049 | 0.3642 | 3 | 20 | regulation of monocyte chemotaxis |
| GO:0030097 | 0.0054 | 1.8783 | 12.9106 | 23 | 709 | hemopoiesis |
| GO:0019886 | 0.0057 | 3.9596 | 1.6207 | 6 | 89 | antigen processing and presentation of exogenous peptide antigen via MHC class II |
| GO:0042102 | 0.0057 | 3.9596 | 1.6207 | 6 | 89 | positive regulation of T cell proliferation |
| GO:0032653 | 0.0059 | 6.0615 | 0.7284 | 4 | 40 | regulation of interleukin-10 production |
| GO:0071622 | 0.0059 | 6.0615 | 0.7284 | 4 | 40 | regulation of granulocyte chemotaxis |
| GO:0050951 | 0.0062 | 9.0707 | 0.3824 | 3 | 21 | sensory perception of temperature stimulus |
| GO:0051251 | 0.0062 | 2.5408 | 4.5524 | 11 | 250 | positive regulation of lymphocyte activation |
| GO:0009259 | 0.0065 | 2.0599 | 8.6678 | 17 | 476 | ribonucleotide metabolic process |
| GO:0002606 | 0.0065 | 21.7113 | 0.1275 | 2 | 7 | positive regulation of dendritic cell antigen processing and presentation |
| GO:0002786 | 0.0065 | 21.7113 | 0.1275 | 2 | 7 | regulation of antibacterial peptide production |
| GO:0042538 | 0.0065 | 21.7113 | 0.1275 | 2 | 7 | hyperosmotic salinity response |
| GO:1904396 | 0.0065 | 21.7113 | 0.1275 | 2 | 7 | regulation of neuromuscular junction development |
| GO:0071731 | 0.0071 | 8.5927 | 0.4006 | 3 | 22 | response to nitric oxide |
| GO:0030814 | 0.0073 | 3.3101 | 2.2398 | 7 | 123 | regulation of cAMP metabolic process |
| GO:0032946 | 0.0073 | 3.3101 | 2.2398 | 7 | 123 | positive regulation of mononuclear cell proliferation |
| GO:0048562 | 0.0074 | 2.3681 | 5.3172 | 12 | 292 | embryonic organ morphogenesis |
| GO:0031347 | 0.0075 | 1.7993 | 14.0396 | 24 | 771 | regulation of defense response |
| GO:0001944 | 0.0075 | 1.9101 | 10.9986 | 20 | 604 | vasculature development |
| GO:0043113 | 0.0076 | 5.5941 | 0.783 | 4 | 43 | receptor clustering |
| GO:0032411 | 0.0079 | 4.3374 | 1.2383 | 5 | 68 | positive regulation of transporter activity |
| GO:0007416 | 0.0079 | 3.2536 | 2.2762 | 7 | 125 | synapse assembly |
| GO:0071379 | 0.0081 | 8.1625 | 0.4188 | 3 | 23 | cellular response to prostaglandin stimulus |
| GO:0050670 | 0.0081 | 2.7355 | 3.4598 | 9 | 190 | regulation of lymphocyte proliferation |
| GO:0050715 | 0.0082 | 3.65 | 1.7481 | 6 | 96 | positive regulation of cytokine secretion |
| GO:0097202 | 0.0082 | 3.65 | 1.7481 | 6 | 96 | activation of cysteine-type endopeptidase activity |
| GO:0042345 | 0.0082 | 5.4539 | 0.8012 | 4 | 44 | regulation of NF-kappaB import into nucleus |
| GO:0032602 | 0.0084 | 4.2694 | 1.2565 | 5 | 69 | chemokine production |
| GO:0002887 | 0.0086 | 18.0915 | 0.1457 | 2 | 8 | negative regulation of myeloid leukocyte mediated immunity |
| GO:0043301 | 0.0086 | 18.0915 | 0.1457 | 2 | 8 | negative regulation of leukocyte degranulation |
| GO:0060312 | 0.0086 | 18.0915 | 0.1457 | 2 | 8 | regulation of blood vessel remodeling |
| GO:1903975 | 0.0086 | 18.0915 | 0.1457 | 2 | 8 | regulation of glial cell migration |
| GO:0050803 | 0.0089 | 2.5384 | 4.1336 | 10 | 227 | regulation of synapse structure or activity |
| GO:0014823 | 0.0089 | 4.2034 | 1.2747 | 5 | 70 | response to activity |
| GO:0032435 | 0.0089 | 4.2034 | 1.2747 | 5 | 70 | negative regulation of proteasomal ubiquitin-dependent protein catabolic process |
| GO:0042330 | 0.0096 | 1.7367 | 15.1322 | 25 | 831 | taxis |
| GO:0052547 | 0.0096 | 2.129 | 6.8832 | 14 | 378 | regulation of peptidase activity |
| GO:0070661 | 0.0097 | 2.3788 | 4.8438 | 11 | 266 | leukocyte proliferation |
| GOMFID | Pvalue | OddsRatio | ExpCount | Count | Size | Term |
| GO:0070489 | 0 | 3.5226 | 7.2339 | 23 | 432 | T cell aggregation |
| GO:0070486 | 0 | 3.4532 | 7.3679 | 23 | 440 | leukocyte aggregation |
| GO:0050863 | 0 | 3.9581 | 4.7221 | 17 | 282 | regulation of T cell activation |
| GO:0034112 | 0 | 4.2423 | 3.349 | 13 | 200 | positive regulation of homotypic cell-cell adhesion |
| GO:1903039 | 0 | 4.1969 | 3.3825 | 13 | 202 | positive regulation of leukocyte cell-cell adhesion |
| GO:0022407 | 1e-04 | 3.0869 | 6.3129 | 18 | 377 | regulation of cell-cell adhesion |
| GO:0043207 | 1e-04 | 2.2519 | 15.0037 | 31 | 896 | response to external biotic stimulus |
| GO:0098609 | 1e-04 | 2.2525 | 14.4846 | 30 | 865 | cell-cell adhesion |
| GO:0022610 | 1e-04 | 1.9695 | 23.46 | 42 | 1401 | biological adhesion |
| GO:0016045 | 2e-04 | 18.3309 | 0.2847 | 4 | 17 | detection of bacterium |
| GO:0032675 | 3e-04 | 5.2927 | 1.6578 | 8 | 99 | regulation of interleukin-6 production |
| GO:0051251 | 3e-04 | 3.3363 | 4.1863 | 13 | 250 | positive regulation of lymphocyte activation |
| GO:0098602 | 4e-04 | 2.2368 | 12.5254 | 26 | 748 | single organism cell adhesion |
| GO:1901222 | 4e-04 | 9.0498 | 0.6363 | 5 | 38 | regulation of NIK/NF-kappaB signaling |
| GO:0042107 | 5e-04 | 4.8135 | 1.8085 | 8 | 108 | cytokine metabolic process |
| GO:0050718 | 5e-04 | 12.5373 | 0.3851 | 4 | 23 | positive regulation of interleukin-1 beta secretion |
| GO:0043123 | 6e-04 | 3.7994 | 2.8299 | 10 | 169 | positive regulation of I-kappaB kinase/NF-kappaB signaling |
| GO:0030593 | 6e-04 | 5.3178 | 1.4401 | 7 | 86 | neutrophil chemotaxis |
| GO:0032490 | 7e-04 | 22.262 | 0.1842 | 3 | 11 | detection of molecule of bacterial origin |
| GO:0042102 | 7e-04 | 5.1223 | 1.4903 | 7 | 89 | positive regulation of T cell proliferation |
| GO:0030595 | 8e-04 | 3.6155 | 2.9639 | 10 | 177 | leukocyte chemotaxis |
| GO:0050717 | 8e-04 | 118.3295 | 0.0502 | 2 | 3 | positive regulation of interleukin-1 alpha secretion |
| GO:0070340 | 8e-04 | 118.3295 | 0.0502 | 2 | 3 | detection of bacterial lipopeptide |
| GO:2000502 | 8e-04 | 118.3295 | 0.0502 | 2 | 3 | negative regulation of natural killer cell chemotaxis |
| GO:0002694 | 8e-04 | 2.5466 | 7.1167 | 17 | 425 | regulation of leukocyte activation |
| GO:0009595 | 9e-04 | 10.8256 | 0.4354 | 4 | 26 | detection of biotic stimulus |
| GO:0050867 | 0.001 | 2.9222 | 4.7389 | 13 | 283 | positive regulation of cell activation |
| GO:0042035 | 0.001 | 4.8263 | 1.574 | 7 | 94 | regulation of cytokine biosynthetic process |
| GO:0001782 | 0.0011 | 9.9221 | 0.4689 | 4 | 28 | B cell homeostasis |
| GO:0050670 | 0.0014 | 3.3516 | 3.1816 | 10 | 190 | regulation of lymphocyte proliferation |
| GO:0071219 | 0.0014 | 3.6125 | 2.6625 | 9 | 159 | cellular response to molecule of bacterial origin |
| GO:0042095 | 0.0015 | 16.1874 | 0.2344 | 3 | 14 | interferon-gamma biosynthetic process |
| GO:0002125 | 0.0016 | 59.1609 | 0.067 | 2 | 4 | maternal aggressive behavior |
| GO:0002503 | 0.0016 | 59.1609 | 0.067 | 2 | 4 | peptide antigen assembly with MHC class II protein complex |
| GO:0033198 | 0.0017 | 8.818 | 0.5191 | 4 | 31 | response to ATP |
| GO:0002252 | 0.0018 | 2.0386 | 12.5421 | 24 | 749 | immune effector process |
| GO:0001776 | 0.0018 | 5.0546 | 1.2894 | 6 | 77 | leukocyte homeostasis |
| GO:0050704 | 0.0019 | 8.5025 | 0.5358 | 4 | 32 | regulation of interleukin-1 secretion |
| GO:0050663 | 0.0019 | 3.4499 | 2.7797 | 9 | 166 | cytokine secretion |
| GO:0070663 | 0.002 | 3.1901 | 3.3323 | 10 | 199 | regulation of leukocyte proliferation |
| GO:0098542 | 0.0023 | 2.1953 | 9.1764 | 19 | 548 | defense response to other organism |
| GO:0001912 | 0.0024 | 7.9346 | 0.5693 | 4 | 34 | positive regulation of leukocyte mediated cytotoxicity |
| GO:0006959 | 0.0025 | 3.3216 | 2.8802 | 9 | 172 | humoral immune response |
| GO:0097530 | 0.0025 | 4.0724 | 1.842 | 7 | 110 | granulocyte migration |
| GO:0002460 | 0.0025 | 3.0747 | 3.4495 | 10 | 206 | adaptive immune response based on somatic recombination of immune receptors built from immunoglobulin superfamily domains |
| GO:0007250 | 0.0027 | 12.7162 | 0.2847 | 3 | 17 | activation of NF-kappaB-inducing kinase activity |
| GO:0002396 | 0.0027 | 39.4381 | 0.0837 | 2 | 5 | MHC protein complex assembly |
| GO:0002730 | 0.0027 | 39.4381 | 0.0837 | 2 | 5 | regulation of dendritic cell cytokine production |
| GO:0008588 | 0.0027 | 39.4381 | 0.0837 | 2 | 5 | release of cytoplasmic sequestered NF-kappaB |
| GO:0032732 | 0.003 | 7.4377 | 0.6028 | 4 | 36 | positive regulation of interleukin-1 production |
| GO:0032729 | 0.003 | 5.5229 | 0.988 | 5 | 59 | positive regulation of interferon-gamma production |
| GO:0002685 | 0.0034 | 3.4541 | 2.4615 | 8 | 147 | regulation of leukocyte migration |
| GO:0045785 | 0.0037 | 2.3965 | 6.1622 | 14 | 368 | positive regulation of cell adhesion |
| GO:0032661 | 0.004 | 29.5766 | 0.1005 | 2 | 6 | regulation of interleukin-18 production |
| GO:0071221 | 0.004 | 29.5766 | 0.1005 | 2 | 6 | cellular response to bacterial lipopeptide |
| GO:0046649 | 0.0041 | 2.465 | 5.5642 | 13 | 344 | lymphocyte activation |
| GO:0001775 | 0.0041 | 2.0308 | 10.4227 | 20 | 643 | cell activation |
| GO:1901623 | 0.0043 | 10.4701 | 0.3349 | 3 | 20 | regulation of lymphocyte chemotaxis |
| GO:0071622 | 0.0044 | 6.6096 | 0.6698 | 4 | 40 | regulation of granulocyte chemotaxis |
| GO:0032946 | 0.0047 | 3.6129 | 2.0597 | 7 | 123 | positive regulation of mononuclear cell proliferation |
| GO:0097186 | 0.0049 | 9.8878 | 0.3516 | 3 | 21 | amelogenesis |
| GO:0002704 | 0.0052 | 6.2609 | 0.7033 | 4 | 42 | negative regulation of leukocyte mediated immunity |
| GO:0002786 | 0.0055 | 23.6598 | 0.1172 | 2 | 7 | regulation of antibacterial peptide production |
| GO:0032493 | 0.0055 | 23.6598 | 0.1172 | 2 | 7 | response to bacterial lipoprotein |
| GO:0032650 | 0.0055 | 23.6598 | 0.1172 | 2 | 7 | regulation of interleukin-1 alpha production |
| GO:0046645 | 0.0055 | 23.6598 | 0.1172 | 2 | 7 | positive regulation of gamma-delta T cell activation |
| GO:2000402 | 0.0055 | 23.6598 | 0.1172 | 2 | 7 | negative regulation of lymphocyte migration |
| GO:0002367 | 0.0056 | 4.7311 | 1.1387 | 5 | 68 | cytokine production involved in immune response |
| GO:0032660 | 0.0056 | 9.3668 | 0.3684 | 3 | 22 | regulation of interleukin-17 production |
| GO:0032943 | 0.0059 | 3.4467 | 2.1521 | 7 | 131 | mononuclear cell proliferation |
| GO:0060491 | 0.006 | 3.4339 | 2.1601 | 7 | 129 | regulation of cell projection assembly |
| GO:0051222 | 0.0061 | 2.1902 | 7.2004 | 15 | 430 | positive regulation of protein transport |
| GO:0042345 | 0.0062 | 5.9471 | 0.7368 | 4 | 44 | regulation of NF-kappaB import into nucleus |
| GO:0090279 | 0.0067 | 3.8122 | 1.6745 | 6 | 100 | regulation of calcium ion import |
| GO:0045471 | 0.0068 | 3.3508 | 2.2104 | 7 | 132 | response to ethanol |
| GO:0014049 | 0.0073 | 19.7152 | 0.134 | 2 | 8 | positive regulation of glutamate secretion |
| GO:0019740 | 0.0073 | 19.7152 | 0.134 | 2 | 8 | nitrogen utilization |
| GO:0045410 | 0.0073 | 19.7152 | 0.134 | 2 | 8 | positive regulation of interleukin-6 biosynthetic process |
| GO:0051928 | 0.0074 | 3.7322 | 1.708 | 6 | 102 | positive regulation of calcium ion transport |
| GO:0031295 | 0.0075 | 4.3818 | 1.2224 | 5 | 73 | T cell costimulation |
| GO:0042993 | 0.0078 | 5.5311 | 0.787 | 4 | 47 | positive regulation of transcription factor import into nucleus |
| GO:0071706 | 0.0081 | 3.6556 | 1.7415 | 6 | 104 | tumor necrosis factor superfamily cytokine production |
| GO:0034105 | 0.0081 | 8.0879 | 0.4186 | 3 | 25 | positive regulation of tissue remodeling |
| GO:0070979 | 0.0081 | 8.0879 | 0.4186 | 3 | 25 | protein K11-linked ubiquitination |
| GO:0009615 | 0.0082 | 2.1759 | 6.7483 | 14 | 403 | response to virus |
| GO:0032651 | 0.0084 | 5.4051 | 0.8038 | 4 | 48 | regulation of interleukin-1 beta production |
| GO:0010959 | 0.0084 | 2.3262 | 5.4087 | 12 | 323 | regulation of metal ion transport |
| GO:0001894 | 0.0088 | 2.7005 | 3.4997 | 9 | 209 | tissue homeostasis |
| GO:0002701 | 0.0091 | 7.7358 | 0.4354 | 3 | 26 | negative regulation of production of molecular mediator of immune response |
| GO:0002683 | 0.0091 | 2.2165 | 6.1455 | 13 | 367 | negative regulation of immune system process |
| GO:0002706 | 0.0092 | 3.5463 | 1.7917 | 6 | 107 | regulation of lymphocyte mediated immunity |
| GO:0002759 | 0.0093 | 16.8976 | 0.1507 | 2 | 9 | regulation of antimicrobial humoral response |
| GO:0002775 | 0.0093 | 16.8976 | 0.1507 | 2 | 9 | antimicrobial peptide production |
| GO:0043374 | 0.0093 | 16.8976 | 0.1507 | 2 | 9 | CD8-positive, alpha-beta T cell differentiation |
| GO:0050830 | 0.0094 | 4.1373 | 1.2894 | 5 | 77 | defense response to Gram-positive bacterium |
| GO:0019731 | 0.0097 | 5.1694 | 0.8373 | 4 | 50 | antibacterial humoral response |
| GO:0031667 | 0.0097 | 2.015 | 8.3224 | 16 | 497 | response to nutrient levels |
| GO:0008284 | 0.0098 | 1.7799 | 13.5971 | 23 | 812 | positive regulation of cell proliferation |
| GOMFID | Pvalue | OddsRatio | ExpCount | Count | Size | Term |
| GO:2000502 | 0 | Inf | 0.0529 | 3 | 3 | negative regulation of natural killer cell chemotaxis |
| GO:1901623 | 0 | 18.8897 | 0.3527 | 5 | 20 | regulation of lymphocyte chemotaxis |
| GO:2000402 | 2e-04 | 42.2217 | 0.1235 | 3 | 7 | negative regulation of lymphocyte migration |
| GO:0031424 | 2e-04 | 7.9221 | 0.8642 | 6 | 49 | keratinization |
| GO:0034112 | 2e-04 | 3.6711 | 3.5273 | 12 | 200 | positive regulation of homotypic cell-cell adhesion |
| GO:1903039 | 3e-04 | 3.6319 | 3.5626 | 12 | 202 | positive regulation of leukocyte cell-cell adhesion |
| GO:0031295 | 3e-04 | 6.0348 | 1.2875 | 7 | 73 | T cell costimulation |
| GO:0071973 | 3e-04 | Inf | 0.0353 | 2 | 2 | bacterial-type flagellum-dependent cell motility |
| GO:0090149 | 3e-04 | Inf | 0.0353 | 2 | 2 | mitochondrial membrane fission |
| GO:0050911 | 3e-04 | 2.7684 | 6.5784 | 17 | 373 | detection of chemical stimulus involved in sensory perception of smell |
| GO:0007135 | 4e-04 | 28.1442 | 0.1587 | 3 | 9 | meiosis II |
| GO:0009593 | 5e-04 | 2.5384 | 8.007 | 19 | 454 | detection of chemical stimulus |
| GO:0050906 | 7e-04 | 2.4626 | 8.2363 | 19 | 467 | detection of stimulus involved in sensory perception |
| GO:0045785 | 9e-04 | 2.6257 | 6.4903 | 16 | 368 | positive regulation of cell adhesion |
| GO:0030887 | 9e-04 | 112.2036 | 0.0529 | 2 | 3 | positive regulation of myeloid dendritic cell activation |
| GO:0042322 | 9e-04 | 112.2036 | 0.0529 | 2 | 3 | negative regulation of circadian sleep/wake cycle, REM sleep |
| GO:0007186 | 0.0013 | 1.8336 | 20.5113 | 35 | 1163 | G-protein coupled receptor signaling pathway |
| GO:0002689 | 0.0014 | 16.8821 | 0.2293 | 3 | 13 | negative regulation of leukocyte chemotaxis |
| GO:0007606 | 0.0016 | 2.3187 | 8.2363 | 18 | 467 | sensory perception of chemical stimulus |
| GO:0051251 | 0.0017 | 2.8903 | 4.4091 | 12 | 250 | positive regulation of lymphocyte activation |
| GO:0051464 | 0.0018 | 56.0982 | 0.0705 | 2 | 4 | positive regulation of cortisol secretion |
| GO:0090280 | 0.0024 | 5.8904 | 0.9347 | 5 | 53 | positive regulation of calcium ion import |
| GO:0018149 | 0.0028 | 5.654 | 0.97 | 5 | 55 | peptide cross-linking |
| GO:0050877 | 0.0028 | 1.7432 | 21.4637 | 35 | 1217 | neurological system process |
| GO:0001912 | 0.0029 | 7.5209 | 0.5996 | 4 | 34 | positive regulation of leukocyte mediated cytotoxicity |
| GO:0051461 | 0.003 | 37.3964 | 0.0882 | 2 | 5 | positive regulation of corticotropin secretion |
| GO:0001525 | 0.003 | 2.3033 | 7.3368 | 16 | 416 | angiogenesis |
| GO:0009913 | 0.003 | 3.5162 | 2.4229 | 8 | 139 | epidermal cell differentiation |
| GO:0006704 | 0.0036 | 11.2511 | 0.3175 | 3 | 18 | glucocorticoid biosynthetic process |
| GO:0032729 | 0.0038 | 5.2339 | 1.0406 | 5 | 59 | positive regulation of interferon-gamma production |
| GO:0050863 | 0.0044 | 2.5424 | 4.9735 | 12 | 282 | regulation of T cell activation |
| GO:0009438 | 0.0044 | 28.0455 | 0.1058 | 2 | 6 | methylglyoxal metabolic process |
| GO:0050867 | 0.0045 | 2.5328 | 4.9911 | 12 | 283 | positive regulation of cell activation |
| GO:0042102 | 0.0049 | 4.0935 | 1.5697 | 6 | 89 | positive regulation of T cell proliferation |
| GO:0070286 | 0.0057 | 9.3741 | 0.3704 | 3 | 21 | axonemal dynein complex assembly |
| GO:0048521 | 0.0061 | 4.6311 | 1.164 | 5 | 66 | negative regulation of behavior |
| GO:0051177 | 0.0061 | 22.4349 | 0.1235 | 2 | 7 | meiotic sister chromatid cohesion |
| GO:2000848 | 0.0061 | 22.4349 | 0.1235 | 2 | 7 | positive regulation of corticosteroid hormone secretion |
| GO:0060326 | 0.0074 | 2.6133 | 4.0211 | 10 | 228 | cell chemotaxis |
| GO:0035315 | 0.0074 | 5.637 | 0.776 | 4 | 44 | hair cell differentiation |
| GO:0090314 | 0.0074 | 8.4356 | 0.4056 | 3 | 23 | positive regulation of protein targeting to membrane |
| GO:0050957 | 0.0081 | 18.6945 | 0.1411 | 2 | 8 | equilibrioception |
| GO:0061072 | 0.0081 | 18.6945 | 0.1411 | 2 | 8 | iris morphogenesis |
| GO:0071267 | 0.0081 | 18.6945 | 0.1411 | 2 | 8 | L-methionine salvage |
| GO:0090278 | 0.0086 | 5.3679 | 0.8113 | 4 | 46 | negative regulation of peptide hormone secretion |
| GO:0051262 | 0.0089 | 3.1742 | 2.328 | 7 | 132 | protein tetramerization |
| GO:0042119 | 0.0094 | 7.6677 | 0.4409 | 3 | 25 | neutrophil activation |
| GOMFID | Pvalue | OddsRatio | ExpCount | Count | Size | Term |
| GO:0021633 | 3e-04 | Inf | 0.0359 | 2 | 2 | optic nerve structural organization |
| GO:1902476 | 6e-04 | 5.2801 | 1.4543 | 7 | 81 | chloride transmembrane transport |
| GO:0032966 | 6e-04 | 23.682 | 0.1795 | 3 | 10 | negative regulation of collagen biosynthetic process |
| GO:0090102 | 8e-04 | 7.7156 | 0.7362 | 5 | 41 | cochlea development |
| GO:0044252 | 0.0011 | 18.417 | 0.2155 | 3 | 12 | negative regulation of multicellular organismal metabolic process |
| GO:0008272 | 0.0018 | 15.0665 | 0.2514 | 3 | 14 | sulfate transport |
| GO:1990126 | 0.0018 | 15.0665 | 0.2514 | 3 | 14 | retrograde transport, endosome to plasma membrane |
| GO:0015850 | 0.0024 | 2.9126 | 4.0039 | 11 | 223 | organic hydroxy compound transport |
| GO:0098656 | 0.0024 | 2.9126 | 4.0039 | 11 | 223 | anion transmembrane transport |
| GO:0050864 | 0.0024 | 4.1073 | 1.8314 | 7 | 102 | regulation of B cell activation |
| GO:0060443 | 0.0026 | 5.7822 | 0.9516 | 5 | 53 | mammary gland morphogenesis |
| GO:0000578 | 0.0031 | 7.3832 | 0.6105 | 4 | 34 | embryonic axis specification |
| GO:0002309 | 0.0031 | 36.7167 | 0.0898 | 2 | 5 | T cell proliferation involved in immune response |
| GO:2001199 | 0.0031 | 36.7167 | 0.0898 | 2 | 5 | negative regulation of dendritic cell differentiation |
| GO:0044030 | 0.0032 | 11.8356 | 0.3052 | 3 | 17 | regulation of DNA methylation |
| GO:0010712 | 0.0042 | 6.7107 | 0.6643 | 4 | 37 | regulation of collagen metabolic process |
| GO:0042536 | 0.0046 | 27.5357 | 0.1077 | 2 | 6 | negative regulation of tumor necrosis factor biosynthetic process |
| GO:0048743 | 0.0046 | 27.5357 | 0.1077 | 2 | 6 | positive regulation of skeletal muscle fiber development |
| GO:0048852 | 0.0046 | 27.5357 | 0.1077 | 2 | 6 | diencephalon morphogenesis |
| GO:0015696 | 0.0048 | 4.1178 | 1.5621 | 6 | 87 | ammonium transport |
| GO:0045663 | 0.006 | 9.2031 | 0.3771 | 3 | 21 | positive regulation of myoblast differentiation |
| GO:0014745 | 0.0064 | 22.0271 | 0.1257 | 2 | 7 | negative regulation of muscle adaptation |
| GO:0046645 | 0.0064 | 22.0271 | 0.1257 | 2 | 7 | positive regulation of gamma-delta T cell activation |
| GO:0051256 | 0.0064 | 22.0271 | 0.1257 | 2 | 7 | mitotic spindle midzone assembly |
| GO:0007214 | 0.0069 | 8.7182 | 0.395 | 3 | 22 | gamma-aminobutyric acid signaling pathway |
| GO:0021675 | 0.0079 | 4.3321 | 1.2389 | 5 | 69 | nerve development |
| GO:0002072 | 0.0084 | 18.3548 | 0.1436 | 2 | 8 | optic cup morphogenesis involved in camera-type eye development |
| GO:0042268 | 0.0084 | 18.3548 | 0.1436 | 2 | 8 | regulation of cytolysis |
| GO:2001135 | 0.0084 | 18.3548 | 0.1436 | 2 | 8 | regulation of endocytic recycling |
| GO:0002700 | 0.0084 | 3.6229 | 1.7596 | 6 | 98 | regulation of production of molecular mediator of immune response |
| GO:0001709 | 0.0085 | 5.3985 | 0.808 | 4 | 45 | cell fate determination |
| GO:0045671 | 0.0088 | 7.8868 | 0.4309 | 3 | 24 | negative regulation of osteoclast differentiation |
| GO:1902105 | 0.0088 | 2.5408 | 4.1296 | 10 | 230 | regulation of leukocyte differentiation |
| GO:0048286 | 0.0099 | 5.1467 | 0.8439 | 4 | 47 | lung alveolus development |
| GOMFID | Pvalue | OddsRatio | ExpCount | Count | Size | Term |
| GO:0006376 | 5e-04 | 9.0258 | 0.6754 | 5 | 26 | mRNA splice site selection |
| GO:0071826 | 7e-04 | 2.9187 | 5.1435 | 14 | 198 | ribonucleoprotein complex subunit organization |
| GO:0070570 | 0.001 | 10.8091 | 0.4676 | 4 | 18 | regulation of neuron projection regeneration |
| GO:0046271 | 0.002 | 75.3547 | 0.0779 | 2 | 3 | phenylpropanoid catabolic process |
| GO:0070340 | 0.002 | 75.3547 | 0.0779 | 2 | 3 | detection of bacterial lipopeptide |
| GO:0000492 | 0.0039 | 37.6749 | 0.1039 | 2 | 4 | box C/D snoRNP assembly |
| GO:0042699 | 0.0039 | 37.6749 | 0.1039 | 2 | 4 | follicle-stimulating hormone signaling pathway |
| GO:0045636 | 0.0039 | 37.6749 | 0.1039 | 2 | 4 | positive regulation of melanocyte differentiation |
| GO:0048254 | 0.0039 | 37.6749 | 0.1039 | 2 | 4 | snoRNA localization |
| GO:0048681 | 0.0039 | 37.6749 | 0.1039 | 2 | 4 | negative regulation of axon regeneration |
| GO:0030799 | 0.0056 | 2.7401 | 3.8706 | 10 | 149 | regulation of cyclic nucleotide metabolic process |
| GO:0022613 | 0.0058 | 2.0366 | 9.2739 | 18 | 357 | ribonucleoprotein complex biogenesis |
| GO:0006521 | 0.0062 | 3.9218 | 1.6625 | 6 | 64 | regulation of cellular amino acid metabolic process |
| GO:0048678 | 0.0062 | 3.9218 | 1.6625 | 6 | 64 | response to axon injury |
| GO:0050650 | 0.0064 | 6.0487 | 0.7533 | 4 | 29 | chondroitin sulfate proteoglycan biosynthetic process |
| GO:0002309 | 0.0064 | 25.1149 | 0.1299 | 2 | 5 | T cell proliferation involved in immune response |
| GO:0048680 | 0.0064 | 25.1149 | 0.1299 | 2 | 5 | positive regulation of axon regeneration |
| GO:0050859 | 0.0064 | 25.1149 | 0.1299 | 2 | 5 | negative regulation of B cell receptor signaling pathway |
| GO:0030817 | 0.0067 | 3.0705 | 2.7796 | 8 | 107 | regulation of cAMP biosynthetic process |
| GO:0006501 | 0.0072 | 5.8157 | 0.7793 | 4 | 30 | C-terminal protein lipidation |
| GO:0031167 | 0.0076 | 8.7094 | 0.4156 | 3 | 16 | rRNA methylation |
| GO:0016045 | 0.009 | 8.0868 | 0.4416 | 3 | 17 | detection of bacterium |
| GO:0002924 | 0.0094 | 18.835 | 0.1559 | 2 | 6 | negative regulation of humoral immune response mediated by circulating immunoglobulin |
| GO:0071221 | 0.0094 | 18.835 | 0.1559 | 2 | 6 | cellular response to bacterial lipopeptide |
| GO:1902774 | 0.0094 | 18.835 | 0.1559 | 2 | 6 | late endosome to lysosome transport |
| GOMFID | Pvalue | OddsRatio | ExpCount | Count | Size | Term |
| GO:0018003 | 3e-04 | Inf | 0.033 | 2 | 2 | peptidyl-lysine N6-acetylation |
| GO:0009593 | 6e-04 | 2.5715 | 7.4867 | 18 | 454 | detection of chemical stimulus |
| GO:0071314 | 8e-04 | 120.2023 | 0.0495 | 2 | 3 | cellular response to cocaine |
| GO:0050877 | 9e-04 | 1.8857 | 20.069 | 35 | 1217 | neurological system process |
| GO:0050911 | 0.0014 | 2.5911 | 6.151 | 15 | 373 | detection of chemical stimulus involved in sensory perception of smell |
| GO:2001046 | 0.0016 | 60.0973 | 0.066 | 2 | 4 | positive regulation of integrin-mediated signaling pathway |
| GO:2000310 | 0.0017 | 15.0732 | 0.2474 | 3 | 15 | regulation of N-methyl-D-aspartate selective glutamate receptor activity |
| GO:0009813 | 0.003 | 12.0563 | 0.2968 | 3 | 18 | flavonoid biosynthetic process |
| GO:0046058 | 0.0031 | 3.5101 | 2.4241 | 8 | 147 | cAMP metabolic process |
| GO:0030799 | 0.0033 | 3.4599 | 2.4571 | 8 | 149 | regulation of cyclic nucleotide metabolic process |
| GO:0051459 | 0.0039 | 30.0447 | 0.0989 | 2 | 6 | regulation of corticotropin secretion |
| GO:0070813 | 0.0039 | 30.0447 | 0.0989 | 2 | 6 | hydrogen sulfide metabolic process |
| GO:0052696 | 0.0041 | 10.6365 | 0.3298 | 3 | 20 | flavonoid glucuronidation |
| GO:0050906 | 0.0048 | 2.1893 | 7.7011 | 16 | 467 | detection of stimulus involved in sensory perception |
| GO:0045672 | 0.0062 | 9.0393 | 0.3793 | 3 | 23 | positive regulation of osteoclast differentiation |
| GO:0045471 | 0.0063 | 3.4049 | 2.1767 | 7 | 132 | response to ethanol |
| GO:0032811 | 0.0071 | 20.0272 | 0.1319 | 2 | 8 | negative regulation of epinephrine secretion |
| GO:0071267 | 0.0071 | 20.0272 | 0.1319 | 2 | 8 | L-methionine salvage |
| GO:0007608 | 0.0079 | 8.1541 | 0.4137 | 3 | 26 | sensory perception of smell |
| GO:0030817 | 0.0086 | 3.6033 | 1.7645 | 6 | 107 | regulation of cAMP biosynthetic process |
| GO:0098542 | 0.0096 | 1.9733 | 9.0368 | 17 | 548 | defense response to other organism |
| GOMFID | Pvalue | OddsRatio | ExpCount | Count | Size | Term |
| GO:0022610 | 2e-04 | 1.9572 | 23.014 | 41 | 1401 | biological adhesion |
| GO:0097237 | 5e-04 | 12.7882 | 0.3778 | 4 | 23 | cellular response to toxic substance |
| GO:0042102 | 7e-04 | 5.226 | 1.462 | 7 | 89 | positive regulation of T cell proliferation |
| GO:0006435 | 8e-04 | 120.6797 | 0.0493 | 2 | 3 | threonyl-tRNA aminoacylation |
| GO:0007156 | 9e-04 | 3.896 | 2.4805 | 9 | 151 | homophilic cell adhesion via plasma membrane adhesion molecules |
| GO:0007416 | 0.0011 | 4.1931 | 2.0534 | 8 | 125 | synapse assembly |
| GO:0016339 | 0.0012 | 9.7153 | 0.4764 | 4 | 29 | calcium-dependent cell-cell adhesion via plasma membrane cell adhesion molecules |
| GO:0071242 | 0.0018 | 8.6727 | 0.5257 | 4 | 32 | cellular response to ammonium ion |
| GO:0042908 | 0.0026 | 40.2214 | 0.0821 | 2 | 5 | xenobiotic transport |
| GO:1902004 | 0.0026 | 40.2214 | 0.0821 | 2 | 5 | positive regulation of beta-amyloid formation |
| GO:0071285 | 0.0035 | 11.3471 | 0.3121 | 3 | 19 | cellular response to lithium ion |
| GO:1990089 | 0.0037 | 6.935 | 0.6406 | 4 | 39 | response to nerve growth factor |
| GO:0051129 | 0.004 | 2.075 | 9.6754 | 19 | 589 | negative regulation of cellular component organization |
| GO:0032946 | 0.0042 | 3.6861 | 2.0205 | 7 | 123 | positive regulation of mononuclear cell proliferation |
| GO:0050670 | 0.0042 | 3.0487 | 3.1211 | 9 | 190 | regulation of lymphocyte proliferation |
| GO:0002790 | 0.0047 | 2.6428 | 4.386 | 11 | 267 | peptide secretion |
| GO:0042886 | 0.0049 | 2.4085 | 5.6837 | 13 | 346 | amide transport |
| GO:0070663 | 0.0057 | 2.9026 | 3.2689 | 9 | 199 | regulation of leukocyte proliferation |
| GO:0034112 | 0.0059 | 2.8872 | 3.2854 | 9 | 200 | positive regulation of homotypic cell-cell adhesion |
| GO:1903039 | 0.0063 | 2.8569 | 3.3182 | 9 | 202 | positive regulation of leukocyte cell-cell adhesion |
| GO:0030155 | 0.0067 | 1.9707 | 10.1518 | 19 | 618 | regulation of cell adhesion |
| GO:0006779 | 0.0069 | 8.6426 | 0.3942 | 3 | 24 | porphyrin-containing compound biosynthetic process |
| GO:1902902 | 0.0071 | 20.1068 | 0.1314 | 2 | 8 | negative regulation of autophagosome assembly |
| GO:1903975 | 0.0071 | 20.1068 | 0.1314 | 2 | 8 | regulation of glial cell migration |
| GO:0050863 | 0.0071 | 2.4941 | 4.6324 | 11 | 282 | regulation of T cell activation |
| GO:0006959 | 0.0076 | 2.9822 | 2.8254 | 8 | 172 | humoral immune response |
| GO:0098609 | 0.0085 | 1.7814 | 14.2092 | 24 | 865 | cell-cell adhesion |
| GO:0035774 | 0.0086 | 7.89 | 0.4271 | 3 | 26 | positive regulation of insulin secretion involved in cellular response to glucose stimulus |
| GO:1902042 | 0.0086 | 7.89 | 0.4271 | 3 | 26 | negative regulation of extrinsic apoptotic signaling pathway via death domain receptors |
| GO:0009642 | 0.009 | 17.2333 | 0.1478 | 2 | 9 | response to light intensity |
| GO:0043374 | 0.009 | 17.2333 | 0.1478 | 2 | 9 | CD8-positive, alpha-beta T cell differentiation |
| GO:0046929 | 0.009 | 17.2333 | 0.1478 | 2 | 9 | negative regulation of neurotransmitter secretion |
| GO:0035337 | 0.0091 | 5.2729 | 0.8213 | 4 | 50 | fatty-acyl-CoA metabolic process |
| GO:0007267 | 0.0092 | 1.664 | 19.088 | 30 | 1162 | cell-cell signaling |
| GOMFID | Pvalue | OddsRatio | ExpCount | Count | Size | Term |
| GO:0004364 | 6e-04 | 12.1403 | 0.3896 | 4 | 26 | glutathione transferase activity |
| GO:0031698 | 0.0022 | 44.188 | 0.0749 | 2 | 5 | beta-2 adrenergic receptor binding |
| GO:0051117 | 0.005 | 4.8447 | 1.1089 | 5 | 74 | ATPase binding |
| GO:0004115 | 0.0093 | 16.5652 | 0.1499 | 2 | 10 | 3',5'-cyclic-AMP phosphodiesterase activity |
| GOMFID | Pvalue | OddsRatio | ExpCount | Count | Size | Term |
| GO:0035197 | 0.0022 | 43.8079 | 0.0756 | 2 | 5 | siRNA binding |
| GO:0015193 | 0.0045 | 26.2814 | 0.1058 | 2 | 7 | L-proline transmembrane transporter activity |
| GO:0071855 | 0.0076 | 8.2378 | 0.408 | 3 | 27 | neuropeptide receptor binding |
| GO:0032395 | 0.0094 | 16.4227 | 0.1511 | 2 | 10 | MHC class II receptor activity |
| GOMFID | Pvalue | OddsRatio | ExpCount | Count | Size | Term |
| GO:0001965 | 4e-04 | 13.5733 | 0.3627 | 4 | 21 | G-protein alpha-subunit binding |
| GO:0035663 | 9e-04 | 114.637 | 0.0518 | 2 | 3 | Toll-like receptor 2 binding |
| GO:0004872 | 0.0013 | 1.7452 | 26.0446 | 42 | 1508 | receptor activity |
| GO:0015299 | 0.0016 | 15.6803 | 0.2418 | 3 | 14 | solute:proton antiporter activity |
| GO:1990782 | 0.0018 | 6.282 | 0.8808 | 5 | 51 | protein tyrosine kinase binding |
| GO:0015057 | 0.0029 | 38.2074 | 0.0864 | 2 | 5 | thrombin receptor activity |
| GO:0004062 | 0.0043 | 28.6537 | 0.1036 | 2 | 6 | aryl sulfotransferase activity |
| GO:0005540 | 0.0054 | 9.5781 | 0.3627 | 3 | 21 | hyaluronic acid binding |
| GO:0015077 | 0.0061 | 2.3401 | 5.8376 | 13 | 338 | monovalent inorganic cation transmembrane transporter activity |
| GO:0005102 | 0.0065 | 1.6212 | 24.3002 | 37 | 1407 | receptor binding |
| GO:0042605 | 0.0079 | 8.2082 | 0.4145 | 3 | 24 | peptide antigen binding |
| GO:0005068 | 0.0099 | 16.3704 | 0.1554 | 2 | 9 | transmembrane receptor protein tyrosine kinase adaptor activity |
| GOMFID | Pvalue | OddsRatio | ExpCount | Count | Size | Term |
| GO:0015252 | 0.0015 | 62.4879 | 0.0635 | 2 | 4 | hydrogen ion channel activity |
| GO:0035473 | 0.0036 | 31.2399 | 0.0952 | 2 | 6 | lipase binding |
| GO:0050661 | 0.004 | 6.795 | 0.6508 | 4 | 41 | NADP binding |
| GO:0043027 | 0.0049 | 9.8956 | 0.3492 | 3 | 22 | cysteine-type endopeptidase inhibitor activity involved in apoptotic process |
| GO:0046977 | 0.005 | 24.9903 | 0.1111 | 2 | 7 | TAP binding |
| GO:0003730 | 0.0065 | 5.8446 | 0.7461 | 4 | 47 | mRNA 3'-UTR binding |
| GO:0016175 | 0.0066 | 20.8239 | 0.127 | 2 | 8 | superoxide-generating NADPH oxidase activity |
| GO:0047760 | 0.0066 | 20.8239 | 0.127 | 2 | 8 | butyrate-CoA ligase activity |
| GO:0008009 | 0.007 | 5.7114 | 0.762 | 4 | 48 | chemokine activity |
| GOMFID | Pvalue | OddsRatio | ExpCount | Count | Size | Term |
| GO:0004890 | 0.0027 | 12.7825 | 0.2865 | 3 | 16 | GABA-A receptor activity |
| GO:0004871 | 0.0059 | 1.586 | 28.2734 | 42 | 1579 | signal transducer activity |
| GO:0033691 | 0.0083 | 18.406 | 0.1432 | 2 | 8 | sialic acid binding |
| GOMFID | Pvalue | OddsRatio | ExpCount | Count | Size | Term |
| GO:0001641 | 3e-04 | Inf | 0.0335 | 2 | 2 | group II metabotropic glutamate receptor activity |
| GO:0004067 | 3e-04 | Inf | 0.0335 | 2 | 2 | asparaginase activity |
| GO:0004930 | 0.0016 | 2.0295 | 13.1422 | 25 | 784 | G-protein coupled receptor activity |
| GO:0001733 | 0.0016 | 59.0954 | 0.0671 | 2 | 4 | galactosylceramide sulfotransferase activity |
| GO:0004890 | 0.0022 | 13.6799 | 0.2682 | 3 | 16 | GABA-A receptor activity |
| GO:0038187 | 0.0027 | 12.702 | 0.285 | 3 | 17 | pattern recognition receptor activity |
| GO:0001875 | 0.0027 | 39.3944 | 0.0838 | 2 | 5 | lipopolysaccharide receptor activity |
| GO:0015197 | 0.0073 | 19.6934 | 0.1341 | 2 | 8 | peptide transporter activity |
| GO:0005184 | 0.0091 | 7.7271 | 0.4358 | 3 | 26 | neuropeptide hormone activity |
| GO:0008066 | 0.0091 | 7.7271 | 0.4358 | 3 | 26 | glutamate receptor activity |
| GOMFID | Pvalue | OddsRatio | ExpCount | Count | Size | Term |
| GO:0042288 | 5e-04 | 13.2115 | 0.3852 | 4 | 18 | MHC class I protein binding |
| GO:0035663 | 0.0014 | 92.006 | 0.0642 | 2 | 3 | Toll-like receptor 2 binding |
| GO:0032051 | 0.0027 | 46 | 0.0856 | 2 | 4 | clathrin light chain binding |
| GO:0031628 | 0.0044 | 30.6647 | 0.107 | 2 | 5 | opioid receptor binding |
| GO:0004871 | 0.008 | 1.5059 | 33.7877 | 48 | 1579 | signal transducer activity |
| GO:0016811 | 0.0097 | 4.1297 | 1.3053 | 5 | 61 | hydrolase activity, acting on carbon-nitrogen (but not peptide) bonds, in linear amides |
| GOMFID | Pvalue | OddsRatio | ExpCount | Count | Size | Term |
| GO:0003684 | 0.0045 | 5.0212 | 1.082 | 5 | 60 | damaged DNA binding |
| GO:0050681 | 0.0052 | 6.298 | 0.7033 | 4 | 39 | androgen receptor binding |
| GO:0015450 | 0.0084 | 18.273 | 0.1443 | 2 | 8 | P-P-bond-hydrolysis-driven protein transmembrane transporter activity |
| GO:0048027 | 0.0084 | 18.273 | 0.1443 | 2 | 8 | mRNA 5'-UTR binding |
| GOMFID | Pvalue | OddsRatio | ExpCount | Count | Size | Term |
| GO:0005549 | 0.001 | 4.8325 | 1.5811 | 7 | 83 | odorant binding |
| GO:0004984 | 0.0022 | 2.3817 | 7.1052 | 16 | 373 | olfactory receptor activity |
| GO:0097493 | 0.0052 | 25.9144 | 0.1143 | 2 | 6 | structural molecule activity conferring elasticity |
| GO:0030215 | 0.0071 | 8.6594 | 0.4 | 3 | 21 | semaphorin receptor binding |
| GO:0004930 | 0.0083 | 1.7595 | 14.9343 | 25 | 784 | G-protein coupled receptor activity |
| GO:0004415 | 0.0094 | 17.274 | 0.1524 | 2 | 8 | hyalurononglucosaminidase activity |
| GO:0016742 | 0.0094 | 17.274 | 0.1524 | 2 | 8 | hydroxymethyl-, formyl- and related transferase activity |
| GOMFID | Pvalue | OddsRatio | ExpCount | Count | Size | Term |
| GO:0004872 | 1e-04 | 2.0424 | 22.8848 | 42 | 1508 | receptor activity |
| GO:0004871 | 1e-04 | 1.9959 | 23.9622 | 43 | 1579 | signal transducer activity |
| GO:0004930 | 0.0011 | 2.1643 | 11.3918 | 23 | 759 | G-protein coupled receptor activity |
| GO:0005549 | 0.0016 | 5.1613 | 1.2596 | 6 | 83 | odorant binding |
| GO:0030883 | 0.0022 | 43.6203 | 0.0759 | 2 | 5 | endogenous lipid antigen binding |
| GO:0030884 | 0.0022 | 43.6203 | 0.0759 | 2 | 5 | exogenous lipid antigen binding |
| GO:0004888 | 0.0035 | 2.5118 | 5.4816 | 13 | 385 | transmembrane signaling receptor activity |
| GO:0043027 | 0.0043 | 10.3642 | 0.3339 | 3 | 22 | cysteine-type endopeptidase inhibitor activity involved in apoptotic process |
| GO:0019957 | 0.0046 | 26.1688 | 0.1062 | 2 | 7 | C-C chemokine binding |
| GO:0071723 | 0.0046 | 26.1688 | 0.1062 | 2 | 7 | lipopeptide binding |
| GO:0004984 | 0.0047 | 2.4207 | 5.6605 | 13 | 373 | olfactory receptor activity |
| GO:0005031 | 0.0049 | 9.8453 | 0.349 | 3 | 23 | tumor necrosis factor-activated receptor activity |
| GO:0051766 | 0.006 | 21.8059 | 0.1214 | 2 | 8 | inositol trisphosphate kinase activity |
| GO:0008527 | 0.0062 | 8.9492 | 0.3794 | 3 | 25 | taste receptor activity |
| GO:0030881 | 0.0077 | 18.6896 | 0.1366 | 2 | 9 | beta-2-microglobulin binding |
| GOMFID | Pvalue | OddsRatio | ExpCount | Count | Size | Term |
| GO:0032394 | 3e-04 | Inf | 0.0342 | 2 | 2 | MHC class Ib receptor activity |
| GO:0004984 | 7e-04 | 2.679 | 6.371 | 16 | 373 | olfactory receptor activity |
| GO:0017162 | 0.0017 | 57.97 | 0.0683 | 2 | 4 | aryl hydrocarbon receptor binding |
| GO:0042288 | 0.0033 | 11.6278 | 0.3074 | 3 | 18 | MHC class I protein binding |
| GO:0003684 | 0.0036 | 5.3116 | 1.0248 | 5 | 60 | damaged DNA binding |
| GO:0003796 | 0.0097 | 16.5575 | 0.1537 | 2 | 9 | lysozyme activity |
| GO:0099600 | 0.0099 | 1.6258 | 20.8211 | 32 | 1219 | transmembrane receptor activity |
| GOMFID | Pvalue | OddsRatio | ExpCount | Count | Size | Term |
| GO:0070181 | 3e-04 | 34.906 | 0.1366 | 3 | 8 | small ribosomal subunit rRNA binding |
| GO:0005096 | 0.0011 | 3.0422 | 4.2018 | 12 | 246 | GTPase activator activity |
| GO:0060589 | 0.0018 | 2.7172 | 5.0729 | 13 | 297 | nucleoside-triphosphatase regulator activity |
| GO:0004468 | 0.0028 | 38.6442 | 0.0854 | 2 | 5 | lysine N-acetyltransferase activity, acting on acetyl phosphate as donor |
| GO:0038023 | 0.0034 | 1.7222 | 21.7263 | 35 | 1272 | signaling receptor activity |
| GO:0004908 | 0.0042 | 28.9813 | 0.1025 | 2 | 6 | interleukin-1 receptor activity |
| GO:0004984 | 0.005 | 2.3125 | 6.371 | 14 | 373 | olfactory receptor activity |
| GO:0099600 | 0.0057 | 1.6853 | 20.8211 | 33 | 1219 | transmembrane receptor activity |
| GO:0030368 | 0.0076 | 19.3184 | 0.1366 | 2 | 8 | interleukin-17 receptor activity |
| GO:0005070 | 0.0083 | 5.4189 | 0.8028 | 4 | 47 | SH3/SH2 adaptor activity |
| GOMFID | Pvalue | OddsRatio | ExpCount | Count | Size | Term |
| GO:0038191 | 5e-04 | 26.9216 | 0.1657 | 3 | 9 | neuropilin binding |
| GO:0030215 | 5e-04 | 12.7042 | 0.3867 | 4 | 21 | semaphorin receptor binding |
| GO:0005549 | 8e-04 | 5.0066 | 1.5284 | 7 | 83 | odorant binding |
| GO:0008142 | 0.0033 | 35.7778 | 0.0921 | 2 | 5 | oxysterol binding |
| GO:0008532 | 0.0033 | 35.7778 | 0.0921 | 2 | 5 | N-acetyllactosaminide beta-1,3-N-acetylglucosaminyltransferase activity |
| GOMFID | Pvalue | OddsRatio | ExpCount | Count | Size | Term |
| GO:0047894 | 8e-04 | 119.1231 | 0.0499 | 2 | 3 | flavonol 3-sulfotransferase activity |
| GO:0004062 | 0.004 | 29.775 | 0.0998 | 2 | 6 | aryl sulfotransferase activity |
| GO:0005546 | 0.0071 | 5.7014 | 0.7653 | 4 | 46 | phosphatidylinositol-4,5-bisphosphate binding |
| GO:0004871 | 0.0078 | 1.5839 | 26.2682 | 39 | 1579 | signal transducer activity |
| GOMFID | Pvalue | OddsRatio | ExpCount | Count | Size | Term |
| GO:0004364 | 1e-04 | 11.7605 | 0.5233 | 5 | 26 | glutathione transferase activity |
| GO:0004117 | 0.0012 | 97.9746 | 0.0604 | 2 | 3 | calmodulin-dependent cyclic-nucleotide phosphodiesterase activity |
| GO:0035663 | 0.0012 | 97.9746 | 0.0604 | 2 | 3 | Toll-like receptor 2 binding |
| GO:0008009 | 0.0027 | 5.7353 | 0.9662 | 5 | 48 | chemokine activity |
| GO:0005134 | 0.0039 | 32.654 | 0.1006 | 2 | 5 | interleukin-2 receptor binding |
| GO:0030375 | 0.0039 | 32.654 | 0.1006 | 2 | 5 | thyroid hormone receptor coactivator activity |
| GO:0001614 | 0.0045 | 10.5218 | 0.3422 | 3 | 17 | purinergic nucleotide receptor activity |
| GO:0036402 | 0.0057 | 24.4889 | 0.1208 | 2 | 6 | proteasome-activating ATPase activity |
| GO:0016782 | 0.0081 | 4.3227 | 1.248 | 5 | 62 | transferase activity, transferring sulfur-containing groups |
| GO:0004298 | 0.0082 | 8.1815 | 0.4227 | 3 | 21 | threonine-type endopeptidase activity |
| GO:0030246 | 0.0088 | 2.314 | 5.4346 | 12 | 270 | carbohydrate binding |
| GOMFID | Pvalue | OddsRatio | ExpCount | Count | Size | Term |
| GO:0050840 | 1e-04 | 8.5193 | 0.8058 | 6 | 49 | extracellular matrix binding |
| GO:0017046 | 3e-04 | 9.8165 | 0.592 | 5 | 36 | peptide hormone binding |
| GO:0016638 | 0.0021 | 13.9516 | 0.2631 | 3 | 16 | oxidoreductase activity, acting on the CH-NH2 group of donors |
| GO:0031628 | 0.0026 | 40.1738 | 0.0822 | 2 | 5 | opioid receptor binding |
| GO:0005125 | 0.003 | 2.9944 | 3.5358 | 10 | 215 | cytokine activity |
| GO:0032184 | 0.0039 | 30.1284 | 0.0987 | 2 | 6 | SUMO polymer binding |
| GO:0038024 | 0.004 | 5.1485 | 1.0525 | 5 | 64 | cargo receptor activity |
| GO:0008172 | 0.0054 | 24.1012 | 0.1151 | 2 | 7 | S-methyltransferase activity |
| GO:0008312 | 0.0054 | 24.1012 | 0.1151 | 2 | 7 | 7S RNA binding |
| GOMFID | Pvalue | OddsRatio | ExpCount | Count | Size | Term |
| GO:0005185 | 4e-04 | Inf | 0.0397 | 2 | 2 | neurohypophyseal hormone activity |
| GO:0035663 | 0.0012 | 99.2605 | 0.0596 | 2 | 3 | Toll-like receptor 2 binding |
| GO:0004364 | 0.0016 | 9.0697 | 0.5167 | 4 | 26 | glutathione transferase activity |
| GO:0008047 | 0.0031 | 2.1762 | 8.7248 | 18 | 439 | enzyme activator activity |
| GO:0030375 | 0.0038 | 33.0825 | 0.0994 | 2 | 5 | thyroid hormone receptor coactivator activity |
| GO:0001614 | 0.0043 | 10.6604 | 0.3379 | 3 | 17 | purinergic nucleotide receptor activity |
| GO:0019534 | 0.0056 | 24.8103 | 0.1192 | 2 | 6 | toxin transporter activity |
| GO:0016505 | 0.0059 | 9.3266 | 0.3776 | 3 | 19 | peptidase activator activity involved in apoptotic process |
| GO:0043325 | 0.0059 | 9.3266 | 0.3776 | 3 | 19 | phosphatidylinositol-3,4-bisphosphate binding |
| GO:0061134 | 0.007 | 2.6342 | 3.9947 | 10 | 201 | peptidase regulator activity |
| GO:0005126 | 0.0071 | 2.3829 | 5.2866 | 12 | 266 | cytokine receptor binding |
| GO:0004298 | 0.0079 | 8.2892 | 0.4174 | 3 | 21 | threonine-type endopeptidase activity |
| GO:0005525 | 0.0085 | 2.1634 | 6.7771 | 14 | 341 | GTP binding |
| GOMFID | Pvalue | OddsRatio | ExpCount | Count | Size | Term |
| GO:0016165 | 3e-04 | Inf | 0.0356 | 2 | 2 | linoleate 13S-lipoxygenase activity |
| GO:0005044 | 0.0012 | 7.0132 | 0.8001 | 5 | 45 | scavenger receptor activity |
| GO:0004522 | 0.0018 | 55.6367 | 0.0711 | 2 | 4 | ribonuclease A activity |
| GO:0000979 | 0.0029 | 5.6069 | 0.9778 | 5 | 55 | RNA polymerase II core promoter sequence-specific DNA binding |
| GO:0004468 | 0.003 | 37.0887 | 0.0889 | 2 | 5 | lysine N-acetyltransferase activity, acting on acetyl phosphate as donor |
| GO:0015057 | 0.003 | 37.0887 | 0.0889 | 2 | 5 | thrombin receptor activity |
| GO:0004872 | 0.0039 | 1.6374 | 26.8106 | 41 | 1508 | receptor activity |
| GO:0004062 | 0.0045 | 27.8147 | 0.1067 | 2 | 6 | aryl sulfotransferase activity |
| GO:0034987 | 0.0045 | 27.8147 | 0.1067 | 2 | 6 | immunoglobulin receptor binding |
| GO:0030674 | 0.0052 | 3.1973 | 2.6491 | 8 | 149 | protein binding, bridging |
| GO:0016810 | 0.0054 | 3.5158 | 2.1157 | 7 | 119 | hydrolase activity, acting on carbon-nitrogen (but not peptide) bonds |
| GO:0001530 | 0.0058 | 9.2966 | 0.3734 | 3 | 21 | lipopolysaccharide binding |
| GO:0003708 | 0.0062 | 22.2504 | 0.1245 | 2 | 7 | retinoic acid receptor activity |
| GO:0004383 | 0.0062 | 22.2504 | 0.1245 | 2 | 7 | guanylate cyclase activity |
| GO:0008519 | 0.0076 | 8.3659 | 0.4089 | 3 | 23 | ammonium transmembrane transporter activity |
| GOMFID | Pvalue | OddsRatio | ExpCount | Count | Size | Term |
| GO:0004930 | 0 | 3.2534 | 10.8522 | 31 | 784 | G-protein coupled receptor activity |
| GO:0004984 | 0 | 4.3431 | 5.1631 | 20 | 373 | olfactory receptor activity |
| GO:0099600 | 0 | 2.6498 | 16.8736 | 39 | 1219 | transmembrane receptor activity |
| GO:0038023 | 0 | 2.4459 | 17.6072 | 38 | 1272 | signaling receptor activity |
| GO:0060089 | 0 | 2.2895 | 20.874 | 42 | 1508 | molecular transducer activity |
| GO:0004468 | 0.0019 | 47.9259 | 0.0692 | 2 | 5 | lysine N-acetyltransferase activity, acting on acetyl phosphate as donor |
| GO:0046923 | 0.0019 | 47.9259 | 0.0692 | 2 | 5 | ER retention sequence binding |
| GO:0005549 | 0.0059 | 4.6506 | 1.1489 | 5 | 83 | odorant binding |
| GO:0070492 | 0.008 | 17.9664 | 0.1384 | 2 | 10 | oligosaccharide binding |
| GOMFID | Pvalue | OddsRatio | ExpCount | Count | Size | Term |
| GO:0005184 | 0.0043 | 10.2273 | 0.3318 | 3 | 26 | neuropeptide hormone activity |
| GO:0005125 | 0.0064 | 3.072 | 2.744 | 8 | 215 | cytokine activity |
| GO:0005126 | 0.0072 | 2.789 | 3.3949 | 9 | 266 | cytokine receptor binding |
| GO:0004984 | 0.0085 | 2.4287 | 4.7605 | 11 | 373 | olfactory receptor activity |
| GOMFID | Pvalue | OddsRatio | ExpCount | Count | Size | Term |
| GO:0030170 | 0.0038 | 5.274 | 1.0427 | 5 | 51 | pyridoxal phosphate binding |
| GO:0035005 | 0.0082 | 19.2775 | 0.1431 | 2 | 7 | 1-phosphatidylinositol-4-phosphate 3-kinase activity |
| GO:0004298 | 0.0086 | 8.0507 | 0.4294 | 3 | 21 | threonine-type endopeptidase activity |
| GO:0015035 | 0.0098 | 7.6265 | 0.4498 | 3 | 22 | protein disulfide oxidoreductase activity |
| GOMFID | Pvalue | OddsRatio | ExpCount | Count | Size | Term |
| GO:0008147 | 3e-04 | Inf | 0.0373 | 2 | 2 | structural constituent of bone |
| GO:0043169 | 9e-04 | 1.5014 | 73.906 | 98 | 3959 | cation binding |
| GO:0005509 | 0.003 | 1.9808 | 12.2834 | 23 | 658 | calcium ion binding |
| GO:0005047 | 0.0033 | 35.2785 | 0.0933 | 2 | 5 | signal recognition particle binding |
| GO:0005432 | 0.0033 | 35.2785 | 0.0933 | 2 | 5 | calcium:sodium antiporter activity |
| GO:0005102 | 0.0048 | 1.623 | 26.2657 | 40 | 1407 | receptor binding |
| GO:0086083 | 0.005 | 26.4572 | 0.112 | 2 | 6 | cell adhesive protein binding involved in bundle of His cell-Purkinje myocyte communication |
| GO:0015491 | 0.0067 | 8.8414 | 0.392 | 3 | 21 | cation:cation antiporter activity |
| GO:0008312 | 0.0069 | 21.1644 | 0.1307 | 2 | 7 | 7S RNA binding |
| GO:0043995 | 0.0069 | 21.1644 | 0.1307 | 2 | 7 | histone acetyltransferase activity (H4-K5 specific) |
| GO:0043996 | 0.0069 | 21.1644 | 0.1307 | 2 | 7 | histone acetyltransferase activity (H4-K8 specific) |
| GO:0046972 | 0.0069 | 21.1644 | 0.1307 | 2 | 7 | histone acetyltransferase activity (H4-K16 specific) |
| GO:0015085 | 0.007 | 3.3412 | 2.2215 | 7 | 119 | calcium ion transmembrane transporter activity |
| GOMFID | Pvalue | OddsRatio | ExpCount | Count | Size | Term |
| GO:0008147 | 6e-04 | Inf | 0.0475 | 2 | 2 | structural constituent of bone |
| GO:0030957 | 7e-04 | 24.8571 | 0.19 | 3 | 8 | Tat protein binding |
| GO:0035663 | 0.0017 | 82.6559 | 0.0712 | 2 | 3 | Toll-like receptor 2 binding |
| GOMFID | Pvalue | OddsRatio | ExpCount | Count | Size | Term |
| GO:0004111 | 2e-04 | 46.8511 | 0.1265 | 3 | 6 | creatine kinase activity |
| GO:0035663 | 0.0013 | 93.4303 | 0.0632 | 2 | 3 | Toll-like receptor 2 binding |
| GO:0015645 | 0.0028 | 12.7709 | 0.2951 | 3 | 14 | fatty acid ligase activity |
| GO:0048487 | 0.0039 | 6.9512 | 0.6535 | 4 | 31 | beta-tubulin binding |
| GO:0005001 | 0.0051 | 10.0323 | 0.3584 | 3 | 17 | transmembrane receptor protein tyrosine phosphatase activity |
| GO:0004645 | 0.0063 | 23.353 | 0.1265 | 2 | 6 | phosphorylase activity |
| GO:0035005 | 0.0087 | 18.6812 | 0.1476 | 2 | 7 | 1-phosphatidylinositol-4-phosphate 3-kinase activity |
| GOMFID | Pvalue | OddsRatio | ExpCount | Count | Size | Term |
| GO:0097108 | 0.001 | 107.7282 | 0.0551 | 2 | 3 | hedgehog family protein binding |
| GO:0019213 | 0.0037 | 6.9854 | 0.6423 | 4 | 35 | deacetylase activity |
| GOMFID | Pvalue | OddsRatio | ExpCount | Count | Size | Term |
| GO:0032394 | 3e-04 | Inf | 0.0361 | 2 | 2 | MHC class Ib receptor activity |
| GO:0030414 | 9e-04 | 3.5816 | 2.9935 | 10 | 166 | peptidase inhibitor activity |
| GO:0004867 | 0.0011 | 4.7407 | 1.6049 | 7 | 89 | serine-type endopeptidase inhibitor activity |
| GO:0004090 | 0.0019 | 54.8333 | 0.0721 | 2 | 4 | carbonyl reductase (NADPH) activity |
| GO:0061135 | 0.003 | 3.2326 | 2.9574 | 9 | 164 | endopeptidase regulator activity |
| GO:0097493 | 0.0046 | 27.4131 | 0.1082 | 2 | 6 | structural molecule activity conferring elasticity |
| GO:0005201 | 0.0048 | 4.9312 | 1.1 | 5 | 61 | extracellular matrix structural constituent |
| GOMFID | Pvalue | OddsRatio | ExpCount | Count | Size | Term |
| GO:0008528 | 2e-04 | 4.8327 | 2.0314 | 9 | 124 | G-protein coupled peptide receptor activity |
| GO:0001631 | 3e-04 | Inf | 0.0328 | 2 | 2 | cysteinyl leukotriene receptor activity |
| GO:0008147 | 3e-04 | Inf | 0.0328 | 2 | 2 | structural constituent of bone |
| GO:0032813 | 7e-04 | 7.8301 | 0.7208 | 5 | 44 | tumor necrosis factor receptor superfamily binding |
| GO:0008559 | 8e-04 | 121.0156 | 0.0491 | 2 | 3 | xenobiotic-transporting ATPase activity |
| GO:0060089 | 8e-04 | 1.8062 | 24.704 | 41 | 1508 | molecular transducer activity |
| GO:0005125 | 9e-04 | 3.3372 | 3.5221 | 11 | 215 | cytokine activity |
| GO:0004953 | 0.0014 | 16.5561 | 0.2293 | 3 | 14 | icosanoid receptor activity |
| GO:0001602 | 0.0016 | 60.5039 | 0.0655 | 2 | 4 | pancreatic polypeptide receptor activity |
| GO:0046848 | 0.0016 | 60.5039 | 0.0655 | 2 | 4 | hydroxyapatite binding |
| GO:0005149 | 0.0017 | 15.1755 | 0.2457 | 3 | 15 | interleukin-1 receptor binding |
| GO:0090484 | 0.003 | 12.138 | 0.2949 | 3 | 18 | drug transporter activity |
| GO:0005201 | 0.0032 | 5.4471 | 0.9993 | 5 | 61 | extracellular matrix structural constituent |
| GO:0004028 | 0.0038 | 30.248 | 0.0983 | 2 | 6 | 3-chloroallyl aldehyde dehydrogenase activity |
| GO:0038023 | 0.0047 | 1.7121 | 20.5717 | 33 | 1265 | signaling receptor activity |
| GO:0042277 | 0.005 | 2.7734 | 3.8006 | 10 | 232 | peptide binding |
| GO:0003708 | 0.0053 | 24.1969 | 0.1147 | 2 | 7 | retinoic acid receptor activity |
| GO:0004030 | 0.0053 | 24.1969 | 0.1147 | 2 | 7 | aldehyde dehydrogenase [NAD(P)+] activity |
| GO:0005126 | 0.0064 | 2.8483 | 3.3273 | 9 | 208 | cytokine receptor binding |
| GO:0036122 | 0.0089 | 17.2812 | 0.1474 | 2 | 9 | BMP binding |
| GO:0035257 | 0.0093 | 3.1487 | 2.3426 | 7 | 143 | nuclear hormone receptor binding |
| GO:0099600 | 0.0096 | 1.6442 | 19.9696 | 31 | 1219 | transmembrane receptor activity |
| GOMFID | Pvalue | OddsRatio | ExpCount | Count | Size | Term |
| GO:0004792 | 0.0026 | 66.0173 | 0.0886 | 2 | 3 | thiosulfate sulfurtransferase activity |
| GO:0070411 | 0.0035 | 12.3994 | 0.3248 | 3 | 11 | I-SMAD binding |
| GO:0008519 | 0.0043 | 6.9711 | 0.6791 | 4 | 23 | ammonium transmembrane transporter activity |
| GO:0004427 | 0.005 | 33.0065 | 0.1181 | 2 | 4 | inorganic diphosphatase activity |
| GO:0008757 | 0.0052 | 2.7773 | 3.8383 | 10 | 130 | S-adenosylmethionine-dependent methyltransferase activity |
| GO:0008191 | 0.0059 | 9.9182 | 0.3838 | 3 | 13 | metalloendopeptidase inhibitor activity |
| GO:0005096 | 0.0065 | 2.1722 | 7.2633 | 15 | 246 | GTPase activator activity |
| GO:0060589 | 0.0073 | 2.0334 | 8.7691 | 17 | 297 | nucleoside-triphosphatase regulator activity |
| GO:0010576 | 0.0073 | 9.0159 | 0.4134 | 3 | 14 | metalloenzyme regulator activity |
| GO:0008474 | 0.0082 | 22.0029 | 0.1476 | 2 | 5 | palmitoyl-(protein) hydrolase activity |
| GO:0030375 | 0.0082 | 22.0029 | 0.1476 | 2 | 5 | thyroid hormone receptor coactivator activity |
| GO:0042809 | 0.0089 | 8.2641 | 0.4429 | 3 | 15 | vitamin D receptor binding |
| GOMFID | Pvalue | OddsRatio | ExpCount | Count | Size | Term |
| GO:0032396 | 9e-04 | 110.4714 | 0.0537 | 2 | 3 | inhibitory MHC class I receptor activity |
| GO:0015026 | 0.0024 | 7.9337 | 0.573 | 4 | 32 | coreceptor activity |
| GO:0031628 | 0.0031 | 36.819 | 0.0895 | 2 | 5 | opioid receptor binding |
| GO:0042288 | 0.0038 | 11.0767 | 0.3223 | 3 | 18 | MHC class I protein binding |
| GO:0008514 | 0.0079 | 2.9615 | 2.847 | 8 | 159 | organic anion transmembrane transporter activity |
| GO:0016298 | 0.0096 | 3.5176 | 1.8085 | 6 | 101 | lipase activity |
| GO:0004871 | 0.0097 | 1.5407 | 28.2734 | 41 | 1579 | signal transducer activity |
| GOMFID | Pvalue | OddsRatio | ExpCount | Count | Size | Term |
| GO:0060089 | 0 | 2.1253 | 22.6933 | 43 | 1508 | molecular transducer activity |
| GO:0004984 | 1e-04 | 3.2897 | 5.6131 | 17 | 373 | olfactory receptor activity |
| GO:0038023 | 2e-04 | 2.0687 | 19.1418 | 36 | 1272 | signaling receptor activity |
| GO:0099600 | 3e-04 | 2.025 | 18.3442 | 34 | 1219 | transmembrane receptor activity |
| GO:0043014 | 4e-04 | 13.9986 | 0.3461 | 4 | 23 | alpha-tubulin binding |
| GO:0035663 | 7e-04 | 132.0085 | 0.0451 | 2 | 3 | Toll-like receptor 2 binding |
| GO:0003960 | 0.0013 | 66 | 0.0602 | 2 | 4 | NADPH:quinone reductase activity |
| GO:0048030 | 0.0013 | 66 | 0.0602 | 2 | 4 | disaccharide binding |
| GO:0004930 | 0.0017 | 2.0833 | 11.7981 | 23 | 784 | G-protein coupled receptor activity |
| GO:0001530 | 0.0037 | 11.0356 | 0.316 | 3 | 21 | lipopolysaccharide binding |
| GO:0033218 | 0.0054 | 2.7451 | 3.8374 | 10 | 255 | amide binding |
| GO:0042605 | 0.0054 | 9.4573 | 0.3612 | 3 | 24 | peptide antigen binding |
| GO:0005549 | 0.0083 | 4.2645 | 1.249 | 5 | 83 | odorant binding |
| GO:0032395 | 0.0094 | 16.4936 | 0.1505 | 2 | 10 | MHC class II receptor activity |
| GOMFID | Pvalue | OddsRatio | ExpCount | Count | Size | Term |
| GO:0042605 | 0 | 18.1287 | 0.3505 | 5 | 24 | peptide antigen binding |
| GO:0004122 | 2e-04 | Inf | 0.0292 | 2 | 2 | cystathionine beta-synthase activity |
| GO:0032395 | 3e-04 | 29.2863 | 0.146 | 3 | 10 | MHC class II receptor activity |
| GO:0035663 | 6e-04 | 136.1228 | 0.0438 | 2 | 3 | Toll-like receptor 2 binding |
| GO:0035727 | 6e-04 | 136.1228 | 0.0438 | 2 | 3 | lysophosphatidic acid binding |
| GO:0004871 | 0.0026 | 1.7377 | 23.0599 | 37 | 1579 | signal transducer activity |
| GO:0019957 | 0.0042 | 27.2175 | 0.1022 | 2 | 7 | C-C chemokine binding |
| GO:0004181 | 0.005 | 9.7533 | 0.3505 | 3 | 24 | metallocarboxypeptidase activity |
| GO:0004872 | 0.0071 | 1.6529 | 22.023 | 34 | 1508 | receptor activity |
| GO:0035925 | 0.0071 | 19.4386 | 0.1314 | 2 | 9 | mRNA 3'-UTR AU-rich region binding |
| GO:0005549 | 0.0073 | 4.3991 | 1.2121 | 5 | 83 | odorant binding |
| GO:0016279 | 0.0079 | 5.4758 | 0.7886 | 4 | 54 | protein-lysine N-methyltransferase activity |
| GO:0045028 | 0.0088 | 17.0077 | 0.146 | 2 | 10 | G-protein coupled purinergic nucleotide receptor activity |
| GO:0004888 | 0.0097 | 1.7068 | 16.7881 | 27 | 1164 | transmembrane signaling receptor activity |
| GO:0004867 | 0.0098 | 4.0833 | 1.2998 | 5 | 89 | serine-type endopeptidase inhibitor activity |
| GOMFID | Pvalue | OddsRatio | ExpCount | Count | Size | Term |
| GO:0032395 | 4e-04 | 28.3974 | 0.1505 | 3 | 10 | MHC class II receptor activity |
| GO:0042605 | 4e-04 | 13.2979 | 0.3612 | 4 | 24 | peptide antigen binding |
| GO:0004331 | 0.0013 | 66 | 0.0602 | 2 | 4 | fructose-2,6-bisphosphate 2-phosphatase activity |
| GO:0004111 | 0.0033 | 32.9957 | 0.0903 | 2 | 6 | creatine kinase activity |
| GO:0050660 | 0.004 | 5.1217 | 1.0534 | 5 | 70 | flavin adenine dinucleotide binding |
| GO:0031748 | 0.0059 | 21.9943 | 0.1204 | 2 | 8 | D1 dopamine receptor binding |
| GO:0016712 | 0.0061 | 9.0268 | 0.3762 | 3 | 25 | oxidoreductase activity, acting on paired donors, with incorporation or reduction of molecular oxygen, reduced flavin or flavoprotein as one donor, and incorporation of one atom of oxygen |
| GO:0016595 | 0.0076 | 18.8511 | 0.1354 | 2 | 9 | glutamate binding |
| GO:0019203 | 0.0094 | 16.4936 | 0.1505 | 2 | 10 | carbohydrate phosphatase activity |
| GO:0045028 | 0.0094 | 16.4936 | 0.1505 | 2 | 10 | G-protein coupled purinergic nucleotide receptor activity |
| GOMFID | Pvalue | OddsRatio | ExpCount | Count | Size | Term |
| GO:0003796 | 2e-04 | 37.8902 | 0.1189 | 3 | 9 | lysozyme activity |
| GO:0004065 | 0.0046 | 25.1375 | 0.1057 | 2 | 8 | arylsulfatase activity |
| GOMFID | Pvalue | OddsRatio | ExpCount | Count | Size | Term |
| GO:0099600 | 1e-04 | 2.1265 | 18.6538 | 36 | 1219 | transmembrane receptor activity |
| GO:0038023 | 2e-04 | 2.0278 | 19.4649 | 36 | 1272 | signaling receptor activity |
| GO:0004872 | 4e-04 | 3.9784 | 2.7138 | 10 | 192 | receptor activity |
| GO:0004930 | 0.001 | 2.2761 | 9.8842 | 21 | 660 | G-protein coupled receptor activity |
| GO:0004468 | 0.0023 | 43.2497 | 0.0765 | 2 | 5 | lysine N-acetyltransferase activity, acting on acetyl phosphate as donor |
| GO:0038085 | 0.0023 | 43.2497 | 0.0765 | 2 | 5 | vascular endothelial growth factor binding |
| GO:0008528 | 0.003 | 3.9352 | 1.8975 | 7 | 124 | G-protein coupled peptide receptor activity |
| GO:0004931 | 0.0047 | 25.9464 | 0.1071 | 2 | 7 | extracellular ATP-gated cation channel activity |
| GO:0042974 | 0.0053 | 6.215 | 0.7039 | 4 | 46 | retinoic acid receptor binding |
| GO:0004435 | 0.0087 | 7.8066 | 0.4285 | 3 | 28 | phosphatidylinositol phospholipase C activity |
| GOMFID | Pvalue | OddsRatio | ExpCount | Count | Size | Term |
| GO:0004468 | 0 | 91.4764 | 0.0816 | 3 | 5 | lysine N-acetyltransferase activity, acting on acetyl phosphate as donor |
| GO:0016174 | 0.0026 | 40.4941 | 0.0816 | 2 | 5 | NAD(P)H oxidase activity |
| GO:0097157 | 0.0038 | 30.3686 | 0.0979 | 2 | 6 | pre-mRNA intronic binding |
| GO:0004652 | 0.007 | 20.2431 | 0.1305 | 2 | 8 | polynucleotide adenylyltransferase activity |
| GO:0030368 | 0.007 | 20.2431 | 0.1305 | 2 | 8 | interleukin-17 receptor activity |
| GO:0004596 | 0.0089 | 17.3501 | 0.1469 | 2 | 9 | peptide alpha-N-acetyltransferase activity |
| GOMFID | Pvalue | OddsRatio | ExpCount | Count | Size | Term |
| GO:0019834 | 0.0012 | 70.5682 | 0.0564 | 2 | 4 | phospholipase A2 inhibitor activity |
| GO:0047961 | 0.0012 | 70.5682 | 0.0564 | 2 | 4 | glycine N-acyltransferase activity |
| GO:0043024 | 0.0067 | 20.1558 | 0.1269 | 2 | 9 | ribosomal small subunit binding |
| GO:0004984 | 0.0068 | 2.4006 | 5.2579 | 12 | 373 | olfactory receptor activity |
| GOMFID | Pvalue | OddsRatio | ExpCount | Count | Size | Term |
| GO:0004364 | 1e-04 | 14.5586 | 0.4259 | 5 | 26 | glutathione transferase activity |
| GO:0099600 | 4e-04 | 1.9613 | 19.9696 | 36 | 1219 | transmembrane receptor activity |
| GO:0060089 | 4e-04 | 1.8602 | 24.704 | 42 | 1508 | molecular transducer activity |
| GO:0042605 | 6e-04 | 12.1819 | 0.3932 | 4 | 24 | peptide antigen binding |
| GO:0015016 | 0.0016 | 60.5039 | 0.0655 | 2 | 4 | [heparan sulfate]-glucosamine N-sulfotransferase activity |
| GO:0038023 | 0.0017 | 1.8085 | 20.8379 | 35 | 1272 | signaling receptor activity |
| GO:0005001 | 0.0025 | 13.0059 | 0.2785 | 3 | 17 | transmembrane receptor protein tyrosine phosphatase activity |
| GO:0004468 | 0.0026 | 40.3333 | 0.0819 | 2 | 5 | lysine N-acetyltransferase activity, acting on acetyl phosphate as donor |
| GO:0016901 | 0.0026 | 40.3333 | 0.0819 | 2 | 5 | oxidoreductase activity, acting on the CH-OH group of donors, quinone or similar compound as acceptor |
| GO:0019212 | 0.0027 | 7.6078 | 0.5898 | 4 | 36 | phosphatase inhibitor activity |
| GO:0001664 | 0.0028 | 2.842 | 4.0955 | 11 | 250 | G-protein coupled receptor binding |
| GO:0004984 | 0.0035 | 2.4185 | 6.1105 | 14 | 373 | olfactory receptor activity |
| GO:0005540 | 0.0046 | 10.1131 | 0.344 | 3 | 21 | hyaluronic acid binding |
| GO:0046977 | 0.0053 | 24.1969 | 0.1147 | 2 | 7 | TAP binding |
| GO:0031748 | 0.007 | 20.1628 | 0.1311 | 2 | 8 | D1 dopamine receptor binding |
| GO:0051766 | 0.007 | 20.1628 | 0.1311 | 2 | 8 | inositol trisphosphate kinase activity |
| GO:0008146 | 0.0084 | 5.4054 | 0.8027 | 4 | 49 | sulfotransferase activity |
| GOMFID | Pvalue | OddsRatio | ExpCount | Count | Size | Term |
| GO:0005102 | 7e-04 | 1.8679 | 22.1561 | 38 | 1407 | receptor binding |
| GO:0008656 | 0.0019 | 14.5884 | 0.252 | 3 | 16 | cysteine-type endopeptidase activator activity involved in apoptotic process |
| GO:0004984 | 0.0024 | 2.5235 | 5.8736 | 14 | 373 | olfactory receptor activity |
| GO:0047372 | 0.0049 | 25.1967 | 0.1102 | 2 | 7 | acylglycerol lipase activity |
| GO:0004865 | 0.0065 | 20.9959 | 0.126 | 2 | 8 | protein serine/threonine phosphatase inhibitor activity |
| GOMFID | Pvalue | OddsRatio | ExpCount | Count | Size | Term |
| GO:0050051 | 0.0016 | 60.5039 | 0.0655 | 2 | 4 | leukotriene-B4 20-monooxygenase activity |
| GO:0004468 | 0.0026 | 40.3333 | 0.0819 | 2 | 5 | lysine N-acetyltransferase activity, acting on acetyl phosphate as donor |
| GO:0005509 | 0.0028 | 2.0662 | 10.7794 | 21 | 658 | calcium ion binding |
| GO:0071723 | 0.0053 | 24.1969 | 0.1147 | 2 | 7 | lipopeptide binding |
| GO:0004126 | 0.007 | 20.1628 | 0.1311 | 2 | 8 | cytidine deaminase activity |
| GO:0051766 | 0.007 | 20.1628 | 0.1311 | 2 | 8 | inositol trisphosphate kinase activity |
| GO:0004364 | 0.0086 | 7.912 | 0.4259 | 3 | 26 | glutathione transferase activity |
| GO:0005184 | 0.0086 | 7.912 | 0.4259 | 3 | 26 | neuropeptide hormone activity |
| GO:0004984 | 0.0087 | 2.2302 | 6.1105 | 13 | 373 | olfactory receptor activity |
| GO:0030881 | 0.0089 | 17.2812 | 0.1474 | 2 | 9 | beta-2-microglobulin binding |
| GO:0099600 | 0.0096 | 1.6442 | 19.9696 | 31 | 1219 | transmembrane receptor activity |
| GO:0038023 | 0.0099 | 1.6273 | 20.8379 | 32 | 1272 | signaling receptor activity |
| GOMFID | Pvalue | OddsRatio | ExpCount | Count | Size | Term |
| GO:0032184 | 0.0041 | 29.0921 | 0.1021 | 2 | 6 | SUMO polymer binding |
| GO:0004364 | 0.0095 | 7.6085 | 0.4424 | 3 | 26 | glutathione transferase activity |
| GO:0005068 | 0.0096 | 16.6208 | 0.1532 | 2 | 9 | transmembrane receptor protein tyrosine kinase adaptor activity |
| GOMFID | Pvalue | OddsRatio | ExpCount | Count | Size | Term |
| GO:0005096 | 3e-04 | 3.3631 | 4.1549 | 13 | 246 | GTPase activator activity |
| GO:0042923 | 5e-04 | 13.117 | 0.3716 | 4 | 22 | neuropeptide binding |
| GO:0004888 | 7e-04 | 1.9081 | 19.8288 | 35 | 1174 | transmembrane signaling receptor activity |
| GO:0005313 | 0.0012 | 17.6498 | 0.2196 | 3 | 13 | L-glutamate transmembrane transporter activity |
| GO:0004872 | 0.0015 | 1.741 | 25.4701 | 41 | 1508 | receptor activity |
| GO:0060589 | 0.0017 | 2.7499 | 5.0163 | 13 | 297 | nucleoside-triphosphatase regulator activity |
| GO:0004908 | 0.0041 | 29.3163 | 0.1013 | 2 | 6 | interleukin-1 receptor activity |
| GO:0008528 | 0.0051 | 3.5495 | 2.0944 | 7 | 124 | G-protein coupled peptide receptor activity |
| GO:0050840 | 0.0093 | 5.2377 | 0.8276 | 4 | 49 | extracellular matrix binding |
| GOMFID | Pvalue | OddsRatio | ExpCount | Count | Size | Term |
| GO:0047961 | 0.0016 | 59.5577 | 0.0665 | 2 | 4 | glycine N-acyltransferase activity |
| GO:0033764 | 0.0055 | 9.4298 | 0.366 | 3 | 22 | steroid dehydrogenase activity, acting on the CH-OH group of donors, NAD or NADP as acceptor |
| GO:0030246 | 0.0057 | 2.5767 | 4.4917 | 11 | 270 | carbohydrate binding |
| GO:0047760 | 0.0072 | 19.8474 | 0.1331 | 2 | 8 | butyrate-CoA ligase activity |
| GO:0070410 | 0.0092 | 17.011 | 0.1497 | 2 | 9 | co-SMAD binding |
| GOMFID | Pvalue | OddsRatio | ExpCount | Count | Size | Term |
| GO:0070051 | 0.0016 | 60.7451 | 0.0653 | 2 | 4 | fibrinogen binding |
| GO:0004871 | 0.0095 | 1.5709 | 25.7669 | 38 | 1579 | signal transducer activity |
| NA. |
| n/a |
| GOMFID | Pvalue | OddsRatio | ExpCount | Count | Size | Term |
| GO:0030229 | 0.0013 | 66.8664 | 0.0594 | 2 | 4 | very-low-density lipoprotein particle receptor activity |
| GO:0005509 | 0.002 | 2.1793 | 9.7766 | 20 | 658 | calcium ion binding |
| GO:0004568 | 0.0021 | 44.5747 | 0.0743 | 2 | 5 | chitinase activity |
| GO:0048248 | 0.0021 | 44.5747 | 0.0743 | 2 | 5 | CXCR3 chemokine receptor binding |
| GO:0005248 | 0.0031 | 11.8396 | 0.2972 | 3 | 20 | voltage-gated sodium channel activity |
| GO:0004111 | 0.0032 | 33.4289 | 0.0891 | 2 | 6 | creatine kinase activity |
| GO:0071813 | 0.0052 | 9.5819 | 0.3566 | 3 | 24 | lipoprotein particle binding |
| GO:0008061 | 0.0058 | 22.283 | 0.1189 | 2 | 8 | chitin binding |
| GO:0032452 | 0.0089 | 7.7368 | 0.4309 | 3 | 29 | histone demethylase activity |
| GO:0004303 | 0.0091 | 16.7101 | 0.1486 | 2 | 10 | estradiol 17-beta-dehydrogenase activity |
| GOMFID | Pvalue | OddsRatio | ExpCount | Count | Size | Term |
| GO:0034235 | 2e-04 | 37.4831 | 0.1275 | 3 | 8 | GPI anchor binding |
| GO:0005185 | 3e-04 | Inf | 0.0319 | 2 | 2 | neurohypophyseal hormone activity |
| GO:0042605 | 5e-04 | 12.5328 | 0.3825 | 4 | 24 | peptide antigen binding |
| GO:0004699 | 8e-04 | 124.4739 | 0.0478 | 2 | 3 | calcium-independent protein kinase C activity |
| GO:0008559 | 8e-04 | 124.4739 | 0.0478 | 2 | 3 | xenobiotic-transporting ATPase activity |
| GO:0030395 | 8e-04 | 124.4739 | 0.0478 | 2 | 3 | lactose binding |
| GO:0004871 | 0.0012 | 1.7721 | 25.1653 | 41 | 1579 | signal transducer activity |
| GO:0008329 | 0.0023 | 13.379 | 0.2709 | 3 | 17 | signaling pattern recognition receptor activity |
| GO:0015347 | 0.0043 | 10.4032 | 0.3347 | 3 | 21 | sodium-independent organic anion transmembrane transporter activity |
| GO:0016907 | 0.005 | 24.8884 | 0.1116 | 2 | 7 | G-protein coupled acetylcholine receptor activity |
| GO:0035325 | 0.005 | 24.8884 | 0.1116 | 2 | 7 | Toll-like receptor binding |
| GO:0004872 | 0.0053 | 1.6487 | 24.0338 | 37 | 1508 | receptor activity |
| GO:0005044 | 0.0056 | 6.1053 | 0.7172 | 4 | 45 | scavenger receptor activity |
| GO:0004435 | 0.0098 | 7.4869 | 0.4463 | 3 | 28 | phosphatidylinositol phospholipase C activity |
| GOMFID | Pvalue | OddsRatio | ExpCount | Count | Size | Term |
| GO:0005509 | 0 | 2.8122 | 9.7766 | 25 | 658 | calcium ion binding |
| GO:0000253 | 7e-04 | 133.7414 | 0.0446 | 2 | 3 | 3-keto sterol reductase activity |
| GO:0005179 | 0.0018 | 4.3186 | 1.7384 | 7 | 117 | hormone activity |
| GO:0004111 | 0.0032 | 33.4289 | 0.0891 | 2 | 6 | creatine kinase activity |
| GO:0071813 | 0.0052 | 9.5819 | 0.3566 | 3 | 24 | lipoprotein particle binding |
| GO:0047760 | 0.0058 | 22.283 | 0.1189 | 2 | 8 | butyrate-CoA ligase activity |
| GO:0070181 | 0.0058 | 22.283 | 0.1189 | 2 | 8 | small ribosomal subunit rRNA binding |
| GO:0004303 | 0.0091 | 16.7101 | 0.1486 | 2 | 10 | estradiol 17-beta-dehydrogenase activity |
| GO:0031702 | 0.0091 | 16.7101 | 0.1486 | 2 | 10 | type 1 angiotensin receptor binding |
| GO:0004693 | 0.0098 | 7.4497 | 0.4457 | 3 | 30 | cyclin-dependent protein serine/threonine kinase activity |
| GOMFID | Pvalue | OddsRatio | ExpCount | Count | Size | Term |
| GO:0031852 | 7e-04 | 127.0656 | 0.0469 | 2 | 3 | mu-type opioid receptor binding |
| GO:0005237 | 0.0014 | 63.5287 | 0.0625 | 2 | 4 | inhibitory extracellular ligand-gated ion channel activity |
| GO:0004866 | 0.0034 | 3.4404 | 2.468 | 8 | 158 | endopeptidase inhibitor activity |
| GO:0043027 | 0.0047 | 10.0611 | 0.3436 | 3 | 22 | cysteine-type endopeptidase inhibitor activity involved in apoptotic process |
| GO:0008494 | 0.0048 | 25.4066 | 0.1093 | 2 | 7 | translation activator activity |
| GO:0042974 | 0.0057 | 6.0846 | 0.7185 | 4 | 46 | retinoic acid receptor binding |
| GO:0045502 | 0.006 | 9.1017 | 0.3749 | 3 | 24 | dynein binding |
| GO:0016175 | 0.0064 | 21.1708 | 0.125 | 2 | 8 | superoxide-generating NADPH oxidase activity |
| GO:0008009 | 0.0066 | 5.8073 | 0.7498 | 4 | 48 | chemokine activity |
| GO:0042169 | 0.0092 | 7.6435 | 0.4374 | 3 | 28 | SH2 domain binding |
| GOMFID | Pvalue | OddsRatio | ExpCount | Count | Size | Term |
| GO:0005102 | 2e-04 | 1.913 | 25.1936 | 44 | 1407 | receptor binding |
| GO:0005185 | 3e-04 | Inf | 0.0358 | 2 | 2 | neurohypophyseal hormone activity |
| GO:0008147 | 3e-04 | Inf | 0.0358 | 2 | 2 | structural constituent of bone |
| GO:0004871 | 6e-04 | 1.7717 | 28.2734 | 46 | 1579 | signal transducer activity |
| GO:0019955 | 8e-04 | 5.0876 | 1.5041 | 7 | 84 | cytokine binding |
| GO:0044548 | 0.0014 | 16.6204 | 0.2328 | 3 | 13 | S100 protein binding |
| GO:0005509 | 0.0018 | 2.0742 | 11.7821 | 23 | 658 | calcium ion binding |
| GO:0004974 | 0.0019 | 55.2321 | 0.0716 | 2 | 4 | leukotriene receptor activity |
| GO:0004872 | 0.0026 | 1.6713 | 27.0021 | 42 | 1508 | receptor activity |
| GO:0008656 | 0.0027 | 12.7825 | 0.2865 | 3 | 16 | cysteine-type endopeptidase activator activity involved in apoptotic process |
| GO:0004888 | 0.0037 | 1.723 | 21.0215 | 34 | 1174 | transmembrane signaling receptor activity |
| GO:0008528 | 0.007 | 3.3395 | 2.2203 | 7 | 124 | G-protein coupled peptide receptor activity |
| GO:0005070 | 0.0098 | 5.1611 | 0.8416 | 4 | 47 | SH3/SH2 adaptor activity |
| GOMFID | Pvalue | OddsRatio | ExpCount | Count | Size | Term |
| GO:0035663 | 8e-04 | 119.1231 | 0.0499 | 2 | 3 | Toll-like receptor 2 binding |
| GO:0004888 | 0.0011 | 1.8767 | 19.5306 | 34 | 1174 | transmembrane signaling receptor activity |
| GO:0008656 | 0.0022 | 13.7873 | 0.2662 | 3 | 16 | cysteine-type endopeptidase activator activity involved in apoptotic process |
| GO:0004871 | 0.0046 | 1.633 | 26.2682 | 40 | 1579 | signal transducer activity |
| GO:0008168 | 0.0072 | 2.7897 | 3.3937 | 9 | 204 | methyltransferase activity |
| GO:0004364 | 0.0089 | 7.7878 | 0.4325 | 3 | 26 | glutathione transferase activity |
| GO:0003823 | 0.0092 | 4.1653 | 1.281 | 5 | 77 | antigen binding |
| GOMFID | Pvalue | OddsRatio | ExpCount | Count | Size | Term |
| GO:0017022 | 5e-04 | 6.703 | 1.0027 | 6 | 56 | myosin binding |
| GO:0004565 | 0.0031 | 36.819 | 0.0895 | 2 | 5 | beta-galactosidase activity |
| GO:0098772 | 0.0054 | 1.6768 | 21.5408 | 34 | 1203 | molecular function regulator |
| GO:0005138 | 0.0063 | 22.0886 | 0.1253 | 2 | 7 | interleukin-6 receptor binding |
| GO:0030159 | 0.0077 | 8.3048 | 0.4118 | 3 | 23 | receptor signaling complex scaffold activity |
| GO:0004126 | 0.0083 | 18.406 | 0.1432 | 2 | 8 | cytidine deaminase activity |
| GOMFID | Pvalue | OddsRatio | ExpCount | Count | Size | Term |
| GO:0004984 | 3e-04 | 2.8092 | 6.4894 | 17 | 373 | olfactory receptor activity |
| GO:0032394 | 3e-04 | Inf | 0.0348 | 2 | 2 | MHC class Ib receptor activity |
| GO:0099600 | 0.0075 | 1.6497 | 21.2081 | 33 | 1219 | transmembrane receptor activity |
| GO:0016861 | 0.0079 | 18.9571 | 0.1392 | 2 | 8 | intramolecular oxidoreductase activity, interconverting aldoses and ketoses |
| GO:0038023 | 0.008 | 1.6292 | 22.1302 | 34 | 1272 | signaling receptor activity |
| GO:0008009 | 0.0096 | 5.1956 | 0.8351 | 4 | 48 | chemokine activity |
| GOMFID | Pvalue | OddsRatio | ExpCount | Count | Size | Term |
| GO:0004126 | 8e-04 | 23.9953 | 0.1966 | 3 | 8 | cytidine deaminase activity |
| GO:0004792 | 0.0018 | 79.7974 | 0.0737 | 2 | 3 | thiosulfate sulfurtransferase activity |
| GO:0047374 | 0.0018 | 79.7974 | 0.0737 | 2 | 3 | methylumbelliferyl-acetate deacetylase activity |
| GO:0004427 | 0.0035 | 39.8961 | 0.0983 | 2 | 4 | inorganic diphosphatase activity |
| GO:0019911 | 0.0035 | 39.8961 | 0.0983 | 2 | 4 | structural constituent of myelin sheath |
| GO:0019956 | 0.0044 | 10.9027 | 0.344 | 3 | 14 | chemokine binding |
| GO:0008536 | 0.0052 | 6.4071 | 0.7126 | 4 | 29 | Ran GTPase binding |
| GO:0016019 | 0.0057 | 26.5957 | 0.1229 | 2 | 5 | peptidoglycan receptor activity |
| GO:0016810 | 0.0091 | 2.9002 | 2.9242 | 8 | 119 | hydrolase activity, acting on carbon-nitrogen (but not peptide) bonds |
| GOMFID | Pvalue | OddsRatio | ExpCount | Count | Size | Term |
| GO:0030942 | 0.001 | 105.8493 | 0.056 | 2 | 3 | endoplasmic reticulum signal peptide binding |
| GO:0022890 | 0.002 | 2.2174 | 9.0726 | 19 | 486 | inorganic cation transmembrane transporter activity |
| GO:0008083 | 0.0022 | 3.3814 | 2.8375 | 9 | 152 | growth factor activity |
| GO:0070851 | 0.0023 | 3.6988 | 2.3148 | 8 | 124 | growth factor receptor binding |
| GO:0015491 | 0.0067 | 8.8414 | 0.392 | 3 | 21 | cation:cation antiporter activity |
| GO:0008312 | 0.0069 | 21.1644 | 0.1307 | 2 | 7 | 7S RNA binding |
| GO:0015385 | 0.0069 | 21.1644 | 0.1307 | 2 | 7 | sodium:proton antiporter activity |
| GO:0016907 | 0.0069 | 21.1644 | 0.1307 | 2 | 7 | G-protein coupled acetylcholine receptor activity |
| GO:0015078 | 0.0071 | 3.7672 | 1.6988 | 6 | 91 | hydrogen ion transmembrane transporter activity |
| GO:0019869 | 0.009 | 17.6358 | 0.1493 | 2 | 8 | chloride channel inhibitor activity |
| GO:0004114 | 0.0097 | 7.5768 | 0.448 | 3 | 24 | 3',5'-cyclic-nucleotide phosphodiesterase activity |
| GOMFID | Pvalue | OddsRatio | ExpCount | Count | Size | Term |
| GO:0016641 | 0.0023 | 14.0055 | 0.2749 | 3 | 13 | oxidoreductase activity, acting on the CH-NH2 group of donors, oxygen as acceptor |
| GO:0017127 | 0.0023 | 14.0055 | 0.2749 | 3 | 13 | cholesterol transporter activity |
| GO:0004953 | 0.0029 | 12.7314 | 0.296 | 3 | 14 | icosanoid receptor activity |
| GO:0008308 | 0.0029 | 12.7314 | 0.296 | 3 | 14 | voltage-gated anion channel activity |
| GO:0015288 | 0.0063 | 23.281 | 0.1269 | 2 | 6 | porin activity |
| GO:0019534 | 0.0063 | 23.281 | 0.1269 | 2 | 6 | toxin transporter activity |
| GO:0032050 | 0.0063 | 23.281 | 0.1269 | 2 | 6 | clathrin heavy chain binding |
| GO:0042608 | 0.0063 | 23.281 | 0.1269 | 2 | 6 | T cell receptor binding |
| GOMFID | Pvalue | OddsRatio | ExpCount | Count | Size | Term |
| GO:0015103 | 5e-04 | 4.705 | 1.8523 | 8 | 102 | inorganic anion transmembrane transporter activity |
| GO:0004784 | 0.0019 | 54.4401 | 0.0726 | 2 | 4 | superoxide dismutase activity |
| GO:0004745 | 0.0028 | 12.5985 | 0.2906 | 3 | 16 | retinol dehydrogenase activity |
| GO:0070566 | 0.008 | 8.1853 | 0.4177 | 3 | 23 | adenylyltransferase activity |
| GO:0005254 | 0.0094 | 4.151 | 1.2894 | 5 | 71 | chloride channel activity |
| GOMFID | Pvalue | OddsRatio | ExpCount | Count | Size | Term |
| GO:0005254 | 2e-04 | 6.4107 | 1.2172 | 7 | 71 | chloride channel activity |
| GO:0030197 | 0.0017 | 57.75 | 0.0686 | 2 | 4 | extracellular matrix constituent, lubricant activity |
| GO:0004888 | 0.0018 | 1.8121 | 20.127 | 34 | 1174 | transmembrane signaling receptor activity |
| GO:0015103 | 0.0019 | 4.3101 | 1.7487 | 7 | 102 | inorganic anion transmembrane transporter activity |
| GO:0004872 | 0.002 | 1.7101 | 25.8531 | 41 | 1508 | receptor activity |
| GO:0004890 | 0.0024 | 13.3673 | 0.2743 | 3 | 16 | GABA-A receptor activity |
| GO:0070888 | 0.0026 | 7.7439 | 0.5829 | 4 | 34 | E-box binding |
| GO:0017022 | 0.0027 | 5.7077 | 0.9601 | 5 | 56 | myosin binding |
| GO:0001159 | 0.0034 | 2.4277 | 6.0861 | 14 | 355 | core promoter proximal region DNA binding |
| GO:0004871 | 0.0046 | 1.6229 | 27.0703 | 41 | 1579 | signal transducer activity |
| GO:0000978 | 0.0054 | 2.3735 | 5.7604 | 13 | 336 | RNA polymerase II core promoter proximal region sequence-specific DNA binding |
| GO:0004952 | 0.0058 | 23.0955 | 0.12 | 2 | 7 | dopamine neurotransmitter receptor activity |
| GO:0043014 | 0.0068 | 8.6848 | 0.3943 | 3 | 23 | alpha-tubulin binding |
| GO:0031995 | 0.0077 | 19.245 | 0.1372 | 2 | 8 | insulin-like growth factor II binding |
| GO:0001228 | 0.008 | 2.3454 | 5.3661 | 12 | 313 | transcriptional activator activity, RNA polymerase II transcription regulatory region sequence-specific binding |
| GO:0019003 | 0.0091 | 5.2751 | 0.8229 | 4 | 48 | GDP binding |
| GO:0031994 | 0.0097 | 16.4947 | 0.1543 | 2 | 9 | insulin-like growth factor I binding |
| GOMFID | Pvalue | OddsRatio | ExpCount | Count | Size | Term |
| GO:0030957 | 0 | 38.6499 | 0.2037 | 4 | 8 | Tat protein binding |
| GO:0004303 | 0.0017 | 16.5194 | 0.2546 | 3 | 10 | estradiol 17-beta-dehydrogenase activity |
| GO:0000253 | 0.0019 | 76.9273 | 0.0764 | 2 | 3 | 3-keto sterol reductase activity |
| GO:0035663 | 0.0019 | 76.9273 | 0.0764 | 2 | 3 | Toll-like receptor 2 binding |
| GO:0003723 | 0.0021 | 1.5689 | 38.0656 | 56 | 1495 | RNA binding |
| GO:0001094 | 0.0061 | 25.6391 | 0.1273 | 2 | 5 | TFIID-class transcription factor binding |
| GO:0005001 | 0.0085 | 8.2559 | 0.4329 | 3 | 17 | transmembrane receptor protein tyrosine phosphatase activity |
| GO:0042803 | 0.0093 | 1.6812 | 17.416 | 28 | 684 | protein homodimerization activity |
| GOMFID | Pvalue | OddsRatio | ExpCount | Count | Size | Term |
| GO:0030395 | 8e-04 | 123.968 | 0.048 | 2 | 3 | lactose binding |
| GO:0004089 | 8e-04 | 20.7336 | 0.192 | 3 | 12 | carbonate dehydratase activity |
| GO:0004984 | 0.001 | 2.6764 | 5.9684 | 15 | 373 | olfactory receptor activity |
| GO:0004468 | 0.0025 | 41.3173 | 0.08 | 2 | 5 | lysine N-acetyltransferase activity, acting on acetyl phosphate as donor |
| GO:0005111 | 0.0025 | 41.3173 | 0.08 | 2 | 5 | type 2 fibroblast growth factor receptor binding |
| GO:0004111 | 0.0037 | 30.986 | 0.096 | 2 | 6 | creatine kinase activity |
| GO:0019966 | 0.0037 | 30.986 | 0.096 | 2 | 6 | interleukin-1 binding |
| GO:0004930 | 0.0038 | 1.9449 | 12.5448 | 23 | 784 | G-protein coupled receptor activity |
| GO:0016835 | 0.0041 | 5.1225 | 1.0561 | 5 | 66 | carbon-oxygen lyase activity |
| GO:0017169 | 0.0067 | 20.6547 | 0.128 | 2 | 8 | CDP-alcohol phosphatidyltransferase activity |
| GO:0099600 | 0.0069 | 1.6895 | 19.5052 | 31 | 1219 | transmembrane receptor activity |
| GOMFID | Pvalue | OddsRatio | ExpCount | Count | Size | Term |
| GO:0004829 | 8e-04 | 120.062 | 0.0495 | 2 | 3 | threonine-tRNA ligase activity |
| GO:0043325 | 0.0035 | 11.2887 | 0.3137 | 3 | 19 | phosphatidylinositol-3,4-bisphosphate binding |
| GO:0042605 | 0.007 | 8.5981 | 0.3962 | 3 | 24 | peptide antigen binding |
| NA. |
| n/a |
| NA. |
| n/a |
| NA. |
| n/a |
| NA. |
| n/a |
| NA. |
| n/a |
| NA. |
| n/a |
| NA. |
| n/a |
| NA. |
| n/a |
| NA. |
| n/a |
| NA. |
| n/a |
| NA. |
| n/a |
| NA. |
| n/a |
| NA. |
| n/a |
| NA. |
| n/a |
| NA. |
| n/a |
| NA. |
| n/a |
| NA. |
| n/a |
| NA. |
| n/a |
| NA. |
| n/a |
| NA. |
| n/a |
| NA. |
| n/a |
| NA. |
| n/a |
| NA. |
| n/a |
| NA. |
| n/a |
| NA. |
| n/a |
| NA. |
| n/a |
| NA. |
| n/a |
| NA. |
| n/a |
| NA. |
| n/a |
| NA. |
| n/a |
| NA. |
| n/a |
| NA. |
| n/a |
| NA. |
| n/a |
| NA. |
| n/a |
| NA. |
| n/a |
| NA. |
| n/a |
| NA. |
| n/a |
| NA. |
| n/a |
| NA. |
| n/a |
| NA. |
| n/a |
| NA. |
| n/a |
| NA. |
| n/a |
| NA. |
| n/a |
| NA. |
| n/a |
| NA. |
| n/a |
| NA. |
| n/a |
| NA. |
| n/a |
| NA. |
| n/a |
| NA. |
| n/a |
| NA. |
| n/a |
| NA. |
| n/a |
| NA. |
| n/a |
| NA. |
| n/a |
| NA. |
| n/a |
| NA. |
| n/a |
| NA. |
| n/a |
| NA. |
| n/a |
| NA. |
| n/a |
| NA. |
| n/a |
| NA. |
| n/a |
| NA. |
| n/a |
| NA. |
| n/a |
| NA. |
| n/a |
| NA. |
| n/a |
| NA. |
| n/a |
| NA. |
| n/a |
| NA. |
| n/a |
| NA. |
| n/a |
| NA. |
| n/a |
| NA. |
| n/a |
| NA. |
| n/a |
| NA. |
| n/a |
| NA. |
| n/a |
| NA. |
| n/a |
| NA. |
| n/a |
| NA. |
| n/a |
| NA. |
| n/a |
| NA. |
| n/a |
| NA. |
| n/a |
| NA. |
| n/a |
| NA. |
| n/a |
| NA. |
| n/a |
| NA. |
| n/a |
| NA. |
| n/a |
| NA. |
| n/a |
| NA. |
| n/a |
| NA. |
| n/a |
| NA. |
| n/a |
| NA. |
| n/a |
| NA. |
| n/a |
| NA. |
| n/a |
| NA. |
| n/a |
| NA. |
| n/a |
| NA. |
| n/a |
| NA. |
| n/a |
| NA. |
| n/a |
| NA. |
| n/a |
| NA. |
| n/a |
| NA. |
| n/a |
| NA. |
| n/a |
| NA. |
| n/a |
| NA. |
| n/a |
| NA. |
| n/a |
| NA. |
| n/a |
| NA. |
| n/a |
| NA. |
| n/a |
| NA. |
| n/a |
| NA. |
| n/a |
| NA. |
| n/a |
| NA. |
| n/a |
| NA. |
| n/a |
| NA. |
| n/a |
| NA. |
| n/a |
| NA. |
| n/a |
| NA. |
| n/a |
| NA. |
| n/a |
| NA. |
| n/a |
| NA. |
| n/a |
| NA. |
| n/a |
| NA. |
| n/a |
| NA. |
| n/a |
| NA. |
| n/a |
| NA. |
| n/a |
| NA. |
| n/a |
| NA. |
| n/a |
| NA. |
| n/a |
| NA. |
| n/a |
| NA. |
| n/a |
| NA. |
| n/a |
| NA. |
| n/a |
| NA. |
| n/a |
| NA. |
| n/a |
| NA. |
| n/a |
| NA. |
| n/a |
| NA. |
| n/a |
| NA. |
| n/a |
| NA. |
| n/a |
| NA. |
| n/a |
| NA. |
| n/a |
| NA. |
| n/a |
| NA. |
| n/a |
| NA. |
| n/a |
| NA. |
| n/a |
| NA. |
| n/a |
| NA. |
| n/a |
| NA. |
| n/a |
| NA. |
| n/a |
| NA. |
| n/a |
| NA. |
| n/a |
| NA. |
| n/a |
| NA. |
| n/a |
| NA. |
| n/a |
| NA. |
| n/a |
| NA. |
| n/a |
| NA. |
| n/a |
| NA. |
| n/a |
| NA. |
| n/a |
| NA. |
| n/a |
| NA. |
| n/a |
| NA. |
| n/a |
| NA. |
| n/a |
| NA. |
| n/a |
| NA. |
| n/a |
| NA. |
| n/a |
| NA. |
| n/a |
| NA. |
| n/a |
| NA. |
| n/a |
| NA. |
| n/a |
| NA. |
| n/a |
| NA. |
| n/a |
| NA. |
| n/a |
| NA. |
| n/a |
| NA. |
| n/a |
| NA. |
| n/a |
| NA. |
| n/a |
| NA. |
| n/a |
| NA. |
| n/a |
| NA. |
| n/a |
| NA. |
| n/a |
| NA. |
| n/a |
| NA. |
| n/a |
| NA. |
| n/a |
| NA. |
| n/a |
| NA. |
| n/a |
| NA. |
| n/a |
| NA. |
| n/a |
| NA. |
| n/a |
| NA. |
| n/a |
| NA. |
| n/a |
| NA. |
| n/a |
| NA. |
| n/a |
| NA. |
| n/a |
| NA. |
| n/a |
| NA. |
| n/a |
| NA. |
| n/a |
| NA. |
| n/a |
| NA. |
| n/a |
| NA. |
| n/a |
| NA. |
| n/a |
| NA. |
| n/a |
| NA. |
| n/a |
| NA. |
| n/a |
| NA. |
| n/a |
| NA. |
| n/a |
| NA. |
| n/a |
| NA. |
| n/a |
| NA. |
| n/a |
| NA. |
| n/a |
| NA. |
| n/a |
| NA. |
| n/a |
| NA. |
| n/a |
| NA. |
| n/a |
| NA. |
| n/a |
| NA. |
| n/a |
| NA. |
| n/a |
| NA. |
| n/a |
| NA. |
| n/a |
| NA. |
| n/a |
| NA. |
| n/a |
| NA. |
| n/a |
| NA. |
| n/a |
| NA. |
| n/a |
| NA. |
| n/a |
| NA. |
| n/a |
| NA. |
| n/a |
| NA. |
| n/a |
| NA. |
| n/a |
| NA. |
| n/a |
| NA. |
| n/a |
| NA. |
| n/a |
| NA. |
| n/a |
| NA. |
| n/a |
| NA. |
| n/a |
| NA. |
| n/a |
| NA. |
| n/a |
| NA. |
| n/a |
| NA. |
| n/a |
| NA. |
| n/a |
| NA. |
| n/a |
| NA. |
| n/a |
| NA. |
| n/a |
| NA. |
| n/a |
| NA. |
| n/a |
| NA. |
| n/a |
| NA. |
| n/a |
| NA. |
| n/a |
| NA. |
| n/a |
| NA. |
| n/a |
| NA. |
| n/a |
| NA. |
| n/a |
| NA. |
| n/a |
| NA. |
| n/a |
| NA. |
| n/a |
| NA. |
| n/a |
| NA. |
| n/a |
| NA. |
| n/a |
| NA. |
| n/a |
| NA. |
| n/a |
| NA. |
| n/a |
| NA. |
| n/a |
| NA. |
| n/a |
| NA. |
| n/a |
| NA. |
| n/a |
| NA. |
| n/a |
| NA. |
| n/a |
| NA. |
| n/a |
| NA. |
| n/a |
| NA. |
| n/a |
| NA. |
| n/a |
| NA. |
| n/a |
| NA. |
| n/a |
| NA. |
| n/a |
| NA. |
| n/a |
| NA. |
| n/a |
| NA. |
| n/a |
| NA. |
| n/a |
| NA. |
| n/a |
| NA. |
| n/a |
| NA. |
| n/a |
| NA. |
| n/a |
| NA. |
| n/a |
| NA. |
| n/a |
| NA. |
| n/a |
| NA. |
| n/a |
| NA. |
| n/a |
| NA. |
| n/a |
| NA. |
| n/a |
| NA. |
| n/a |
| NA. |
| n/a |
| NA. |
| n/a |
| NA. |
| n/a |
| NA. |
| n/a |
| NA. |
| n/a |
| NA. |
| n/a |
| NA. |
| n/a |
| NA. |
| n/a |
| NA. |
| n/a |
| NA. |
| n/a |
| NA. |
| n/a |
| NA. |
| n/a |
| NA. |
| n/a |
| NA. |
| n/a |
| NA. |
| n/a |
| NA. |
| n/a |
| NA. |
| n/a |
| NA. |
| n/a |
| NA. |
| n/a |
| NA. |
| n/a |
| NA. |
| n/a |
| NA. |
| n/a |
| NA. |
| n/a |
| NA. |
| n/a |
| NA. |
| n/a |
| NA. |
| n/a |
| NA. |
| n/a |
| NA. |
| n/a |
| NA. |
| n/a |
| NA. |
| n/a |
| NA. |
| n/a |
| NA. |
| n/a |
| NA. |
| n/a |
| NA. |
| n/a |
| NA. |
| n/a |
| NA. |
| n/a |
| NA. |
| n/a |
| NA. |
| n/a |
| NA. |
| n/a |
| NA. |
| n/a |
| NA. |
| n/a |
| NA. |
| n/a |
| NA. |
| n/a |
| NA. |
| n/a |
| NA. |
| n/a |
| NA. |
| n/a |
| NA. |
| n/a |
| NA. |
| n/a |
| NA. |
| n/a |
| NA. |
| n/a |
| NA. |
| n/a |
| NA. |
| n/a |
| NA. |
| n/a |
| NA. |
| n/a |
| NA. |
| n/a |
| NA. |
| n/a |
| NA. |
| n/a |
| NA. |
| n/a |
| NA. |
| n/a |
| NA. |
| n/a |
| NA. |
| n/a |
| NA. |
| n/a |
| NA. |
| n/a |
| NA. |
| n/a |
| NA. |
| n/a |
| NA. |
| n/a |
| NA. |
| n/a |
| NA. |
| n/a |
| NA. |
| n/a |
| NA. |
| n/a |
| NA. |
| n/a |
| NA. |
| n/a |
| NA. |
| n/a |
| NA. |
| n/a |
| NA. |
| n/a |
| NA. |
| n/a |
| NA. |
| n/a |
| NA. |
| n/a |
| NA. |
| n/a |
| NA. |
| n/a |
| NA. |
| n/a |
| NA. |
| n/a |
| NA. |
| n/a |
| NA. |
| n/a |
| NA. |
| n/a |
| NA. |
| n/a |
| NA. |
| n/a |
| NA. |
| n/a |
| NA. |
| n/a |
| NA. |
| n/a |
| NA. |
| n/a |
| NA. |
| n/a |
| NA. |
| n/a |
| NA. |
| n/a |
| NA. |
| n/a |
| NA. |
| n/a |
| NA. |
| n/a |
| NA. |
| n/a |
| NA. |
| n/a |
| NA. |
| n/a |
| NA. |
| n/a |
| NA. |
| n/a |
| NA. |
| n/a |
| NA. |
| n/a |
| NA. |
| n/a |
| NA. |
| n/a |
| NA. |
| n/a |
| NA. |
| n/a |
| NA. |
| n/a |
| NA. |
| n/a |
| NA. |
| n/a |
| NA. |
| n/a |
| NA. |
| n/a |
| NA. |
| n/a |
| NA. |
| n/a |
| NA. |
| n/a |
| NA. |
| n/a |
| NA. |
| n/a |
| NA. |
| n/a |
| NA. |
| n/a |
| NA. |
| n/a |
| NA. |
| n/a |
| NA. |
| n/a |
| NA. |
| n/a |
| NA. |
| n/a |
| NA. |
| n/a |
| NA. |
| n/a |
| NA. |
| n/a |
| NA. |
| n/a |
| NA. |
| n/a |
| NA. |
| n/a |
| NA. |
| n/a |
| NA. |
| n/a |
| NA. |
| n/a |
| NA. |
| n/a |
| NA. |
| n/a |
| NA. |
| n/a |
| NA. |
| n/a |
| NA. |
| n/a |
| NA. |
| n/a |
| NA. |
| n/a |
| NA. |
| n/a |
| NA. |
| n/a |
| NA. |
| n/a |
| NA. |
| n/a |
| NA. |
| n/a |
| NA. |
| n/a |
| NA. |
| n/a |
| NA. |
| n/a |
| NA. |
| n/a |
| NA. |
| n/a |
| NA. |
| n/a |
| NA. |
| n/a |
| NA. |
| n/a |
| NA. |
| n/a |
| NA. |
| n/a |
| NA. |
| n/a |
| NA. |
| n/a |
| NA. |
| n/a |
| NA. |
| n/a |
| NA. |
| n/a |
| NA. |
| n/a |
| NA. |
| n/a |
| NA. |
| n/a |
| NA. |
| n/a |
| NA. |
| n/a |
| NA. |
| n/a |
| NA. |
| n/a |
| NA. |
| n/a |
| NA. |
| n/a |
| NA. |
| n/a |
| NA. |
| n/a |
| NA. |
| n/a |
| NA. |
| n/a |
| NA. |
| n/a |
| NA. |
| n/a |
| NA. |
| n/a |
| NA. |
| n/a |
| NA. |
| n/a |
| NA. |
| n/a |
| NA. |
| n/a |
| NA. |
| n/a |
| NA. |
| n/a |
| NA. |
| n/a |
| NA. |
| n/a |
| NA. |
| n/a |
| NA. |
| n/a |
| NA. |
| n/a |
| NA. |
| n/a |
| NA. |
| n/a |
| NA. |
| n/a |
| NA. |
| n/a |
| NA. |
| n/a |
| NA. |
| n/a |
| NA. |
| n/a |
| NA. |
| n/a |
| NA. |
| n/a |
| NA. |
| n/a |
| NA. |
| n/a |
| NA. |
| n/a |
| NA. |
| n/a |
| NA. |
| n/a |
| NA. |
| n/a |
| NA. |
| n/a |
| NA. |
| n/a |
| NA. |
| n/a |
| NA. |
| n/a |
| NA. |
| n/a |
| NA. |
| n/a |
| NA. |
| n/a |
| NA. |
| n/a |
| NA. |
| n/a |
| NA. |
| n/a |
| NA. |
| n/a |
| NA. |
| n/a |
| NA. |
| n/a |
| NA. |
| n/a |
| NA. |
| n/a |
| NA. |
| n/a |
| NA. |
| n/a |
| NA. |
| n/a |
| NA. |
| n/a |
| NA. |
| n/a |
| NA. |
| n/a |
| NA. |
| n/a |
| NA. |
| n/a |
| NA. |
| n/a |
| NA. |
| n/a |
| NA. |
| n/a |
| NA. |
| n/a |
| NA. |
| n/a |
| NA. |
| n/a |
| NA. |
| n/a |
| NA. |
| n/a |
| NA. |
| n/a |
| NA. |
| n/a |
| NA. |
| n/a |
| NA. |
| n/a |
| NA. |
| n/a |
| NA. |
| n/a |
| NA. |
| n/a |
| NA. |
| n/a |
| NA. |
| n/a |
| NA. |
| n/a |
| NA. |
| n/a |
| NA. |
| n/a |
| NA. |
| n/a |
| NA. |
| n/a |
| NA. |
| n/a |
| NA. |
| n/a |
| NA. |
| n/a |
| NA. |
| n/a |
| NA. |
| n/a |
| NA. |
| n/a |
| NA. |
| n/a |
| NA. |
| n/a |
| NA. |
| n/a |
| NA. |
| n/a |
| NA. |
| n/a |
| NA. |
| n/a |
| NA. |
| n/a |
| NA. |
| n/a |
| NA. |
| n/a |
| NA. |
| n/a |
| NA. |
| n/a |
| NA. |
| n/a |
| NA. |
| n/a |
| NA. |
| n/a |
| NA. |
| n/a |
| NA. |
| n/a |
| NA. |
| n/a |
| NA. |
| n/a |
| NA. |
| n/a |
| NA. |
| n/a |
| NA. |
| n/a |
| NA. |
| n/a |
| NA. |
| n/a |
| NA. |
| n/a |
| NA. |
| n/a |
| NA. |
| n/a |
| NA. |
| n/a |
| NA. |
| n/a |
| NA. |
| n/a |
| NA. |
| n/a |
| NA. |
| n/a |
| NA. |
| n/a |
| NA. |
| n/a |
| NA. |
| n/a |
| NA. |
| n/a |
| NA. |
| n/a |
| NA. |
| n/a |
| NA. |
| n/a |
| NA. |
| n/a |
| NA. |
| n/a |
| NA. |
| n/a |
| NA. |
| n/a |
| NA. |
| n/a |
| NA. |
| n/a |
| NA. |
| n/a |
| NA. |
| n/a |
| NA. |
| n/a |
| NA. |
| n/a |
| NA. |
| n/a |
| NA. |
| n/a |
| NA. |
| n/a |
| NA. |
| n/a |
| NA. |
| n/a |
| NA. |
| n/a |
| NA. |
| n/a |
| NA. |
| n/a |
| NA. |
| n/a |
| NA. |
| n/a |
| NA. |
| n/a |
| NA. |
| n/a |
| NA. |
| n/a |
| NA. |
| n/a |
| NA. |
| n/a |
| NA. |
| n/a |
| NA. |
| n/a |
| NA. |
| n/a |
| NA. |
| n/a |
| NA. |
| n/a |
| NA. |
| n/a |
| NA. |
| n/a |
| NA. |
| n/a |
| NA. |
| n/a |
| NA. |
| n/a |
| NA. |
| n/a |
| NA. |
| n/a |
| NA. |
| n/a |
| NA. |
| n/a |
| NA. |
| n/a |
| NA. |
| n/a |
| NA. |
| n/a |
| NA. |
| n/a |
| NA. |
| n/a |
| NA. |
| n/a |
| NA. |
| n/a |
| NA. |
| n/a |
| NA. |
| n/a |
| NA. |
| n/a |
| NA. |
| n/a |
| NA. |
| n/a |
| NA. |
| n/a |
| NA. |
| n/a |
| NA. |
| n/a |
| NA. |
| n/a |
| NA. |
| n/a |
| NA. |
| n/a |
| NA. |
| n/a |
| NA. |
| n/a |
| NA. |
| n/a |
| NA. |
| n/a |
| NA. |
| n/a |
| NA. |
| n/a |
| NA. |
| n/a |
| NA. |
| n/a |
| NA. |
| n/a |
| NA. |
| n/a |
| NA. |
| n/a |
| NA. |
| n/a |
| NA. |
| n/a |
| NA. |
| n/a |
| NA. |
| n/a |
| NA. |
| n/a |
| NA. |
| n/a |
| NA. |
| n/a |
| NA. |
| n/a |
| NA. |
| n/a |
| NA. |
| n/a |
| NA. |
| n/a |
| NA. |
| n/a |
| NA. |
| n/a |
| NA. |
| n/a |
| NA. |
| n/a |
| NA. |
| n/a |
| NA. |
| n/a |
| NA. |
| n/a |
| NA. |
| n/a |
| NA. |
| n/a |
| NA. |
| n/a |
| NA. |
| n/a |
| NA. |
| n/a |
| NA. |
| n/a |
| NA. |
| n/a |
| NA. |
| n/a |
| NA. |
| n/a |
| NA. |
| n/a |
| NA. |
| n/a |
| NA. |
| n/a |
| NA. |
| n/a |
| NA. |
| n/a |
| NA. |
| n/a |
| NA. |
| n/a |
| NA. |
| n/a |
| NA. |
| n/a |
| NA. |
| n/a |
| NA. |
| n/a |
| NA. |
| n/a |
| NA. |
| n/a |
| NA. |
| n/a |
| NA. |
| n/a |
| NA. |
| n/a |
| NA. |
| n/a |
| NA. |
| n/a |
| NA. |
| n/a |
| NA. |
| n/a |
| NA. |
| n/a |
| NA. |
| n/a |
| NA. |
| n/a |
| NA. |
| n/a |
| NA. |
| n/a |
| NA. |
| n/a |
| NA. |
| n/a |
| NA. |
| n/a |
| NA. |
| n/a |
| NA. |
| n/a |
| NA. |
| n/a |
| NA. |
| n/a |
| NA. |
| n/a |
| NA. |
| n/a |
| NA. |
| n/a |
| NA. |
| n/a |
| NA. |
| n/a |
| NA. |
| n/a |
| NA. |
| n/a |
| NA. |
| n/a |
| NA. |
| n/a |
| NA. |
| n/a |
| NA. |
| n/a |
| NA. |
| n/a |
| NA. |
| n/a |
| NA. |
| n/a |
| NA. |
| n/a |
| NA. |
| n/a |
| NA. |
| n/a |
| NA. |
| n/a |
| NA. |
| n/a |
| NA. |
| n/a |
| NA. |
| n/a |
| NA. |
| n/a |
| NA. |
| n/a |
| NA. |
| n/a |
| NA. |
| n/a |
| NA. |
| n/a |
| NA. |
| n/a |
| NA. |
| n/a |
| NA. |
| n/a |
| NA. |
| n/a |
| NA. |
| n/a |
| NA. |
| n/a |
| NA. |
| n/a |
| NA. |
| n/a |
| NA. |
| n/a |
| NA. |
| n/a |
| NA. |
| n/a |
| NA. |
| n/a |
| NA. |
| n/a |
| NA. |
| n/a |
| NA. |
| n/a |
| NA. |
| n/a |
| NA. |
| n/a |
| NA. |
| n/a |
| NA. |
| n/a |
| NA. |
| n/a |
| NA. |
| n/a |
| NA. |
| n/a |
| NA. |
| n/a |
| NA. |
| n/a |
| NA. |
| n/a |
| NA. |
| n/a |
| NA. |
| n/a |
| NA. |
| n/a |
| NA. |
| n/a |
| NA. |
| n/a |
| NA. |
| n/a |
| NA. |
| n/a |
| NA. |
| n/a |
| NA. |
| n/a |
| NA. |
| n/a |
| NA. |
| n/a |
| NA. |
| n/a |
| NA. |
| n/a |
| NA. |
| n/a |
| NA. |
| n/a |
| NA. |
| n/a |
| NA. |
| n/a |
| NA. |
| n/a |
| NA. |
| n/a |
| NA. |
| n/a |
| NA. |
| n/a |
| NA. |
| n/a |
| NA. |
| n/a |
| NA. |
| n/a |
| NA. |
| n/a |
| NA. |
| n/a |
| NA. |
| n/a |
| NA. |
| n/a |
| NA. |
| n/a |
| NA. |
| n/a |
| NA. |
| n/a |
| NA. |
| n/a |
| NA. |
| n/a |
| NA. |
| n/a |
| NA. |
| n/a |
| NA. |
| n/a |
| NA. |
| n/a |
| NA. |
| n/a |
| NA. |
| n/a |
| NA. |
| n/a |
| NA. |
| n/a |
| NA. |
| n/a |
| NA. |
| n/a |
| NA. |
| n/a |
| NA. |
| n/a |
| NA. |
| n/a |
| NA. |
| n/a |
| NA. |
| n/a |
| NA. |
| n/a |
| NA. |
| n/a |
| NA. |
| n/a |
| NA. |
| n/a |
| NA. |
| n/a |
| NA. |
| n/a |
| NA. |
| n/a |
| NA. |
| n/a |
| NA. |
| n/a |
| NA. |
| n/a |
| NA. |
| n/a |
| NA. |
| n/a |
| NA. |
| n/a |
| NA. |
| n/a |
| NA. |
| n/a |
| NA. |
| n/a |
| NA. |
| n/a |
| NA. |
| n/a |
| NA. |
| n/a |
| NA. |
| n/a |
| NA. |
| n/a |
| NA. |
| n/a |
| NA. |
| n/a |
| NA. |
| n/a |
| NA. |
| n/a |
| NA. |
| n/a |
| NA. |
| n/a |
| NA. |
| n/a |
| NA. |
| n/a |
| NA. |
| n/a |
| NA. |
| n/a |
| NA. |
| n/a |
| NA. |
| n/a |
| NA. |
| n/a |
| NA. |
| n/a |
| NA. |
| n/a |
| NA. |
| n/a |
| NA. |
| n/a |
| NA. |
| n/a |
| NA. |
| n/a |
| NA. |
| n/a |
| NA. |
| n/a |
| NA. |
| n/a |
| NA. |
| n/a |
| NA. |
| n/a |
| NA. |
| n/a |
| NA. |
| n/a |
| NA. |
| n/a |
| NA. |
| n/a |
| NA. |
| n/a |
| NA. |
| n/a |
| NA. |
| n/a |
| NA. |
| n/a |
| NA. |
| n/a |
| NA. |
| n/a |
| NA. |
| n/a |
| NA. |
| n/a |
| NA. |
| n/a |
| NA. |
| n/a |
| NA. |
| n/a |
| NA. |
| n/a |
| NA. |
| n/a |
| NA. |
| n/a |
| NA. |
| n/a |
| NA. |
| n/a |
| NA. |
| n/a |
| NA. |
| n/a |
| NA. |
| n/a |
| NA. |
| n/a |
| NA. |
| n/a |
| NA. |
| n/a |
| NA. |
| n/a |
| NA. |
| n/a |
| NA. |
| n/a |
| NA. |
| n/a |
| NA. |
| n/a |
| NA. |
| n/a |
| NA. |
| n/a |
| NA. |
| n/a |
| NA. |
| n/a |
| NA. |
| n/a |
| NA. |
| n/a |
| NA. |
| n/a |
| NA. |
| n/a |
| NA. |
| n/a |
| NA. |
| n/a |
| NA. |
| n/a |
| NA. |
| n/a |
| NA. |
| n/a |
| NA. |
| n/a |
| NA. |
| n/a |
| NA. |
| n/a |
| NA. |
| n/a |
| NA. |
| n/a |
| NA. |
| n/a |
| NA. |
| n/a |
| NA. |
| n/a |
| NA. |
| n/a |
| NA. |
| n/a |
| NA. |
| n/a |
| NA. |
| n/a |
| NA. |
| n/a |
| NA. |
| n/a |
| NA. |
| n/a |
| NA. |
| n/a |
| NA. |
| n/a |
| NA. |
| n/a |
| NA. |
| n/a |
| NA. |
| n/a |
| NA. |
| n/a |
| NA. |
| n/a |
| NA. |
| n/a |
| NA. |
| n/a |
| NA. |
| n/a |
| NA. |
| n/a |
| NA. |
| n/a |
| NA. |
| n/a |
| NA. |
| n/a |
| NA. |
| n/a |
| NA. |
| n/a |
| NA. |
| n/a |
| NA. |
| n/a |
| NA. |
| n/a |
| NA. |
| n/a |
| NA. |
| n/a |
| NA. |
| n/a |
| NA. |
| n/a |
| NA. |
| n/a |
| NA. |
| n/a |
| NA. |
| n/a |
| NA. |
| n/a |
| NA. |
| n/a |
| NA. |
| n/a |
| NA. |
| n/a |
| NA. |
| n/a |
| NA. |
| n/a |
| NA. |
| n/a |
| NA. |
| n/a |
| NA. |
| n/a |
| NA. |
| n/a |
| NA. |
| n/a |
| NA. |
| n/a |
| NA. |
| n/a |
| NA. |
| n/a |
| NA. |
| n/a |
| NA. |
| n/a |
| NA. |
| n/a |
| NA. |
| n/a |
| NA. |
| n/a |
| NA. |
| n/a |
| NA. |
| n/a |
| NA. |
| n/a |
| NA. |
| n/a |
| NA. |
| n/a |