Differential methylation on the region level was computed based on a variety of metrics. Of particular interest for the following plots and analyses are the following quantities for each region: the mean methylation difference in a region of the two groups being and of quotient of mean methylation levelsas well as a p-value obtained from statistical testing (limma or t-test; depending on parameter settings). Additionally each region was assigned a rank based on each of these three criteria. A combined rank is computed as the maximum (i.e. worst) value among the three ranks. The smaller the combined rank for a region, the more evidence for differential methylation it exhibits. Regions were defined based on the region types specified in the analysis. This section includes scatterplots of the region group means as well as volcano plots of each pairwise comparison colored according to the combined rank of a given region.
The following rank cutfoffs have been automatically selected for the analysis of differentially methylated regions:
| tiling | cpgislands | genes | promoters | ensembleRegBuildBPall | ensembleRegBuildBPallMerged | |
| CMP vs. MEP (based on cmp_ct_CMPvMEP) | 0 | 0 | 0 | 0 | 0 | 0 |
| CMP vs. GMP (based on cmp_ct_CMPvGMP) | 0 | 0 | 0 | 0 | 0 | 0 |
| CLP vs. CMP (based on cmp_ct_CMPvCLP) | 0 | 0 | 0 | 0 | 0 | 0 |
| GMP vs. MLP3 (based on cmp_ct_MLP3vGMP) | 0 | 0 | 0 | 0 | 0 | 0 |
| CLP vs. MLP0 (based on cmp_ct_CLPvMLP0) | 0 | 0 | 0 | 0 | 0 | 0 |
| CLP vs. MLP1 (based on cmp_ct_CLPvMLP1) | 0 | 0 | 0 | 0 | 0 | 0 |
| CLP vs. MLP2 (based on cmp_ct_CLPvMLP2) | 0 | 0 | 0 | 0 | 0 | 0 |
| CLP vs. MLP3 (based on cmp_ct_CLPvMLP3) | 0 | 0 | 0 | 0 | 0 | 0 |
| MLP1 vs. MLP2 (based on cmp_ct_MLP1vMLP2) | 0 | 0 | 0 | 0 | 0 | 0 |
| MLP2 vs. MLP3 (based on cmp_ct_MLP2vMLP3) | 0 | 0 | 0 | 0 | 0 | 0 |
| MLP1 vs. MLP3 (based on cmp_ct_MLP1vMLP3) | 0 | 0 | 0 | 0 | 0 | 0 |
| MLP0 vs. MLP1 (based on cmp_ct_MLP0vMLP1) | 0 | 0 | 0 | 0 | 0 | 0 |
| MLP0 vs. MLP2 (based on cmp_ct_MLP0vMLP2) | 0 | 0 | 0 | 0 | 0 | 0 |
| MLP0 vs. MLP3 (based on cmp_ct_MLP0vMLP3) | 0 | 0 | 0 | 0 | 0 | 0 |
| HSC vs. MPP (based on cmp_ct_HSCvMPP) | 0 | 0 | 0 | 0 | 0 | 0 |
| CMP vs. MPP (based on cmp_ct_MPPvCMP) | 0 | 0 | 0 | 0 | 0 | 0 |
| HSC vs. ML (based on cmp_ct_HSCvML) | 0 | 0 | 0 | 0 | 0 | 0 |
| LYM vs. MYE (based on cmp_ct_MYEvLYM) | 0 | 0 | 0 | 0 | 0 | 0 |
| BM vs. CB (based on cmp_src_HSC_BMvCB) | 0 | 0 | 0 | 0 | 0 | 0 |
| BM vs. FL (based on cmp_src_HSC_BMvFL) | 0 | 0 | 0 | 0 | 0 | 0 |
| BM vs. PB (based on cmp_src_HSC_BMvPB) | 0 | 0 | 0 | 0 | 0 | 0 |
| CB vs. FL (based on cmp_src_HSC_CBvFL) | 0 | 0 | 0 | 0 | 0 | 0 |
| CB vs. PB (based on cmp_src_HSC_CBvPB) | 0 | 0 | 0 | 0 | 0 | 0 |
| FL vs. PB (based on cmp_src_HSC_FLvPB) | 0 | 0 | 0 | 0 | 0 | 0 |
| BM vs. CB (based on cmp_src_MPP_BMvCB) | 0 | 0 | 0 | 0 | 0 | 0 |
| BM vs. PB (based on cmp_src_MPP_BMvPB) | 0 | 0 | 0 | 0 | 0 | 0 |
| CB vs. PB (based on cmp_src_MPP_CBvPB) | 0 | 0 | 0 | 0 | 0 | 0 |
| HSC vs. MPP (based on cmp_HSCvMPP_PB) | 0 | 0 | 0 | 0 | 0 | 0 |
| HSC vs. MPP (based on cmp_HSCvMPP_CB) | 0 | 0 | 0 | 0 | 0 | 0 |
| HSC vs. MPP (based on cmp_HSCvMPP_BM) | 0 | 0 | 0 | 0 | 0 | 0 |
| comparison | |
| regions | |
| differential methylation measure |

Scatterplot for differential methylation (regions). If the selected criterion is not rankGradient:
The transparency corresponds to point density. The 1% of the points in the sparsest populated plot regions are drawn explicitly.
Additionally, the colored points represent differentially methylated regions (according to the selected criterion).
If the selected criterion is rankGradient: median combined ranks accross hexagonal bins are shown
as a gradient according to the color legend.
| comparison | |
| regions | |
| difference metric | |
| significance metric |
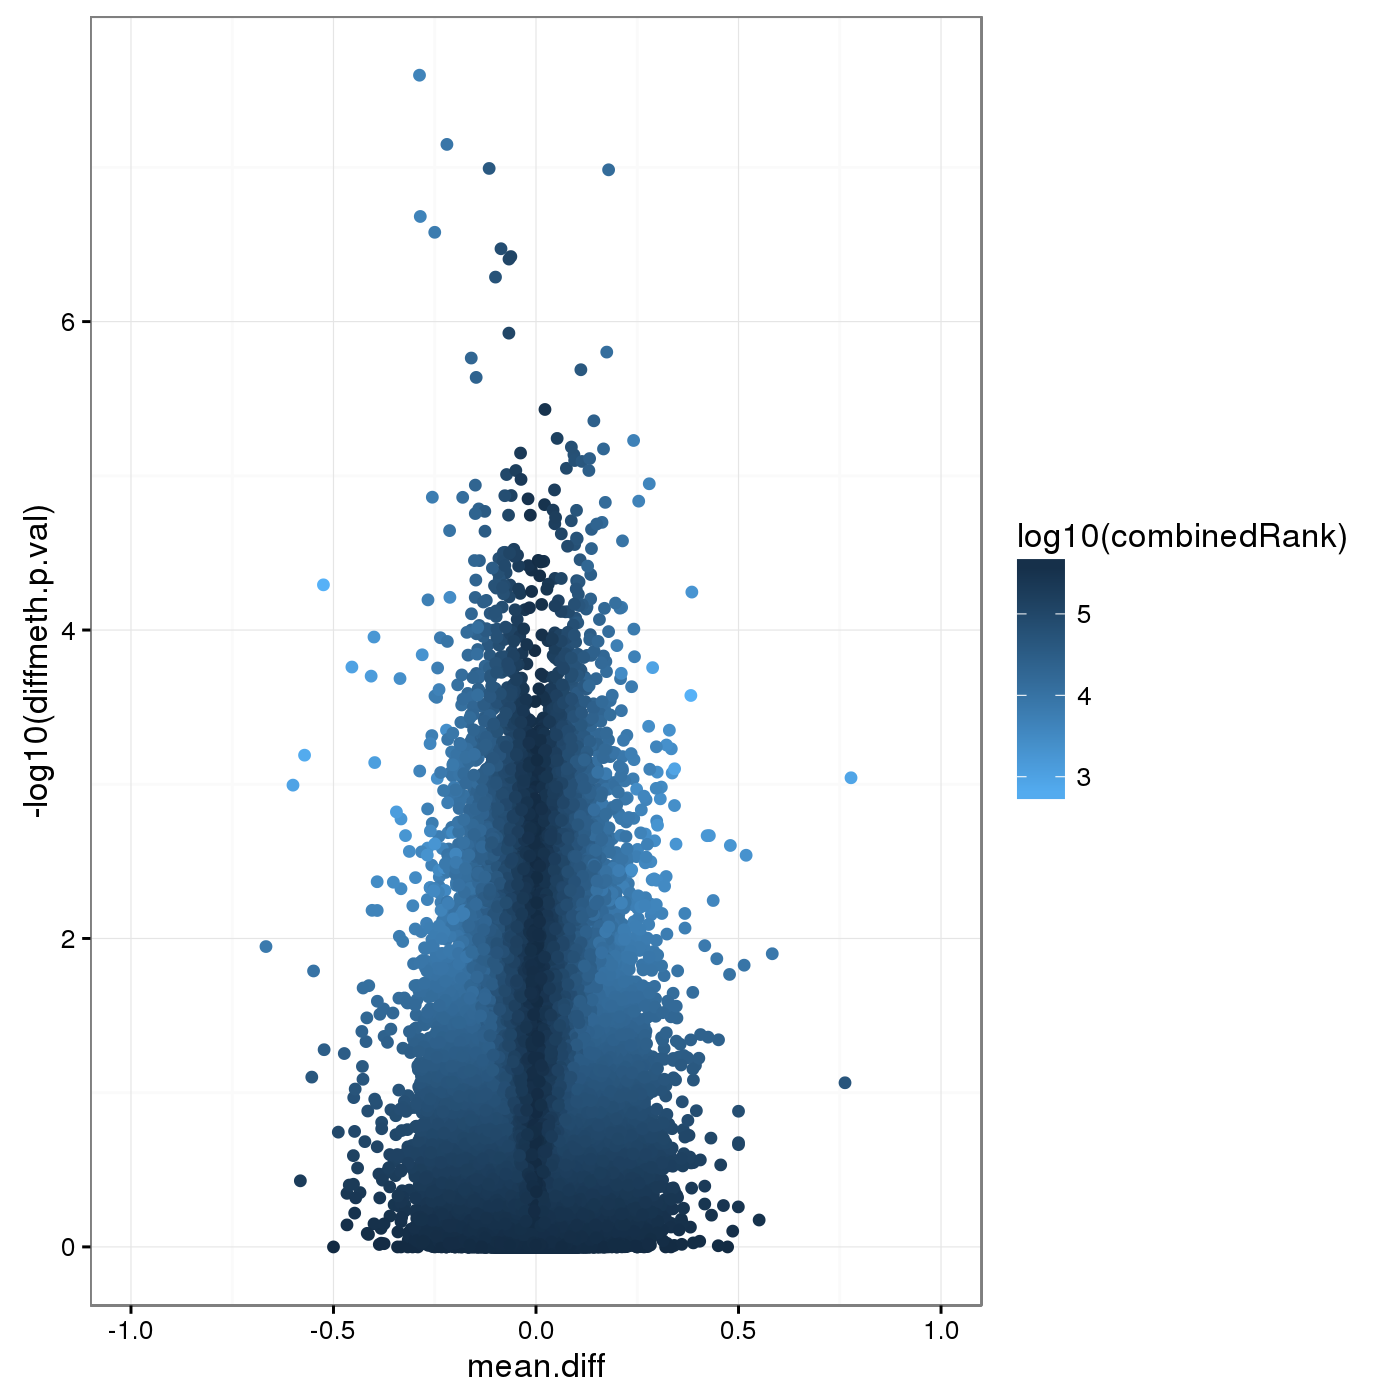
Volcano plot for differential methylation quantified by various metrics. Color scale according to combined ranking.
Differential Methylation Tables
A tabular overview of measures for differential methylation on the region level for the individual comparisons are provided in this section.
- id: region id
- Chromosome: chromosome of the region
- Start: start coordinate of the region
- End: end coordinate of the region
- mean.g1,mean.g2: (where g1 and g2 is replaced by the respective group names in the table) mean methylation in each of the two groups
- mean.diff: difference in methylation means between the two groups: mean.g1-mean.g2. In case of paired analysis, it is the mean of the pairwise differences.
- mean.quot.log2: log2 of the quotient in methylation: log2((mean.g1+epsilon)/(mean.g2+epsilon)), where epsilon:=0.01. In case of paired analysis, it is the mean of the pairwise quotients.
- diffmeth.p.val: p-value obtained from linear models employed in the limma package (or alternatively from a two-sided Welch t-test; which type of p-value is computed is specified in the differential.site.test.method option).
- max.g1,max.g2: maximum methylation level in group 1 and 2 respectively
- min.g1,min.g2: minimum methylation level in group 1 and 2 respectively
- sd.g1,sd.g2: standard deviation of methylation levels
- min.diff: Minimum of 0 and the smallest pairwise difference between samples of the two groups
- diffmeth.p.adj.fdr: FDR adjusted p-value of all sites
- combinedRank: mean.diff, mean.quot.log2 and diffmeth.p.val are ranked for all regions. This aggregates them using the maximum, i.e. worst rank of a site among the three measures
- num.na.g1,num.na.g2: number of NA methylation values for groups 1 and 2 respectively
- mean.covg.g1,mean.covg.g2: mean coverage of groups 1 and 2 respectively (In case of Infinium array methylation data, coverage is defined as combined beadcount.)
- min.covg.g1,min.covg.g2: minimum coverage of groups 1 and 2 respectively
- max.covg.g1,max.covg.g2: maximum coverage of groups 1 and 2 respectively
- covg.thresh.nsamples.g1,covg.thresh.nsamples.g2: number of samples in group 1 and 2 respectively exceeding the coverage threshold (1) for this region.
The tables for the individual comparisons can be found here:
| tiling | cpgislands | genes | promoters | ensembleRegBuildBPall | ensembleRegBuildBPallMerged | |
| CMP vs. MEP (based on cmp_ct_CMPvMEP) | csv | csv | csv | csv | csv | csv |
| CMP vs. GMP (based on cmp_ct_CMPvGMP) | csv | csv | csv | csv | csv | csv |
| CLP vs. CMP (based on cmp_ct_CMPvCLP) | csv | csv | csv | csv | csv | csv |
| GMP vs. MLP3 (based on cmp_ct_MLP3vGMP) | csv | csv | csv | csv | csv | csv |
| CLP vs. MLP0 (based on cmp_ct_CLPvMLP0) | csv | csv | csv | csv | csv | csv |
| CLP vs. MLP1 (based on cmp_ct_CLPvMLP1) | csv | csv | csv | csv | csv | csv |
| CLP vs. MLP2 (based on cmp_ct_CLPvMLP2) | csv | csv | csv | csv | csv | csv |
| CLP vs. MLP3 (based on cmp_ct_CLPvMLP3) | csv | csv | csv | csv | csv | csv |
| MLP1 vs. MLP2 (based on cmp_ct_MLP1vMLP2) | csv | csv | csv | csv | csv | csv |
| MLP2 vs. MLP3 (based on cmp_ct_MLP2vMLP3) | csv | csv | csv | csv | csv | csv |
| MLP1 vs. MLP3 (based on cmp_ct_MLP1vMLP3) | csv | csv | csv | csv | csv | csv |
| MLP0 vs. MLP1 (based on cmp_ct_MLP0vMLP1) | csv | csv | csv | csv | csv | csv |
| MLP0 vs. MLP2 (based on cmp_ct_MLP0vMLP2) | csv | csv | csv | csv | csv | csv |
| MLP0 vs. MLP3 (based on cmp_ct_MLP0vMLP3) | csv | csv | csv | csv | csv | csv |
| HSC vs. MPP (based on cmp_ct_HSCvMPP) | csv | csv | csv | csv | csv | csv |
| CMP vs. MPP (based on cmp_ct_MPPvCMP) | csv | csv | csv | csv | csv | csv |
| HSC vs. ML (based on cmp_ct_HSCvML) | csv | csv | csv | csv | csv | csv |
| LYM vs. MYE (based on cmp_ct_MYEvLYM) | csv | csv | csv | csv | csv | csv |
| BM vs. CB (based on cmp_src_HSC_BMvCB) | csv | csv | csv | csv | csv | csv |
| BM vs. FL (based on cmp_src_HSC_BMvFL) | csv | csv | csv | csv | csv | csv |
| BM vs. PB (based on cmp_src_HSC_BMvPB) | csv | csv | csv | csv | csv | csv |
| CB vs. FL (based on cmp_src_HSC_CBvFL) | csv | csv | csv | csv | csv | csv |
| CB vs. PB (based on cmp_src_HSC_CBvPB) | csv | csv | csv | csv | csv | csv |
| FL vs. PB (based on cmp_src_HSC_FLvPB) | csv | csv | csv | csv | csv | csv |
| BM vs. CB (based on cmp_src_MPP_BMvCB) | csv | csv | csv | csv | csv | csv |
| BM vs. PB (based on cmp_src_MPP_BMvPB) | csv | csv | csv | csv | csv | csv |
| CB vs. PB (based on cmp_src_MPP_CBvPB) | csv | csv | csv | csv | csv | csv |
| HSC vs. MPP (based on cmp_HSCvMPP_PB) | csv | csv | csv | csv | csv | csv |
| HSC vs. MPP (based on cmp_HSCvMPP_CB) | csv | csv | csv | csv | csv | csv |
| HSC vs. MPP (based on cmp_HSCvMPP_BM) | csv | csv | csv | csv | csv | csv |
Enrichment Analysis
Enrichment Analysis was conducted. The wordclouds and tables below contains significant GO terms as determined by a hypergeometric test.
| comparison | |
| Hypermethylation/hypomethylation | |
| ontology | |
| regions | |
| differential methylation measure |
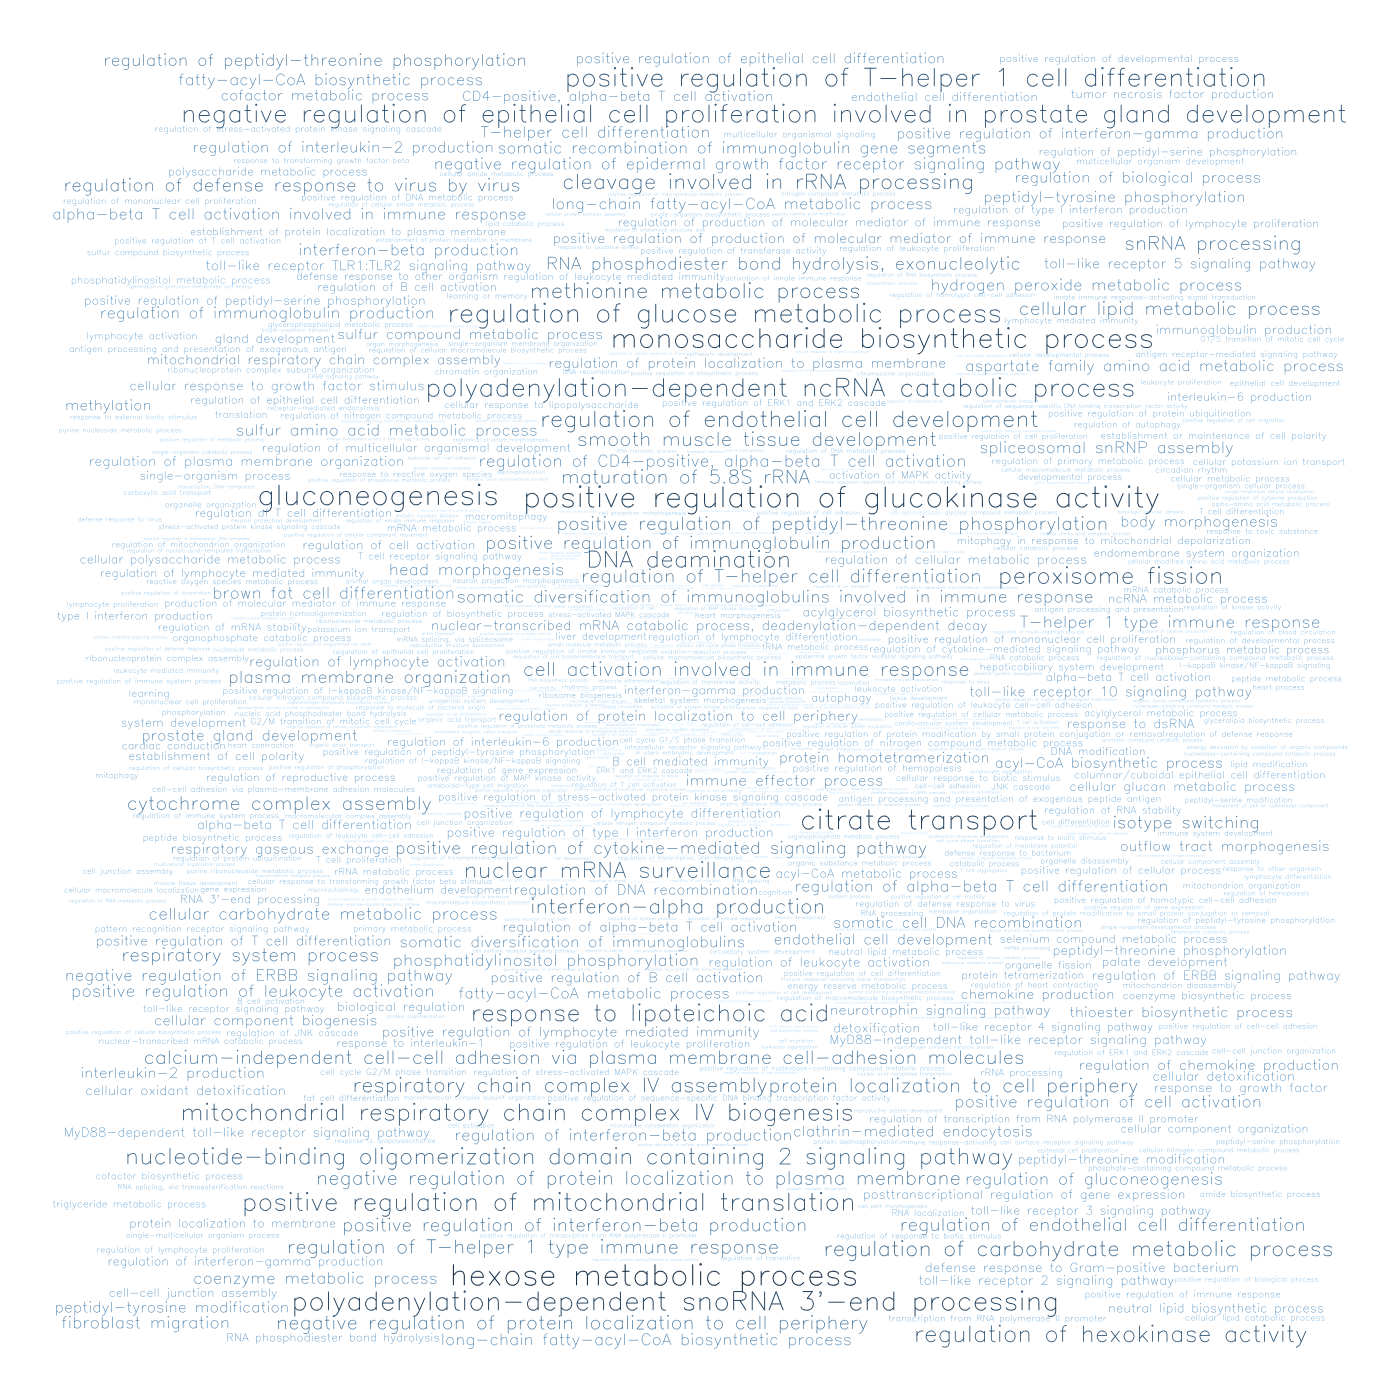
Wordclouds for GO enrichment terms.
| comparison | |
| Hypermethylation/hypomethylation | |
| ontology | |
| regions | |
| differential methylation measure |
| GOMFID | Pvalue | OddsRatio | ExpCount | Count | Size | Term |
| GO:0035574 | 1e-04 | 200.9744 | 0.0134 | 2 | 15 | histone H4-K20 demethylation |
| GO:0045653 | 1e-04 | 163.2604 | 0.016 | 2 | 18 | negative regulation of megakaryocyte differentiation |
| GO:0006335 | 4e-04 | 86.9944 | 0.0285 | 2 | 32 | DNA replication-dependent nucleosome assembly |
| GO:0016577 | 4e-04 | 84.1828 | 0.0294 | 2 | 33 | histone demethylation |
| GO:0008214 | 4e-04 | 79.0707 | 0.0312 | 2 | 35 | protein dealkylation |
| GO:0032776 | 4e-04 | 79.0707 | 0.0312 | 2 | 35 | DNA methylation on cytosine |
| GO:0051290 | 5e-04 | 72.4676 | 0.0339 | 2 | 38 | protein heterotetramerization |
| GO:0034080 | 6e-04 | 68.6447 | 0.0357 | 2 | 40 | CENP-A containing nucleosome assembly |
| GO:0000183 | 6e-04 | 66.8803 | 0.0366 | 2 | 41 | chromatin silencing at rDNA |
| GO:1901532 | 7e-04 | 63.6098 | 0.0383 | 2 | 43 | regulation of hematopoietic progenitor cell differentiation |
| GO:0034724 | 9e-04 | 54.309 | 0.0446 | 2 | 50 | DNA replication-independent nucleosome organization |
| GO:0043048 | 9e-04 | Inf | 9e-04 | 1 | 1 | dolichyl monophosphate biosynthetic process |
| GO:0070988 | 0.0014 | 43.4139 | 0.0553 | 2 | 62 | demethylation |
| GO:0006303 | 0.0015 | 41.3386 | 0.058 | 2 | 65 | double-strand break repair via nonhomologous end joining |
| GO:0043044 | 0.0018 | 37.7295 | 0.0633 | 2 | 71 | ATP-dependent chromatin remodeling |
| GO:0045815 | 0.0021 | 34.6978 | 0.0686 | 2 | 77 | positive regulation of gene expression, epigenetic |
| GO:0006305 | 0.0026 | 30.5961 | 0.0776 | 2 | 87 | DNA alkylation |
| GO:0044728 | 0.0035 | 26.5153 | 0.0892 | 2 | 100 | DNA methylation or demethylation |
| GO:0042989 | 0.0045 | 301.6346 | 0.0045 | 1 | 5 | sequestering of actin monomers |
| GO:1990592 | 0.0045 | 301.6346 | 0.0045 | 1 | 5 | protein K69-linked ufmylation |
| GO:0006489 | 0.0053 | 241.2923 | 0.0053 | 1 | 6 | dolichyl diphosphate biosynthetic process |
| GO:0071569 | 0.0053 | 241.2923 | 0.0053 | 1 | 6 | protein ufmylation |
| GO:0000723 | 0.0055 | 20.752 | 0.1132 | 2 | 127 | telomere maintenance |
| GO:1903707 | 0.0058 | 20.2617 | 0.1159 | 2 | 130 | negative regulation of hemopoiesis |
| GO:0031497 | 0.0066 | 18.9197 | 0.1239 | 2 | 139 | chromatin assembly |
| GO:0031047 | 0.0076 | 17.6213 | 0.1328 | 2 | 149 | gene silencing by RNA |
| GO:0000724 | 0.0077 | 17.3826 | 0.1346 | 2 | 151 | double-strand break repair via homologous recombination |
| GO:0045814 | 0.0077 | 17.3826 | 0.1346 | 2 | 151 | negative regulation of gene expression, epigenetic |
| GO:0048552 | 0.0089 | 134.0171 | 0.0089 | 1 | 10 | regulation of metalloenzyme activity |
| GO:0065004 | 0.0096 | 15.491 | 0.1507 | 2 | 169 | protein-DNA complex assembly |
| GOMFID | Pvalue | OddsRatio | ExpCount | Count | Size | Term |
| GO:0006818 | 2e-04 | 31.4222 | 0.123 | 3 | 138 | hydrogen transport |
| GO:0015876 | 0.0018 | 1206.7692 | 0.0018 | 1 | 2 | acetyl-CoA transport |
| GO:0070901 | 0.0018 | 1206.7692 | 0.0018 | 1 | 2 | mitochondrial tRNA methylation |
| GO:1901337 | 0.0018 | 1206.7692 | 0.0018 | 1 | 2 | thioester transport |
| GO:1902600 | 0.0033 | 27.0712 | 0.0874 | 2 | 98 | hydrogen ion transmembrane transport |
| GO:0090261 | 0.0036 | 402.2051 | 0.0036 | 1 | 4 | positive regulation of inclusion body assembly |
| GO:0022900 | 0.0052 | 21.4435 | 0.1097 | 2 | 123 | electron transport chain |
| GO:0035814 | 0.0053 | 241.2923 | 0.0053 | 1 | 6 | negative regulation of renal sodium excretion |
| GO:0044539 | 0.0062 | 201.0641 | 0.0062 | 1 | 7 | long-chain fatty acid import |
| GO:0051256 | 0.0062 | 201.0641 | 0.0062 | 1 | 7 | mitotic spindle midzone assembly |
| GO:0006123 | 0.0071 | 172.3297 | 0.0071 | 1 | 8 | mitochondrial electron transport, cytochrome c to oxygen |
| GO:1900864 | 0.0071 | 172.3297 | 0.0071 | 1 | 8 | mitochondrial RNA modification |
| GO:0010459 | 0.008 | 150.7788 | 0.008 | 1 | 9 | negative regulation of heart rate |
| GO:0051231 | 0.008 | 150.7788 | 0.008 | 1 | 9 | spindle elongation |
| GO:0042407 | 0.0089 | 134.0171 | 0.0089 | 1 | 10 | cristae formation |
| GOMFID | Pvalue | OddsRatio | ExpCount | Count | Size | Term |
| GO:0043249 | 1e-04 | 170.3261 | 0.0159 | 2 | 10 | erythrocyte maturation |
| GO:0009399 | 0.0016 | Inf | 0.0016 | 1 | 1 | nitrogen fixation |
| GO:1904057 | 0.0016 | Inf | 0.0016 | 1 | 1 | negative regulation of sensory perception of pain |
| GO:0046676 | 0.0019 | 34.8696 | 0.0653 | 2 | 41 | negative regulation of insulin secretion |
| GO:0002792 | 0.0026 | 29.5501 | 0.0764 | 2 | 48 | negative regulation of peptide secretion |
| GO:0061515 | 0.0026 | 29.5501 | 0.0764 | 2 | 48 | myeloid cell development |
| GO:0006668 | 0.0032 | 653.2083 | 0.0032 | 1 | 2 | sphinganine-1-phosphate metabolic process |
| GO:0019264 | 0.0032 | 653.2083 | 0.0032 | 1 | 2 | glycine biosynthetic process from serine |
| GO:0044571 | 0.0032 | 653.2083 | 0.0032 | 1 | 2 | [2Fe-2S] cluster assembly |
| GO:1990523 | 0.0032 | 653.2083 | 0.0032 | 1 | 2 | bone regeneration |
| GO:0015820 | 0.0048 | 326.5833 | 0.0048 | 1 | 3 | leucine transport |
| GO:0035928 | 0.0048 | 326.5833 | 0.0048 | 1 | 3 | rRNA import into mitochondrion |
| GO:0060392 | 0.0048 | 326.5833 | 0.0048 | 1 | 3 | negative regulation of SMAD protein import into nucleus |
| GO:0071409 | 0.0048 | 326.5833 | 0.0048 | 1 | 3 | cellular response to cycloheximide |
| GO:0097428 | 0.0048 | 326.5833 | 0.0048 | 1 | 3 | protein maturation by iron-sulfur cluster transfer |
| GO:1902731 | 0.0048 | 326.5833 | 0.0048 | 1 | 3 | negative regulation of chondrocyte proliferation |
| GO:0046888 | 0.006 | 19.1145 | 0.1162 | 2 | 73 | negative regulation of hormone secretion |
| GO:0006564 | 0.0064 | 217.7083 | 0.0064 | 1 | 4 | L-serine biosynthetic process |
| GO:0071603 | 0.0064 | 217.7083 | 0.0064 | 1 | 4 | endothelial cell-cell adhesion |
| GO:0090027 | 0.0064 | 217.7083 | 0.0064 | 1 | 4 | negative regulation of monocyte chemotaxis |
| GO:0040029 | 0.0066 | 8.7346 | 0.3885 | 3 | 244 | regulation of gene expression, epigenetic |
| GO:0070124 | 0.0078 | 16.5387 | 0.1337 | 2 | 84 | mitochondrial translational initiation |
| GO:0070125 | 0.0078 | 16.5387 | 0.1337 | 2 | 84 | mitochondrial translational elongation |
| GO:0061484 | 0.0079 | 163.2708 | 0.008 | 1 | 5 | hematopoietic stem cell homeostasis |
| GO:0070126 | 0.0082 | 16.1429 | 0.1369 | 2 | 86 | mitochondrial translational termination |
| GO:0043624 | 0.0089 | 7.8113 | 0.433 | 3 | 272 | cellular protein complex disassembly |
| GO:0030218 | 0.0095 | 14.8944 | 0.1481 | 2 | 93 | erythrocyte differentiation |
| GOMFID | Pvalue | OddsRatio | ExpCount | Count | Size | Term |
| GO:0051256 | 0.004 | 326.8333 | 0.004 | 1 | 7 | mitotic spindle midzone assembly |
| GO:0000059 | 0.0046 | 280.125 | 0.0046 | 1 | 8 | protein import into nucleus, docking |
| GO:0006610 | 0.0046 | 280.125 | 0.0046 | 1 | 8 | ribosomal protein import into nucleus |
| GO:0051231 | 0.0051 | 245.0938 | 0.0052 | 1 | 9 | spindle elongation |
| GOMFID | Pvalue | OddsRatio | ExpCount | Count | Size | Term |
| GO:0051260 | 0.0017 | 15.0703 | 0.2474 | 3 | 259 | protein homooligomerization |
| GO:0019264 | 0.0019 | 1120.5 | 0.0019 | 1 | 2 | glycine biosynthetic process from serine |
| GO:0006564 | 0.0038 | 373.4524 | 0.0038 | 1 | 4 | L-serine biosynthetic process |
| GO:0050911 | 0.0048 | 10.4366 | 0.3534 | 3 | 370 | detection of chemical stimulus involved in sensory perception of smell |
| GO:0009593 | 0.0083 | 8.5045 | 0.4308 | 3 | 451 | detection of chemical stimulus |
| GO:0007606 | 0.0089 | 8.2576 | 0.4432 | 3 | 464 | sensory perception of chemical stimulus |
| GO:0050906 | 0.0089 | 8.2576 | 0.4432 | 3 | 464 | detection of stimulus involved in sensory perception |
| GO:0035999 | 0.0095 | 124.4365 | 0.0096 | 1 | 10 | tetrahydrofolate interconversion |
| GOMFID | Pvalue | OddsRatio | ExpCount | Count | Size | Term |
| GO:0042255 | 8e-04 | 56.6775 | 0.0428 | 2 | 48 | ribosome assembly |
| GO:0044248 | 0.0018 | 6.4556 | 1.4612 | 6 | 1639 | cellular catabolic process |
| GO:0009057 | 0.0021 | 7.2827 | 0.9959 | 5 | 1117 | macromolecule catabolic process |
| GO:0016259 | 0.0025 | 31.7215 | 0.0749 | 2 | 84 | selenocysteine metabolic process |
| GO:1901605 | 0.0029 | 12.6934 | 0.2969 | 3 | 333 | alpha-amino acid metabolic process |
| GO:1903361 | 0.0036 | 402.2051 | 0.0036 | 1 | 4 | protein localization to basolateral plasma membrane |
| GO:0006614 | 0.0036 | 25.9817 | 0.0909 | 2 | 102 | SRP-dependent cotranslational protein targeting to membrane |
| GO:0072599 | 0.0042 | 24.0448 | 0.0981 | 2 | 110 | establishment of protein localization to endoplasmic reticulum |
| GO:0000184 | 0.0045 | 23.1801 | 0.1016 | 2 | 114 | nuclear-transcribed mRNA catabolic process, nonsense-mediated decay |
| GO:0045199 | 0.0062 | 201.0641 | 0.0062 | 1 | 7 | maintenance of epithelial cell apical/basal polarity |
| GO:0005981 | 0.0071 | 172.3297 | 0.0071 | 1 | 8 | regulation of glycogen catabolic process |
| GO:0006610 | 0.0071 | 172.3297 | 0.0071 | 1 | 8 | ribosomal protein import into nucleus |
| GO:0035970 | 0.0071 | 172.3297 | 0.0071 | 1 | 8 | peptidyl-threonine dephosphorylation |
| GO:0006364 | 0.0074 | 17.8667 | 0.1311 | 2 | 147 | rRNA processing |
| GO:0072657 | 0.0075 | 8.929 | 0.4172 | 3 | 468 | protein localization to membrane |
| GO:2000786 | 0.008 | 150.7788 | 0.008 | 1 | 9 | positive regulation of autophagosome assembly |
| GO:0006527 | 0.0089 | 134.0171 | 0.0089 | 1 | 10 | arginine catabolic process |
| GO:0030011 | 0.0098 | 120.6077 | 0.0098 | 1 | 11 | maintenance of cell polarity |
| GO:0090266 | 0.0098 | 120.6077 | 0.0098 | 1 | 11 | regulation of mitotic cell cycle spindle assembly checkpoint |
| GO:0006415 | 0.01 | 15.2147 | 0.1533 | 2 | 172 | translational termination |
| GOMFID | Pvalue | OddsRatio | ExpCount | Count | Size | Term |
| GO:0006117 | 0.001 | Inf | 0.001 | 1 | 1 | acetaldehyde metabolic process |
| GO:0006463 | 0.001 | Inf | 0.001 | 1 | 1 | steroid hormone receptor complex assembly |
| GO:0018106 | 0.001 | Inf | 0.001 | 1 | 1 | peptidyl-histidine phosphorylation |
| GO:0033590 | 0.001 | Inf | 0.001 | 1 | 1 | response to cobalamin |
| GO:0046785 | 0.0011 | 47.538 | 0.0499 | 2 | 49 | microtubule polymerization |
| GO:0009145 | 0.0012 | 45.5918 | 0.052 | 2 | 51 | purine nucleoside triphosphate biosynthetic process |
| GO:0009201 | 0.0014 | 42.1402 | 0.056 | 2 | 55 | ribonucleoside triphosphate biosynthetic process |
| GO:0014040 | 0.002 | 1045.7333 | 0.002 | 1 | 2 | positive regulation of Schwann cell differentiation |
| GO:0046129 | 0.0037 | 25.3231 | 0.0917 | 2 | 90 | purine ribonucleoside biosynthetic process |
| GO:0061370 | 0.0051 | 261.3833 | 0.0051 | 1 | 5 | testosterone biosynthetic process |
| GO:0009163 | 0.0061 | 19.515 | 0.1182 | 2 | 116 | nucleoside biosynthetic process |
| GO:2000630 | 0.0061 | 209.0933 | 0.0061 | 1 | 6 | positive regulation of miRNA metabolic process |
| GO:0045084 | 0.0071 | 174.2333 | 0.0071 | 1 | 7 | positive regulation of interleukin-12 biosynthetic process |
| GO:0071316 | 0.0071 | 174.2333 | 0.0071 | 1 | 7 | cellular response to nicotine |
| GO:1901223 | 0.0071 | 174.2333 | 0.0071 | 1 | 7 | negative regulation of NIK/NF-kappaB signaling |
| GO:0006183 | 0.0091 | 130.6583 | 0.0092 | 1 | 9 | GTP biosynthetic process |
| GO:0006364 | 0.0096 | 15.3123 | 0.1498 | 2 | 147 | rRNA processing |
| GOMFID | Pvalue | OddsRatio | ExpCount | Count | Size | Term |
| GO:0006463 | 5e-04 | Inf | 5e-04 | 1 | 1 | steroid hormone receptor complex assembly |
| GO:0031118 | 5e-04 | Inf | 5e-04 | 1 | 1 | rRNA pseudouridine synthesis |
| GO:0048866 | 0.001 | 2242 | 0.001 | 1 | 2 | stem cell fate specification |
| GO:0035993 | 0.0015 | 1120.9286 | 0.0015 | 1 | 3 | deltoid tuberosity development |
| GO:0035990 | 0.002 | 747.2381 | 0.002 | 1 | 4 | tendon cell differentiation |
| GO:0060214 | 0.002 | 747.2381 | 0.002 | 1 | 4 | endocardium formation |
| GO:0046661 | 0.0024 | 35.0158 | 0.0764 | 2 | 150 | male sex differentiation |
| GO:0030855 | 0.0025 | 15.5527 | 0.2985 | 3 | 586 | epithelial cell differentiation |
| GO:0061056 | 0.0025 | 560.3929 | 0.0025 | 1 | 5 | sclerotome development |
| GO:1903898 | 0.0025 | 560.3929 | 0.0025 | 1 | 5 | negative regulation of PERK-mediated unfolded protein response |
| GO:1903912 | 0.0025 | 560.3929 | 0.0025 | 1 | 5 | negative regulation of endoplasmic reticulum stress-induced eIF2 alpha phosphorylation |
| GO:0035989 | 0.0031 | 448.2857 | 0.0031 | 1 | 6 | tendon development |
| GO:0060836 | 0.0031 | 448.2857 | 0.0031 | 1 | 6 | lymphatic endothelial cell differentiation |
| GO:0060956 | 0.0031 | 448.2857 | 0.0031 | 1 | 6 | endocardial cell differentiation |
| GO:0036491 | 0.0036 | 373.5476 | 0.0036 | 1 | 7 | regulation of translation initiation in response to endoplasmic reticulum stress |
| GO:0070262 | 0.0041 | 320.1633 | 0.0041 | 1 | 8 | peptidyl-serine dephosphorylation |
| GO:2000543 | 0.0046 | 280.125 | 0.0046 | 1 | 9 | positive regulation of gastrulation |
| GO:0006983 | 0.0051 | 248.9841 | 0.0051 | 1 | 10 | ER overload response |
| GO:0031115 | 0.0051 | 248.9841 | 0.0051 | 1 | 10 | negative regulation of microtubule polymerization |
| GO:0010998 | 0.0061 | 203.6883 | 0.0061 | 1 | 12 | regulation of translational initiation by eIF2 alpha phosphorylation |
| GO:0043588 | 0.0065 | 21.0204 | 0.1258 | 2 | 247 | skin development |
| GO:0042789 | 0.0066 | 186.7024 | 0.0066 | 1 | 13 | mRNA transcription from RNA polymerase II promoter |
| GO:0006413 | 0.0069 | 20.2638 | 0.1304 | 2 | 256 | translational initiation |
| GO:0001946 | 0.0071 | 172.3297 | 0.0071 | 1 | 14 | lymphangiogenesis |
| GO:0003188 | 0.0071 | 172.3297 | 0.0071 | 1 | 14 | heart valve formation |
| GO:1904874 | 0.0071 | 172.3297 | 0.0071 | 1 | 14 | positive regulation of telomerase RNA localization to Cajal body |
| GO:0090670 | 0.0076 | 160.0102 | 0.0076 | 1 | 15 | RNA localization to Cajal body |
| GO:0090672 | 0.0076 | 160.0102 | 0.0076 | 1 | 15 | telomerase RNA localization |
| GO:0006825 | 0.0081 | 149.3333 | 0.0082 | 1 | 16 | copper ion transport |
| GO:0003159 | 0.0096 | 124.4206 | 0.0097 | 1 | 19 | morphogenesis of an endothelium |
| GO:0008544 | 0.0097 | 16.9329 | 0.1554 | 2 | 305 | epidermis development |
| GOMFID | Pvalue | OddsRatio | ExpCount | Count | Size | Term |
| GO:0050911 | 0 | 55.847 | 0.1649 | 4 | 370 | detection of chemical stimulus involved in sensory perception of smell |
| GO:0009593 | 0 | 45.4855 | 0.201 | 4 | 451 | detection of chemical stimulus |
| GO:0007606 | 0 | 44.1623 | 0.2068 | 4 | 464 | sensory perception of chemical stimulus |
| GO:0050906 | 0 | 44.1623 | 0.2068 | 4 | 464 | detection of stimulus involved in sensory perception |
| GO:0048006 | 4e-04 | Inf | 4e-04 | 1 | 1 | antigen processing and presentation, endogenous lipid antigen via MHC class Ib |
| GO:0007186 | 9e-04 | 16.7705 | 0.5171 | 4 | 1160 | G-protein coupled receptor signaling pathway |
| GO:0050877 | 0.001 | 15.9625 | 0.5412 | 4 | 1214 | neurological system process |
| GO:0048007 | 0.0031 | 435.8333 | 0.0031 | 1 | 7 | antigen processing and presentation, exogenous lipid antigen via MHC class Ib |
| GO:0046130 | 0.0053 | 237.6515 | 0.0053 | 1 | 12 | purine ribonucleoside catabolic process |
| GO:0002475 | 0.0067 | 186.6905 | 0.0067 | 1 | 15 | antigen processing and presentation via MHC class Ib |
| GO:0016045 | 0.0076 | 163.3333 | 0.0076 | 1 | 17 | detection of bacterium |
| NA. |
| n/a |
| GOMFID | Pvalue | OddsRatio | ExpCount | Count | Size | Term |
| GO:0001692 | 0.0013 | 1307.8333 | 0.0013 | 1 | 3 | histamine metabolic process |
| GO:0007042 | 0.0022 | 653.8333 | 0.0022 | 1 | 5 | lysosomal lumen acidification |
| GO:0014054 | 0.0022 | 653.8333 | 0.0022 | 1 | 5 | positive regulation of gamma-aminobutyric acid secretion |
| GO:0014050 | 0.0027 | 523.0333 | 0.0027 | 1 | 6 | negative regulation of glutamate secretion |
| GO:2000252 | 0.0036 | 373.5476 | 0.0036 | 1 | 8 | negative regulation of feeding behavior |
| GO:0032891 | 0.0067 | 186.6905 | 0.0067 | 1 | 15 | negative regulation of organic acid transport |
| GO:0048026 | 0.0067 | 186.6905 | 0.0067 | 1 | 15 | positive regulation of mRNA splicing, via spliceosome |
| GO:0015812 | 0.0076 | 163.3333 | 0.0076 | 1 | 17 | gamma-aminobutyric acid transport |
| GO:0006465 | 0.008 | 153.7157 | 0.008 | 1 | 18 | signal peptide processing |
| GOMFID | Pvalue | OddsRatio | ExpCount | Count | Size | Term |
| GO:0010836 | 0.001 | Inf | 0.001 | 1 | 1 | negative regulation of protein ADP-ribosylation |
| GO:0071228 | 0.001 | Inf | 0.001 | 1 | 1 | cellular response to tumor cell |
| GO:0032202 | 0.0041 | 348.5333 | 0.0041 | 1 | 4 | telomere assembly |
| GO:0043137 | 0.0041 | 348.5333 | 0.0041 | 1 | 4 | DNA replication, removal of RNA primer |
| GO:0046952 | 0.0041 | 348.5333 | 0.0041 | 1 | 4 | ketone body catabolic process |
| GO:0006273 | 0.0081 | 149.3333 | 0.0082 | 1 | 8 | lagging strand elongation |
| GO:0072321 | 0.0081 | 149.3333 | 0.0082 | 1 | 8 | chaperone-mediated protein transport |
| GOMFID | Pvalue | OddsRatio | ExpCount | Count | Size | Term |
| GO:0002209 | 3e-04 | 97.8688 | 0.026 | 2 | 34 | behavioral defense response |
| GO:0032094 | 3e-04 | 94.897 | 0.0267 | 2 | 35 | response to food |
| GO:0046686 | 5e-04 | 78.255 | 0.0321 | 2 | 42 | response to cadmium ion |
| GO:0045776 | 5e-04 | 76.3415 | 0.0329 | 2 | 43 | negative regulation of blood pressure |
| GO:0042312 | 5e-04 | 72.7814 | 0.0344 | 2 | 45 | regulation of vasodilation |
| GO:0050795 | 7e-04 | 21.5509 | 0.1849 | 3 | 242 | regulation of behavior |
| GO:0045935 | 7e-04 | 8.4982 | 1.267 | 6 | 1658 | positive regulation of nucleobase-containing compound metabolic process |
| GO:0007344 | 8e-04 | Inf | 8e-04 | 1 | 1 | pronuclear fusion |
| GO:0040008 | 9e-04 | 12.2777 | 0.4723 | 4 | 618 | regulation of growth |
| GO:0009891 | 0.001 | 7.992 | 1.3381 | 6 | 1751 | positive regulation of biosynthetic process |
| GO:0030421 | 0.0015 | 1426.3636 | 0.0015 | 1 | 2 | defecation |
| GO:0048866 | 0.0015 | 1426.3636 | 0.0015 | 1 | 2 | stem cell fate specification |
| GO:0033555 | 0.0016 | 41.0921 | 0.0596 | 2 | 78 | multicellular organismal response to stress |
| GO:0045740 | 0.0018 | 37.6096 | 0.065 | 2 | 85 | positive regulation of DNA replication |
| GO:1903524 | 0.0019 | 36.72 | 0.0665 | 2 | 87 | positive regulation of blood circulation |
| GO:0007218 | 0.0022 | 34.6689 | 0.0703 | 2 | 92 | neuropeptide signaling pathway |
| GO:0014038 | 0.0023 | 713.1364 | 0.0023 | 1 | 3 | regulation of Schwann cell differentiation |
| GO:0032765 | 0.0023 | 713.1364 | 0.0023 | 1 | 3 | positive regulation of mast cell cytokine production |
| GO:0035483 | 0.0023 | 713.1364 | 0.0023 | 1 | 3 | gastric emptying |
| GO:0042109 | 0.0023 | 713.1364 | 0.0023 | 1 | 3 | lymphotoxin A biosynthetic process |
| GO:0046005 | 0.0023 | 713.1364 | 0.0023 | 1 | 3 | positive regulation of circadian sleep/wake cycle, REM sleep |
| GO:0045893 | 0.0025 | 7.425 | 1.0561 | 5 | 1382 | positive regulation of transcription, DNA-templated |
| GO:0043066 | 0.0027 | 9.0677 | 0.6297 | 4 | 824 | negative regulation of apoptotic process |
| GO:1902680 | 0.0027 | 7.2628 | 1.0775 | 5 | 1410 | positive regulation of RNA biosynthetic process |
| GO:0032635 | 0.0028 | 30.268 | 0.0802 | 2 | 105 | interleukin-6 production |
| GO:0002906 | 0.0031 | 475.3939 | 0.0031 | 1 | 4 | negative regulation of mature B cell apoptotic process |
| GO:0031064 | 0.0031 | 475.3939 | 0.0031 | 1 | 4 | negative regulation of histone deacetylation |
| GO:0060214 | 0.0031 | 475.3939 | 0.0031 | 1 | 4 | endocardium formation |
| GO:0044708 | 0.0034 | 12.2699 | 0.3194 | 3 | 418 | single-organism behavior |
| GO:0035051 | 0.0035 | 27.0887 | 0.0894 | 2 | 117 | cardiocyte differentiation |
| GO:0042493 | 0.0038 | 11.8302 | 0.3309 | 3 | 433 | response to drug |
| GO:0010841 | 0.0038 | 356.5227 | 0.0038 | 1 | 5 | positive regulation of circadian sleep/wake cycle, wakefulness |
| GO:0035811 | 0.0038 | 356.5227 | 0.0038 | 1 | 5 | negative regulation of urine volume |
| GO:0051461 | 0.0038 | 356.5227 | 0.0038 | 1 | 5 | positive regulation of corticotropin secretion |
| GO:1903365 | 0.0038 | 356.5227 | 0.0038 | 1 | 5 | regulation of fear response |
| GO:2000987 | 0.0038 | 356.5227 | 0.0038 | 1 | 5 | positive regulation of behavioral fear response |
| GO:0003105 | 0.0046 | 285.2 | 0.0046 | 1 | 6 | negative regulation of glomerular filtration |
| GO:0035814 | 0.0046 | 285.2 | 0.0046 | 1 | 6 | negative regulation of renal sodium excretion |
| GO:0042756 | 0.0046 | 285.2 | 0.0046 | 1 | 6 | drinking behavior |
| GO:0045416 | 0.0046 | 285.2 | 0.0046 | 1 | 6 | positive regulation of interleukin-8 biosynthetic process |
| GO:0060836 | 0.0046 | 285.2 | 0.0046 | 1 | 6 | lymphatic endothelial cell differentiation |
| GO:0060956 | 0.0046 | 285.2 | 0.0046 | 1 | 6 | endocardial cell differentiation |
| GO:0090166 | 0.0046 | 285.2 | 0.0046 | 1 | 6 | Golgi disassembly |
| GO:0030307 | 0.0049 | 22.5406 | 0.107 | 2 | 140 | positive regulation of cell growth |
| GO:0009790 | 0.005 | 7.5138 | 0.7512 | 4 | 983 | embryo development |
| GO:0035150 | 0.0051 | 22.2157 | 0.1085 | 2 | 142 | regulation of tube size |
| GO:1990267 | 0.0053 | 21.5931 | 0.1116 | 2 | 146 | response to transition metal nanoparticle |
| GO:0060455 | 0.0053 | 237.6515 | 0.0053 | 1 | 7 | negative regulation of gastric acid secretion |
| GO:0060452 | 0.0061 | 203.6883 | 0.0061 | 1 | 8 | positive regulation of cardiac muscle contraction |
| GO:2000252 | 0.0061 | 203.6883 | 0.0061 | 1 | 8 | negative regulation of feeding behavior |
| GO:0048519 | 0.0063 | 5.1016 | 3.383 | 8 | 4427 | negative regulation of biological process |
| GO:0051384 | 0.0064 | 19.5371 | 0.123 | 2 | 161 | response to glucocorticoid |
| GO:0003018 | 0.0067 | 19.1716 | 0.1253 | 2 | 164 | vascular process in circulatory system |
| GO:1901215 | 0.0068 | 19.0528 | 0.1261 | 2 | 165 | negative regulation of neuron death |
| GO:0007614 | 0.0069 | 178.2159 | 0.0069 | 1 | 9 | short-term memory |
| GO:0045792 | 0.0069 | 178.2159 | 0.0069 | 1 | 9 | negative regulation of cell size |
| GO:0031398 | 0.0073 | 18.26 | 0.1314 | 2 | 172 | positive regulation of protein ubiquitination |
| GO:0033160 | 0.0084 | 142.5545 | 0.0084 | 1 | 11 | positive regulation of protein import into nucleus, translocation |
| GO:0034501 | 0.0084 | 142.5545 | 0.0084 | 1 | 11 | protein localization to kinetochore |
| GO:0032099 | 0.0091 | 129.5868 | 0.0092 | 1 | 12 | negative regulation of appetite |
| GO:0043117 | 0.0091 | 129.5868 | 0.0092 | 1 | 12 | positive regulation of vascular permeability |
| GO:0010172 | 0.0099 | 118.7803 | 0.0099 | 1 | 13 | embryonic body morphogenesis |
| GO:0042789 | 0.0099 | 118.7803 | 0.0099 | 1 | 13 | mRNA transcription from RNA polymerase II promoter |
| GO:0055015 | 0.0099 | 118.7803 | 0.0099 | 1 | 13 | ventricular cardiac muscle cell development |
| GOMFID | Pvalue | OddsRatio | ExpCount | Count | Size | Term |
| GO:0070124 | 0 | 64.2387 | 0.0642 | 3 | 84 | mitochondrial translational initiation |
| GO:0070125 | 0 | 64.2387 | 0.0642 | 3 | 84 | mitochondrial translational elongation |
| GO:0070126 | 0 | 62.6827 | 0.0657 | 3 | 86 | mitochondrial translational termination |
| GO:0018885 | 8e-04 | Inf | 8e-04 | 1 | 1 | carbon tetrachloride metabolic process |
| GO:0043624 | 0.001 | 19.1103 | 0.2079 | 3 | 272 | cellular protein complex disassembly |
| GO:0032984 | 0.0015 | 16.4845 | 0.24 | 3 | 314 | macromolecular complex disassembly |
| GO:0042197 | 0.0015 | 1426.3636 | 0.0015 | 1 | 2 | halogenated hydrocarbon metabolic process |
| GO:0032765 | 0.0023 | 713.1364 | 0.0023 | 1 | 3 | positive regulation of mast cell cytokine production |
| GO:0042109 | 0.0023 | 713.1364 | 0.0023 | 1 | 3 | lymphotoxin A biosynthetic process |
| GO:0002906 | 0.0031 | 475.3939 | 0.0031 | 1 | 4 | negative regulation of mature B cell apoptotic process |
| GO:0045416 | 0.0046 | 285.2 | 0.0046 | 1 | 6 | positive regulation of interleukin-8 biosynthetic process |
| GO:0071822 | 0.0072 | 5.6358 | 1.3526 | 5 | 1770 | protein complex subunit organization |
| GO:0006412 | 0.0097 | 8.3405 | 0.4631 | 3 | 606 | translation |
| GO:0010172 | 0.0099 | 118.7803 | 0.0099 | 1 | 13 | embryonic body morphogenesis |
| GOMFID | Pvalue | OddsRatio | ExpCount | Count | Size | Term |
| GO:0061615 | 0.0012 | 45.3565 | 0.0509 | 2 | 25 | glycolytic process through fructose-6-phosphate |
| GO:0061621 | 0.0012 | 45.3565 | 0.0509 | 2 | 25 | canonical glycolysis |
| GO:0006007 | 0.0018 | 35.9586 | 0.0632 | 2 | 31 | glucose catabolic process |
| GO:0007344 | 0.002 | Inf | 0.002 | 1 | 1 | pronuclear fusion |
| GO:1900186 | 0.002 | Inf | 0.002 | 1 | 1 | negative regulation of clathrin-mediated endocytosis |
| GO:0006734 | 0.0026 | 29.7829 | 0.0754 | 2 | 37 | NADH metabolic process |
| GO:0015876 | 0.0041 | 505.4839 | 0.0041 | 1 | 2 | acetyl-CoA transport |
| GO:0051792 | 0.0041 | 505.4839 | 0.0041 | 1 | 2 | medium-chain fatty acid biosynthetic process |
| GO:0072703 | 0.0041 | 505.4839 | 0.0041 | 1 | 2 | cellular response to methyl methanesulfonate |
| GO:1901337 | 0.0041 | 505.4839 | 0.0041 | 1 | 2 | thioester transport |
| GO:2001287 | 0.0041 | 505.4839 | 0.0041 | 1 | 2 | negative regulation of caveolin-mediated endocytosis |
| GO:0009408 | 0.0043 | 10.0924 | 0.3301 | 3 | 162 | response to heat |
| GO:0007352 | 0.0061 | 252.7258 | 0.0061 | 1 | 3 | zygotic specification of dorsal/ventral axis |
| GO:0014038 | 0.0061 | 252.7258 | 0.0061 | 1 | 3 | regulation of Schwann cell differentiation |
| GO:0019747 | 0.0061 | 252.7258 | 0.0061 | 1 | 3 | regulation of isoprenoid metabolic process |
| GO:0031296 | 0.0061 | 252.7258 | 0.0061 | 1 | 3 | B cell costimulation |
| GO:0044375 | 0.0061 | 252.7258 | 0.0061 | 1 | 3 | regulation of peroxisome size |
| GO:0046365 | 0.0062 | 18.5893 | 0.1182 | 2 | 58 | monosaccharide catabolic process |
| GO:0009056 | 0.0076 | 2.9166 | 4.3263 | 10 | 2123 | catabolic process |
| GO:0000045 | 0.008 | 16.2573 | 0.1345 | 2 | 66 | autophagosome assembly |
| GO:0006757 | 0.008 | 16.2573 | 0.1345 | 2 | 66 | ATP generation from ADP |
| GO:0002636 | 0.0081 | 168.4731 | 0.0082 | 1 | 4 | positive regulation of germinal center formation |
| GO:0051790 | 0.0081 | 168.4731 | 0.0082 | 1 | 4 | short-chain fatty acid biosynthetic process |
| GOMFID | Pvalue | OddsRatio | ExpCount | Count | Size | Term |
| GO:0031508 | 0.0019 | 1120.5 | 0.0019 | 1 | 2 | pericentric heterochromatin assembly |
| GO:0042942 | 0.0019 | 1120.5 | 0.0019 | 1 | 2 | D-serine transport |
| GO:0001692 | 0.0029 | 560.2143 | 0.0029 | 1 | 3 | histamine metabolic process |
| GO:0042732 | 0.0029 | 560.2143 | 0.0029 | 1 | 3 | D-xylose metabolic process |
| GO:0005997 | 0.0038 | 373.4524 | 0.0038 | 1 | 4 | xylulose metabolic process |
| GO:0014054 | 0.0048 | 280.0714 | 0.0048 | 1 | 5 | positive regulation of gamma-aminobutyric acid secretion |
| GO:0019640 | 0.0048 | 280.0714 | 0.0048 | 1 | 5 | glucuronate catabolic process to xylulose 5-phosphate |
| GO:0036018 | 0.0048 | 280.0714 | 0.0048 | 1 | 5 | cellular response to erythropoietin |
| GO:0051167 | 0.0048 | 280.0714 | 0.0048 | 1 | 5 | xylulose 5-phosphate metabolic process |
| GO:0014050 | 0.0057 | 224.0429 | 0.0057 | 1 | 6 | negative regulation of glutamate secretion |
| GO:0031119 | 0.0057 | 224.0429 | 0.0057 | 1 | 6 | tRNA pseudouridine synthesis |
| GO:0006865 | 0.0076 | 17.4632 | 0.1328 | 2 | 139 | amino acid transport |
| GO:2000252 | 0.0076 | 160.0102 | 0.0076 | 1 | 8 | negative regulation of feeding behavior |
| GO:0032926 | 0.0095 | 124.4365 | 0.0096 | 1 | 10 | negative regulation of activin receptor signaling pathway |
| GO:0051798 | 0.0095 | 124.4365 | 0.0096 | 1 | 10 | positive regulation of hair follicle development |
| GOMFID | Pvalue | OddsRatio | ExpCount | Count | Size | Term |
| GO:0036394 | 4e-04 | Inf | 4e-04 | 1 | 1 | amylase secretion |
| GO:0090297 | 4e-04 | Inf | 4e-04 | 1 | 1 | positive regulation of mitochondrial DNA replication |
| GO:1900210 | 4e-04 | Inf | 4e-04 | 1 | 1 | positive regulation of cardiolipin metabolic process |
| GO:1990046 | 4e-04 | Inf | 4e-04 | 1 | 1 | stress-induced mitochondrial fusion |
| GO:0010918 | 0.0015 | 1046.2667 | 0.0015 | 1 | 4 | positive regulation of mitochondrial membrane potential |
| GO:0010739 | 0.0019 | 784.65 | 0.0019 | 1 | 5 | positive regulation of protein kinase A signaling |
| GO:1901858 | 0.0019 | 784.65 | 0.0019 | 1 | 5 | regulation of mitochondrial DNA metabolic process |
| GO:0007565 | 0.0022 | 40.3776 | 0.0741 | 2 | 194 | female pregnancy |
| GO:0072321 | 0.0031 | 448.2857 | 0.0031 | 1 | 8 | chaperone-mediated protein transport |
| GO:0009152 | 0.0032 | 33.1845 | 0.0898 | 2 | 235 | purine ribonucleotide biosynthetic process |
| GO:0034982 | 0.0034 | 392.225 | 0.0034 | 1 | 9 | mitochondrial protein processing |
| GO:0046390 | 0.0036 | 31.4045 | 0.0948 | 2 | 248 | ribose phosphate biosynthetic process |
| GO:0072522 | 0.0037 | 30.6448 | 0.0971 | 2 | 254 | purine-containing compound biosynthetic process |
| GO:0051533 | 0.0038 | 348.6222 | 0.0038 | 1 | 10 | positive regulation of NFAT protein import into nucleus |
| GO:0006851 | 0.0042 | 313.74 | 0.0042 | 1 | 11 | mitochondrial calcium ion transport |
| GO:0009165 | 0.005 | 26.3784 | 0.1123 | 2 | 294 | nucleotide biosynthetic process |
| GO:0042776 | 0.0065 | 196.0125 | 0.0065 | 1 | 17 | mitochondrial ATP synthesis coupled proton transport |
| GO:0006874 | 0.0071 | 21.9243 | 0.1345 | 2 | 352 | cellular calcium ion homeostasis |
| GO:0014850 | 0.0076 | 165.0316 | 0.0076 | 1 | 20 | response to muscle activity |
| GO:0072507 | 0.0087 | 19.6761 | 0.1494 | 2 | 391 | divalent inorganic cation homeostasis |
| GO:0001832 | 0.0088 | 142.5 | 0.0088 | 1 | 23 | blastocyst growth |
| GO:0015985 | 0.0088 | 142.5 | 0.0088 | 1 | 23 | energy coupled proton transport, down electrochemical gradient |
| GO:0007194 | 0.0091 | 136.2957 | 0.0092 | 1 | 24 | negative regulation of adenylate cyclase activity |
| GO:0033036 | 0.0092 | 9.8379 | 1.0148 | 4 | 2656 | macromolecule localization |
| GO:0070838 | 0.0095 | 18.7838 | 0.1563 | 2 | 409 | divalent metal ion transport |
| GO:0050775 | 0.0099 | 125.376 | 0.0099 | 1 | 26 | positive regulation of dendrite morphogenesis |
| GOMFID | Pvalue | OddsRatio | ExpCount | Count | Size | Term |
| GO:0035971 | 0.0011 | Inf | 0.0011 | 1 | 1 | peptidyl-histidine dephosphorylation |
| GO:0042418 | 0.0022 | 980.3125 | 0.0022 | 1 | 2 | epinephrine biosynthetic process |
| GO:0060265 | 0.0022 | 980.3125 | 0.0022 | 1 | 2 | positive regulation of respiratory burst involved in inflammatory response |
| GO:0070488 | 0.0022 | 980.3125 | 0.0022 | 1 | 2 | neutrophil aggregation |
| GO:0033387 | 0.0032 | 490.125 | 0.0032 | 1 | 3 | putrescine biosynthetic process from ornithine |
| GO:0060266 | 0.0032 | 490.125 | 0.0032 | 1 | 3 | negative regulation of respiratory burst involved in inflammatory response |
| GO:2000984 | 0.0032 | 490.125 | 0.0032 | 1 | 3 | negative regulation of ATP citrate synthase activity |
| GO:0002793 | 0.0041 | 23.9065 | 0.0964 | 2 | 89 | positive regulation of peptide secretion |
| GO:0007000 | 0.0054 | 245.0312 | 0.0054 | 1 | 5 | nucleolus organization |
| GO:0009445 | 0.0065 | 196.0125 | 0.0065 | 1 | 6 | putrescine metabolic process |
| GO:0002683 | 0.0067 | 9.02 | 0.3973 | 3 | 367 | negative regulation of immune system process |
| GO:0019725 | 0.0077 | 6.0935 | 0.8206 | 4 | 758 | cellular homeostasis |
| GO:0051262 | 0.0088 | 15.9549 | 0.1429 | 2 | 132 | protein tetramerization |
| GO:0050907 | 0.0093 | 7.984 | 0.4471 | 3 | 413 | detection of chemical stimulus involved in sensory perception |
| GO:0002679 | 0.0097 | 122.4844 | 0.0097 | 1 | 9 | respiratory burst involved in defense response |
| GO:0030432 | 0.0097 | 122.4844 | 0.0097 | 1 | 9 | peristalsis |
| GO:0045842 | 0.0097 | 122.4844 | 0.0097 | 1 | 9 | positive regulation of mitotic metaphase/anaphase transition |
| GOMFID | Pvalue | OddsRatio | ExpCount | Count | Size | Term |
| GO:0033299 | 0.0054 | 245.0312 | 0.0054 | 1 | 5 | secretion of lysosomal enzymes |
| GO:0016567 | 0.0071 | 6.2589 | 0.8 | 4 | 739 | protein ubiquitination |
| GO:0000910 | 0.0085 | 16.2063 | 0.1407 | 2 | 130 | cytokinesis |
| GO:0060155 | 0.0086 | 139.9911 | 0.0087 | 1 | 8 | platelet dense granule organization |
| GO:0001547 | 0.0097 | 122.4844 | 0.0097 | 1 | 9 | antral ovarian follicle growth |
| GOMFID | Pvalue | OddsRatio | ExpCount | Count | Size | Term |
| GO:0006878 | 0.0069 | 178.2159 | 0.0069 | 1 | 12 | cellular copper ion homeostasis |
| GO:0006825 | 0.0091 | 130.6583 | 0.0092 | 1 | 16 | copper ion transport |
| GO:0014912 | 0.0091 | 130.6583 | 0.0092 | 1 | 16 | negative regulation of smooth muscle cell migration |
| GO:0008535 | 0.0097 | 122.4844 | 0.0097 | 1 | 17 | respiratory chain complex IV assembly |
| GO:0080111 | 0.0097 | 122.4844 | 0.0097 | 1 | 17 | DNA demethylation |
| GOMFID | Pvalue | OddsRatio | ExpCount | Count | Size | Term |
| GO:0006713 | 0.001 | Inf | 0.001 | 1 | 1 | glucocorticoid catabolic process |
| GO:0021509 | 0.001 | Inf | 0.001 | 1 | 1 | roof plate formation |
| GO:1903434 | 0.001 | Inf | 0.001 | 1 | 1 | negative regulation of constitutive secretory pathway |
| GO:2001051 | 0.001 | Inf | 0.001 | 1 | 1 | positive regulation of tendon cell differentiation |
| GO:0010043 | 0.0013 | 43.7983 | 0.054 | 2 | 53 | response to zinc ion |
| GO:0006542 | 0.002 | 1045.7333 | 0.002 | 1 | 2 | glutamine biosynthetic process |
| GO:0021568 | 0.002 | 1045.7333 | 0.002 | 1 | 2 | rhombomere 2 development |
| GO:0021658 | 0.002 | 1045.7333 | 0.002 | 1 | 2 | rhombomere 3 morphogenesis |
| GO:2000156 | 0.002 | 1045.7333 | 0.002 | 1 | 2 | regulation of retrograde vesicle-mediated transport, Golgi to ER |
| GO:0035284 | 0.0031 | 522.8333 | 0.0031 | 1 | 3 | brain segmentation |
| GO:2000599 | 0.0031 | 522.8333 | 0.0031 | 1 | 3 | negative regulation of cyclin catabolic process |
| GO:0030901 | 0.0033 | 26.8571 | 0.0866 | 2 | 85 | midbrain development |
| GO:0035992 | 0.0041 | 348.5333 | 0.0041 | 1 | 4 | tendon formation |
| GO:0045667 | 0.0058 | 20.0463 | 0.1151 | 2 | 113 | regulation of osteoblast differentiation |
| GO:0006538 | 0.0061 | 209.0933 | 0.0061 | 1 | 6 | glutamate catabolic process |
| GO:0033689 | 0.0091 | 130.6583 | 0.0092 | 1 | 9 | negative regulation of osteoblast proliferation |
| GO:1903358 | 0.0091 | 130.6583 | 0.0092 | 1 | 9 | regulation of Golgi organization |
| NA. |
| n/a |
| GOMFID | Pvalue | OddsRatio | ExpCount | Count | Size | Term |
| GO:0071228 | 7e-04 | Inf | 7e-04 | 1 | 1 | cellular response to tumor cell |
| GO:1901303 | 0.0014 | 1569.1 | 0.0014 | 1 | 2 | negative regulation of cargo loading into COPII-coated vesicle |
| GO:0050911 | 0.0019 | 15.6591 | 0.2592 | 3 | 370 | detection of chemical stimulus involved in sensory perception of smell |
| GO:0009593 | 0.0033 | 12.76 | 0.3159 | 3 | 451 | detection of chemical stimulus |
| GO:0007606 | 0.0035 | 12.3896 | 0.325 | 3 | 464 | sensory perception of chemical stimulus |
| GO:0050906 | 0.0035 | 12.3896 | 0.325 | 3 | 464 | detection of stimulus involved in sensory perception |
| GO:0032933 | 0.0063 | 196.05 | 0.0063 | 1 | 9 | SREBP signaling pathway |
| GO:0035459 | 0.0063 | 196.05 | 0.0063 | 1 | 9 | cargo loading into vesicle |
| GO:0006991 | 0.007 | 174.2556 | 0.007 | 1 | 10 | response to sterol depletion |
| GO:0032060 | 0.007 | 174.2556 | 0.007 | 1 | 10 | bleb assembly |
| GO:0060363 | 0.007 | 174.2556 | 0.007 | 1 | 10 | cranial suture morphogenesis |
| GO:0045717 | 0.0091 | 130.6667 | 0.0091 | 1 | 13 | negative regulation of fatty acid biosynthetic process |
| GO:0060628 | 0.0091 | 130.6667 | 0.0091 | 1 | 13 | regulation of ER to Golgi vesicle-mediated transport |
| GOMFID | Pvalue | OddsRatio | ExpCount | Count | Size | Term |
| GO:0042254 | 0.0012 | 70.6849 | 0.0563 | 2 | 221 | ribosome biogenesis |
| GO:0045730 | 0.0064 | 217.7083 | 0.0064 | 1 | 25 | respiratory burst |
| GO:0006412 | 0.0085 | 24.9917 | 0.1544 | 2 | 606 | translation |
| GOMFID | Pvalue | OddsRatio | ExpCount | Count | Size | Term |
| GO:1902361 | 0 | Inf | 0.0039 | 2 | 2 | mitochondrial pyruvate transmembrane transport |
| GO:0006848 | 0 | 1080.7586 | 0.0059 | 2 | 3 | pyruvate transport |
| GO:0010467 | 7e-04 | 3.3894 | 9.8885 | 19 | 5009 | gene expression |
| GO:0042254 | 7e-04 | 11.2163 | 0.4128 | 4 | 216 | ribosome biogenesis |
| GO:0046688 | 0.0013 | 43.1641 | 0.0533 | 2 | 27 | response to copper ion |
| GO:0009069 | 0.0017 | 14.1229 | 0.2389 | 3 | 121 | serine family amino acid metabolic process |
| GO:0044085 | 0.002 | 3.3261 | 4.961 | 12 | 2513 | cellular component biogenesis |
| GO:0007344 | 0.002 | Inf | 0.002 | 1 | 1 | pronuclear fusion |
| GO:0016077 | 0.002 | Inf | 0.002 | 1 | 1 | snoRNA catabolic process |
| GO:0035863 | 0.002 | Inf | 0.002 | 1 | 1 | dITP catabolic process |
| GO:1901639 | 0.002 | Inf | 0.002 | 1 | 1 | XDP catabolic process |
| GO:1904947 | 0.002 | Inf | 0.002 | 1 | 1 | folic acid import into mitochondrion |
| GO:0046483 | 0.0024 | 2.9664 | 10.8045 | 19 | 5473 | heterocycle metabolic process |
| GO:0006725 | 0.0025 | 2.9514 | 10.84 | 19 | 5491 | cellular aromatic compound metabolic process |
| GO:0051726 | 0.0028 | 4.3349 | 1.9643 | 7 | 995 | regulation of cell cycle |
| GO:0046686 | 0.0031 | 26.9517 | 0.0829 | 2 | 42 | response to cadmium ion |
| GO:0016072 | 0.0033 | 11.0871 | 0.302 | 3 | 153 | rRNA metabolic process |
| GO:0090304 | 0.0037 | 2.8099 | 9.3693 | 17 | 4746 | nucleic acid metabolic process |
| GO:0046709 | 0.0039 | 522.3667 | 0.0039 | 1 | 2 | IDP catabolic process |
| GO:0072703 | 0.0039 | 522.3667 | 0.0039 | 1 | 2 | cellular response to methyl methanesulfonate |
| GO:2000233 | 0.0039 | 522.3667 | 0.0039 | 1 | 2 | negative regulation of rRNA processing |
| GO:1901360 | 0.004 | 2.7815 | 11.2605 | 19 | 5704 | organic cyclic compound metabolic process |
| GO:0051054 | 0.0047 | 9.7702 | 0.3415 | 3 | 173 | positive regulation of DNA metabolic process |
| GO:0032774 | 0.0052 | 2.7696 | 7.1188 | 14 | 3606 | RNA biosynthetic process |
| GO:0034502 | 0.0052 | 20.324 | 0.1086 | 2 | 55 | protein localization to chromosome |
| GO:0014038 | 0.0059 | 261.1667 | 0.0059 | 1 | 3 | regulation of Schwann cell differentiation |
| GO:0033693 | 0.0059 | 261.1667 | 0.0059 | 1 | 3 | neurofilament bundle assembly |
| GO:0035526 | 0.0059 | 261.1667 | 0.0059 | 1 | 3 | retrograde transport, plasma membrane to Golgi |
| GO:0035993 | 0.0059 | 261.1667 | 0.0059 | 1 | 3 | deltoid tuberosity development |
| GO:0044375 | 0.0059 | 261.1667 | 0.0059 | 1 | 3 | regulation of peroxisome size |
| GO:0097428 | 0.0059 | 261.1667 | 0.0059 | 1 | 3 | protein maturation by iron-sulfur cluster transfer |
| GO:0006402 | 0.0072 | 8.3308 | 0.3988 | 3 | 202 | mRNA catabolic process |
| GO:0006382 | 0.0079 | 174.1 | 0.0079 | 1 | 4 | adenosine to inosine editing |
| GO:0009137 | 0.0079 | 174.1 | 0.0079 | 1 | 4 | purine nucleoside diphosphate catabolic process |
| GO:0035990 | 0.0079 | 174.1 | 0.0079 | 1 | 4 | tendon cell differentiation |
| GO:0061732 | 0.0079 | 174.1 | 0.0079 | 1 | 4 | mitochondrial acetyl-CoA biosynthetic process from pyruvate |
| GO:0051252 | 0.0098 | 2.5767 | 6.799 | 13 | 3444 | regulation of RNA metabolic process |
| GO:0061056 | 0.0098 | 130.5667 | 0.0099 | 1 | 5 | sclerotome development |
| GO:0070885 | 0.0098 | 130.5667 | 0.0099 | 1 | 5 | negative regulation of calcineurin-NFAT signaling cascade |
| GO:0090069 | 0.0098 | 130.5667 | 0.0099 | 1 | 5 | regulation of ribosome biogenesis |
| GOMFID | Pvalue | OddsRatio | ExpCount | Count | Size | Term |
| GO:0045008 | 5e-04 | Inf | 5e-04 | 1 | 8 | depyrimidination |
| GO:0006244 | 8e-04 | Inf | 8e-04 | 1 | 12 | pyrimidine nucleotide catabolic process |
| GO:0009219 | 0.001 | Inf | 0.001 | 1 | 16 | pyrimidine deoxyribonucleotide metabolic process |
| GO:0009264 | 0.0013 | Inf | 0.0013 | 1 | 20 | deoxyribonucleotide catabolic process |
| GO:0046386 | 0.0013 | Inf | 0.0013 | 1 | 21 | deoxyribose phosphate catabolic process |
| GO:0006284 | 0.0031 | Inf | 0.0031 | 1 | 48 | base-excision repair |
| GO:0072527 | 0.0046 | Inf | 0.0046 | 1 | 72 | pyrimidine-containing compound metabolic process |
| GO:1901292 | 0.0066 | Inf | 0.0066 | 1 | 103 | nucleoside phosphate catabolic process |
| GO:0032355 | 0.0092 | Inf | 0.0092 | 1 | 145 | response to estradiol |
| GOMFID | Pvalue | OddsRatio | ExpCount | Count | Size | Term |
| GO:0043048 | 3e-04 | Inf | 3e-04 | 1 | 1 | dolichyl monophosphate biosynthetic process |
| GO:0045585 | 5e-04 | 5232.6667 | 5e-04 | 1 | 2 | positive regulation of cytotoxic T cell differentiation |
| GO:0006364 | 5e-04 | 107.269 | 0.0374 | 2 | 147 | rRNA processing |
| GO:0006489 | 0.0015 | 1046.2667 | 0.0015 | 1 | 6 | dolichyl diphosphate biosynthetic process |
| GO:0022613 | 0.003 | 43.2225 | 0.0909 | 2 | 357 | ribonucleoprotein complex biogenesis |
| GO:0000028 | 0.0041 | 348.5333 | 0.0041 | 1 | 16 | ribosomal small subunit assembly |
| GO:0034660 | 0.0049 | 33.2773 | 0.1172 | 2 | 460 | ncRNA metabolic process |
| GO:0043011 | 0.0053 | 261.3167 | 0.0053 | 1 | 21 | myeloid dendritic cell differentiation |
| GO:0000462 | 0.0064 | 217.7083 | 0.0064 | 1 | 25 | maturation of SSU-rRNA from tricistronic rRNA transcript (SSU-rRNA, 5.8S rRNA, LSU-rRNA) |
| GO:0042104 | 0.0069 | 200.9359 | 0.0069 | 1 | 27 | positive regulation of activated T cell proliferation |
| GO:0009303 | 0.0074 | 186.5595 | 0.0074 | 1 | 29 | rRNA transcription |
| GO:0032735 | 0.0086 | 158.2424 | 0.0087 | 1 | 34 | positive regulation of interleukin-12 production |
| GOMFID | Pvalue | OddsRatio | ExpCount | Count | Size | Term |
| GO:0034629 | 3e-04 | 93.2321 | 0.0265 | 2 | 26 | cellular protein complex localization |
| GO:0043105 | 0.001 | Inf | 0.001 | 1 | 1 | negative regulation of GTP cyclohydrolase I activity |
| GO:1990428 | 0.001 | Inf | 0.001 | 1 | 1 | miRNA transport |
| GO:2000751 | 0.001 | Inf | 0.001 | 1 | 1 | histone H3-T3 phosphorylation involved in chromosome passenger complex localization to kinetochore |
| GO:0044260 | 0.0025 | 6.7847 | 8.1309 | 14 | 7980 | cellular macromolecule metabolic process |
| GO:0001927 | 0.0031 | 522.8333 | 0.0031 | 1 | 3 | exocyst assembly |
| GO:0035993 | 0.0031 | 522.8333 | 0.0031 | 1 | 3 | deltoid tuberosity development |
| GO:0071409 | 0.0031 | 522.8333 | 0.0031 | 1 | 3 | cellular response to cycloheximide |
| GO:0035990 | 0.0041 | 348.5333 | 0.0041 | 1 | 4 | tendon cell differentiation |
| GO:1901699 | 0.0048 | 7.126 | 0.7183 | 4 | 705 | cellular response to nitrogen compound |
| GO:0061056 | 0.0051 | 261.3833 | 0.0051 | 1 | 5 | sclerotome development |
| GO:0006357 | 0.0052 | 4.8946 | 1.7515 | 6 | 1719 | regulation of transcription from RNA polymerase II promoter |
| GO:0044271 | 0.0055 | 4.0744 | 4.6503 | 10 | 4564 | cellular nitrogen compound biosynthetic process |
| GO:0051291 | 0.0057 | 20.2299 | 0.1141 | 2 | 112 | protein heterooligomerization |
| GO:0035989 | 0.0061 | 209.0933 | 0.0061 | 1 | 6 | tendon development |
| GO:0043062 | 0.0062 | 9.3716 | 0.3872 | 3 | 380 | extracellular structure organization |
| GO:0032963 | 0.0065 | 18.8487 | 0.1223 | 2 | 120 | collagen metabolic process |
| GO:0032790 | 0.0071 | 174.2333 | 0.0071 | 1 | 7 | ribosome disassembly |
| GO:0035405 | 0.0071 | 174.2333 | 0.0071 | 1 | 7 | histone-threonine phosphorylation |
| GO:0022617 | 0.0076 | 17.365 | 0.1325 | 2 | 130 | extracellular matrix disassembly |
| GO:0009889 | 0.0083 | 3.787 | 4.0604 | 9 | 3985 | regulation of biosynthetic process |
| GO:0010468 | 0.0086 | 3.754 | 4.0869 | 9 | 4011 | regulation of gene expression |
| GO:0044236 | 0.0087 | 16.0963 | 0.1426 | 2 | 140 | multicellular organism metabolic process |
| GO:0071495 | 0.0089 | 4.8786 | 1.3674 | 5 | 1342 | cellular response to endogenous stimulus |
| GO:0051171 | 0.0091 | 3.7178 | 4.1164 | 9 | 4040 | regulation of nitrogen compound metabolic process |
| GO:0031053 | 0.0091 | 130.6583 | 0.0092 | 1 | 9 | primary miRNA processing |
| GO:2000543 | 0.0091 | 130.6583 | 0.0092 | 1 | 9 | positive regulation of gastrulation |
| GO:0031047 | 0.0098 | 15.102 | 0.1518 | 2 | 149 | gene silencing by RNA |
| GOMFID | Pvalue | OddsRatio | ExpCount | Count | Size | Term |
| GO:0035971 | 6e-04 | Inf | 6e-04 | 1 | 1 | peptidyl-histidine dephosphorylation |
| GO:0043086 | 8e-04 | 14.5112 | 0.4723 | 4 | 824 | negative regulation of catalytic activity |
| GO:2000984 | 0.0017 | 980.75 | 0.0017 | 1 | 3 | negative regulation of ATP citrate synthase activity |
| GO:0034316 | 0.0023 | 653.7917 | 0.0023 | 1 | 4 | negative regulation of Arp2/3 complex-mediated actin nucleation |
| GO:0006112 | 0.004 | 26.2468 | 0.098 | 2 | 171 | energy reserve metabolic process |
| GO:0006469 | 0.0072 | 19.381 | 0.1318 | 2 | 230 | negative regulation of protein kinase activity |
| GO:0030168 | 0.0082 | 18.0163 | 0.1416 | 2 | 247 | platelet activation |
| GO:0050860 | 0.0091 | 130.6583 | 0.0092 | 1 | 16 | negative regulation of T cell receptor signaling pathway |
| GO:0032956 | 0.0093 | 16.8944 | 0.1507 | 2 | 263 | regulation of actin cytoskeleton organization |
| GO:0007597 | 0.0097 | 122.4844 | 0.0097 | 1 | 17 | blood coagulation, intrinsic pathway |
| GOMFID | Pvalue | OddsRatio | ExpCount | Count | Size | Term |
| GO:0031118 | 4e-04 | Inf | 4e-04 | 1 | 1 | rRNA pseudouridine synthesis |
| GO:0006888 | 0.0015 | 48.5531 | 0.0619 | 2 | 162 | ER to Golgi vesicle-mediated transport |
| GO:0018279 | 0.0034 | 32.0664 | 0.0928 | 2 | 243 | protein N-linked glycosylation via asparagine |
| GO:1904874 | 0.0053 | 241.2923 | 0.0053 | 1 | 14 | positive regulation of telomerase RNA localization to Cajal body |
| GO:0090670 | 0.0057 | 224.0429 | 0.0057 | 1 | 15 | RNA localization to Cajal body |
| GO:0090672 | 0.0057 | 224.0429 | 0.0057 | 1 | 15 | telomerase RNA localization |
| GO:0006486 | 0.0095 | 18.7838 | 0.1563 | 2 | 409 | protein glycosylation |
| GO:0070085 | 0.0096 | 18.5961 | 0.1578 | 2 | 413 | glycosylation |
| GOMFID | Pvalue | OddsRatio | ExpCount | Count | Size | Term |
| GO:0032094 | 7e-04 | 59.2879 | 0.0401 | 2 | 35 | response to food |
| GO:0009231 | 0.0011 | Inf | 0.0011 | 1 | 1 | riboflavin biosynthetic process |
| GO:0009398 | 0.0011 | Inf | 0.0011 | 1 | 1 | FMN biosynthetic process |
| GO:0019391 | 0.0011 | Inf | 0.0011 | 1 | 1 | glucuronoside catabolic process |
| GO:0002260 | 0.0022 | 33.1059 | 0.0699 | 2 | 61 | lymphocyte homeostasis |
| GO:0032796 | 0.0023 | 922.5882 | 0.0023 | 1 | 2 | uropod organization |
| GO:1901566 | 0.0027 | 5.4413 | 1.52 | 6 | 1326 | organonitrogen compound biosynthetic process |
| GO:0032765 | 0.0034 | 461.2647 | 0.0034 | 1 | 3 | positive regulation of mast cell cytokine production |
| GO:0033864 | 0.0034 | 461.2647 | 0.0034 | 1 | 3 | positive regulation of NAD(P)H oxidase activity |
| GO:0035483 | 0.0034 | 461.2647 | 0.0034 | 1 | 3 | gastric emptying |
| GO:0042109 | 0.0034 | 461.2647 | 0.0034 | 1 | 3 | lymphotoxin A biosynthetic process |
| GO:0043624 | 0.0035 | 11.4617 | 0.3118 | 3 | 272 | cellular protein complex disassembly |
| GO:0070126 | 0.0043 | 23.2158 | 0.0986 | 2 | 86 | mitochondrial translational termination |
| GO:0006412 | 0.0044 | 7.1585 | 0.6946 | 4 | 606 | translation |
| GO:0002906 | 0.0046 | 307.4902 | 0.0046 | 1 | 4 | negative regulation of mature B cell apoptotic process |
| GO:0031064 | 0.0046 | 307.4902 | 0.0046 | 1 | 4 | negative regulation of histone deacetylation |
| GO:0061502 | 0.0046 | 307.4902 | 0.0046 | 1 | 4 | early endosome to recycling endosome transport |
| GO:0032984 | 0.0052 | 9.8868 | 0.3599 | 3 | 314 | macromolecular complex disassembly |
| GO:0031339 | 0.0057 | 230.6029 | 0.0057 | 1 | 5 | negative regulation of vesicle fusion |
| GO:0051461 | 0.0057 | 230.6029 | 0.0057 | 1 | 5 | positive regulation of corticotropin secretion |
| GO:1903365 | 0.0057 | 230.6029 | 0.0057 | 1 | 5 | regulation of fear response |
| GO:2000987 | 0.0057 | 230.6029 | 0.0057 | 1 | 5 | positive regulation of behavioral fear response |
| GO:0090279 | 0.0057 | 19.8814 | 0.1146 | 2 | 100 | regulation of calcium ion import |
| GO:0032635 | 0.0063 | 18.9102 | 0.1204 | 2 | 105 | interleukin-6 production |
| GO:0050905 | 0.0066 | 18.5476 | 0.1227 | 2 | 107 | neuromuscular process |
| GO:0042726 | 0.0069 | 184.4706 | 0.0069 | 1 | 6 | flavin-containing compound metabolic process |
| GO:0042756 | 0.0069 | 184.4706 | 0.0069 | 1 | 6 | drinking behavior |
| GO:0045416 | 0.0069 | 184.4706 | 0.0069 | 1 | 6 | positive regulation of interleukin-8 biosynthetic process |
| GO:0051126 | 0.0069 | 184.4706 | 0.0069 | 1 | 6 | negative regulation of actin nucleation |
| GO:0043604 | 0.0076 | 6.08 | 0.8116 | 4 | 708 | amide biosynthetic process |
| GO:0043320 | 0.008 | 153.7157 | 0.008 | 1 | 7 | natural killer cell degranulation |
| GO:0060455 | 0.008 | 153.7157 | 0.008 | 1 | 7 | negative regulation of gastric acid secretion |
| GO:0060452 | 0.0091 | 131.7479 | 0.0092 | 1 | 8 | positive regulation of cardiac muscle contraction |
| GO:0090073 | 0.0091 | 131.7479 | 0.0092 | 1 | 8 | positive regulation of protein homodimerization activity |
| GO:2000252 | 0.0091 | 131.7479 | 0.0092 | 1 | 8 | negative regulation of feeding behavior |
| GO:0006518 | 0.0093 | 5.7135 | 0.8609 | 4 | 751 | peptide metabolic process |
| GOMFID | Pvalue | OddsRatio | ExpCount | Count | Size | Term |
| GO:0017174 | 0.0013 | Inf | 0.0013 | 1 | 1 | glycine N-methyltransferase activity |
| GO:0004715 | 0.0014 | 41.4974 | 0.0559 | 2 | 44 | non-membrane spanning protein tyrosine kinase activity |
| GO:0015137 | 0.0051 | 275.8772 | 0.0051 | 1 | 4 | citrate transmembrane transporter activity |
| GO:0051920 | 0.0076 | 165.5053 | 0.0076 | 1 | 6 | peroxiredoxin activity |
| GO:0030274 | 0.0089 | 137.9123 | 0.0089 | 1 | 7 | LIM domain binding |
| GOMFID | Pvalue | OddsRatio | ExpCount | Count | Size | Term |
| GO:0015320 | 0.001 | Inf | 0.001 | 1 | 1 | phosphate ion carrier activity |
| GO:0017174 | 0.001 | Inf | 0.001 | 1 | 1 | glycine N-methyltransferase activity |
| GO:0070976 | 0.001 | Inf | 0.001 | 1 | 1 | TIR domain binding |
| GO:0034597 | 0.0041 | 349.5333 | 0.0041 | 1 | 4 | phosphatidylinositol-4,5-bisphosphate 4-phosphatase activity |
| GO:0031726 | 0.0061 | 209.6933 | 0.0061 | 1 | 6 | CCR1 chemokine receptor binding |
| GOMFID | Pvalue | OddsRatio | ExpCount | Count | Size | Term |
| GO:0030881 | 0.0063 | 196.6125 | 0.0063 | 1 | 9 | beta-2-microglobulin binding |
| GO:0046703 | 0.0063 | 196.6125 | 0.0063 | 1 | 9 | natural killer cell lectin-like receptor binding |
| GO:0008106 | 0.009 | 131.0417 | 0.0091 | 1 | 13 | alcohol dehydrogenase (NADP+) activity |
| GOMFID | Pvalue | OddsRatio | ExpCount | Count | Size | Term |
| GO:0008821 | 0 | 655.4167 | 0.0053 | 2 | 6 | crossover junction endodeoxyribonuclease activity |
| GO:0017108 | 0 | 655.4167 | 0.0053 | 2 | 6 | 5'-flap endonuclease activity |
| GO:0016894 | 1e-04 | 154.0882 | 0.0169 | 2 | 19 | endonuclease activity, active with either ribo- or deoxyribonucleic acids and producing 3'-phosphomonoesters |
| GO:0016893 | 5e-04 | 74.7571 | 0.0329 | 2 | 37 | endonuclease activity, active with either ribo- or deoxyribonucleic acids and producing 5'-phosphomonoesters |
| GO:0004520 | 8e-04 | 58.1074 | 0.0418 | 2 | 47 | endodeoxyribonuclease activity |
| GO:0070180 | 9e-04 | Inf | 9e-04 | 1 | 1 | large ribosomal subunit rRNA binding |
| GO:0015016 | 0.0036 | 403.359 | 0.0036 | 1 | 4 | [heparan sulfate]-glucosamine N-sulfotransferase activity |
| GO:0070513 | 0.008 | 151.2115 | 0.008 | 1 | 9 | death domain binding |
| GOMFID | Pvalue | OddsRatio | ExpCount | Count | Size | Term |
| GO:0035575 | 1e-04 | 219.8881 | 0.0124 | 2 | 15 | histone demethylase activity (H4-K20 specific) |
| GO:0032451 | 4e-04 | 81.5584 | 0.0305 | 2 | 37 | demethylase activity |
| GO:0004168 | 8e-04 | Inf | 8e-04 | 1 | 1 | dolichol kinase activity |
| GO:0042393 | 0.008 | 17.2627 | 0.137 | 2 | 166 | histone binding |
| GOMFID | Pvalue | OddsRatio | ExpCount | Count | Size | Term |
| GO:0031531 | 8e-04 | Inf | 8e-04 | 1 | 1 | thyrotropin-releasing hormone receptor binding |
| GO:0052906 | 8e-04 | Inf | 8e-04 | 1 | 1 | tRNA (guanine(37)-N(1))-methyltransferase activity |
| GO:0008521 | 0.0017 | 1311.1667 | 0.0017 | 1 | 2 | acetyl-CoA transporter activity |
| GO:0031765 | 0.0017 | 1311.1667 | 0.0017 | 1 | 2 | type 2 galanin receptor binding |
| GO:0031766 | 0.0017 | 1311.1667 | 0.0017 | 1 | 2 | type 3 galanin receptor binding |
| GO:0015078 | 0.0025 | 31.9632 | 0.0751 | 2 | 91 | hydrogen ion transmembrane transporter activity |
| GO:0036402 | 0.0049 | 262.1667 | 0.005 | 1 | 6 | proteasome-activating ATPase activity |
| GO:0016423 | 0.0058 | 218.4583 | 0.0058 | 1 | 7 | tRNA (guanine) methyltransferase activity |
| GOMFID | Pvalue | OddsRatio | ExpCount | Count | Size | Term |
| GO:0005298 | 0.0015 | Inf | 0.0015 | 1 | 1 | proline:sodium symporter activity |
| GO:0036455 | 0.0015 | Inf | 0.0015 | 1 | 1 | iron-sulfur transferase activity |
| GO:0019843 | 0.0019 | 34.7243 | 0.0657 | 2 | 45 | rRNA binding |
| GO:0004372 | 0.003 | 683.6087 | 0.003 | 1 | 2 | glycine hydroxymethyltransferase activity |
| GO:0008732 | 0.003 | 683.6087 | 0.003 | 1 | 2 | L-allo-threonine aldolase activity |
| GO:0003735 | 0.0031 | 11.5565 | 0.2972 | 3 | 195 | structural constituent of ribosome |
| GO:0042392 | 0.0046 | 341.7826 | 0.0046 | 1 | 3 | sphingosine-1-phosphate phosphatase activity |
| GO:0008097 | 0.0061 | 227.8406 | 0.0061 | 1 | 4 | 5S rRNA binding |
| GOMFID | Pvalue | OddsRatio | ExpCount | Count | Size | Term |
| GO:0008106 | 0.0066 | 187.2381 | 0.0066 | 1 | 13 | alcohol dehydrogenase (NADP+) activity |
| GOMFID | Pvalue | OddsRatio | ExpCount | Count | Size | Term |
| GO:0004372 | 0.0018 | 1210.2308 | 0.0018 | 1 | 2 | glycine hydroxymethyltransferase activity |
| GO:0008732 | 0.0018 | 1210.2308 | 0.0018 | 1 | 2 | L-allo-threonine aldolase activity |
| GO:0005249 | 0.0025 | 31.4277 | 0.0756 | 2 | 85 | voltage-gated potassium channel activity |
| GO:0016972 | 0.0036 | 403.359 | 0.0036 | 1 | 4 | thiol oxidase activity |
| GO:0004984 | 0.0039 | 11.4196 | 0.3289 | 3 | 370 | olfactory receptor activity |
| GO:0061133 | 0.0053 | 241.9846 | 0.0053 | 1 | 6 | endopeptidase activator activity |
| GO:0015079 | 0.0065 | 19.1152 | 0.1227 | 2 | 138 | potassium ion transmembrane transporter activity |
| GO:0016832 | 0.008 | 151.2115 | 0.008 | 1 | 9 | aldehyde-lyase activity |
| GO:0022890 | 0.0083 | 8.5932 | 0.4329 | 3 | 487 | inorganic cation transmembrane transporter activity |
| GOMFID | Pvalue | OddsRatio | ExpCount | Count | Size | Term |
| GO:0070180 | 8e-04 | Inf | 8e-04 | 1 | 1 | large ribosomal subunit rRNA binding |
| GO:0016403 | 0.0017 | 1311.1667 | 0.0017 | 1 | 2 | dimethylargininase activity |
| GO:0016309 | 0.0025 | 655.5417 | 0.0025 | 1 | 3 | 1-phosphatidylinositol-5-phosphate 4-kinase activity |
| GO:0008097 | 0.0033 | 437 | 0.0033 | 1 | 4 | 5S rRNA binding |
| GO:0008330 | 0.0033 | 437 | 0.0033 | 1 | 4 | protein tyrosine/threonine phosphatase activity |
| GO:0004726 | 0.0066 | 187.2381 | 0.0066 | 1 | 8 | non-membrane spanning protein tyrosine phosphatase activity |
| GO:0016308 | 0.0066 | 187.2381 | 0.0066 | 1 | 8 | 1-phosphatidylinositol-4-phosphate 5-kinase activity |
| GO:0008239 | 0.009 | 131.0417 | 0.0091 | 1 | 11 | dipeptidyl-peptidase activity |
| GO:0017017 | 0.009 | 131.0417 | 0.0091 | 1 | 11 | MAP kinase tyrosine/serine/threonine phosphatase activity |
| GO:0004185 | 0.0099 | 119.1212 | 0.0099 | 1 | 12 | serine-type carboxypeptidase activity |
| GOMFID | Pvalue | OddsRatio | ExpCount | Count | Size | Term |
| GO:0032767 | 0.0022 | 983.125 | 0.0022 | 1 | 2 | copper-dependent protein binding |
| GO:0034513 | 0.0032 | 491.5312 | 0.0032 | 1 | 3 | box H/ACA snoRNA binding |
| GO:0050220 | 0.0032 | 491.5312 | 0.0032 | 1 | 3 | prostaglandin-E synthase activity |
| GO:0071532 | 0.0032 | 491.5312 | 0.0032 | 1 | 3 | ankyrin repeat binding |
| GO:0047035 | 0.0065 | 196.575 | 0.0065 | 1 | 6 | testosterone dehydrogenase (NAD+) activity |
| GO:0004673 | 0.0097 | 122.8359 | 0.0097 | 1 | 9 | protein histidine kinase activity |
| GO:0046933 | 0.0097 | 122.8359 | 0.0097 | 1 | 9 | proton-transporting ATP synthase activity, rotational mechanism |
| GOMFID | Pvalue | OddsRatio | ExpCount | Count | Size | Term |
| GO:0004984 | 0 | 16.1907 | 0.4229 | 5 | 370 | olfactory receptor activity |
| GO:0004930 | 2e-04 | 9.6484 | 0.8927 | 6 | 781 | G-protein coupled receptor activity |
| GO:0099600 | 0.0017 | 6 | 1.3899 | 6 | 1216 | transmembrane receptor activity |
| GO:0038023 | 0.0022 | 5.7272 | 1.4505 | 6 | 1269 | signaling receptor activity |
| GO:0034513 | 0.0034 | 462.5882 | 0.0034 | 1 | 3 | box H/ACA snoRNA binding |
| GO:0060089 | 0.0051 | 4.7468 | 1.7202 | 6 | 1505 | molecular transducer activity |
| GO:0042608 | 0.0068 | 185 | 0.0069 | 1 | 6 | T cell receptor binding |
| GO:0004523 | 0.008 | 154.1569 | 0.008 | 1 | 7 | RNA-DNA hybrid ribonuclease activity |
| GO:0046977 | 0.008 | 154.1569 | 0.008 | 1 | 7 | TAP binding |
| GOMFID | Pvalue | OddsRatio | ExpCount | Count | Size | Term |
| GO:0004603 | 0.0011 | Inf | 0.0011 | 1 | 1 | phenylethanolamine N-methyltransferase activity |
| GO:0019843 | 0.0014 | 41.7101 | 0.056 | 2 | 49 | rRNA binding |
| GO:0004784 | 0.0046 | 308.3725 | 0.0046 | 1 | 4 | superoxide dismutase activity |
| GO:0039706 | 0.0091 | 132.1261 | 0.0091 | 1 | 8 | co-receptor binding |
| GOMFID | Pvalue | OddsRatio | ExpCount | Count | Size | Term |
| GO:0031696 | 0.0015 | 1430.4545 | 0.0015 | 1 | 2 | alpha-2C adrenergic receptor binding |
| GO:0004930 | 0.0022 | 9.6261 | 0.5951 | 4 | 781 | G-protein coupled receptor activity |
| GO:0004938 | 0.0023 | 715.1818 | 0.0023 | 1 | 3 | alpha2-adrenergic receptor activity |
| GO:0031692 | 0.0023 | 715.1818 | 0.0023 | 1 | 3 | alpha-1B adrenergic receptor binding |
| GO:0032795 | 0.0023 | 715.1818 | 0.0023 | 1 | 3 | heterotrimeric G-protein binding |
| GO:0004082 | 0.003 | 476.7576 | 0.003 | 1 | 4 | bisphosphoglycerate mutase activity |
| GO:0046538 | 0.003 | 476.7576 | 0.003 | 1 | 4 | 2,3-bisphosphoglycerate-dependent phosphoglycerate mutase activity |
| GO:0051380 | 0.003 | 476.7576 | 0.003 | 1 | 4 | norepinephrine binding |
| GO:0004083 | 0.0038 | 357.5455 | 0.0038 | 1 | 5 | bisphosphoglycerate 2-phosphatase activity |
| GO:0004871 | 0.0043 | 6.4404 | 1.2009 | 5 | 1576 | signal transducer activity |
| GO:0051379 | 0.0046 | 286.0182 | 0.0046 | 1 | 6 | epinephrine binding |
| GO:0004935 | 0.0068 | 178.7273 | 0.0069 | 1 | 9 | adrenergic receptor activity |
| GO:0031996 | 0.0099 | 119.1212 | 0.0099 | 1 | 13 | thioesterase binding |
| GOMFID | Pvalue | OddsRatio | ExpCount | Count | Size | Term |
| GO:0016538 | 7e-04 | 59.4697 | 0.0396 | 2 | 26 | cyclin-dependent protein serine/threonine kinase regulator activity |
| GO:0008311 | 0.0015 | Inf | 0.0015 | 1 | 1 | double-stranded DNA 3'-5' exodeoxyribonuclease activity |
| GO:0050346 | 0.0015 | Inf | 0.0015 | 1 | 1 | trans-L-3-hydroxyproline dehydratase activity |
| GO:0000248 | 0.003 | 683.6087 | 0.003 | 1 | 2 | C-5 sterol desaturase activity |
| GO:0016890 | 0.003 | 683.6087 | 0.003 | 1 | 2 | site-specific endodeoxyribonuclease activity, specific for altered base |
| GO:0016835 | 0.0045 | 22.2443 | 0.1006 | 2 | 66 | carbon-oxygen lyase activity |
| GO:0004528 | 0.0076 | 170.8696 | 0.0076 | 1 | 5 | phosphodiesterase I activity |
| GO:0004844 | 0.0076 | 170.8696 | 0.0076 | 1 | 5 | uracil DNA N-glycosylase activity |
| GOMFID | Pvalue | OddsRatio | ExpCount | Count | Size | Term |
| GO:0022894 | 9e-04 | Inf | 9e-04 | 1 | 1 | Intermediate conductance calcium-activated potassium channel activity |
| GO:0031716 | 0.0018 | 1210.2308 | 0.0018 | 1 | 2 | calcitonin receptor binding |
| GO:0016286 | 0.0036 | 403.359 | 0.0036 | 1 | 4 | small conductance calcium-activated potassium channel activity |
| GO:0097157 | 0.0053 | 241.9846 | 0.0053 | 1 | 6 | pre-mRNA intronic binding |
| GO:1990247 | 0.0062 | 201.641 | 0.0062 | 1 | 7 | N6-methyladenosine-containing RNA binding |
| GO:0047498 | 0.0071 | 172.8242 | 0.0071 | 1 | 8 | calcium-dependent phospholipase A2 activity |
| GO:0043047 | 0.008 | 151.2115 | 0.008 | 1 | 9 | single-stranded telomeric DNA binding |
| GOMFID | Pvalue | OddsRatio | ExpCount | Count | Size | Term |
| GO:0032767 | 0.001 | 2248.4286 | 0.001 | 1 | 2 | copper-dependent protein binding |
| GO:0034513 | 0.0015 | 1124.1429 | 0.0015 | 1 | 3 | box H/ACA snoRNA binding |
| GO:0030674 | 0.0024 | 35.3583 | 0.0757 | 2 | 149 | protein binding, bridging |
| GO:0048156 | 0.0056 | 224.7143 | 0.0056 | 1 | 11 | tau protein binding |
| GO:0035259 | 0.0066 | 187.2381 | 0.0066 | 1 | 13 | glucocorticoid receptor binding |
| GO:0070034 | 0.0066 | 187.2381 | 0.0066 | 1 | 13 | telomerase RNA binding |
| GO:0005528 | 0.0091 | 132.1261 | 0.0091 | 1 | 18 | FK506 binding |
| GOMFID | Pvalue | OddsRatio | ExpCount | Count | Size | Term |
| GO:0004984 | 0 | 42.0055 | 0.188 | 4 | 370 | olfactory receptor activity |
| GO:0060089 | 3e-04 | 15.8222 | 0.7645 | 5 | 1505 | molecular transducer activity |
| GO:0004930 | 4e-04 | 19.2574 | 0.3967 | 4 | 781 | G-protein coupled receptor activity |
| GO:0047710 | 0.001 | 2248.4286 | 0.001 | 1 | 2 | bis(5'-adenosyl)-triphosphatase activity |
| GO:0099600 | 0.0019 | 11.9868 | 0.6177 | 4 | 1216 | transmembrane receptor activity |
| GO:0038023 | 0.0023 | 11.4427 | 0.6447 | 4 | 1269 | signaling receptor activity |
| GO:0030883 | 0.0025 | 562 | 0.0025 | 1 | 5 | endogenous lipid antigen binding |
| GO:0030884 | 0.0025 | 562 | 0.0025 | 1 | 5 | exogenous lipid antigen binding |
| GO:0071723 | 0.0036 | 374.619 | 0.0036 | 1 | 7 | lipopeptide binding |
| GO:0030881 | 0.0046 | 280.9286 | 0.0046 | 1 | 9 | beta-2-microglobulin binding |
| NA. |
| n/a |
| GOMFID | Pvalue | OddsRatio | ExpCount | Count | Size | Term |
| GO:0008437 | 5e-04 | Inf | 5e-04 | 1 | 1 | thyrotropin-releasing hormone activity |
| GO:0005537 | 0.0096 | 124.7778 | 0.0097 | 1 | 19 | mannose binding |
| GOMFID | Pvalue | OddsRatio | ExpCount | Count | Size | Term |
| GO:0008260 | 0.0019 | 1123.7143 | 0.0019 | 1 | 2 | 3-oxoacid CoA-transferase activity |
| GO:0051920 | 0.0057 | 224.6857 | 0.0057 | 1 | 6 | peroxiredoxin activity |
| GO:0004523 | 0.0066 | 187.2262 | 0.0067 | 1 | 7 | RNA-DNA hybrid ribonuclease activity |
| GO:0010521 | 0.0076 | 160.4694 | 0.0076 | 1 | 8 | telomerase inhibitor activity |
| GOMFID | Pvalue | OddsRatio | ExpCount | Count | Size | Term |
| GO:0004984 | 0.001 | 20.9428 | 0.2115 | 3 | 370 | olfactory receptor activity |
| GO:0099600 | 0.0033 | 9.5888 | 0.6949 | 4 | 1216 | transmembrane receptor activity |
| GO:0001588 | 0.0034 | 393.35 | 0.0034 | 1 | 6 | dopamine neurotransmitter receptor activity, coupled via Gs |
| GO:0038023 | 0.0038 | 9.1535 | 0.7252 | 4 | 1269 | signaling receptor activity |
| GO:0004930 | 0.0054 | 11.7503 | 0.39 | 3 | 767 | G-protein coupled receptor activity |
| GO:0035240 | 0.0057 | 218.4722 | 0.0057 | 1 | 10 | dopamine binding |
| GO:0060089 | 0.0071 | 7.5885 | 0.8601 | 4 | 1505 | molecular transducer activity |
| GO:0099528 | 0.008 | 151.2115 | 0.008 | 1 | 14 | G-protein coupled neurotransmitter receptor activity |
| GOMFID | Pvalue | OddsRatio | ExpCount | Count | Size | Term |
| GO:0001604 | 8e-04 | Inf | 8e-04 | 1 | 1 | urotensin II receptor activity |
| GO:0046811 | 0.0015 | 1430.4545 | 0.0015 | 1 | 2 | histone deacetylase inhibitor activity |
| GO:0051430 | 0.003 | 476.7576 | 0.003 | 1 | 4 | corticotropin-releasing hormone receptor 1 binding |
| GO:0051431 | 0.003 | 476.7576 | 0.003 | 1 | 4 | corticotropin-releasing hormone receptor 2 binding |
| GO:0046703 | 0.0068 | 178.7273 | 0.0069 | 1 | 9 | natural killer cell lectin-like receptor binding |
| GO:0043422 | 0.0076 | 158.8586 | 0.0076 | 1 | 10 | protein kinase B binding |
| GOMFID | Pvalue | OddsRatio | ExpCount | Count | Size | Term |
| GO:0003735 | 5e-04 | 24.2859 | 0.161 | 3 | 195 | structural constituent of ribosome |
| GO:0043422 | 0.0082 | 145.6111 | 0.0083 | 1 | 10 | protein kinase B binding |
| GOMFID | Pvalue | OddsRatio | ExpCount | Count | Size | Term |
| GO:0008532 | 0.0054 | 245.7344 | 0.0054 | 1 | 5 | N-acetyllactosaminide beta-1,3-N-acetylglucosaminyltransferase activity |
| GO:0030883 | 0.0054 | 245.7344 | 0.0054 | 1 | 5 | endogenous lipid antigen binding |
| GO:0030884 | 0.0054 | 245.7344 | 0.0054 | 1 | 5 | exogenous lipid antigen binding |
| GO:0034046 | 0.0054 | 245.7344 | 0.0054 | 1 | 5 | poly(G) binding |
| GO:0003696 | 0.0075 | 163.8021 | 0.0076 | 1 | 7 | satellite DNA binding |
| GO:0019237 | 0.0075 | 163.8021 | 0.0076 | 1 | 7 | centromeric DNA binding |
| GO:0071723 | 0.0075 | 163.8021 | 0.0076 | 1 | 7 | lipopeptide binding |
| GO:0030881 | 0.0097 | 122.8359 | 0.0097 | 1 | 9 | beta-2-microglobulin binding |
| GOMFID | Pvalue | OddsRatio | ExpCount | Count | Size | Term |
| GO:0004634 | 0 | 523.8 | 0.0081 | 2 | 4 | phosphopyruvate hydratase activity |
| GO:0042586 | 0.002 | Inf | 0.002 | 1 | 1 | peptide deformylase activity |
| GO:0004315 | 0.0041 | 506.9355 | 0.0041 | 1 | 2 | 3-oxoacyl-[acyl-carrier-protein] synthase activity |
| GO:0008521 | 0.0041 | 506.9355 | 0.0041 | 1 | 2 | acetyl-CoA transporter activity |
| GO:0019777 | 0.0041 | 506.9355 | 0.0041 | 1 | 2 | Atg12 transferase activity |
| GO:0019776 | 0.0061 | 253.4516 | 0.0061 | 1 | 3 | Atg8 ligase activity |
| GO:0016835 | 0.0079 | 16.3042 | 0.1341 | 2 | 66 | carbon-oxygen lyase activity |
| GO:0017151 | 0.0081 | 168.957 | 0.0081 | 1 | 4 | DEAD/H-box RNA helicase binding |
| GOMFID | Pvalue | OddsRatio | ExpCount | Count | Size | Term |
| GO:0008437 | 0.001 | Inf | 0.001 | 1 | 1 | thyrotropin-releasing hormone activity |
| GO:0050038 | 0.001 | Inf | 0.001 | 1 | 1 | L-xylulose reductase (NADP+) activity |
| GO:0045155 | 0.0019 | 1123.7143 | 0.0019 | 1 | 2 | electron transporter, transferring electrons from CoQH2-cytochrome c reductase complex and cytochrome c oxidase complex activity |
| GO:0016846 | 0.0076 | 160.4694 | 0.0076 | 1 | 8 | carbon-sulfur lyase activity |
| GOMFID | Pvalue | OddsRatio | ExpCount | Count | Size | Term |
| GO:1901612 | 0.0013 | 1311.6667 | 0.0013 | 1 | 4 | cardiolipin binding |
| GO:0030346 | 0.0029 | 491.7188 | 0.0029 | 1 | 9 | protein phosphatase 2B binding |
| GO:0008179 | 0.0032 | 437.0556 | 0.0032 | 1 | 10 | adenylate cyclase binding |
| GO:0050811 | 0.0048 | 280.875 | 0.0048 | 1 | 15 | GABA receptor binding |
| GO:0034237 | 0.0051 | 262.1333 | 0.0051 | 1 | 16 | protein kinase A regulatory subunit binding |
| GO:0045296 | 0.0089 | 145.5185 | 0.0089 | 1 | 28 | cadherin binding |
| GOMFID | Pvalue | OddsRatio | ExpCount | Count | Size | Term |
| GO:0004586 | 0.0011 | Inf | 0.0011 | 1 | 1 | ornithine decarboxylase activity |
| GO:0004603 | 0.0011 | Inf | 0.0011 | 1 | 1 | phenylethanolamine N-methyltransferase activity |
| GO:0008969 | 0.0034 | 462.5882 | 0.0034 | 1 | 3 | phosphohistidine phosphatase activity |
| GO:0035662 | 0.0034 | 462.5882 | 0.0034 | 1 | 3 | Toll-like receptor 4 binding |
| GO:0001601 | 0.0046 | 308.3725 | 0.0046 | 1 | 4 | peptide YY receptor activity |
| GO:0001602 | 0.0046 | 308.3725 | 0.0046 | 1 | 4 | pancreatic polypeptide receptor activity |
| GO:0050544 | 0.0057 | 231.2647 | 0.0057 | 1 | 5 | arachidonic acid binding |
| GO:1901567 | 0.0068 | 185 | 0.0069 | 1 | 6 | fatty acid derivative binding |
| GO:0042285 | 0.008 | 154.1569 | 0.008 | 1 | 7 | xylosyltransferase activity |
| GOMFID | Pvalue | OddsRatio | ExpCount | Count | Size | Term |
| GO:0038100 | 0.0017 | 1311.1667 | 0.0017 | 1 | 2 | nodal binding |
| GO:0035662 | 0.0025 | 655.5417 | 0.0025 | 1 | 3 | Toll-like receptor 4 binding |
| GO:0050544 | 0.0041 | 327.7292 | 0.0041 | 1 | 5 | arachidonic acid binding |
| GO:0031849 | 0.0049 | 262.1667 | 0.005 | 1 | 6 | olfactory receptor binding |
| GO:1901567 | 0.0049 | 262.1667 | 0.005 | 1 | 6 | fatty acid derivative binding |
| GO:0030881 | 0.0074 | 163.8229 | 0.0074 | 1 | 9 | beta-2-microglobulin binding |
| GO:0046703 | 0.0074 | 163.8229 | 0.0074 | 1 | 9 | natural killer cell lectin-like receptor binding |
| GO:0070513 | 0.0074 | 163.8229 | 0.0074 | 1 | 9 | death domain binding |
| GO:0050786 | 0.009 | 131.0417 | 0.0091 | 1 | 11 | RAGE receptor binding |
| GOMFID | Pvalue | OddsRatio | ExpCount | Count | Size | Term |
| GO:0015320 | 0.0011 | Inf | 0.0011 | 1 | 1 | phosphate ion carrier activity |
| GO:0070976 | 0.0011 | Inf | 0.0011 | 1 | 1 | TIR domain binding |
| GO:0019777 | 0.0023 | 925.2353 | 0.0023 | 1 | 2 | Atg12 transferase activity |
| GO:0030156 | 0.0023 | 925.2353 | 0.0023 | 1 | 2 | benzodiazepine receptor binding |
| GO:0072354 | 0.0023 | 925.2353 | 0.0023 | 1 | 2 | histone kinase activity (H3-T3 specific) |
| GO:0019776 | 0.0034 | 462.5882 | 0.0034 | 1 | 3 | Atg8 ligase activity |
| GO:0036042 | 0.0034 | 462.5882 | 0.0034 | 1 | 3 | long-chain fatty acyl-CoA binding |
| GO:0034597 | 0.0046 | 308.3725 | 0.0046 | 1 | 4 | phosphatidylinositol-4,5-bisphosphate 4-phosphatase activity |
| GO:0008494 | 0.008 | 154.1569 | 0.008 | 1 | 7 | translation activator activity |
| GOMFID | Pvalue | OddsRatio | ExpCount | Count | Size | Term |
| GO:0008176 | 0.0032 | 655.0833 | 0.0032 | 1 | 2 | tRNA (guanine-N7-)-methyltransferase activity |
| GO:0008168 | 0.004 | 10.5305 | 0.3239 | 3 | 204 | methyltransferase activity |
| GO:0034513 | 0.0048 | 327.5208 | 0.0048 | 1 | 3 | box H/ACA snoRNA binding |
| GO:0035939 | 0.0048 | 327.5208 | 0.0048 | 1 | 3 | microsatellite binding |
| GO:0051033 | 0.0048 | 327.5208 | 0.0048 | 1 | 3 | RNA transmembrane transporter activity |
| GO:0002039 | 0.0049 | 21.2758 | 0.1048 | 2 | 66 | p53 binding |
| GO:0016972 | 0.0063 | 218.3333 | 0.0064 | 1 | 4 | thiol oxidase activity |
| GO:0034597 | 0.0063 | 218.3333 | 0.0064 | 1 | 4 | phosphatidylinositol-4,5-bisphosphate 4-phosphatase activity |
| GO:0005375 | 0.0079 | 163.7396 | 0.0079 | 1 | 5 | copper ion transmembrane transporter activity |
| GO:0061665 | 0.0079 | 163.7396 | 0.0079 | 1 | 5 | SUMO ligase activity |
| GO:1990050 | 0.0079 | 163.7396 | 0.0079 | 1 | 5 | phosphatidic acid transporter activity |
| GO:0097157 | 0.0095 | 130.9833 | 0.0095 | 1 | 6 | pre-mRNA intronic binding |
| GOMFID | Pvalue | OddsRatio | ExpCount | Count | Size | Term |
| GO:0004842 | 9e-04 | 11.1003 | 0.45 | 4 | 373 | ubiquitin-protein transferase activity |
| GO:0034513 | 0.0036 | 436.8611 | 0.0036 | 1 | 3 | box H/ACA snoRNA binding |
| GOMFID | Pvalue | OddsRatio | ExpCount | Count | Size | Term |
| GO:1990829 | 9e-04 | Inf | 9e-04 | 1 | 1 | C-rich single-stranded DNA binding |
| GO:1990715 | 0.0018 | 1210.2308 | 0.0018 | 1 | 2 | mRNA CDS binding |
| GO:0030628 | 0.0027 | 605.0769 | 0.0027 | 1 | 3 | pre-mRNA 3'-splice site binding |
| GO:0016972 | 0.0036 | 403.359 | 0.0036 | 1 | 4 | thiol oxidase activity |
| GO:0042289 | 0.0044 | 302.5 | 0.0044 | 1 | 5 | MHC class II protein binding |
| GOMFID | Pvalue | OddsRatio | ExpCount | Count | Size | Term |
| GO:0008897 | 0.0018 | Inf | 0.0018 | 1 | 1 | holo-[acyl-carrier-protein] synthase activity |
| GO:0030549 | 0.0018 | Inf | 0.0018 | 1 | 1 | acetylcholine receptor activator activity |
| GO:0031707 | 0.0018 | Inf | 0.0018 | 1 | 1 | endothelin A receptor binding |
| GO:0000248 | 0.0036 | 582.1852 | 0.0036 | 1 | 2 | C-5 sterol desaturase activity |
| GO:0072354 | 0.0036 | 582.1852 | 0.0036 | 1 | 2 | histone kinase activity (H3-T3 specific) |
| GO:0031708 | 0.0053 | 291.0741 | 0.0053 | 1 | 3 | endothelin B receptor binding |
| GO:0031800 | 0.0053 | 291.0741 | 0.0053 | 1 | 3 | type 3 metabotropic glutamate receptor binding |
| GO:0031997 | 0.0053 | 291.0741 | 0.0053 | 1 | 3 | N-terminal myristoylation domain binding |
| GO:0099602 | 0.0053 | 291.0741 | 0.0053 | 1 | 3 | neurotransmitter receptor regulator activity |
| GO:0005176 | 0.0071 | 194.037 | 0.0071 | 1 | 4 | ErbB-2 class receptor binding |
| GO:0016972 | 0.0071 | 194.037 | 0.0071 | 1 | 4 | thiol oxidase activity |
| GO:0043125 | 0.0071 | 194.037 | 0.0071 | 1 | 4 | ErbB-3 class receptor binding |
| GO:0005375 | 0.0089 | 145.5185 | 0.0089 | 1 | 5 | copper ion transmembrane transporter activity |
| GO:0032407 | 0.0089 | 145.5185 | 0.0089 | 1 | 5 | MutSalpha complex binding |
| GOMFID | Pvalue | OddsRatio | ExpCount | Count | Size | Term |
| GO:0001872 | 0.0013 | Inf | 0.0013 | 1 | 1 | (1->3)-beta-D-glucan binding |
| GO:0004941 | 0.0013 | Inf | 0.0013 | 1 | 1 | beta2-adrenergic receptor activity |
| GO:0031713 | 0.0013 | Inf | 0.0013 | 1 | 1 | B2 bradykinin receptor binding |
| GO:0015459 | 0.0015 | 39.6061 | 0.0584 | 2 | 46 | potassium channel regulator activity |
| GO:0051380 | 0.0051 | 275.8772 | 0.0051 | 1 | 4 | norepinephrine binding |
| GO:0016651 | 0.0055 | 20.2093 | 0.1118 | 2 | 88 | oxidoreductase activity, acting on NAD(P)H |
| GO:0051379 | 0.0076 | 165.5053 | 0.0076 | 1 | 6 | epinephrine binding |
| GO:0001849 | 0.0089 | 137.9123 | 0.0089 | 1 | 7 | complement component C1q binding |
| GOMFID | Pvalue | OddsRatio | ExpCount | Count | Size | Term |
| GO:0097159 | 9e-04 | 3.9038 | 8.8249 | 17 | 5559 | organic cyclic compound binding |
| GO:0004733 | 0.0016 | Inf | 0.0016 | 1 | 1 | pyridoxamine-phosphate oxidase activity |
| GO:0015052 | 0.0016 | Inf | 0.0016 | 1 | 1 | beta3-adrenergic receptor activity |
| GO:0045503 | 0.0016 | Inf | 0.0016 | 1 | 1 | dynein light chain binding |
| GO:0003723 | 0.0016 | 4.5019 | 2.3749 | 8 | 1496 | RNA binding |
| GO:1901363 | 0.0027 | 3.3379 | 8.6995 | 16 | 5480 | heterocyclic compound binding |
| GO:0000248 | 0.0032 | 655.0833 | 0.0032 | 1 | 2 | C-5 sterol desaturase activity |
| GO:0004356 | 0.0032 | 655.0833 | 0.0032 | 1 | 2 | glutamate-ammonia ligase activity |
| GO:0009019 | 0.0032 | 655.0833 | 0.0032 | 1 | 2 | tRNA (guanine-N1-)-methyltransferase activity |
| GO:0016880 | 0.0032 | 655.0833 | 0.0032 | 1 | 2 | acid-ammonia (or amide) ligase activity |
| GO:0031699 | 0.0032 | 655.0833 | 0.0032 | 1 | 2 | beta-3 adrenergic receptor binding |
| GO:0061711 | 0.0032 | 655.0833 | 0.0032 | 1 | 2 | N(6)-L-threonylcarbamoyladenine synthase |
| GO:0004351 | 0.0048 | 327.5208 | 0.0048 | 1 | 3 | glutamate decarboxylase activity |
| GO:0004886 | 0.0048 | 327.5208 | 0.0048 | 1 | 3 | 9-cis retinoic acid receptor activity |
| GO:0016429 | 0.0048 | 327.5208 | 0.0048 | 1 | 3 | tRNA (adenine-N1-)-methyltransferase activity |
| GO:0051033 | 0.0048 | 327.5208 | 0.0048 | 1 | 3 | RNA transmembrane transporter activity |
| GO:0051380 | 0.0063 | 218.3333 | 0.0064 | 1 | 4 | norepinephrine binding |
| GO:0030375 | 0.0079 | 163.7396 | 0.0079 | 1 | 5 | thyroid hormone receptor coactivator activity |
| GO:0051379 | 0.0095 | 130.9833 | 0.0095 | 1 | 6 | epinephrine binding |
| GOMFID | Pvalue | OddsRatio | ExpCount | Count | Size | Term |
| GO:0008311 | 5e-04 | Inf | 5e-04 | 1 | 1 | double-stranded DNA 3'-5' exodeoxyribonuclease activity |
| GO:0016890 | 0.001 | 2248.4286 | 0.001 | 1 | 2 | site-specific endodeoxyribonuclease activity, specific for altered base |
| GO:0004528 | 0.0025 | 562 | 0.0025 | 1 | 5 | phosphodiesterase I activity |
| GO:0004844 | 0.0025 | 562 | 0.0025 | 1 | 5 | uracil DNA N-glycosylase activity |
| GO:0003691 | 0.0036 | 374.619 | 0.0036 | 1 | 7 | double-stranded telomeric DNA binding |
| GO:0004523 | 0.0036 | 374.619 | 0.0036 | 1 | 7 | RNA-DNA hybrid ribonuclease activity |
| GO:0003906 | 0.0061 | 204.2727 | 0.0061 | 1 | 12 | DNA-(apurinic or apyrimidinic site) lyase activity |
| GO:0019104 | 0.0071 | 172.8242 | 0.0071 | 1 | 14 | DNA N-glycosylase activity |
| GO:0016895 | 0.0076 | 160.4694 | 0.0076 | 1 | 15 | exodeoxyribonuclease activity, producing 5'-phosphomonoesters |
| GOMFID | Pvalue | OddsRatio | ExpCount | Count | Size | Term |
| GO:1990841 | 0.0034 | 462.5882 | 0.0034 | 1 | 3 | promoter-specific chromatin binding |
| GO:0000976 | 0.005 | 6.8594 | 0.7235 | 4 | 633 | transcription regulatory region sequence-specific DNA binding |
| GO:0000774 | 0.0057 | 231.2647 | 0.0057 | 1 | 5 | adenyl-nucleotide exchange factor activity |
| GO:0003690 | 0.0084 | 5.8878 | 0.8367 | 4 | 732 | double-stranded DNA binding |
| GO:0004985 | 0.0091 | 132.1261 | 0.0091 | 1 | 8 | opioid receptor activity |
| GOMFID | Pvalue | OddsRatio | ExpCount | Count | Size | Term |
| GO:0045503 | 0.001 | Inf | 0.001 | 1 | 1 | dynein light chain binding |
| GO:0004356 | 0.002 | 1048.7333 | 0.002 | 1 | 2 | glutamate-ammonia ligase activity |
| GO:0016880 | 0.002 | 1048.7333 | 0.002 | 1 | 2 | acid-ammonia (or amide) ligase activity |
| GO:0004351 | 0.003 | 524.3333 | 0.003 | 1 | 3 | glutamate decarboxylase activity |
| GO:0016595 | 0.0091 | 131.0333 | 0.0091 | 1 | 9 | glutamate binding |
| GOMFID | Pvalue | OddsRatio | ExpCount | Count | Size | Term |
| GO:0004522 | 0.0018 | 874.3333 | 0.0018 | 1 | 4 | ribonuclease A activity |
| GO:0015271 | 0.004 | 327.7708 | 0.004 | 1 | 9 | outward rectifier potassium channel activity |
| GO:0031681 | 0.004 | 327.7708 | 0.004 | 1 | 9 | G-protein beta-subunit binding |
| GO:0016894 | 0.0084 | 145.5833 | 0.0084 | 1 | 19 | endonuclease activity, active with either ribo- or deoxyribonucleic acids and producing 3'-phosphomonoesters |
| GOMFID | Pvalue | OddsRatio | ExpCount | Count | Size | Term |
| GO:0038100 | 0.0014 | 1573.6 | 0.0014 | 1 | 2 | nodal binding |
| GO:0004984 | 0.0018 | 15.705 | 0.2584 | 3 | 370 | olfactory receptor activity |
| GO:0099600 | 0.0075 | 6.8482 | 0.8494 | 4 | 1216 | transmembrane receptor activity |
| GO:0038023 | 0.0087 | 6.5373 | 0.8864 | 4 | 1269 | signaling receptor activity |
| GOMFID | Pvalue | OddsRatio | ExpCount | Count | Size | Term |
| GO:0001664 | 0 | 31.4837 | 0.1905 | 4 | 250 | G-protein coupled receptor binding |
| GO:0005184 | 2e-04 | 130.9333 | 0.0198 | 2 | 26 | neuropeptide hormone activity |
| GO:0031696 | 0.0015 | 1430.4545 | 0.0015 | 1 | 2 | alpha-2C adrenergic receptor binding |
| GO:0031765 | 0.0015 | 1430.4545 | 0.0015 | 1 | 2 | type 2 galanin receptor binding |
| GO:0031766 | 0.0015 | 1430.4545 | 0.0015 | 1 | 2 | type 3 galanin receptor binding |
| GO:0004938 | 0.0023 | 715.1818 | 0.0023 | 1 | 3 | alpha2-adrenergic receptor activity |
| GO:0031692 | 0.0023 | 715.1818 | 0.0023 | 1 | 3 | alpha-1B adrenergic receptor binding |
| GO:0032795 | 0.0023 | 715.1818 | 0.0023 | 1 | 3 | heterotrimeric G-protein binding |
| GO:0016520 | 0.003 | 476.7576 | 0.003 | 1 | 4 | growth hormone-releasing hormone receptor activity |
| GO:0051380 | 0.003 | 476.7576 | 0.003 | 1 | 4 | norepinephrine binding |
| GO:0051379 | 0.0046 | 286.0182 | 0.0046 | 1 | 6 | epinephrine binding |
| GO:0004935 | 0.0068 | 178.7273 | 0.0069 | 1 | 9 | adrenergic receptor activity |
| GO:0009982 | 0.0091 | 129.9587 | 0.0091 | 1 | 12 | pseudouridine synthase activity |
| GO:0004888 | 0.0093 | 6.2421 | 0.8923 | 4 | 1171 | transmembrane signaling receptor activity |
| GO:0031996 | 0.0099 | 119.1212 | 0.0099 | 1 | 13 | thioesterase binding |
| GOMFID | Pvalue | OddsRatio | ExpCount | Count | Size | Term |
| GO:0010698 | 0.0028 | 748.8095 | 0.0028 | 1 | 2 | acetyltransferase activator activity |
| GO:0005125 | 0.0032 | 11.5546 | 0.3004 | 3 | 215 | cytokine activity |
| GO:0005126 | 0.0058 | 9.2834 | 0.3716 | 3 | 266 | cytokine receptor binding |
| GO:0046974 | 0.007 | 187.1667 | 0.007 | 1 | 5 | histone methyltransferase activity (H3-K9 specific) |
| NA. |
| n/a |
| GOMFID | Pvalue | OddsRatio | ExpCount | Count | Size | Term |
| GO:0005125 | 0.0018 | 48.6072 | 0.0683 | 2 | 215 | cytokine activity |
| GO:0005132 | 0.0054 | 245.7344 | 0.0054 | 1 | 17 | type I interferon receptor binding |
| GO:0030515 | 0.0079 | 163.7396 | 0.0079 | 1 | 25 | snoRNA binding |
| GO:0005164 | 0.0089 | 145.5185 | 0.0089 | 1 | 28 | tumor necrosis factor receptor binding |
| GOMFID | Pvalue | OddsRatio | ExpCount | Count | Size | Term |
| GO:0003954 | 0.002 | 34.4725 | 0.0658 | 2 | 37 | NADH dehydrogenase activity |
| GO:0008137 | 0.002 | 34.4725 | 0.0658 | 2 | 37 | NADH dehydrogenase (ubiquinone) activity |
| GO:0016655 | 0.0037 | 24.6013 | 0.0907 | 2 | 51 | oxidoreductase activity, acting on NAD(P)H, quinone or similar compound as acceptor |
| GO:0008427 | 0.0053 | 291.0741 | 0.0053 | 1 | 3 | calcium-dependent protein kinase inhibitor activity |
| GO:0046979 | 0.0053 | 291.0741 | 0.0053 | 1 | 3 | TAP2 binding |
| GO:0046978 | 0.0071 | 194.037 | 0.0071 | 1 | 4 | TAP1 binding |
| GO:0070087 | 0.0089 | 145.5185 | 0.0089 | 1 | 5 | chromo shadow domain binding |
| GO:0031072 | 0.0097 | 14.6698 | 0.1494 | 2 | 84 | heat shock protein binding |
| GOMFID | Pvalue | OddsRatio | ExpCount | Count | Size | Term |
| GO:0018169 | 0.0013 | Inf | 0.0013 | 1 | 1 | ribosomal S6-glutamic acid ligase activity |
| GO:0031835 | 0.0013 | Inf | 0.0013 | 1 | 1 | substance P receptor binding |
| GO:0097016 | 0.0038 | 413.8421 | 0.0038 | 1 | 3 | L27 domain binding |
| GO:0019788 | 0.0051 | 275.8772 | 0.0051 | 1 | 4 | NEDD8 transferase activity |
| GOMFID | Pvalue | OddsRatio | ExpCount | Count | Size | Term |
| GO:0000210 | 0.0018 | Inf | 0.0018 | 1 | 1 | NAD+ diphosphatase activity |
| GO:0044549 | 0.0018 | Inf | 0.0018 | 1 | 1 | GTP cyclohydrolase binding |
| GO:0003735 | 0.0049 | 9.705 | 0.3467 | 3 | 195 | structural constituent of ribosome |
| GO:0016167 | 0.0053 | 291.0741 | 0.0053 | 1 | 3 | glial cell-derived neurotrophic factor receptor activity |
| GO:0035529 | 0.0053 | 291.0741 | 0.0053 | 1 | 3 | NADH pyrophosphatase activity |
| GO:0046979 | 0.0053 | 291.0741 | 0.0053 | 1 | 3 | TAP2 binding |
| GO:0004427 | 0.0071 | 194.037 | 0.0071 | 1 | 4 | inorganic diphosphatase activity |
| GO:0046978 | 0.0071 | 194.037 | 0.0071 | 1 | 4 | TAP1 binding |
| GOMFID | Pvalue | OddsRatio | ExpCount | Count | Size | Term |
| GO:0050833 | 0 | 1083.8621 | 0.0059 | 2 | 3 | pyruvate transmembrane transporter activity |
| GO:0090450 | 0.002 | Inf | 0.002 | 1 | 1 | inosine-diphosphatase activity |
| GO:0097383 | 0.002 | Inf | 0.002 | 1 | 1 | dIDP diphosphatase activity |
| GO:1901640 | 0.002 | Inf | 0.002 | 1 | 1 | XTP binding |
| GO:1901641 | 0.002 | Inf | 0.002 | 1 | 1 | ITP binding |
| GO:0003729 | 0.0029 | 11.6688 | 0.2874 | 3 | 146 | mRNA binding |
| GO:0035870 | 0.0039 | 523.8667 | 0.0039 | 1 | 2 | dITP diphosphatase activity |
| GO:0050072 | 0.0059 | 261.9167 | 0.0059 | 1 | 3 | m7G(5')pppN diphosphatase activity |
| GO:0050897 | 0.0059 | 261.9167 | 0.0059 | 1 | 3 | cobalt ion binding |
| GO:0003735 | 0.0065 | 8.6635 | 0.3839 | 3 | 195 | structural constituent of ribosome |
| GO:0098519 | 0.0079 | 174.6 | 0.0079 | 1 | 4 | nucleotide phosphatase activity, acting on free nucleotides |
| GOMFID | Pvalue | OddsRatio | ExpCount | Count | Size | Term |
| GO:0008263 | 1e-04 | Inf | 1e-04 | 1 | 2 | pyrimidine-specific mismatch base pair DNA N-glycosylase activity |
| GO:0003696 | 4e-04 | Inf | 4e-04 | 1 | 7 | satellite DNA binding |
| GO:0019104 | 9e-04 | Inf | 9e-04 | 1 | 14 | DNA N-glycosylase activity |
| GO:0004520 | 0.003 | Inf | 0.003 | 1 | 47 | endodeoxyribonuclease activity |
| GO:0016798 | 0.0074 | Inf | 0.0074 | 1 | 117 | hydrolase activity, acting on glycosyl bonds |
| GOMFID | Pvalue | OddsRatio | ExpCount | Count | Size | Term |
| GO:0004168 | 3e-04 | Inf | 3e-04 | 1 | 1 | dolichol kinase activity |
| GO:0030515 | 0.0063 | 218.3333 | 0.0064 | 1 | 25 | snoRNA binding |
| GO:0005164 | 0.0071 | 194.037 | 0.0071 | 1 | 28 | tumor necrosis factor receptor binding |
| GOMFID | Pvalue | OddsRatio | ExpCount | Count | Size | Term |
| GO:0044549 | 0.001 | Inf | 0.001 | 1 | 1 | GTP cyclohydrolase binding |
| GO:0097655 | 0.001 | Inf | 0.001 | 1 | 1 | serpin family protein binding |
| GO:0072354 | 0.002 | 1048.7333 | 0.002 | 1 | 2 | histone kinase activity (H3-T3 specific) |
| GO:0005105 | 0.0051 | 262.1333 | 0.0051 | 1 | 5 | type 1 fibroblast growth factor receptor binding |
| GO:0005111 | 0.0051 | 262.1333 | 0.0051 | 1 | 5 | type 2 fibroblast growth factor receptor binding |
| GO:1990050 | 0.0051 | 262.1333 | 0.0051 | 1 | 5 | phosphatidic acid transporter activity |
| GO:0003677 | 0.0052 | 4.4828 | 2.3703 | 7 | 2333 | DNA binding |
| GO:0097157 | 0.0061 | 209.6933 | 0.0061 | 1 | 6 | pre-mRNA intronic binding |
| GO:1990247 | 0.0071 | 174.7333 | 0.0071 | 1 | 7 | N6-methyladenosine-containing RNA binding |
| GO:0043024 | 0.0091 | 131.0333 | 0.0091 | 1 | 9 | ribosomal small subunit binding |
| GO:0043047 | 0.0091 | 131.0333 | 0.0091 | 1 | 9 | single-stranded telomeric DNA binding |
| GOMFID | Pvalue | OddsRatio | ExpCount | Count | Size | Term |
| GO:0008969 | 0.0019 | 874.2222 | 0.0019 | 1 | 3 | phosphohistidine phosphatase activity |
| GO:0071933 | 0.0044 | 291.3333 | 0.0044 | 1 | 7 | Arp2/3 complex binding |
| GO:0098772 | 0.0049 | 8.0767 | 0.7645 | 4 | 1204 | molecular function regulator |
| GO:0019855 | 0.0057 | 218.4722 | 0.0057 | 1 | 9 | calcium channel inhibitor activity |
| GO:0031681 | 0.0057 | 218.4722 | 0.0057 | 1 | 9 | G-protein beta-subunit binding |
| GOMFID | Pvalue | OddsRatio | ExpCount | Count | Size | Term |
| GO:0034513 | 0.0011 | 1574 | 0.0011 | 1 | 3 | box H/ACA snoRNA binding |
| GO:0070034 | 0.0049 | 262.1667 | 0.005 | 1 | 13 | telomerase RNA binding |
| GOMFID | Pvalue | OddsRatio | ExpCount | Count | Size | Term |
| GO:0008531 | 0.0011 | Inf | 0.0011 | 1 | 1 | riboflavin kinase activity |
| GO:0097020 | 0.0011 | Inf | 0.0011 | 1 | 1 | COPII adaptor activity |
| GO:0046811 | 0.0023 | 925.2353 | 0.0023 | 1 | 2 | histone deacetylase inhibitor activity |
| GO:0016149 | 0.0034 | 462.5882 | 0.0034 | 1 | 3 | translation release factor activity, codon specific |
| GO:0051430 | 0.0046 | 308.3725 | 0.0046 | 1 | 4 | corticotropin-releasing hormone receptor 1 binding |
| GO:0051431 | 0.0046 | 308.3725 | 0.0046 | 1 | 4 | corticotropin-releasing hormone receptor 2 binding |
| GO:0008079 | 0.0068 | 185 | 0.0069 | 1 | 6 | translation termination factor activity |
| NA. |
| n/a |
| NA. |
| n/a |
| NA. |
| n/a |
| NA. |
| n/a |
| NA. |
| n/a |
| NA. |
| n/a |
| NA. |
| n/a |
| NA. |
| n/a |
| NA. |
| n/a |
| NA. |
| n/a |
| NA. |
| n/a |
| NA. |
| n/a |
| NA. |
| n/a |
| NA. |
| n/a |
| NA. |
| n/a |
| NA. |
| n/a |
| NA. |
| n/a |
| NA. |
| n/a |
| NA. |
| n/a |
| NA. |
| n/a |
| NA. |
| n/a |
| NA. |
| n/a |
| NA. |
| n/a |
| NA. |
| n/a |
| NA. |
| n/a |
| NA. |
| n/a |
| NA. |
| n/a |
| NA. |
| n/a |
| NA. |
| n/a |
| NA. |
| n/a |
| NA. |
| n/a |
| NA. |
| n/a |
| NA. |
| n/a |
| NA. |
| n/a |
| NA. |
| n/a |
| NA. |
| n/a |
| NA. |
| n/a |
| NA. |
| n/a |
| NA. |
| n/a |
| NA. |
| n/a |
| NA. |
| n/a |
| NA. |
| n/a |
| NA. |
| n/a |
| NA. |
| n/a |
| NA. |
| n/a |
| NA. |
| n/a |
| NA. |
| n/a |
| NA. |
| n/a |
| NA. |
| n/a |
| NA. |
| n/a |
| NA. |
| n/a |
| NA. |
| n/a |
| NA. |
| n/a |
| NA. |
| n/a |
| NA. |
| n/a |
| NA. |
| n/a |
| NA. |
| n/a |
| NA. |
| n/a |
| NA. |
| n/a |
| NA. |
| n/a |
| NA. |
| n/a |
| NA. |
| n/a |
| NA. |
| n/a |
| NA. |
| n/a |
| NA. |
| n/a |
| NA. |
| n/a |
| NA. |
| n/a |
| NA. |
| n/a |
| NA. |
| n/a |
| NA. |
| n/a |
| NA. |
| n/a |
| NA. |
| n/a |
| NA. |
| n/a |
| NA. |
| n/a |
| NA. |
| n/a |
| NA. |
| n/a |
| NA. |
| n/a |
| NA. |
| n/a |
| NA. |
| n/a |
| NA. |
| n/a |
| NA. |
| n/a |
| NA. |
| n/a |
| NA. |
| n/a |
| NA. |
| n/a |
| NA. |
| n/a |
| NA. |
| n/a |
| NA. |
| n/a |
| NA. |
| n/a |
| NA. |
| n/a |
| NA. |
| n/a |
| NA. |
| n/a |
| NA. |
| n/a |
| NA. |
| n/a |
| NA. |
| n/a |
| NA. |
| n/a |
| NA. |
| n/a |
| NA. |
| n/a |
| NA. |
| n/a |
| NA. |
| n/a |
| NA. |
| n/a |
| NA. |
| n/a |
| NA. |
| n/a |
| NA. |
| n/a |
| NA. |
| n/a |
| NA. |
| n/a |
| NA. |
| n/a |
| NA. |
| n/a |
| NA. |
| n/a |
| NA. |
| n/a |
| NA. |
| n/a |
| NA. |
| n/a |
| NA. |
| n/a |
| NA. |
| n/a |
| NA. |
| n/a |
| NA. |
| n/a |
| NA. |
| n/a |
| NA. |
| n/a |
| NA. |
| n/a |
| NA. |
| n/a |
| NA. |
| n/a |
| NA. |
| n/a |
| NA. |
| n/a |
| NA. |
| n/a |
| NA. |
| n/a |
| NA. |
| n/a |
| NA. |
| n/a |
| NA. |
| n/a |
| NA. |
| n/a |
| NA. |
| n/a |
| NA. |
| n/a |
| NA. |
| n/a |
| NA. |
| n/a |
| NA. |
| n/a |
| NA. |
| n/a |
| NA. |
| n/a |
| NA. |
| n/a |
| NA. |
| n/a |
| NA. |
| n/a |
| NA. |
| n/a |
| NA. |
| n/a |
| NA. |
| n/a |
| NA. |
| n/a |
| NA. |
| n/a |
| NA. |
| n/a |
| NA. |
| n/a |
| NA. |
| n/a |
| NA. |
| n/a |
| NA. |
| n/a |
| NA. |
| n/a |
| NA. |
| n/a |
| NA. |
| n/a |
| NA. |
| n/a |
| NA. |
| n/a |
| NA. |
| n/a |
| NA. |
| n/a |
| NA. |
| n/a |
| NA. |
| n/a |
| NA. |
| n/a |
| NA. |
| n/a |
| NA. |
| n/a |
| NA. |
| n/a |
| NA. |
| n/a |
| NA. |
| n/a |
| NA. |
| n/a |
| NA. |
| n/a |
| NA. |
| n/a |
| NA. |
| n/a |
| NA. |
| n/a |
| NA. |
| n/a |
| NA. |
| n/a |
| NA. |
| n/a |
| NA. |
| n/a |
| NA. |
| n/a |
| NA. |
| n/a |
| NA. |
| n/a |
| NA. |
| n/a |
| NA. |
| n/a |
| NA. |
| n/a |
| NA. |
| n/a |
| NA. |
| n/a |
| NA. |
| n/a |
| NA. |
| n/a |
| NA. |
| n/a |
| NA. |
| n/a |
| NA. |
| n/a |
| NA. |
| n/a |
| NA. |
| n/a |
| NA. |
| n/a |
| NA. |
| n/a |
| NA. |
| n/a |
| NA. |
| n/a |
| NA. |
| n/a |
| NA. |
| n/a |
| NA. |
| n/a |
| NA. |
| n/a |
| NA. |
| n/a |
| NA. |
| n/a |
| NA. |
| n/a |
| NA. |
| n/a |
| NA. |
| n/a |
| NA. |
| n/a |
| NA. |
| n/a |
| NA. |
| n/a |
| NA. |
| n/a |
| NA. |
| n/a |
| NA. |
| n/a |
| NA. |
| n/a |
| NA. |
| n/a |
| NA. |
| n/a |
| NA. |
| n/a |
| NA. |
| n/a |
| NA. |
| n/a |
| NA. |
| n/a |
| NA. |
| n/a |
| NA. |
| n/a |
| NA. |
| n/a |
| NA. |
| n/a |
| NA. |
| n/a |
| NA. |
| n/a |
| NA. |
| n/a |
| NA. |
| n/a |
| NA. |
| n/a |
| NA. |
| n/a |
| NA. |
| n/a |
| NA. |
| n/a |
| NA. |
| n/a |
| NA. |
| n/a |
| NA. |
| n/a |
| NA. |
| n/a |
| NA. |
| n/a |
| NA. |
| n/a |
| NA. |
| n/a |
| NA. |
| n/a |
| NA. |
| n/a |
| NA. |
| n/a |
| NA. |
| n/a |
| NA. |
| n/a |
| NA. |
| n/a |
| NA. |
| n/a |
| NA. |
| n/a |
| GOMFID | Pvalue | OddsRatio | ExpCount | Count | Size | Term |
| GO:0071539 | 0.0021 | 33.4374 | 0.069 | 2 | 19 | protein localization to centrosome |
| GO:0032402 | 0.0024 | 31.5778 | 0.0726 | 2 | 20 | melanosome transport |
| GO:0051905 | 0.0026 | 29.9139 | 0.0762 | 2 | 21 | establishment of pigment granule localization |
| GO:0045004 | 0.0036 | Inf | 0.0036 | 1 | 1 | DNA replication proofreading |
| GO:1902296 | 0.0036 | Inf | 0.0036 | 1 | 1 | DNA strand elongation involved in cell cycle DNA replication |
| GO:1902983 | 0.0036 | Inf | 0.0036 | 1 | 1 | DNA strand elongation involved in mitotic DNA replication |
| GO:0072595 | 0.0049 | 21.0397 | 0.1052 | 2 | 29 | maintenance of protein localization in organelle |
| GO:0044380 | 0.0053 | 20.287 | 0.1089 | 2 | 30 | protein localization to cytoskeleton |
| GO:0051591 | 0.0057 | 8.9072 | 0.3629 | 3 | 100 | response to cAMP |
| GO:0006668 | 0.0072 | 279.4286 | 0.0073 | 1 | 2 | sphinganine-1-phosphate metabolic process |
| GO:0071344 | 0.0072 | 279.4286 | 0.0073 | 1 | 2 | diphosphate metabolic process |
| GO:1903070 | 0.0072 | 279.4286 | 0.0073 | 1 | 2 | negative regulation of ER-associated ubiquitin-dependent protein catabolic process |
| GO:1903595 | 0.0072 | 279.4286 | 0.0073 | 1 | 2 | positive regulation of histamine secretion by mast cell |
| GO:0051648 | 0.0087 | 5.3175 | 0.8093 | 4 | 223 | vesicle localization |
| GO:0033260 | 0.0088 | 15.3435 | 0.1415 | 2 | 39 | nuclear DNA replication |
| GO:0043303 | 0.0092 | 14.9388 | 0.1452 | 2 | 40 | mast cell degranulation |
| GOMFID | Pvalue | OddsRatio | ExpCount | Count | Size | Term |
| GO:0016254 | 0.0014 | 42.9533 | 0.0554 | 2 | 15 | preassembly of GPI anchor in ER membrane |
| GO:0070199 | 0.003 | 27.9071 | 0.0812 | 2 | 22 | establishment of protein localization to chromosome |
| GO:0032203 | 0.0037 | Inf | 0.0037 | 1 | 1 | telomere formation via telomerase |
| GO:0006501 | 0.0055 | 19.9235 | 0.1108 | 2 | 30 | C-terminal protein lipidation |
| GO:0006505 | 0.007 | 17.4286 | 0.1256 | 2 | 34 | GPI anchor metabolic process |
| GO:0006437 | 0.0074 | 274.5088 | 0.0074 | 1 | 2 | tyrosyl-tRNA aminoacylation |
| GO:0019918 | 0.0074 | 274.5088 | 0.0074 | 1 | 2 | peptidyl-arginine methylation, to symmetrical-dimethyl arginine |
| GO:0038060 | 0.0074 | 274.5088 | 0.0074 | 1 | 2 | nitric oxide-cGMP-mediated signaling pathway |
| GO:0051066 | 0.0074 | 274.5088 | 0.0074 | 1 | 2 | dihydrobiopterin metabolic process |
| GO:0070564 | 0.0074 | 274.5088 | 0.0074 | 1 | 2 | positive regulation of vitamin D receptor signaling pathway |
| GOMFID | Pvalue | OddsRatio | ExpCount | Count | Size | Term |
| GO:0060545 | 0 | Inf | 0.0073 | 2 | 2 | positive regulation of necroptotic process |
| GO:1990000 | 2e-04 | 142.2273 | 0.0218 | 2 | 6 | amyloid fibril formation |
| GO:0019637 | 9e-04 | 3.5218 | 3.651 | 11 | 1006 | organophosphate metabolic process |
| GO:0046777 | 0.0011 | 7.0015 | 0.7875 | 5 | 217 | protein autophosphorylation |
| GO:2000311 | 0.0017 | 37.9006 | 0.0617 | 2 | 17 | regulation of alpha-amino-3-hydroxy-5-methyl-4-isoxazole propionate selective glutamate receptor activity |
| GO:0007166 | 0.0022 | 2.4327 | 9.7516 | 19 | 2687 | cell surface receptor signaling pathway |
| GO:0002089 | 0.0024 | 31.5778 | 0.0726 | 2 | 20 | lens morphogenesis in camera-type eye |
| GO:0060384 | 0.0031 | 27.0615 | 0.0835 | 2 | 23 | innervation |
| GO:0032481 | 0.0033 | 10.9494 | 0.2976 | 3 | 82 | positive regulation of type I interferon production |
| GO:0030901 | 0.0036 | 10.5467 | 0.3085 | 3 | 85 | midbrain development |
| GO:0007014 | 0.0036 | Inf | 0.0036 | 1 | 1 | actin ubiquitination |
| GO:0008052 | 0.0036 | Inf | 0.0036 | 1 | 1 | sensory organ boundary specification |
| GO:0061144 | 0.0036 | Inf | 0.0036 | 1 | 1 | alveolar secondary septum development |
| GO:0070926 | 0.0036 | Inf | 0.0036 | 1 | 1 | regulation of ATP:ADP antiporter activity |
| GO:0090126 | 0.0036 | Inf | 0.0036 | 1 | 1 | protein complex assembly involved in synapse maturation |
| GO:0097117 | 0.0036 | Inf | 0.0036 | 1 | 1 | guanylate kinase-associated protein clustering |
| GO:0097398 | 0.0036 | Inf | 0.0036 | 1 | 1 | cellular response to interleukin-17 |
| GO:1902178 | 0.0036 | Inf | 0.0036 | 1 | 1 | fibroblast growth factor receptor apoptotic signaling pathway |
| GO:1903883 | 0.0036 | Inf | 0.0036 | 1 | 1 | positive regulation of interleukin-17-mediated signaling pathway |
| GO:1903886 | 0.0036 | Inf | 0.0036 | 1 | 1 | positive regulation of chemokine (C-C motif) ligand 20 production |
| GO:2001108 | 0.0036 | Inf | 0.0036 | 1 | 1 | positive regulation of Rho guanyl-nucleotide exchange factor activity |
| GO:0048710 | 0.004 | 23.6742 | 0.0944 | 2 | 26 | regulation of astrocyte differentiation |
| GO:0007616 | 0.0046 | 21.8503 | 0.1016 | 2 | 28 | long-term memory |
| GO:0034587 | 0.0049 | 21.0397 | 0.1052 | 2 | 29 | piRNA metabolic process |
| GO:0070306 | 0.0049 | 21.0397 | 0.1052 | 2 | 29 | lens fiber cell differentiation |
| GO:0071887 | 0.0056 | 9.0006 | 0.3593 | 3 | 99 | leukocyte apoptotic process |
| GO:0010939 | 0.006 | 18.9321 | 0.1161 | 2 | 32 | regulation of necrotic cell death |
| GO:0007308 | 0.0072 | 279.4286 | 0.0073 | 1 | 2 | oocyte construction |
| GO:0007314 | 0.0072 | 279.4286 | 0.0073 | 1 | 2 | oocyte anterior/posterior axis specification |
| GO:0007402 | 0.0072 | 279.4286 | 0.0073 | 1 | 2 | ganglion mother cell fate determination |
| GO:0010848 | 0.0072 | 279.4286 | 0.0073 | 1 | 2 | regulation of chromatin disassembly |
| GO:0019408 | 0.0072 | 279.4286 | 0.0073 | 1 | 2 | dolichol biosynthetic process |
| GO:0030719 | 0.0072 | 279.4286 | 0.0073 | 1 | 2 | P granule organization |
| GO:0033030 | 0.0072 | 279.4286 | 0.0073 | 1 | 2 | negative regulation of neutrophil apoptotic process |
| GO:0036413 | 0.0072 | 279.4286 | 0.0073 | 1 | 2 | histone H3-R26 citrullination |
| GO:0061193 | 0.0072 | 279.4286 | 0.0073 | 1 | 2 | taste bud development |
| GO:0097156 | 0.0072 | 279.4286 | 0.0073 | 1 | 2 | fasciculation of motor neuron axon |
| GO:1904562 | 0.0072 | 279.4286 | 0.0073 | 1 | 2 | phosphatidylinositol 5-phosphate metabolic process |
| GO:2000452 | 0.0072 | 279.4286 | 0.0073 | 1 | 2 | regulation of CD8-positive, alpha-beta cytotoxic T cell extravasation |
| GO:0080135 | 0.0072 | 3.3994 | 2.2719 | 7 | 626 | regulation of cellular response to stress |
| GO:0009259 | 0.0074 | 3.7995 | 1.7275 | 6 | 476 | ribonucleotide metabolic process |
| GO:0051716 | 0.0076 | 1.9796 | 24.4026 | 34 | 6724 | cellular response to stimulus |
| GO:2000401 | 0.0079 | 16.2223 | 0.1343 | 2 | 37 | regulation of lymphocyte migration |
| GO:0051092 | 0.0094 | 7.3751 | 0.4355 | 3 | 120 | positive regulation of NF-kappaB transcription factor activity |
| GO:0097300 | 0.0097 | 14.5548 | 0.1488 | 2 | 41 | programmed necrotic cell death |
| GO:0016458 | 0.0099 | 5.1046 | 0.842 | 4 | 232 | gene silencing |
| GOMFID | Pvalue | OddsRatio | ExpCount | Count | Size | Term |
| GO:0007018 | 0.0011 | 6.9496 | 0.7895 | 5 | 200 | microtubule-based movement |
| GO:0030317 | 0.0016 | 14.1538 | 0.2329 | 3 | 59 | sperm motility |
| GO:0016043 | 0.0033 | 2.0638 | 23.0102 | 34 | 5829 | cellular component organization |
| GO:0006660 | 0.0039 | Inf | 0.0039 | 1 | 1 | phosphatidylserine catabolic process |
| GO:0010189 | 0.0039 | Inf | 0.0039 | 1 | 1 | vitamin E biosynthetic process |
| GO:0032954 | 0.0039 | Inf | 0.0039 | 1 | 1 | regulation of cytokinetic process |
| GO:0061738 | 0.0039 | Inf | 0.0039 | 1 | 1 | late endosomal microautophagy |
| GO:1902412 | 0.0039 | Inf | 0.0039 | 1 | 1 | regulation of mitotic cytokinesis |
| GO:1903438 | 0.0039 | Inf | 0.0039 | 1 | 1 | positive regulation of mitotic cytokinetic process |
| GO:0048870 | 0.005 | 2.7527 | 4.5588 | 11 | 1209 | cell motility |
| GO:0032007 | 0.0058 | 19.2802 | 0.1145 | 2 | 29 | negative regulation of TOR signaling |
| GO:0033198 | 0.0066 | 17.9483 | 0.1224 | 2 | 31 | response to ATP |
| GO:0007080 | 0.0075 | 16.7882 | 0.1303 | 2 | 33 | mitotic metaphase plate congression |
| GO:0002017 | 0.0079 | 256.4426 | 0.0079 | 1 | 2 | regulation of blood volume by renal aldosterone |
| GO:0034342 | 0.0079 | 256.4426 | 0.0079 | 1 | 2 | response to type III interferon |
| GO:0048193 | 0.0083 | 4.2966 | 1.2553 | 5 | 318 | Golgi vesicle transport |
| GO:0018108 | 0.0094 | 4.1608 | 1.2948 | 5 | 328 | peptidyl-tyrosine phosphorylation |
| GOMFID | Pvalue | OddsRatio | ExpCount | Count | Size | Term |
| GO:1902003 | 4e-04 | 85.0543 | 0.0306 | 2 | 10 | regulation of beta-amyloid formation |
| GO:0015937 | 5e-04 | 75.599 | 0.0336 | 2 | 11 | coenzyme A biosynthetic process |
| GO:0033866 | 0.0012 | 45.342 | 0.052 | 2 | 17 | nucleoside bisphosphate biosynthetic process |
| GO:0042987 | 0.0017 | 37.7778 | 0.0611 | 2 | 20 | amyloid precursor protein catabolic process |
| GO:0050435 | 0.0024 | 30.9012 | 0.0733 | 2 | 24 | beta-amyloid metabolic process |
| GO:0010836 | 0.0031 | Inf | 0.0031 | 1 | 1 | negative regulation of protein ADP-ribosylation |
| GO:0033342 | 0.0031 | Inf | 0.0031 | 1 | 1 | negative regulation of collagen binding |
| GO:0035644 | 0.0031 | Inf | 0.0031 | 1 | 1 | phosphoanandamide dephosphorylation |
| GO:0006099 | 0.0031 | 27.1878 | 0.0825 | 2 | 27 | tricarboxylic acid cycle |
| GO:1901137 | 0.0039 | 3.5237 | 2.5947 | 8 | 849 | carbohydrate derivative biosynthetic process |
| GO:0072350 | 0.0051 | 20.5863 | 0.107 | 2 | 35 | tricarboxylic acid metabolic process |
| GO:0033875 | 0.0057 | 19.4075 | 0.1131 | 2 | 37 | ribonucleoside bisphosphate metabolic process |
| GO:0034032 | 0.0057 | 19.4075 | 0.1131 | 2 | 37 | purine nucleoside bisphosphate metabolic process |
| GO:1901222 | 0.006 | 18.8671 | 0.1161 | 2 | 38 | regulation of NIK/NF-kappaB signaling |
| GO:0000354 | 0.0061 | 333.1277 | 0.0061 | 1 | 2 | cis assembly of pre-catalytic spliceosome |
| GO:0003292 | 0.0061 | 333.1277 | 0.0061 | 1 | 2 | cardiac septum cell differentiation |
| GO:0006097 | 0.0061 | 333.1277 | 0.0061 | 1 | 2 | glyoxylate cycle |
| GO:0006624 | 0.0061 | 333.1277 | 0.0061 | 1 | 2 | vacuolar protein processing |
| GO:0042351 | 0.0061 | 333.1277 | 0.0061 | 1 | 2 | 'de novo' GDP-L-fucose biosynthetic process |
| GO:0051083 | 0.0061 | 333.1277 | 0.0061 | 1 | 2 | 'de novo' cotranslational protein folding |
| GO:0060928 | 0.0061 | 333.1277 | 0.0061 | 1 | 2 | atrioventricular node cell development |
| GO:1902523 | 0.0061 | 333.1277 | 0.0061 | 1 | 2 | positive regulation of protein K63-linked ubiquitination |
| GO:0018279 | 0.0064 | 5.865 | 0.7426 | 4 | 243 | protein N-linked glycosylation via asparagine |
| GO:0006486 | 0.008 | 4.3904 | 1.25 | 5 | 409 | protein glycosylation |
| GO:0070085 | 0.0083 | 4.3462 | 1.2622 | 5 | 413 | glycosylation |
| GO:0001712 | 0.0091 | 166.5532 | 0.0092 | 1 | 3 | ectodermal cell fate commitment |
| GO:0003162 | 0.0091 | 166.5532 | 0.0092 | 1 | 3 | atrioventricular node development |
| GO:0006982 | 0.0091 | 166.5532 | 0.0092 | 1 | 3 | response to lipid hydroperoxide |
| GO:0046368 | 0.0091 | 166.5532 | 0.0092 | 1 | 3 | GDP-L-fucose metabolic process |
| GO:0070433 | 0.0091 | 166.5532 | 0.0092 | 1 | 3 | negative regulation of nucleotide-binding oligomerization domain containing 2 signaling pathway |
| GO:1901165 | 0.0091 | 166.5532 | 0.0092 | 1 | 3 | positive regulation of trophoblast cell migration |
| GOMFID | Pvalue | OddsRatio | ExpCount | Count | Size | Term |
| GO:0042340 | 1e-04 | 165 | 0.016 | 2 | 12 | keratan sulfate catabolic process |
| GO:0018146 | 6e-04 | 63.3968 | 0.0374 | 2 | 28 | keratan sulfate biosynthetic process |
| GO:0048662 | 0.001 | 49.9266 | 0.0468 | 2 | 35 | negative regulation of smooth muscle cell proliferation |
| GO:0006535 | 0.0027 | 784.2 | 0.0027 | 1 | 2 | cysteine biosynthetic process from serine |
| GO:0043418 | 0.0027 | 784.2 | 0.0027 | 1 | 2 | homocysteine catabolic process |
| GO:2000473 | 0.0027 | 784.2 | 0.0027 | 1 | 2 | positive regulation of hematopoietic stem cell migration |
| GO:0006026 | 0.0031 | 27.4123 | 0.0829 | 2 | 62 | aminoglycan catabolic process |
| GO:0002378 | 0.004 | 392.075 | 0.004 | 1 | 3 | immunoglobulin biosynthetic process |
| GO:0006565 | 0.004 | 392.075 | 0.004 | 1 | 3 | L-serine catabolic process |
| GO:0019343 | 0.004 | 392.075 | 0.004 | 1 | 3 | cysteine biosynthetic process via cystathionine |
| GO:0019448 | 0.004 | 392.075 | 0.004 | 1 | 3 | L-cysteine catabolic process |
| GO:0042262 | 0.004 | 392.075 | 0.004 | 1 | 3 | DNA protection |
| GO:0001915 | 0.0053 | 261.3667 | 0.0053 | 1 | 4 | negative regulation of T cell mediated cytotoxicity |
| GO:0006933 | 0.0053 | 261.3667 | 0.0053 | 1 | 4 | negative regulation of cell adhesion involved in substrate-bound cell migration |
| GO:0019346 | 0.0053 | 261.3667 | 0.0053 | 1 | 4 | transsulfuration |
| GO:0032914 | 0.0053 | 261.3667 | 0.0053 | 1 | 4 | positive regulation of transforming growth factor beta1 production |
| GO:0070814 | 0.0053 | 261.3667 | 0.0053 | 1 | 4 | hydrogen sulfide biosynthetic process |
| GO:0006405 | 0.0059 | 19.3189 | 0.1163 | 2 | 87 | RNA export from nucleus |
| GO:0048539 | 0.008 | 156.8 | 0.008 | 1 | 6 | bone marrow development |
| GO:0006023 | 0.0094 | 15.1823 | 0.1471 | 2 | 110 | aminoglycan biosynthetic process |
| GOMFID | Pvalue | OddsRatio | ExpCount | Count | Size | Term |
| GO:1901726 | 0.0019 | Inf | 0.0019 | 1 | 1 | negative regulation of histone deacetylase activity |
| GO:1902775 | 0.0057 | 270.2414 | 0.0057 | 1 | 3 | mitochondrial large ribosomal subunit assembly |
| GO:0008627 | 0.0095 | 135.1034 | 0.0096 | 1 | 5 | intrinsic apoptotic signaling pathway in response to osmotic stress |
| GO:0034720 | 0.0095 | 135.1034 | 0.0096 | 1 | 5 | histone H3-K4 demethylation |
| GO:0042760 | 0.0095 | 135.1034 | 0.0096 | 1 | 5 | very long-chain fatty acid catabolic process |
| GOMFID | Pvalue | OddsRatio | ExpCount | Count | Size | Term |
| GO:0016043 | 9e-04 | 2.6991 | 16.3298 | 27 | 5829 | cellular component organization |
| GO:0000921 | 0.0028 | Inf | 0.0028 | 1 | 1 | septin ring assembly |
| GO:0001697 | 0.0028 | Inf | 0.0028 | 1 | 1 | histamine-induced gastric acid secretion |
| GO:0002044 | 0.0028 | Inf | 0.0028 | 1 | 1 | blood vessel endothelial cell migration involved in intussusceptive angiogenesis |
| GO:0010836 | 0.0028 | Inf | 0.0028 | 1 | 1 | negative regulation of protein ADP-ribosylation |
| GO:0030490 | 0.0034 | 25.67 | 0.0868 | 2 | 31 | maturation of SSU-rRNA |
| GO:0045494 | 0.0056 | 19.5789 | 0.1121 | 2 | 40 | photoreceptor cell maintenance |
| GO:0016332 | 0.0056 | 364.2093 | 0.0056 | 1 | 2 | establishment or maintenance of polarity of embryonic epithelium |
| GO:0032185 | 0.0056 | 364.2093 | 0.0056 | 1 | 2 | septin cytoskeleton organization |
| GO:0090521 | 0.0056 | 364.2093 | 0.0056 | 1 | 2 | glomerular visceral epithelial cell migration |
| GO:0001698 | 0.0084 | 182.093 | 0.0084 | 1 | 3 | gastrin-induced gastric acid secretion |
| GO:0009236 | 0.0084 | 182.093 | 0.0084 | 1 | 3 | cobalamin biosynthetic process |
| GOMFID | Pvalue | OddsRatio | ExpCount | Count | Size | Term |
| GO:0031998 | 0.001 | 50.7987 | 0.0469 | 2 | 16 | regulation of fatty acid beta-oxidation |
| GO:0097529 | 0.0011 | 9.7818 | 0.454 | 4 | 155 | myeloid leukocyte migration |
| GO:0006783 | 0.0014 | 41.8262 | 0.0556 | 2 | 19 | heme biosynthetic process |
| GO:0006972 | 0.0017 | 37.4187 | 0.0615 | 2 | 21 | hyperosmotic response |
| GO:0030595 | 0.0018 | 8.5257 | 0.5184 | 4 | 177 | leukocyte chemotaxis |
| GO:0042346 | 0.0024 | 30.9032 | 0.0732 | 2 | 25 | positive regulation of NF-kappaB import into nucleus |
| GO:0033014 | 0.0028 | 28.4273 | 0.0791 | 2 | 27 | tetrapyrrole biosynthetic process |
| GO:0000717 | 0.0029 | Inf | 0.0029 | 1 | 1 | nucleotide-excision repair, DNA duplex unwinding |
| GO:0001697 | 0.0029 | Inf | 0.0029 | 1 | 1 | histamine-induced gastric acid secretion |
| GO:0003353 | 0.0029 | Inf | 0.0029 | 1 | 1 | positive regulation of cilium movement |
| GO:0010808 | 0.0029 | Inf | 0.0029 | 1 | 1 | positive regulation of synaptic vesicle priming |
| GO:0034346 | 0.0029 | Inf | 0.0029 | 1 | 1 | positive regulation of type III interferon production |
| GO:1904591 | 0.0029 | 11.4308 | 0.287 | 3 | 98 | positive regulation of protein import |
| GO:0032543 | 0.0048 | 9.5141 | 0.3427 | 3 | 117 | mitochondrial translation |
| GO:0006778 | 0.005 | 20.8904 | 0.1054 | 2 | 36 | porphyrin-containing compound metabolic process |
| GO:0002282 | 0.0058 | 347.9778 | 0.0059 | 1 | 2 | microglial cell activation involved in immune response |
| GO:0006864 | 0.0058 | 347.9778 | 0.0059 | 1 | 2 | pyrimidine nucleotide transport |
| GO:0045356 | 0.0058 | 347.9778 | 0.0059 | 1 | 2 | positive regulation of interferon-alpha biosynthetic process |
| GO:0007077 | 0.007 | 17.316 | 0.1259 | 2 | 43 | mitotic nuclear envelope disassembly |
| GO:0030397 | 0.0077 | 16.5085 | 0.1318 | 2 | 45 | membrane disassembly |
| GO:0006865 | 0.0078 | 7.9637 | 0.4071 | 3 | 139 | amino acid transport |
| GO:0001698 | 0.0088 | 173.9778 | 0.0088 | 1 | 3 | gastrin-induced gastric acid secretion |
| GO:1901509 | 0.0088 | 173.9778 | 0.0088 | 1 | 3 | regulation of endothelial tube morphogenesis |
| GO:1901740 | 0.0088 | 173.9778 | 0.0088 | 1 | 3 | negative regulation of myoblast fusion |
| GOMFID | Pvalue | OddsRatio | ExpCount | Count | Size | Term |
| GO:0006782 | 2e-04 | 125.192 | 0.0232 | 2 | 7 | protoporphyrinogen IX biosynthetic process |
| GO:0008152 | 8e-04 | 3.8196 | 37.0085 | 47 | 11178 | metabolic process |
| GO:0019538 | 0.0027 | 2.2559 | 17.7593 | 28 | 5364 | protein metabolic process |
| GO:0042346 | 0.0031 | 27.1843 | 0.0828 | 2 | 25 | positive regulation of NF-kappaB import into nucleus |
| GO:0021993 | 0.0033 | Inf | 0.0033 | 1 | 1 | initiation of neural tube closure |
| GO:0090035 | 0.0033 | Inf | 0.0033 | 1 | 1 | positive regulation of chaperone-mediated protein complex assembly |
| GO:0051051 | 0.0034 | 4.5206 | 1.4733 | 6 | 445 | negative regulation of transport |
| GO:0033014 | 0.0036 | 25.0064 | 0.0894 | 2 | 27 | tetrapyrrole biosynthetic process |
| GO:0042168 | 0.0038 | 24.0431 | 0.0927 | 2 | 28 | heme metabolic process |
| GO:0042339 | 0.0053 | 20.1587 | 0.1093 | 2 | 33 | keratan sulfate metabolic process |
| GO:0006464 | 0.0054 | 2.1902 | 12.313 | 21 | 3719 | cellular protein modification process |
| GO:0015847 | 0.0066 | 306.9216 | 0.0066 | 1 | 2 | putrescine transport |
| GO:0019408 | 0.0066 | 306.9216 | 0.0066 | 1 | 2 | dolichol biosynthetic process |
| GO:0021592 | 0.0066 | 306.9216 | 0.0066 | 1 | 2 | fourth ventricle development |
| GO:0097498 | 0.0066 | 306.9216 | 0.0066 | 1 | 2 | endothelial tube lumen extension |
| GO:1902766 | 0.0066 | 306.9216 | 0.0066 | 1 | 2 | skeletal muscle satellite cell migration |
| GO:1903281 | 0.0066 | 306.9216 | 0.0066 | 1 | 2 | positive regulation of calcium:sodium antiporter activity |
| GO:1903527 | 0.0066 | 306.9216 | 0.0066 | 1 | 2 | positive regulation of membrane tubulation |
| GO:2000301 | 0.0066 | 306.9216 | 0.0066 | 1 | 2 | negative regulation of synaptic vesicle exocytosis |
| GO:0050821 | 0.0077 | 7.9926 | 0.4039 | 3 | 122 | protein stabilization |
| GO:0051496 | 0.0077 | 16.4379 | 0.1324 | 2 | 40 | positive regulation of stress fiber assembly |
| GO:0010975 | 0.0079 | 4.3823 | 1.2449 | 5 | 376 | regulation of neuron projection development |
| GO:1900024 | 0.0081 | 16.0154 | 0.1357 | 2 | 41 | regulation of substrate adhesion-dependent cell spreading |
| GO:1901214 | 0.009 | 5.285 | 0.8178 | 4 | 247 | regulation of neuron death |
| GO:0043524 | 0.0093 | 7.4263 | 0.4337 | 3 | 131 | negative regulation of neuron apoptotic process |
| GO:0043412 | 0.0093 | 2.0641 | 12.8758 | 21 | 3889 | macromolecule modification |
| GO:0006166 | 0.0099 | 153.451 | 0.0099 | 1 | 3 | purine ribonucleoside salvage |
| GO:0021678 | 0.0099 | 153.451 | 0.0099 | 1 | 3 | third ventricle development |
| GO:0032377 | 0.0099 | 153.451 | 0.0099 | 1 | 3 | regulation of intracellular lipid transport |
| GO:0032383 | 0.0099 | 153.451 | 0.0099 | 1 | 3 | regulation of intracellular cholesterol transport |
| GO:0038128 | 0.0099 | 153.451 | 0.0099 | 1 | 3 | ERBB2 signaling pathway |
| GO:0044861 | 0.0099 | 153.451 | 0.0099 | 1 | 3 | protein transport into plasma membrane raft |
| GO:1902268 | 0.0099 | 153.451 | 0.0099 | 1 | 3 | negative regulation of polyamine transmembrane transport |
| GO:1902459 | 0.0099 | 153.451 | 0.0099 | 1 | 3 | positive regulation of stem cell population maintenance |
| GO:1903288 | 0.0099 | 153.451 | 0.0099 | 1 | 3 | positive regulation of potassium ion import |
| GOMFID | Pvalue | OddsRatio | ExpCount | Count | Size | Term |
| GO:0008088 | 4e-04 | 22.8216 | 0.149 | 3 | 39 | axo-dendritic transport |
| GO:0048490 | 0.0017 | 38.5025 | 0.0611 | 2 | 16 | anterograde synaptic vesicle transport |
| GO:0099514 | 0.0017 | 38.5025 | 0.0611 | 2 | 16 | synaptic vesicle cytoskeletal transport |
| GO:0036065 | 0.0034 | 25.6568 | 0.0879 | 2 | 23 | fucosylation |
| GO:0008334 | 0.0038 | 24.489 | 0.0917 | 2 | 24 | histone mRNA metabolic process |
| GO:0000494 | 0.0038 | Inf | 0.0038 | 1 | 1 | box C/D snoRNA 3'-end processing |
| GO:0033967 | 0.0038 | Inf | 0.0038 | 1 | 1 | box C/D snoRNA metabolic process |
| GO:0075521 | 0.0038 | Inf | 0.0038 | 1 | 1 | microtubule-dependent intracellular transport of viral material towards nucleus |
| GO:1904268 | 0.0038 | Inf | 0.0038 | 1 | 1 | positive regulation of Schwann cell chemotaxis |
| GO:1990258 | 0.0038 | Inf | 0.0038 | 1 | 1 | histone glutamine methylation |
| GO:0050775 | 0.0044 | 22.4454 | 0.0993 | 2 | 26 | positive regulation of dendrite morphogenesis |
| GO:0035587 | 0.0047 | 21.5462 | 0.1031 | 2 | 27 | purinergic receptor signaling pathway |
| GO:0006397 | 0.0053 | 4.0779 | 1.6083 | 6 | 421 | mRNA processing |
| GO:0022618 | 0.0058 | 6.0023 | 0.7182 | 4 | 188 | ribonucleoprotein complex assembly |
| GO:0031123 | 0.0073 | 8.1006 | 0.3973 | 3 | 104 | RNA 3'-end processing |
| GO:0047496 | 0.0074 | 16.8254 | 0.1299 | 2 | 34 | vesicle transport along microtubule |
| GO:0001189 | 0.0076 | 265.1695 | 0.0076 | 1 | 2 | RNA polymerase I transcriptional preinitiation complex assembly at the promoter for the nuclear large rRNA transcript |
| GO:0031022 | 0.0076 | 265.1695 | 0.0076 | 1 | 2 | nuclear migration along microfilament |
| GO:1900147 | 0.0076 | 265.1695 | 0.0076 | 1 | 2 | regulation of Schwann cell migration |
| GO:0034660 | 0.008 | 3.7181 | 1.7573 | 6 | 460 | ncRNA metabolic process |
| GO:0051656 | 0.0087 | 4.2588 | 1.2683 | 5 | 332 | establishment of organelle localization |
| GO:0043631 | 0.0088 | 15.3803 | 0.1413 | 2 | 37 | RNA polyadenylation |
| GOMFID | Pvalue | OddsRatio | ExpCount | Count | Size | Term |
| GO:0006906 | 1e-04 | 16.8411 | 0.2682 | 4 | 78 | vesicle fusion |
| GO:0048284 | 8e-04 | 10.5315 | 0.4195 | 4 | 122 | organelle fusion |
| GO:0019371 | 0.001 | 50.1282 | 0.0481 | 2 | 14 | cyclooxygenase pathway |
| GO:0044801 | 0.0012 | 9.4785 | 0.4642 | 4 | 135 | single-organism membrane fusion |
| GO:0000349 | 0.0034 | Inf | 0.0034 | 1 | 1 | generation of catalytic spliceosome for first transesterification step |
| GO:0006425 | 0.0034 | Inf | 0.0034 | 1 | 1 | glutaminyl-tRNA aminoacylation |
| GO:0021763 | 0.0034 | Inf | 0.0034 | 1 | 1 | subthalamic nucleus development |
| GO:0039521 | 0.0034 | Inf | 0.0034 | 1 | 1 | suppression by virus of host autophagy |
| GO:0060127 | 0.0034 | Inf | 0.0034 | 1 | 1 | prolactin secreting cell differentiation |
| GO:0060578 | 0.0034 | Inf | 0.0034 | 1 | 1 | superior vena cava morphogenesis |
| GO:0046457 | 0.0041 | 23.1154 | 0.0963 | 2 | 28 | prostanoid biosynthetic process |
| GO:0006693 | 0.0061 | 18.774 | 0.1169 | 2 | 34 | prostaglandin metabolic process |
| GO:0006624 | 0.0069 | 295.3019 | 0.0069 | 1 | 2 | vacuolar protein processing |
| GO:0031022 | 0.0069 | 295.3019 | 0.0069 | 1 | 2 | nuclear migration along microfilament |
| GO:0060460 | 0.0069 | 295.3019 | 0.0069 | 1 | 2 | left lung morphogenesis |
| GO:0060577 | 0.0069 | 295.3019 | 0.0069 | 1 | 2 | pulmonary vein morphogenesis |
| GO:1901898 | 0.0069 | 295.3019 | 0.0069 | 1 | 2 | negative regulation of relaxation of cardiac muscle |
| GO:1902530 | 0.0069 | 295.3019 | 0.0069 | 1 | 2 | positive regulation of protein linear polyubiquitination |
| GOMFID | Pvalue | OddsRatio | ExpCount | Count | Size | Term |
| GO:1903861 | 0.0018 | 36.0692 | 0.0641 | 2 | 19 | positive regulation of dendrite extension |
| GO:0051977 | 0.0034 | Inf | 0.0034 | 1 | 1 | lysophospholipid transport |
| GO:0061611 | 0.0034 | Inf | 0.0034 | 1 | 1 | mannose to fructose-6-phosphate metabolic process |
| GO:1901843 | 0.0034 | Inf | 0.0034 | 1 | 1 | positive regulation of high voltage-gated calcium channel activity |
| GO:0006658 | 0.004 | 23.5701 | 0.0945 | 2 | 28 | phosphatidylserine metabolic process |
| GO:0046474 | 0.0044 | 6.5391 | 0.6648 | 4 | 197 | glycerophospholipid biosynthetic process |
| GO:0006436 | 0.0067 | 301 | 0.0067 | 1 | 2 | tryptophanyl-tRNA aminoacylation |
| GO:0016598 | 0.0067 | 301 | 0.0067 | 1 | 2 | protein arginylation |
| GO:0043323 | 0.0067 | 301 | 0.0067 | 1 | 2 | positive regulation of natural killer cell degranulation |
| GO:0051792 | 0.0067 | 301 | 0.0067 | 1 | 2 | medium-chain fatty acid biosynthetic process |
| GO:0045010 | 0.0092 | 14.9326 | 0.1451 | 2 | 43 | actin nucleation |
| GOMFID | Pvalue | OddsRatio | ExpCount | Count | Size | Term |
| GO:0033278 | 2e-04 | 125.192 | 0.0232 | 2 | 7 | cell proliferation in midbrain |
| GO:1903830 | 7e-04 | 62.576 | 0.0397 | 2 | 12 | magnesium ion transmembrane transport |
| GO:0006970 | 0.0014 | 15.1516 | 0.2185 | 3 | 66 | response to osmotic stress |
| GO:0007214 | 0.0024 | 31.268 | 0.0728 | 2 | 22 | gamma-aminobutyric acid signaling pathway |
| GO:0044550 | 0.0028 | 28.4218 | 0.0795 | 2 | 24 | secondary metabolite biosynthetic process |
| GO:0097194 | 0.0033 | 10.955 | 0.298 | 3 | 90 | execution phase of apoptosis |
| GO:0016077 | 0.0033 | Inf | 0.0033 | 1 | 1 | snoRNA catabolic process |
| GO:0035750 | 0.0033 | Inf | 0.0033 | 1 | 1 | protein localization to myelin sheath abaxonal region |
| GO:0035863 | 0.0033 | Inf | 0.0033 | 1 | 1 | dITP catabolic process |
| GO:0036518 | 0.0033 | Inf | 0.0033 | 1 | 1 | chemorepulsion of dopaminergic neuron axon |
| GO:0050783 | 0.0033 | Inf | 0.0033 | 1 | 1 | cocaine metabolic process |
| GO:0061485 | 0.0033 | Inf | 0.0033 | 1 | 1 | memory T cell proliferation |
| GO:1901300 | 0.0033 | Inf | 0.0033 | 1 | 1 | positive regulation of hydrogen peroxide-mediated programmed cell death |
| GO:1901639 | 0.0033 | Inf | 0.0033 | 1 | 1 | XDP catabolic process |
| GO:1903542 | 0.0033 | Inf | 0.0033 | 1 | 1 | negative regulation of exosomal secretion |
| GO:1903724 | 0.0033 | Inf | 0.0033 | 1 | 1 | positive regulation of centriole elongation |
| GO:1904938 | 0.0033 | Inf | 0.0033 | 1 | 1 | planar cell polarity pathway involved in axon guidance |
| GO:0007601 | 0.0039 | 6.7465 | 0.6456 | 4 | 195 | visual perception |
| GO:0030490 | 0.0047 | 21.5517 | 0.1026 | 2 | 31 | maturation of SSU-rRNA |
| GO:0050808 | 0.0055 | 6.0991 | 0.7118 | 4 | 215 | synapse organization |
| GO:0019464 | 0.0066 | 306.9216 | 0.0066 | 1 | 2 | glycine decarboxylation via glycine cleavage system |
| GO:0032510 | 0.0066 | 306.9216 | 0.0066 | 1 | 2 | endosome to lysosome transport via multivesicular body sorting pathway |
| GO:0034970 | 0.0066 | 306.9216 | 0.0066 | 1 | 2 | histone H3-R2 methylation |
| GO:0046709 | 0.0066 | 306.9216 | 0.0066 | 1 | 2 | IDP catabolic process |
| GO:0046778 | 0.0066 | 306.9216 | 0.0066 | 1 | 2 | modification by virus of host mRNA processing |
| GO:0051643 | 0.0066 | 306.9216 | 0.0066 | 1 | 2 | endoplasmic reticulum localization |
| GO:0070676 | 0.0066 | 306.9216 | 0.0066 | 1 | 2 | intralumenal vesicle formation |
| GO:0071454 | 0.0066 | 306.9216 | 0.0066 | 1 | 2 | cellular response to anoxia |
| GO:1902512 | 0.0066 | 306.9216 | 0.0066 | 1 | 2 | positive regulation of apoptotic DNA fragmentation |
| GO:1904009 | 0.0066 | 306.9216 | 0.0066 | 1 | 2 | cellular response to monosodium glutamate |
| GO:2000233 | 0.0066 | 306.9216 | 0.0066 | 1 | 2 | negative regulation of rRNA processing |
| GO:0043631 | 0.0066 | 17.8503 | 0.1225 | 2 | 37 | RNA polyadenylation |
| GO:0010796 | 0.0099 | 153.451 | 0.0099 | 1 | 3 | regulation of multivesicular body size |
| GO:0010825 | 0.0099 | 153.451 | 0.0099 | 1 | 3 | positive regulation of centrosome duplication |
| GO:0014016 | 0.0099 | 153.451 | 0.0099 | 1 | 3 | neuroblast differentiation |
| GO:0035880 | 0.0099 | 153.451 | 0.0099 | 1 | 3 | embryonic nail plate morphogenesis |
| GO:0043420 | 0.0099 | 153.451 | 0.0099 | 1 | 3 | anthranilate metabolic process |
| GO:1904693 | 0.0099 | 153.451 | 0.0099 | 1 | 3 | midbrain morphogenesis |
| GO:1990637 | 0.0099 | 153.451 | 0.0099 | 1 | 3 | response to prolactin |
| GOMFID | Pvalue | OddsRatio | ExpCount | Count | Size | Term |
| GO:0051656 | 6e-04 | 6.562 | 1.0358 | 6 | 332 | establishment of organelle localization |
| GO:0006302 | 6e-04 | 8.0855 | 0.6926 | 5 | 222 | double-strand break repair |
| GO:0022402 | 7e-04 | 3.6766 | 3.6285 | 11 | 1209 | cell cycle process |
| GO:0006998 | 0.0016 | 14.3166 | 0.2309 | 3 | 74 | nuclear envelope organization |
| GO:0043123 | 0.0019 | 8.3459 | 0.5273 | 4 | 169 | positive regulation of I-kappaB kinase/NF-kappaB signaling |
| GO:0034105 | 0.0027 | 28.9251 | 0.078 | 2 | 25 | positive regulation of tissue remodeling |
| GO:0032201 | 0.003 | 27.7181 | 0.0811 | 2 | 26 | telomere maintenance via semi-conservative replication |
| GO:0035058 | 0.003 | 27.7181 | 0.0811 | 2 | 26 | nonmotile primary cilium assembly |
| GO:1902017 | 0.003 | 27.7181 | 0.0811 | 2 | 26 | regulation of cilium assembly |
| GO:0010124 | 0.0031 | Inf | 0.0031 | 1 | 1 | phenylacetate catabolic process |
| GO:0021990 | 0.0031 | Inf | 0.0031 | 1 | 1 | neural plate formation |
| GO:0036334 | 0.0031 | Inf | 0.0031 | 1 | 1 | epidermal stem cell homeostasis |
| GO:0048685 | 0.0031 | Inf | 0.0031 | 1 | 1 | negative regulation of collateral sprouting of intact axon in response to injury |
| GO:0000722 | 0.0037 | 24.6336 | 0.0905 | 2 | 29 | telomere maintenance via recombination |
| GO:0048858 | 0.0048 | 3.1494 | 3.2852 | 9 | 1053 | cell projection morphogenesis |
| GO:0061024 | 0.0048 | 3.1461 | 3.2883 | 9 | 1054 | membrane organization |
| GO:0006890 | 0.0053 | 20.147 | 0.1092 | 2 | 35 | retrograde vesicle-mediated transport, Golgi to ER |
| GO:0030705 | 0.0055 | 9.0518 | 0.3588 | 3 | 115 | cytoskeleton-dependent intracellular transport |
| GO:0034405 | 0.0056 | 19.5532 | 0.1123 | 2 | 36 | response to fluid shear stress |
| GO:0006271 | 0.0059 | 18.9933 | 0.1154 | 2 | 37 | DNA strand elongation involved in DNA replication |
| GO:0046006 | 0.0059 | 18.9933 | 0.1154 | 2 | 37 | regulation of activated T cell proliferation |
| GO:0002337 | 0.0062 | 326.1667 | 0.0062 | 1 | 2 | B-1a B cell differentiation |
| GO:0019244 | 0.0062 | 326.1667 | 0.0062 | 1 | 2 | lactate biosynthetic process from pyruvate |
| GO:0031022 | 0.0062 | 326.1667 | 0.0062 | 1 | 2 | nuclear migration along microfilament |
| GO:0046226 | 0.0062 | 326.1667 | 0.0062 | 1 | 2 | coumarin catabolic process |
| GO:1902766 | 0.0062 | 326.1667 | 0.0062 | 1 | 2 | skeletal muscle satellite cell migration |
| GO:0000070 | 0.0073 | 8.1695 | 0.3962 | 3 | 127 | mitotic sister chromatid segregation |
| GO:0007077 | 0.0079 | 16.2076 | 0.1342 | 2 | 43 | mitotic nuclear envelope disassembly |
| GO:0007017 | 0.0084 | 3.7204 | 1.7845 | 6 | 572 | microtubule-based process |
| GO:0030397 | 0.0087 | 15.4518 | 0.1404 | 2 | 45 | membrane disassembly |
| GO:1902117 | 0.0087 | 15.4518 | 0.1404 | 2 | 45 | positive regulation of organelle assembly |
| GO:0044786 | 0.009 | 15.0996 | 0.1435 | 2 | 46 | cell cycle DNA replication |
| GO:0006974 | 0.0093 | 3.2669 | 2.3929 | 7 | 767 | cellular response to DNA damage stimulus |
| GO:0031587 | 0.0093 | 163.0729 | 0.0094 | 1 | 3 | positive regulation of inositol 1,4,5-trisphosphate-sensitive calcium-release channel activity |
| GO:0032929 | 0.0093 | 163.0729 | 0.0094 | 1 | 3 | negative regulation of superoxide anion generation |
| GO:0044778 | 0.0093 | 163.0729 | 0.0094 | 1 | 3 | meiotic DNA integrity checkpoint |
| GO:0090292 | 0.0093 | 163.0729 | 0.0094 | 1 | 3 | nuclear matrix anchoring at nuclear membrane |
| GO:1990166 | 0.0093 | 163.0729 | 0.0094 | 1 | 3 | protein localization to site of double-strand break |
| GO:0048168 | 0.0094 | 14.7631 | 0.1466 | 2 | 47 | regulation of neuronal synaptic plasticity |
| GO:0000278 | 0.0097 | 3.255 | 2.4236 | 7 | 837 | mitotic cell cycle |
| GO:0006284 | 0.0098 | 14.4413 | 0.1498 | 2 | 48 | base-excision repair |
| GOMFID | Pvalue | OddsRatio | ExpCount | Count | Size | Term |
| GO:0044458 | 0.0012 | 47.3576 | 0.052 | 2 | 12 | motile cilium assembly |
| GO:2000001 | 0.0014 | 43.0496 | 0.0563 | 2 | 13 | regulation of DNA damage checkpoint |
| GO:0042487 | 0.0016 | 39.4596 | 0.0606 | 2 | 14 | regulation of odontogenesis of dentin-containing tooth |
| GO:0061097 | 0.0024 | 12.187 | 0.2684 | 3 | 62 | regulation of protein tyrosine kinase activity |
| GO:0018108 | 0.0029 | 4.6031 | 1.4201 | 6 | 328 | peptidyl-tyrosine phosphorylation |
| GO:0001578 | 0.0032 | 11.0578 | 0.2944 | 3 | 68 | microtubule bundle formation |
| GO:0007017 | 0.0032 | 3.5636 | 2.4765 | 8 | 572 | microtubule-based process |
| GO:0003351 | 0.0033 | 26.2963 | 0.0866 | 2 | 20 | epithelial cilium movement |
| GO:0003353 | 0.0043 | Inf | 0.0043 | 1 | 1 | positive regulation of cilium movement |
| GO:0006660 | 0.0043 | Inf | 0.0043 | 1 | 1 | phosphatidylserine catabolic process |
| GO:0036334 | 0.0043 | Inf | 0.0043 | 1 | 1 | epidermal stem cell homeostasis |
| GO:0071528 | 0.0043 | Inf | 0.0043 | 1 | 1 | tRNA re-export from nucleus |
| GO:0072428 | 0.0043 | Inf | 0.0043 | 1 | 1 | signal transduction involved in intra-S DNA damage checkpoint |
| GO:1902520 | 0.0043 | Inf | 0.0043 | 1 | 1 | response to doxorubicin |
| GO:1902559 | 0.0043 | Inf | 0.0043 | 1 | 1 | 3'-phospho-5'-adenylyl sulfate transmembrane transport |
| GO:1903463 | 0.0043 | Inf | 0.0043 | 1 | 1 | regulation of mitotic cell cycle DNA replication |
| GO:1903926 | 0.0043 | Inf | 0.0043 | 1 | 1 | cellular response to bisphenol A |
| GO:0043567 | 0.0048 | 21.5096 | 0.1039 | 2 | 24 | regulation of insulin-like growth factor receptor signaling pathway |
| GO:0042102 | 0.0068 | 8.3463 | 0.3853 | 3 | 89 | positive regulation of T cell proliferation |
| GO:0018200 | 0.0074 | 16.8939 | 0.1299 | 2 | 30 | peptidyl-glutamic acid modification |
| GO:0032456 | 0.0074 | 16.8939 | 0.1299 | 2 | 30 | endocytic recycling |
| GO:0050863 | 0.0075 | 4.4012 | 1.2209 | 5 | 282 | regulation of T cell activation |
| GO:0031022 | 0.0086 | 233.3881 | 0.0087 | 1 | 2 | nuclear migration along microfilament |
| GO:0071431 | 0.0086 | 233.3881 | 0.0087 | 1 | 2 | tRNA-containing ribonucleoprotein complex export from nucleus |
| GO:0050670 | 0.0093 | 5.1922 | 0.8226 | 4 | 190 | regulation of lymphocyte proliferation |
| GOMFID | Pvalue | OddsRatio | ExpCount | Count | Size | Term |
| GO:0060052 | 6e-04 | 71.0955 | 0.0363 | 2 | 10 | neurofilament cytoskeleton organization |
| GO:0015904 | 0.0036 | Inf | 0.0036 | 1 | 1 | tetracycline transport |
| GO:1901006 | 0.0036 | Inf | 0.0036 | 1 | 1 | ubiquinone-6 biosynthetic process |
| GO:0006518 | 0.0055 | 3.2754 | 2.7255 | 8 | 751 | peptide metabolic process |
| GO:0010824 | 0.006 | 18.9321 | 0.1161 | 2 | 32 | regulation of centrosome duplication |
| GO:0008610 | 0.0071 | 3.4108 | 2.2646 | 7 | 624 | lipid biosynthetic process |
| GO:0003064 | 0.0072 | 279.4286 | 0.0073 | 1 | 2 | regulation of heart rate by hormone |
| GO:0006433 | 0.0072 | 279.4286 | 0.0073 | 1 | 2 | prolyl-tRNA aminoacylation |
| GO:0046601 | 0.0072 | 279.4286 | 0.0073 | 1 | 2 | positive regulation of centriole replication |
| GO:0046854 | 0.0084 | 15.7707 | 0.1379 | 2 | 38 | phosphatidylinositol phosphorylation |
| GOMFID | Pvalue | OddsRatio | ExpCount | Count | Size | Term |
| GO:0060765 | 0.0016 | 39.11 | 0.0588 | 2 | 22 | regulation of androgen receptor signaling pathway |
| GO:2000209 | 0.0019 | 35.55 | 0.0642 | 2 | 24 | regulation of anoikis |
| GO:0044319 | 0.002 | 34.0022 | 0.0669 | 2 | 25 | wound healing, spreading of cells |
| GO:0090504 | 0.0022 | 32.5833 | 0.0695 | 2 | 26 | epiboly |
| GO:2000352 | 0.0022 | 32.5833 | 0.0695 | 2 | 26 | negative regulation of endothelial cell apoptotic process |
| GO:0001193 | 0.0027 | Inf | 0.0027 | 1 | 1 | maintenance of transcriptional fidelity during DNA-templated transcription elongation from RNA polymerase II promoter |
| GO:0072684 | 0.0027 | Inf | 0.0027 | 1 | 1 | mitochondrial tRNA 3'-trailer cleavage, endonucleolytic |
| GO:0007611 | 0.0029 | 7.4237 | 0.5963 | 4 | 223 | learning or memory |
| GO:0042779 | 0.0053 | 382.0244 | 0.0053 | 1 | 2 | tRNA 3'-trailer cleavage |
| GO:0046778 | 0.0053 | 382.0244 | 0.0053 | 1 | 2 | modification by virus of host mRNA processing |
| GO:1902766 | 0.0053 | 382.0244 | 0.0053 | 1 | 2 | skeletal muscle satellite cell migration |
| GO:0019058 | 0.0059 | 4.7761 | 1.1659 | 5 | 436 | viral life cycle |
| GO:0006369 | 0.0064 | 18.164 | 0.1203 | 2 | 45 | termination of RNA polymerase II transcription |
| GO:0061077 | 0.0076 | 16.6138 | 0.131 | 2 | 49 | chaperone-mediated protein folding |
| GO:0006336 | 0.0079 | 16.2667 | 0.1337 | 2 | 50 | DNA replication-independent nucleosome assembly |
| GO:0051865 | 0.0079 | 16.2667 | 0.1337 | 2 | 50 | protein autoubiquitination |
| GO:0000965 | 0.008 | 191 | 0.008 | 1 | 3 | mitochondrial RNA 3'-end processing |
| GO:0031937 | 0.008 | 191 | 0.008 | 1 | 3 | positive regulation of chromatin silencing |
| GO:0061198 | 0.008 | 191 | 0.008 | 1 | 3 | fungiform papilla formation |
| GOMFID | Pvalue | OddsRatio | ExpCount | Count | Size | Term |
| GO:1901998 | 3e-04 | 27.695 | 0.1242 | 3 | 39 | toxin transport |
| GO:0010575 | 0.0028 | 28.3207 | 0.0796 | 2 | 25 | positive regulation of vascular endothelial growth factor production |
| GO:0001949 | 0.0032 | Inf | 0.0032 | 1 | 1 | sebaceous gland cell differentiation |
| GO:0003374 | 0.0032 | Inf | 0.0032 | 1 | 1 | dynamin polymerization involved in mitochondrial fission |
| GO:0019677 | 0.0032 | Inf | 0.0032 | 1 | 1 | NAD catabolic process |
| GO:0021502 | 0.0032 | Inf | 0.0032 | 1 | 1 | neural fold elevation formation |
| GO:0072347 | 0.0032 | Inf | 0.0032 | 1 | 1 | response to anesthetic |
| GO:1903928 | 0.0032 | Inf | 0.0032 | 1 | 1 | cellular response to cyanide |
| GO:0003401 | 0.0049 | 21.0013 | 0.1051 | 2 | 33 | axis elongation |
| GO:0006742 | 0.0064 | 319.4898 | 0.0064 | 1 | 2 | NADP catabolic process |
| GO:0006864 | 0.0064 | 319.4898 | 0.0064 | 1 | 2 | pyrimidine nucleotide transport |
| GO:0071245 | 0.0064 | 319.4898 | 0.0064 | 1 | 2 | cellular response to carbon monoxide |
| GO:0071250 | 0.0064 | 319.4898 | 0.0064 | 1 | 2 | cellular response to nitrite |
| GO:0090149 | 0.0064 | 319.4898 | 0.0064 | 1 | 2 | mitochondrial membrane fission |
| GO:0090249 | 0.0064 | 319.4898 | 0.0064 | 1 | 2 | regulation of cell motility involved in somitogenic axis elongation |
| GO:1902037 | 0.0064 | 319.4898 | 0.0064 | 1 | 2 | negative regulation of hematopoietic stem cell differentiation |
| GO:1903146 | 0.0079 | 16.2667 | 0.1337 | 2 | 42 | regulation of mitophagy |
| GO:0001922 | 0.0095 | 159.7347 | 0.0096 | 1 | 3 | B-1 B cell homeostasis |
| GO:0006421 | 0.0095 | 159.7347 | 0.0096 | 1 | 3 | asparaginyl-tRNA aminoacylation |
| GO:0060988 | 0.0095 | 159.7347 | 0.0096 | 1 | 3 | lipid tube assembly |
| GO:0061030 | 0.0095 | 159.7347 | 0.0096 | 1 | 3 | epithelial cell differentiation involved in mammary gland alveolus development |
| GO:0070101 | 0.0095 | 159.7347 | 0.0096 | 1 | 3 | positive regulation of chemokine-mediated signaling pathway |
| GO:1900063 | 0.0095 | 159.7347 | 0.0096 | 1 | 3 | regulation of peroxisome organization |
| GOMFID | Pvalue | OddsRatio | ExpCount | Count | Size | Term |
| GO:0060271 | 0.001 | 7.1736 | 0.7702 | 5 | 216 | cilium morphogenesis |
| GO:0003374 | 0.0036 | Inf | 0.0036 | 1 | 1 | dynamin polymerization involved in mitochondrial fission |
| GO:0030209 | 0.0036 | Inf | 0.0036 | 1 | 1 | dermatan sulfate catabolic process |
| GO:1902747 | 0.0036 | Inf | 0.0036 | 1 | 1 | negative regulation of lens fiber cell differentiation |
| GO:1990167 | 0.0036 | Inf | 0.0036 | 1 | 1 | protein K27-linked deubiquitination |
| GO:1902017 | 0.0038 | 24.1142 | 0.0927 | 2 | 26 | regulation of cilium assembly |
| GO:0009653 | 0.0041 | 2.3174 | 9.5342 | 18 | 2674 | anatomical structure morphogenesis |
| GO:0002930 | 0.0071 | 284.5273 | 0.0071 | 1 | 2 | trabecular meshwork development |
| GO:0032474 | 0.0071 | 284.5273 | 0.0071 | 1 | 2 | otolith morphogenesis |
| GO:0035523 | 0.0071 | 284.5273 | 0.0071 | 1 | 2 | protein K29-linked deubiquitination |
| GO:0051083 | 0.0071 | 284.5273 | 0.0071 | 1 | 2 | 'de novo' cotranslational protein folding |
| GO:0055096 | 0.0071 | 284.5273 | 0.0071 | 1 | 2 | low-density lipoprotein particle mediated signaling |
| GO:0090149 | 0.0071 | 284.5273 | 0.0071 | 1 | 2 | mitochondrial membrane fission |
| GO:0097494 | 0.0071 | 284.5273 | 0.0071 | 1 | 2 | regulation of vesicle size |
| GO:1900168 | 0.0071 | 284.5273 | 0.0071 | 1 | 2 | positive regulation of glial cell-derived neurotrophic factor secretion |
| GO:1990168 | 0.0071 | 284.5273 | 0.0071 | 1 | 2 | protein K33-linked deubiquitination |
| GO:2001111 | 0.0071 | 284.5273 | 0.0071 | 1 | 2 | positive regulation of lens epithelial cell proliferation |
| GO:0043029 | 0.0077 | 16.5238 | 0.1319 | 2 | 37 | T cell homeostasis |
| GO:0045824 | 0.0077 | 16.5238 | 0.1319 | 2 | 37 | negative regulation of innate immune response |
| GO:0006355 | 0.0082 | 2.0863 | 11.8054 | 20 | 3311 | regulation of transcription, DNA-templated |
| GO:2001141 | 0.0092 | 2.0585 | 11.9302 | 20 | 3346 | regulation of RNA biosynthetic process |
| GO:0000902 | 0.01 | 2.494 | 5.0202 | 11 | 1408 | cell morphogenesis |
| GOMFID | Pvalue | OddsRatio | ExpCount | Count | Size | Term |
| GO:0006396 | 7e-04 | 4.2847 | 2.4577 | 9 | 772 | RNA processing |
| GO:0000717 | 0.0032 | Inf | 0.0032 | 1 | 1 | nucleotide-excision repair, DNA duplex unwinding |
| GO:0046657 | 0.0032 | Inf | 0.0032 | 1 | 1 | folic acid catabolic process |
| GO:0051793 | 0.0032 | Inf | 0.0032 | 1 | 1 | medium-chain fatty acid catabolic process |
| GO:0070159 | 0.0032 | Inf | 0.0032 | 1 | 1 | mitochondrial threonyl-tRNA aminoacylation |
| GO:1904385 | 0.0032 | Inf | 0.0032 | 1 | 1 | cellular response to angiotensin |
| GO:0019080 | 0.0035 | 6.9669 | 0.6271 | 4 | 197 | viral gene expression |
| GO:0032543 | 0.0061 | 8.7021 | 0.3725 | 3 | 117 | mitochondrial translation |
| GO:0042700 | 0.0064 | 319.4898 | 0.0064 | 1 | 2 | luteinizing hormone signaling pathway |
| GO:0070564 | 0.0064 | 319.4898 | 0.0064 | 1 | 2 | positive regulation of vitamin D receptor signaling pathway |
| GO:0019254 | 0.0095 | 159.7347 | 0.0096 | 1 | 3 | carnitine metabolic process, CoA-linked |
| GO:0042560 | 0.0095 | 159.7347 | 0.0096 | 1 | 3 | pteridine-containing compound catabolic process |
| GO:1904117 | 0.0095 | 159.7347 | 0.0096 | 1 | 3 | cellular response to vasopressin |
| GOMFID | Pvalue | OddsRatio | ExpCount | Count | Size | Term |
| GO:0005515 | 0.0016 | 2.6741 | 37.2881 | 48 | 10125 | protein binding |
| GO:0000822 | 0.0037 | Inf | 0.0037 | 1 | 1 | inositol hexakisphosphate binding |
| GO:0042922 | 0.0037 | Inf | 0.0037 | 1 | 1 | neuromedin U receptor binding |
| GO:0008193 | 0.0074 | 275.2632 | 0.0074 | 1 | 2 | tRNA guanylyltransferase activity |
| GO:0016796 | 0.01 | 14.3333 | 0.151 | 2 | 41 | exonuclease activity, active with either ribo- or deoxyribonucleic acids and producing 5'-phosphomonoesters |
| GOMFID | Pvalue | OddsRatio | ExpCount | Count | Size | Term |
| GO:0015320 | 0.0038 | Inf | 0.0038 | 1 | 1 | phosphate ion carrier activity |
| GO:0018455 | 0.0038 | Inf | 0.0038 | 1 | 1 | alcohol dehydrogenase [NAD(P)+] activity |
| GO:0000175 | 0.004 | 23.4873 | 0.0952 | 2 | 25 | 3'-5'-exoribonuclease activity |
| GO:0004532 | 0.0054 | 20.0026 | 0.1105 | 2 | 29 | exoribonuclease activity |
| GO:0004483 | 0.0076 | 265.8983 | 0.0076 | 1 | 2 | mRNA (nucleoside-2'-O-)-methyltransferase activity |
| GO:0004609 | 0.0076 | 265.8983 | 0.0076 | 1 | 2 | phosphatidylserine decarboxylase activity |
| GO:0019828 | 0.0076 | 265.8983 | 0.0076 | 1 | 2 | aspartic-type endopeptidase inhibitor activity |
| GO:0047708 | 0.0076 | 265.8983 | 0.0076 | 1 | 2 | biotinidase activity |
| GOMFID | Pvalue | OddsRatio | ExpCount | Count | Size | Term |
| GO:0005289 | 0.0034 | Inf | 0.0034 | 1 | 1 | high-affinity arginine transmembrane transporter activity |
| GO:0005292 | 0.0034 | Inf | 0.0034 | 1 | 1 | high-affinity lysine transmembrane transporter activity |
| GO:0008488 | 0.0034 | Inf | 0.0034 | 1 | 1 | gamma-glutamyl carboxylase activity |
| GO:0015112 | 0.0034 | Inf | 0.0034 | 1 | 1 | nitrate transmembrane transporter activity |
| GO:0097626 | 0.0034 | Inf | 0.0034 | 1 | 1 | low-affinity L-arginine transmembrane transporter activity |
| GO:0097627 | 0.0034 | Inf | 0.0034 | 1 | 1 | high-affinity L-ornithine transmembrane transporter activity |
| GO:0003938 | 0.0067 | 301.8269 | 0.0067 | 1 | 2 | IMP dehydrogenase activity |
| GO:0004572 | 0.0067 | 301.8269 | 0.0067 | 1 | 2 | mannosyl-oligosaccharide 1,3-1,6-alpha-mannosidase activity |
| GO:0004906 | 0.0067 | 301.8269 | 0.0067 | 1 | 2 | interferon-gamma receptor activity |
| GO:0015485 | 0.0069 | 17.5473 | 0.1245 | 2 | 37 | cholesterol binding |
| GOMFID | Pvalue | OddsRatio | ExpCount | Count | Size | Term |
| GO:0004502 | 0.0023 | Inf | 0.0023 | 1 | 1 | kynurenine 3-monooxygenase activity |
| GO:0005302 | 0.0023 | Inf | 0.0023 | 1 | 1 | L-tyrosine transmembrane transporter activity |
| GO:0050038 | 0.0023 | Inf | 0.0023 | 1 | 1 | L-xylulose reductase (NADP+) activity |
| GO:0070774 | 0.0023 | Inf | 0.0023 | 1 | 1 | phytoceramidase activity |
| GO:0032403 | 0.0039 | 3.9728 | 2.0733 | 7 | 907 | protein complex binding |
| GO:0001135 | 0.0046 | 448.9143 | 0.0046 | 1 | 2 | transcription factor activity, RNA polymerase II transcription factor recruiting |
| GO:0005146 | 0.0046 | 448.9143 | 0.0046 | 1 | 2 | leukemia inhibitory factor receptor binding |
| GO:0030674 | 0.0047 | 9.693 | 0.3406 | 3 | 149 | protein binding, bridging |
| GO:0031852 | 0.0068 | 224.4429 | 0.0069 | 1 | 3 | mu-type opioid receptor binding |
| GO:0032564 | 0.0068 | 224.4429 | 0.0069 | 1 | 3 | dATP binding |
| GO:0016811 | 0.0085 | 15.6072 | 0.1394 | 2 | 61 | hydrolase activity, acting on carbon-nitrogen (but not peptide) bonds, in linear amides |
| GO:0032554 | 0.0091 | 149.619 | 0.0091 | 1 | 4 | purine deoxyribonucleotide binding |
| GO:1904288 | 0.0091 | 149.619 | 0.0091 | 1 | 4 | BAT3 complex binding |
| GO:0032947 | 0.0099 | 14.3833 | 0.1509 | 2 | 66 | protein complex scaffold |
| GOMFID | Pvalue | OddsRatio | ExpCount | Count | Size | Term |
| GO:0000225 | 0.0036 | Inf | 0.0036 | 1 | 1 | N-acetylglucosaminylphosphatidylinositol deacetylase activity |
| GO:0004139 | 0.0036 | Inf | 0.0036 | 1 | 1 | deoxyribose-phosphate aldolase activity |
| GO:0004155 | 0.0036 | Inf | 0.0036 | 1 | 1 | 6,7-dihydropteridine reductase activity |
| GO:0008265 | 0.0036 | Inf | 0.0036 | 1 | 1 | Mo-molybdopterin cofactor sulfurase activity |
| GO:0070404 | 0.0036 | Inf | 0.0036 | 1 | 1 | NADH binding |
| GO:0001042 | 0.0071 | 285.3091 | 0.0071 | 1 | 2 | RNA polymerase I core binding |
| GO:0004831 | 0.0071 | 285.3091 | 0.0071 | 1 | 2 | tyrosine-tRNA ligase activity |
| GO:0005153 | 0.0071 | 285.3091 | 0.0071 | 1 | 2 | interleukin-8 receptor binding |
| GO:0016404 | 0.0071 | 285.3091 | 0.0071 | 1 | 2 | 15-hydroxyprostaglandin dehydrogenase (NAD+) activity |
| GO:0035243 | 0.0071 | 285.3091 | 0.0071 | 1 | 2 | protein-arginine omega-N symmetric methyltransferase activity |
| GO:0003954 | 0.0076 | 16.5693 | 0.1316 | 2 | 37 | NADH dehydrogenase activity |
| GO:0008137 | 0.0076 | 16.5693 | 0.1316 | 2 | 37 | NADH dehydrogenase (ubiquinone) activity |
| GOMFID | Pvalue | OddsRatio | ExpCount | Count | Size | Term |
| GO:0016301 | 0.0033 | 3.5962 | 2.5099 | 8 | 732 | kinase activity |
| GO:0003975 | 0.0034 | Inf | 0.0034 | 1 | 1 | UDP-N-acetylglucosamine-dolichyl-phosphate N-acetylglucosaminephosphotransferase activity |
| GO:0008963 | 0.0034 | Inf | 0.0034 | 1 | 1 | phospho-N-acetylmuramoyl-pentapeptide-transferase activity |
| GO:0035755 | 0.0034 | Inf | 0.0034 | 1 | 1 | cardiolipin hydrolase activity |
| GO:0097161 | 0.0034 | Inf | 0.0034 | 1 | 1 | DH domain binding |
| GO:0031369 | 0.0036 | 25.1138 | 0.0891 | 2 | 26 | translation initiation factor binding |
| GO:0008808 | 0.0068 | 296.1132 | 0.0069 | 1 | 2 | cardiolipin synthase activity |
| GO:0052629 | 0.0068 | 296.1132 | 0.0069 | 1 | 2 | phosphatidylinositol-3,5-bisphosphate 3-phosphatase activity |
| GO:0016773 | 0.0077 | 3.3662 | 2.3041 | 7 | 672 | phosphotransferase activity, alcohol group as acceptor |
| GO:0016772 | 0.0086 | 7.6661 | 0.4228 | 3 | 138 | transferase activity, transferring phosphorus-containing groups |
| GOMFID | Pvalue | OddsRatio | ExpCount | Count | Size | Term |
| GO:0004709 | 0.0035 | 25.4367 | 0.0884 | 2 | 24 | MAP kinase kinase kinase activity |
| GO:0005289 | 0.0037 | Inf | 0.0037 | 1 | 1 | high-affinity arginine transmembrane transporter activity |
| GO:0005292 | 0.0037 | Inf | 0.0037 | 1 | 1 | high-affinity lysine transmembrane transporter activity |
| GO:0097626 | 0.0037 | Inf | 0.0037 | 1 | 1 | low-affinity L-arginine transmembrane transporter activity |
| GO:0097627 | 0.0037 | Inf | 0.0037 | 1 | 1 | high-affinity L-ornithine transmembrane transporter activity |
| GO:0043167 | 0.0062 | 1.9992 | 21.1944 | 31 | 5755 | ion binding |
| GO:0004382 | 0.0074 | 275.2632 | 0.0074 | 1 | 2 | guanosine-diphosphatase activity |
| GO:0004583 | 0.0074 | 275.2632 | 0.0074 | 1 | 2 | dolichyl-phosphate-glucose-glycolipid alpha-glucosyltransferase activity |
| GO:0004906 | 0.0074 | 275.2632 | 0.0074 | 1 | 2 | interferon-gamma receptor activity |
| GO:0015489 | 0.0074 | 275.2632 | 0.0074 | 1 | 2 | putrescine transmembrane transporter activity |
| GOMFID | Pvalue | OddsRatio | ExpCount | Count | Size | Term |
| GO:0048156 | 6e-04 | 68.3529 | 0.037 | 2 | 11 | tau protein binding |
| GO:0043167 | 9e-04 | 2.4548 | 19.3673 | 31 | 5755 | ion binding |
| GO:0004990 | 0.0034 | Inf | 0.0034 | 1 | 1 | oxytocin receptor activity |
| GO:0046911 | 0.0034 | Inf | 0.0034 | 1 | 1 | metal chelating activity |
| GO:0070524 | 0.0034 | Inf | 0.0034 | 1 | 1 | 11-beta-hydroxysteroid dehydrogenase (NADP+) activity |
| GO:0097161 | 0.0034 | Inf | 0.0034 | 1 | 1 | DH domain binding |
| GO:0005154 | 0.0046 | 21.944 | 0.101 | 2 | 30 | epidermal growth factor receptor binding |
| GO:0003845 | 0.0067 | 301.8269 | 0.0067 | 1 | 2 | 11-beta-hydroxysteroid dehydrogenase [NAD(P)] activity |
| GO:0004372 | 0.0067 | 301.8269 | 0.0067 | 1 | 2 | glycine hydroxymethyltransferase activity |
| GO:0008732 | 0.0067 | 301.8269 | 0.0067 | 1 | 2 | L-allo-threonine aldolase activity |
| GOMFID | Pvalue | OddsRatio | ExpCount | Count | Size | Term |
| GO:0008783 | 0.0034 | Inf | 0.0034 | 1 | 1 | agmatinase activity |
| GO:0030366 | 0.0034 | Inf | 0.0034 | 1 | 1 | molybdopterin synthase activity |
| GO:0033823 | 0.0034 | Inf | 0.0034 | 1 | 1 | procollagen glucosyltransferase activity |
| GO:0052917 | 0.0034 | Inf | 0.0034 | 1 | 1 | dol-P-Man:Man(7)GlcNAc(2)-PP-Dol alpha-1,6-mannosyltransferase activity |
| GO:0046966 | 0.0043 | 22.7582 | 0.0976 | 2 | 29 | thyroid hormone receptor binding |
| GO:0030546 | 0.0049 | 21.1859 | 0.1043 | 2 | 31 | receptor activator activity |
| GO:0004450 | 0.0067 | 301.8269 | 0.0067 | 1 | 2 | isocitrate dehydrogenase (NADP+) activity |
| GO:0015616 | 0.0067 | 301.8269 | 0.0067 | 1 | 2 | DNA translocase activity |
| GO:0016422 | 0.0067 | 301.8269 | 0.0067 | 1 | 2 | mRNA (2'-O-methyladenosine-N6-)-methyltransferase activity |
| GO:0071633 | 0.0067 | 301.8269 | 0.0067 | 1 | 2 | dihydroceramidase activity |
| GOMFID | Pvalue | OddsRatio | ExpCount | Count | Size | Term |
| GO:0061631 | 2e-04 | 33.1843 | 0.1063 | 3 | 27 | ubiquitin conjugating enzyme activity |
| GO:0046977 | 3e-04 | 104.5467 | 0.0276 | 2 | 7 | TAP binding |
| GO:0003995 | 0.0018 | 37.3167 | 0.063 | 2 | 16 | acyl-CoA dehydrogenase activity |
| GO:0052890 | 0.0018 | 37.3167 | 0.063 | 2 | 16 | oxidoreductase activity, acting on the CH-CH group of donors, with a flavin as acceptor |
| GO:0018455 | 0.0039 | Inf | 0.0039 | 1 | 1 | alcohol dehydrogenase [NAD(P)+] activity |
| GO:0042605 | 0.004 | 23.7348 | 0.0945 | 2 | 24 | peptide antigen binding |
| GO:0000062 | 0.0066 | 17.9977 | 0.122 | 2 | 31 | fatty-acyl-CoA binding |
| GO:0003875 | 0.0079 | 257.1475 | 0.0079 | 1 | 2 | ADP-ribosylarginine hydrolase activity |
| GO:0009055 | 0.0086 | 7.6188 | 0.4212 | 3 | 107 | electron carrier activity |
| GO:0000166 | 0.0091 | 2.1666 | 8.6058 | 16 | 2186 | nucleotide binding |
| GOMFID | Pvalue | OddsRatio | ExpCount | Count | Size | Term |
| GO:0017111 | 0.0015 | 3.7169 | 2.7384 | 9 | 707 | nucleoside-triphosphatase activity |
| GO:0016818 | 0.0022 | 3.4962 | 2.9011 | 9 | 749 | hydrolase activity, acting on acid anhydrides, in phosphorus-containing anhydrides |
| GO:0003777 | 0.0029 | 11.3771 | 0.2866 | 3 | 74 | microtubule motor activity |
| GO:0008092 | 0.003 | 3.335 | 3.0328 | 9 | 783 | cytoskeletal protein binding |
| GO:0035639 | 0.005 | 2.4591 | 6.6194 | 14 | 1709 | purine ribonucleoside triphosphate binding |
| GO:0032550 | 0.0052 | 2.4429 | 6.6581 | 14 | 1719 | purine ribonucleoside binding |
| GO:0001882 | 0.0055 | 2.4285 | 6.693 | 14 | 1728 | nucleoside binding |
| GO:0044877 | 0.0057 | 2.5842 | 5.3064 | 12 | 1370 | macromolecular complex binding |
| GO:0032555 | 0.0061 | 2.394 | 6.7782 | 14 | 1750 | purine ribonucleotide binding |
| GO:0000166 | 0.0077 | 2.2149 | 8.467 | 16 | 2186 | nucleotide binding |
| GO:0003845 | 0.0077 | 261.45 | 0.0077 | 1 | 2 | 11-beta-hydroxysteroid dehydrogenase [NAD(P)] activity |
| GO:0004809 | 0.0077 | 261.45 | 0.0077 | 1 | 2 | tRNA (guanine-N2-)-methyltransferase activity |
| GO:0005006 | 0.0077 | 261.45 | 0.0077 | 1 | 2 | epidermal growth factor-activated receptor activity |
| GO:0047389 | 0.0077 | 261.45 | 0.0077 | 1 | 2 | glycerophosphocholine phosphodiesterase activity |
| GOMFID | Pvalue | OddsRatio | ExpCount | Count | Size | Term |
| GO:0004476 | 0.0034 | Inf | 0.0034 | 1 | 1 | mannose-6-phosphate isomerase activity |
| GO:0004729 | 0.0034 | Inf | 0.0034 | 1 | 1 | oxygen-dependent protoporphyrinogen oxidase activity |
| GO:0005367 | 0.0034 | Inf | 0.0034 | 1 | 1 | myo-inositol:sodium symporter activity |
| GO:0008404 | 0.0034 | Inf | 0.0034 | 1 | 1 | arachidonic acid 14,15-epoxygenase activity |
| GO:0008405 | 0.0034 | Inf | 0.0034 | 1 | 1 | arachidonic acid 11,12-epoxygenase activity |
| GO:0047066 | 0.0034 | Inf | 0.0034 | 1 | 1 | phospholipid-hydroperoxide glutathione peroxidase activity |
| GO:0071614 | 0.0034 | Inf | 0.0034 | 1 | 1 | linoleic acid epoxygenase activity |
| GO:0043167 | 0.0052 | 2.1039 | 19.3673 | 29 | 5755 | ion binding |
| GO:0004817 | 0.0067 | 301.8269 | 0.0067 | 1 | 2 | cysteine-tRNA ligase activity |
| GO:0008521 | 0.0067 | 301.8269 | 0.0067 | 1 | 2 | acetyl-CoA transporter activity |
| GO:0016603 | 0.0067 | 301.8269 | 0.0067 | 1 | 2 | glutaminyl-peptide cyclotransferase activity |
| GO:0032767 | 0.0067 | 301.8269 | 0.0067 | 1 | 2 | copper-dependent protein binding |
| GO:0034485 | 0.0067 | 301.8269 | 0.0067 | 1 | 2 | phosphatidylinositol-3,4,5-trisphosphate 5-phosphatase activity |
| GO:0051500 | 0.0067 | 301.8269 | 0.0067 | 1 | 2 | D-tyrosyl-tRNA(Tyr) deacylase activity |
| GOMFID | Pvalue | OddsRatio | ExpCount | Count | Size | Term |
| GO:0004729 | 0.0035 | Inf | 0.0035 | 1 | 1 | oxygen-dependent protoporphyrinogen oxidase activity |
| GO:0008783 | 0.0035 | Inf | 0.0035 | 1 | 1 | agmatinase activity |
| GO:0030791 | 0.0035 | Inf | 0.0035 | 1 | 1 | arsenite methyltransferase activity |
| GO:0030792 | 0.0035 | Inf | 0.0035 | 1 | 1 | methylarsonite methyltransferase activity |
| GO:0003868 | 0.007 | 290.6111 | 0.007 | 1 | 2 | 4-hydroxyphenylpyruvate dioxygenase activity |
| GO:0008193 | 0.007 | 290.6111 | 0.007 | 1 | 2 | tRNA guanylyltransferase activity |
| GO:0015218 | 0.007 | 290.6111 | 0.007 | 1 | 2 | pyrimidine nucleotide transmembrane transporter activity |
| GO:0032767 | 0.007 | 290.6111 | 0.007 | 1 | 2 | copper-dependent protein binding |
| GO:0033872 | 0.007 | 290.6111 | 0.007 | 1 | 2 | [heparan sulfate]-glucosamine 3-sulfotransferase 3 activity |
| GOMFID | Pvalue | OddsRatio | ExpCount | Count | Size | Term |
| GO:0004693 | 2e-04 | 32.2325 | 0.1086 | 3 | 30 | cyclin-dependent protein serine/threonine kinase activity |
| GO:0004587 | 0.0036 | Inf | 0.0036 | 1 | 1 | ornithine-oxo-acid transaminase activity |
| GO:0004655 | 0.0036 | Inf | 0.0036 | 1 | 1 | porphobilinogen synthase activity |
| GO:0004964 | 0.0036 | Inf | 0.0036 | 1 | 1 | luteinizing hormone receptor activity |
| GO:0005367 | 0.0036 | Inf | 0.0036 | 1 | 1 | myo-inositol:sodium symporter activity |
| GO:0008609 | 0.0036 | Inf | 0.0036 | 1 | 1 | alkylglycerone-phosphate synthase activity |
| GO:0018455 | 0.0036 | Inf | 0.0036 | 1 | 1 | alcohol dehydrogenase [NAD(P)+] activity |
| GO:0032791 | 0.0036 | Inf | 0.0036 | 1 | 1 | lead ion binding |
| GO:0035472 | 0.0036 | Inf | 0.0036 | 1 | 1 | choriogonadotropin hormone receptor activity |
| GO:0038106 | 0.0036 | Inf | 0.0036 | 1 | 1 | choriogonadotropin hormone binding |
| GO:0046911 | 0.0036 | Inf | 0.0036 | 1 | 1 | metal chelating activity |
| GO:0005524 | 0.0038 | 2.7503 | 5.0634 | 12 | 1399 | ATP binding |
| GO:0030554 | 0.0048 | 2.6616 | 5.2154 | 12 | 1441 | adenyl nucleotide binding |
| GO:0017098 | 0.0072 | 280.1964 | 0.0072 | 1 | 2 | sulfonylurea receptor binding |
| GO:0034485 | 0.0072 | 280.1964 | 0.0072 | 1 | 2 | phosphatidylinositol-3,4,5-trisphosphate 5-phosphatase activity |
| GO:0001883 | 0.0075 | 2.4174 | 6.2324 | 13 | 1722 | purine nucleoside binding |
| GO:0032549 | 0.0075 | 2.4174 | 6.2324 | 13 | 1722 | ribonucleoside binding |
| GO:0032555 | 0.0085 | 2.3737 | 6.3337 | 13 | 1750 | purine ribonucleotide binding |
| GO:0000166 | 0.0094 | 2.2243 | 7.9117 | 15 | 2186 | nucleotide binding |
| GOMFID | Pvalue | OddsRatio | ExpCount | Count | Size | Term |
| GO:0038051 | 0.0036 | Inf | 0.0036 | 1 | 1 | glucocorticoid-activated RNA polymerase II transcription factor binding transcription factor activity |
| GO:0050146 | 0.0036 | Inf | 0.0036 | 1 | 1 | nucleoside phosphotransferase activity |
| GO:0031732 | 0.0071 | 285.3091 | 0.0071 | 1 | 2 | CCR7 chemokine receptor binding |
| GO:0036132 | 0.0071 | 285.3091 | 0.0071 | 1 | 2 | 13-prostaglandin reductase activity |
| GO:0047522 | 0.0071 | 285.3091 | 0.0071 | 1 | 2 | 15-oxoprostaglandin 13-oxidase activity |
| GO:0052739 | 0.0071 | 285.3091 | 0.0071 | 1 | 2 | phosphatidylserine 1-acylhydrolase activity |
| GO:0052740 | 0.0071 | 285.3091 | 0.0071 | 1 | 2 | 1-acyl-2-lysophosphatidylserine acylhydrolase activity |
| GO:0042578 | 0.0072 | 4.4673 | 1.2161 | 5 | 342 | phosphoric ester hydrolase activity |
| GOMFID | Pvalue | OddsRatio | ExpCount | Count | Size | Term |
| GO:0004594 | 0 | 383.0244 | 0.0109 | 2 | 4 | pantothenate kinase activity |
| GO:0042356 | 0.0027 | Inf | 0.0027 | 1 | 1 | GDP-4-dehydro-D-rhamnose reductase activity |
| GO:0050577 | 0.0027 | Inf | 0.0027 | 1 | 1 | GDP-L-fucose synthase activity |
| GO:0051267 | 0.0027 | Inf | 0.0027 | 1 | 1 | CP2 mannose-ethanolamine phosphotransferase activity |
| GO:0031625 | 0.0044 | 6.5539 | 0.6717 | 4 | 246 | ubiquitin protein ligase binding |
| GO:0001729 | 0.0055 | 373.9286 | 0.0055 | 1 | 2 | ceramide kinase activity |
| GO:0004450 | 0.0055 | 373.9286 | 0.0055 | 1 | 2 | isocitrate dehydrogenase (NADP+) activity |
| GO:0004776 | 0.0055 | 373.9286 | 0.0055 | 1 | 2 | succinate-CoA ligase (GDP-forming) activity |
| GO:1990460 | 0.0082 | 186.9524 | 0.0082 | 1 | 3 | leptin receptor binding |
| GOMFID | Pvalue | OddsRatio | ExpCount | Count | Size | Term |
| GO:0001069 | 0.0035 | Inf | 0.0035 | 1 | 1 | regulatory region RNA binding |
| GO:0003947 | 0.0035 | Inf | 0.0035 | 1 | 1 | (N-acetylneuraminyl)-galactosylglucosylceramide N-acetylgalactosaminyltransferase activity |
| GO:0008437 | 0.0035 | Inf | 0.0035 | 1 | 1 | thyrotropin-releasing hormone activity |
| GO:0015405 | 0.0064 | 8.5654 | 0.3772 | 3 | 108 | P-P-bond-hydrolysis-driven transmembrane transporter activity |
| GO:0004449 | 0.007 | 290.6111 | 0.007 | 1 | 2 | isocitrate dehydrogenase (NAD+) activity |
| GO:0004830 | 0.007 | 290.6111 | 0.007 | 1 | 2 | tryptophan-tRNA ligase activity |
| GO:0017046 | 0.007 | 17.3807 | 0.1257 | 2 | 36 | peptide hormone binding |
| GO:0003954 | 0.0074 | 16.883 | 0.1292 | 2 | 37 | NADH dehydrogenase activity |
| GO:0008137 | 0.0074 | 16.883 | 0.1292 | 2 | 37 | NADH dehydrogenase (ubiquinone) activity |
| GOMFID | Pvalue | OddsRatio | ExpCount | Count | Size | Term |
| GO:0004550 | 0.0015 | 40.9961 | 0.0572 | 2 | 17 | nucleoside diphosphate kinase activity |
| GO:0004055 | 0.0034 | Inf | 0.0034 | 1 | 1 | argininosuccinate synthase activity |
| GO:0004395 | 0.0034 | Inf | 0.0034 | 1 | 1 | hexaprenyldihydroxybenzoate methyltransferase activity |
| GO:0008169 | 0.0034 | Inf | 0.0034 | 1 | 1 | C-methyltransferase activity |
| GO:0008425 | 0.0034 | Inf | 0.0034 | 1 | 1 | 2-polyprenyl-6-methoxy-1,4-benzoquinone methyltransferase activity |
| GO:0008689 | 0.0034 | Inf | 0.0034 | 1 | 1 | 3-demethylubiquinone-9 3-O-methyltransferase activity |
| GO:0030272 | 0.0034 | Inf | 0.0034 | 1 | 1 | 5-formyltetrahydrofolate cyclo-ligase activity |
| GO:0005525 | 0.0057 | 4.7619 | 1.1476 | 5 | 341 | GTP binding |
| GO:0043168 | 0.0066 | 2.2967 | 8.4233 | 16 | 2503 | anion binding |
| GO:0015489 | 0.0067 | 301.8269 | 0.0067 | 1 | 2 | putrescine transmembrane transporter activity |
| GO:0031755 | 0.0067 | 301.8269 | 0.0067 | 1 | 2 | Edg-2 lysophosphatidic acid receptor binding |
| GO:0045145 | 0.0067 | 301.8269 | 0.0067 | 1 | 2 | single-stranded DNA 5'-3' exodeoxyribonuclease activity |
| GO:0045523 | 0.0067 | 301.8269 | 0.0067 | 1 | 2 | interleukin-27 receptor binding |
| GO:0019001 | 0.007 | 4.5145 | 1.2081 | 5 | 359 | guanyl nucleotide binding |
| GO:0097367 | 0.0085 | 2.3292 | 7.1008 | 14 | 2110 | carbohydrate derivative binding |
| GOMFID | Pvalue | OddsRatio | ExpCount | Count | Size | Term |
| GO:0005046 | 0.0042 | 491.0938 | 0.0042 | 1 | 2 | KDEL sequence binding |
| GO:0032089 | 0.0042 | 491.0938 | 0.0042 | 1 | 2 | NACHT domain binding |
| GO:0051377 | 0.0063 | 245.5312 | 0.0063 | 1 | 3 | mannose-ethanolamine phosphotransferase activity |
| GOMFID | Pvalue | OddsRatio | ExpCount | Count | Size | Term |
| GO:0004476 | 0.003 | Inf | 0.003 | 1 | 1 | mannose-6-phosphate isomerase activity |
| GO:0004502 | 0.003 | Inf | 0.003 | 1 | 1 | kynurenine 3-monooxygenase activity |
| GO:0008116 | 0.003 | Inf | 0.003 | 1 | 1 | prostaglandin-I synthase activity |
| GO:0019778 | 0.003 | Inf | 0.003 | 1 | 1 | Atg12 activating enzyme activity |
| GO:0019779 | 0.003 | Inf | 0.003 | 1 | 1 | Atg8 activating enzyme activity |
| GO:0016874 | 0.0053 | 4.8657 | 1.134 | 5 | 380 | ligase activity |
| GO:0070573 | 0.006 | 341.3261 | 0.006 | 1 | 2 | metallodipeptidase activity |
| GO:0016706 | 0.0063 | 18.3205 | 0.1194 | 2 | 40 | oxidoreductase activity, acting on paired donors, with incorporation or reduction of molecular oxygen, 2-oxoglutarate as one donor, and incorporation of one atom each of oxygen into both donors |
| GO:0004814 | 0.0089 | 170.6522 | 0.009 | 1 | 3 | arginine-tRNA ligase activity |
| GO:0031852 | 0.0089 | 170.6522 | 0.009 | 1 | 3 | mu-type opioid receptor binding |
| GO:0050816 | 0.0089 | 170.6522 | 0.009 | 1 | 3 | phosphothreonine binding |
| GO:0016853 | 0.0096 | 7.3665 | 0.4387 | 3 | 147 | isomerase activity |
| GOMFID | Pvalue | OddsRatio | ExpCount | Count | Size | Term |
| GO:0015055 | 0.0028 | Inf | 0.0028 | 1 | 1 | secretin receptor activity |
| GO:0016409 | 0.0038 | 24.0768 | 0.0922 | 2 | 33 | palmitoyltransferase activity |
| GO:0032089 | 0.0056 | 365.2093 | 0.0056 | 1 | 2 | NACHT domain binding |
| GO:0072320 | 0.0056 | 365.2093 | 0.0056 | 1 | 2 | volume-sensitive chloride channel activity |
| GOMFID | Pvalue | OddsRatio | ExpCount | Count | Size | Term |
| GO:0003735 | 0.0027 | 7.5544 | 0.5819 | 4 | 195 | structural constituent of ribosome |
| GO:0003870 | 0.003 | Inf | 0.003 | 1 | 1 | 5-aminolevulinate synthase activity |
| GO:0004796 | 0.003 | Inf | 0.003 | 1 | 1 | thromboxane-A synthase activity |
| GO:0050201 | 0.003 | Inf | 0.003 | 1 | 1 | fucokinase activity |
| GO:1990275 | 0.003 | Inf | 0.003 | 1 | 1 | preribosome binding |
| GO:0005153 | 0.006 | 341.3261 | 0.006 | 1 | 2 | interleukin-8 receptor binding |
| GO:0015218 | 0.006 | 341.3261 | 0.006 | 1 | 2 | pyrimidine nucleotide transmembrane transporter activity |
| GO:0016748 | 0.006 | 341.3261 | 0.006 | 1 | 2 | succinyltransferase activity |
| GO:0019797 | 0.0089 | 170.6522 | 0.009 | 1 | 3 | procollagen-proline 3-dioxygenase activity |
| GO:0032564 | 0.0089 | 170.6522 | 0.009 | 1 | 3 | dATP binding |
| GO:0008009 | 0.009 | 15.1266 | 0.1432 | 2 | 48 | chemokine activity |
| GOMFID | Pvalue | OddsRatio | ExpCount | Count | Size | Term |
| GO:0072509 | 0.0021 | 8.0248 | 0.544 | 4 | 153 | divalent inorganic cation transmembrane transporter activity |
| GO:0043021 | 0.0033 | 10.9099 | 0.2987 | 3 | 84 | ribonucleoprotein complex binding |
| GO:0030272 | 0.0036 | Inf | 0.0036 | 1 | 1 | 5-formyltetrahydrofolate cyclo-ligase activity |
| GO:0042922 | 0.0036 | Inf | 0.0036 | 1 | 1 | neuromedin U receptor binding |
| GO:1990829 | 0.0036 | Inf | 0.0036 | 1 | 1 | C-rich single-stranded DNA binding |
| GO:0016597 | 0.0047 | 9.5986 | 0.3378 | 3 | 95 | amino acid binding |
| GO:0043168 | 0.0049 | 2.3157 | 8.9001 | 17 | 2503 | anion binding |
| GO:0005547 | 0.0051 | 20.7209 | 0.1067 | 2 | 30 | phosphatidylinositol-3,4,5-trisphosphate binding |
| GO:0004775 | 0.0071 | 285.3091 | 0.0071 | 1 | 2 | succinate-CoA ligase (ADP-forming) activity |
| GO:0004776 | 0.0071 | 285.3091 | 0.0071 | 1 | 2 | succinate-CoA ligase (GDP-forming) activity |
| GO:0004822 | 0.0071 | 285.3091 | 0.0071 | 1 | 2 | isoleucine-tRNA ligase activity |
| GO:0016403 | 0.0071 | 285.3091 | 0.0071 | 1 | 2 | dimethylargininase activity |
| GO:0043812 | 0.0071 | 285.3091 | 0.0071 | 1 | 2 | phosphatidylinositol-4-phosphate phosphatase activity |
| GO:1990715 | 0.0071 | 285.3091 | 0.0071 | 1 | 2 | mRNA CDS binding |
| GOMFID | Pvalue | OddsRatio | ExpCount | Count | Size | Term |
| GO:0003870 | 0.0036 | Inf | 0.0036 | 1 | 1 | 5-aminolevulinate synthase activity |
| GO:0005139 | 0.0036 | Inf | 0.0036 | 1 | 1 | interleukin-7 receptor binding |
| GO:0017061 | 0.0036 | Inf | 0.0036 | 1 | 1 | S-methyl-5-thioadenosine phosphorylase activity |
| GO:0070984 | 0.0036 | Inf | 0.0036 | 1 | 1 | SET domain binding |
| GO:0046966 | 0.0049 | 21.0976 | 0.105 | 2 | 29 | thyroid hormone receptor binding |
| GO:0019900 | 0.0051 | 3.6477 | 2.1245 | 7 | 587 | kinase binding |
| GO:0008378 | 0.0063 | 18.3707 | 0.1194 | 2 | 33 | galactosyltransferase activity |
| GO:0004109 | 0.0072 | 280.1964 | 0.0072 | 1 | 2 | coproporphyrinogen oxidase activity |
| GO:0015489 | 0.0072 | 280.1964 | 0.0072 | 1 | 2 | putrescine transmembrane transporter activity |
| GO:0016748 | 0.0072 | 280.1964 | 0.0072 | 1 | 2 | succinyltransferase activity |
| GO:0032810 | 0.0072 | 280.1964 | 0.0072 | 1 | 2 | sterol response element binding |
| GOMFID | Pvalue | OddsRatio | ExpCount | Count | Size | Term |
| GO:0004343 | 0.004 | Inf | 0.004 | 1 | 1 | glucosamine 6-phosphate N-acetyltransferase activity |
| GO:0050146 | 0.004 | Inf | 0.004 | 1 | 1 | nucleoside phosphotransferase activity |
| GO:0051267 | 0.004 | Inf | 0.004 | 1 | 1 | CP2 mannose-ethanolamine phosphotransferase activity |
| GO:0004658 | 0.008 | 252.9839 | 0.008 | 1 | 2 | propionyl-CoA carboxylase activity |
| GO:0016534 | 0.008 | 252.9839 | 0.008 | 1 | 2 | cyclin-dependent protein kinase 5 activator activity |
| GO:0036505 | 0.008 | 252.9839 | 0.008 | 1 | 2 | prosaposin receptor activity |
| GOMFID | Pvalue | OddsRatio | ExpCount | Count | Size | Term |
| GO:0005484 | 2e-04 | 28.7941 | 0.1198 | 3 | 37 | SNAP receptor activity |
| GO:0050780 | 0.0012 | 45.7259 | 0.0518 | 2 | 16 | dopamine receptor binding |
| GO:0004819 | 0.0032 | Inf | 0.0032 | 1 | 1 | glutamine-tRNA ligase activity |
| GO:0008116 | 0.0032 | Inf | 0.0032 | 1 | 1 | prostaglandin-I synthase activity |
| GO:0019778 | 0.0032 | Inf | 0.0032 | 1 | 1 | Atg12 activating enzyme activity |
| GO:0019779 | 0.0032 | Inf | 0.0032 | 1 | 1 | Atg8 activating enzyme activity |
| GO:0032440 | 0.0032 | Inf | 0.0032 | 1 | 1 | 2-alkenal reductase [NAD(P)] activity |
| GO:0034417 | 0.0032 | Inf | 0.0032 | 1 | 1 | bisphosphoglycerate 3-phosphatase activity |
| GO:0047323 | 0.0032 | Inf | 0.0032 | 1 | 1 | [3-methyl-2-oxobutanoate dehydrogenase (acetyl-transferring)] kinase activity |
| GO:0052826 | 0.0032 | Inf | 0.0032 | 1 | 1 | inositol hexakisphosphate 2-phosphatase activity |
| GO:0000149 | 0.0061 | 8.6975 | 0.3724 | 3 | 115 | SNARE binding |
| GO:0036132 | 0.0065 | 313.94 | 0.0065 | 1 | 2 | 13-prostaglandin reductase activity |
| GO:0047522 | 0.0065 | 313.94 | 0.0065 | 1 | 2 | 15-oxoprostaglandin 13-oxidase activity |
| GO:0008969 | 0.0097 | 156.96 | 0.0097 | 1 | 3 | phosphohistidine phosphatase activity |
| GOMFID | Pvalue | OddsRatio | ExpCount | Count | Size | Term |
| GO:0004134 | 0.0032 | Inf | 0.0032 | 1 | 1 | 4-alpha-glucanotransferase activity |
| GO:0004135 | 0.0032 | Inf | 0.0032 | 1 | 1 | amylo-alpha-1,6-glucosidase activity |
| GO:0004476 | 0.0032 | Inf | 0.0032 | 1 | 1 | mannose-6-phosphate isomerase activity |
| GO:0004492 | 0.0032 | Inf | 0.0032 | 1 | 1 | methylmalonyl-CoA decarboxylase activity |
| GO:0047545 | 0.0032 | Inf | 0.0032 | 1 | 1 | 2-hydroxyglutarate dehydrogenase activity |
| GO:0003938 | 0.0063 | 320.3673 | 0.0063 | 1 | 2 | IMP dehydrogenase activity |
| GO:0004315 | 0.0063 | 320.3673 | 0.0063 | 1 | 2 | 3-oxoacyl-[acyl-carrier-protein] synthase activity |
| GO:0004830 | 0.0063 | 320.3673 | 0.0063 | 1 | 2 | tryptophan-tRNA ligase activity |
| GO:0043812 | 0.0063 | 320.3673 | 0.0063 | 1 | 2 | phosphatidylinositol-4-phosphate phosphatase activity |
| GO:0048408 | 0.0063 | 320.3673 | 0.0063 | 1 | 2 | epidermal growth factor binding |
| GO:0097200 | 0.0095 | 160.1735 | 0.0095 | 1 | 3 | cysteine-type endopeptidase activity involved in execution phase of apoptosis |
| GOMFID | Pvalue | OddsRatio | ExpCount | Count | Size | Term |
| GO:0015095 | 6e-04 | 66.766 | 0.0373 | 2 | 12 | magnesium ion transmembrane transporter activity |
| GO:0042813 | 0.0017 | 37.0733 | 0.0622 | 2 | 20 | Wnt-activated receptor activity |
| GO:0017137 | 0.0022 | 12.7337 | 0.2582 | 3 | 83 | Rab GTPase binding |
| GO:0004502 | 0.0031 | Inf | 0.0031 | 1 | 1 | kynurenine 3-monooxygenase activity |
| GO:0004686 | 0.0031 | Inf | 0.0031 | 1 | 1 | elongation factor-2 kinase activity |
| GO:0070611 | 0.0031 | Inf | 0.0031 | 1 | 1 | histone methyltransferase activity (H3-R2 specific) |
| GO:0070612 | 0.0031 | Inf | 0.0031 | 1 | 1 | histone methyltransferase activity (H2A-R3 specific) |
| GO:0090450 | 0.0031 | Inf | 0.0031 | 1 | 1 | inosine-diphosphatase activity |
| GO:0097383 | 0.0031 | Inf | 0.0031 | 1 | 1 | dIDP diphosphatase activity |
| GO:1901640 | 0.0031 | Inf | 0.0031 | 1 | 1 | XTP binding |
| GO:1901641 | 0.0031 | Inf | 0.0031 | 1 | 1 | ITP binding |
| GO:0017147 | 0.0039 | 23.8176 | 0.0933 | 2 | 30 | Wnt-protein binding |
| GO:0003990 | 0.0062 | 327.0625 | 0.0062 | 1 | 2 | acetylcholinesterase activity |
| GO:0004047 | 0.0062 | 327.0625 | 0.0062 | 1 | 2 | aminomethyltransferase activity |
| GO:0035870 | 0.0062 | 327.0625 | 0.0062 | 1 | 2 | dITP diphosphatase activity |
| GO:0035241 | 0.0093 | 163.5208 | 0.0093 | 1 | 3 | protein-arginine omega-N monomethyltransferase activity |
| GO:0050072 | 0.0093 | 163.5208 | 0.0093 | 1 | 3 | m7G(5')pppN diphosphatase activity |
| GO:0050897 | 0.0093 | 163.5208 | 0.0093 | 1 | 3 | cobalt ion binding |
| GO:0051959 | 0.0093 | 163.5208 | 0.0093 | 1 | 3 | dynein light intermediate chain binding |
| GO:0097200 | 0.0093 | 163.5208 | 0.0093 | 1 | 3 | cysteine-type endopeptidase activity involved in execution phase of apoptosis |
| GOMFID | Pvalue | OddsRatio | ExpCount | Count | Size | Term |
| GO:0003974 | 0.0032 | Inf | 0.0032 | 1 | 1 | UDP-N-acetylglucosamine 4-epimerase activity |
| GO:0003978 | 0.0032 | Inf | 0.0032 | 1 | 1 | UDP-glucose 4-epimerase activity |
| GO:0018733 | 0.0032 | Inf | 0.0032 | 1 | 1 | 3,4-dihydrocoumarin hydrolase activity |
| GO:0047856 | 0.0032 | Inf | 0.0032 | 1 | 1 | dihydrocoumarin hydrolase activity |
| GO:0050809 | 0.0032 | Inf | 0.0032 | 1 | 1 | diazepam binding |
| GO:0019894 | 0.0055 | 19.7803 | 0.1111 | 2 | 35 | kinesin binding |
| GO:0004063 | 0.0063 | 320.3673 | 0.0063 | 1 | 2 | aryldialkylphosphatase activity |
| GO:0045519 | 0.0063 | 320.3673 | 0.0063 | 1 | 2 | interleukin-23 receptor binding |
| GO:0016796 | 0.0075 | 16.7308 | 0.1302 | 2 | 41 | exonuclease activity, active with either ribo- or deoxyribonucleic acids and producing 5'-phosphomonoesters |
| GO:0008309 | 0.0095 | 160.1735 | 0.0095 | 1 | 3 | double-stranded DNA exodeoxyribonuclease activity |
| GO:0071209 | 0.0095 | 160.1735 | 0.0095 | 1 | 3 | U7 snRNA binding |
| GOMFID | Pvalue | OddsRatio | ExpCount | Count | Size | Term |
| GO:0008267 | 0.0034 | Inf | 0.0034 | 1 | 1 | poly-glutamine tract binding |
| GO:0008238 | 0.0042 | 9.9587 | 0.3264 | 3 | 97 | exopeptidase activity |
| GO:0004739 | 0.0067 | 301.8269 | 0.0067 | 1 | 2 | pyruvate dehydrogenase (acetyl-transferring) activity |
| GOMFID | Pvalue | OddsRatio | ExpCount | Count | Size | Term |
| GO:0004856 | 0.0042 | Inf | 0.0042 | 1 | 1 | xylulokinase activity |
| GO:0008609 | 0.0042 | Inf | 0.0042 | 1 | 1 | alkylglycerone-phosphate synthase activity |
| GO:0019969 | 0.0042 | Inf | 0.0042 | 1 | 1 | interleukin-10 binding |
| GO:0047066 | 0.0042 | Inf | 0.0042 | 1 | 1 | phospholipid-hydroperoxide glutathione peroxidase activity |
| GO:0001147 | 0.0084 | 241.2615 | 0.0084 | 1 | 2 | transcription termination site sequence-specific DNA binding |
| GO:0003868 | 0.0084 | 241.2615 | 0.0084 | 1 | 2 | 4-hydroxyphenylpyruvate dioxygenase activity |
| GO:0004920 | 0.0084 | 241.2615 | 0.0084 | 1 | 2 | interleukin-10 receptor activity |
| GO:0046969 | 0.0084 | 241.2615 | 0.0084 | 1 | 2 | NAD-dependent histone deacetylase activity (H3-K9 specific) |
| GO:0043167 | 0.009 | 1.8501 | 24.1177 | 34 | 5755 | ion binding |
| GOMFID | Pvalue | OddsRatio | ExpCount | Count | Size | Term |
| GO:0061630 | 0.0011 | 7.0243 | 0.7785 | 5 | 183 | ubiquitin protein ligase activity |
| GO:0000979 | 0.0016 | 14.0895 | 0.234 | 3 | 55 | RNA polymerase II core promoter sequence-specific DNA binding |
| GO:0003974 | 0.0043 | Inf | 0.0043 | 1 | 1 | UDP-N-acetylglucosamine 4-epimerase activity |
| GO:0003978 | 0.0043 | Inf | 0.0043 | 1 | 1 | UDP-glucose 4-epimerase activity |
| GO:0004757 | 0.0043 | Inf | 0.0043 | 1 | 1 | sepiapterin reductase activity |
| GO:0031695 | 0.0043 | Inf | 0.0043 | 1 | 1 | alpha-2B adrenergic receptor binding |
| GO:0005488 | 0.0044 | 3.9672 | 56.5261 | 64 | 13287 | binding |
| GO:0008092 | 0.0057 | 2.9888 | 3.3311 | 9 | 783 | cytoskeletal protein binding |
| GO:0061631 | 0.0058 | 19.2702 | 0.1149 | 2 | 27 | ubiquitin conjugating enzyme activity |
| GO:0004693 | 0.0072 | 17.2022 | 0.1276 | 2 | 30 | cyclin-dependent protein serine/threonine kinase activity |
| GO:0031696 | 0.0085 | 237.5909 | 0.0085 | 1 | 2 | alpha-2C adrenergic receptor binding |
| GO:0035034 | 0.0085 | 237.5909 | 0.0085 | 1 | 2 | histone acetyltransferase regulator activity |
| GO:0045519 | 0.0085 | 237.5909 | 0.0085 | 1 | 2 | interleukin-23 receptor binding |
| GO:0047389 | 0.0085 | 237.5909 | 0.0085 | 1 | 2 | glycerophosphocholine phosphodiesterase activity |
| GO:0048257 | 0.0085 | 237.5909 | 0.0085 | 1 | 2 | 3'-flap endonuclease activity |
| GOMFID | Pvalue | OddsRatio | ExpCount | Count | Size | Term |
| GO:0009055 | 6e-04 | 11.643 | 0.3805 | 4 | 107 | electron carrier activity |
| GO:0047837 | 0.0036 | Inf | 0.0036 | 1 | 1 | D-xylose 1-dehydrogenase (NADP+) activity |
| GO:0050683 | 0.0036 | Inf | 0.0036 | 1 | 1 | AF-1 domain binding |
| GO:0030165 | 0.0038 | 10.3938 | 0.3129 | 3 | 88 | PDZ domain binding |
| GO:0003977 | 0.0071 | 285.3091 | 0.0071 | 1 | 2 | UDP-N-acetylglucosamine diphosphorylase activity |
| GO:0008746 | 0.0071 | 285.3091 | 0.0071 | 1 | 2 | NAD(P)+ transhydrogenase activity |
| GO:0034701 | 0.0071 | 285.3091 | 0.0071 | 1 | 2 | tripeptidase activity |
| GO:0042328 | 0.0071 | 285.3091 | 0.0071 | 1 | 2 | heparan sulfate N-acetylglucosaminyltransferase activity |
| GO:0050509 | 0.0071 | 285.3091 | 0.0071 | 1 | 2 | N-acetylglucosaminyl-proteoglycan 4-beta-glucuronosyltransferase activity |
| GO:0052629 | 0.0071 | 285.3091 | 0.0071 | 1 | 2 | phosphatidylinositol-3,5-bisphosphate 3-phosphatase activity |
| GOMFID | Pvalue | OddsRatio | ExpCount | Count | Size | Term |
| GO:0051879 | 0.0028 | 28.707 | 0.0789 | 2 | 23 | Hsp90 protein binding |
| GO:0004648 | 0.0034 | Inf | 0.0034 | 1 | 1 | O-phospho-L-serine:2-oxoglutarate aminotransferase activity |
| GO:0008267 | 0.0034 | Inf | 0.0034 | 1 | 1 | poly-glutamine tract binding |
| GO:0033823 | 0.0034 | Inf | 0.0034 | 1 | 1 | procollagen glucosyltransferase activity |
| GO:0001103 | 0.0041 | 23.179 | 0.096 | 2 | 28 | RNA polymerase II repressing transcription factor binding |
| GO:0048487 | 0.005 | 20.7772 | 0.1063 | 2 | 31 | beta-tubulin binding |
| GO:0001046 | 0.0051 | 9.2668 | 0.3497 | 3 | 102 | core promoter sequence-specific DNA binding |
| GO:0004583 | 0.0068 | 296.1132 | 0.0069 | 1 | 2 | dolichyl-phosphate-glucose-glycolipid alpha-glucosyltransferase activity |
| GO:0071633 | 0.0068 | 296.1132 | 0.0069 | 1 | 2 | dihydroceramidase activity |
| GO:0016706 | 0.0083 | 15.8472 | 0.1372 | 2 | 40 | oxidoreductase activity, acting on paired donors, with incorporation or reduction of molecular oxygen, 2-oxoglutarate as one donor, and incorporation of one atom each of oxygen into both donors |
| GOMFID | Pvalue | OddsRatio | ExpCount | Count | Size | Term |
| GO:0008046 | 2e-04 | 135.2155 | 0.0229 | 2 | 6 | axon guidance receptor activity |
| GO:0003975 | 0.0038 | Inf | 0.0038 | 1 | 1 | UDP-N-acetylglucosamine-dolichyl-phosphate N-acetylglucosaminephosphotransferase activity |
| GO:0008267 | 0.0038 | Inf | 0.0038 | 1 | 1 | poly-glutamine tract binding |
| GO:0008963 | 0.0038 | Inf | 0.0038 | 1 | 1 | phospho-N-acetylmuramoyl-pentapeptide-transferase activity |
| GO:0047066 | 0.0038 | Inf | 0.0038 | 1 | 1 | phospholipid-hydroperoxide glutathione peroxidase activity |
| GO:0002020 | 0.0071 | 8.2047 | 0.3924 | 3 | 103 | protease binding |
| GO:0003954 | 0.0087 | 15.4227 | 0.141 | 2 | 37 | NADH dehydrogenase activity |
| GO:0008137 | 0.0087 | 15.4227 | 0.141 | 2 | 37 | NADH dehydrogenase (ubiquinone) activity |
| GOMFID | Pvalue | OddsRatio | ExpCount | Count | Size | Term |
| GO:0017134 | 0.0025 | 30.4704 | 0.0745 | 2 | 23 | fibroblast growth factor binding |
| GO:0004610 | 0.0032 | Inf | 0.0032 | 1 | 1 | phosphoacetylglucosamine mutase activity |
| GO:0070611 | 0.0032 | Inf | 0.0032 | 1 | 1 | histone methyltransferase activity (H3-R2 specific) |
| GO:0070612 | 0.0032 | Inf | 0.0032 | 1 | 1 | histone methyltransferase activity (H2A-R3 specific) |
| GO:0070773 | 0.0032 | Inf | 0.0032 | 1 | 1 | protein-N-terminal glutamine amidohydrolase activity |
| GO:0004920 | 0.0065 | 313.94 | 0.0065 | 1 | 2 | interleukin-10 receptor activity |
| GO:0004614 | 0.0097 | 156.96 | 0.0097 | 1 | 3 | phosphoglucomutase activity |
| GO:0008309 | 0.0097 | 156.96 | 0.0097 | 1 | 3 | double-stranded DNA exodeoxyribonuclease activity |
| GO:0030628 | 0.0097 | 156.96 | 0.0097 | 1 | 3 | pre-mRNA 3'-splice site binding |
| GO:0035241 | 0.0097 | 156.96 | 0.0097 | 1 | 3 | protein-arginine omega-N monomethyltransferase activity |
| GOMFID | Pvalue | OddsRatio | ExpCount | Count | Size | Term |
| GO:0070097 | 3e-04 | 106.3254 | 0.0271 | 2 | 7 | delta-catenin binding |
| GO:0008265 | 0.0039 | Inf | 0.0039 | 1 | 1 | Mo-molybdopterin cofactor sulfurase activity |
| GO:0008507 | 0.0039 | Inf | 0.0039 | 1 | 1 | sodium:iodide symporter activity |
| GO:0070039 | 0.0039 | Inf | 0.0039 | 1 | 1 | rRNA (guanosine-2'-O-)-methyltransferase activity |
| GO:0001735 | 0.0077 | 261.45 | 0.0077 | 1 | 2 | prenylcysteine oxidase activity |
| GO:0034736 | 0.0077 | 261.45 | 0.0077 | 1 | 2 | cholesterol O-acyltransferase activity |
| GO:0047389 | 0.0077 | 261.45 | 0.0077 | 1 | 2 | glycerophosphocholine phosphodiesterase activity |
| GO:0048408 | 0.0077 | 261.45 | 0.0077 | 1 | 2 | epidermal growth factor binding |
| GOMFID | Pvalue | OddsRatio | ExpCount | Count | Size | Term |
| GO:0004430 | 1e-04 | 201.1795 | 0.0171 | 2 | 5 | 1-phosphatidylinositol 4-kinase activity |
| GO:0048037 | 0.0017 | 6.3557 | 0.8675 | 5 | 253 | cofactor binding |
| GO:0003878 | 0.0034 | Inf | 0.0034 | 1 | 1 | ATP citrate synthase activity |
| GO:0004362 | 0.0034 | Inf | 0.0034 | 1 | 1 | glutathione-disulfide reductase activity |
| GO:0008117 | 0.0034 | Inf | 0.0034 | 1 | 1 | sphinganine-1-phosphate aldolase activity |
| GO:0008493 | 0.0034 | Inf | 0.0034 | 1 | 1 | tetracycline transporter activity |
| GO:0043890 | 0.0034 | Inf | 0.0034 | 1 | 1 | N-acetylgalactosamine-6-sulfatase activity |
| GO:0000166 | 0.0055 | 2.3959 | 7.4953 | 15 | 2186 | nucleotide binding |
| GO:0001042 | 0.0068 | 296.1132 | 0.0069 | 1 | 2 | RNA polymerase I core binding |
| GO:0002094 | 0.0068 | 296.1132 | 0.0069 | 1 | 2 | polyprenyltransferase activity |
| GO:0003943 | 0.0068 | 296.1132 | 0.0069 | 1 | 2 | N-acetylgalactosamine-4-sulfatase activity |
| GO:0004464 | 0.0068 | 296.1132 | 0.0069 | 1 | 2 | leukotriene-C4 synthase activity |
| GO:0004827 | 0.0068 | 296.1132 | 0.0069 | 1 | 2 | proline-tRNA ligase activity |
| GO:0016404 | 0.0068 | 296.1132 | 0.0069 | 1 | 2 | 15-hydroxyprostaglandin dehydrogenase (NAD+) activity |
| GO:0043168 | 0.008 | 2.2361 | 8.5823 | 16 | 2503 | anion binding |
| GOMFID | Pvalue | OddsRatio | ExpCount | Count | Size | Term |
| GO:0005524 | 0.0011 | 2.9502 | 5.5964 | 14 | 1399 | ATP binding |
| GO:0030554 | 0.0014 | 2.8549 | 5.7644 | 14 | 1441 | adenyl nucleotide binding |
| GO:1901363 | 0.0031 | 2.0671 | 21.9254 | 33 | 5481 | heterocyclic compound binding |
| GO:0097159 | 0.004 | 2.0219 | 22.2414 | 33 | 5560 | organic cyclic compound binding |
| GO:0005154 | 0.0064 | 18.3349 | 0.12 | 2 | 30 | epidermal growth factor receptor binding |
| GO:0008017 | 0.0069 | 5.6806 | 0.756 | 4 | 189 | microtubule binding |
| GO:0001883 | 0.0072 | 2.3382 | 6.8884 | 14 | 1722 | purine nucleoside binding |
| GO:0032549 | 0.0072 | 2.3382 | 6.8884 | 14 | 1722 | ribonucleoside binding |
| GO:0003920 | 0.008 | 252.9839 | 0.008 | 1 | 2 | GMP reductase activity |
| GO:0005006 | 0.008 | 252.9839 | 0.008 | 1 | 2 | epidermal growth factor-activated receptor activity |
| GO:0019781 | 0.008 | 252.9839 | 0.008 | 1 | 2 | NEDD8 activating enzyme activity |
| GO:1990188 | 0.008 | 252.9839 | 0.008 | 1 | 2 | euchromatin binding |
| GO:0032555 | 0.0082 | 2.2959 | 7.0004 | 14 | 1750 | purine ribonucleotide binding |
| GO:0016877 | 0.0096 | 14.6614 | 0.148 | 2 | 37 | ligase activity, forming carbon-sulfur bonds |
| GOMFID | Pvalue | OddsRatio | ExpCount | Count | Size | Term |
| GO:0003948 | 0.0027 | Inf | 0.0027 | 1 | 1 | N4-(beta-N-acetylglucosaminyl)-L-asparaginase activity |
| GO:0004686 | 0.0027 | Inf | 0.0027 | 1 | 1 | elongation factor-2 kinase activity |
| GO:0001540 | 0.0033 | 26.1283 | 0.0853 | 2 | 32 | beta-amyloid binding |
| GO:0003990 | 0.0053 | 383.0732 | 0.0053 | 1 | 2 | acetylcholinesterase activity |
| GO:0004315 | 0.0053 | 383.0732 | 0.0053 | 1 | 2 | 3-oxoacyl-[acyl-carrier-protein] synthase activity |
| GO:0008798 | 0.0053 | 383.0732 | 0.0053 | 1 | 2 | beta-aspartyl-peptidase activity |
| GO:0005488 | 0.0069 | 7.6175 | 35.4342 | 41 | 13287 | binding |
| GO:0008426 | 0.008 | 191.5244 | 0.008 | 1 | 3 | protein kinase C inhibitor activity |
| GOMFID | Pvalue | OddsRatio | ExpCount | Count | Size | Term |
| GO:0005509 | 2e-04 | 5.9792 | 1.6294 | 8 | 658 | calcium ion binding |
| GO:0033218 | 4e-04 | 9.0941 | 0.6315 | 5 | 255 | amide binding |
| GO:0043167 | 0.0013 | 2.786 | 14.2514 | 24 | 5755 | ion binding |
| GO:0042605 | 0.0016 | 38.5455 | 0.0594 | 2 | 24 | peptide antigen binding |
| GO:0001596 | 0.0025 | Inf | 0.0025 | 1 | 1 | angiotensin type I receptor activity |
| GO:0004729 | 0.0025 | Inf | 0.0025 | 1 | 1 | oxygen-dependent protoporphyrinogen oxidase activity |
| GO:0004979 | 0.0025 | Inf | 0.0025 | 1 | 1 | beta-endorphin receptor activity |
| GO:0008442 | 0.0025 | Inf | 0.0025 | 1 | 1 | 3-hydroxyisobutyrate dehydrogenase activity |
| GO:0038047 | 0.0025 | Inf | 0.0025 | 1 | 1 | morphine receptor activity |
| GO:0004713 | 0.0048 | 9.6142 | 0.3417 | 3 | 138 | protein tyrosine kinase activity |
| GO:0001147 | 0.0049 | 413.3947 | 0.005 | 1 | 2 | transcription termination site sequence-specific DNA binding |
| GO:0004660 | 0.0049 | 413.3947 | 0.005 | 1 | 2 | protein farnesyltransferase activity |
| GO:0005006 | 0.0049 | 413.3947 | 0.005 | 1 | 2 | epidermal growth factor-activated receptor activity |
| GO:0004616 | 0.0074 | 206.6842 | 0.0074 | 1 | 3 | phosphogluconate dehydrogenase (decarboxylating) activity |
| GO:0004829 | 0.0074 | 206.6842 | 0.0074 | 1 | 3 | threonine-tRNA ligase activity |
| GO:0030942 | 0.0074 | 206.6842 | 0.0074 | 1 | 3 | endoplasmic reticulum signal peptide binding |
| GO:0031711 | 0.0074 | 206.6842 | 0.0074 | 1 | 3 | bradykinin receptor binding |
| GO:0004311 | 0.0099 | 137.7807 | 0.0099 | 1 | 4 | farnesyltranstransferase activity |
| GO:0004945 | 0.0099 | 137.7807 | 0.0099 | 1 | 4 | angiotensin type II receptor activity |
| GO:0043533 | 0.0099 | 137.7807 | 0.0099 | 1 | 4 | inositol 1,3,4,5 tetrakisphosphate binding |
| GO:0051434 | 0.0099 | 137.7807 | 0.0099 | 1 | 4 | BH3 domain binding |
| GOMFID | Pvalue | OddsRatio | ExpCount | Count | Size | Term |
| GO:0004407 | 0.0018 | 36.4744 | 0.0629 | 2 | 22 | histone deacetylase activity |
| GO:0051059 | 0.0029 | 28.0465 | 0.08 | 2 | 28 | NF-kappaB binding |
| GO:0019213 | 0.0045 | 22.0874 | 0.1 | 2 | 35 | deacetylase activity |
| GO:0008281 | 0.0057 | 356.8864 | 0.0057 | 1 | 2 | sulfonylurea receptor activity |
| GO:0031491 | 0.0067 | 17.7686 | 0.1229 | 2 | 43 | nucleosome binding |
| GO:0004965 | 0.0085 | 178.4318 | 0.0086 | 1 | 3 | G-protein coupled GABA receptor activity |
| GO:0032564 | 0.0085 | 178.4318 | 0.0086 | 1 | 3 | dATP binding |
| GOMFID | Pvalue | OddsRatio | ExpCount | Count | Size | Term |
| GO:0044822 | 0.0011 | 4.0665 | 2.7096 | 9 | 1123 | poly(A) RNA binding |
| GO:0008457 | 0.0024 | Inf | 0.0024 | 1 | 1 | beta-galactosyl-N-acetylglucosaminylgalactosylglucosyl-ceramide beta-1,3-acetylglucosaminyltransferase activity |
| GO:0047256 | 0.0024 | Inf | 0.0024 | 1 | 1 | lactosylceramide 1,3-N-acetyl-beta-D-glucosaminyltransferase activity |
| GO:0047277 | 0.0024 | Inf | 0.0024 | 1 | 1 | globoside alpha-N-acetylgalactosaminyltransferase activity |
| GO:0008194 | 0.0037 | 10.602 | 0.3113 | 3 | 129 | UDP-glycosyltransferase activity |
| GO:0008449 | 0.0072 | 212.2838 | 0.0072 | 1 | 3 | N-acetylglucosamine-6-sulfatase activity |
| GO:0008454 | 0.0072 | 212.2838 | 0.0072 | 1 | 3 | alpha-1,3-mannosylglycoprotein 4-beta-N-acetylglucosaminyltransferase activity |
| GO:0008559 | 0.0072 | 212.2838 | 0.0072 | 1 | 3 | xenobiotic-transporting ATPase activity |
| GO:0031852 | 0.0072 | 212.2838 | 0.0072 | 1 | 3 | mu-type opioid receptor binding |
| GOMFID | Pvalue | OddsRatio | ExpCount | Count | Size | Term |
| GO:0003957 | 0.0024 | Inf | 0.0024 | 1 | 1 | NAD(P)+ transhydrogenase (B-specific) activity |
| GO:0004796 | 0.0024 | Inf | 0.0024 | 1 | 1 | thromboxane-A synthase activity |
| GO:0008750 | 0.0024 | Inf | 0.0024 | 1 | 1 | NAD(P)+ transhydrogenase (AB-specific) activity |
| GO:0004816 | 0.0048 | 424.5946 | 0.0048 | 1 | 2 | asparagine-tRNA ligase activity |
| GO:0015501 | 0.0048 | 424.5946 | 0.0048 | 1 | 2 | glutamate:sodium symporter activity |
| GO:0016652 | 0.0048 | 424.5946 | 0.0048 | 1 | 2 | oxidoreductase activity, acting on NAD(P)H, NAD(P) as acceptor |
| GO:0030343 | 0.0048 | 424.5946 | 0.0048 | 1 | 2 | vitamin D3 25-hydroxylase activity |
| GO:0035402 | 0.0048 | 424.5946 | 0.0048 | 1 | 2 | histone kinase activity (H3-T11 specific) |
| GOMFID | Pvalue | OddsRatio | ExpCount | Count | Size | Term |
| GO:0043325 | 0.0022 | 32.9286 | 0.07 | 2 | 19 | phosphatidylinositol-3,4-bisphosphate binding |
| GO:0032500 | 0.0037 | Inf | 0.0037 | 1 | 1 | muramyl dipeptide binding |
| GO:0035757 | 0.0037 | Inf | 0.0037 | 1 | 1 | chemokine (C-C motif) ligand 19 binding |
| GO:0035758 | 0.0037 | Inf | 0.0037 | 1 | 1 | chemokine (C-C motif) ligand 21 binding |
| GO:0038117 | 0.0037 | Inf | 0.0037 | 1 | 1 | C-C motif chemokine 19 receptor activity |
| GO:0038121 | 0.0037 | Inf | 0.0037 | 1 | 1 | C-C motif chemokine 21 receptor activity |
| GO:0047277 | 0.0037 | Inf | 0.0037 | 1 | 1 | globoside alpha-N-acetylgalactosaminyltransferase activity |
| GO:1990259 | 0.0037 | Inf | 0.0037 | 1 | 1 | histone-glutamine methyltransferase activity |
| GO:1901981 | 0.0068 | 8.3364 | 0.3867 | 3 | 105 | phosphatidylinositol phosphate binding |
| GO:0008144 | 0.007 | 8.2549 | 0.3904 | 3 | 106 | drug binding |
| GO:0001156 | 0.0074 | 275.2632 | 0.0074 | 1 | 2 | TFIIIC-class transcription factor binding |
| GO:0003868 | 0.0074 | 275.2632 | 0.0074 | 1 | 2 | 4-hydroxyphenylpyruvate dioxygenase activity |
| GO:0052739 | 0.0074 | 275.2632 | 0.0074 | 1 | 2 | phosphatidylserine 1-acylhydrolase activity |
| GO:0052740 | 0.0074 | 275.2632 | 0.0074 | 1 | 2 | 1-acyl-2-lysophosphatidylserine acylhydrolase activity |
| GO:0051015 | 0.0083 | 7.7261 | 0.4162 | 3 | 113 | actin filament binding |
| GOMFID | Pvalue | OddsRatio | ExpCount | Count | Size | Term |
| GO:0005096 | 0.0014 | 6.6801 | 0.8279 | 5 | 246 | GTPase activator activity |
| GO:0060589 | 0.0032 | 5.4951 | 0.9995 | 5 | 297 | nucleoside-triphosphatase regulator activity |
| GO:0000210 | 0.0034 | Inf | 0.0034 | 1 | 1 | NAD+ diphosphatase activity |
| GO:0004796 | 0.0034 | Inf | 0.0034 | 1 | 1 | thromboxane-A synthase activity |
| GO:0080132 | 0.0034 | Inf | 0.0034 | 1 | 1 | fatty acid alpha-hydroxylase activity |
| GO:0004613 | 0.0067 | 301.8269 | 0.0067 | 1 | 2 | phosphoenolpyruvate carboxykinase (GTP) activity |
| GO:0004816 | 0.0067 | 301.8269 | 0.0067 | 1 | 2 | asparagine-tRNA ligase activity |
| GO:0015218 | 0.0067 | 301.8269 | 0.0067 | 1 | 2 | pyrimidine nucleotide transmembrane transporter activity |
| GO:0005488 | 0.007 | 4.7393 | 44.7146 | 51 | 13287 | binding |
| GOMFID | Pvalue | OddsRatio | ExpCount | Count | Size | Term |
| GO:0043795 | 0.0038 | Inf | 0.0038 | 1 | 1 | glyceraldehyde oxidoreductase activity |
| GO:0080132 | 0.0038 | Inf | 0.0038 | 1 | 1 | fatty acid alpha-hydroxylase activity |
| GO:0001641 | 0.0076 | 265.8983 | 0.0076 | 1 | 2 | group II metabotropic glutamate receptor activity |
| GO:0004382 | 0.0076 | 265.8983 | 0.0076 | 1 | 2 | guanosine-diphosphatase activity |
| GO:0015489 | 0.0076 | 265.8983 | 0.0076 | 1 | 2 | putrescine transmembrane transporter activity |
| GO:0016300 | 0.0076 | 265.8983 | 0.0076 | 1 | 2 | tRNA (uracil) methyltransferase activity |
| GOMFID | Pvalue | OddsRatio | ExpCount | Count | Size | Term |
| GO:0001082 | 0.0039 | Inf | 0.0039 | 1 | 1 | transcription factor activity, RNA polymerase I transcription factor binding |
| GO:0001167 | 0.0039 | Inf | 0.0039 | 1 | 1 | RNA polymerase I transcription factor activity, sequence-specific DNA binding |
| GO:0001187 | 0.0039 | Inf | 0.0039 | 1 | 1 | transcription factor activity, RNA polymerase I CORE element binding transcription factor recruiting |
| GO:1990259 | 0.0039 | Inf | 0.0039 | 1 | 1 | histone-glutamine methyltransferase activity |
| GO:0004483 | 0.0077 | 261.45 | 0.0077 | 1 | 2 | mRNA (nucleoside-2'-O-)-methyltransferase activity |
| GO:0052739 | 0.0077 | 261.45 | 0.0077 | 1 | 2 | phosphatidylserine 1-acylhydrolase activity |
| GO:0052740 | 0.0077 | 261.45 | 0.0077 | 1 | 2 | 1-acyl-2-lysophosphatidylserine acylhydrolase activity |
| GO:0070573 | 0.0077 | 261.45 | 0.0077 | 1 | 2 | metallodipeptidase activity |
| GOMFID | Pvalue | OddsRatio | ExpCount | Count | Size | Term |
| GO:0004819 | 0.0026 | Inf | 0.0026 | 1 | 1 | glutamine-tRNA ligase activity |
| GO:0008116 | 0.0026 | Inf | 0.0026 | 1 | 1 | prostaglandin-I synthase activity |
| GO:0035851 | 0.0026 | Inf | 0.0026 | 1 | 1 | Krueppel-associated box domain binding |
| GO:0047323 | 0.0026 | Inf | 0.0026 | 1 | 1 | [3-methyl-2-oxobutanoate dehydrogenase (acetyl-transferring)] kinase activity |
| GO:0001105 | 0.0035 | 25.1218 | 0.0885 | 2 | 34 | RNA polymerase II transcription coactivator activity |
| GO:0003938 | 0.0052 | 392.675 | 0.0052 | 1 | 2 | IMP dehydrogenase activity |
| GO:0034189 | 0.0052 | 392.675 | 0.0052 | 1 | 2 | very-low-density lipoprotein particle binding |
| GO:0098811 | 0.0078 | 16.3883 | 0.1328 | 2 | 51 | transcriptional repressor activity, RNA polymerase II activating transcription factor binding |
| GO:0004719 | 0.0078 | 196.325 | 0.0078 | 1 | 3 | protein-L-isoaspartate (D-aspartate) O-methyltransferase activity |
| GO:0015143 | 0.0078 | 196.325 | 0.0078 | 1 | 3 | urate transmembrane transporter activity |
| GOMFID | Pvalue | OddsRatio | ExpCount | Count | Size | Term |
| GO:0008198 | 0.0011 | 47.197 | 0.0493 | 2 | 21 | ferrous iron binding |
| GO:0001532 | 0.0023 | Inf | 0.0023 | 1 | 1 | interleukin-21 receptor activity |
| GO:0003972 | 0.0023 | Inf | 0.0023 | 1 | 1 | RNA ligase (ATP) activity |
| GO:0003938 | 0.0047 | 436.4167 | 0.0047 | 1 | 2 | IMP dehydrogenase activity |
| GO:0004067 | 0.0047 | 436.4167 | 0.0047 | 1 | 2 | asparaginase activity |
| GO:0008798 | 0.0047 | 436.4167 | 0.0047 | 1 | 2 | beta-aspartyl-peptidase activity |
| GO:0003690 | 0.0067 | 3.9952 | 1.7197 | 6 | 732 | double-stranded DNA binding |
| GO:0001591 | 0.007 | 218.1944 | 0.007 | 1 | 3 | dopamine neurotransmitter receptor activity, coupled via Gi/Go |
| GO:0008475 | 0.007 | 218.1944 | 0.007 | 1 | 3 | procollagen-lysine 5-dioxygenase activity |
| GO:0015091 | 0.007 | 218.1944 | 0.007 | 1 | 3 | ferric iron transmembrane transporter activity |
| GO:0000978 | 0.0077 | 5.6152 | 0.7894 | 4 | 336 | RNA polymerase II core promoter proximal region sequence-specific DNA binding |
| GO:0001159 | 0.0093 | 5.3047 | 0.834 | 4 | 355 | core promoter proximal region DNA binding |
| GO:0051525 | 0.0094 | 145.4537 | 0.0094 | 1 | 4 | NFAT protein binding |
| GOMFID | Pvalue | OddsRatio | ExpCount | Count | Size | Term |
| GO:0003940 | 0.0036 | Inf | 0.0036 | 1 | 1 | L-iduronidase activity |
| GO:1904265 | 0.0036 | Inf | 0.0036 | 1 | 1 | ubiquitin-specific protease activity involved in negative regulation of retrograde protein transport, ER to cytosol |
| GO:0000248 | 0.0072 | 280.1964 | 0.0072 | 1 | 2 | C-5 sterol desaturase activity |
| GO:0005019 | 0.0072 | 280.1964 | 0.0072 | 1 | 2 | platelet-derived growth factor beta-receptor activity |
| GO:0016005 | 0.0072 | 280.1964 | 0.0072 | 1 | 2 | phospholipase A2 activator activity |
| GO:0016403 | 0.0072 | 280.1964 | 0.0072 | 1 | 2 | dimethylargininase activity |
| GO:0034041 | 0.0072 | 280.1964 | 0.0072 | 1 | 2 | sterol-transporting ATPase activity |
| GOMFID | Pvalue | OddsRatio | ExpCount | Count | Size | Term |
| GO:0002083 | 0.003 | Inf | 0.003 | 1 | 1 | 4-hydroxybenzoate decaprenyltransferase activity |
| GO:0004964 | 0.003 | Inf | 0.003 | 1 | 1 | luteinizing hormone receptor activity |
| GO:0030272 | 0.003 | Inf | 0.003 | 1 | 1 | 5-formyltetrahydrofolate cyclo-ligase activity |
| GO:0035472 | 0.003 | Inf | 0.003 | 1 | 1 | choriogonadotropin hormone receptor activity |
| GO:0038106 | 0.003 | Inf | 0.003 | 1 | 1 | choriogonadotropin hormone binding |
| GO:0047293 | 0.003 | Inf | 0.003 | 1 | 1 | 4-hydroxybenzoate nonaprenyltransferase activity |
| GO:0002151 | 0.006 | 341.3261 | 0.006 | 1 | 2 | G-quadruplex RNA binding |
| GO:0070991 | 0.006 | 341.3261 | 0.006 | 1 | 2 | medium-chain-acyl-CoA dehydrogenase activity |
| GO:1901363 | 0.0073 | 2.134 | 16.357 | 25 | 5481 | heterocyclic compound binding |
| GO:0004829 | 0.0089 | 170.6522 | 0.009 | 1 | 3 | threonine-tRNA ligase activity |
| GO:0032564 | 0.0089 | 170.6522 | 0.009 | 1 | 3 | dATP binding |
| GO:0050265 | 0.0089 | 170.6522 | 0.009 | 1 | 3 | RNA uridylyltransferase activity |
| GO:0097159 | 0.0089 | 2.0873 | 16.5928 | 25 | 5560 | organic cyclic compound binding |
| GOMFID | Pvalue | OddsRatio | ExpCount | Count | Size | Term |
| GO:0005042 | 0.0039 | Inf | 0.0039 | 1 | 1 | netrin receptor activity |
| GO:0031775 | 0.0039 | Inf | 0.0039 | 1 | 1 | lutropin-choriogonadotropic hormone receptor binding |
| GO:0086039 | 0.0039 | Inf | 0.0039 | 1 | 1 | calcium-transporting ATPase activity involved in regulation of cardiac muscle cell membrane potential |
| GO:0003920 | 0.0077 | 261.45 | 0.0077 | 1 | 2 | GMP reductase activity |
| GO:0004019 | 0.0077 | 261.45 | 0.0077 | 1 | 2 | adenylosuccinate synthase activity |
| GO:0015489 | 0.0077 | 261.45 | 0.0077 | 1 | 2 | putrescine transmembrane transporter activity |
| GO:0032810 | 0.0077 | 261.45 | 0.0077 | 1 | 2 | sterol response element binding |
| GO:1904928 | 0.0077 | 261.45 | 0.0077 | 1 | 2 | coreceptor activity involved in canonical Wnt signaling pathway |
| GO:0044325 | 0.008 | 7.8264 | 0.4106 | 3 | 106 | ion channel binding |
| GO:0019899 | 0.0091 | 2.3374 | 6.3599 | 13 | 1642 | enzyme binding |
| GO:0048365 | 0.0095 | 14.7382 | 0.1472 | 2 | 38 | Rac GTPase binding |
| GO:0051018 | 0.01 | 14.339 | 0.1511 | 2 | 39 | protein kinase A binding |
| GOMFID | Pvalue | OddsRatio | ExpCount | Count | Size | Term |
| GO:0070530 | 0.0019 | 35.4192 | 0.0658 | 2 | 17 | K63-linked polyubiquitin binding |
| GO:0046961 | 0.003 | 27.9554 | 0.0813 | 2 | 21 | proton-transporting ATPase activity, rotational mechanism |
| GO:0004149 | 0.0039 | Inf | 0.0039 | 1 | 1 | dihydrolipoyllysine-residue succinyltransferase activity |
| GO:0042624 | 0.0039 | Inf | 0.0039 | 1 | 1 | ATPase activity, uncoupled |
| GO:1990829 | 0.0039 | Inf | 0.0039 | 1 | 1 | C-rich single-stranded DNA binding |
| GO:0032266 | 0.0056 | 19.6623 | 0.1123 | 2 | 29 | phosphatidylinositol-3-phosphate binding |
| GO:0035254 | 0.0076 | 16.5847 | 0.1317 | 2 | 34 | glutamate receptor binding |
| GO:0000703 | 0.0077 | 261.45 | 0.0077 | 1 | 2 | oxidized pyrimidine nucleobase lesion DNA N-glycosylase activity |
| GO:0016748 | 0.0077 | 261.45 | 0.0077 | 1 | 2 | succinyltransferase activity |
| GO:1990715 | 0.0077 | 261.45 | 0.0077 | 1 | 2 | mRNA CDS binding |
| NA. |
| n/a |
| NA. |
| n/a |
| NA. |
| n/a |
| NA. |
| n/a |
| NA. |
| n/a |
| NA. |
| n/a |
| NA. |
| n/a |
| NA. |
| n/a |
| NA. |
| n/a |
| NA. |
| n/a |
| NA. |
| n/a |
| NA. |
| n/a |
| NA. |
| n/a |
| NA. |
| n/a |
| NA. |
| n/a |
| NA. |
| n/a |
| NA. |
| n/a |
| NA. |
| n/a |
| NA. |
| n/a |
| NA. |
| n/a |
| NA. |
| n/a |
| NA. |
| n/a |
| NA. |
| n/a |
| NA. |
| n/a |
| NA. |
| n/a |
| NA. |
| n/a |
| NA. |
| n/a |
| NA. |
| n/a |
| NA. |
| n/a |
| NA. |
| n/a |
| NA. |
| n/a |
| NA. |
| n/a |
| NA. |
| n/a |
| NA. |
| n/a |
| NA. |
| n/a |
| NA. |
| n/a |
| NA. |
| n/a |
| NA. |
| n/a |
| NA. |
| n/a |
| NA. |
| n/a |
| NA. |
| n/a |
| NA. |
| n/a |
| NA. |
| n/a |
| NA. |
| n/a |
| NA. |
| n/a |
| NA. |
| n/a |
| NA. |
| n/a |
| NA. |
| n/a |
| NA. |
| n/a |
| NA. |
| n/a |
| NA. |
| n/a |
| NA. |
| n/a |
| NA. |
| n/a |
| NA. |
| n/a |
| NA. |
| n/a |
| NA. |
| n/a |
| NA. |
| n/a |
| NA. |
| n/a |
| NA. |
| n/a |
| NA. |
| n/a |
| NA. |
| n/a |
| NA. |
| n/a |
| NA. |
| n/a |
| NA. |
| n/a |
| NA. |
| n/a |
| NA. |
| n/a |
| NA. |
| n/a |
| NA. |
| n/a |
| NA. |
| n/a |
| NA. |
| n/a |
| NA. |
| n/a |
| NA. |
| n/a |
| NA. |
| n/a |
| NA. |
| n/a |
| NA. |
| n/a |
| NA. |
| n/a |
| NA. |
| n/a |
| NA. |
| n/a |
| NA. |
| n/a |
| NA. |
| n/a |
| NA. |
| n/a |
| NA. |
| n/a |
| NA. |
| n/a |
| NA. |
| n/a |
| NA. |
| n/a |
| NA. |
| n/a |
| NA. |
| n/a |
| NA. |
| n/a |
| NA. |
| n/a |
| NA. |
| n/a |
| NA. |
| n/a |
| NA. |
| n/a |
| NA. |
| n/a |
| NA. |
| n/a |
| NA. |
| n/a |
| NA. |
| n/a |
| NA. |
| n/a |
| NA. |
| n/a |
| NA. |
| n/a |
| NA. |
| n/a |
| NA. |
| n/a |
| NA. |
| n/a |
| NA. |
| n/a |
| NA. |
| n/a |
| NA. |
| n/a |
| NA. |
| n/a |
| NA. |
| n/a |
| NA. |
| n/a |
| NA. |
| n/a |
| NA. |
| n/a |
| NA. |
| n/a |
| NA. |
| n/a |
| NA. |
| n/a |
| NA. |
| n/a |
| NA. |
| n/a |
| NA. |
| n/a |
| NA. |
| n/a |
| NA. |
| n/a |
| NA. |
| n/a |
| NA. |
| n/a |
| NA. |
| n/a |
| NA. |
| n/a |
| NA. |
| n/a |
| NA. |
| n/a |
| NA. |
| n/a |
| NA. |
| n/a |
| NA. |
| n/a |
| NA. |
| n/a |
| NA. |
| n/a |
| NA. |
| n/a |
| NA. |
| n/a |
| NA. |
| n/a |
| NA. |
| n/a |
| NA. |
| n/a |
| NA. |
| n/a |
| NA. |
| n/a |
| NA. |
| n/a |
| NA. |
| n/a |
| NA. |
| n/a |
| NA. |
| n/a |
| NA. |
| n/a |
| NA. |
| n/a |
| NA. |
| n/a |
| NA. |
| n/a |
| NA. |
| n/a |
| NA. |
| n/a |
| NA. |
| n/a |
| NA. |
| n/a |
| NA. |
| n/a |
| NA. |
| n/a |
| NA. |
| n/a |
| NA. |
| n/a |
| NA. |
| n/a |
| NA. |
| n/a |
| NA. |
| n/a |
| NA. |
| n/a |
| NA. |
| n/a |
| NA. |
| n/a |
| NA. |
| n/a |
| NA. |
| n/a |
| NA. |
| n/a |
| NA. |
| n/a |
| NA. |
| n/a |
| NA. |
| n/a |
| NA. |
| n/a |
| NA. |
| n/a |
| NA. |
| n/a |
| NA. |
| n/a |
| NA. |
| n/a |
| NA. |
| n/a |
| NA. |
| n/a |
| NA. |
| n/a |
| NA. |
| n/a |
| NA. |
| n/a |
| NA. |
| n/a |
| NA. |
| n/a |
| NA. |
| n/a |
| NA. |
| n/a |
| NA. |
| n/a |
| NA. |
| n/a |
| NA. |
| n/a |
| NA. |
| n/a |
| NA. |
| n/a |
| NA. |
| n/a |
| NA. |
| n/a |
| NA. |
| n/a |
| NA. |
| n/a |
| NA. |
| n/a |
| NA. |
| n/a |
| NA. |
| n/a |
| NA. |
| n/a |
| NA. |
| n/a |
| NA. |
| n/a |
| NA. |
| n/a |
| NA. |
| n/a |
| NA. |
| n/a |
| NA. |
| n/a |
| NA. |
| n/a |
| NA. |
| n/a |
| NA. |
| n/a |
| NA. |
| n/a |
| NA. |
| n/a |
| NA. |
| n/a |
| NA. |
| n/a |
| NA. |
| n/a |
| NA. |
| n/a |
| NA. |
| n/a |
| NA. |
| n/a |
| NA. |
| n/a |
| NA. |
| n/a |
| NA. |
| n/a |
| NA. |
| n/a |
| NA. |
| n/a |
| NA. |
| n/a |
| NA. |
| n/a |
| NA. |
| n/a |
| NA. |
| n/a |
| NA. |
| n/a |
| NA. |
| n/a |
| NA. |
| n/a |
| NA. |
| n/a |
| NA. |
| n/a |
| NA. |
| n/a |
| NA. |
| n/a |
| NA. |
| n/a |
| NA. |
| n/a |
| NA. |
| n/a |
| NA. |
| n/a |
| NA. |
| n/a |
| NA. |
| n/a |
| NA. |
| n/a |
| NA. |
| n/a |
| NA. |
| n/a |
| NA. |
| n/a |
| NA. |
| n/a |
| NA. |
| n/a |
| NA. |
| n/a |
| NA. |
| n/a |
| NA. |
| n/a |
| NA. |
| n/a |
| GOMFID | Pvalue | OddsRatio | ExpCount | Count | Size | Term |
| GO:0001510 | 0.0024 | 12.3849 | 0.2652 | 3 | 49 | RNA methylation |
| GO:0035574 | 0.0029 | 28.9249 | 0.0812 | 2 | 15 | histone H4-K20 demethylation |
| GO:0000184 | 0.0034 | 6.9621 | 0.6171 | 4 | 114 | nuclear-transcribed mRNA catabolic process, nonsense-mediated decay |
| GO:0045653 | 0.0042 | 23.497 | 0.0974 | 2 | 18 | negative regulation of megakaryocyte differentiation |
| GO:0002940 | 0.0054 | Inf | 0.0054 | 1 | 1 | tRNA N2-guanine methylation |
| GO:0031460 | 0.0054 | Inf | 0.0054 | 1 | 1 | glycine betaine transport |
| GO:0033301 | 0.0054 | Inf | 0.0054 | 1 | 1 | cell cycle comprising mitosis without cytokinesis |
| GO:0043048 | 0.0054 | Inf | 0.0054 | 1 | 1 | dolichyl monophosphate biosynthetic process |
| GO:0043381 | 0.0054 | Inf | 0.0054 | 1 | 1 | negative regulation of memory T cell differentiation |
| GO:1904761 | 0.0054 | Inf | 0.0054 | 1 | 1 | negative regulation of myofibroblast differentiation |
| GOMFID | Pvalue | OddsRatio | ExpCount | Count | Size | Term |
| GO:0060392 | 1e-04 | 308.8911 | 0.0197 | 2 | 3 | negative regulation of SMAD protein import into nucleus |
| GO:0061484 | 4e-04 | 102.9505 | 0.0328 | 2 | 5 | hematopoietic stem cell homeostasis |
| GO:0046888 | 0.0013 | 9.0944 | 0.4788 | 4 | 73 | negative regulation of hormone secretion |
| GO:0032926 | 0.0019 | 38.5941 | 0.0656 | 2 | 10 | negative regulation of activin receptor signaling pathway |
| GO:0043249 | 0.0019 | 38.5941 | 0.0656 | 2 | 10 | erythrocyte maturation |
| GO:0046676 | 0.0024 | 12.2858 | 0.2689 | 3 | 41 | negative regulation of insulin secretion |
| GO:0045899 | 0.0027 | 30.8713 | 0.0787 | 2 | 12 | positive regulation of RNA polymerase II transcriptional preinitiation complex assembly |
| GO:0071705 | 0.0037 | 2.6556 | 4.9194 | 12 | 750 | nitrogen compound transport |
| GO:0002792 | 0.0038 | 10.37 | 0.3148 | 3 | 48 | negative regulation of peptide secretion |
| GO:0009914 | 0.0049 | 3.5964 | 2.0793 | 7 | 317 | hormone transport |
| GO:0040029 | 0.0054 | 3.9925 | 1.6005 | 6 | 244 | regulation of gene expression, epigenetic |
| GO:0002044 | 0.0066 | Inf | 0.0066 | 1 | 1 | blood vessel endothelial cell migration involved in intussusceptive angiogenesis |
| GO:0006211 | 0.0066 | Inf | 0.0066 | 1 | 1 | 5-methylcytosine catabolic process |
| GO:0009399 | 0.0066 | Inf | 0.0066 | 1 | 1 | nitrogen fixation |
| GO:0031460 | 0.0066 | Inf | 0.0066 | 1 | 1 | glycine betaine transport |
| GO:0031651 | 0.0066 | Inf | 0.0066 | 1 | 1 | negative regulation of heat generation |
| GO:0036394 | 0.0066 | Inf | 0.0066 | 1 | 1 | amylase secretion |
| GO:0051885 | 0.0066 | Inf | 0.0066 | 1 | 1 | positive regulation of anagen |
| GO:0090327 | 0.0066 | Inf | 0.0066 | 1 | 1 | negative regulation of locomotion involved in locomotory behavior |
| GO:1904057 | 0.0066 | Inf | 0.0066 | 1 | 1 | negative regulation of sensory perception of pain |
| GO:1990079 | 0.0066 | Inf | 0.0066 | 1 | 1 | cartilage homeostasis |
| GO:0023061 | 0.0068 | 3.0661 | 2.7877 | 8 | 425 | signal release |
| GO:0030072 | 0.0072 | 3.7522 | 1.6988 | 6 | 259 | peptide hormone secretion |
| GO:0051224 | 0.0094 | 4.1161 | 1.2856 | 5 | 196 | negative regulation of protein transport |
| GOMFID | Pvalue | OddsRatio | ExpCount | Count | Size | Term |
| GO:0055129 | 7e-04 | 79.2214 | 0.0423 | 2 | 5 | L-proline biosynthetic process |
| GO:0070124 | 7e-04 | 7.6597 | 0.7115 | 5 | 84 | mitochondrial translational initiation |
| GO:0070125 | 7e-04 | 7.6597 | 0.7115 | 5 | 84 | mitochondrial translational elongation |
| GO:0070126 | 8e-04 | 7.4696 | 0.7284 | 5 | 86 | mitochondrial translational termination |
| GO:1903322 | 0.001 | 4.7768 | 1.5754 | 7 | 186 | positive regulation of protein modification by small protein conjugation or removal |
| GO:0006610 | 0.0019 | 39.6031 | 0.0678 | 2 | 8 | ribosomal protein import into nucleus |
| GO:0006974 | 0.0021 | 2.5048 | 6.4963 | 15 | 767 | cellular response to DNA damage stimulus |
| GO:0006259 | 0.0021 | 2.3609 | 7.8514 | 17 | 927 | DNA metabolic process |
| GO:0043624 | 0.0022 | 3.7105 | 2.3038 | 8 | 272 | cellular protein complex disassembly |
| GO:0006560 | 0.0031 | 29.6985 | 0.0847 | 2 | 10 | proline metabolic process |
| GO:1901566 | 0.0038 | 2.0496 | 11.2308 | 21 | 1326 | organonitrogen compound biosynthetic process |
| GO:1902591 | 0.0049 | 6.239 | 0.686 | 4 | 81 | single-organism membrane budding |
| GO:0034641 | 0.005 | 1.5909 | 51.9363 | 67 | 6132 | cellular nitrogen compound metabolic process |
| GO:0032984 | 0.0053 | 3.1925 | 2.6595 | 8 | 314 | macromolecular complex disassembly |
| GO:0036297 | 0.0054 | 9.1899 | 0.3557 | 3 | 42 | interstrand cross-link repair |
| GO:0006412 | 0.0054 | 2.5004 | 5.1326 | 12 | 606 | translation |
| GO:0007077 | 0.0057 | 8.9596 | 0.3642 | 3 | 43 | mitotic nuclear envelope disassembly |
| GO:0046834 | 0.0057 | 8.9596 | 0.3642 | 3 | 43 | lipid phosphorylation |
| GO:0071168 | 0.0061 | 19.7939 | 0.1186 | 2 | 14 | protein localization to chromatin |
| GO:0030397 | 0.0065 | 8.5319 | 0.3811 | 3 | 45 | membrane disassembly |
| GO:0051668 | 0.0069 | 5.6489 | 0.7538 | 4 | 89 | localization within membrane |
| GO:0006461 | 0.0071 | 1.9576 | 11.1038 | 20 | 1311 | protein complex assembly |
| GO:0031396 | 0.0073 | 3.3102 | 2.236 | 7 | 264 | regulation of protein ubiquitination |
| GO:0044249 | 0.0075 | 1.5563 | 48.8533 | 63 | 5768 | cellular biosynthetic process |
| GO:0044711 | 0.0078 | 1.8364 | 14.3223 | 24 | 1691 | single-organism biosynthetic process |
| GO:0051443 | 0.008 | 5.3936 | 0.7877 | 4 | 93 | positive regulation of ubiquitin-protein transferase activity |
| GO:0007005 | 0.0084 | 2.2674 | 6.1236 | 13 | 723 | mitochondrion organization |
| GO:0006226 | 0.0085 | Inf | 0.0085 | 1 | 1 | dUMP biosynthetic process |
| GO:0009149 | 0.0085 | Inf | 0.0085 | 1 | 1 | pyrimidine nucleoside triphosphate catabolic process |
| GO:0010121 | 0.0085 | Inf | 0.0085 | 1 | 1 | arginine catabolic process to proline via ornithine |
| GO:0018009 | 0.0085 | Inf | 0.0085 | 1 | 1 | N-terminal peptidyl-L-cysteine N-palmitoylation |
| GO:0019544 | 0.0085 | Inf | 0.0085 | 1 | 1 | arginine catabolic process to glutamate |
| GO:0036031 | 0.0085 | Inf | 0.0085 | 1 | 1 | recruitment of mRNA capping enzyme to RNA polymerase II holoenzyme complex |
| GO:0036372 | 0.0085 | Inf | 0.0085 | 1 | 1 | opsin transport |
| GO:0046081 | 0.0085 | Inf | 0.0085 | 1 | 1 | dUTP catabolic process |
| GO:0046521 | 0.0085 | Inf | 0.0085 | 1 | 1 | sphingoid catabolic process |
| GO:0071234 | 0.0085 | Inf | 0.0085 | 1 | 1 | cellular response to phenylalanine |
| GO:0072303 | 0.0085 | Inf | 0.0085 | 1 | 1 | positive regulation of glomerular metanephric mesangial cell proliferation |
| GO:0072616 | 0.0085 | Inf | 0.0085 | 1 | 1 | interleukin-18 secretion |
| GO:2000723 | 0.0085 | Inf | 0.0085 | 1 | 1 | negative regulation of cardiac vascular smooth muscle cell differentiation |
| GO:0071345 | 0.0094 | 2.2311 | 6.2168 | 13 | 734 | cellular response to cytokine stimulus |
| GO:0006525 | 0.01 | 14.8416 | 0.1525 | 2 | 18 | arginine metabolic process |
| GO:0009084 | 0.01 | 14.8416 | 0.1525 | 2 | 18 | glutamine family amino acid biosynthetic process |
| GOMFID | Pvalue | OddsRatio | ExpCount | Count | Size | Term |
| GO:0071877 | 0 | 141.7 | 0.0432 | 3 | 6 | regulation of adrenergic receptor signaling pathway |
| GO:0045986 | 3e-04 | 28.3182 | 0.1295 | 3 | 18 | negative regulation of smooth muscle contraction |
| GO:0016557 | 3e-04 | 140.4324 | 0.0288 | 2 | 4 | peroxisome membrane biogenesis |
| GO:0007186 | 6e-04 | 2.5596 | 8.3474 | 19 | 1160 | G-protein coupled receptor signaling pathway |
| GO:0033365 | 0.001 | 2.7289 | 6.0663 | 15 | 843 | protein localization to organelle |
| GO:1903533 | 0.0012 | 4.121 | 2.0941 | 8 | 291 | regulation of protein targeting |
| GO:0023014 | 0.0012 | 2.6843 | 6.1598 | 15 | 856 | signal transduction by protein phosphorylation |
| GO:0050911 | 0.0014 | 3.6507 | 2.6625 | 9 | 370 | detection of chemical stimulus involved in sensory perception of smell |
| GO:0010534 | 0.0018 | 40.1107 | 0.0648 | 2 | 9 | regulation of activation of JAK2 kinase activity |
| GO:0050821 | 0.0019 | 6.1226 | 0.8779 | 5 | 122 | protein stabilization |
| GO:0043588 | 0.0021 | 4.2237 | 1.7774 | 7 | 247 | skin development |
| GO:0006612 | 0.0021 | 4.8829 | 1.3169 | 6 | 183 | protein targeting to membrane |
| GO:0016482 | 0.0021 | 2.3202 | 8.5993 | 18 | 1195 | cytoplasmic transport |
| GO:0016559 | 0.0022 | 35.0946 | 0.072 | 2 | 10 | peroxisome fission |
| GO:0090266 | 0.0027 | 31.1932 | 0.0792 | 2 | 11 | regulation of mitotic cell cycle spindle assembly checkpoint |
| GO:0050873 | 0.0027 | 11.7833 | 0.2806 | 3 | 39 | brown fat cell differentiation |
| GO:0000187 | 0.0028 | 5.5487 | 0.9643 | 5 | 134 | activation of MAPK activity |
| GO:0006606 | 0.003 | 3.9244 | 1.907 | 7 | 265 | protein import into nucleus |
| GO:0016259 | 0.0032 | 7.1147 | 0.6045 | 4 | 84 | selenocysteine metabolic process |
| GO:0051169 | 0.0032 | 3.2202 | 3.0008 | 9 | 417 | nuclear transport |
| GO:0071318 | 0.0032 | 28.0721 | 0.0864 | 2 | 12 | cellular response to ATP |
| GO:0051170 | 0.0033 | 3.8635 | 1.9357 | 7 | 269 | nuclear import |
| GO:0030855 | 0.0033 | 2.8161 | 4.2169 | 11 | 586 | epithelial cell differentiation |
| GO:0006402 | 0.0034 | 4.4042 | 1.4536 | 6 | 202 | mRNA catabolic process |
| GO:0019220 | 0.0035 | 2.0536 | 11.9743 | 22 | 1664 | regulation of phosphate metabolic process |
| GO:0001932 | 0.0035 | 2.1618 | 9.7291 | 19 | 1352 | regulation of protein phosphorylation |
| GO:1900180 | 0.0036 | 4.3591 | 1.468 | 6 | 204 | regulation of protein localization to nucleus |
| GO:0042990 | 0.0039 | 6.694 | 0.6405 | 4 | 89 | regulation of transcription factor import into nucleus |
| GO:0070727 | 0.004 | 2.0956 | 10.5854 | 20 | 1471 | cellular macromolecule localization |
| GO:1902531 | 0.0041 | 2.0543 | 11.3698 | 21 | 1580 | regulation of intracellular signal transduction |
| GO:0051347 | 0.0041 | 2.6051 | 4.9797 | 12 | 692 | positive regulation of transferase activity |
| GO:0031401 | 0.0043 | 2.209 | 8.4482 | 17 | 1174 | positive regulation of protein modification process |
| GO:0090231 | 0.0044 | 23.3904 | 0.1007 | 2 | 14 | regulation of spindle checkpoint |
| GO:0042976 | 0.0051 | 21.5897 | 0.1079 | 2 | 15 | activation of Janus kinase activity |
| GO:0090026 | 0.0051 | 21.5897 | 0.1079 | 2 | 15 | positive regulation of monocyte chemotaxis |
| GO:0031424 | 0.0053 | 9.2158 | 0.3526 | 3 | 49 | keratinization |
| GO:0009593 | 0.0053 | 2.9658 | 3.2454 | 9 | 451 | detection of chemical stimulus |
| GO:0043405 | 0.0054 | 2.9521 | 3.2598 | 9 | 453 | regulation of MAP kinase activity |
| GO:0009967 | 0.0054 | 2.0665 | 10.1321 | 19 | 1408 | positive regulation of signal transduction |
| GO:0070373 | 0.0056 | 9.0191 | 0.3598 | 3 | 50 | negative regulation of ERK1 and ERK2 cascade |
| GO:0042510 | 0.0058 | 20.0463 | 0.1151 | 2 | 16 | regulation of tyrosine phosphorylation of Stat1 protein |
| GO:0051968 | 0.0058 | 20.0463 | 0.1151 | 2 | 16 | positive regulation of synaptic transmission, glutamatergic |
| GO:0043043 | 0.0058 | 2.5995 | 4.5479 | 11 | 632 | peptide biosynthetic process |
| GO:0043603 | 0.0059 | 2.3082 | 6.5772 | 14 | 914 | cellular amide metabolic process |
| GO:0042327 | 0.006 | 2.2379 | 7.2896 | 15 | 1013 | positive regulation of phosphorylation |
| GO:0001885 | 0.0062 | 8.6499 | 0.3742 | 3 | 52 | endothelial cell development |
| GO:0006614 | 0.0063 | 5.8012 | 0.734 | 4 | 102 | SRP-dependent cotranslational protein targeting to membrane |
| GO:0007606 | 0.0063 | 2.8786 | 3.339 | 9 | 464 | sensory perception of chemical stimulus |
| GO:0050906 | 0.0063 | 2.8786 | 3.339 | 9 | 464 | detection of stimulus involved in sensory perception |
| GO:0010562 | 0.0066 | 2.1538 | 8.0956 | 16 | 1125 | positive regulation of phosphorus metabolic process |
| GO:0015689 | 0.0072 | Inf | 0.0072 | 1 | 1 | molybdate ion transport |
| GO:0016077 | 0.0072 | Inf | 0.0072 | 1 | 1 | snoRNA catabolic process |
| GO:0018106 | 0.0072 | Inf | 0.0072 | 1 | 1 | peptidyl-histidine phosphorylation |
| GO:0019046 | 0.0072 | Inf | 0.0072 | 1 | 1 | release from viral latency |
| GO:0021509 | 0.0072 | Inf | 0.0072 | 1 | 1 | roof plate formation |
| GO:0031651 | 0.0072 | Inf | 0.0072 | 1 | 1 | negative regulation of heat generation |
| GO:0033552 | 0.0072 | Inf | 0.0072 | 1 | 1 | response to vitamin B3 |
| GO:0035684 | 0.0072 | Inf | 0.0072 | 1 | 1 | helper T cell extravasation |
| GO:0035863 | 0.0072 | Inf | 0.0072 | 1 | 1 | dITP catabolic process |
| GO:0036306 | 0.0072 | Inf | 0.0072 | 1 | 1 | embryonic heart tube elongation |
| GO:0042502 | 0.0072 | Inf | 0.0072 | 1 | 1 | tyrosine phosphorylation of Stat2 protein |
| GO:0042666 | 0.0072 | Inf | 0.0072 | 1 | 1 | negative regulation of ectodermal cell fate specification |
| GO:0043105 | 0.0072 | Inf | 0.0072 | 1 | 1 | negative regulation of GTP cyclohydrolase I activity |
| GO:0060618 | 0.0072 | Inf | 0.0072 | 1 | 1 | nipple development |
| GO:0060649 | 0.0072 | Inf | 0.0072 | 1 | 1 | mammary gland bud elongation |
| GO:0060659 | 0.0072 | Inf | 0.0072 | 1 | 1 | nipple sheath formation |
| GO:0070481 | 0.0072 | Inf | 0.0072 | 1 | 1 | nuclear-transcribed mRNA catabolic process, non-stop decay |
| GO:0071881 | 0.0072 | Inf | 0.0072 | 1 | 1 | adenylate cyclase-inhibiting adrenergic receptor signaling pathway |
| GO:0071882 | 0.0072 | Inf | 0.0072 | 1 | 1 | phospholipase C-activating adrenergic receptor signaling pathway |
| GO:0072302 | 0.0072 | Inf | 0.0072 | 1 | 1 | negative regulation of metanephric glomerular mesangial cell proliferation |
| GO:0090327 | 0.0072 | Inf | 0.0072 | 1 | 1 | negative regulation of locomotion involved in locomotory behavior |
| GO:1900131 | 0.0072 | Inf | 0.0072 | 1 | 1 | negative regulation of lipid binding |
| GO:1901639 | 0.0072 | Inf | 0.0072 | 1 | 1 | XDP catabolic process |
| GO:2000326 | 0.0072 | Inf | 0.0072 | 1 | 1 | negative regulation of ligand-dependent nuclear receptor transcription coactivator activity |
| GO:2000383 | 0.0072 | Inf | 0.0072 | 1 | 1 | regulation of ectoderm development |
| GO:2000657 | 0.0072 | Inf | 0.0072 | 1 | 1 | negative regulation of apolipoprotein binding |
| GO:2001051 | 0.0072 | Inf | 0.0072 | 1 | 1 | positive regulation of tendon cell differentiation |
| GO:0060039 | 0.0073 | 17.5383 | 0.1295 | 2 | 18 | pericardium development |
| GO:0060231 | 0.0073 | 17.5383 | 0.1295 | 2 | 18 | mesenchymal to epithelial transition |
| GO:0007259 | 0.0073 | 4.3817 | 1.2089 | 5 | 168 | JAK-STAT cascade |
| GO:0010604 | 0.0075 | 1.7489 | 20.1634 | 31 | 2802 | positive regulation of macromolecule metabolic process |
| GO:0006415 | 0.0081 | 4.2756 | 1.2377 | 5 | 172 | translational termination |
| GO:0072599 | 0.0082 | 5.3606 | 0.7916 | 4 | 110 | establishment of protein localization to endoplasmic reticulum |
| GO:1904589 | 0.0085 | 4.2245 | 1.2521 | 5 | 174 | regulation of protein import |
| GO:0045184 | 0.0087 | 1.8558 | 13.7445 | 23 | 1910 | establishment of protein localization |
| GO:0009880 | 0.0088 | 7.5653 | 0.4246 | 3 | 59 | embryonic pattern specification |
| GO:0006886 | 0.0091 | 2.4386 | 4.8475 | 11 | 706 | intracellular protein transport |
| GO:0000184 | 0.0093 | 5.1643 | 0.8204 | 4 | 114 | nuclear-transcribed mRNA catabolic process, nonsense-mediated decay |
| GO:0043410 | 0.0093 | 2.5444 | 4.1953 | 10 | 583 | positive regulation of MAPK cascade |
| GO:0042273 | 0.0096 | 15.0188 | 0.1486 | 2 | 21 | ribosomal large subunit biogenesis |
| GO:0003151 | 0.0096 | 7.3034 | 0.439 | 3 | 61 | outflow tract morphogenesis |
| GO:0000027 | 0.0099 | 14.7662 | 0.1511 | 2 | 21 | ribosomal large subunit assembly |
| GOMFID | Pvalue | OddsRatio | ExpCount | Count | Size | Term |
| GO:0050911 | 0 | 5.4327 | 2.0735 | 10 | 370 | detection of chemical stimulus involved in sensory perception of smell |
| GO:0009593 | 2e-04 | 4.4113 | 2.5274 | 10 | 451 | detection of chemical stimulus |
| GO:0007606 | 3e-04 | 4.2813 | 2.6003 | 10 | 464 | sensory perception of chemical stimulus |
| GO:0050906 | 3e-04 | 4.2813 | 2.6003 | 10 | 464 | detection of stimulus involved in sensory perception |
| GO:0002475 | 0.0031 | 27.9106 | 0.0841 | 2 | 15 | antigen processing and presentation via MHC class Ib |
| GO:0042774 | 0.0056 | Inf | 0.0056 | 1 | 1 | plasma membrane ATP synthesis coupled electron transport |
| GO:0048006 | 0.0056 | Inf | 0.0056 | 1 | 1 | antigen processing and presentation, endogenous lipid antigen via MHC class Ib |
| GO:0071528 | 0.0056 | Inf | 0.0056 | 1 | 1 | tRNA re-export from nucleus |
| GO:1901557 | 0.0056 | Inf | 0.0056 | 1 | 1 | response to fenofibrate |
| GO:1990261 | 0.0056 | Inf | 0.0056 | 1 | 1 | pre-mRNA catabolic process |
| GO:0031058 | 0.0089 | 7.5143 | 0.4259 | 3 | 76 | positive regulation of histone modification |
| GOMFID | Pvalue | OddsRatio | ExpCount | Count | Size | Term |
| GO:0007597 | 7e-04 | 59.6229 | 0.0401 | 2 | 17 | blood coagulation, intrinsic pathway |
| GO:0050878 | 0.0011 | 5.0414 | 1.6494 | 7 | 700 | regulation of body fluid levels |
| GO:0007186 | 0.0012 | 4.0535 | 2.7332 | 9 | 1160 | G-protein coupled receptor signaling pathway |
| GO:0007596 | 0.0017 | 5.3802 | 1.2959 | 6 | 550 | blood coagulation |
| GO:0000002 | 0.0021 | 33.0984 | 0.0683 | 2 | 29 | mitochondrial genome maintenance |
| GO:0051291 | 0.0023 | 12.5934 | 0.2639 | 3 | 112 | protein heterooligomerization |
| GO:1903723 | 0.0024 | Inf | 0.0024 | 1 | 1 | negative regulation of centriole elongation |
| GO:0019068 | 0.0038 | 24.1375 | 0.0919 | 2 | 39 | virion assembly |
| GO:0050913 | 0.0038 | 24.1375 | 0.0919 | 2 | 39 | sensory perception of bitter taste |
| GO:0000387 | 0.004 | 23.5008 | 0.0942 | 2 | 40 | spliceosomal snRNP assembly |
| GO:0050832 | 0.004 | 23.5008 | 0.0942 | 2 | 40 | defense response to fungus |
| GO:0007606 | 0.0044 | 5.1767 | 1.0933 | 5 | 464 | sensory perception of chemical stimulus |
| GO:0050829 | 0.0046 | 21.777 | 0.1013 | 2 | 43 | defense response to Gram-negative bacterium |
| GO:0003342 | 0.0047 | 435.1389 | 0.0047 | 1 | 2 | proepicardium development |
| GO:0006864 | 0.0047 | 435.1389 | 0.0047 | 1 | 2 | pyrimidine nucleotide transport |
| GO:1902723 | 0.0047 | 435.1389 | 0.0047 | 1 | 2 | negative regulation of skeletal muscle satellite cell proliferation |
| GO:2000707 | 0.0047 | 435.1389 | 0.0047 | 1 | 2 | positive regulation of dense core granule biogenesis |
| GO:0001775 | 0.0053 | 3.7443 | 2.1819 | 7 | 926 | cell activation |
| GO:0000245 | 0.0069 | 17.4958 | 0.1249 | 2 | 53 | spliceosomal complex assembly |
| GO:1900738 | 0.0071 | 217.5556 | 0.0071 | 1 | 3 | positive regulation of phospholipase C-activating G-protein coupled receptor signaling pathway |
| GO:0070527 | 0.0072 | 17.1582 | 0.1272 | 2 | 54 | platelet aggregation |
| GO:0051881 | 0.0074 | 16.8334 | 0.1296 | 2 | 55 | regulation of mitochondrial membrane potential |
| GO:0010992 | 0.0094 | 145.0278 | 0.0094 | 1 | 4 | ubiquitin homeostasis |
| GO:0032100 | 0.0094 | 145.0278 | 0.0094 | 1 | 4 | positive regulation of appetite |
| GO:0051344 | 0.0094 | 145.0278 | 0.0094 | 1 | 4 | negative regulation of cyclic-nucleotide phosphodiesterase activity |
| GOMFID | Pvalue | OddsRatio | ExpCount | Count | Size | Term |
| GO:0031943 | 2e-04 | 38.5398 | 0.1169 | 3 | 9 | regulation of glucocorticoid metabolic process |
| GO:0033484 | 5e-04 | 153.4455 | 0.039 | 2 | 3 | nitric oxide homeostasis |
| GO:0034441 | 5e-04 | 153.4455 | 0.039 | 2 | 3 | plasma lipoprotein particle oxidation |
| GO:0060129 | 5e-04 | 153.4455 | 0.039 | 2 | 3 | thyroid-stimulating hormone-secreting cell differentiation |
| GO:0006041 | 0.001 | 76.7178 | 0.052 | 2 | 4 | glucosamine metabolic process |
| GO:0006040 | 0.0012 | 9.6669 | 0.4677 | 4 | 36 | amino sugar metabolic process |
| GO:1902931 | 0.0013 | 16.5085 | 0.2208 | 3 | 17 | negative regulation of alcohol biosynthetic process |
| GO:0042127 | 0.0014 | 1.8812 | 19.1619 | 33 | 1475 | regulation of cell proliferation |
| GO:0042160 | 0.0016 | 51.1419 | 0.065 | 2 | 5 | lipoprotein modification |
| GO:2000064 | 0.0016 | 51.1419 | 0.065 | 2 | 5 | regulation of cortisol biosynthetic process |
| GO:0035914 | 0.0017 | 6.3588 | 0.8574 | 5 | 66 | skeletal muscle cell differentiation |
| GO:0044711 | 0.002 | 1.7925 | 21.968 | 36 | 1691 | single-organism biosynthetic process |
| GO:0016202 | 0.0022 | 4.8116 | 1.3381 | 6 | 103 | regulation of striated muscle tissue development |
| GO:0006048 | 0.0024 | 38.354 | 0.0779 | 2 | 6 | UDP-N-acetylglucosamine biosynthetic process |
| GO:0032347 | 0.0024 | 38.354 | 0.0779 | 2 | 6 | regulation of aldosterone biosynthetic process |
| GO:0070661 | 0.0026 | 3.0692 | 3.4556 | 10 | 266 | leukocyte proliferation |
| GO:0006700 | 0.0028 | 12.1603 | 0.2858 | 3 | 22 | C21-steroid hormone biosynthetic process |
| GO:0010894 | 0.0032 | 11.5515 | 0.2988 | 3 | 23 | negative regulation of steroid biosynthetic process |
| GO:0033591 | 0.0034 | 30.6812 | 0.0909 | 2 | 7 | response to L-ascorbic acid |
| GO:0009636 | 0.0042 | 3.0505 | 3.1179 | 9 | 240 | response to toxic substance |
| GO:0032353 | 0.0045 | 25.566 | 0.1039 | 2 | 8 | negative regulation of hormone biosynthetic process |
| GO:0033080 | 0.0045 | 25.566 | 0.1039 | 2 | 8 | immature T cell proliferation in thymus |
| GO:0051384 | 0.0051 | 3.5406 | 2.0916 | 7 | 161 | response to glucocorticoid |
| GO:0043124 | 0.0053 | 6.1796 | 0.7015 | 4 | 54 | negative regulation of I-kappaB kinase/NF-kappaB signaling |
| GO:0051154 | 0.0056 | 9.2382 | 0.3638 | 3 | 28 | negative regulation of striated muscle cell differentiation |
| GO:0046651 | 0.0056 | 2.9098 | 3.2608 | 9 | 251 | lymphocyte proliferation |
| GO:0034502 | 0.0056 | 6.058 | 0.7145 | 4 | 55 | protein localization to chromosome |
| GO:0051186 | 0.0057 | 2.5799 | 4.4949 | 11 | 346 | cofactor metabolic process |
| GO:0030638 | 0.0057 | 21.9123 | 0.1169 | 2 | 9 | polyketide metabolic process |
| GO:0034650 | 0.0057 | 21.9123 | 0.1169 | 2 | 9 | cortisol metabolic process |
| GO:0071637 | 0.0057 | 21.9123 | 0.1169 | 2 | 9 | regulation of monocyte chemotactic protein-1 production |
| GO:0060537 | 0.0059 | 2.5643 | 4.5209 | 11 | 348 | muscle tissue development |
| GO:1990542 | 0.0064 | 5.8287 | 0.7405 | 4 | 57 | mitochondrial transmembrane transport |
| GO:0060538 | 0.0068 | 3.3432 | 2.2085 | 7 | 170 | skeletal muscle organ development |
| GO:0032341 | 0.0071 | 19.172 | 0.1299 | 2 | 10 | aldosterone metabolic process |
| GO:0033198 | 0.0074 | 8.2468 | 0.4027 | 3 | 31 | response to ATP |
| GO:0009225 | 0.0081 | 7.9619 | 0.4157 | 3 | 32 | nucleotide-sugar metabolic process |
| GO:0031128 | 0.0088 | 7.696 | 0.4287 | 3 | 33 | developmental induction |
| GO:0042181 | 0.0088 | 7.696 | 0.4287 | 3 | 33 | ketone biosynthetic process |
| GO:0009168 | 0.0096 | 5.1463 | 0.8314 | 4 | 64 | purine ribonucleoside monophosphate biosynthetic process |
| GO:0010718 | 0.0096 | 7.4473 | 0.4417 | 3 | 34 | positive regulation of epithelial to mesenchymal transition |
| GOMFID | Pvalue | OddsRatio | ExpCount | Count | Size | Term |
| GO:0051971 | 4e-04 | 88.339 | 0.0311 | 2 | 8 | positive regulation of transmission of nerve impulse |
| GO:0051602 | 6e-04 | 20.175 | 0.167 | 3 | 43 | response to electrical stimulus |
| GO:0050877 | 7e-04 | 3.2565 | 4.7159 | 13 | 1214 | neurological system process |
| GO:0009746 | 7e-04 | 7.7568 | 0.7109 | 5 | 183 | response to hexose |
| GO:0071333 | 0.001 | 9.8189 | 0.4467 | 4 | 115 | cellular response to glucose stimulus |
| GO:0071326 | 0.0011 | 9.5586 | 0.4584 | 4 | 118 | cellular response to monosaccharide stimulus |
| GO:0009743 | 0.0015 | 6.5612 | 0.8352 | 5 | 215 | response to carbohydrate |
| GO:1901137 | 0.0015 | 3.4595 | 3.298 | 10 | 849 | carbohydrate derivative biosynthetic process |
| GO:0042593 | 0.0015 | 6.4985 | 0.843 | 5 | 217 | glucose homeostasis |
| GO:0060055 | 0.0019 | 35.3153 | 0.066 | 2 | 17 | angiogenesis involved in wound healing |
| GO:0021766 | 0.0027 | 11.6739 | 0.2797 | 3 | 72 | hippocampus development |
| GO:0050911 | 0.0031 | 4.5788 | 1.4373 | 6 | 370 | detection of chemical stimulus involved in sensory perception of smell |
| GO:0055082 | 0.0031 | 3.6027 | 2.4745 | 8 | 637 | cellular chemical homeostasis |
| GO:0031124 | 0.0038 | 10.321 | 0.3147 | 3 | 81 | mRNA 3'-end processing |
| GO:0032812 | 0.0039 | Inf | 0.0039 | 1 | 1 | positive regulation of epinephrine secretion |
| GO:0036394 | 0.0039 | Inf | 0.0039 | 1 | 1 | amylase secretion |
| GO:0060691 | 0.0039 | Inf | 0.0039 | 1 | 1 | epithelial cell maturation involved in salivary gland development |
| GO:0090297 | 0.0039 | Inf | 0.0039 | 1 | 1 | positive regulation of mitochondrial DNA replication |
| GO:1900100 | 0.0039 | Inf | 0.0039 | 1 | 1 | positive regulation of plasma cell differentiation |
| GO:1900210 | 0.0039 | Inf | 0.0039 | 1 | 1 | positive regulation of cardiolipin metabolic process |
| GO:1900413 | 0.0039 | Inf | 0.0039 | 1 | 1 | positive regulation of phospholipid biosynthetic process by positive regulation of transcription from RNA polymerase II promoter |
| GO:1903489 | 0.0039 | Inf | 0.0039 | 1 | 1 | positive regulation of lactation |
| GO:1990046 | 0.0039 | Inf | 0.0039 | 1 | 1 | stress-induced mitochondrial fusion |
| GO:0071426 | 0.0044 | 9.815 | 0.3302 | 3 | 85 | ribonucleoprotein complex export from nucleus |
| GO:0033036 | 0.0045 | 2.231 | 10.3175 | 19 | 2656 | macromolecule localization |
| GO:1901566 | 0.0045 | 2.6704 | 5.151 | 12 | 1326 | organonitrogen compound biosynthetic process |
| GO:0051491 | 0.0049 | 21.1756 | 0.1049 | 2 | 27 | positive regulation of filopodium assembly |
| GO:0042990 | 0.005 | 9.3561 | 0.3457 | 3 | 89 | regulation of transcription factor import into nucleus |
| GO:0006913 | 0.0052 | 4.0939 | 1.6005 | 6 | 412 | nucleocytoplasmic transport |
| GO:0071702 | 0.0054 | 2.2238 | 9.696 | 18 | 2496 | organic substance transport |
| GO:0007043 | 0.006 | 8.7425 | 0.369 | 3 | 95 | cell-cell junction assembly |
| GO:0043267 | 0.0068 | 17.6407 | 0.1243 | 2 | 32 | negative regulation of potassium ion transport |
| GO:0006614 | 0.0073 | 8.1207 | 0.3962 | 3 | 102 | SRP-dependent cotranslational protein targeting to membrane |
| GO:0051928 | 0.0073 | 8.1207 | 0.3962 | 3 | 102 | positive regulation of calcium ion transport |
| GO:0006880 | 0.0078 | 260.6833 | 0.0078 | 1 | 2 | intracellular sequestering of iron ion |
| GO:0035498 | 0.0078 | 260.6833 | 0.0078 | 1 | 2 | carnosine metabolic process |
| GO:0042309 | 0.0078 | 260.6833 | 0.0078 | 1 | 2 | homoiothermy |
| GO:0060532 | 0.0078 | 260.6833 | 0.0078 | 1 | 2 | bronchus cartilage development |
| GO:0061145 | 0.0078 | 260.6833 | 0.0078 | 1 | 2 | lung smooth muscle development |
| GO:0046907 | 0.0079 | 2.3139 | 6.9845 | 14 | 1798 | intracellular transport |
| GO:0009593 | 0.0079 | 3.7255 | 1.752 | 6 | 451 | detection of chemical stimulus |
| GO:0007631 | 0.0081 | 7.8033 | 0.4118 | 3 | 106 | feeding behavior |
| GO:0044267 | 0.0085 | 1.9263 | 18.6888 | 28 | 4811 | cellular protein metabolic process |
| GO:0072599 | 0.009 | 7.5097 | 0.4273 | 3 | 110 | establishment of protein localization to endoplasmic reticulum |
| GO:0007606 | 0.0091 | 3.6167 | 1.8025 | 6 | 464 | sensory perception of chemical stimulus |
| GO:0050906 | 0.0091 | 3.6167 | 1.8025 | 6 | 464 | detection of stimulus involved in sensory perception |
| GOMFID | Pvalue | OddsRatio | ExpCount | Count | Size | Term |
| GO:0034641 | 0 | 1.847 | 73.0232 | 101 | 6132 | cellular nitrogen compound metabolic process |
| GO:0009059 | 0 | 2.5707 | 13.7776 | 30 | 1292 | macromolecule biosynthetic process |
| GO:0090304 | 1e-04 | 1.8171 | 56.518 | 82 | 4746 | nucleic acid metabolic process |
| GO:0043604 | 1e-04 | 2.7307 | 8.4313 | 21 | 708 | amide biosynthetic process |
| GO:0006412 | 1e-04 | 2.8763 | 7.2166 | 19 | 606 | translation |
| GO:0045082 | 1e-04 | Inf | 0.0238 | 2 | 2 | positive regulation of interleukin-10 biosynthetic process |
| GO:0006518 | 2e-04 | 2.5624 | 8.9433 | 21 | 751 | peptide metabolic process |
| GO:0044260 | 4e-04 | 1.6649 | 95.0302 | 118 | 7980 | cellular macromolecule metabolic process |
| GO:0044249 | 0.0011 | 2.0214 | 17.7359 | 31 | 1690 | cellular biosynthetic process |
| GO:0033554 | 0.0013 | 1.8402 | 22.2809 | 37 | 1871 | cellular response to stress |
| GO:2000112 | 0.0013 | 1.6412 | 43.621 | 62 | 3663 | regulation of cellular macromolecule biosynthetic process |
| GO:0009889 | 0.0015 | 1.6141 | 47.4556 | 66 | 3985 | regulation of biosynthetic process |
| GO:0016071 | 0.0018 | 2.4401 | 7.0141 | 16 | 589 | mRNA metabolic process |
| GO:0071902 | 0.002 | 3.1782 | 3.3463 | 10 | 281 | positive regulation of protein serine/threonine kinase activity |
| GO:1901362 | 0.002 | 1.5853 | 49.7658 | 68 | 4179 | organic cyclic compound biosynthetic process |
| GO:0051412 | 0.0032 | 11.4827 | 0.2977 | 3 | 25 | response to corticosterone |
| GO:0044238 | 0.0033 | 1.5602 | 115.8583 | 134 | 9729 | primary metabolic process |
| GO:0018130 | 0.004 | 1.5386 | 48.3011 | 65 | 4056 | heterocycle biosynthetic process |
| GO:0019438 | 0.0041 | 1.537 | 48.3368 | 65 | 4059 | aromatic compound biosynthetic process |
| GO:0051881 | 0.0041 | 6.6281 | 0.655 | 4 | 55 | regulation of mitochondrial membrane potential |
| GO:1901566 | 0.0041 | 1.8469 | 15.7907 | 27 | 1326 | organonitrogen compound biosynthetic process |
| GO:0006473 | 0.0041 | 3.6858 | 2.0125 | 7 | 169 | protein acetylation |
| GO:0006396 | 0.005 | 2.0853 | 9.1934 | 18 | 772 | RNA processing |
| GO:0006996 | 0.0051 | 1.5444 | 41.537 | 57 | 3488 | organelle organization |
| GO:0000187 | 0.0054 | 3.9852 | 1.5957 | 6 | 134 | activation of MAPK activity |
| GO:0002862 | 0.006 | 20.9568 | 0.1191 | 2 | 10 | negative regulation of inflammatory response to antigenic stimulus |
| GO:0010561 | 0.006 | 20.9568 | 0.1191 | 2 | 10 | negative regulation of glycoprotein biosynthetic process |
| GO:0006725 | 0.0067 | 1.8528 | 15.0038 | 25 | 1432 | cellular aromatic compound metabolic process |
| GO:0032774 | 0.0067 | 1.5166 | 42.9422 | 58 | 3606 | RNA biosynthetic process |
| GO:0006357 | 0.0069 | 1.6924 | 20.4708 | 32 | 1719 | regulation of transcription from RNA polymerase II promoter |
| GO:0045333 | 0.0069 | 3.3321 | 2.215 | 7 | 186 | cellular respiration |
| GO:0033674 | 0.0074 | 2.1494 | 7.3833 | 15 | 620 | positive regulation of kinase activity |
| GO:0006614 | 0.0075 | 4.367 | 1.2147 | 5 | 102 | SRP-dependent cotranslational protein targeting to membrane |
| GO:0043405 | 0.0082 | 2.344 | 5.3946 | 12 | 453 | regulation of MAP kinase activity |
| GO:0006364 | 0.0083 | 3.6147 | 1.7506 | 6 | 147 | rRNA processing |
| GO:0034728 | 0.0083 | 3.6147 | 1.7506 | 6 | 147 | nucleosome organization |
| GO:0000729 | 0.0086 | 16.7632 | 0.1429 | 2 | 12 | DNA double-strand break processing |
| GO:0043217 | 0.0086 | 16.7632 | 0.1429 | 2 | 12 | myelin maintenance |
| GO:0051171 | 0.009 | 1.4741 | 48.1106 | 63 | 4040 | regulation of nitrogen compound metabolic process |
| GO:0071704 | 0.0097 | 1.4735 | 119.4785 | 135 | 10033 | organic substance metabolic process |
| GOMFID | Pvalue | OddsRatio | ExpCount | Count | Size | Term |
| GO:0006807 | 1e-04 | 1.7907 | 67.4269 | 91 | 6417 | nitrogen compound metabolic process |
| GO:0070525 | 2e-04 | 31.9527 | 0.1261 | 3 | 12 | tRNA threonylcarbamoyladenosine metabolic process |
| GO:0031960 | 5e-04 | 4.8064 | 1.7968 | 8 | 171 | response to corticosteroid |
| GO:0006400 | 6e-04 | 8.0615 | 0.683 | 5 | 65 | tRNA modification |
| GO:0014826 | 6e-04 | 95.3129 | 0.042 | 2 | 4 | vein smooth muscle contraction |
| GO:0071389 | 6e-04 | 95.3129 | 0.042 | 2 | 4 | cellular response to mineralocorticoid stimulus |
| GO:0051343 | 0.0011 | 63.5378 | 0.0525 | 2 | 5 | positive regulation of cyclic-nucleotide phosphodiesterase activity |
| GO:1901576 | 0.0013 | 1.6275 | 61.5952 | 81 | 5862 | organic substance biosynthetic process |
| GO:0070723 | 0.0013 | 15.9671 | 0.2207 | 3 | 21 | response to cholesterol |
| GO:0034470 | 0.0013 | 3.3757 | 3.1678 | 10 | 305 | ncRNA processing |
| GO:0019388 | 0.0016 | 47.6503 | 0.063 | 2 | 6 | galactose catabolic process |
| GO:0044237 | 0.0017 | 1.6702 | 101.65 | 120 | 9674 | cellular metabolic process |
| GO:0006139 | 0.0019 | 1.6051 | 55.6795 | 74 | 5299 | nucleobase-containing compound metabolic process |
| GO:0051412 | 0.0022 | 13.0606 | 0.2627 | 3 | 25 | response to corticosterone |
| GO:0010193 | 0.0022 | 38.1178 | 0.0736 | 2 | 7 | response to ozone |
| GO:0042045 | 0.0022 | 38.1178 | 0.0736 | 2 | 7 | epithelial fluid transport |
| GO:0046826 | 0.0022 | 38.1178 | 0.0736 | 2 | 7 | negative regulation of protein export from nucleus |
| GO:0060017 | 0.0022 | 38.1178 | 0.0736 | 2 | 7 | parathyroid gland development |
| GO:0071385 | 0.0026 | 7.5445 | 0.5779 | 4 | 55 | cellular response to glucocorticoid stimulus |
| GO:0010467 | 0.0028 | 1.5812 | 52.6323 | 70 | 5009 | gene expression |
| GO:0016070 | 0.0034 | 1.5919 | 43.8787 | 60 | 4250 | RNA metabolic process |
| GO:0030638 | 0.0038 | 27.2235 | 0.0946 | 2 | 9 | polyketide metabolic process |
| GO:0031053 | 0.0038 | 27.2235 | 0.0946 | 2 | 9 | primary miRNA processing |
| GO:0044706 | 0.0039 | 3.3617 | 2.5218 | 8 | 240 | multi-multicellular organism process |
| GO:0006399 | 0.004 | 3.7174 | 1.9964 | 7 | 190 | tRNA metabolic process |
| GO:0044271 | 0.0044 | 1.5543 | 47.9564 | 64 | 4564 | cellular nitrogen compound biosynthetic process |
| GO:0071548 | 0.0045 | 9.9036 | 0.3362 | 3 | 32 | response to dexamethasone |
| GO:0051085 | 0.0047 | 23.819 | 0.1051 | 2 | 10 | chaperone mediated protein folding requiring cofactor |
| GO:0042089 | 0.0052 | 4.7763 | 1.1138 | 5 | 106 | cytokine biosynthetic process |
| GO:0010870 | 0.0057 | 21.1711 | 0.1156 | 2 | 11 | positive regulation of receptor biosynthetic process |
| GO:0031620 | 0.0057 | 21.1711 | 0.1156 | 2 | 11 | regulation of fever generation |
| GO:0032308 | 0.0068 | 19.0528 | 0.1261 | 2 | 12 | positive regulation of prostaglandin secretion |
| GO:0034645 | 0.0073 | 1.5062 | 49.9003 | 65 | 4749 | cellular macromolecule biosynthetic process |
| GO:0033993 | 0.0076 | 2.001 | 9.6039 | 18 | 914 | response to lipid |
| GO:0032725 | 0.0079 | 17.3196 | 0.1366 | 2 | 13 | positive regulation of granulocyte macrophage colony-stimulating factor production |
| GO:0035815 | 0.0079 | 17.3196 | 0.1366 | 2 | 13 | positive regulation of renal sodium excretion |
| GO:0000122 | 0.0084 | 2.1197 | 7.5129 | 15 | 715 | negative regulation of transcription from RNA polymerase II promoter |
| GO:0018107 | 0.0088 | 5.2633 | 0.8091 | 4 | 77 | peptidyl-threonine phosphorylation |
| GO:0071359 | 0.0091 | 7.5536 | 0.4308 | 3 | 41 | cellular response to dsRNA |
| GO:0032924 | 0.0097 | 7.3594 | 0.4413 | 3 | 42 | activin receptor signaling pathway |
| GOMFID | Pvalue | OddsRatio | ExpCount | Count | Size | Term |
| GO:0042255 | 1e-04 | 11.2609 | 0.5044 | 5 | 48 | ribosome assembly |
| GO:0051771 | 0.0011 | 63.5378 | 0.0525 | 2 | 5 | negative regulation of nitric-oxide synthase biosynthetic process |
| GO:0031347 | 0.0013 | 2.4043 | 8.1013 | 18 | 771 | regulation of defense response |
| GO:0034622 | 0.0013 | 2.3358 | 8.8158 | 19 | 839 | cellular macromolecular complex assembly |
| GO:0086064 | 0.0015 | 15.1257 | 0.2312 | 3 | 22 | cell communication by electrical coupling involved in cardiac conduction |
| GO:0071918 | 0.0016 | 47.6503 | 0.063 | 2 | 6 | urea transmembrane transport |
| GO:0055078 | 0.0019 | 8.3673 | 0.5254 | 4 | 50 | sodium ion homeostasis |
| GO:0002027 | 0.002 | 6.0383 | 0.8931 | 5 | 85 | regulation of heart rate |
| GO:0034393 | 0.0022 | 38.1178 | 0.0736 | 2 | 7 | positive regulation of smooth muscle cell apoptotic process |
| GO:0070131 | 0.0022 | 38.1178 | 0.0736 | 2 | 7 | positive regulation of mitochondrial translation |
| GO:2000510 | 0.0029 | 31.7628 | 0.0841 | 2 | 8 | positive regulation of dendritic cell chemotaxis |
| GO:0010498 | 0.003 | 2.834 | 4.1295 | 11 | 393 | proteasomal protein catabolic process |
| GO:0032609 | 0.0042 | 5.0267 | 1.0613 | 5 | 101 | interferon-gamma production |
| GO:0019755 | 0.0047 | 23.819 | 0.1051 | 2 | 10 | one-carbon compound transport |
| GO:0032526 | 0.0052 | 4.7763 | 1.1138 | 5 | 106 | response to retinoic acid |
| GO:0030433 | 0.0054 | 6.1027 | 0.704 | 4 | 67 | ER-associated ubiquitin-dependent protein catabolic process |
| GO:0015793 | 0.0057 | 21.1711 | 0.1156 | 2 | 11 | glycerol transport |
| GO:0043268 | 0.0058 | 8.9734 | 0.3678 | 3 | 35 | positive regulation of potassium ion transport |
| GO:0098801 | 0.0063 | 8.7009 | 0.3783 | 3 | 36 | regulation of renal system process |
| GO:0000729 | 0.0068 | 19.0528 | 0.1261 | 2 | 12 | DNA double-strand break processing |
| GO:0001956 | 0.0068 | 19.0528 | 0.1261 | 2 | 12 | positive regulation of neurotransmitter secretion |
| GO:0032781 | 0.0073 | 8.2026 | 0.3993 | 3 | 38 | positive regulation of ATPase activity |
| GO:1903573 | 0.0073 | 8.2026 | 0.3993 | 3 | 38 | negative regulation of response to endoplasmic reticulum stress |
| GO:0034767 | 0.0076 | 4.3432 | 1.2189 | 5 | 116 | positive regulation of ion transmembrane transport |
| GO:0032102 | 0.0076 | 2.9826 | 2.8265 | 8 | 269 | negative regulation of response to external stimulus |
| GO:0002456 | 0.0076 | 5.49 | 0.7776 | 4 | 74 | T cell mediated immunity |
| GO:0030819 | 0.0076 | 5.49 | 0.7776 | 4 | 74 | positive regulation of cAMP biosynthetic process |
| GO:0000209 | 0.0079 | 3.2494 | 2.2696 | 7 | 216 | protein polyubiquitination |
| GO:0002693 | 0.0079 | 17.3196 | 0.1366 | 2 | 13 | positive regulation of cellular extravasation |
| GO:0034446 | 0.0092 | 5.1919 | 0.8196 | 4 | 78 | substrate adhesion-dependent cell spreading |
| GO:0031398 | 0.0097 | 3.4944 | 1.8073 | 6 | 172 | positive regulation of protein ubiquitination |
| GO:0032570 | 0.0097 | 7.3594 | 0.4413 | 3 | 42 | response to progesterone |
| GOMFID | Pvalue | OddsRatio | ExpCount | Count | Size | Term |
| GO:0006415 | 0 | 8.6272 | 0.9091 | 7 | 172 | translational termination |
| GO:0019083 | 1e-04 | 7.9452 | 0.9831 | 7 | 186 | viral transcription |
| GO:0016259 | 1e-04 | 12.6104 | 0.444 | 5 | 84 | selenocysteine metabolic process |
| GO:0006402 | 1e-04 | 7.2858 | 1.0677 | 7 | 202 | mRNA catabolic process |
| GO:0006414 | 1e-04 | 7.2858 | 1.0677 | 7 | 202 | translational elongation |
| GO:0044033 | 1e-04 | 7.1013 | 1.0941 | 7 | 207 | multi-organism metabolic process |
| GO:0043043 | 1e-04 | 4.0891 | 3.3405 | 12 | 632 | peptide biosynthetic process |
| GO:0043241 | 2e-04 | 5.5222 | 1.6068 | 8 | 304 | protein complex disassembly |
| GO:0006614 | 2e-04 | 10.2584 | 0.5391 | 5 | 102 | SRP-dependent cotranslational protein targeting to membrane |
| GO:0032571 | 3e-04 | 128.535 | 0.0264 | 2 | 5 | response to vitamin K |
| GO:0043603 | 3e-04 | 3.3185 | 4.8311 | 14 | 914 | cellular amide metabolic process |
| GO:0072599 | 3e-04 | 9.4719 | 0.5814 | 5 | 110 | establishment of protein localization to endoplasmic reticulum |
| GO:0000184 | 3e-04 | 9.122 | 0.6026 | 5 | 114 | nuclear-transcribed mRNA catabolic process, nonsense-mediated decay |
| GO:0006413 | 4e-04 | 5.6857 | 1.3531 | 7 | 256 | translational initiation |
| GO:0017183 | 8e-04 | 64.2551 | 0.0423 | 2 | 8 | peptidyl-diphthamide biosynthetic process from peptidyl-histidine |
| GO:0031047 | 0.0012 | 6.8892 | 0.7876 | 5 | 149 | gene silencing by RNA |
| GO:0018202 | 0.0012 | 48.1852 | 0.0529 | 2 | 10 | peptidyl-histidine modification |
| GO:0060158 | 0.0012 | 48.1852 | 0.0529 | 2 | 10 | phospholipase C-activating dopamine receptor signaling pathway |
| GO:0007191 | 0.0018 | 38.5432 | 0.0634 | 2 | 12 | adenylate cyclase-activating dopamine receptor signaling pathway |
| GO:0017187 | 0.0018 | 38.5432 | 0.0634 | 2 | 12 | peptidyl-glutamic acid carboxylation |
| GO:0019058 | 0.0021 | 3.7862 | 2.3045 | 8 | 436 | viral life cycle |
| GO:0044265 | 0.0026 | 2.8073 | 4.7518 | 12 | 899 | cellular macromolecule catabolic process |
| GO:0006612 | 0.0028 | 5.5611 | 0.9673 | 5 | 183 | protein targeting to membrane |
| GO:0016482 | 0.0038 | 2.4807 | 6.3163 | 14 | 1195 | cytoplasmic transport |
| GO:0006465 | 0.004 | 24.0802 | 0.0951 | 2 | 18 | signal peptide processing |
| GO:0034655 | 0.004 | 3.7546 | 2.0138 | 7 | 381 | nucleobase-containing compound catabolic process |
| GO:0014739 | 0.0053 | Inf | 0.0053 | 1 | 1 | positive regulation of muscle hyperplasia |
| GO:0044802 | 0.0056 | 2.6449 | 4.5668 | 11 | 864 | single-organism membrane organization |
| GO:0022411 | 0.0058 | 2.7742 | 3.9378 | 10 | 745 | cellular component disassembly |
| GO:0050927 | 0.0071 | 17.5062 | 0.1269 | 2 | 24 | positive regulation of positive chemotaxis |
| GO:0060326 | 0.0072 | 4.426 | 1.2051 | 5 | 228 | cell chemotaxis |
| GO:0002690 | 0.0087 | 7.5696 | 0.4228 | 3 | 80 | positive regulation of leukocyte chemotaxis |
| GO:0040029 | 0.0095 | 4.1254 | 1.2897 | 5 | 244 | regulation of gene expression, epigenetic |
| GOMFID | Pvalue | OddsRatio | ExpCount | Count | Size | Term |
| GO:0034641 | 1e-04 | 1.7209 | 77.7092 | 104 | 6132 | cellular nitrogen compound metabolic process |
| GO:1901576 | 4e-04 | 1.6396 | 74.2876 | 98 | 5862 | organic substance biosynthetic process |
| GO:1901360 | 6e-04 | 1.6115 | 72.2853 | 95 | 5704 | organic cyclic compound metabolic process |
| GO:0034645 | 6e-04 | 1.6274 | 60.1828 | 82 | 4749 | cellular macromolecule biosynthetic process |
| GO:0046292 | 9e-04 | 78.6904 | 0.0507 | 2 | 4 | formaldehyde metabolic process |
| GO:0006725 | 0.001 | 1.5766 | 69.586 | 91 | 5491 | cellular aromatic compound metabolic process |
| GO:0010557 | 0.0018 | 1.8353 | 20.2637 | 34 | 1599 | positive regulation of macromolecule biosynthetic process |
| GO:0009249 | 0.0023 | 39.3401 | 0.076 | 2 | 6 | protein lipoylation |
| GO:0036123 | 0.0023 | 39.3401 | 0.076 | 2 | 6 | histone H3-K9 dimethylation |
| GO:0090304 | 0.0026 | 1.5287 | 60.1448 | 79 | 4746 | nucleic acid metabolic process |
| GO:0051304 | 0.0029 | 5.5241 | 0.9758 | 5 | 77 | chromosome separation |
| GO:2000816 | 0.0031 | 7.2075 | 0.6083 | 4 | 48 | negative regulation of mitotic sister chromatid separation |
| GO:1901409 | 0.0032 | 31.4701 | 0.0887 | 2 | 7 | positive regulation of phosphorylation of RNA polymerase II C-terminal domain |
| GO:0033046 | 0.0039 | 6.7461 | 0.6463 | 4 | 51 | negative regulation of sister chromatid segregation |
| GO:0031325 | 0.0041 | 1.5855 | 35.7244 | 51 | 2819 | positive regulation of cellular metabolic process |
| GO:0006273 | 0.0043 | 26.2234 | 0.1014 | 2 | 8 | lagging strand elongation |
| GO:0021796 | 0.0043 | 26.2234 | 0.1014 | 2 | 8 | cerebral cortex regionalization |
| GO:0046483 | 0.0044 | 1.8731 | 16.0594 | 27 | 1417 | heterocycle metabolic process |
| GO:0006261 | 0.0044 | 4.1601 | 1.5334 | 6 | 121 | DNA-dependent DNA replication |
| GO:0043374 | 0.0054 | 22.4757 | 0.1141 | 2 | 9 | CD8-positive, alpha-beta T cell differentiation |
| GO:0051983 | 0.0057 | 4.6753 | 1.1405 | 5 | 90 | regulation of chromosome segregation |
| GO:0002548 | 0.0066 | 5.7619 | 0.7477 | 4 | 59 | monocyte chemotaxis |
| GO:0002634 | 0.0067 | 19.665 | 0.1267 | 2 | 10 | regulation of germinal center formation |
| GO:0045839 | 0.007 | 5.6586 | 0.7604 | 4 | 60 | negative regulation of mitotic nuclear division |
| GO:0051173 | 0.0071 | 1.6611 | 22.1139 | 34 | 1745 | positive regulation of nitrogen compound metabolic process |
| GO:0018130 | 0.0081 | 1.4652 | 51.4006 | 67 | 4056 | heterocycle biosynthetic process |
| GO:0006739 | 0.0083 | 7.8949 | 0.4182 | 3 | 33 | NADP metabolic process |
| GO:0033044 | 0.0083 | 2.724 | 3.4723 | 9 | 274 | regulation of chromosome organization |
| GO:0043604 | 0.0087 | 2.0024 | 8.9723 | 17 | 708 | amide biosynthetic process |
| GO:0035115 | 0.009 | 7.6397 | 0.4309 | 3 | 34 | embryonic forelimb morphogenesis |
| GO:0051254 | 0.0092 | 1.6906 | 18.3755 | 29 | 1450 | positive regulation of RNA metabolic process |
| GO:0060255 | 0.0096 | 1.4196 | 69.662 | 86 | 5497 | regulation of macromolecule metabolic process |
| GO:0043117 | 0.0097 | 15.7299 | 0.1521 | 2 | 12 | positive regulation of vascular permeability |
| GO:0060795 | 0.0097 | 7.4005 | 0.4435 | 3 | 35 | cell fate commitment involved in formation of primary germ layer |
| GO:0033047 | 0.0098 | 5.109 | 0.8364 | 4 | 66 | regulation of mitotic sister chromatid segregation |
| GO:0035914 | 0.0098 | 5.109 | 0.8364 | 4 | 66 | skeletal muscle cell differentiation |
| GO:0006357 | 0.0099 | 1.6293 | 21.7844 | 33 | 1719 | regulation of transcription from RNA polymerase II promoter |
| GOMFID | Pvalue | OddsRatio | ExpCount | Count | Size | Term |
| GO:1902361 | 1e-04 | Inf | 0.0232 | 2 | 2 | mitochondrial pyruvate transmembrane transport |
| GO:0006848 | 4e-04 | 172.4444 | 0.0348 | 2 | 3 | pyruvate transport |
| GO:0044237 | 4e-04 | 1.7502 | 112.123 | 134 | 9674 | cellular metabolic process |
| GO:0006807 | 7e-04 | 1.6247 | 74.3739 | 96 | 6417 | nitrogen compound metabolic process |
| GO:1901576 | 9e-04 | 1.6159 | 67.9414 | 89 | 5862 | organic substance biosynthetic process |
| GO:0006771 | 0.0013 | 57.4741 | 0.058 | 2 | 5 | riboflavin metabolic process |
| GO:0044267 | 0.0015 | 1.5962 | 55.7602 | 75 | 4811 | cellular protein metabolic process |
| GO:0043603 | 0.0021 | 2.1366 | 10.5934 | 21 | 914 | cellular amide metabolic process |
| GO:0035751 | 0.0036 | 28.7315 | 0.0927 | 2 | 8 | regulation of lysosomal lumen pH |
| GO:0034502 | 0.0038 | 6.8165 | 0.6375 | 4 | 55 | protein localization to chromosome |
| GO:0043666 | 0.0038 | 6.8165 | 0.6375 | 4 | 55 | regulation of phosphoprotein phosphatase activity |
| GO:0006415 | 0.0039 | 3.7227 | 1.9935 | 7 | 172 | translational termination |
| GO:0010467 | 0.0049 | 1.504 | 58.055 | 75 | 5009 | gene expression |
| GO:1901687 | 0.0054 | 9.2735 | 0.3593 | 3 | 31 | glutathione derivative biosynthetic process |
| GO:1904816 | 0.0057 | 21.5458 | 0.1159 | 2 | 10 | positive regulation of protein localization to chromosome, telomeric region |
| GO:0006139 | 0.0062 | 1.4796 | 61.4162 | 78 | 5299 | nucleobase-containing compound metabolic process |
| GO:0034645 | 0.0065 | 1.5019 | 51.3338 | 67 | 4547 | cellular macromolecule biosynthetic process |
| GO:0043043 | 0.0068 | 2.1697 | 7.325 | 15 | 632 | peptide biosynthetic process |
| GO:0006047 | 0.0069 | 19.1506 | 0.1275 | 2 | 11 | UDP-N-acetylglucosamine metabolic process |
| GO:0035914 | 0.0072 | 5.6031 | 0.7649 | 4 | 66 | skeletal muscle cell differentiation |
| GO:0070266 | 0.0076 | 8.1123 | 0.4057 | 3 | 35 | necroptotic process |
| GO:0000423 | 0.0086 | 3.5901 | 1.7617 | 6 | 152 | macromitophagy |
| GO:0022613 | 0.0089 | 2.5424 | 4.1377 | 10 | 357 | ribonucleoprotein complex biogenesis |
| GO:0044710 | 0.0092 | 1.4492 | 61.335 | 77 | 5292 | single-organism metabolic process |
| GO:0006414 | 0.0093 | 3.1438 | 2.3412 | 7 | 202 | translational elongation |
| GO:0051290 | 0.0096 | 7.4155 | 0.4404 | 3 | 38 | protein heterotetramerization |
| GO:0009566 | 0.0097 | 3.4934 | 1.8081 | 6 | 156 | fertilization |
| GOMFID | Pvalue | OddsRatio | ExpCount | Count | Size | Term |
| GO:0006880 | 0 | Inf | 0.0079 | 2 | 2 | intracellular sequestering of iron ion |
| GO:0000042 | 0 | 52.9695 | 0.0711 | 3 | 18 | protein targeting to Golgi |
| GO:1901137 | 4e-04 | 3.81 | 3.3521 | 11 | 849 | carbohydrate derivative biosynthetic process |
| GO:0006891 | 6e-04 | 19.8318 | 0.1698 | 3 | 43 | intra-Golgi vesicle-mediated transport |
| GO:0032922 | 0.0016 | 14.151 | 0.2329 | 3 | 59 | circadian regulation of gene expression |
| GO:0050911 | 0.0033 | 4.4968 | 1.4609 | 6 | 370 | detection of chemical stimulus involved in sensory perception of smell |
| GO:0017004 | 0.0037 | 24.7937 | 0.0908 | 2 | 23 | cytochrome complex assembly |
| GO:0070098 | 0.0037 | 10.4137 | 0.3119 | 3 | 79 | chemokine-mediated signaling pathway |
| GO:0036394 | 0.0039 | Inf | 0.0039 | 1 | 1 | amylase secretion |
| GO:0043048 | 0.0039 | Inf | 0.0039 | 1 | 1 | dolichyl monophosphate biosynthetic process |
| GO:0061723 | 0.0039 | Inf | 0.0039 | 1 | 1 | glycophagy |
| GO:1990079 | 0.0039 | Inf | 0.0039 | 1 | 1 | cartilage homeostasis |
| GO:0030593 | 0.0048 | 9.5311 | 0.3396 | 3 | 86 | neutrophil chemotaxis |
| GO:0071347 | 0.0054 | 9.0906 | 0.3553 | 3 | 90 | cellular response to interleukin-1 |
| GO:0090407 | 0.0064 | 3.466 | 2.215 | 7 | 561 | organophosphate biosynthetic process |
| GO:0006506 | 0.007 | 17.3456 | 0.1263 | 2 | 32 | GPI anchor biosynthetic process |
| GO:0045687 | 0.007 | 17.3456 | 0.1263 | 2 | 32 | positive regulation of glial cell differentiation |
| GO:0019918 | 0.0079 | 256.3934 | 0.0079 | 1 | 2 | peptidyl-arginine methylation, to symmetrical-dimethyl arginine |
| GO:0042309 | 0.0079 | 256.3934 | 0.0079 | 1 | 2 | homoiothermy |
| GO:0009593 | 0.0086 | 3.6587 | 1.7807 | 6 | 451 | detection of chemical stimulus |
| GO:0090501 | 0.0087 | 7.5963 | 0.4225 | 3 | 107 | RNA phosphodiester bond hydrolysis |
| GO:0097530 | 0.0094 | 7.3819 | 0.4343 | 3 | 110 | granulocyte migration |
| GO:0007606 | 0.0098 | 3.5519 | 1.832 | 6 | 464 | sensory perception of chemical stimulus |
| GO:0050906 | 0.0098 | 3.5519 | 1.832 | 6 | 464 | detection of stimulus involved in sensory perception |
| GOMFID | Pvalue | OddsRatio | ExpCount | Count | Size | Term |
| GO:0061737 | 4e-04 | 108.3472 | 0.0312 | 2 | 5 | leukotriene signaling pathway |
| GO:0050911 | 5e-04 | 4.2702 | 2.3091 | 9 | 370 | detection of chemical stimulus involved in sensory perception of smell |
| GO:0050906 | 6e-04 | 3.7923 | 2.8958 | 10 | 464 | detection of stimulus involved in sensory perception |
| GO:0045124 | 0.001 | 16.9612 | 0.1997 | 3 | 32 | regulation of bone resorption |
| GO:0046849 | 0.0013 | 9.1803 | 0.4743 | 4 | 76 | bone remodeling |
| GO:0060180 | 0.0017 | 40.6172 | 0.0624 | 2 | 10 | female mating behavior |
| GO:0009593 | 0.002 | 3.4691 | 2.8146 | 9 | 451 | detection of chemical stimulus |
| GO:0006364 | 0.0023 | 5.8545 | 0.9174 | 5 | 147 | rRNA processing |
| GO:0034660 | 0.0023 | 3.3978 | 2.8708 | 9 | 460 | ncRNA metabolic process |
| GO:0007606 | 0.0024 | 3.3671 | 2.8958 | 9 | 464 | sensory perception of chemical stimulus |
| GO:0007618 | 0.0026 | 11.9877 | 0.2746 | 3 | 44 | mating |
| GO:0045717 | 0.0029 | 29.5341 | 0.0811 | 2 | 13 | negative regulation of fatty acid biosynthetic process |
| GO:1904874 | 0.0033 | 27.0712 | 0.0874 | 2 | 14 | positive regulation of telomerase RNA localization to Cajal body |
| GO:0090670 | 0.0038 | 24.9872 | 0.0936 | 2 | 15 | RNA localization to Cajal body |
| GO:0090672 | 0.0038 | 24.9872 | 0.0936 | 2 | 15 | telomerase RNA localization |
| GO:0031123 | 0.0041 | 6.5979 | 0.649 | 4 | 104 | RNA 3'-end processing |
| GO:0007004 | 0.0042 | 10.0253 | 0.3245 | 3 | 52 | telomere maintenance via telomerase |
| GO:0090501 | 0.0045 | 6.4045 | 0.6678 | 4 | 107 | RNA phosphodiester bond hydrolysis |
| GO:0046164 | 0.0046 | 9.631 | 0.337 | 3 | 54 | alcohol catabolic process |
| GO:0050789 | 0.0051 | 1.8613 | 63.7627 | 76 | 10217 | regulation of biological process |
| GO:0000184 | 0.0056 | 5.9942 | 0.7115 | 4 | 114 | nuclear-transcribed mRNA catabolic process, nonsense-mediated decay |
| GO:0019083 | 0.0062 | 4.5815 | 1.1608 | 5 | 186 | viral transcription |
| GO:0001984 | 0.0062 | Inf | 0.0062 | 1 | 1 | vasodilation of artery involved in baroreceptor response to increased systemic arterial blood pressure |
| GO:0010900 | 0.0062 | Inf | 0.0062 | 1 | 1 | negative regulation of phosphatidylcholine catabolic process |
| GO:0031118 | 0.0062 | Inf | 0.0062 | 1 | 1 | rRNA pseudouridine synthesis |
| GO:0040031 | 0.0062 | Inf | 0.0062 | 1 | 1 | snRNA modification |
| GO:0042946 | 0.0062 | Inf | 0.0062 | 1 | 1 | glucoside transport |
| GO:0046360 | 0.0062 | Inf | 0.0062 | 1 | 1 | 2-oxobutyrate biosynthetic process |
| GO:0060829 | 0.0062 | Inf | 0.0062 | 1 | 1 | negative regulation of canonical Wnt signaling pathway involved in neural plate anterior/posterior pattern formation |
| GO:1903723 | 0.0062 | Inf | 0.0062 | 1 | 1 | negative regulation of centriole elongation |
| GO:2000176 | 0.0062 | Inf | 0.0062 | 1 | 1 | positive regulation of pro-T cell differentiation |
| GO:0009069 | 0.0069 | 5.633 | 0.7551 | 4 | 121 | serine family amino acid metabolic process |
| GO:0022613 | 0.007 | 3.3527 | 2.228 | 7 | 357 | ribonucleoprotein complex biogenesis |
| GO:0034103 | 0.0071 | 8.1816 | 0.3932 | 3 | 63 | regulation of tissue remodeling |
| GO:1900087 | 0.0082 | 16.2344 | 0.1373 | 2 | 22 | positive regulation of G1/S transition of mitotic cell cycle |
| GO:0030216 | 0.0082 | 5.3562 | 0.7926 | 4 | 127 | keratinocyte differentiation |
| GO:0046890 | 0.0087 | 5.2698 | 0.8051 | 4 | 129 | regulation of lipid biosynthetic process |
| GO:0006402 | 0.0087 | 4.205 | 1.2607 | 5 | 202 | mRNA catabolic process |
| GO:0010894 | 0.009 | 15.4603 | 0.1435 | 2 | 23 | negative regulation of steroid biosynthetic process |
| GO:0044033 | 0.0096 | 4.0996 | 1.2919 | 5 | 207 | multi-organism metabolic process |
| GO:0008334 | 0.0097 | 14.7566 | 0.1498 | 2 | 24 | histone mRNA metabolic process |
| GOMFID | Pvalue | OddsRatio | ExpCount | Count | Size | Term |
| GO:0014038 | 2e-04 | 261.8655 | 0.0231 | 2 | 3 | regulation of Schwann cell differentiation |
| GO:0050832 | 2e-04 | 14.7635 | 0.3082 | 4 | 40 | defense response to fungus |
| GO:0000184 | 3e-04 | 7.4754 | 0.8784 | 6 | 114 | nuclear-transcribed mRNA catabolic process, nonsense-mediated decay |
| GO:0001992 | 3e-04 | 130.9244 | 0.0308 | 2 | 4 | regulation of systemic arterial blood pressure by vasopressin |
| GO:0019731 | 6e-04 | 11.5466 | 0.3853 | 4 | 50 | antibacterial humoral response |
| GO:0002227 | 6e-04 | 20.8247 | 0.1695 | 3 | 22 | innate immune response in mucosa |
| GO:0034655 | 7e-04 | 3.6937 | 2.9358 | 10 | 381 | nucleobase-containing compound catabolic process |
| GO:0006402 | 0.001 | 4.8452 | 1.5565 | 7 | 202 | mRNA catabolic process |
| GO:0006614 | 0.0011 | 6.881 | 0.786 | 5 | 102 | SRP-dependent cotranslational protein targeting to membrane |
| GO:0043043 | 0.0012 | 2.9097 | 4.8699 | 13 | 632 | peptide biosynthetic process |
| GO:0033860 | 0.0012 | 52.3597 | 0.0539 | 2 | 7 | regulation of NAD(P)H oxidase activity |
| GO:0010579 | 0.0016 | 43.6303 | 0.0616 | 2 | 8 | positive regulation of adenylate cyclase activity involved in G-protein coupled receptor signaling pathway |
| GO:0072599 | 0.0016 | 6.3534 | 0.8476 | 5 | 110 | establishment of protein localization to endoplasmic reticulum |
| GO:0031640 | 0.0019 | 13.635 | 0.2466 | 3 | 32 | killing of cells of other organism |
| GO:0048255 | 0.0019 | 13.635 | 0.2466 | 3 | 32 | mRNA stabilization |
| GO:0045924 | 0.002 | 37.395 | 0.0693 | 2 | 9 | regulation of female receptivity |
| GO:0045823 | 0.0021 | 13.1797 | 0.2543 | 3 | 33 | positive regulation of heart contraction |
| GO:0006415 | 0.0022 | 4.8453 | 1.3254 | 6 | 172 | translational termination |
| GO:0001662 | 0.0022 | 12.7537 | 0.262 | 3 | 34 | behavioral fear response |
| GO:0002251 | 0.0022 | 12.7537 | 0.262 | 3 | 34 | organ or tissue specific immune response |
| GO:1901564 | 0.0025 | 1.9501 | 16.2741 | 28 | 2112 | organonitrogen compound metabolic process |
| GO:0006612 | 0.0029 | 4.5409 | 1.4101 | 6 | 183 | protein targeting to membrane |
| GO:0050830 | 0.0029 | 7.2633 | 0.5933 | 4 | 77 | defense response to Gram-positive bacterium |
| GO:0050886 | 0.0029 | 7.2633 | 0.5933 | 4 | 77 | endocrine process |
| GO:0019083 | 0.0032 | 4.4643 | 1.4332 | 6 | 186 | viral transcription |
| GO:1904293 | 0.0037 | 26.1714 | 0.0925 | 2 | 12 | negative regulation of ERAD pathway |
| GO:0016259 | 0.004 | 6.6248 | 0.6473 | 4 | 84 | selenocysteine metabolic process |
| GO:0034641 | 0.0042 | 1.6467 | 47.2503 | 62 | 6132 | cellular nitrogen compound metabolic process |
| GO:0001878 | 0.0043 | 23.7907 | 0.1002 | 2 | 13 | response to yeast |
| GO:0021889 | 0.0043 | 23.7907 | 0.1002 | 2 | 13 | olfactory bulb interneuron differentiation |
| GO:0043084 | 0.0043 | 23.7907 | 0.1002 | 2 | 13 | penile erection |
| GO:0007618 | 0.0047 | 9.6368 | 0.339 | 3 | 44 | mating |
| GO:0030520 | 0.005 | 9.4068 | 0.3467 | 3 | 45 | intracellular estrogen receptor signaling pathway |
| GO:0030157 | 0.005 | 21.8067 | 0.1079 | 2 | 14 | pancreatic juice secretion |
| GO:0003044 | 0.0053 | 9.1874 | 0.3545 | 3 | 46 | regulation of systemic arterial blood pressure mediated by a chemical signal |
| GO:0044033 | 0.0053 | 3.9925 | 1.595 | 6 | 207 | multi-organism metabolic process |
| GO:1901576 | 0.0065 | 1.6036 | 45.1698 | 59 | 5862 | organic substance biosynthetic process |
| GO:0044249 | 0.0074 | 1.5917 | 44.4455 | 58 | 5768 | cellular biosynthetic process |
| GO:0031442 | 0.0074 | 17.442 | 0.131 | 2 | 17 | positive regulation of mRNA 3'-end processing |
| GO:0007611 | 0.0076 | 3.6942 | 1.7183 | 6 | 223 | learning or memory |
| GO:0007344 | 0.0077 | Inf | 0.0077 | 1 | 1 | pronuclear fusion |
| GO:0009231 | 0.0077 | Inf | 0.0077 | 1 | 1 | riboflavin biosynthetic process |
| GO:0009398 | 0.0077 | Inf | 0.0077 | 1 | 1 | FMN biosynthetic process |
| GO:0015862 | 0.0077 | Inf | 0.0077 | 1 | 1 | uridine transport |
| GO:0018885 | 0.0077 | Inf | 0.0077 | 1 | 1 | carbon tetrachloride metabolic process |
| GO:0019391 | 0.0077 | Inf | 0.0077 | 1 | 1 | glucuronoside catabolic process |
| GO:0031129 | 0.0077 | Inf | 0.0077 | 1 | 1 | inductive cell-cell signaling |
| GO:0033168 | 0.0077 | Inf | 0.0077 | 1 | 1 | conversion of ds siRNA to ss siRNA involved in RNA interference |
| GO:1901899 | 0.0077 | Inf | 0.0077 | 1 | 1 | positive regulation of relaxation of cardiac muscle |
| GO:2000256 | 0.0077 | Inf | 0.0077 | 1 | 1 | positive regulation of male germ cell proliferation |
| GO:1903513 | 0.0083 | 7.7423 | 0.4161 | 3 | 54 | endoplasmic reticulum to cytosol transport |
| GO:0034654 | 0.0084 | 1.624 | 30.7605 | 43 | 3992 | nucleobase-containing compound biosynthetic process |
| GO:0043241 | 0.0092 | 3.1601 | 2.3425 | 7 | 304 | protein complex disassembly |
| GO:0070884 | 0.0092 | 15.388 | 0.1464 | 2 | 19 | regulation of calcineurin-NFAT signaling cascade |
| GO:0021537 | 0.0095 | 3.5135 | 1.8031 | 6 | 234 | telencephalon development |
| GOMFID | Pvalue | OddsRatio | ExpCount | Count | Size | Term |
| GO:0005542 | 0.0026 | 32.1584 | 0.0768 | 2 | 11 | folic acid binding |
| GO:0003712 | 0.0027 | 3.072 | 3.5135 | 10 | 503 | transcription cofactor activity |
| GO:0000988 | 0.0053 | 2.7852 | 3.8557 | 10 | 552 | transcription factor activity, protein binding |
| GO:0004042 | 0.007 | Inf | 0.007 | 1 | 1 | acetyl-CoA:L-glutamate N-acetyltransferase activity |
| GO:0004506 | 0.007 | Inf | 0.007 | 1 | 1 | squalene monooxygenase activity |
| GO:0004610 | 0.007 | Inf | 0.007 | 1 | 1 | phosphoacetylglucosamine mutase activity |
| GO:0004757 | 0.007 | Inf | 0.007 | 1 | 1 | sepiapterin reductase activity |
| GO:0004799 | 0.007 | Inf | 0.007 | 1 | 1 | thymidylate synthase activity |
| GO:0017174 | 0.007 | Inf | 0.007 | 1 | 1 | glycine N-methyltransferase activity |
| GO:0031771 | 0.007 | Inf | 0.007 | 1 | 1 | type 1 hypocretin receptor binding |
| GO:0031772 | 0.007 | Inf | 0.007 | 1 | 1 | type 2 hypocretin receptor binding |
| GO:0070976 | 0.007 | Inf | 0.007 | 1 | 1 | TIR domain binding |
| GO:0008327 | 0.0077 | 17.0163 | 0.1327 | 2 | 19 | methyl-CpG binding |
| GO:0004518 | 0.0096 | 4.0894 | 1.2922 | 5 | 185 | nuclease activity |
| GOMFID | Pvalue | OddsRatio | ExpCount | Count | Size | Term |
| GO:0016594 | 0.0034 | 27.5326 | 0.0894 | 2 | 11 | glycine binding |
| GO:0043295 | 0.0034 | 27.5326 | 0.0894 | 2 | 11 | glutathione binding |
| GO:0005549 | 0.0047 | 6.3459 | 0.6746 | 4 | 83 | odorant binding |
| GO:0000215 | 0.0081 | Inf | 0.0081 | 1 | 1 | tRNA 2'-phosphotransferase activity |
| GO:0004941 | 0.0081 | Inf | 0.0081 | 1 | 1 | beta2-adrenergic receptor activity |
| GO:0008531 | 0.0081 | Inf | 0.0081 | 1 | 1 | riboflavin kinase activity |
| GO:0008728 | 0.0081 | Inf | 0.0081 | 1 | 1 | GTP diphosphokinase activity |
| GO:0008893 | 0.0081 | Inf | 0.0081 | 1 | 1 | guanosine-3',5'-bis(diphosphate) 3'-diphosphatase activity |
| GO:0009673 | 0.0081 | Inf | 0.0081 | 1 | 1 | low-affinity phosphate transmembrane transporter activity |
| GO:0015320 | 0.0081 | Inf | 0.0081 | 1 | 1 | phosphate ion carrier activity |
| GO:0017174 | 0.0081 | Inf | 0.0081 | 1 | 1 | glycine N-methyltransferase activity |
| GO:0030549 | 0.0081 | Inf | 0.0081 | 1 | 1 | acetylcholine receptor activator activity |
| GO:0031686 | 0.0081 | Inf | 0.0081 | 1 | 1 | A1 adenosine receptor binding |
| GO:0031713 | 0.0081 | Inf | 0.0081 | 1 | 1 | B2 bradykinin receptor binding |
| GO:0031751 | 0.0081 | Inf | 0.0081 | 1 | 1 | D4 dopamine receptor binding |
| GO:0034722 | 0.0081 | Inf | 0.0081 | 1 | 1 | gamma-glutamyl-peptidase activity |
| GO:0045032 | 0.0081 | Inf | 0.0081 | 1 | 1 | ADP-activated adenosine receptor activity |
| GO:0070976 | 0.0081 | Inf | 0.0081 | 1 | 1 | TIR domain binding |
| GOMFID | Pvalue | OddsRatio | ExpCount | Count | Size | Term |
| GO:0015272 | 2e-04 | 195.8 | 0.0208 | 2 | 4 | ATP-activated inward rectifier potassium channel activity |
| GO:0008173 | 0.0013 | 15.2162 | 0.2187 | 3 | 42 | RNA methyltransferase activity |
| GO:0035575 | 0.0027 | 30.1019 | 0.0781 | 2 | 15 | histone demethylase activity (H4-K20 specific) |
| GO:0003735 | 0.0035 | 5.2891 | 1.0154 | 5 | 195 | structural constituent of ribosome |
| GO:0004168 | 0.0052 | Inf | 0.0052 | 1 | 1 | dolichol kinase activity |
| GO:0032003 | 0.0052 | Inf | 0.0052 | 1 | 1 | interleukin-28 receptor binding |
| GO:0052909 | 0.0052 | Inf | 0.0052 | 1 | 1 | 18S rRNA (adenine(1779)-N(6)/adenine(1780)-N(6))-dimethyltransferase activity |
| GO:0005249 | 0.0099 | 7.217 | 0.4426 | 3 | 85 | voltage-gated potassium channel activity |
| GOMFID | Pvalue | OddsRatio | ExpCount | Count | Size | Term |
| GO:0005179 | 0.0059 | 5.9142 | 0.7207 | 4 | 117 | hormone activity |
| GO:0004145 | 0.0062 | Inf | 0.0062 | 1 | 1 | diamine N-acetyltransferase activity |
| GO:0004168 | 0.0062 | Inf | 0.0062 | 1 | 1 | dolichol kinase activity |
| GO:0005144 | 0.0062 | Inf | 0.0062 | 1 | 1 | interleukin-13 receptor binding |
| GO:0008403 | 0.0062 | Inf | 0.0062 | 1 | 1 | 25-hydroxycholecalciferol-24-hydroxylase activity |
| GO:0030342 | 0.0062 | Inf | 0.0062 | 1 | 1 | 1-alpha,25-dihydroxyvitamin D3 24-hydroxylase activity |
| GO:0031531 | 0.0062 | Inf | 0.0062 | 1 | 1 | thyrotropin-releasing hormone receptor binding |
| GO:0046789 | 0.0062 | Inf | 0.0062 | 1 | 1 | host cell surface receptor binding |
| GO:0052906 | 0.0062 | Inf | 0.0062 | 1 | 1 | tRNA (guanine(37)-N(1))-methyltransferase activity |
| GO:0004129 | 0.0087 | 15.6692 | 0.1417 | 2 | 23 | cytochrome-c oxidase activity |
| GO:0016675 | 0.0095 | 14.956 | 0.1478 | 2 | 24 | oxidoreductase activity, acting on a heme group of donors |
| GOMFID | Pvalue | OddsRatio | ExpCount | Count | Size | Term |
| GO:0019843 | 3e-04 | 14.1506 | 0.3174 | 4 | 49 | rRNA binding |
| GO:0005184 | 6e-04 | 20.5837 | 0.1684 | 3 | 26 | neuropeptide hormone activity |
| GO:0044548 | 0.0031 | 28.4273 | 0.0842 | 2 | 13 | S100 protein binding |
| GO:0030955 | 0.0041 | 24.0508 | 0.0972 | 2 | 15 | potassium ion binding |
| GO:0003975 | 0.0065 | Inf | 0.0065 | 1 | 1 | UDP-N-acetylglucosamine-dolichyl-phosphate N-acetylglucosaminephosphotransferase activity |
| GO:0005252 | 0.0065 | Inf | 0.0065 | 1 | 1 | open rectifier potassium channel activity |
| GO:0005298 | 0.0065 | Inf | 0.0065 | 1 | 1 | proline:sodium symporter activity |
| GO:0008963 | 0.0065 | Inf | 0.0065 | 1 | 1 | phospho-N-acetylmuramoyl-pentapeptide-transferase activity |
| GO:0031531 | 0.0065 | Inf | 0.0065 | 1 | 1 | thyrotropin-releasing hormone receptor binding |
| GO:0036455 | 0.0065 | Inf | 0.0065 | 1 | 1 | iron-sulfur transferase activity |
| GO:0051736 | 0.0065 | Inf | 0.0065 | 1 | 1 | ATP-dependent polyribonucleotide 5'-hydroxyl-kinase activity |
| GO:0008198 | 0.0081 | 16.4495 | 0.136 | 2 | 21 | ferrous iron binding |
| GOMFID | Pvalue | OddsRatio | ExpCount | Count | Size | Term |
| GO:0004595 | 0.0051 | Inf | 0.0051 | 1 | 1 | pantetheine-phosphate adenylyltransferase activity |
| GO:0004129 | 0.0062 | 18.862 | 0.1183 | 2 | 23 | cytochrome-c oxidase activity |
| GO:0016675 | 0.0067 | 18.0035 | 0.1234 | 2 | 24 | oxidoreductase activity, acting on a heme group of donors |
| GO:0005549 | 0.009 | 7.4938 | 0.4269 | 3 | 83 | odorant binding |
| GOMFID | Pvalue | OddsRatio | ExpCount | Count | Size | Term |
| GO:0016832 | 0.0011 | 50.8149 | 0.0514 | 2 | 9 | aldehyde-lyase activity |
| GO:0004506 | 0.0057 | Inf | 0.0057 | 1 | 1 | squalene monooxygenase activity |
| GO:0033682 | 0.0057 | Inf | 0.0057 | 1 | 1 | ATP-dependent 5'-3' DNA/RNA helicase activity |
| GO:0034417 | 0.0057 | Inf | 0.0057 | 1 | 1 | bisphosphoglycerate 3-phosphatase activity |
| GO:0042356 | 0.0057 | Inf | 0.0057 | 1 | 1 | GDP-4-dehydro-D-rhamnose reductase activity |
| GO:0047915 | 0.0057 | Inf | 0.0057 | 1 | 1 | ganglioside galactosyltransferase activity |
| GO:0050577 | 0.0057 | Inf | 0.0057 | 1 | 1 | GDP-L-fucose synthase activity |
| GO:0052826 | 0.0057 | Inf | 0.0057 | 1 | 1 | inositol hexakisphosphate 2-phosphatase activity |
| GO:0052856 | 0.0057 | Inf | 0.0057 | 1 | 1 | NADHX epimerase activity |
| GO:0052857 | 0.0057 | Inf | 0.0057 | 1 | 1 | NADPHX epimerase activity |
| GOMFID | Pvalue | OddsRatio | ExpCount | Count | Size | Term |
| GO:0044822 | 0 | 2.8612 | 9.2073 | 23 | 1124 | poly(A) RNA binding |
| GO:0003735 | 2e-04 | 5.4561 | 1.5973 | 8 | 195 | structural constituent of ribosome |
| GO:0003676 | 0.0039 | 1.695 | 30.2922 | 44 | 3698 | nucleic acid binding |
| GO:0034483 | 0.0049 | 22.345 | 0.1065 | 2 | 13 | heparan sulfate sulfotransferase activity |
| GO:0004170 | 0.0082 | Inf | 0.0082 | 1 | 1 | dUTP diphosphatase activity |
| GO:0004587 | 0.0082 | Inf | 0.0082 | 1 | 1 | ornithine-oxo-acid transaminase activity |
| GO:0004729 | 0.0082 | Inf | 0.0082 | 1 | 1 | oxygen-dependent protoporphyrinogen oxidase activity |
| GO:0015367 | 0.0082 | Inf | 0.0082 | 1 | 1 | oxoglutarate:malate antiporter activity |
| GO:0070180 | 0.0082 | Inf | 0.0082 | 1 | 1 | large ribosomal subunit rRNA binding |
| GO:0070363 | 0.0082 | Inf | 0.0082 | 1 | 1 | mitochondrial light strand promoter sense binding |
| GO:0045236 | 0.0084 | 16.3822 | 0.1393 | 2 | 17 | CXCR chemokine receptor binding |
| GOMFID | Pvalue | OddsRatio | ExpCount | Count | Size | Term |
| GO:0016895 | 1e-04 | 36.169 | 0.1057 | 3 | 15 | exodeoxyribonuclease activity, producing 5'-phosphomonoesters |
| GO:1901981 | 9e-04 | 7.3288 | 0.7401 | 5 | 105 | phosphatidylinositol phosphate binding |
| GO:0004536 | 9e-04 | 10.2181 | 0.43 | 4 | 61 | deoxyribonuclease activity |
| GO:0004523 | 0.001 | 57.3651 | 0.0493 | 2 | 7 | RNA-DNA hybrid ribonuclease activity |
| GO:0004984 | 0.0012 | 3.7337 | 2.608 | 9 | 370 | olfactory receptor activity |
| GO:0008409 | 0.0031 | 28.6734 | 0.0846 | 2 | 12 | 5'-3' exonuclease activity |
| GO:0004930 | 0.0034 | 2.5683 | 5.5049 | 13 | 781 | G-protein coupled receptor activity |
| GO:0016888 | 0.0037 | 26.0651 | 0.0916 | 2 | 13 | endodeoxyribonuclease activity, producing 5'-phosphomonoesters |
| GO:0015078 | 0.0039 | 6.6817 | 0.6414 | 4 | 91 | hydrogen ion transmembrane transporter activity |
| GO:0005546 | 0.0042 | 10.0736 | 0.3242 | 3 | 46 | phosphatidylinositol-4,5-bisphosphate binding |
| GO:0002135 | 0.007 | Inf | 0.007 | 1 | 1 | CTP binding |
| GO:0003883 | 0.007 | Inf | 0.007 | 1 | 1 | CTP synthase activity |
| GO:0004378 | 0.007 | Inf | 0.007 | 1 | 1 | GDP-Man:Man1GlcNAc2-PP-Dol alpha-1,3-mannosyltransferase activity |
| GO:0004506 | 0.007 | Inf | 0.007 | 1 | 1 | squalene monooxygenase activity |
| GO:0008311 | 0.007 | Inf | 0.007 | 1 | 1 | double-stranded DNA 3'-5' exodeoxyribonuclease activity |
| GO:0015367 | 0.007 | Inf | 0.007 | 1 | 1 | oxoglutarate:malate antiporter activity |
| GO:0070180 | 0.007 | Inf | 0.007 | 1 | 1 | large ribosomal subunit rRNA binding |
| GO:0071796 | 0.007 | Inf | 0.007 | 1 | 1 | K6-linked polyubiquitin binding |
| GO:0072572 | 0.007 | Inf | 0.007 | 1 | 1 | poly-ADP-D-ribose binding |
| GOMFID | Pvalue | OddsRatio | ExpCount | Count | Size | Term |
| GO:0004984 | 0 | 5.3924 | 2.514 | 12 | 370 | olfactory receptor activity |
| GO:0004930 | 1e-04 | 3.419 | 5.3065 | 16 | 781 | G-protein coupled receptor activity |
| GO:0008073 | 1e-04 | 297.9048 | 0.0204 | 2 | 3 | ornithine decarboxylase inhibitor activity |
| GO:0046703 | 0.0016 | 42.5415 | 0.0612 | 2 | 9 | natural killer cell lectin-like receptor binding |
| GO:0009982 | 0.0029 | 29.7733 | 0.0815 | 2 | 12 | pseudouridine synthase activity |
| GO:0044548 | 0.0034 | 27.0649 | 0.0883 | 2 | 13 | S100 protein binding |
| GO:0038023 | 0.0052 | 2.1709 | 8.6222 | 17 | 1269 | signaling receptor activity |
| GO:0001604 | 0.0068 | Inf | 0.0068 | 1 | 1 | urotensin II receptor activity |
| GO:0005252 | 0.0068 | Inf | 0.0068 | 1 | 1 | open rectifier potassium channel activity |
| GO:0005298 | 0.0068 | Inf | 0.0068 | 1 | 1 | proline:sodium symporter activity |
| GO:0033682 | 0.0068 | Inf | 0.0068 | 1 | 1 | ATP-dependent 5'-3' DNA/RNA helicase activity |
| GO:0033867 | 0.0068 | Inf | 0.0068 | 1 | 1 | Fas-activated serine/threonine kinase activity |
| GO:0036455 | 0.0068 | Inf | 0.0068 | 1 | 1 | iron-sulfur transferase activity |
| GO:0045130 | 0.0068 | Inf | 0.0068 | 1 | 1 | keratan sulfotransferase activity |
| GO:0046523 | 0.0068 | Inf | 0.0068 | 1 | 1 | S-methyl-5-thioribose-1-phosphate isomerase activity |
| GO:0047734 | 0.0068 | Inf | 0.0068 | 1 | 1 | CDP-glycerol diphosphatase activity |
| GO:0090450 | 0.0068 | Inf | 0.0068 | 1 | 1 | inosine-diphosphatase activity |
| GO:0097383 | 0.0068 | Inf | 0.0068 | 1 | 1 | dIDP diphosphatase activity |
| GO:1901640 | 0.0068 | Inf | 0.0068 | 1 | 1 | XTP binding |
| GO:1901641 | 0.0068 | Inf | 0.0068 | 1 | 1 | ITP binding |
| GO:0099600 | 0.0079 | 2.1159 | 8.2621 | 16 | 1216 | transmembrane receptor activity |
| GO:0016209 | 0.0094 | 7.3676 | 0.4348 | 3 | 64 | antioxidant activity |
| GOMFID | Pvalue | OddsRatio | ExpCount | Count | Size | Term |
| GO:0031696 | 0 | Inf | 0.0132 | 2 | 2 | alpha-2C adrenergic receptor binding |
| GO:0008821 | 6e-04 | 76.6667 | 0.0396 | 2 | 6 | crossover junction endodeoxyribonuclease activity |
| GO:0017108 | 6e-04 | 76.6667 | 0.0396 | 2 | 6 | 5'-flap endonuclease activity |
| GO:0004170 | 0.0066 | Inf | 0.0066 | 1 | 1 | dUTP diphosphatase activity |
| GO:0004512 | 0.0066 | Inf | 0.0066 | 1 | 1 | inositol-3-phosphate synthase activity |
| GO:0015367 | 0.0066 | Inf | 0.0066 | 1 | 1 | oxoglutarate:malate antiporter activity |
| GO:0031686 | 0.0066 | Inf | 0.0066 | 1 | 1 | A1 adenosine receptor binding |
| GO:0031695 | 0.0066 | Inf | 0.0066 | 1 | 1 | alpha-2B adrenergic receptor binding |
| GO:0033867 | 0.0066 | Inf | 0.0066 | 1 | 1 | Fas-activated serine/threonine kinase activity |
| GO:0045032 | 0.0066 | Inf | 0.0066 | 1 | 1 | ADP-activated adenosine receptor activity |
| GO:0070037 | 0.0066 | Inf | 0.0066 | 1 | 1 | rRNA (pseudouridine) methyltransferase activity |
| GO:0070180 | 0.0066 | Inf | 0.0066 | 1 | 1 | large ribosomal subunit rRNA binding |
| GO:0090450 | 0.0066 | Inf | 0.0066 | 1 | 1 | inosine-diphosphatase activity |
| GO:0097383 | 0.0066 | Inf | 0.0066 | 1 | 1 | dIDP diphosphatase activity |
| GO:1901640 | 0.0066 | Inf | 0.0066 | 1 | 1 | XTP binding |
| GO:1901641 | 0.0066 | Inf | 0.0066 | 1 | 1 | ITP binding |
| GO:0016894 | 0.0069 | 18.0242 | 0.1255 | 2 | 19 | endonuclease activity, active with either ribo- or deoxyribonucleic acids and producing 3'-phosphomonoesters |
| GO:0004536 | 0.0076 | 7.9819 | 0.4028 | 3 | 61 | deoxyribonuclease activity |
| GO:0003735 | 0.0095 | 4.1079 | 1.2878 | 5 | 195 | structural constituent of ribosome |
| GOMFID | Pvalue | OddsRatio | ExpCount | Count | Size | Term |
| GO:0046703 | 1e-04 | 56.5254 | 0.0806 | 3 | 9 | natural killer cell lectin-like receptor binding |
| GO:0004634 | 5e-04 | 112.2662 | 0.0358 | 2 | 4 | phosphopyruvate hydratase activity |
| GO:0003743 | 0.0081 | 7.8686 | 0.4119 | 3 | 46 | translation initiation factor activity |
| GO:0004603 | 0.009 | Inf | 0.009 | 1 | 1 | phenylethanolamine N-methyltransferase activity |
| GO:0005367 | 0.009 | Inf | 0.009 | 1 | 1 | myo-inositol:sodium symporter activity |
| GO:0008437 | 0.009 | Inf | 0.009 | 1 | 1 | thyrotropin-releasing hormone activity |
| GO:0031531 | 0.009 | Inf | 0.009 | 1 | 1 | thyrotropin-releasing hormone receptor binding |
| GO:0033735 | 0.009 | Inf | 0.009 | 1 | 1 | aspartate dehydrogenase activity |
| GO:0090450 | 0.009 | Inf | 0.009 | 1 | 1 | inosine-diphosphatase activity |
| GO:0097383 | 0.009 | Inf | 0.009 | 1 | 1 | dIDP diphosphatase activity |
| GO:1901640 | 0.009 | Inf | 0.009 | 1 | 1 | XTP binding |
| GO:1901641 | 0.009 | Inf | 0.009 | 1 | 1 | ITP binding |
| GOMFID | Pvalue | OddsRatio | ExpCount | Count | Size | Term |
| GO:0004984 | 0.0015 | 3.6264 | 2.6784 | 9 | 370 | olfactory receptor activity |
| GO:0005125 | 0.0047 | 4.1002 | 1.5564 | 6 | 215 | cytokine activity |
| GO:0001077 | 0.0055 | 3.9655 | 1.6071 | 6 | 222 | transcriptional activator activity, RNA polymerase II core promoter proximal region sequence-specific binding |
| GO:0001872 | 0.0072 | Inf | 0.0072 | 1 | 1 | (1->3)-beta-D-glucan binding |
| GO:0005307 | 0.0072 | Inf | 0.0072 | 1 | 1 | choline:sodium symporter activity |
| GO:0015098 | 0.0072 | Inf | 0.0072 | 1 | 1 | molybdate ion transmembrane transporter activity |
| GO:0017174 | 0.0072 | Inf | 0.0072 | 1 | 1 | glycine N-methyltransferase activity |
| GO:0036105 | 0.0072 | Inf | 0.0072 | 1 | 1 | peroxisome membrane class-1 targeting sequence binding |
| GO:0042781 | 0.0072 | Inf | 0.0072 | 1 | 1 | 3'-tRNA processing endoribonuclease activity |
| GO:0044549 | 0.0072 | Inf | 0.0072 | 1 | 1 | GTP cyclohydrolase binding |
| GO:0090450 | 0.0072 | Inf | 0.0072 | 1 | 1 | inosine-diphosphatase activity |
| GO:0097383 | 0.0072 | Inf | 0.0072 | 1 | 1 | dIDP diphosphatase activity |
| GO:1901640 | 0.0072 | Inf | 0.0072 | 1 | 1 | XTP binding |
| GO:1901641 | 0.0072 | Inf | 0.0072 | 1 | 1 | ITP binding |
| GO:0031690 | 0.0082 | 16.4044 | 0.1375 | 2 | 19 | adrenergic receptor binding |
| GOMFID | Pvalue | OddsRatio | ExpCount | Count | Size | Term |
| GO:0004096 | 2e-04 | 229.5441 | 0.0263 | 2 | 3 | catalase activity |
| GO:0017150 | 5e-04 | 114.7647 | 0.0351 | 2 | 4 | tRNA dihydrouridine synthase activity |
| GO:0015152 | 0.0088 | Inf | 0.0088 | 1 | 1 | glucose-6-phosphate transmembrane transporter activity |
| GO:0022894 | 0.0088 | Inf | 0.0088 | 1 | 1 | Intermediate conductance calcium-activated potassium channel activity |
| GO:0047888 | 0.0088 | Inf | 0.0088 | 1 | 1 | fatty acid peroxidase activity |
| GO:0051717 | 0.0088 | Inf | 0.0088 | 1 | 1 | inositol-1,3,4,5-tetrakisphosphate 3-phosphatase activity |
| GO:0051800 | 0.0088 | Inf | 0.0088 | 1 | 1 | phosphatidylinositol-3,4-bisphosphate 3-phosphatase activity |
| GOMFID | Pvalue | OddsRatio | ExpCount | Count | Size | Term |
| GO:0004984 | 1e-04 | 5.6972 | 1.7856 | 9 | 370 | olfactory receptor activity |
| GO:0004865 | 6e-04 | 70.5676 | 0.0386 | 2 | 8 | protein serine/threonine phosphatase inhibitor activity |
| GO:0019212 | 7e-04 | 19.4757 | 0.1737 | 3 | 36 | phosphatase inhibitor activity |
| GO:0004930 | 0.0042 | 2.9283 | 3.7691 | 10 | 781 | G-protein coupled receptor activity |
| GO:0018169 | 0.0048 | Inf | 0.0048 | 1 | 1 | ribosomal S6-glutamic acid ligase activity |
| GO:0031751 | 0.0048 | Inf | 0.0048 | 1 | 1 | D4 dopamine receptor binding |
| GO:0031771 | 0.0048 | Inf | 0.0048 | 1 | 1 | type 1 hypocretin receptor binding |
| GO:0031772 | 0.0048 | Inf | 0.0048 | 1 | 1 | type 2 hypocretin receptor binding |
| GO:0019888 | 0.0053 | 9.1597 | 0.3523 | 3 | 73 | protein phosphatase regulator activity |
| GO:0017134 | 0.0054 | 20.1429 | 0.111 | 2 | 23 | fibroblast growth factor binding |
| GO:0032767 | 0.0096 | 208.9467 | 0.0097 | 1 | 2 | copper-dependent protein binding |
| GO:0051500 | 0.0096 | 208.9467 | 0.0097 | 1 | 2 | D-tyrosyl-tRNA(Tyr) deacylase activity |
| GOMFID | Pvalue | OddsRatio | ExpCount | Count | Size | Term |
| GO:0004984 | 0 | 5.7447 | 1.9736 | 10 | 370 | olfactory receptor activity |
| GO:0004631 | 0.0053 | Inf | 0.0053 | 1 | 1 | phosphomevalonate kinase activity |
| GO:0005307 | 0.0053 | Inf | 0.0053 | 1 | 1 | choline:sodium symporter activity |
| GO:0042356 | 0.0053 | Inf | 0.0053 | 1 | 1 | GDP-4-dehydro-D-rhamnose reductase activity |
| GO:0047860 | 0.0053 | Inf | 0.0053 | 1 | 1 | diiodophenylpyruvate reductase activity |
| GO:0050577 | 0.0053 | Inf | 0.0053 | 1 | 1 | GDP-L-fucose synthase activity |
| GO:0090554 | 0.0053 | Inf | 0.0053 | 1 | 1 | phosphatidylcholine-translocating ATPase activity |
| GO:1990595 | 0.0053 | Inf | 0.0053 | 1 | 1 | mast cell secretagogue receptor activity |
| GO:0004930 | 0.0078 | 2.6497 | 4.1113 | 10 | 780 | G-protein coupled receptor activity |
| GO:0005549 | 0.0099 | 7.2148 | 0.4427 | 3 | 83 | odorant binding |
| GOMFID | Pvalue | OddsRatio | ExpCount | Count | Size | Term |
| GO:0000035 | 0.0025 | Inf | 0.0025 | 1 | 1 | acyl binding |
| GO:0004930 | 0.0028 | 4.221 | 1.9342 | 7 | 781 | G-protein coupled receptor activity |
| GO:0015218 | 0.0049 | 413.3684 | 0.005 | 1 | 2 | pyrimidine nucleotide transmembrane transporter activity |
| GOMFID | Pvalue | OddsRatio | ExpCount | Count | Size | Term |
| GO:0004984 | 3e-04 | 4.5942 | 2.1615 | 9 | 370 | olfactory receptor activity |
| GO:0004930 | 6e-04 | 3.19 | 4.5626 | 13 | 781 | G-protein coupled receptor activity |
| GO:0003735 | 0.0057 | 4.6782 | 1.1392 | 5 | 195 | structural constituent of ribosome |
| GO:0008728 | 0.0058 | Inf | 0.0058 | 1 | 1 | GTP diphosphokinase activity |
| GO:0008893 | 0.0058 | Inf | 0.0058 | 1 | 1 | guanosine-3',5'-bis(diphosphate) 3'-diphosphatase activity |
| GO:0050038 | 0.0058 | Inf | 0.0058 | 1 | 1 | L-xylulose reductase (NADP+) activity |
| GOMFID | Pvalue | OddsRatio | ExpCount | Count | Size | Term |
| GO:0008121 | 7e-04 | 70.3461 | 0.0404 | 2 | 7 | ubiquinol-cytochrome-c reductase activity |
| GO:0016679 | 9e-04 | 58.618 | 0.0462 | 2 | 8 | oxidoreductase activity, acting on diphenols and related substances as donors |
| GO:0004984 | 0.0056 | 3.511 | 2.138 | 7 | 370 | olfactory receptor activity |
| GO:0004458 | 0.0058 | Inf | 0.0058 | 1 | 1 | D-lactate dehydrogenase (cytochrome) activity |
| GO:0005130 | 0.0058 | Inf | 0.0058 | 1 | 1 | granulocyte colony-stimulating factor receptor binding |
| GO:0005550 | 0.0058 | Inf | 0.0058 | 1 | 1 | pheromone binding |
| GO:0016913 | 0.0058 | Inf | 0.0058 | 1 | 1 | follicle-stimulating hormone activity |
| GO:0031855 | 0.0058 | Inf | 0.0058 | 1 | 1 | oxytocin receptor binding |
| GO:0047560 | 0.0058 | Inf | 0.0058 | 1 | 1 | 3-dehydrosphinganine reductase activity |
| GO:0005031 | 0.0077 | 16.7319 | 0.1329 | 2 | 23 | tumor necrosis factor-activated receptor activity |
| GOMFID | Pvalue | OddsRatio | ExpCount | Count | Size | Term |
| GO:0061133 | 5e-04 | 88.9432 | 0.0343 | 2 | 6 | endopeptidase activator activity |
| GO:0032036 | 0.0021 | 35.5636 | 0.0686 | 2 | 12 | myosin heavy chain binding |
| GO:0043565 | 0.0041 | 2.5287 | 5.675 | 13 | 993 | sequence-specific DNA binding |
| GO:0001604 | 0.0057 | Inf | 0.0057 | 1 | 1 | urotensin II receptor activity |
| GO:0001872 | 0.0057 | Inf | 0.0057 | 1 | 1 | (1->3)-beta-D-glucan binding |
| GO:0004145 | 0.0057 | Inf | 0.0057 | 1 | 1 | diamine N-acetyltransferase activity |
| GO:0033682 | 0.0057 | Inf | 0.0057 | 1 | 1 | ATP-dependent 5'-3' DNA/RNA helicase activity |
| GO:0047273 | 0.0057 | Inf | 0.0057 | 1 | 1 | galactosylgalactosylglucosylceramide beta-D-acetylgalactosaminyltransferase activity |
| GO:0047734 | 0.0057 | Inf | 0.0057 | 1 | 1 | CDP-glycerol diphosphatase activity |
| GO:0050038 | 0.0057 | Inf | 0.0057 | 1 | 1 | L-xylulose reductase (NADP+) activity |
| GO:0070611 | 0.0057 | Inf | 0.0057 | 1 | 1 | histone methyltransferase activity (H3-R2 specific) |
| GO:0070612 | 0.0057 | Inf | 0.0057 | 1 | 1 | histone methyltransferase activity (H2A-R3 specific) |
| GO:0005540 | 0.0063 | 18.7069 | 0.12 | 2 | 21 | hyaluronic acid binding |
| GO:0008080 | 0.0082 | 7.7681 | 0.4126 | 3 | 73 | N-acetyltransferase activity |
| GOMFID | Pvalue | OddsRatio | ExpCount | Count | Size | Term |
| GO:0003735 | 4e-04 | 6.7319 | 0.9782 | 6 | 195 | structural constituent of ribosome |
| GO:0005525 | 0.0016 | 4.4638 | 1.7106 | 7 | 341 | GTP binding |
| GO:0019001 | 0.0021 | 4.2305 | 1.8009 | 7 | 359 | guanyl nucleotide binding |
| GO:0051428 | 0.0032 | 27.1065 | 0.0853 | 2 | 17 | peptide hormone receptor binding |
| GO:0001872 | 0.005 | Inf | 0.005 | 1 | 1 | (1->3)-beta-D-glucan binding |
| GO:0004145 | 0.005 | Inf | 0.005 | 1 | 1 | diamine N-acetyltransferase activity |
| GO:0004595 | 0.005 | Inf | 0.005 | 1 | 1 | pantetheine-phosphate adenylyltransferase activity |
| GO:0016034 | 0.005 | Inf | 0.005 | 1 | 1 | maleylacetoacetate isomerase activity |
| GO:0032542 | 0.005 | Inf | 0.005 | 1 | 1 | sulfiredoxin activity |
| GO:0050038 | 0.005 | Inf | 0.005 | 1 | 1 | L-xylulose reductase (NADP+) activity |
| GO:0070180 | 0.005 | Inf | 0.005 | 1 | 1 | large ribosomal subunit rRNA binding |
| GO:0005184 | 0.0075 | 16.9318 | 0.1304 | 2 | 26 | neuropeptide hormone activity |
| GO:0071855 | 0.008 | 16.2535 | 0.1354 | 2 | 27 | neuropeptide receptor binding |
| GOMFID | Pvalue | OddsRatio | ExpCount | Count | Size | Term |
| GO:0032395 | 1e-04 | 55.7786 | 0.0781 | 3 | 10 | MHC class II receptor activity |
| GO:0042605 | 8e-04 | 18.5762 | 0.1875 | 3 | 24 | peptide antigen binding |
| GO:0003735 | 8e-04 | 4.955 | 1.5231 | 7 | 195 | structural constituent of ribosome |
| GO:0016175 | 0.0016 | 43.0275 | 0.0625 | 2 | 8 | superoxide-generating NADPH oxidase activity |
| GO:0023026 | 0.0068 | 18.4309 | 0.125 | 2 | 16 | MHC class II protein complex binding |
| GO:0070717 | 0.0068 | 18.4309 | 0.125 | 2 | 16 | poly-purine tract binding |
| GO:0000257 | 0.0078 | Inf | 0.0078 | 1 | 1 | nitrilase activity |
| GO:0004498 | 0.0078 | Inf | 0.0078 | 1 | 1 | calcidiol 1-monooxygenase activity |
| GO:0004595 | 0.0078 | Inf | 0.0078 | 1 | 1 | pantetheine-phosphate adenylyltransferase activity |
| GO:0008613 | 0.0078 | Inf | 0.0078 | 1 | 1 | diuretic hormone activity |
| GO:0035755 | 0.0078 | Inf | 0.0078 | 1 | 1 | cardiolipin hydrolase activity |
| GO:0048270 | 0.0078 | Inf | 0.0078 | 1 | 1 | methionine adenosyltransferase regulator activity |
| GO:0052829 | 0.0078 | Inf | 0.0078 | 1 | 1 | inositol-1,3,4-trisphosphate 1-phosphatase activity |
| GO:1990583 | 0.0078 | Inf | 0.0078 | 1 | 1 | phospholipase D activator activity |
| GOMFID | Pvalue | OddsRatio | ExpCount | Count | Size | Term |
| GO:0004307 | 5e-04 | 150.8641 | 0.0396 | 2 | 3 | ethanolaminephosphotransferase activity |
| GO:0004634 | 0.001 | 75.4272 | 0.0528 | 2 | 4 | phosphopyruvate hydratase activity |
| GO:0016780 | 0.0019 | 14.1988 | 0.251 | 3 | 19 | phosphotransferase activity, for other substituted phosphate groups |
| GO:0070700 | 0.0059 | 21.5437 | 0.1189 | 2 | 9 | BMP receptor binding |
| GO:0043295 | 0.0088 | 16.754 | 0.1453 | 2 | 11 | glutathione binding |
| GOMFID | Pvalue | OddsRatio | ExpCount | Count | Size | Term |
| GO:0003676 | 6e-04 | 2.0406 | 23.2475 | 38 | 3698 | nucleic acid binding |
| GO:0044822 | 0.0017 | 2.5299 | 7.066 | 16 | 1124 | poly(A) RNA binding |
| GO:0004042 | 0.0063 | Inf | 0.0063 | 1 | 1 | acetyl-CoA:L-glutamate N-acetyltransferase activity |
| GO:0004333 | 0.0063 | Inf | 0.0063 | 1 | 1 | fumarate hydratase activity |
| GO:0004603 | 0.0063 | Inf | 0.0063 | 1 | 1 | phenylethanolamine N-methyltransferase activity |
| GO:0008437 | 0.0063 | Inf | 0.0063 | 1 | 1 | thyrotropin-releasing hormone activity |
| GO:0050038 | 0.0063 | Inf | 0.0063 | 1 | 1 | L-xylulose reductase (NADP+) activity |
| GO:0003735 | 0.0077 | 4.3278 | 1.2259 | 5 | 195 | structural constituent of ribosome |
| GO:0008168 | 0.0093 | 4.1297 | 1.2824 | 5 | 204 | methyltransferase activity |
| GOMFID | Pvalue | OddsRatio | ExpCount | Count | Size | Term |
| GO:1901612 | 1e-04 | 257.0984 | 0.016 | 2 | 4 | cardiolipin binding |
| GO:0004984 | 0.0036 | 4.4306 | 1.4802 | 6 | 370 | olfactory receptor activity |
| GO:0008455 | 0.004 | Inf | 0.004 | 1 | 1 | alpha-1,6-mannosylglycoprotein 2-beta-N-acetylglucosaminyltransferase activity |
| GO:0030735 | 0.004 | Inf | 0.004 | 1 | 1 | carnosine N-methyltransferase activity |
| GO:0031771 | 0.004 | Inf | 0.004 | 1 | 1 | type 1 hypocretin receptor binding |
| GO:0031772 | 0.004 | Inf | 0.004 | 1 | 1 | type 2 hypocretin receptor binding |
| GO:0047220 | 0.004 | Inf | 0.004 | 1 | 1 | galactosylxylosylprotein 3-beta-galactosyltransferase activity |
| GO:0010736 | 0.008 | 252.9677 | 0.008 | 1 | 2 | serum response element binding |
| GO:1990825 | 0.008 | 252.9677 | 0.008 | 1 | 2 | sequence-specific mRNA binding |
| GOMFID | Pvalue | OddsRatio | ExpCount | Count | Size | Term |
| GO:0035662 | 1e-04 | 441.5211 | 0.0139 | 2 | 3 | Toll-like receptor 4 binding |
| GO:0001601 | 1e-04 | 220.7465 | 0.0185 | 2 | 4 | peptide YY receptor activity |
| GO:0050544 | 2e-04 | 147.1549 | 0.0232 | 2 | 5 | arachidonic acid binding |
| GO:1901567 | 3e-04 | 110.3592 | 0.0278 | 2 | 6 | fatty acid derivative binding |
| GO:0050786 | 0.0011 | 49.0329 | 0.051 | 2 | 11 | RAGE receptor binding |
| GO:0019864 | 0.0014 | 44.1268 | 0.0556 | 2 | 12 | IgG binding |
| GO:0036041 | 0.0016 | 40.1127 | 0.0603 | 2 | 13 | long-chain fatty acid binding |
| GO:0004512 | 0.0046 | Inf | 0.0046 | 1 | 1 | inositol-3-phosphate synthase activity |
| GO:0004586 | 0.0046 | Inf | 0.0046 | 1 | 1 | ornithine decarboxylase activity |
| GO:0008254 | 0.0046 | Inf | 0.0046 | 1 | 1 | 3'-nucleotidase activity |
| GO:0008493 | 0.0046 | Inf | 0.0046 | 1 | 1 | tetracycline transporter activity |
| GO:0004743 | 0.0092 | 217.6944 | 0.0093 | 1 | 2 | pyruvate kinase activity |
| GO:0008441 | 0.0092 | 217.6944 | 0.0093 | 1 | 2 | 3'(2'),5'-bisphosphate nucleotidase activity |
| GO:0016262 | 0.0092 | 217.6944 | 0.0093 | 1 | 2 | protein N-acetylglucosaminyltransferase activity |
| GO:0017057 | 0.0092 | 217.6944 | 0.0093 | 1 | 2 | 6-phosphogluconolactonase activity |
| GO:0038100 | 0.0092 | 217.6944 | 0.0093 | 1 | 2 | nodal binding |
| GOMFID | Pvalue | OddsRatio | ExpCount | Count | Size | Term |
| GO:0019776 | 3e-04 | 212.2177 | 0.0284 | 2 | 3 | Atg8 ligase activity |
| GO:0000215 | 0.0095 | Inf | 0.0095 | 1 | 1 | tRNA 2'-phosphotransferase activity |
| GO:0003881 | 0.0095 | Inf | 0.0095 | 1 | 1 | CDP-diacylglycerol-inositol 3-phosphatidyltransferase activity |
| GO:0004607 | 0.0095 | Inf | 0.0095 | 1 | 1 | phosphatidylcholine-sterol O-acyltransferase activity |
| GO:0004631 | 0.0095 | Inf | 0.0095 | 1 | 1 | phosphomevalonate kinase activity |
| GO:0015320 | 0.0095 | Inf | 0.0095 | 1 | 1 | phosphate ion carrier activity |
| GO:0030273 | 0.0095 | Inf | 0.0095 | 1 | 1 | melanin-concentrating hormone receptor activity |
| GO:0030549 | 0.0095 | Inf | 0.0095 | 1 | 1 | acetylcholine receptor activator activity |
| GO:0031751 | 0.0095 | Inf | 0.0095 | 1 | 1 | D4 dopamine receptor binding |
| GO:0042163 | 0.0095 | Inf | 0.0095 | 1 | 1 | interleukin-12 beta subunit binding |
| GO:0045513 | 0.0095 | Inf | 0.0095 | 1 | 1 | interleukin-27 binding |
| GO:0070191 | 0.0095 | Inf | 0.0095 | 1 | 1 | methionine-R-sulfoxide reductase activity |
| GO:0070976 | 0.0095 | Inf | 0.0095 | 1 | 1 | TIR domain binding |
| GO:1902387 | 0.0095 | Inf | 0.0095 | 1 | 1 | ceramide 1-phosphate binding |
| GO:1902388 | 0.0095 | Inf | 0.0095 | 1 | 1 | ceramide 1-phosphate transporter activity |
| GOMFID | Pvalue | OddsRatio | ExpCount | Count | Size | Term |
| GO:0019863 | 8e-04 | 74.3 | 0.0451 | 2 | 5 | IgE binding |
| GO:0097159 | 0.0023 | 1.6452 | 50.1256 | 67 | 5559 | organic cyclic compound binding |
| GO:0042162 | 0.0024 | 12.4532 | 0.2705 | 3 | 30 | telomeric DNA binding |
| GO:1901363 | 0.0026 | 1.6348 | 49.4133 | 66 | 5480 | heterocyclic compound binding |
| GO:0003924 | 0.003 | 3.9344 | 1.8936 | 7 | 210 | GTPase activity |
| GO:0005525 | 0.0038 | 3.1132 | 3.0748 | 9 | 341 | GTP binding |
| GO:0019001 | 0.0053 | 2.9496 | 3.2371 | 9 | 359 | guanyl nucleotide binding |
| GO:0000701 | 0.009 | Inf | 0.009 | 1 | 1 | purine-specific mismatch base pair DNA N-glycosylase activity |
| GO:0003870 | 0.009 | Inf | 0.009 | 1 | 1 | 5-aminolevulinate synthase activity |
| GO:0004588 | 0.009 | Inf | 0.009 | 1 | 1 | orotate phosphoribosyltransferase activity |
| GO:0004590 | 0.009 | Inf | 0.009 | 1 | 1 | orotidine-5'-phosphate decarboxylase activity |
| GO:0004941 | 0.009 | Inf | 0.009 | 1 | 1 | beta2-adrenergic receptor activity |
| GO:0005144 | 0.009 | Inf | 0.009 | 1 | 1 | interleukin-13 receptor binding |
| GO:0008531 | 0.009 | Inf | 0.009 | 1 | 1 | riboflavin kinase activity |
| GO:0031707 | 0.009 | Inf | 0.009 | 1 | 1 | endothelin A receptor binding |
| GO:0031713 | 0.009 | Inf | 0.009 | 1 | 1 | B2 bradykinin receptor binding |
| GO:0031751 | 0.009 | Inf | 0.009 | 1 | 1 | D4 dopamine receptor binding |
| GO:0032427 | 0.009 | Inf | 0.009 | 1 | 1 | GBD domain binding |
| GO:0032542 | 0.009 | Inf | 0.009 | 1 | 1 | sulfiredoxin activity |
| GO:0034038 | 0.009 | Inf | 0.009 | 1 | 1 | deoxyhypusine synthase activity |
| GO:0045503 | 0.009 | Inf | 0.009 | 1 | 1 | dynein light chain binding |
| GOMFID | Pvalue | OddsRatio | ExpCount | Count | Size | Term |
| GO:0003735 | 0.0011 | 4.7487 | 1.585 | 7 | 195 | structural constituent of ribosome |
| GO:0015207 | 0.0081 | Inf | 0.0081 | 1 | 1 | adenine transmembrane transporter activity |
| GO:0043795 | 0.0081 | Inf | 0.0081 | 1 | 1 | glyceraldehyde oxidoreductase activity |
| GO:0044549 | 0.0081 | Inf | 0.0081 | 1 | 1 | GTP cyclohydrolase binding |
| GO:0047341 | 0.0081 | Inf | 0.0081 | 1 | 1 | fucose-1-phosphate guanylyltransferase activity |
| GO:0070037 | 0.0081 | Inf | 0.0081 | 1 | 1 | rRNA (pseudouridine) methyltransferase activity |
| GO:0072541 | 0.0081 | Inf | 0.0081 | 1 | 1 | peroxynitrite reductase activity |
| GO:0008320 | 0.0092 | 15.4802 | 0.1463 | 2 | 18 | protein transmembrane transporter activity |
| GO:0004857 | 0.0096 | 2.8667 | 2.9505 | 8 | 363 | enzyme inhibitor activity |
| GOMFID | Pvalue | OddsRatio | ExpCount | Count | Size | Term |
| GO:0003735 | 1e-04 | 4.6957 | 2.3155 | 10 | 195 | structural constituent of ribosome |
| GO:0016410 | 7e-04 | 6.1077 | 1.0687 | 6 | 90 | N-acyltransferase activity |
| GO:0003676 | 8e-04 | 2.0997 | 14.9575 | 28 | 1365 | nucleic acid binding |
| GO:0008179 | 0.0059 | 21.0176 | 0.1187 | 2 | 10 | adenylate cyclase binding |
| GO:0003700 | 0.0073 | 1.8455 | 13.3232 | 23 | 1122 | transcription factor activity, sequence-specific DNA binding |
| GO:0044822 | 0.0074 | 1.8419 | 13.347 | 23 | 1124 | poly(A) RNA binding |
| GO:0003677 | 0.0095 | 1.5745 | 27.7033 | 40 | 2333 | DNA binding |
| GOMFID | Pvalue | OddsRatio | ExpCount | Count | Size | Term |
| GO:0003723 | 0.0028 | 1.8953 | 16.1494 | 28 | 1496 | RNA binding |
| GO:1901363 | 0.0029 | 1.5592 | 59.1567 | 77 | 5480 | heterocyclic compound binding |
| GO:0004865 | 0.0031 | 30.8968 | 0.0864 | 2 | 8 | protein serine/threonine phosphatase inhibitor activity |
| GO:0097159 | 0.0044 | 1.5248 | 60.0095 | 77 | 5559 | organic cyclic compound binding |
| GO:0070411 | 0.006 | 20.5939 | 0.1187 | 2 | 11 | I-SMAD binding |
| GO:0005095 | 0.0097 | 15.4425 | 0.1511 | 2 | 14 | GTPase inhibitor activity |
| GO:0016854 | 0.0097 | 15.4425 | 0.1511 | 2 | 14 | racemase and epimerase activity |
| GOMFID | Pvalue | OddsRatio | ExpCount | Count | Size | Term |
| GO:0061630 | 9e-04 | 4.3196 | 1.9871 | 8 | 183 | ubiquitin protein ligase activity |
| GO:0043022 | 9e-04 | 10.34 | 0.4343 | 4 | 40 | ribosome binding |
| GO:0015204 | 0.0017 | 46.074 | 0.0652 | 2 | 6 | urea transmembrane transporter activity |
| GO:0001849 | 0.0024 | 36.8568 | 0.076 | 2 | 7 | complement component C1q binding |
| GO:0019787 | 0.0035 | 2.7644 | 4.224 | 11 | 389 | ubiquitin-like protein transferase activity |
| GO:0008179 | 0.005 | 23.0311 | 0.1086 | 2 | 10 | adenylate cyclase binding |
| GO:0015250 | 0.006 | 20.4707 | 0.1194 | 2 | 11 | water channel activity |
| GO:0015254 | 0.006 | 20.4707 | 0.1194 | 2 | 11 | glycerol channel activity |
| GO:0015166 | 0.0072 | 18.4225 | 0.1303 | 2 | 12 | polyol transmembrane transporter activity |
| GO:0032036 | 0.0072 | 18.4225 | 0.1303 | 2 | 12 | myosin heavy chain binding |
| GO:1990381 | 0.0072 | 18.4225 | 0.1303 | 2 | 12 | ubiquitin-specific protease binding |
| GO:0003823 | 0.0098 | 5.087 | 0.8361 | 4 | 77 | antigen binding |
| GOMFID | Pvalue | OddsRatio | ExpCount | Count | Size | Term |
| GO:0008327 | 6e-04 | 21.6583 | 0.1665 | 3 | 19 | methyl-CpG binding |
| GO:0008821 | 0.0011 | 57.375 | 0.0526 | 2 | 6 | crossover junction endodeoxyribonuclease activity |
| GO:0017108 | 0.0011 | 57.375 | 0.0526 | 2 | 6 | 5'-flap endonuclease activity |
| GO:0005184 | 0.0015 | 15.0599 | 0.2278 | 3 | 26 | neuropeptide hormone activity |
| GO:0016423 | 0.0016 | 45.8971 | 0.0613 | 2 | 7 | tRNA (guanine) methyltransferase activity |
| GO:0004984 | 0.0016 | 3.3095 | 3.2423 | 10 | 370 | olfactory receptor activity |
| GO:0031994 | 0.0026 | 32.7794 | 0.0789 | 2 | 9 | insulin-like growth factor I binding |
| GO:0004930 | 0.0035 | 2.3632 | 6.8439 | 15 | 781 | G-protein coupled receptor activity |
| GO:0019215 | 0.0048 | 22.9412 | 0.1052 | 2 | 12 | intermediate filament binding |
| GO:1901338 | 0.0074 | 17.6437 | 0.1314 | 2 | 15 | catecholamine binding |
| GO:0004498 | 0.0088 | Inf | 0.0088 | 1 | 1 | calcidiol 1-monooxygenase activity |
| GO:0004733 | 0.0088 | Inf | 0.0088 | 1 | 1 | pyridoxamine-phosphate oxidase activity |
| GO:0005298 | 0.0088 | Inf | 0.0088 | 1 | 1 | proline:sodium symporter activity |
| GO:0010428 | 0.0088 | Inf | 0.0088 | 1 | 1 | methyl-CpNpG binding |
| GO:0015052 | 0.0088 | Inf | 0.0088 | 1 | 1 | beta3-adrenergic receptor activity |
| GO:0030549 | 0.0088 | Inf | 0.0088 | 1 | 1 | acetylcholine receptor activator activity |
| GO:0031531 | 0.0088 | Inf | 0.0088 | 1 | 1 | thyrotropin-releasing hormone receptor binding |
| GO:0031764 | 0.0088 | Inf | 0.0088 | 1 | 1 | type 1 galanin receptor binding |
| GO:0045503 | 0.0088 | Inf | 0.0088 | 1 | 1 | dynein light chain binding |
| GO:0052856 | 0.0088 | Inf | 0.0088 | 1 | 1 | NADHX epimerase activity |
| GO:0052857 | 0.0088 | Inf | 0.0088 | 1 | 1 | NADPHX epimerase activity |
| GO:0016705 | 0.0098 | 4.0662 | 1.2969 | 5 | 148 | oxidoreductase activity, acting on paired donors, with incorporation or reduction of molecular oxygen |
| GOMFID | Pvalue | OddsRatio | ExpCount | Count | Size | Term |
| GO:0003841 | 1e-04 | 40.4494 | 0.1067 | 3 | 10 | 1-acylglycerol-3-phosphate O-acyltransferase activity |
| GO:0071617 | 2e-04 | 31.4566 | 0.128 | 3 | 12 | lysophospholipid acyltransferase activity |
| GO:0004939 | 3e-04 | 187.6988 | 0.032 | 2 | 3 | beta-adrenergic receptor activity |
| GO:0051380 | 7e-04 | 93.8434 | 0.0427 | 2 | 4 | norepinephrine binding |
| GO:0036402 | 0.0016 | 46.9157 | 0.064 | 2 | 6 | proteasome-activating ATPase activity |
| GO:0051379 | 0.0016 | 46.9157 | 0.064 | 2 | 6 | epinephrine binding |
| GO:0008179 | 0.0048 | 23.4518 | 0.1067 | 2 | 10 | adenylate cyclase binding |
| GO:1990381 | 0.007 | 18.759 | 0.128 | 2 | 12 | ubiquitin-specific protease binding |
| GO:0008374 | 0.0071 | 8.3134 | 0.3947 | 3 | 37 | O-acyltransferase activity |
| GOMFID | Pvalue | OddsRatio | ExpCount | Count | Size | Term |
| GO:0008311 | 0.0047 | Inf | 0.0047 | 1 | 1 | double-stranded DNA 3'-5' exodeoxyribonuclease activity |
| GO:0042931 | 0.0047 | Inf | 0.0047 | 1 | 1 | enterobactin transporter activity |
| GO:0047915 | 0.0047 | Inf | 0.0047 | 1 | 1 | ganglioside galactosyltransferase activity |
| GO:0005549 | 0.007 | 8.2363 | 0.39 | 3 | 83 | odorant binding |
| GO:0016891 | 0.0071 | 17.3878 | 0.1269 | 2 | 27 | endoribonuclease activity, producing 5'-phosphomonoesters |
| GO:0001135 | 0.0094 | 214.6986 | 0.0094 | 1 | 2 | transcription factor activity, RNA polymerase II transcription factor recruiting |
| GO:0003920 | 0.0094 | 214.6986 | 0.0094 | 1 | 2 | GMP reductase activity |
| GO:0005146 | 0.0094 | 214.6986 | 0.0094 | 1 | 2 | leukemia inhibitory factor receptor binding |
| GO:0016890 | 0.0094 | 214.6986 | 0.0094 | 1 | 2 | site-specific endodeoxyribonuclease activity, specific for altered base |
| GO:0017098 | 0.0094 | 214.6986 | 0.0094 | 1 | 2 | sulfonylurea receptor binding |
| GO:0047057 | 0.0094 | 214.6986 | 0.0094 | 1 | 2 | vitamin-K-epoxide reductase (warfarin-sensitive) activity |
| GOMFID | Pvalue | OddsRatio | ExpCount | Count | Size | Term |
| GO:0003676 | 2e-04 | 1.9387 | 32.8753 | 52 | 3698 | nucleic acid binding |
| GO:0003700 | 0.0049 | 2.065 | 9.9746 | 19 | 1122 | transcription factor activity, sequence-specific DNA binding |
| GO:0004778 | 0.0089 | Inf | 0.0089 | 1 | 1 | succinyl-CoA hydrolase activity |
| GO:0032003 | 0.0089 | Inf | 0.0089 | 1 | 1 | interleukin-28 receptor binding |
| GO:0032028 | 0.0089 | Inf | 0.0089 | 1 | 1 | myosin head/neck binding |
| GO:0033746 | 0.0089 | Inf | 0.0089 | 1 | 1 | histone demethylase activity (H3-R2 specific) |
| GO:0033749 | 0.0089 | Inf | 0.0089 | 1 | 1 | histone demethylase activity (H4-R3 specific) |
| GO:0042931 | 0.0089 | Inf | 0.0089 | 1 | 1 | enterobactin transporter activity |
| GO:0052909 | 0.0089 | Inf | 0.0089 | 1 | 1 | 18S rRNA (adenine(1779)-N(6)/adenine(1780)-N(6))-dimethyltransferase activity |
| GO:0070363 | 0.0089 | Inf | 0.0089 | 1 | 1 | mitochondrial light strand promoter sense binding |
| GOMFID | Pvalue | OddsRatio | ExpCount | Count | Size | Term |
| GO:0015271 | 0.0021 | 37.1881 | 0.0697 | 2 | 9 | outward rectifier potassium channel activity |
| GO:0044822 | 0.0059 | 2.1235 | 8.7076 | 17 | 1124 | poly(A) RNA binding |
| GO:0003983 | 0.0077 | Inf | 0.0077 | 1 | 1 | UTP:glucose-1-phosphate uridylyltransferase activity |
| GO:0004498 | 0.0077 | Inf | 0.0077 | 1 | 1 | calcidiol 1-monooxygenase activity |
| GO:0010428 | 0.0077 | Inf | 0.0077 | 1 | 1 | methyl-CpNpG binding |
| GO:0045503 | 0.0077 | Inf | 0.0077 | 1 | 1 | dynein light chain binding |
| GO:0047860 | 0.0077 | Inf | 0.0077 | 1 | 1 | diiodophenylpyruvate reductase activity |
| GO:0086087 | 0.0077 | Inf | 0.0077 | 1 | 1 | voltage-gated potassium channel activity involved in bundle of His cell action potential repolarization |
| GO:0086090 | 0.0077 | Inf | 0.0077 | 1 | 1 | voltage-gated potassium channel activity involved in SA node cell action potential repolarization |
| GO:0008327 | 0.0093 | 15.3029 | 0.1472 | 2 | 19 | methyl-CpG binding |
| GOMFID | Pvalue | OddsRatio | ExpCount | Count | Size | Term |
| GO:0004984 | 0 | 9.1436 | 1.7386 | 13 | 370 | olfactory receptor activity |
| GO:0004930 | 0 | 4.948 | 3.6699 | 15 | 781 | G-protein coupled receptor activity |
| GO:0000774 | 2e-04 | 145.1019 | 0.0235 | 2 | 5 | adenyl-nucleotide exchange factor activity |
| GO:0099600 | 5e-04 | 3.0638 | 5.714 | 15 | 1216 | transmembrane receptor activity |
| GO:0005549 | 6e-04 | 11.2803 | 0.39 | 4 | 83 | odorant binding |
| GO:0038023 | 7e-04 | 2.9235 | 5.963 | 15 | 1269 | signaling receptor activity |
| GO:0008083 | 7e-04 | 7.654 | 0.7142 | 5 | 152 | growth factor activity |
| GO:0060089 | 0.0039 | 2.4202 | 7.072 | 15 | 1505 | molecular transducer activity |
| GO:0017168 | 0.0047 | Inf | 0.0047 | 1 | 1 | 5-oxoprolinase (ATP-hydrolyzing) activity |
| GO:0051537 | 0.0047 | 21.7417 | 0.1034 | 2 | 22 | 2 iron, 2 sulfur cluster binding |
| GO:0043183 | 0.0094 | 214.6986 | 0.0094 | 1 | 2 | vascular endothelial growth factor receptor 1 binding |
| GO:0051747 | 0.0094 | 214.6986 | 0.0094 | 1 | 2 | cytosine C-5 DNA demethylase activity |
| GOMFID | Pvalue | OddsRatio | ExpCount | Count | Size | Term |
| GO:0015578 | 0.0053 | Inf | 0.0053 | 1 | 1 | mannose transmembrane transporter activity |
| GO:0052856 | 0.0053 | Inf | 0.0053 | 1 | 1 | NADHX epimerase activity |
| GO:0052857 | 0.0053 | Inf | 0.0053 | 1 | 1 | NADPHX epimerase activity |
| GOMFID | Pvalue | OddsRatio | ExpCount | Count | Size | Term |
| GO:0004930 | 0 | 6.0152 | 2.7276 | 13 | 781 | G-protein coupled receptor activity |
| GO:0004984 | 0 | 8.3095 | 1.2922 | 9 | 370 | olfactory receptor activity |
| GO:0099600 | 1e-04 | 4.1166 | 4.2469 | 14 | 1216 | transmembrane receptor activity |
| GO:0051380 | 1e-04 | 296.0566 | 0.014 | 2 | 4 | norepinephrine binding |
| GO:0038023 | 1e-04 | 3.9283 | 4.432 | 14 | 1269 | signaling receptor activity |
| GO:0005184 | 1e-04 | 39.306 | 0.0908 | 3 | 26 | neuropeptide hormone activity |
| GO:0051379 | 2e-04 | 148.0094 | 0.021 | 2 | 6 | epinephrine binding |
| GO:0001664 | 2e-04 | 7.7529 | 0.8731 | 6 | 250 | G-protein coupled receptor binding |
| GO:0004935 | 4e-04 | 84.5606 | 0.0314 | 2 | 9 | adrenergic receptor activity |
| GO:0060089 | 5e-04 | 3.2525 | 5.2562 | 14 | 1505 | molecular transducer activity |
| GO:0005132 | 0.0016 | 39.4415 | 0.0594 | 2 | 17 | type I interferon receptor binding |
| GO:0005179 | 0.0034 | 10.8409 | 0.301 | 3 | 91 | hormone activity |
| GO:0004940 | 0.0035 | Inf | 0.0035 | 1 | 1 | beta1-adrenergic receptor activity |
| GO:0005307 | 0.0035 | Inf | 0.0035 | 1 | 1 | choline:sodium symporter activity |
| GO:0031857 | 0.0035 | Inf | 0.0035 | 1 | 1 | type 1 parathyroid hormone receptor binding |
| GO:0004850 | 0.007 | 290.5926 | 0.007 | 1 | 2 | uridine phosphorylase activity |
| GO:0009019 | 0.007 | 290.5926 | 0.007 | 1 | 2 | tRNA (guanine-N1-)-methyltransferase activity |
| GO:0031696 | 0.007 | 290.5926 | 0.007 | 1 | 2 | alpha-2C adrenergic receptor binding |
| GO:0031765 | 0.007 | 290.5926 | 0.007 | 1 | 2 | type 2 galanin receptor binding |
| GO:0031766 | 0.007 | 290.5926 | 0.007 | 1 | 2 | type 3 galanin receptor binding |
| GOMFID | Pvalue | OddsRatio | ExpCount | Count | Size | Term |
| GO:0001588 | 0.0012 | 54.542 | 0.0552 | 2 | 6 | dopamine neurotransmitter receptor activity, coupled via Gs |
| GO:0035240 | 0.0036 | 27.264 | 0.0921 | 2 | 10 | dopamine binding |
| GO:0099528 | 0.0071 | 18.1713 | 0.1289 | 2 | 14 | G-protein coupled neurotransmitter receptor activity |
| GO:0004498 | 0.0092 | Inf | 0.0092 | 1 | 1 | calcidiol 1-monooxygenase activity |
| GO:0004506 | 0.0092 | Inf | 0.0092 | 1 | 1 | squalene monooxygenase activity |
| GO:0015320 | 0.0092 | Inf | 0.0092 | 1 | 1 | phosphate ion carrier activity |
| GO:0015367 | 0.0092 | Inf | 0.0092 | 1 | 1 | oxoglutarate:malate antiporter activity |
| GO:0044377 | 0.0092 | Inf | 0.0092 | 1 | 1 | RNA polymerase II core promoter proximal region sequence-specific DNA binding, bending |
| GO:0044549 | 0.0092 | Inf | 0.0092 | 1 | 1 | GTP cyclohydrolase binding |
| GO:0070042 | 0.0092 | Inf | 0.0092 | 1 | 1 | rRNA (uridine-N3-)-methyltransferase activity |
| GO:0070363 | 0.0092 | Inf | 0.0092 | 1 | 1 | mitochondrial light strand promoter sense binding |
| GO:0003735 | 0.0094 | 3.5204 | 1.7955 | 6 | 195 | structural constituent of ribosome |
| GOMFID | Pvalue | OddsRatio | ExpCount | Count | Size | Term |
| GO:0003735 | 1e-04 | 7.8957 | 0.9906 | 7 | 195 | structural constituent of ribosome |
| GO:0001588 | 4e-04 | 100.4103 | 0.0305 | 2 | 6 | dopamine neurotransmitter receptor activity, coupled via Gs |
| GO:0035240 | 0.0011 | 50.1923 | 0.0508 | 2 | 10 | dopamine binding |
| GO:0044822 | 0.0015 | 2.782 | 5.7099 | 14 | 1124 | poly(A) RNA binding |
| GO:0099528 | 0.0022 | 33.453 | 0.0711 | 2 | 14 | G-protein coupled neurotransmitter receptor activity |
| GO:0052925 | 0.0051 | Inf | 0.0051 | 1 | 1 | dol-P-Man:Man(5)GlcNAc(2)-PP-Dol alpha-1,3-mannosyltransferase activity |
| GO:0090560 | 0.0051 | Inf | 0.0051 | 1 | 1 | 2-(3-amino-3-carboxypropyl)histidine synthase activity |
| GO:0097020 | 0.0051 | Inf | 0.0051 | 1 | 1 | COPII adaptor activity |
| GOMFID | Pvalue | OddsRatio | ExpCount | Count | Size | Term |
| GO:0004984 | 1e-04 | 8.2181 | 1.0103 | 7 | 370 | olfactory receptor activity |
| GO:0005125 | 3e-04 | 9.7086 | 0.5871 | 5 | 215 | cytokine activity |
| GO:0004930 | 0.0011 | 4.4153 | 2.1325 | 8 | 781 | G-protein coupled receptor activity |
| GO:0099600 | 0.0013 | 3.6431 | 3.3203 | 10 | 1216 | transmembrane receptor activity |
| GO:0005164 | 0.0026 | 29.4165 | 0.0765 | 2 | 28 | tumor necrosis factor receptor binding |
| GO:0005130 | 0.0027 | Inf | 0.0027 | 1 | 1 | granulocyte colony-stimulating factor receptor binding |
| GO:0005140 | 0.0027 | Inf | 0.0027 | 1 | 1 | interleukin-9 receptor binding |
| GO:0004657 | 0.0055 | 373.9048 | 0.0055 | 1 | 2 | proline dehydrogenase activity |
| GO:0060089 | 0.0063 | 2.8803 | 4.1094 | 10 | 1505 | molecular transducer activity |
| GO:0038023 | 0.0064 | 3.0347 | 3.465 | 9 | 1269 | signaling receptor activity |
| GO:1990841 | 0.0082 | 186.9405 | 0.0082 | 1 | 3 | promoter-specific chromatin binding |
| GOMFID | Pvalue | OddsRatio | ExpCount | Count | Size | Term |
| GO:0003735 | 2e-04 | 4.2572 | 2.5384 | 10 | 195 | structural constituent of ribosome |
| GO:0010997 | 5e-04 | 153.1232 | 0.0391 | 2 | 3 | anaphase-promoting complex binding |
| GO:0016538 | 0.0045 | 10.0215 | 0.3385 | 3 | 26 | cyclin-dependent protein serine/threonine kinase regulator activity |
| GO:0016634 | 0.0057 | 21.8663 | 0.1172 | 2 | 9 | oxidoreductase activity, acting on the CH-CH group of donors, oxygen as acceptor |
| GOMFID | Pvalue | OddsRatio | ExpCount | Count | Size | Term |
| GO:0071855 | 0.0011 | 16.5286 | 0.2075 | 3 | 27 | neuropeptide receptor binding |
| GO:0005140 | 0.0077 | Inf | 0.0077 | 1 | 1 | interleukin-9 receptor binding |
| GO:0018169 | 0.0077 | Inf | 0.0077 | 1 | 1 | ribosomal S6-glutamic acid ligase activity |
| GO:0031707 | 0.0077 | Inf | 0.0077 | 1 | 1 | endothelin A receptor binding |
| GO:0031771 | 0.0077 | Inf | 0.0077 | 1 | 1 | type 1 hypocretin receptor binding |
| GO:0031772 | 0.0077 | Inf | 0.0077 | 1 | 1 | type 2 hypocretin receptor binding |
| GO:0031835 | 0.0077 | Inf | 0.0077 | 1 | 1 | substance P receptor binding |
| GO:0044549 | 0.0077 | Inf | 0.0077 | 1 | 1 | GTP cyclohydrolase binding |
| GO:0004984 | 0.0078 | 2.9854 | 2.8429 | 8 | 370 | olfactory receptor activity |
| GOMFID | Pvalue | OddsRatio | ExpCount | Count | Size | Term |
| GO:0044212 | 1e-04 | 2.5529 | 9.8534 | 23 | 772 | transcription regulatory region DNA binding |
| GO:0001067 | 1e-04 | 2.5386 | 9.9045 | 23 | 776 | regulatory region nucleic acid binding |
| GO:0035034 | 2e-04 | Inf | 0.0255 | 2 | 2 | histone acetyltransferase regulator activity |
| GO:1990837 | 3e-04 | 2.5612 | 8.4622 | 20 | 663 | sequence-specific double-stranded DNA binding |
| GO:0000977 | 8e-04 | 2.5578 | 7.1348 | 17 | 559 | RNA polymerase II regulatory region sequence-specific DNA binding |
| GO:0001228 | 0.0023 | 2.9225 | 3.995 | 11 | 313 | transcriptional activator activity, RNA polymerase II transcription regulatory region sequence-specific binding |
| GO:0016538 | 0.0043 | 10.2266 | 0.3319 | 3 | 26 | cyclin-dependent protein serine/threonine kinase regulator activity |
| GO:0046703 | 0.0055 | 22.3116 | 0.1149 | 2 | 9 | natural killer cell lectin-like receptor binding |
| GO:0016868 | 0.0068 | 19.5214 | 0.1276 | 2 | 10 | intramolecular transferase activity, phosphotransferases |
| GOMFID | Pvalue | OddsRatio | ExpCount | Count | Size | Term |
| GO:0050833 | 4e-04 | 173.9218 | 0.0345 | 2 | 3 | pyruvate transmembrane transporter activity |
| GO:0003735 | 0.0019 | 3.8033 | 2.2412 | 8 | 195 | structural constituent of ribosome |
| GO:0005125 | 0.0035 | 3.4313 | 2.4711 | 8 | 215 | cytokine activity |
| GOMFID | Pvalue | OddsRatio | ExpCount | Count | Size | Term |
| GO:0034046 | 1e-04 | 193.6914 | 0.0178 | 2 | 5 | poly(G) binding |
| GO:0008009 | 7e-04 | 19.6818 | 0.1707 | 3 | 48 | chemokine activity |
| GO:0004519 | 7e-04 | 10.8965 | 0.4054 | 4 | 114 | endonuclease activity |
| GO:0004984 | 0.0019 | 5.0532 | 1.3157 | 6 | 370 | olfactory receptor activity |
| GO:0004540 | 0.0032 | 11.0462 | 0.2951 | 3 | 83 | ribonuclease activity |
| GO:0004168 | 0.0036 | Inf | 0.0036 | 1 | 1 | dolichol kinase activity |
| GO:0016891 | 0.0041 | 23.2104 | 0.096 | 2 | 27 | endoribonuclease activity, producing 5'-phosphomonoesters |
| GO:0048020 | 0.0069 | 17.5746 | 0.1245 | 2 | 35 | CCR chemokine receptor binding |
| GO:0004906 | 0.0071 | 285.2909 | 0.0071 | 1 | 2 | interferon-gamma receptor activity |
| GO:0005153 | 0.0071 | 285.2909 | 0.0071 | 1 | 2 | interleukin-8 receptor binding |
| GO:0008263 | 0.0071 | 285.2909 | 0.0071 | 1 | 2 | pyrimidine-specific mismatch base pair DNA N-glycosylase activity |
| GO:0035243 | 0.0071 | 285.2909 | 0.0071 | 1 | 2 | protein-arginine omega-N symmetric methyltransferase activity |
| GO:2001069 | 0.0071 | 285.2909 | 0.0071 | 1 | 2 | glycogen binding |
| GOMFID | Pvalue | OddsRatio | ExpCount | Count | Size | Term |
| GO:0004984 | 2e-04 | 5.5491 | 1.6212 | 8 | 370 | olfactory receptor activity |
| GO:0008173 | 8e-04 | 18.2284 | 0.184 | 3 | 42 | RNA methyltransferase activity |
| GO:1990381 | 0.0012 | 46.7731 | 0.0526 | 2 | 12 | ubiquitin-specific protease binding |
| GO:0070628 | 0.0022 | 33.4009 | 0.0701 | 2 | 16 | proteasome binding |
| GO:0008757 | 0.0023 | 7.777 | 0.5571 | 4 | 129 | S-adenosylmethionine-dependent methyltransferase activity |
| GO:0016741 | 0.0024 | 5.8394 | 0.9289 | 5 | 212 | transferase activity, transferring one-carbon groups |
| GO:0004168 | 0.0044 | Inf | 0.0044 | 1 | 1 | dolichol kinase activity |
| GO:0004588 | 0.0044 | Inf | 0.0044 | 1 | 1 | orotate phosphoribosyltransferase activity |
| GO:0004590 | 0.0044 | Inf | 0.0044 | 1 | 1 | orotidine-5'-phosphate decarboxylase activity |
| GO:0015320 | 0.0044 | Inf | 0.0044 | 1 | 1 | phosphate ion carrier activity |
| GO:0030735 | 0.0044 | Inf | 0.0044 | 1 | 1 | carnosine N-methyltransferase activity |
| GO:0034632 | 0.0044 | Inf | 0.0044 | 1 | 1 | retinol transporter activity |
| GO:0035226 | 0.0044 | Inf | 0.0044 | 1 | 1 | glutamate-cysteine ligase catalytic subunit binding |
| GO:0035800 | 0.0044 | Inf | 0.0044 | 1 | 1 | deubiquitinase activator activity |
| GO:0042292 | 0.0044 | Inf | 0.0044 | 1 | 1 | URM1 activating enzyme activity |
| GO:0052906 | 0.0044 | Inf | 0.0044 | 1 | 1 | tRNA (guanine(37)-N(1))-methyltransferase activity |
| GO:0061604 | 0.0044 | Inf | 0.0044 | 1 | 1 | molybdopterin-synthase sulfurtransferase activity |
| GO:0061605 | 0.0044 | Inf | 0.0044 | 1 | 1 | molybdopterin-synthase adenylyltransferase activity |
| GO:0070037 | 0.0044 | Inf | 0.0044 | 1 | 1 | rRNA (pseudouridine) methyltransferase activity |
| GO:0004146 | 0.0087 | 230.5588 | 0.0088 | 1 | 2 | dihydrofolate reductase activity |
| GO:0004357 | 0.0087 | 230.5588 | 0.0088 | 1 | 2 | glutamate-cysteine ligase activity |
| GO:0044547 | 0.0087 | 230.5588 | 0.0088 | 1 | 2 | DNA topoisomerase binding |
| GO:0070733 | 0.0087 | 230.5588 | 0.0088 | 1 | 2 | protein adenylyltransferase activity |
| GO:0072354 | 0.0087 | 230.5588 | 0.0088 | 1 | 2 | histone kinase activity (H3-T3 specific) |
| GO:0004518 | 0.0088 | 5.2692 | 0.8106 | 4 | 185 | nuclease activity |
| GOMFID | Pvalue | OddsRatio | ExpCount | Count | Size | Term |
| GO:0015196 | 0.0065 | Inf | 0.0065 | 1 | 1 | L-tryptophan transmembrane transporter activity |
| GO:0035226 | 0.0065 | Inf | 0.0065 | 1 | 1 | glutamate-cysteine ligase catalytic subunit binding |
| GO:0043783 | 0.0065 | Inf | 0.0065 | 1 | 1 | oxidoreductase activity, oxidizing metal ions with flavin as acceptor |
| GO:0044549 | 0.0065 | Inf | 0.0065 | 1 | 1 | GTP cyclohydrolase binding |
| GO:0097655 | 0.0065 | Inf | 0.0065 | 1 | 1 | serpin family protein binding |
| GO:0003723 | 0.0072 | 2.0541 | 9.6896 | 18 | 1496 | RNA binding |
| GOMFID | Pvalue | OddsRatio | ExpCount | Count | Size | Term |
| GO:0004062 | 3e-04 | 113.5725 | 0.0271 | 2 | 6 | aryl sulfotransferase activity |
| GO:0050786 | 0.0011 | 50.4605 | 0.0496 | 2 | 11 | RAGE receptor binding |
| GO:0004475 | 0.0045 | Inf | 0.0045 | 1 | 1 | mannose-1-phosphate guanylyltransferase activity |
| GO:0046789 | 0.0045 | Inf | 0.0045 | 1 | 1 | host cell surface receptor binding |
| GO:0052856 | 0.0045 | Inf | 0.0045 | 1 | 1 | NADHX epimerase activity |
| GO:0052857 | 0.0045 | Inf | 0.0045 | 1 | 1 | NADPHX epimerase activity |
| GO:0072572 | 0.0045 | Inf | 0.0045 | 1 | 1 | poly-ADP-D-ribose binding |
| GO:0003845 | 0.009 | 223.9429 | 0.009 | 1 | 2 | 11-beta-hydroxysteroid dehydrogenase [NAD(P)] activity |
| GO:0004066 | 0.009 | 223.9429 | 0.009 | 1 | 2 | asparagine synthase (glutamine-hydrolyzing) activity |
| GO:0015218 | 0.009 | 223.9429 | 0.009 | 1 | 2 | pyrimidine nucleotide transmembrane transporter activity |
| GO:0047134 | 0.009 | 223.9429 | 0.009 | 1 | 2 | protein-disulfide reductase activity |
| GOMFID | Pvalue | OddsRatio | ExpCount | Count | Size | Term |
| GO:0070034 | 1e-04 | 50.4581 | 0.0792 | 3 | 13 | telomerase RNA binding |
| GO:0034513 | 1e-04 | 333 | 0.0183 | 2 | 3 | box H/ACA snoRNA binding |
| GO:0000774 | 4e-04 | 110.9858 | 0.0305 | 2 | 5 | adenyl-nucleotide exchange factor activity |
| GO:0034046 | 4e-04 | 110.9858 | 0.0305 | 2 | 5 | poly(G) binding |
| GO:0004984 | 4e-04 | 4.3818 | 2.2555 | 9 | 370 | olfactory receptor activity |
| GO:0044822 | 0.0012 | 2.6253 | 6.8519 | 16 | 1124 | poly(A) RNA binding |
| GO:0046703 | 0.0013 | 47.5532 | 0.0549 | 2 | 9 | natural killer cell lectin-like receptor binding |
| GO:0003676 | 0.0028 | 1.878 | 22.5431 | 35 | 3698 | nucleic acid binding |
| GO:0031210 | 0.0047 | 22.1801 | 0.1036 | 2 | 17 | phosphatidylcholine binding |
| GO:0004498 | 0.0061 | Inf | 0.0061 | 1 | 1 | calcidiol 1-monooxygenase activity |
| GO:0018169 | 0.0061 | Inf | 0.0061 | 1 | 1 | ribosomal S6-glutamic acid ligase activity |
| GO:0031751 | 0.0061 | Inf | 0.0061 | 1 | 1 | D4 dopamine receptor binding |
| GO:0042947 | 0.0061 | Inf | 0.0061 | 1 | 1 | glucoside transmembrane transporter activity |
| GO:0042605 | 0.0093 | 15.1161 | 0.1463 | 2 | 24 | peptide antigen binding |
| GOMFID | Pvalue | OddsRatio | ExpCount | Count | Size | Term |
| GO:0051087 | 5e-04 | 8.5399 | 0.6421 | 5 | 79 | chaperone binding |
| GO:0044822 | 0.0043 | 2.1474 | 9.1359 | 18 | 1124 | poly(A) RNA binding |
| GO:0051082 | 0.0072 | 5.5663 | 0.764 | 4 | 94 | unfolded protein binding |
| GO:0001872 | 0.0081 | Inf | 0.0081 | 1 | 1 | (1->3)-beta-D-glucan binding |
| GO:0008531 | 0.0081 | Inf | 0.0081 | 1 | 1 | riboflavin kinase activity |
| GO:0016034 | 0.0081 | Inf | 0.0081 | 1 | 1 | maleylacetoacetate isomerase activity |
| GO:0016807 | 0.0081 | Inf | 0.0081 | 1 | 1 | cysteine-type carboxypeptidase activity |
| GO:0047734 | 0.0081 | Inf | 0.0081 | 1 | 1 | CDP-glycerol diphosphatase activity |
| GO:0050038 | 0.0081 | Inf | 0.0081 | 1 | 1 | L-xylulose reductase (NADP+) activity |
| GO:0070180 | 0.0081 | Inf | 0.0081 | 1 | 1 | large ribosomal subunit rRNA binding |
| GO:0070611 | 0.0081 | Inf | 0.0081 | 1 | 1 | histone methyltransferase activity (H3-R2 specific) |
| GO:0070612 | 0.0081 | Inf | 0.0081 | 1 | 1 | histone methyltransferase activity (H2A-R3 specific) |
| GO:0071796 | 0.0081 | Inf | 0.0081 | 1 | 1 | K6-linked polyubiquitin binding |
| GO:0097020 | 0.0081 | Inf | 0.0081 | 1 | 1 | COPII adaptor activity |
| NA. |
| n/a |
| NA. |
| n/a |
| NA. |
| n/a |
| NA. |
| n/a |
| NA. |
| n/a |
| NA. |
| n/a |
| NA. |
| n/a |
| NA. |
| n/a |
| NA. |
| n/a |
| NA. |
| n/a |
| NA. |
| n/a |
| NA. |
| n/a |
| NA. |
| n/a |
| NA. |
| n/a |
| NA. |
| n/a |
| NA. |
| n/a |
| NA. |
| n/a |
| NA. |
| n/a |
| NA. |
| n/a |
| NA. |
| n/a |
| NA. |
| n/a |
| NA. |
| n/a |
| NA. |
| n/a |
| NA. |
| n/a |
| NA. |
| n/a |
| NA. |
| n/a |
| NA. |
| n/a |
| NA. |
| n/a |
| NA. |
| n/a |
| NA. |
| n/a |
| NA. |
| n/a |
| NA. |
| n/a |
| NA. |
| n/a |
| NA. |
| n/a |
| NA. |
| n/a |
| NA. |
| n/a |
| NA. |
| n/a |
| NA. |
| n/a |
| NA. |
| n/a |
| NA. |
| n/a |
| NA. |
| n/a |
| NA. |
| n/a |
| NA. |
| n/a |
| NA. |
| n/a |
| NA. |
| n/a |
| NA. |
| n/a |
| NA. |
| n/a |
| NA. |
| n/a |
| NA. |
| n/a |
| NA. |
| n/a |
| NA. |
| n/a |
| NA. |
| n/a |
| NA. |
| n/a |
| NA. |
| n/a |
| NA. |
| n/a |
| NA. |
| n/a |
| NA. |
| n/a |
| NA. |
| n/a |
| NA. |
| n/a |
| NA. |
| n/a |
| NA. |
| n/a |
| NA. |
| n/a |
| NA. |
| n/a |
| NA. |
| n/a |
| NA. |
| n/a |
| NA. |
| n/a |
| NA. |
| n/a |
| NA. |
| n/a |
| NA. |
| n/a |
| NA. |
| n/a |
| NA. |
| n/a |
| NA. |
| n/a |
| NA. |
| n/a |
| NA. |
| n/a |
| NA. |
| n/a |
| NA. |
| n/a |
| NA. |
| n/a |
| NA. |
| n/a |
| NA. |
| n/a |
| NA. |
| n/a |
| NA. |
| n/a |
| NA. |
| n/a |
| NA. |
| n/a |
| NA. |
| n/a |
| NA. |
| n/a |
| NA. |
| n/a |
| NA. |
| n/a |
| NA. |
| n/a |
| NA. |
| n/a |
| NA. |
| n/a |
| NA. |
| n/a |
| NA. |
| n/a |
| NA. |
| n/a |
| NA. |
| n/a |
| NA. |
| n/a |
| NA. |
| n/a |
| NA. |
| n/a |
| NA. |
| n/a |
| NA. |
| n/a |
| NA. |
| n/a |
| NA. |
| n/a |
| NA. |
| n/a |
| NA. |
| n/a |
| NA. |
| n/a |
| NA. |
| n/a |
| NA. |
| n/a |
| NA. |
| n/a |
| NA. |
| n/a |
| NA. |
| n/a |
| NA. |
| n/a |
| NA. |
| n/a |
| NA. |
| n/a |
| NA. |
| n/a |
| NA. |
| n/a |
| NA. |
| n/a |
| NA. |
| n/a |
| NA. |
| n/a |
| NA. |
| n/a |
| NA. |
| n/a |
| NA. |
| n/a |
| NA. |
| n/a |
| NA. |
| n/a |
| NA. |
| n/a |
| NA. |
| n/a |
| NA. |
| n/a |
| NA. |
| n/a |
| NA. |
| n/a |
| NA. |
| n/a |
| NA. |
| n/a |
| NA. |
| n/a |
| NA. |
| n/a |
| NA. |
| n/a |
| NA. |
| n/a |
| NA. |
| n/a |
| NA. |
| n/a |
| NA. |
| n/a |
| NA. |
| n/a |
| NA. |
| n/a |
| NA. |
| n/a |
| NA. |
| n/a |
| NA. |
| n/a |
| NA. |
| n/a |
| NA. |
| n/a |
| NA. |
| n/a |
| NA. |
| n/a |
| NA. |
| n/a |
| NA. |
| n/a |
| NA. |
| n/a |
| NA. |
| n/a |
| NA. |
| n/a |
| NA. |
| n/a |
| NA. |
| n/a |
| NA. |
| n/a |
| NA. |
| n/a |
| NA. |
| n/a |
| NA. |
| n/a |
| NA. |
| n/a |
| NA. |
| n/a |
| NA. |
| n/a |
| NA. |
| n/a |
| NA. |
| n/a |
| NA. |
| n/a |
| NA. |
| n/a |
| NA. |
| n/a |
| NA. |
| n/a |
| NA. |
| n/a |
| NA. |
| n/a |
| NA. |
| n/a |
| NA. |
| n/a |
| NA. |
| n/a |
| NA. |
| n/a |
| NA. |
| n/a |
| NA. |
| n/a |
| NA. |
| n/a |
| NA. |
| n/a |
| NA. |
| n/a |
| NA. |
| n/a |
| NA. |
| n/a |
| NA. |
| n/a |
| NA. |
| n/a |
| NA. |
| n/a |
| NA. |
| n/a |
| NA. |
| n/a |
| NA. |
| n/a |
| NA. |
| n/a |
| NA. |
| n/a |
| NA. |
| n/a |
| NA. |
| n/a |
| NA. |
| n/a |
| NA. |
| n/a |
| NA. |
| n/a |
| NA. |
| n/a |
| NA. |
| n/a |
| NA. |
| n/a |
| NA. |
| n/a |
| NA. |
| n/a |
| NA. |
| n/a |
| NA. |
| n/a |
| NA. |
| n/a |
| NA. |
| n/a |
| NA. |
| n/a |
| NA. |
| n/a |
| NA. |
| n/a |
| NA. |
| n/a |
| NA. |
| n/a |
| NA. |
| n/a |
| NA. |
| n/a |
| NA. |
| n/a |
| NA. |
| n/a |
| NA. |
| n/a |
| NA. |
| n/a |
| NA. |
| n/a |
| NA. |
| n/a |
| NA. |
| n/a |
| NA. |
| n/a |
| NA. |
| n/a |
| NA. |
| n/a |
| NA. |
| n/a |
| NA. |
| n/a |
| NA. |
| n/a |
| NA. |
| n/a |
| NA. |
| n/a |
| NA. |
| n/a |
| NA. |
| n/a |
| NA. |
| n/a |
| NA. |
| n/a |
| NA. |
| n/a |
| NA. |
| n/a |
| NA. |
| n/a |
| NA. |
| n/a |
| NA. |
| n/a |
| NA. |
| n/a |
| NA. |
| n/a |
| NA. |
| n/a |
| NA. |
| n/a |
| NA. |
| n/a |
| NA. |
| n/a |
| NA. |
| n/a |
| NA. |
| n/a |
| NA. |
| n/a |
| GOMFID | Pvalue | OddsRatio | ExpCount | Count | Size | Term |
| GO:1903225 | 0.0011 | 103.7441 | 0.0571 | 2 | 3 | negative regulation of endodermal cell differentiation |
| GO:0000278 | 0.0015 | 1.8485 | 19.0754 | 33 | 1002 | mitotic cell cycle |
| GO:0003241 | 0.0021 | 51.8687 | 0.0761 | 2 | 4 | growth involved in heart morphogenesis |
| GO:1900041 | 0.0021 | 51.8687 | 0.0761 | 2 | 4 | negative regulation of interleukin-2 secretion |
| GO:0007040 | 0.0023 | 5.9381 | 0.9328 | 5 | 49 | lysosome organization |
| GO:0044380 | 0.0024 | 8.0214 | 0.5711 | 4 | 30 | protein localization to cytoskeleton |
| GO:0036092 | 0.0026 | 13.0025 | 0.2856 | 3 | 15 | phosphatidylinositol-3-phosphate biosynthetic process |
| GO:0044314 | 0.0035 | 34.5769 | 0.0952 | 2 | 5 | protein K27-linked ubiquitination |
| GO:0044030 | 0.0038 | 11.1436 | 0.3236 | 3 | 17 | regulation of DNA methylation |
| GO:0042373 | 0.0052 | 25.931 | 0.1142 | 2 | 6 | vitamin K metabolic process |
| GO:0060920 | 0.0052 | 25.931 | 0.1142 | 2 | 6 | cardiac pacemaker cell differentiation |
| GO:0097211 | 0.0052 | 25.931 | 0.1142 | 2 | 6 | cellular response to gonadotropin-releasing hormone |
| GO:1900122 | 0.0052 | 25.931 | 0.1142 | 2 | 6 | positive regulation of receptor binding |
| GO:2000653 | 0.0052 | 25.931 | 0.1142 | 2 | 6 | regulation of genetic imprinting |
| GO:0071539 | 0.0053 | 9.7494 | 0.3617 | 3 | 19 | protein localization to centrosome |
| GO:0046879 | 0.0066 | 2.3125 | 5.9016 | 13 | 310 | hormone secretion |
| GO:0046598 | 0.0071 | 20.7434 | 0.1333 | 2 | 7 | positive regulation of viral entry into host cell |
| GO:0097151 | 0.0071 | 20.7434 | 0.1333 | 2 | 7 | positive regulation of inhibitory postsynaptic potential |
| GO:0006887 | 0.0074 | 2.2034 | 6.6631 | 14 | 350 | exocytosis |
| GO:0090276 | 0.0085 | 2.5533 | 4.1121 | 10 | 216 | regulation of peptide hormone secretion |
| GO:0006639 | 0.0087 | 2.9139 | 2.8937 | 8 | 152 | acylglycerol metabolic process |
| GO:0006767 | 0.0091 | 3.5648 | 1.7895 | 6 | 94 | water-soluble vitamin metabolic process |
| GO:0085020 | 0.0094 | 17.2851 | 0.1523 | 2 | 8 | protein K6-linked ubiquitination |
| GO:2000270 | 0.0094 | 17.2851 | 0.1523 | 2 | 8 | negative regulation of fibroblast apoptotic process |
| GO:0051640 | 0.0094 | 2.0224 | 8.2812 | 16 | 435 | organelle localization |
| GOMFID | Pvalue | OddsRatio | ExpCount | Count | Size | Term |
| GO:1900122 | 0.0047 | 27.1408 | 0.1093 | 2 | 6 | positive regulation of receptor binding |
| GO:2000653 | 0.0047 | 27.1408 | 0.1093 | 2 | 6 | regulation of genetic imprinting |
| GO:0045762 | 0.0064 | 5.8973 | 0.7466 | 4 | 41 | positive regulation of adenylate cyclase activity |
| GO:0060770 | 0.0065 | 21.7113 | 0.1275 | 2 | 7 | negative regulation of epithelial cell proliferation involved in prostate gland development |
| GO:0070601 | 0.0065 | 21.7113 | 0.1275 | 2 | 7 | centromeric sister chromatid cohesion |
| GO:0051220 | 0.007 | 5.7417 | 0.7648 | 4 | 42 | cytoplasmic sequestering of protein |
| GO:0008584 | 0.0079 | 3.2536 | 2.2762 | 7 | 125 | male gonad development |
| GOMFID | Pvalue | OddsRatio | ExpCount | Count | Size | Term |
| GO:0071464 | 7e-04 | 129.958 | 0.0458 | 2 | 3 | cellular response to hydrostatic pressure |
| GO:0032984 | 0.0011 | 2.8853 | 4.7982 | 13 | 314 | macromolecular complex disassembly |
| GO:0003104 | 0.0014 | 64.9748 | 0.0611 | 2 | 4 | positive regulation of glomerular filtration |
| GO:0072218 | 0.0014 | 64.9748 | 0.0611 | 2 | 4 | metanephric ascending thin limb development |
| GO:0006370 | 0.0015 | 9.0222 | 0.5043 | 4 | 33 | 7-methylguanosine mRNA capping |
| GO:0003073 | 0.0016 | 5.1923 | 1.253 | 6 | 82 | regulation of systemic arterial blood pressure |
| GO:0007200 | 0.0018 | 5.0585 | 1.2836 | 6 | 84 | phospholipase C-activating G-protein coupled receptor signaling pathway |
| GO:0031952 | 0.0021 | 8.1748 | 0.5501 | 4 | 36 | regulation of protein autophosphorylation |
| GO:0071279 | 0.0023 | 43.3137 | 0.0764 | 2 | 5 | cellular response to cobalt ion |
| GO:0036260 | 0.0024 | 7.9266 | 0.5654 | 4 | 37 | RNA capping |
| GO:0001696 | 0.0028 | 12.2231 | 0.2903 | 3 | 19 | gastric acid secretion |
| GO:0043624 | 0.0032 | 2.7984 | 4.1564 | 11 | 272 | cellular protein complex disassembly |
| GO:0008063 | 0.0033 | 32.4832 | 0.0917 | 2 | 6 | Toll signaling pathway |
| GO:0045347 | 0.0033 | 32.4832 | 0.0917 | 2 | 6 | negative regulation of MHC class II biosynthetic process |
| GO:0034141 | 0.0046 | 25.9849 | 0.107 | 2 | 7 | positive regulation of toll-like receptor 3 signaling pathway |
| GO:0071169 | 0.0046 | 25.9849 | 0.107 | 2 | 7 | establishment of protein localization to chromatin |
| GO:0072177 | 0.0046 | 25.9849 | 0.107 | 2 | 7 | mesonephric duct development |
| GO:0072235 | 0.0046 | 25.9849 | 0.107 | 2 | 7 | metanephric distal tubule development |
| GO:0006283 | 0.0049 | 4.8901 | 1.1002 | 5 | 72 | transcription-coupled nucleotide-excision repair |
| GO:1903902 | 0.005 | 4.0626 | 1.5739 | 6 | 103 | positive regulation of viral life cycle |
| GO:0035019 | 0.0061 | 4.6134 | 1.1613 | 5 | 76 | somatic stem cell population maintenance |
| GO:0031659 | 0.0061 | 21.6527 | 0.1222 | 2 | 8 | positive regulation of cyclin-dependent protein serine/threonine kinase activity involved in G1/S transition of mitotic cell cycle |
| GO:0032509 | 0.0061 | 21.6527 | 0.1222 | 2 | 8 | endosome transport via multivesicular body sorting pathway |
| GO:0071420 | 0.0061 | 21.6527 | 0.1222 | 2 | 8 | cellular response to histamine |
| GO:0071260 | 0.0065 | 4.5491 | 1.1766 | 5 | 77 | cellular response to mechanical stimulus |
| GO:0050775 | 0.0071 | 8.4992 | 0.3973 | 3 | 26 | positive regulation of dendrite morphogenesis |
| GO:0000398 | 0.0075 | 2.6039 | 4.0341 | 10 | 264 | mRNA splicing, via spliceosome |
| GO:0010389 | 0.0076 | 5.5604 | 0.7793 | 4 | 51 | regulation of G2/M transition of mitotic cell cycle |
| GO:0006950 | 0.0079 | 1.4257 | 59.1366 | 76 | 3870 | response to stress |
| GO:0070661 | 0.0079 | 2.5832 | 4.0647 | 10 | 266 | leukocyte proliferation |
| GO:0000375 | 0.0083 | 2.5629 | 4.0953 | 10 | 268 | RNA splicing, via transesterification reactions |
| GO:0002377 | 0.0084 | 4.2523 | 1.253 | 5 | 82 | immunoglobulin production |
| GO:0032507 | 0.0084 | 4.2523 | 1.253 | 5 | 82 | maintenance of protein location in cell |
| GO:0002376 | 0.0086 | 1.4898 | 38.584 | 53 | 2525 | immune system process |
| GO:0031440 | 0.0087 | 7.8182 | 0.4279 | 3 | 28 | regulation of mRNA 3'-end processing |
| GO:0034587 | 0.0096 | 7.517 | 0.4431 | 3 | 29 | piRNA metabolic process |
| GO:0060674 | 0.0096 | 7.517 | 0.4431 | 3 | 29 | placenta blood vessel development |
| GO:0006105 | 0.0097 | 16.2374 | 0.1528 | 2 | 10 | succinate metabolic process |
| GO:0006600 | 0.0097 | 16.2374 | 0.1528 | 2 | 10 | creatine metabolic process |
| GO:0034145 | 0.0097 | 16.2374 | 0.1528 | 2 | 10 | positive regulation of toll-like receptor 4 signaling pathway |
| GO:0002274 | 0.0098 | 3.1094 | 2.3685 | 7 | 155 | myeloid leukocyte activation |
| GO:0002443 | 0.0099 | 2.494 | 4.2022 | 10 | 275 | leukocyte mediated immunity |
| GOMFID | Pvalue | OddsRatio | ExpCount | Count | Size | Term |
| GO:0034142 | 1e-04 | 5.0848 | 1.9435 | 9 | 111 | toll-like receptor 4 signaling pathway |
| GO:2001020 | 2e-04 | 4.3736 | 2.4863 | 10 | 142 | regulation of response to DNA damage stimulus |
| GO:0007130 | 2e-04 | 16.2541 | 0.3152 | 4 | 18 | synaptonemal complex assembly |
| GO:0060545 | 3e-04 | Inf | 0.035 | 2 | 2 | positive regulation of necroptotic process |
| GO:0002757 | 3e-04 | 2.6079 | 7.8091 | 19 | 446 | immune response-activating signal transduction |
| GO:0021762 | 8e-04 | 7.7047 | 0.7354 | 5 | 42 | substantia nigra development |
| GO:0080134 | 9e-04 | 1.7983 | 24.7055 | 41 | 1411 | regulation of response to stress |
| GO:0051592 | 9e-04 | 4.3318 | 1.9961 | 8 | 114 | response to calcium ion |
| GO:0034138 | 0.001 | 4.8299 | 1.5758 | 7 | 90 | toll-like receptor 3 signaling pathway |
| GO:0002218 | 0.0013 | 2.8288 | 4.8851 | 13 | 279 | activation of innate immune response |
| GO:0002221 | 0.0013 | 3.3675 | 3.1692 | 10 | 181 | pattern recognition receptor signaling pathway |
| GO:0034162 | 0.0015 | 5.2729 | 1.2432 | 6 | 71 | toll-like receptor 9 signaling pathway |
| GO:0007166 | 0.0016 | 1.5621 | 46.6187 | 66 | 2681 | cell surface receptor signaling pathway |
| GO:0032483 | 0.0018 | 56.5165 | 0.07 | 2 | 4 | regulation of Rab protein signal transduction |
| GO:1900041 | 0.0018 | 56.5165 | 0.07 | 2 | 4 | negative regulation of interleukin-2 secretion |
| GO:1903215 | 0.0018 | 56.5165 | 0.07 | 2 | 4 | negative regulation of protein targeting to mitochondrion |
| GO:0023051 | 0.0019 | 1.535 | 50.3916 | 70 | 2878 | regulation of signaling |
| GO:0035666 | 0.0021 | 4.8946 | 1.3307 | 6 | 76 | TRIF-dependent toll-like receptor signaling pathway |
| GO:0010646 | 0.0022 | 1.5237 | 50.6892 | 70 | 2895 | regulation of cell communication |
| GO:0050860 | 0.0025 | 13.0809 | 0.2801 | 3 | 16 | negative regulation of T cell receptor signaling pathway |
| GO:0043123 | 0.003 | 3.2293 | 2.9591 | 9 | 169 | positive regulation of I-kappaB kinase/NF-kappaB signaling |
| GO:0032388 | 0.0034 | 2.4246 | 6.0932 | 14 | 348 | positive regulation of intracellular transport |
| GO:0050778 | 0.0035 | 2.0226 | 10.9783 | 21 | 627 | positive regulation of immune response |
| GO:0045088 | 0.0038 | 2.3163 | 6.8286 | 15 | 390 | regulation of innate immune response |
| GO:1902531 | 0.004 | 1.6283 | 27.6646 | 42 | 1580 | regulation of intracellular signal transduction |
| GO:0001696 | 0.0042 | 10.6261 | 0.3327 | 3 | 19 | gastric acid secretion |
| GO:0008063 | 0.0044 | 28.2546 | 0.1051 | 2 | 6 | Toll signaling pathway |
| GO:0045837 | 0.0044 | 28.2546 | 0.1051 | 2 | 6 | negative regulation of membrane potential |
| GO:0060385 | 0.0044 | 28.2546 | 0.1051 | 2 | 6 | axonogenesis involved in innervation |
| GO:1990000 | 0.0044 | 28.2546 | 0.1051 | 2 | 6 | amyloid fibril formation |
| GO:0045637 | 0.0045 | 3.0194 | 3.1517 | 9 | 180 | regulation of myeloid cell differentiation |
| GO:0051092 | 0.0052 | 3.5407 | 2.1011 | 7 | 120 | positive regulation of NF-kappaB transcription factor activity |
| GO:1903900 | 0.0052 | 2.9496 | 3.2217 | 9 | 184 | regulation of viral life cycle |
| GO:0034166 | 0.0052 | 4.8249 | 1.1206 | 5 | 64 | toll-like receptor 10 signaling pathway |
| GO:0034146 | 0.0056 | 4.7441 | 1.1381 | 5 | 65 | toll-like receptor 5 signaling pathway |
| GO:0019637 | 0.0057 | 1.744 | 17.6143 | 29 | 1006 | organophosphate metabolic process |
| GO:0032344 | 0.0061 | 22.6022 | 0.1226 | 2 | 7 | regulation of aldosterone metabolic process |
| GO:0002682 | 0.0061 | 1.6093 | 25.8436 | 39 | 1476 | regulation of immune system process |
| GO:0010517 | 0.0061 | 3.8889 | 1.6459 | 6 | 94 | regulation of phospholipase activity |
| GO:0019079 | 0.0061 | 3.8889 | 1.6459 | 6 | 94 | viral genome replication |
| GO:0007265 | 0.0062 | 2.1246 | 7.9142 | 16 | 452 | Ras protein signal transduction |
| GO:0003416 | 0.0064 | 8.9466 | 0.3852 | 3 | 22 | endochondral bone growth |
| GO:0021675 | 0.0072 | 4.4465 | 1.2081 | 5 | 69 | nerve development |
| GO:0035307 | 0.0072 | 5.6793 | 0.7704 | 4 | 44 | positive regulation of protein dephosphorylation |
| GO:1902600 | 0.0075 | 3.7188 | 1.7159 | 6 | 98 | hydrogen ion transmembrane transport |
| GO:0038123 | 0.0076 | 4.3778 | 1.2256 | 5 | 70 | toll-like receptor TLR1:TLR2 signaling pathway |
| GO:0038124 | 0.0076 | 4.3778 | 1.2256 | 5 | 70 | toll-like receptor TLR6:TLR2 signaling pathway |
| GO:0065007 | 0.0078 | 1.4062 | 187.2787 | 206 | 10696 | biological regulation |
| GO:0031349 | 0.0079 | 2.119 | 7.4239 | 15 | 424 | positive regulation of defense response |
| GO:0007028 | 0.008 | 18.8339 | 0.1401 | 2 | 8 | cytoplasm organization |
| GO:0010603 | 0.008 | 18.8339 | 0.1401 | 2 | 8 | regulation of cytoplasmic mRNA processing body assembly |
| GO:0010635 | 0.008 | 18.8339 | 0.1401 | 2 | 8 | regulation of mitochondrial fusion |
| GO:0060534 | 0.008 | 18.8339 | 0.1401 | 2 | 8 | trachea cartilage development |
| GO:0071420 | 0.008 | 18.8339 | 0.1401 | 2 | 8 | cellular response to histamine |
| GO:1904322 | 0.008 | 18.8339 | 0.1401 | 2 | 8 | cellular response to forskolin |
| GO:0019080 | 0.008 | 2.7433 | 3.4493 | 9 | 197 | viral gene expression |
| GO:0009967 | 0.0082 | 1.5943 | 24.653 | 37 | 1408 | positive regulation of signal transduction |
| GO:0051130 | 0.0092 | 1.6618 | 19.0676 | 30 | 1089 | positive regulation of cellular component organization |
| GO:0010033 | 0.0092 | 1.4244 | 51.0044 | 67 | 2913 | response to organic substance |
| GO:0046483 | 0.0092 | 1.3509 | 95.8455 | 115 | 5474 | heterocycle metabolic process |
| GO:0031345 | 0.0097 | 3.1227 | 2.3637 | 7 | 135 | negative regulation of cell projection organization |
| GO:1901360 | 0.0098 | 1.3444 | 99.8902 | 119 | 5705 | organic cyclic compound metabolic process |
| GOMFID | Pvalue | OddsRatio | ExpCount | Count | Size | Term |
| GO:0006029 | 9e-04 | 4.9405 | 1.5406 | 7 | 92 | proteoglycan metabolic process |
| GO:0000038 | 0.0011 | 9.9221 | 0.4689 | 4 | 28 | very long-chain fatty acid metabolic process |
| GO:0034626 | 0.0016 | 59.1609 | 0.067 | 2 | 4 | fatty acid elongation, polyunsaturated fatty acid |
| GO:0019367 | 0.0027 | 39.4381 | 0.0837 | 2 | 5 | fatty acid elongation, saturated fatty acid |
| GO:0019800 | 0.0027 | 39.4381 | 0.0837 | 2 | 5 | peptide cross-linking via chondroitin 4-sulfate glycosaminoglycan |
| GO:0009445 | 0.004 | 29.5766 | 0.1005 | 2 | 6 | putrescine metabolic process |
| GO:0014883 | 0.0055 | 23.6598 | 0.1172 | 2 | 7 | transition between fast and slow fiber |
| GO:0036289 | 0.0055 | 23.6598 | 0.1172 | 2 | 7 | peptidyl-serine autophosphorylation |
| GO:1903309 | 0.0057 | 6.1 | 0.72 | 4 | 43 | negative regulation of chromatin modification |
| GO:0010811 | 0.0064 | 3.8534 | 1.6578 | 6 | 99 | positive regulation of cell-substrate adhesion |
| GO:0044773 | 0.0067 | 3.8122 | 1.6745 | 6 | 100 | mitotic DNA damage checkpoint |
| GO:0050435 | 0.0072 | 8.4736 | 0.4019 | 3 | 24 | beta-amyloid metabolic process |
| GO:0009744 | 0.0073 | 19.7152 | 0.134 | 2 | 8 | response to sucrose |
| GO:0016188 | 0.0073 | 19.7152 | 0.134 | 2 | 8 | synaptic vesicle maturation |
| GO:2000781 | 0.0073 | 19.7152 | 0.134 | 2 | 8 | positive regulation of double-strand break repair |
| GO:0006488 | 0.0075 | 4.3818 | 1.2224 | 5 | 73 | dolichol-linked oligosaccharide biosynthetic process |
| GO:0007093 | 0.0085 | 2.9228 | 2.8802 | 8 | 172 | mitotic cell cycle checkpoint |
| GO:0050881 | 0.009 | 5.2846 | 0.8205 | 4 | 49 | musculoskeletal movement |
| GO:0045932 | 0.0091 | 7.7358 | 0.4354 | 3 | 26 | negative regulation of muscle contraction |
| GO:0035459 | 0.0093 | 16.8976 | 0.1507 | 2 | 9 | cargo loading into vesicle |
| GOMFID | Pvalue | OddsRatio | ExpCount | Count | Size | Term |
| GO:0045410 | 2e-04 | 38.9748 | 0.1228 | 3 | 8 | positive regulation of interleukin-6 biosynthetic process |
| GO:0097055 | 2e-04 | Inf | 0.0307 | 2 | 2 | agmatine biosynthetic process |
| GO:0070340 | 7e-04 | 129.4059 | 0.046 | 2 | 3 | detection of bacterial lipopeptide |
| GO:2000001 | 9e-04 | 19.4811 | 0.1995 | 3 | 13 | regulation of DNA damage checkpoint |
| GO:0002741 | 0.0023 | 43.1297 | 0.0767 | 2 | 5 | positive regulation of cytokine secretion involved in immune response |
| GO:0006681 | 0.0023 | 43.1297 | 0.0767 | 2 | 5 | galactosylceramide metabolic process |
| GO:0009446 | 0.0023 | 43.1297 | 0.0767 | 2 | 5 | putrescine biosynthetic process |
| GO:0034104 | 0.0025 | 12.9832 | 0.2762 | 3 | 18 | negative regulation of tissue remodeling |
| GO:1903018 | 0.0029 | 7.4406 | 0.5984 | 4 | 39 | regulation of glycoprotein metabolic process |
| GO:0051964 | 0.0034 | 32.3452 | 0.0921 | 2 | 6 | negative regulation of synapse assembly |
| GO:0071221 | 0.0034 | 32.3452 | 0.0921 | 2 | 6 | cellular response to bacterial lipopeptide |
| GO:0048041 | 0.0036 | 5.2635 | 1.0281 | 5 | 67 | focal adhesion assembly |
| GO:1903393 | 0.0039 | 10.8172 | 0.3222 | 3 | 21 | positive regulation of adherens junction organization |
| GO:0055093 | 0.0044 | 10.2472 | 0.3376 | 3 | 22 | response to hyperoxia |
| GO:0051783 | 0.0046 | 3.2637 | 2.5932 | 8 | 169 | regulation of nuclear division |
| GO:0014883 | 0.0047 | 25.8745 | 0.1074 | 2 | 7 | transition between fast and slow fiber |
| GO:0032493 | 0.0047 | 25.8745 | 0.1074 | 2 | 7 | response to bacterial lipoprotein |
| GO:0038030 | 0.0047 | 25.8745 | 0.1074 | 2 | 7 | non-canonical Wnt signaling pathway via MAPK cascade |
| GO:0010948 | 0.0051 | 2.7697 | 3.8054 | 10 | 248 | negative regulation of cell cycle process |
| GO:0010862 | 0.0058 | 6.0532 | 0.7212 | 4 | 47 | positive regulation of pathway-restricted SMAD protein phosphorylation |
| GO:0007172 | 0.0062 | 21.5607 | 0.1228 | 2 | 8 | signal complex assembly |
| GO:0033080 | 0.0062 | 21.5607 | 0.1228 | 2 | 8 | immature T cell proliferation in thymus |
| GO:0061101 | 0.0062 | 21.5607 | 0.1228 | 2 | 8 | neuroendocrine cell differentiation |
| GO:0034333 | 0.0066 | 4.5295 | 1.1815 | 5 | 77 | adherens junction assembly |
| GO:0042384 | 0.0071 | 3.0173 | 2.7927 | 8 | 182 | cilium assembly |
| GO:0006446 | 0.0073 | 4.4065 | 1.2122 | 5 | 79 | regulation of translational initiation |
| GO:0006672 | 0.0077 | 4.3475 | 1.2276 | 5 | 80 | ceramide metabolic process |
| GO:0045080 | 0.0079 | 18.4794 | 0.1381 | 2 | 9 | positive regulation of chemokine biosynthetic process |
| GO:0045807 | 0.0083 | 3.6305 | 1.7493 | 6 | 114 | positive regulation of endocytosis |
| GO:0007044 | 0.0094 | 4.1263 | 1.2889 | 5 | 84 | cell-substrate junction assembly |
| GO:0010561 | 0.0097 | 16.1684 | 0.1534 | 2 | 10 | negative regulation of glycoprotein biosynthetic process |
| GO:0010826 | 0.0097 | 16.1684 | 0.1534 | 2 | 10 | negative regulation of centrosome duplication |
| GO:0061525 | 0.0097 | 16.1684 | 0.1534 | 2 | 10 | hindgut development |
| GOMFID | Pvalue | OddsRatio | ExpCount | Count | Size | Term |
| GO:0045410 | 2e-04 | 36.049 | 0.1324 | 3 | 8 | positive regulation of interleukin-6 biosynthetic process |
| GO:0070340 | 8e-04 | 119.7287 | 0.0497 | 2 | 3 | detection of bacterial lipopeptide |
| GO:0018230 | 0.0016 | 59.8605 | 0.0662 | 2 | 4 | peptidyl-L-cysteine S-palmitoylation |
| GO:0044782 | 0.002 | 3.1779 | 3.3439 | 10 | 202 | cilium organization |
| GO:0070925 | 0.0022 | 2.2058 | 9.1379 | 19 | 552 | organelle assembly |
| GO:0090110 | 0.0026 | 39.9044 | 0.0828 | 2 | 5 | cargo loading into COPII-coated vesicle |
| GO:2000002 | 0.0026 | 39.9044 | 0.0828 | 2 | 5 | negative regulation of DNA damage checkpoint |
| GO:0060271 | 0.0033 | 2.9592 | 3.5757 | 10 | 216 | cilium morphogenesis |
| GO:0071221 | 0.0039 | 29.9264 | 0.0993 | 2 | 6 | cellular response to bacterial lipopeptide |
| GO:0007018 | 0.004 | 3.3483 | 2.5337 | 8 | 155 | microtubule-based movement |
| GO:0032493 | 0.0054 | 23.9395 | 0.1159 | 2 | 7 | response to bacterial lipoprotein |
| GO:0010927 | 0.0059 | 2.5602 | 4.5193 | 11 | 273 | cellular component assembly involved in morphogenesis |
| GO:0003341 | 0.0064 | 5.8708 | 0.7449 | 4 | 45 | cilium movement |
| GO:0033129 | 0.0072 | 19.9483 | 0.1324 | 2 | 8 | positive regulation of histone phosphorylation |
| GO:0035058 | 0.0088 | 7.8276 | 0.4304 | 3 | 26 | nonmotile primary cilium assembly |
| GO:0006563 | 0.0091 | 17.0975 | 0.149 | 2 | 9 | L-serine metabolic process |
| GO:0034058 | 0.0091 | 17.0975 | 0.149 | 2 | 9 | endosomal vesicle fusion |
| GO:0070647 | 0.0094 | 1.7244 | 15.9086 | 26 | 961 | protein modification by small protein conjugation or removal |
| GOMFID | Pvalue | OddsRatio | ExpCount | Count | Size | Term |
| GO:0009057 | 3e-04 | 1.9912 | 20.1798 | 37 | 1116 | macromolecule catabolic process |
| GO:0007052 | 5e-04 | 5.4638 | 1.4104 | 7 | 78 | mitotic spindle organization |
| GO:0072156 | 0.001 | 109.3688 | 0.0542 | 2 | 3 | distal tubule morphogenesis |
| GO:0035426 | 0.0019 | 54.6809 | 0.0723 | 2 | 4 | extracellular matrix-cell signaling |
| GO:1902850 | 0.002 | 6.1239 | 0.9041 | 5 | 50 | microtubule cytoskeleton organization involved in mitosis |
| GO:0051044 | 0.0023 | 13.71 | 0.2712 | 3 | 15 | positive regulation of membrane protein ectodomain proteolysis |
| GO:0006469 | 0.0032 | 2.7971 | 4.1589 | 11 | 230 | negative regulation of protein kinase activity |
| GO:0042326 | 0.0038 | 2.2421 | 7.5222 | 16 | 416 | negative regulation of phosphorylation |
| GO:0009838 | 0.0047 | 27.3369 | 0.1085 | 2 | 6 | abscission |
| GO:0010359 | 0.0047 | 27.3369 | 0.1085 | 2 | 6 | regulation of anion channel activity |
| GO:0045869 | 0.0047 | 27.3369 | 0.1085 | 2 | 6 | negative regulation of single stranded viral RNA replication via double stranded DNA intermediate |
| GO:0019068 | 0.0052 | 6.2804 | 0.7052 | 4 | 39 | virion assembly |
| GO:0051052 | 0.0058 | 2.354 | 5.8044 | 13 | 321 | regulation of DNA metabolic process |
| GO:0039702 | 0.0061 | 9.1364 | 0.3797 | 3 | 21 | viral budding via host ESCRT complex |
| GO:0051348 | 0.0063 | 2.246 | 6.5458 | 14 | 362 | negative regulation of transferase activity |
| GO:0010638 | 0.0064 | 1.9759 | 10.108 | 19 | 559 | positive regulation of organelle organization |
| GO:0032466 | 0.0064 | 21.8681 | 0.1266 | 2 | 7 | negative regulation of cytokinesis |
| GO:0051256 | 0.0064 | 21.8681 | 0.1266 | 2 | 7 | mitotic spindle midzone assembly |
| GO:0032886 | 0.0065 | 3.0753 | 2.7485 | 8 | 152 | regulation of microtubule-based process |
| GO:0045787 | 0.0066 | 2.3156 | 5.8948 | 13 | 326 | positive regulation of cell cycle |
| GO:0051310 | 0.0068 | 5.7835 | 0.7595 | 4 | 42 | metaphase plate congression |
| GO:1904353 | 0.007 | 8.655 | 0.3978 | 3 | 22 | regulation of telomere capping |
| GO:0090224 | 0.0079 | 8.2217 | 0.4159 | 3 | 23 | regulation of spindle organization |
| GO:0006281 | 0.008 | 2.0123 | 8.8603 | 17 | 490 | DNA repair |
| GO:0033129 | 0.0085 | 18.2222 | 0.1447 | 2 | 8 | positive regulation of histone phosphorylation |
| GO:2000480 | 0.0085 | 18.2222 | 0.1447 | 2 | 8 | negative regulation of cAMP-dependent protein kinase activity |
| GO:0009056 | 0.0085 | 1.4808 | 38.3706 | 53 | 2122 | catabolic process |
| GO:0034198 | 0.0089 | 7.8297 | 0.434 | 3 | 24 | cellular response to amino acid starvation |
| GO:1902592 | 0.0089 | 7.8297 | 0.434 | 3 | 24 | multi-organism membrane budding |
| GO:2000178 | 0.0089 | 7.8297 | 0.434 | 3 | 24 | negative regulation of neural precursor cell proliferation |
| GO:0043407 | 0.0092 | 4.1697 | 1.2838 | 5 | 71 | negative regulation of MAP kinase activity |
| GO:0045732 | 0.0094 | 2.513 | 4.1726 | 10 | 233 | positive regulation of protein catabolic process |
| GO:0044773 | 0.0096 | 3.5194 | 1.8082 | 6 | 100 | mitotic DNA damage checkpoint |
| GO:0050792 | 0.0098 | 2.652 | 3.5622 | 9 | 197 | regulation of viral process |
| GOMFID | Pvalue | OddsRatio | ExpCount | Count | Size | Term |
| GO:0045762 | 0.001 | 7.3377 | 0.7727 | 5 | 41 | positive regulation of adenylate cyclase activity |
| GO:0050893 | 0.001 | 104.8231 | 0.0565 | 2 | 3 | sensory processing |
| GO:0036498 | 0.0014 | 5.3832 | 1.225 | 6 | 65 | IRE1-mediated unfolded protein response |
| GO:0072595 | 0.002 | 8.4301 | 0.5465 | 4 | 29 | maintenance of protein localization in organelle |
| GO:0060271 | 0.0027 | 2.8627 | 4.0708 | 11 | 216 | cilium morphogenesis |
| GO:1904355 | 0.0031 | 12.1268 | 0.3015 | 3 | 16 | positive regulation of telomere capping |
| GO:0001996 | 0.0034 | 34.9365 | 0.0942 | 2 | 5 | positive regulation of heart rate by epinephrine-norepinephrine |
| GO:0045777 | 0.005 | 6.3831 | 0.6973 | 4 | 37 | positive regulation of blood pressure |
| GO:1902855 | 0.0051 | 26.2007 | 0.1131 | 2 | 6 | regulation of nonmotile primary cilium assembly |
| GO:0001696 | 0.0051 | 9.8511 | 0.3581 | 3 | 19 | gastric acid secretion |
| GO:0051932 | 0.0066 | 5.8501 | 0.7539 | 4 | 40 | synaptic transmission, GABAergic |
| GO:0060406 | 0.007 | 20.9592 | 0.1319 | 2 | 7 | positive regulation of penile erection |
| GO:0090102 | 0.0072 | 5.6916 | 0.7727 | 4 | 41 | cochlea development |
| GO:2000573 | 0.0072 | 5.6916 | 0.7727 | 4 | 41 | positive regulation of DNA biosynthetic process |
| GO:0007214 | 0.0078 | 8.2941 | 0.4146 | 3 | 22 | gamma-aminobutyric acid signaling pathway |
| GO:0032210 | 0.0086 | 5.399 | 0.8104 | 4 | 43 | regulation of telomere maintenance via telomerase |
| GO:0050798 | 0.0086 | 5.399 | 0.8104 | 4 | 43 | activated T cell proliferation |
| GO:0070925 | 0.0087 | 1.9145 | 10.4032 | 19 | 552 | organelle assembly |
| GO:0035845 | 0.0092 | 17.4649 | 0.1508 | 2 | 8 | photoreceptor cell outer segment organization |
| GOMFID | Pvalue | OddsRatio | ExpCount | Count | Size | Term |
| GO:0010803 | 0.0011 | 7.0802 | 0.7885 | 5 | 48 | regulation of tumor necrosis factor-mediated signaling pathway |
| GO:0043508 | 0.0014 | 16.5102 | 0.23 | 3 | 14 | negative regulation of JUN kinase activity |
| GO:0045184 | 0.0017 | 1.6688 | 31.3588 | 48 | 1909 | establishment of protein localization |
| GO:0006911 | 0.002 | 8.3731 | 0.5421 | 4 | 33 | phagocytosis, engulfment |
| GO:0018279 | 0.0023 | 2.9208 | 3.9917 | 11 | 243 | protein N-linked glycosylation via asparagine |
| GO:0071902 | 0.0024 | 2.7526 | 4.6159 | 12 | 281 | positive regulation of protein serine/threonine kinase activity |
| GO:0015936 | 0.0025 | 12.9697 | 0.2793 | 3 | 17 | coenzyme A metabolic process |
| GO:0033865 | 0.0031 | 7.3562 | 0.6078 | 4 | 37 | nucleoside bisphosphate metabolic process |
| GO:0090162 | 0.0035 | 11.3471 | 0.3121 | 3 | 19 | establishment of epithelial cell polarity |
| GO:0046328 | 0.004 | 3.3539 | 2.5297 | 8 | 154 | regulation of JNK cascade |
| GO:0032873 | 0.0041 | 6.7419 | 0.6571 | 4 | 40 | negative regulation of stress-activated MAPK cascade |
| GO:0070302 | 0.0041 | 3.0659 | 3.1047 | 9 | 189 | regulation of stress-activated protein kinase signaling cascade |
| GO:0006886 | 0.0051 | 1.7979 | 15.934 | 27 | 970 | intracellular protein transport |
| GO:0007185 | 0.0053 | 24.1297 | 0.115 | 2 | 7 | transmembrane receptor protein tyrosine phosphatase signaling pathway |
| GO:0007098 | 0.0066 | 4.5369 | 1.1827 | 5 | 72 | centrosome cycle |
| GO:0000187 | 0.0067 | 3.3644 | 2.2012 | 7 | 134 | activation of MAPK activity |
| GO:0007620 | 0.0069 | 8.6426 | 0.3942 | 3 | 24 | copulation |
| GO:0045008 | 0.0071 | 20.1068 | 0.1314 | 2 | 8 | depyrimidination |
| GO:0090073 | 0.0071 | 20.1068 | 0.1314 | 2 | 8 | positive regulation of protein homodimerization activity |
| GO:0090023 | 0.0077 | 8.2492 | 0.4107 | 3 | 25 | positive regulation of neutrophil chemotaxis |
| GO:0044249 | 0.0078 | 1.371 | 94.7665 | 114 | 5769 | cellular biosynthetic process |
| GO:0006486 | 0.0079 | 2.1866 | 6.7186 | 14 | 409 | protein glycosylation |
| GO:0008154 | 0.0079 | 2.964 | 2.8418 | 8 | 173 | actin polymerization or depolymerization |
| GO:0043405 | 0.0081 | 2.1154 | 7.4414 | 15 | 453 | regulation of MAP kinase activity |
| GO:0051225 | 0.0082 | 4.2802 | 1.2484 | 5 | 76 | spindle assembly |
| GO:0031023 | 0.0084 | 3.6179 | 1.7577 | 6 | 107 | microtubule organizing center organization |
| GO:0070085 | 0.0085 | 2.1641 | 6.7843 | 14 | 413 | glycosylation |
| GO:0043412 | 0.009 | 1.3988 | 63.884 | 81 | 3889 | macromolecule modification |
| GO:1901576 | 0.0096 | 1.3571 | 96.3106 | 115 | 5863 | organic substance biosynthetic process |
| GO:0070727 | 0.0099 | 1.5848 | 24.1475 | 36 | 1470 | cellular macromolecule localization |
| GOMFID | Pvalue | OddsRatio | ExpCount | Count | Size | Term |
| GO:0031667 | 0.0013 | 2.3739 | 8.0692 | 18 | 497 | response to nutrient levels |
| GO:0042493 | 0.0016 | 2.4698 | 6.881 | 16 | 427 | response to drug |
| GO:0007005 | 0.0016 | 2.0923 | 11.7223 | 23 | 722 | mitochondrion organization |
| GO:0006289 | 0.0023 | 4.1253 | 1.8184 | 7 | 112 | nucleotide-excision repair |
| GO:0006526 | 0.0025 | 40.7062 | 0.0812 | 2 | 5 | arginine biosynthetic process |
| GO:0006271 | 0.0029 | 7.4456 | 0.6007 | 4 | 37 | DNA strand elongation involved in DNA replication |
| GO:0034551 | 0.0038 | 30.5277 | 0.0974 | 2 | 6 | mitochondrial respiratory chain complex III assembly |
| GO:2001023 | 0.0038 | 30.5277 | 0.0974 | 2 | 6 | regulation of response to drug |
| GO:0006471 | 0.0045 | 10.207 | 0.341 | 3 | 21 | protein ADP-ribosylation |
| GO:0042273 | 0.0047 | 6.4638 | 0.6819 | 4 | 42 | ribosomal large subunit biogenesis |
| GO:0070131 | 0.0052 | 24.4206 | 0.1137 | 2 | 7 | positive regulation of mitochondrial translation |
| GO:1901698 | 0.0053 | 1.7749 | 16.7554 | 28 | 1032 | response to nitrogen compound |
| GO:0071451 | 0.0059 | 9.1851 | 0.3734 | 3 | 23 | cellular response to superoxide |
| GO:0043535 | 0.0065 | 5.8467 | 0.7468 | 4 | 46 | regulation of blood vessel endothelial cell migration |
| GO:0021904 | 0.0067 | 8.7472 | 0.3897 | 3 | 24 | dorsal/ventral neural tube patterning |
| GO:0051412 | 0.0075 | 8.349 | 0.4059 | 3 | 25 | response to corticosterone |
| GO:0014075 | 0.0087 | 5.3369 | 0.8118 | 4 | 50 | response to amine |
| GO:0042220 | 0.0087 | 5.3369 | 0.8118 | 4 | 50 | response to cocaine |
| GO:0018095 | 0.0088 | 17.441 | 0.1461 | 2 | 9 | protein polyglutamylation |
| GO:0060896 | 0.0088 | 17.441 | 0.1461 | 2 | 9 | neural plate pattern specification |
| GO:0071803 | 0.0088 | 17.441 | 0.1461 | 2 | 9 | positive regulation of podosome assembly |
| GO:2000121 | 0.0088 | 17.441 | 0.1461 | 2 | 9 | regulation of removal of superoxide radicals |
| GO:0000305 | 0.0093 | 7.6523 | 0.4384 | 3 | 27 | response to oxygen radical |
| GOMFID | Pvalue | OddsRatio | ExpCount | Count | Size | Term |
| GO:0032689 | 2e-04 | 11.3389 | 0.5211 | 5 | 33 | negative regulation of interferon-gamma production |
| GO:0019264 | 2e-04 | Inf | 0.0316 | 2 | 2 | glycine biosynthetic process from serine |
| GO:0032700 | 6e-04 | 23.648 | 0.1737 | 3 | 11 | negative regulation of interleukin-17 production |
| GO:0042488 | 7e-04 | 125.6667 | 0.0474 | 2 | 3 | positive regulation of odontogenesis of dentin-containing tooth |
| GO:0098543 | 0.0027 | 12.6065 | 0.2842 | 3 | 18 | detection of other organism |
| GO:0006578 | 0.0036 | 31.4106 | 0.0947 | 2 | 6 | amino-acid betaine biosynthetic process |
| GO:0006767 | 0.0037 | 4.3304 | 1.4843 | 6 | 94 | water-soluble vitamin metabolic process |
| GO:0097503 | 0.0042 | 10.5034 | 0.3316 | 3 | 21 | sialylation |
| GO:0009083 | 0.0048 | 9.9499 | 0.3474 | 3 | 22 | branched-chain amino acid catabolic process |
| GO:0045630 | 0.0049 | 25.1268 | 0.1105 | 2 | 7 | positive regulation of T-helper 2 cell differentiation |
| GO:0060406 | 0.0049 | 25.1268 | 0.1105 | 2 | 7 | positive regulation of penile erection |
| GO:2001256 | 0.0049 | 25.1268 | 0.1105 | 2 | 7 | regulation of store-operated calcium entry |
| GO:0006488 | 0.0059 | 4.6569 | 1.1527 | 5 | 73 | dolichol-linked oligosaccharide biosynthetic process |
| GO:0007028 | 0.0065 | 20.9377 | 0.1263 | 2 | 8 | cytoplasm organization |
| GO:0051568 | 0.0069 | 5.7429 | 0.7579 | 4 | 48 | histone H3-K4 methylation |
| GO:0009595 | 0.0077 | 8.2174 | 0.4105 | 3 | 26 | detection of biotic stimulus |
| GO:1901565 | 0.0081 | 2.3382 | 5.3844 | 12 | 341 | organonitrogen compound catabolic process |
| GO:0071453 | 0.0082 | 3.2245 | 2.2896 | 7 | 145 | cellular response to oxygen levels |
| GO:0051260 | 0.0083 | 2.5664 | 4.0896 | 10 | 259 | protein homooligomerization |
| GO:0060513 | 0.0083 | 17.9454 | 0.1421 | 2 | 9 | prostatic bud formation |
| GO:0032259 | 0.0091 | 2.3024 | 5.4634 | 12 | 346 | methylation |
| GO:1902106 | 0.0096 | 4.1101 | 1.2948 | 5 | 82 | negative regulation of leukocyte differentiation |
| GO:0060443 | 0.0097 | 5.1552 | 0.8369 | 4 | 53 | mammary gland morphogenesis |
| GO:0044711 | 0.0099 | 1.5595 | 26.7011 | 39 | 1691 | single-organism biosynthetic process |
| GOMFID | Pvalue | OddsRatio | ExpCount | Count | Size | Term |
| GO:0034470 | 0 | 3.6689 | 4.7582 | 16 | 314 | ncRNA processing |
| GO:0016072 | 1e-04 | 4.7003 | 2.3185 | 10 | 153 | rRNA metabolic process |
| GO:0000154 | 2e-04 | 17.6103 | 0.2879 | 4 | 19 | rRNA modification |
| GO:0042178 | 4e-04 | 28.1964 | 0.1515 | 3 | 10 | xenobiotic catabolic process |
| GO:0070886 | 4e-04 | 28.1964 | 0.1515 | 3 | 10 | positive regulation of calcineurin-NFAT signaling cascade |
| GO:0042254 | 6e-04 | 3.5208 | 3.3489 | 11 | 221 | ribosome biogenesis |
| GO:0052547 | 7e-04 | 2.799 | 5.728 | 15 | 378 | regulation of peptidase activity |
| GO:0070458 | 7e-04 | 131.0763 | 0.0455 | 2 | 3 | cellular detoxification of nitrogen compound |
| GO:0044282 | 7e-04 | 2.903 | 5.1522 | 14 | 340 | small molecule catabolic process |
| GO:0001510 | 8e-04 | 7.5224 | 0.7425 | 5 | 49 | RNA methylation |
| GO:0010827 | 9e-04 | 4.9562 | 1.5305 | 7 | 101 | regulation of glucose transport |
| GO:0032388 | 9e-04 | 2.832 | 5.2734 | 14 | 348 | positive regulation of intracellular transport |
| GO:1901687 | 0.0012 | 9.7759 | 0.4698 | 4 | 31 | glutathione derivative biosynthetic process |
| GO:0006749 | 0.0012 | 6.8938 | 0.8031 | 5 | 53 | glutathione metabolic process |
| GO:0018916 | 0.0013 | 65.5339 | 0.0606 | 2 | 4 | nitrobenzene metabolic process |
| GO:1901564 | 0.0014 | 1.6846 | 32.0041 | 49 | 2112 | organonitrogen compound metabolic process |
| GO:0031998 | 0.0017 | 15.1768 | 0.2425 | 3 | 16 | regulation of fatty acid beta-oxidation |
| GO:0046395 | 0.002 | 3.1714 | 3.3489 | 10 | 221 | carboxylic acid catabolic process |
| GO:0002730 | 0.0022 | 43.6864 | 0.0758 | 2 | 5 | regulation of dendritic cell cytokine production |
| GO:0070475 | 0.0022 | 43.6864 | 0.0758 | 2 | 5 | rRNA base methylation |
| GO:2001237 | 0.0023 | 4.7938 | 1.3487 | 6 | 89 | negative regulation of extrinsic apoptotic signaling pathway |
| GO:0042276 | 0.0028 | 12.3287 | 0.2879 | 3 | 19 | error-prone translesion synthesis |
| GO:0019395 | 0.0029 | 4.5722 | 1.4093 | 6 | 93 | fatty acid oxidation |
| GO:0046184 | 0.0033 | 32.7627 | 0.0909 | 2 | 6 | aldehyde biosynthetic process |
| GO:1904591 | 0.0038 | 4.3223 | 1.485 | 6 | 98 | positive regulation of protein import |
| GO:1900087 | 0.0043 | 10.3801 | 0.3334 | 3 | 22 | positive regulation of G1/S transition of mitotic cell cycle |
| GO:0034641 | 0.0047 | 1.4188 | 92.9361 | 113 | 6133 | cellular nitrogen compound metabolic process |
| GO:0032269 | 0.0052 | 1.819 | 15.1989 | 26 | 1003 | negative regulation of cellular protein metabolic process |
| GO:2001269 | 0.0055 | 9.3903 | 0.3637 | 3 | 24 | positive regulation of cysteine-type endopeptidase activity involved in apoptotic signaling pathway |
| GO:0010950 | 0.0057 | 3.4677 | 2.1366 | 7 | 141 | positive regulation of endopeptidase activity |
| GO:0051292 | 0.006 | 21.839 | 0.1212 | 2 | 8 | nuclear pore complex assembly |
| GO:0060426 | 0.006 | 21.839 | 0.1212 | 2 | 8 | lung vasculature development |
| GO:0042346 | 0.0062 | 8.9629 | 0.3788 | 3 | 25 | positive regulation of NF-kappaB import into nucleus |
| GO:0009266 | 0.0065 | 2.8418 | 3.3338 | 9 | 220 | response to temperature stimulus |
| GO:0008645 | 0.0069 | 3.3418 | 2.2124 | 7 | 146 | hexose transport |
| GO:0030258 | 0.0071 | 3.0221 | 2.7882 | 8 | 184 | lipid modification |
| GO:0043086 | 0.0072 | 1.8625 | 12.4864 | 22 | 824 | negative regulation of catalytic activity |
| GO:0098754 | 0.0073 | 4.4043 | 1.2123 | 5 | 80 | detoxification |
| GO:0010951 | 0.0077 | 2.7621 | 3.4247 | 9 | 226 | negative regulation of endopeptidase activity |
| GO:0060326 | 0.0081 | 2.7366 | 3.455 | 9 | 228 | cell chemotaxis |
| GO:0070125 | 0.009 | 4.1802 | 1.2729 | 5 | 84 | mitochondrial translational elongation |
| GO:0051272 | 0.0093 | 2.2105 | 6.1675 | 13 | 407 | positive regulation of cellular component movement |
| GO:0009062 | 0.0094 | 4.1277 | 1.288 | 5 | 85 | fatty acid catabolic process |
| GO:0048552 | 0.0095 | 16.3771 | 0.1515 | 2 | 10 | regulation of metalloenzyme activity |
| GO:0042180 | 0.0098 | 2.6506 | 3.5611 | 9 | 235 | cellular ketone metabolic process |
| GO:0051092 | 0.0099 | 3.4832 | 1.8184 | 6 | 120 | positive regulation of NF-kappaB transcription factor activity |
| GOMFID | Pvalue | OddsRatio | ExpCount | Count | Size | Term |
| GO:0051383 | 1e-04 | 22.8474 | 0.2442 | 4 | 14 | kinetochore organization |
| GO:0010970 | 0.0014 | 4.5197 | 1.6748 | 7 | 96 | establishment of localization by movement along microtubule |
| GO:0034508 | 0.0016 | 6.5005 | 0.8548 | 5 | 49 | centromere complex assembly |
| GO:0034626 | 0.0018 | 56.7279 | 0.0698 | 2 | 4 | fatty acid elongation, polyunsaturated fatty acid |
| GO:1903553 | 0.0018 | 56.7279 | 0.0698 | 2 | 4 | positive regulation of extracellular exosome assembly |
| GO:0051654 | 0.002 | 14.2251 | 0.2617 | 3 | 15 | establishment of mitochondrion localization |
| GO:0042559 | 0.0025 | 13.13 | 0.2791 | 3 | 16 | pteridine-containing compound biosynthetic process |
| GO:0071732 | 0.0025 | 13.13 | 0.2791 | 3 | 16 | cellular response to nitric oxide |
| GO:2001259 | 0.0028 | 7.6059 | 0.5931 | 4 | 34 | positive regulation of cation channel activity |
| GO:0010032 | 0.0029 | 37.8162 | 0.0872 | 2 | 5 | meiotic chromosome condensation |
| GO:0030705 | 0.004 | 3.7199 | 2.0062 | 7 | 115 | cytoskeleton-dependent intracellular transport |
| GO:0009445 | 0.0043 | 28.3603 | 0.1047 | 2 | 6 | putrescine metabolic process |
| GO:0046654 | 0.0043 | 28.3603 | 0.1047 | 2 | 6 | tetrahydrofolate biosynthetic process |
| GO:0014074 | 0.0063 | 3.0848 | 2.739 | 8 | 157 | response to purine-containing compound |
| GO:0010975 | 0.0064 | 2.2416 | 6.5595 | 14 | 376 | regulation of neuron projection development |
| GO:0090559 | 0.0066 | 4.5344 | 1.1863 | 5 | 68 | regulation of membrane permeability |
| GO:0009108 | 0.0075 | 3.29 | 2.2505 | 7 | 129 | coenzyme biosynthetic process |
| GO:0072332 | 0.008 | 4.3275 | 1.2386 | 5 | 71 | intrinsic apoptotic signaling pathway by p53 class mediator |
| GO:0008089 | 0.0091 | 7.7541 | 0.4361 | 3 | 25 | anterograde axonal transport |
| GO:0097345 | 0.0097 | 5.1811 | 0.8374 | 4 | 48 | mitochondrial outer membrane permeabilization |
| GO:0010564 | 0.01 | 1.9633 | 9.0717 | 17 | 520 | regulation of cell cycle process |
| GOMFID | Pvalue | OddsRatio | ExpCount | Count | Size | Term |
| GO:1903044 | 0 | 41.3574 | 0.1611 | 4 | 10 | protein localization to membrane raft |
| GO:0032594 | 2e-04 | 37.0752 | 0.1289 | 3 | 8 | protein transport within lipid bilayer |
| GO:0090087 | 4e-04 | 3.2806 | 4.2526 | 13 | 264 | regulation of peptide transport |
| GO:0001960 | 4e-04 | 9.1431 | 0.6282 | 5 | 39 | negative regulation of cytokine-mediated signaling pathway |
| GO:0001765 | 5e-04 | 26.4789 | 0.1611 | 3 | 10 | membrane raft assembly |
| GO:0042886 | 5e-04 | 2.8794 | 5.5735 | 15 | 346 | amide transport |
| GO:0021762 | 5e-04 | 8.4002 | 0.6766 | 5 | 42 | substantia nigra development |
| GO:0044861 | 8e-04 | 123.1235 | 0.0483 | 2 | 3 | protein transport into plasma membrane raft |
| GO:0060800 | 8e-04 | 123.1235 | 0.0483 | 2 | 3 | regulation of cell differentiation involved in embryonic placenta development |
| GO:0098909 | 8e-04 | 123.1235 | 0.0483 | 2 | 3 | regulation of cardiac muscle cell action potential involved in regulation of contraction |
| GO:0034330 | 8e-04 | 3.1696 | 4.0432 | 12 | 251 | cell junction organization |
| GO:0044091 | 0.0011 | 9.9136 | 0.4671 | 4 | 29 | membrane biogenesis |
| GO:0001933 | 0.0012 | 2.62 | 6.089 | 15 | 378 | negative regulation of protein phosphorylation |
| GO:0060547 | 0.0013 | 16.8458 | 0.2255 | 3 | 14 | negative regulation of necrotic cell death |
| GO:0070836 | 0.0015 | 61.5578 | 0.0644 | 2 | 4 | caveola assembly |
| GO:0019538 | 0.0018 | 1.4689 | 86.406 | 109 | 5364 | protein metabolic process |
| GO:1902043 | 0.002 | 14.2523 | 0.2577 | 3 | 16 | positive regulation of extrinsic apoptotic signaling pathway via death domain receptors |
| GO:0044857 | 0.0025 | 41.0359 | 0.0805 | 2 | 5 | plasma membrane raft organization |
| GO:0016575 | 0.0026 | 5.7493 | 0.9504 | 5 | 59 | histone deacetylation |
| GO:0090276 | 0.0027 | 3.0459 | 3.4794 | 10 | 216 | regulation of peptide hormone secretion |
| GO:2001238 | 0.0027 | 7.5915 | 0.5895 | 4 | 37 | positive regulation of extrinsic apoptotic signaling pathway |
| GO:0009892 | 0.0033 | 1.5425 | 41.9465 | 59 | 2604 | negative regulation of metabolic process |
| GO:0061024 | 0.0033 | 1.8224 | 16.9784 | 29 | 1054 | membrane organization |
| GO:0050821 | 0.0036 | 3.7952 | 1.9652 | 7 | 122 | protein stabilization |
| GO:0010727 | 0.0037 | 30.7749 | 0.0967 | 2 | 6 | negative regulation of hydrogen peroxide metabolic process |
| GO:0043067 | 0.0039 | 1.6972 | 22.7452 | 36 | 1412 | regulation of programmed cell death |
| GO:1901888 | 0.0039 | 5.1724 | 1.0471 | 5 | 65 | regulation of cell junction assembly |
| GO:0002790 | 0.0041 | 2.6983 | 4.301 | 11 | 267 | peptide secretion |
| GO:0007043 | 0.0043 | 4.1934 | 1.5303 | 6 | 95 | cell-cell junction assembly |
| GO:0010882 | 0.0044 | 10.29 | 0.3383 | 3 | 21 | regulation of cardiac muscle contraction by calcium ion signaling |
| GO:0006782 | 0.0051 | 24.6183 | 0.1128 | 2 | 7 | protoporphyrinogen IX biosynthetic process |
| GO:0014816 | 0.0051 | 24.6183 | 0.1128 | 2 | 7 | skeletal muscle satellite cell differentiation |
| GO:0010769 | 0.0052 | 2.4896 | 5.0742 | 12 | 315 | regulation of cell morphogenesis involved in differentiation |
| GO:0043412 | 0.0052 | 1.4401 | 62.6459 | 81 | 3889 | macromolecule modification |
| GO:0051591 | 0.0056 | 3.9691 | 1.6108 | 6 | 100 | response to cAMP |
| GO:0051051 | 0.0058 | 2.2019 | 7.1683 | 15 | 445 | negative regulation of transport |
| GO:2001233 | 0.0067 | 2.3103 | 5.9118 | 13 | 367 | regulation of apoptotic signaling pathway |
| GO:0034063 | 0.0068 | 20.5139 | 0.1289 | 2 | 8 | stress granule assembly |
| GO:0006464 | 0.0068 | 1.435 | 57.8154 | 75 | 3644 | cellular protein modification process |
| GO:0032879 | 0.007 | 1.5102 | 37.2428 | 52 | 2312 | regulation of localization |
| GO:0035601 | 0.0072 | 4.4306 | 1.2081 | 5 | 75 | protein deacylation |
| GO:0032620 | 0.0073 | 8.4169 | 0.4027 | 3 | 25 | interleukin-17 production |
| GO:0042346 | 0.0073 | 8.4169 | 0.4027 | 3 | 25 | positive regulation of NF-kappaB import into nucleus |
| GO:0044092 | 0.0074 | 1.7264 | 17.1878 | 28 | 1067 | negative regulation of molecular function |
| GO:0006338 | 0.0076 | 3.2777 | 2.2552 | 7 | 140 | chromatin remodeling |
| GO:0023057 | 0.0076 | 1.6906 | 18.8308 | 30 | 1169 | negative regulation of signaling |
| GO:0071840 | 0.0078 | 1.3736 | 95.8455 | 115 | 5950 | cellular component organization or biogenesis |
| GO:0051641 | 0.008 | 1.4573 | 46.3441 | 62 | 2877 | cellular localization |
| GO:0010644 | 0.0082 | 8.0504 | 0.4188 | 3 | 26 | cell communication by electrical coupling |
| GO:0060759 | 0.0082 | 3.2287 | 2.2874 | 7 | 142 | regulation of response to cytokine stimulus |
| GO:0003158 | 0.0084 | 3.6201 | 1.7558 | 6 | 109 | endothelium development |
| GO:0033555 | 0.0085 | 4.2477 | 1.2565 | 5 | 78 | multicellular organismal response to stress |
| GO:1901844 | 0.0086 | 17.5822 | 0.145 | 2 | 9 | regulation of cell communication by electrical coupling involved in cardiac conduction |
| GO:0010648 | 0.0087 | 1.6716 | 19.0241 | 30 | 1181 | negative regulation of cell communication |
| GO:0033014 | 0.0091 | 7.7145 | 0.4349 | 3 | 27 | tetrapyrrole biosynthetic process |
| GO:0006325 | 0.0093 | 1.8706 | 11.2437 | 20 | 698 | chromatin organization |
| GO:0031327 | 0.0097 | 1.5978 | 23.2929 | 35 | 1446 | negative regulation of cellular biosynthetic process |
| GO:0050810 | 0.0097 | 5.1556 | 0.8376 | 4 | 52 | regulation of steroid biosynthetic process |
| GOMFID | Pvalue | OddsRatio | ExpCount | Count | Size | Term |
| GO:0044205 | 0.0011 | 101.9934 | 0.0581 | 2 | 3 | 'de novo' UMP biosynthetic process |
| GO:0035696 | 0.0022 | 50.9934 | 0.0774 | 2 | 4 | monocyte extravasation |
| GO:0014911 | 0.0025 | 7.8851 | 0.5807 | 4 | 30 | positive regulation of smooth muscle cell migration |
| GO:0034637 | 0.0033 | 4.4742 | 1.4517 | 6 | 75 | cellular carbohydrate biosynthetic process |
| GO:0015677 | 0.0036 | 33.9934 | 0.0968 | 2 | 5 | copper ion import |
| GO:0072126 | 0.0036 | 33.9934 | 0.0968 | 2 | 5 | positive regulation of glomerular mesangial cell proliferation |
| GO:0006399 | 0.004 | 2.8764 | 3.6776 | 10 | 190 | tRNA metabolic process |
| GO:0006207 | 0.0053 | 25.4934 | 0.1161 | 2 | 6 | 'de novo' pyrimidine nucleobase biosynthetic process |
| GO:0006685 | 0.0074 | 20.3934 | 0.1355 | 2 | 7 | sphingomyelin catabolic process |
| GO:0090336 | 0.0074 | 20.3934 | 0.1355 | 2 | 7 | positive regulation of brown fat cell differentiation |
| GO:2000643 | 0.0074 | 20.3934 | 0.1355 | 2 | 7 | positive regulation of early endosome to late endosome transport |
| GO:0034470 | 0.0084 | 2.2412 | 6.0777 | 13 | 314 | ncRNA processing |
| GO:0006400 | 0.0084 | 4.2759 | 1.2581 | 5 | 65 | tRNA modification |
| GO:0014812 | 0.009 | 4.2055 | 1.2775 | 5 | 66 | muscle cell migration |
| GO:0007049 | 0.0092 | 1.5018 | 33.2724 | 47 | 1719 | cell cycle |
| GO:1901566 | 0.0094 | 1.5654 | 25.6656 | 38 | 1326 | organonitrogen compound biosynthetic process |
| GO:0036065 | 0.0095 | 7.6654 | 0.4452 | 3 | 23 | fucosylation |
| GO:0009112 | 0.0095 | 4.1374 | 1.2968 | 5 | 67 | nucleobase metabolic process |
| GO:0002098 | 0.0097 | 16.9934 | 0.1548 | 2 | 8 | tRNA wobble uridine modification |
| GO:0006971 | 0.0097 | 16.9934 | 0.1548 | 2 | 8 | hypotonic response |
| GOMFID | Pvalue | OddsRatio | ExpCount | Count | Size | Term |
| GO:0060491 | 8e-04 | 3.9815 | 2.4394 | 9 | 129 | regulation of cell projection assembly |
| GO:0006767 | 0.002 | 4.2511 | 1.7775 | 7 | 94 | water-soluble vitamin metabolic process |
| GO:0016339 | 0.002 | 8.4008 | 0.5484 | 4 | 29 | calcium-dependent cell-cell adhesion via plasma membrane cell adhesion molecules |
| GO:0006041 | 0.0021 | 52.2271 | 0.0756 | 2 | 4 | glucosamine metabolic process |
| GO:0061157 | 0.0021 | 14.2839 | 0.2647 | 3 | 14 | mRNA destabilization |
| GO:0090201 | 0.0031 | 12.0848 | 0.3026 | 3 | 16 | negative regulation of release of cytochrome c from mitochondria |
| GO:0031345 | 0.0042 | 3.331 | 2.5528 | 8 | 135 | negative regulation of cell projection organization |
| GO:0071599 | 0.0044 | 10.4721 | 0.3404 | 3 | 18 | otic vesicle development |
| GO:0021764 | 0.0051 | 26.1102 | 0.1135 | 2 | 6 | amygdala development |
| GO:0014002 | 0.0052 | 9.817 | 0.3593 | 3 | 19 | astrocyte development |
| GO:0051223 | 0.006 | 1.8336 | 13.7854 | 24 | 729 | regulation of protein transport |
| GO:0030199 | 0.0067 | 5.8297 | 0.7564 | 4 | 40 | collagen fibril organization |
| GO:0032438 | 0.0069 | 8.7251 | 0.3971 | 3 | 21 | melanosome organization |
| GO:0006561 | 0.007 | 20.8868 | 0.1324 | 2 | 7 | proline biosynthetic process |
| GO:0098597 | 0.007 | 20.8868 | 0.1324 | 2 | 7 | observational learning |
| GO:0034644 | 0.0087 | 4.2386 | 1.267 | 5 | 67 | cellular response to UV |
| GO:0031223 | 0.0093 | 17.4045 | 0.1513 | 2 | 8 | auditory behavior |
| GO:0072578 | 0.0093 | 17.4045 | 0.1513 | 2 | 8 | neurotransmitter-gated ion channel clustering |
| GO:0071478 | 0.0097 | 2.8544 | 2.95 | 8 | 156 | cellular response to radiation |
| GO:0050796 | 0.0099 | 2.6439 | 3.574 | 9 | 189 | regulation of insulin secretion |
| GO:0051048 | 0.0099 | 2.6439 | 3.574 | 9 | 189 | negative regulation of secretion |
| GOMFID | Pvalue | OddsRatio | ExpCount | Count | Size | Term |
| GO:0018003 | 2e-04 | Inf | 0.0299 | 2 | 2 | peptidyl-lysine N6-acetylation |
| GO:0071926 | 7e-04 | 132.7897 | 0.0449 | 2 | 3 | endocannabinoid signaling pathway |
| GO:0032417 | 0.0013 | 66.3906 | 0.0598 | 2 | 4 | positive regulation of sodium:proton antiporter activity |
| GO:0001833 | 0.0013 | 16.6584 | 0.2244 | 3 | 15 | inner cell mass cell proliferation |
| GO:0061024 | 0.0022 | 1.9044 | 15.7704 | 28 | 1054 | membrane organization |
| GO:0009268 | 0.0029 | 7.4242 | 0.5985 | 4 | 40 | response to pH |
| GO:0006797 | 0.0032 | 33.191 | 0.0898 | 2 | 6 | polyphosphate metabolic process |
| GO:0099515 | 0.0032 | 33.191 | 0.0898 | 2 | 6 | actin filament-based transport |
| GO:1901897 | 0.0032 | 33.191 | 0.0898 | 2 | 6 | regulation of relaxation of cardiac muscle |
| GO:0008286 | 0.0036 | 2.6145 | 4.8478 | 12 | 324 | insulin receptor signaling pathway |
| GO:0044248 | 0.0041 | 1.6723 | 24.5085 | 38 | 1638 | cellular catabolic process |
| GO:0009083 | 0.0041 | 10.5163 | 0.3292 | 3 | 22 | branched-chain amino acid catabolic process |
| GO:0032596 | 0.0045 | 26.5511 | 0.1047 | 2 | 7 | protein transport into membrane raft |
| GO:0060159 | 0.0045 | 26.5511 | 0.1047 | 2 | 7 | regulation of dopamine receptor signaling pathway |
| GO:0002092 | 0.0047 | 9.9899 | 0.3441 | 3 | 23 | positive regulation of receptor internalization |
| GO:0045745 | 0.0047 | 9.9899 | 0.3441 | 3 | 23 | positive regulation of G-protein coupled receptor protein signaling pathway |
| GO:0001824 | 0.005 | 4.8526 | 1.1072 | 5 | 74 | blastocyst development |
| GO:0044712 | 0.0053 | 1.7975 | 15.9948 | 27 | 1069 | single-organism catabolic process |
| GO:0010256 | 0.0056 | 2.7294 | 3.8607 | 10 | 265 | endomembrane system organization |
| GO:0043112 | 0.0062 | 3.4112 | 2.1696 | 7 | 145 | receptor metabolic process |
| GO:0007009 | 0.0062 | 2.6841 | 3.9202 | 10 | 262 | plasma membrane organization |
| GO:0006906 | 0.0063 | 4.5855 | 1.1671 | 5 | 78 | vesicle fusion |
| GO:0006099 | 0.0074 | 8.3227 | 0.404 | 3 | 27 | tricarboxylic acid cycle |
| GO:0033004 | 0.0075 | 18.9626 | 0.1347 | 2 | 9 | negative regulation of mast cell activation |
| GO:0071468 | 0.0075 | 18.9626 | 0.1347 | 2 | 9 | cellular response to acidic pH |
| GO:0050994 | 0.0075 | 5.5639 | 0.778 | 4 | 52 | regulation of lipid catabolic process |
| GO:0006897 | 0.0076 | 2.0275 | 8.8278 | 17 | 590 | endocytosis |
| GO:0006383 | 0.0081 | 5.45 | 0.793 | 4 | 53 | transcription from RNA polymerase III promoter |
| GO:0015980 | 0.0087 | 2.318 | 5.4314 | 12 | 363 | energy derivation by oxidation of organic compounds |
| GO:0001765 | 0.0093 | 16.5912 | 0.1496 | 2 | 10 | membrane raft assembly |
| GO:0014842 | 0.0093 | 16.5912 | 0.1496 | 2 | 10 | regulation of skeletal muscle satellite cell proliferation |
| GO:0006082 | 0.0099 | 1.6861 | 17.6108 | 28 | 1177 | organic acid metabolic process |
| GOMFID | Pvalue | OddsRatio | ExpCount | Count | Size | Term |
| GO:0034144 | 2e-04 | 38.9748 | 0.1228 | 3 | 8 | negative regulation of toll-like receptor 4 signaling pathway |
| GO:0032816 | 0.0034 | 11.4543 | 0.3069 | 3 | 20 | positive regulation of natural killer cell activation |
| GO:0055064 | 0.0034 | 32.3452 | 0.0921 | 2 | 6 | chloride ion homeostasis |
| GO:0045010 | 0.0042 | 6.6758 | 0.6598 | 4 | 43 | actin nucleation |
| GO:0008152 | 0.0064 | 1.4804 | 171.5203 | 189 | 11178 | metabolic process |
| GO:0044260 | 0.0067 | 1.3946 | 122.4948 | 142 | 7983 | cellular macromolecule metabolic process |
| GO:0051095 | 0.0079 | 18.4794 | 0.1381 | 2 | 9 | regulation of helicase activity |
| GO:0070229 | 0.008 | 8.1098 | 0.4143 | 3 | 27 | negative regulation of lymphocyte apoptotic process |
| GO:0006396 | 0.008 | 1.8702 | 11.8459 | 21 | 772 | RNA processing |
| GO:0043043 | 0.0088 | 1.9523 | 9.6977 | 18 | 632 | peptide biosynthetic process |
| GO:0016259 | 0.0094 | 4.1263 | 1.2889 | 5 | 84 | selenocysteine metabolic process |
| GOMFID | Pvalue | OddsRatio | ExpCount | Count | Size | Term |
| GO:0002200 | 3e-04 | 7.2172 | 0.9327 | 6 | 57 | somatic diversification of immune receptors |
| GO:0016447 | 5e-04 | 8.4948 | 0.6709 | 5 | 41 | somatic recombination of immunoglobulin gene segments |
| GO:1990166 | 8e-04 | 121.1608 | 0.0491 | 2 | 3 | protein localization to site of double-strand break |
| GO:0016444 | 0.0014 | 6.6438 | 0.8345 | 5 | 51 | somatic cell DNA recombination |
| GO:0045354 | 0.0016 | 60.5765 | 0.0655 | 2 | 4 | regulation of interferon-alpha biosynthetic process |
| GO:0051142 | 0.0016 | 60.5765 | 0.0655 | 2 | 4 | positive regulation of NK T cell proliferation |
| GO:0006974 | 0.0018 | 2.0387 | 12.5506 | 24 | 767 | cellular response to DNA damage stimulus |
| GO:0002377 | 0.0022 | 4.8353 | 1.3418 | 6 | 82 | immunoglobulin production |
| GO:0006398 | 0.0026 | 40.3817 | 0.0818 | 2 | 5 | mRNA 3'-end processing by stem-loop binding and cleavage |
| GO:0032607 | 0.0029 | 12.1528 | 0.2945 | 3 | 18 | interferon-alpha production |
| GO:0032943 | 0.0032 | 2.7981 | 4.1562 | 11 | 254 | mononuclear cell proliferation |
| GO:0006302 | 0.0037 | 2.9098 | 3.6326 | 10 | 222 | double-strand break repair |
| GO:0008088 | 0.0037 | 6.9628 | 0.6382 | 4 | 39 | axo-dendritic transport |
| GO:0032661 | 0.0038 | 30.2843 | 0.0982 | 2 | 6 | regulation of interleukin-18 production |
| GO:2000503 | 0.0038 | 30.2843 | 0.0982 | 2 | 6 | positive regulation of natural killer cell chemotaxis |
| GO:0000723 | 0.0049 | 3.5768 | 2.0781 | 7 | 127 | telomere maintenance |
| GO:0090205 | 0.0053 | 24.2259 | 0.1145 | 2 | 7 | positive regulation of cholesterol metabolic process |
| GO:0046640 | 0.0068 | 8.6772 | 0.3927 | 3 | 24 | regulation of alpha-beta T cell proliferation |
| GO:0006273 | 0.007 | 20.1869 | 0.1309 | 2 | 8 | lagging strand elongation |
| GO:0042098 | 0.0072 | 3.013 | 2.7981 | 8 | 171 | T cell proliferation |
| GO:0009791 | 0.0076 | 3.7064 | 1.7181 | 6 | 105 | post-embryonic development |
| GO:0006284 | 0.0078 | 5.5354 | 0.7854 | 4 | 48 | base-excision repair |
| GO:0090501 | 0.0083 | 3.6325 | 1.7509 | 6 | 107 | RNA phosphodiester bond hydrolysis |
| GO:0032733 | 0.0085 | 7.9216 | 0.4254 | 3 | 26 | positive regulation of interleukin-10 production |
| GO:0048291 | 0.0089 | 17.302 | 0.1473 | 2 | 9 | isotype switching to IgG isotypes |
| GO:0051103 | 0.0089 | 17.302 | 0.1473 | 2 | 9 | DNA ligation involved in DNA repair |
| GO:0007052 | 0.009 | 4.1792 | 1.2763 | 5 | 78 | mitotic spindle organization |
| GO:1901360 | 0.0094 | 1.3611 | 93.3519 | 112 | 5705 | organic cyclic compound metabolic process |
| GO:0042104 | 0.0095 | 7.591 | 0.4418 | 3 | 27 | positive regulation of activated T cell proliferation |
| GOMFID | Pvalue | OddsRatio | ExpCount | Count | Size | Term |
| GO:0019372 | 0.001 | 18.6072 | 0.2086 | 3 | 13 | lipoxygenase pathway |
| GO:1901029 | 0.0025 | 41.2027 | 0.0802 | 2 | 5 | negative regulation of mitochondrial outer membrane permeabilization involved in apoptotic signaling pathway |
| GO:0019369 | 0.0031 | 5.4681 | 0.9948 | 5 | 62 | arachidonic acid metabolic process |
| GO:0003283 | 0.0033 | 11.625 | 0.3049 | 3 | 19 | atrial septum development |
| GO:0001554 | 0.0051 | 24.7184 | 0.1123 | 2 | 7 | luteolysis |
| GO:2001300 | 0.0051 | 24.7184 | 0.1123 | 2 | 7 | lipoxin metabolic process |
| GO:0071447 | 0.0067 | 20.5973 | 0.1284 | 2 | 8 | cellular response to hydroperoxide |
| GO:0043039 | 0.0078 | 5.5229 | 0.7862 | 4 | 49 | tRNA aminoacylation |
| GO:1902110 | 0.0078 | 5.5229 | 0.7862 | 4 | 49 | positive regulation of mitochondrial membrane permeability involved in apoptotic process |
| GO:0006563 | 0.0086 | 17.6537 | 0.1444 | 2 | 9 | L-serine metabolic process |
| GO:0006621 | 0.0086 | 17.6537 | 0.1444 | 2 | 9 | protein retention in ER lumen |
| GO:0033327 | 0.0086 | 17.6537 | 0.1444 | 2 | 9 | Leydig cell differentiation |
| GO:0035794 | 0.009 | 5.2872 | 0.8183 | 4 | 51 | positive regulation of mitochondrial membrane permeability |
| GOMFID | Pvalue | OddsRatio | ExpCount | Count | Size | Term |
| GO:0051482 | 0 | 36.3868 | 0.2235 | 5 | 13 | positive regulation of cytosolic calcium ion concentration involved in phospholipase C-activating G-protein coupled signaling pathway |
| GO:0032456 | 1e-04 | 11.6309 | 0.5157 | 5 | 30 | endocytic recycling |
| GO:0042098 | 2e-04 | 4.0549 | 2.9396 | 11 | 171 | T cell proliferation |
| GO:0033512 | 9e-04 | 115.1866 | 0.0516 | 2 | 3 | L-lysine catabolic process to acetyl-CoA via saccharopine |
| GO:2000001 | 0.0013 | 17.3326 | 0.2235 | 3 | 13 | regulation of DNA damage checkpoint |
| GO:0019477 | 0.0017 | 57.5896 | 0.0688 | 2 | 4 | L-lysine catabolic process |
| GO:0006646 | 0.002 | 14.4419 | 0.2579 | 3 | 15 | phosphatidylethanolamine biosynthetic process |
| GO:0042559 | 0.0024 | 13.3302 | 0.2751 | 3 | 16 | pteridine-containing compound biosynthetic process |
| GO:0001990 | 0.0033 | 7.2387 | 0.6189 | 4 | 36 | regulation of systemic arterial blood pressure by hormone |
| GO:0051726 | 0.0038 | 1.8025 | 17.1049 | 29 | 995 | regulation of cell cycle |
| GO:0032943 | 0.0046 | 2.6554 | 4.3665 | 11 | 254 | mononuclear cell proliferation |
| GO:0030815 | 0.0048 | 6.4327 | 0.6876 | 4 | 40 | negative regulation of cAMP metabolic process |
| GO:0021578 | 0.0058 | 23.0313 | 0.1203 | 2 | 7 | hindbrain maturation |
| GO:0048050 | 0.0058 | 23.0313 | 0.1203 | 2 | 7 | post-embryonic eye morphogenesis |
| GO:0030885 | 0.0077 | 19.1915 | 0.1375 | 2 | 8 | regulation of myeloid dendritic cell activation |
| GO:0061101 | 0.0077 | 19.1915 | 0.1375 | 2 | 8 | neuroendocrine cell differentiation |
| GO:0046640 | 0.0078 | 8.2477 | 0.4126 | 3 | 24 | regulation of alpha-beta T cell proliferation |
| GO:0051783 | 0.0089 | 2.897 | 2.9053 | 8 | 169 | regulation of nuclear division |
| GO:1902582 | 0.0094 | 1.5461 | 28.2446 | 41 | 1643 | single-organism intracellular transport |
| GO:0042481 | 0.0098 | 7.5296 | 0.447 | 3 | 26 | regulation of odontogenesis |
| GO:0010960 | 0.0098 | 16.4488 | 0.1547 | 2 | 9 | magnesium ion homeostasis |
| GOMFID | Pvalue | OddsRatio | ExpCount | Count | Size | Term |
| GO:0016311 | 0 | 3.0128 | 7.204 | 20 | 407 | dephosphorylation |
| GO:0051031 | 0.0018 | 55.8913 | 0.0708 | 2 | 4 | tRNA transport |
| GO:0061732 | 0.0018 | 55.8913 | 0.0708 | 2 | 4 | mitochondrial acetyl-CoA biosynthetic process from pyruvate |
| GO:0009395 | 0.0029 | 7.4929 | 0.6018 | 4 | 34 | phospholipid catabolic process |
| GO:0043456 | 0.003 | 37.2585 | 0.0885 | 2 | 5 | regulation of pentose-phosphate shunt |
| GO:0007064 | 0.0031 | 12.0109 | 0.3009 | 3 | 17 | mitotic sister chromatid cohesion |
| GO:0034182 | 0.0045 | 27.942 | 0.1062 | 2 | 6 | regulation of maintenance of mitotic sister chromatid cohesion |
| GO:2000378 | 0.0049 | 6.4204 | 0.6903 | 4 | 39 | negative regulation of reactive oxygen species metabolic process |
| GO:0034641 | 0.005 | 1.3791 | 108.5556 | 130 | 6133 | cellular nitrogen compound metabolic process |
| GO:0046697 | 0.0058 | 9.3394 | 0.3717 | 3 | 21 | decidualization |
| GO:0001554 | 0.0062 | 22.3522 | 0.1239 | 2 | 7 | luteolysis |
| GO:0001558 | 0.0067 | 2.2323 | 6.5845 | 14 | 372 | regulation of cell growth |
| GO:0046483 | 0.0069 | 1.3662 | 96.8911 | 117 | 5474 | heterocycle metabolic process |
| GO:0006090 | 0.0075 | 3.7178 | 1.7169 | 6 | 97 | pyruvate metabolic process |
| GO:0008152 | 0.0081 | 1.4194 | 197.8533 | 216 | 11178 | metabolic process |
| GO:0000733 | 0.0081 | 18.6256 | 0.1416 | 2 | 8 | DNA strand renaturation |
| GO:0003321 | 0.0081 | 18.6256 | 0.1416 | 2 | 8 | positive regulation of blood pressure by epinephrine-norepinephrine |
| GO:0021891 | 0.0081 | 18.6256 | 0.1416 | 2 | 8 | olfactory bulb interneuron development |
| GO:0090304 | 0.0082 | 1.3667 | 84.023 | 103 | 4747 | nucleic acid metabolic process |
| GO:0046487 | 0.0095 | 7.6393 | 0.4425 | 3 | 25 | glyoxylate metabolic process |
| GO:0006974 | 0.0097 | 1.7802 | 13.5761 | 23 | 767 | cellular response to DNA damage stimulus |
| GOMFID | Pvalue | OddsRatio | ExpCount | Count | Size | Term |
| GO:0007156 | 2e-04 | 4.3418 | 2.4997 | 10 | 151 | homophilic cell adhesion via plasma membrane adhesion molecules |
| GO:0097055 | 3e-04 | Inf | 0.0331 | 2 | 2 | agmatine biosynthetic process |
| GO:1990035 | 0.0016 | 59.8605 | 0.0662 | 2 | 4 | calcium ion import into cell |
| GO:0000245 | 0.0018 | 6.29 | 0.8774 | 5 | 53 | spliceosomal complex assembly |
| GO:0009446 | 0.0026 | 39.9044 | 0.0828 | 2 | 5 | putrescine biosynthetic process |
| GO:0051964 | 0.0039 | 29.9264 | 0.0993 | 2 | 6 | negative regulation of synapse assembly |
| GO:0090166 | 0.0039 | 29.9264 | 0.0993 | 2 | 6 | Golgi disassembly |
| GO:0015695 | 0.0042 | 10.5944 | 0.3311 | 3 | 20 | organic cation transport |
| GO:0043496 | 0.0042 | 10.5944 | 0.3311 | 3 | 20 | regulation of protein homodimerization activity |
| GO:0032107 | 0.0044 | 3.6565 | 2.0362 | 7 | 123 | regulation of response to nutrient levels |
| GO:1903146 | 0.005 | 6.3355 | 0.6953 | 4 | 42 | regulation of mitophagy |
| GO:0021902 | 0.0054 | 23.9395 | 0.1159 | 2 | 7 | commitment of neuronal cell to specific neuron type in forebrain |
| GO:0035511 | 0.0054 | 23.9395 | 0.1159 | 2 | 7 | oxidative DNA demethylation |
| GO:0035510 | 0.0055 | 9.478 | 0.3642 | 3 | 22 | DNA dealkylation |
| GO:0008053 | 0.0062 | 9.0035 | 0.3807 | 3 | 23 | mitochondrial fusion |
| GO:0015949 | 0.0062 | 9.0035 | 0.3807 | 3 | 23 | nucleobase-containing small molecule interconversion |
| GO:0006987 | 0.0072 | 19.9483 | 0.1324 | 2 | 8 | activation of signaling protein activity involved in unfolded protein response |
| GO:1903896 | 0.0072 | 19.9483 | 0.1324 | 2 | 8 | positive regulation of IRE1-mediated unfolded protein response |
| GO:0031398 | 0.0077 | 2.9765 | 2.8308 | 8 | 171 | positive regulation of protein ubiquitination |
| GO:0030163 | 0.0089 | 1.8215 | 12.7136 | 22 | 768 | protein catabolic process |
| GO:0000160 | 0.0091 | 17.0975 | 0.149 | 2 | 9 | phosphorelay signal transduction system |
| GO:0035791 | 0.0091 | 17.0975 | 0.149 | 2 | 9 | platelet-derived growth factor receptor-beta signaling pathway |
| GO:0070344 | 0.0091 | 17.0975 | 0.149 | 2 | 9 | regulation of fat cell proliferation |
| GO:1901077 | 0.0091 | 17.0975 | 0.149 | 2 | 9 | regulation of relaxation of muscle |
| GO:0050808 | 0.0097 | 2.6527 | 3.5591 | 9 | 215 | synapse organization |
| GOMFID | Pvalue | OddsRatio | ExpCount | Count | Size | Term |
| GO:0032402 | 3e-04 | 14.8909 | 0.3349 | 4 | 20 | melanosome transport |
| GO:0051905 | 4e-04 | 14.0141 | 0.3516 | 4 | 21 | establishment of pigment granule localization |
| GO:0061511 | 8e-04 | 118.3295 | 0.0502 | 2 | 3 | centriole elongation |
| GO:2000001 | 0.0012 | 17.8073 | 0.2177 | 3 | 13 | regulation of DNA damage checkpoint |
| GO:0006888 | 0.0016 | 3.541 | 2.7127 | 9 | 162 | ER to Golgi vesicle-mediated transport |
| GO:1901687 | 0.0017 | 8.818 | 0.5191 | 4 | 31 | glutathione derivative biosynthetic process |
| GO:0022408 | 0.0022 | 3.7243 | 2.2941 | 8 | 137 | negative regulation of cell-cell adhesion |
| GO:0002695 | 0.0025 | 3.639 | 2.3443 | 8 | 140 | negative regulation of leukocyte activation |
| GO:0044342 | 0.0027 | 12.7162 | 0.2847 | 3 | 17 | type B pancreatic cell proliferation |
| GO:0060126 | 0.0027 | 39.4381 | 0.0837 | 2 | 5 | somatotropin secreting cell differentiation |
| GO:1902035 | 0.0027 | 39.4381 | 0.0837 | 2 | 5 | positive regulation of hematopoietic stem cell proliferation |
| GO:0048009 | 0.0033 | 7.2119 | 0.6196 | 4 | 37 | insulin-like growth factor receptor signaling pathway |
| GO:0050868 | 0.0034 | 4.4277 | 1.4568 | 6 | 87 | negative regulation of T cell activation |
| GO:0000079 | 0.0036 | 4.3734 | 1.4736 | 6 | 88 | regulation of cyclin-dependent protein serine/threonine kinase activity |
| GO:0046854 | 0.0036 | 6.9993 | 0.6363 | 4 | 38 | phosphatidylinositol phosphorylation |
| GO:0071539 | 0.0037 | 11.1252 | 0.3182 | 3 | 19 | protein localization to centrosome |
| GO:0051656 | 0.004 | 2.4654 | 5.5594 | 13 | 332 | establishment of organelle localization |
| GO:0043087 | 0.0045 | 2.0959 | 9.0591 | 18 | 541 | regulation of GTPase activity |
| GO:0019919 | 0.0055 | 23.6598 | 0.1172 | 2 | 7 | peptidyl-arginine methylation, to asymmetrical-dimethyl arginine |
| GO:0007018 | 0.0067 | 2.8295 | 3.349 | 9 | 200 | microtubule-based movement |
| GO:0033059 | 0.0072 | 5.6632 | 0.7703 | 4 | 46 | cellular pigmentation |
| GO:2000209 | 0.0072 | 8.4736 | 0.4019 | 3 | 24 | regulation of anoikis |
| GO:0000054 | 0.0073 | 19.7152 | 0.134 | 2 | 8 | ribosomal subunit export from nucleus |
| GO:0002692 | 0.0073 | 19.7152 | 0.134 | 2 | 8 | negative regulation of cellular extravasation |
| GO:0033080 | 0.0073 | 19.7152 | 0.134 | 2 | 8 | immature T cell proliferation in thymus |
| GO:0033750 | 0.0073 | 19.7152 | 0.134 | 2 | 8 | ribosome localization |
| GO:0046007 | 0.0073 | 19.7152 | 0.134 | 2 | 8 | negative regulation of activated T cell proliferation |
| GO:0051013 | 0.0073 | 19.7152 | 0.134 | 2 | 8 | microtubule severing |
| GO:0042098 | 0.0082 | 2.9409 | 2.8634 | 8 | 171 | T cell proliferation |
| GO:0044237 | 0.0085 | 1.3824 | 162.0432 | 181 | 9677 | cellular metabolic process |
| GO:0035058 | 0.0091 | 7.7358 | 0.4354 | 3 | 26 | nonmotile primary cilium assembly |
| GO:0018095 | 0.0093 | 16.8976 | 0.1507 | 2 | 9 | protein polyglutamylation |
| GO:0033085 | 0.0093 | 16.8976 | 0.1507 | 2 | 9 | negative regulation of T cell differentiation in thymus |
| GO:0035246 | 0.0093 | 16.8976 | 0.1507 | 2 | 9 | peptidyl-arginine N-methylation |
| GOMFID | Pvalue | OddsRatio | ExpCount | Count | Size | Term |
| GO:0061732 | 0.0018 | 56.941 | 0.0695 | 2 | 4 | mitochondrial acetyl-CoA biosynthetic process from pyruvate |
| GO:0006749 | 0.0022 | 5.9799 | 0.9212 | 5 | 53 | glutathione metabolic process |
| GO:0006085 | 0.0025 | 13.1795 | 0.2781 | 3 | 16 | acetyl-CoA biosynthetic process |
| GO:0006489 | 0.0043 | 28.4668 | 0.1043 | 2 | 6 | dolichyl diphosphate biosynthetic process |
| GO:0071286 | 0.0043 | 28.4668 | 0.1043 | 2 | 6 | cellular response to magnesium ion |
| GO:0051653 | 0.0046 | 6.5419 | 0.6779 | 4 | 39 | spindle localization |
| GO:0002076 | 0.0048 | 10.0758 | 0.3476 | 3 | 20 | osteoblast development |
| GO:0034166 | 0.0051 | 4.8615 | 1.1124 | 5 | 64 | toll-like receptor 10 signaling pathway |
| GO:0051250 | 0.0052 | 3.5362 | 2.1032 | 7 | 121 | negative regulation of lymphocyte activation |
| GO:0000086 | 0.0053 | 2.9384 | 3.233 | 9 | 186 | G2/M transition of mitotic cell cycle |
| GO:0034146 | 0.0054 | 4.7802 | 1.1298 | 5 | 65 | toll-like receptor 5 signaling pathway |
| GO:0021902 | 0.006 | 22.772 | 0.1217 | 2 | 7 | commitment of neuronal cell to specific neuron type in forebrain |
| GO:0006367 | 0.0064 | 2.5292 | 4.5714 | 11 | 263 | transcription initiation from RNA polymerase II promoter |
| GO:0038123 | 0.0074 | 4.411 | 1.2167 | 5 | 70 | toll-like receptor TLR1:TLR2 signaling pathway |
| GO:0038124 | 0.0074 | 4.411 | 1.2167 | 5 | 70 | toll-like receptor TLR6:TLR2 signaling pathway |
| GO:0006888 | 0.0075 | 2.9951 | 2.8159 | 8 | 162 | ER to Golgi vesicle-mediated transport |
| GO:0034162 | 0.0078 | 4.3439 | 1.2341 | 5 | 71 | toll-like receptor 9 signaling pathway |
| GO:0061072 | 0.0079 | 18.9754 | 0.1391 | 2 | 8 | iris morphogenesis |
| GO:0071372 | 0.0079 | 18.9754 | 0.1391 | 2 | 8 | cellular response to follicle-stimulating hormone stimulus |
| GO:0007018 | 0.0084 | 2.7205 | 3.4764 | 9 | 200 | microtubule-based movement |
| GO:0032925 | 0.009 | 7.7833 | 0.4345 | 3 | 25 | regulation of activin receptor signaling pathway |
| GO:0010960 | 0.01 | 16.2636 | 0.1564 | 2 | 9 | magnesium ion homeostasis |
| GO:0033327 | 0.01 | 16.2636 | 0.1564 | 2 | 9 | Leydig cell differentiation |
| GO:0050966 | 0.01 | 16.2636 | 0.1564 | 2 | 9 | detection of mechanical stimulus involved in sensory perception of pain |
| GOMFID | Pvalue | OddsRatio | ExpCount | Count | Size | Term |
| GO:0006367 | 3e-04 | 3.1958 | 4.7054 | 14 | 263 | transcription initiation from RNA polymerase II promoter |
| GO:0071426 | 8e-04 | 5.0266 | 1.5208 | 7 | 85 | ribonucleoprotein complex export from nucleus |
| GO:0007113 | 9e-04 | 110.5663 | 0.0537 | 2 | 3 | endomitotic cell cycle |
| GO:0006406 | 0.0019 | 5.0012 | 1.3061 | 6 | 73 | mRNA export from nucleus |
| GO:0048308 | 0.0022 | 13.8606 | 0.2684 | 3 | 15 | organelle inheritance |
| GO:1900034 | 0.0024 | 4.786 | 1.3597 | 6 | 76 | regulation of cellular response to heat |
| GO:0019054 | 0.0025 | 5.8035 | 0.9482 | 5 | 53 | modulation by virus of host process |
| GO:0009408 | 0.0026 | 3.3028 | 2.8984 | 9 | 162 | response to heat |
| GO:0046209 | 0.0029 | 4.5884 | 1.4134 | 6 | 79 | nitric oxide metabolic process |
| GO:0033043 | 0.003 | 1.7983 | 18.3564 | 31 | 1026 | regulation of organelle organization |
| GO:0051315 | 0.0031 | 36.8507 | 0.0895 | 2 | 5 | attachment of mitotic spindle microtubules to kinetochore |
| GO:0051343 | 0.0031 | 36.8507 | 0.0895 | 2 | 5 | positive regulation of cyclic-nucleotide phosphodiesterase activity |
| GO:0051726 | 0.0035 | 1.791 | 17.8018 | 30 | 995 | regulation of cell cycle |
| GO:0006868 | 0.0046 | 27.6362 | 0.1073 | 2 | 6 | glutamine transport |
| GO:0034498 | 0.0046 | 27.6362 | 0.1073 | 2 | 6 | early endosome to Golgi transport |
| GO:0051096 | 0.0046 | 27.6362 | 0.1073 | 2 | 6 | positive regulation of helicase activity |
| GO:0090166 | 0.0046 | 27.6362 | 0.1073 | 2 | 6 | Golgi disassembly |
| GO:2000653 | 0.0046 | 27.6362 | 0.1073 | 2 | 6 | regulation of genetic imprinting |
| GO:0006637 | 0.0047 | 4.1331 | 1.5565 | 6 | 87 | acyl-CoA metabolic process |
| GO:0015931 | 0.005 | 2.9692 | 3.2025 | 9 | 179 | nucleobase-containing compound transport |
| GO:0050658 | 0.0054 | 3.1765 | 2.6658 | 8 | 149 | RNA transport |
| GO:0015808 | 0.0063 | 22.1075 | 0.1252 | 2 | 7 | L-alanine transport |
| GO:0035524 | 0.0063 | 22.1075 | 0.1252 | 2 | 7 | proline transmembrane transport |
| GO:0007077 | 0.0072 | 5.6969 | 0.7693 | 4 | 43 | mitotic nuclear envelope disassembly |
| GO:0006399 | 0.0073 | 2.7867 | 3.3993 | 9 | 190 | tRNA metabolic process |
| GO:0046626 | 0.0078 | 5.5542 | 0.7872 | 4 | 44 | regulation of insulin receptor signaling pathway |
| GO:0061024 | 0.0079 | 1.6809 | 18.8574 | 30 | 1054 | membrane organization |
| GO:1901841 | 0.0083 | 18.4217 | 0.1431 | 2 | 8 | regulation of high voltage-gated calcium channel activity |
| GO:0030397 | 0.0084 | 5.4183 | 0.8051 | 4 | 45 | membrane disassembly |
| GO:0071456 | 0.0096 | 3.127 | 2.3616 | 7 | 132 | cellular response to hypoxia |
| GOMFID | Pvalue | OddsRatio | ExpCount | Count | Size | Term |
| GO:2000781 | 2e-04 | 38.3207 | 0.1248 | 3 | 8 | positive regulation of double-strand break repair |
| GO:0032897 | 4e-04 | 13.4894 | 0.3588 | 4 | 23 | negative regulation of viral transcription |
| GO:0001915 | 0.0014 | 63.6173 | 0.0624 | 2 | 4 | negative regulation of T cell mediated cytotoxicity |
| GO:0006933 | 0.0014 | 63.6173 | 0.0624 | 2 | 4 | negative regulation of cell adhesion involved in substrate-bound cell migration |
| GO:0019722 | 0.0017 | 3.8609 | 2.2151 | 8 | 142 | calcium-mediated signaling |
| GO:2000811 | 0.0022 | 13.678 | 0.2652 | 3 | 17 | negative regulation of anoikis |
| GO:2001022 | 0.003 | 5.5327 | 0.9827 | 5 | 63 | positive regulation of response to DNA damage stimulus |
| GO:0070562 | 0.0035 | 31.8045 | 0.0936 | 2 | 6 | regulation of vitamin D receptor signaling pathway |
| GO:0019080 | 0.0038 | 3.0981 | 3.073 | 9 | 197 | viral gene expression |
| GO:0043011 | 0.0041 | 10.6357 | 0.3276 | 3 | 21 | myeloid dendritic cell differentiation |
| GO:0002521 | 0.0046 | 2.2635 | 6.9884 | 15 | 448 | leukocyte differentiation |
| GO:0006396 | 0.0048 | 1.9351 | 12.0425 | 22 | 772 | RNA processing |
| GO:0016074 | 0.0048 | 25.442 | 0.1092 | 2 | 7 | snoRNA metabolic process |
| GO:0019221 | 0.0051 | 2.0716 | 9.1723 | 18 | 588 | cytokine-mediated signaling pathway |
| GO:0035987 | 0.0052 | 6.2423 | 0.702 | 4 | 45 | endodermal cell differentiation |
| GO:0030217 | 0.0053 | 2.9397 | 3.229 | 9 | 207 | T cell differentiation |
| GO:0015672 | 0.0053 | 2.1088 | 8.5015 | 17 | 545 | monovalent inorganic cation transport |
| GO:0031398 | 0.0054 | 3.168 | 2.6675 | 8 | 171 | positive regulation of protein ubiquitination |
| GO:0071346 | 0.0055 | 3.4957 | 2.1215 | 7 | 136 | cellular response to interferon-gamma |
| GO:0008334 | 0.006 | 9.1145 | 0.3744 | 3 | 24 | histone mRNA metabolic process |
| GO:0034661 | 0.006 | 9.1145 | 0.3744 | 3 | 24 | ncRNA catabolic process |
| GO:0030522 | 0.006 | 2.558 | 4.5237 | 11 | 290 | intracellular receptor signaling pathway |
| GO:0006282 | 0.006 | 4.6473 | 1.1543 | 5 | 74 | regulation of DNA repair |
| GO:0007172 | 0.0064 | 21.2003 | 0.1248 | 2 | 8 | signal complex assembly |
| GO:0071474 | 0.0064 | 21.2003 | 0.1248 | 2 | 8 | cellular hyperosmotic response |
| GO:0071383 | 0.0067 | 2.6538 | 3.9622 | 10 | 254 | cellular response to steroid hormone stimulus |
| GO:0044319 | 0.0067 | 8.6997 | 0.39 | 3 | 25 | wound healing, spreading of cells |
| GO:0090504 | 0.0075 | 8.3209 | 0.4056 | 3 | 26 | epiboly |
| GO:0051865 | 0.0076 | 5.562 | 0.78 | 4 | 50 | protein autoubiquitination |
| GO:0045724 | 0.0081 | 18.1705 | 0.1404 | 2 | 9 | positive regulation of cilium assembly |
| GO:0006364 | 0.0083 | 3.2187 | 2.2931 | 7 | 147 | rRNA processing |
| GO:0035066 | 0.0083 | 7.9737 | 0.4212 | 3 | 27 | positive regulation of histone acetylation |
| GO:0043266 | 0.0087 | 4.2174 | 1.2635 | 5 | 81 | regulation of potassium ion transport |
| GO:1902115 | 0.0089 | 3.5688 | 1.7783 | 6 | 114 | regulation of organelle assembly |
| GOMFID | Pvalue | OddsRatio | ExpCount | Count | Size | Term |
| GO:0006700 | 6e-04 | 12.4058 | 0.3922 | 4 | 22 | C21-steroid hormone biosynthetic process |
| GO:0019858 | 9e-04 | 110.9712 | 0.0535 | 2 | 3 | cytosine metabolic process |
| GO:0072061 | 9e-04 | 110.9712 | 0.0535 | 2 | 3 | inner medullary collecting duct development |
| GO:0046467 | 0.0017 | 3.8818 | 2.2106 | 8 | 124 | membrane lipid biosynthetic process |
| GO:0030150 | 0.0018 | 15.1772 | 0.2496 | 3 | 14 | protein import into mitochondrial matrix |
| GO:0032286 | 0.0019 | 55.482 | 0.0713 | 2 | 4 | central nervous system myelin maintenance |
| GO:0035696 | 0.0019 | 55.482 | 0.0713 | 2 | 4 | monocyte extravasation |
| GO:0042982 | 0.0019 | 8.5842 | 0.5348 | 4 | 30 | amyloid precursor protein metabolic process |
| GO:0042181 | 0.0027 | 7.6947 | 0.5883 | 4 | 33 | ketone biosynthetic process |
| GO:0061484 | 0.0031 | 36.9856 | 0.0891 | 2 | 5 | hematopoietic stem cell homeostasis |
| GO:0019400 | 0.0044 | 10.431 | 0.3387 | 3 | 19 | alditol metabolic process |
| GO:0048251 | 0.0045 | 27.7374 | 0.107 | 2 | 6 | elastic fiber assembly |
| GO:0061099 | 0.0051 | 9.8167 | 0.3566 | 3 | 20 | negative regulation of protein tyrosine kinase activity |
| GO:1902031 | 0.0063 | 22.1885 | 0.1248 | 2 | 7 | regulation of NADP metabolic process |
| GO:0070536 | 0.0076 | 8.3426 | 0.41 | 3 | 23 | protein K63-linked deubiquitination |
| GO:0032509 | 0.0083 | 18.4892 | 0.1426 | 2 | 8 | endosome transport via multivesicular body sorting pathway |
| GO:0085020 | 0.0083 | 18.4892 | 0.1426 | 2 | 8 | protein K6-linked ubiquitination |
| GO:0006839 | 0.0091 | 2.4041 | 4.7956 | 11 | 269 | mitochondrial transport |
| GO:0030325 | 0.0096 | 7.5832 | 0.4457 | 3 | 25 | adrenal gland development |
| GO:0032925 | 0.0096 | 7.5832 | 0.4457 | 3 | 25 | regulation of activin receptor signaling pathway |
| GOMFID | Pvalue | OddsRatio | ExpCount | Count | Size | Term |
| GO:0016556 | 1e-04 | 24.8261 | 0.2318 | 4 | 13 | mRNA modification |
| GO:0036451 | 3e-04 | Inf | 0.0357 | 2 | 2 | cap mRNA methylation |
| GO:0042488 | 9e-04 | 110.9712 | 0.0535 | 2 | 3 | positive regulation of odontogenesis of dentin-containing tooth |
| GO:0016242 | 0.0059 | 9.2708 | 0.3744 | 3 | 21 | negative regulation of macroautophagy |
| GO:0046834 | 0.0071 | 5.7179 | 0.7666 | 4 | 43 | lipid phosphorylation |
| GO:0043171 | 0.0086 | 7.9448 | 0.4279 | 3 | 24 | peptide catabolic process |
| GO:0033057 | 0.0096 | 7.5832 | 0.4457 | 3 | 25 | multicellular organism reproductive behavior |
| GO:2000279 | 0.0096 | 7.5832 | 0.4457 | 3 | 25 | negative regulation of DNA biosynthetic process |
| GO:0006695 | 0.0097 | 5.1847 | 0.8379 | 4 | 47 | cholesterol biosynthetic process |
| GOMFID | Pvalue | OddsRatio | ExpCount | Count | Size | Term |
| GO:0051123 | 5e-04 | 13.1315 | 0.3712 | 4 | 22 | RNA polymerase II transcriptional preinitiation complex assembly |
| GO:0009957 | 8e-04 | 117.4144 | 0.0506 | 2 | 3 | epidermal cell fate specification |
| GO:0032439 | 8e-04 | 117.4144 | 0.0506 | 2 | 3 | endosome localization |
| GO:0034628 | 8e-04 | 117.4144 | 0.0506 | 2 | 3 | 'de novo' NAD biosynthetic process from aspartate |
| GO:0007051 | 0.0013 | 4.0422 | 2.1259 | 8 | 126 | spindle organization |
| GO:0009411 | 0.0016 | 3.9412 | 2.1766 | 8 | 129 | response to UV |
| GO:0098813 | 0.0028 | 3.0345 | 3.4926 | 10 | 207 | nuclear chromosome segregation |
| GO:0045824 | 0.0034 | 7.1557 | 0.6243 | 4 | 37 | negative regulation of innate immune response |
| GO:0006657 | 0.0041 | 29.3479 | 0.1012 | 2 | 6 | CDP-choline pathway |
| GO:0032237 | 0.0041 | 29.3479 | 0.1012 | 2 | 6 | activation of store-operated calcium channel activity |
| GO:0090527 | 0.0041 | 29.3479 | 0.1012 | 2 | 6 | actin filament reorganization |
| GO:0051983 | 0.0042 | 4.2352 | 1.5185 | 6 | 90 | regulation of chromosome segregation |
| GO:0070507 | 0.0055 | 3.4934 | 2.1259 | 7 | 126 | regulation of microtubule cytoskeleton organization |
| GO:0000070 | 0.0058 | 3.4641 | 2.1428 | 7 | 127 | mitotic sister chromatid segregation |
| GO:0006891 | 0.0058 | 6.0525 | 0.7255 | 4 | 43 | intra-Golgi vesicle-mediated transport |
| GO:0008347 | 0.0058 | 6.0525 | 0.7255 | 4 | 43 | glial cell migration |
| GO:2001044 | 0.0074 | 19.5627 | 0.135 | 2 | 8 | regulation of integrin-mediated signaling pathway |
| GO:0008298 | 0.0094 | 16.767 | 0.1519 | 2 | 9 | intracellular mRNA localization |
| GO:1901339 | 0.0094 | 16.767 | 0.1519 | 2 | 9 | regulation of store-operated calcium channel activity |
| GOMFID | Pvalue | OddsRatio | ExpCount | Count | Size | Term |
| GO:0005515 | 0.0013 | 1.4847 | 190.2978 | 215 | 10125 | protein binding |
| GO:0043533 | 0.0021 | 52.5544 | 0.0752 | 2 | 4 | inositol 1,3,4,5 tetrakisphosphate binding |
| GO:0071535 | 0.0021 | 52.5544 | 0.0752 | 2 | 4 | RING-like zinc finger domain binding |
| GO:0050811 | 0.0025 | 13.1749 | 0.2819 | 3 | 15 | GABA receptor binding |
| GO:0016411 | 0.0031 | 12.1607 | 0.3007 | 3 | 16 | acylglycerol O-acyltransferase activity |
| GO:0046934 | 0.0034 | 35.034 | 0.094 | 2 | 5 | phosphatidylinositol-4,5-bisphosphate 3-kinase activity |
| GO:0016248 | 0.0045 | 6.6015 | 0.6766 | 4 | 36 | channel inhibitor activity |
| GO:0035005 | 0.0069 | 21.0177 | 0.1316 | 2 | 7 | 1-phosphatidylinositol-4-phosphate 3-kinase activity |
| GO:0019870 | 0.0091 | 17.5136 | 0.1504 | 2 | 8 | potassium channel inhibitor activity |
| GOMFID | Pvalue | OddsRatio | ExpCount | Count | Size | Term |
| GO:0000253 | 0.001 | 107.7282 | 0.0551 | 2 | 3 | 3-keto sterol reductase activity |
| GO:0005525 | 0.0043 | 2.356 | 6.2575 | 14 | 341 | GTP binding |
| GO:0051015 | 0.0048 | 3.5955 | 2.0736 | 7 | 113 | actin filament binding |
| GO:0016670 | 0.0066 | 21.5401 | 0.1285 | 2 | 7 | oxidoreductase activity, acting on a sulfur group of donors, oxygen as acceptor |
| GO:0019001 | 0.0067 | 2.2304 | 6.5878 | 14 | 359 | guanyl nucleotide binding |
| GOMFID | Pvalue | OddsRatio | ExpCount | Count | Size | Term |
| GO:0042923 | 0.0049 | 9.8956 | 0.3492 | 3 | 22 | neuropeptide binding |
| GO:0005031 | 0.0055 | 9.4002 | 0.3651 | 3 | 23 | tumor necrosis factor-activated receptor activity |
| GO:0005005 | 0.0084 | 17.8479 | 0.1429 | 2 | 9 | transmembrane-ephrin receptor activity |
| GO:0016417 | 0.0087 | 7.8315 | 0.4286 | 3 | 27 | S-acyltransferase activity |
| GOMFID | Pvalue | OddsRatio | ExpCount | Count | Size | Term |
| GO:0032394 | 2e-04 | Inf | 0.0309 | 2 | 2 | MHC class Ib receptor activity |
| GO:0042288 | 0.0025 | 12.9092 | 0.2777 | 3 | 18 | MHC class I protein binding |
| GO:0003997 | 0.0034 | 32.1618 | 0.0926 | 2 | 6 | acyl-CoA oxidase activity |
| GO:0045502 | 0.0058 | 9.2173 | 0.3703 | 3 | 24 | dynein binding |
| GO:0030515 | 0.0065 | 8.7977 | 0.3857 | 3 | 25 | snoRNA binding |
| GOMFID | Pvalue | OddsRatio | ExpCount | Count | Size | Term |
| GO:0034235 | 2e-04 | 36.293 | 0.1316 | 3 | 8 | GPI anchor binding |
| GO:0015501 | 3e-04 | Inf | 0.0329 | 2 | 2 | glutamate:sodium symporter activity |
| GO:0005416 | 0.0017 | 15.1152 | 0.2467 | 3 | 15 | cation:amino acid symporter activity |
| GO:0003923 | 0.0026 | 40.1738 | 0.0822 | 2 | 5 | GPI-anchor transamidase activity |
| GO:0030911 | 0.0026 | 40.1738 | 0.0822 | 2 | 5 | TPR domain binding |
| GO:0005384 | 0.0039 | 30.1284 | 0.0987 | 2 | 6 | manganese ion transmembrane transporter activity |
| GO:0005343 | 0.0086 | 7.8806 | 0.4276 | 3 | 26 | organic acid:sodium symporter activity |
| GO:0004716 | 0.009 | 17.2129 | 0.148 | 2 | 9 | receptor signaling protein tyrosine kinase activity |
| GO:0016832 | 0.009 | 17.2129 | 0.148 | 2 | 9 | aldehyde-lyase activity |
| GOMFID | Pvalue | OddsRatio | ExpCount | Count | Size | Term |
| GO:0031755 | 3e-04 | Inf | 0.0348 | 2 | 2 | Edg-2 lysophosphatidic acid receptor binding |
| GO:0042500 | 0.0018 | 56.886 | 0.0696 | 2 | 4 | aspartic endopeptidase activity, intramembrane cleaving |
| GO:0004842 | 0.0023 | 2.4525 | 6.472 | 15 | 372 | ubiquitin-protein transferase activity |
| GO:0080025 | 0.0035 | 11.4096 | 0.3132 | 3 | 18 | phosphatidylinositol-3,5-bisphosphate binding |
| GO:0031625 | 0.004 | 2.7124 | 4.2799 | 11 | 246 | ubiquitin protein ligase binding |
| GO:0016917 | 0.0041 | 10.6958 | 0.3306 | 3 | 19 | GABA receptor activity |
| GO:0003824 | 0.0047 | 1.3941 | 92.122 | 113 | 5295 | catalytic activity |
| GO:0003708 | 0.006 | 22.75 | 0.1218 | 2 | 7 | retinoic acid receptor activity |
| GO:0004129 | 0.0071 | 8.5544 | 0.4002 | 3 | 23 | cytochrome-c oxidase activity |
| GO:0016675 | 0.008 | 8.1465 | 0.4176 | 3 | 24 | oxidoreductase activity, acting on a heme group of donors |
| GO:0004527 | 0.0083 | 4.2745 | 1.2527 | 5 | 72 | exonuclease activity |
| GOMFID | Pvalue | OddsRatio | ExpCount | Count | Size | Term |
| GO:0004427 | 0.0016 | 60.0271 | 0.066 | 2 | 4 | inorganic diphosphatase activity |
| GO:0008574 | 0.0017 | 15.0554 | 0.2476 | 3 | 15 | ATP-dependent microtubule motor activity, plus-end-directed |
| GO:0005225 | 0.0039 | 30.0097 | 0.0991 | 2 | 6 | volume-sensitive anion channel activity |
| GO:0045322 | 0.0039 | 30.0097 | 0.0991 | 2 | 6 | unmethylated CpG binding |
| GO:0016818 | 0.0065 | 1.877 | 12.3652 | 22 | 749 | hydrolase activity, acting on acid anhydrides, in phosphorus-containing anhydrides |
| GO:0036442 | 0.0078 | 8.2068 | 0.4127 | 3 | 25 | hydrogen-exporting ATPase activity |
| GO:0015297 | 0.008 | 4.319 | 1.2382 | 5 | 75 | antiporter activity |
| GOMFID | Pvalue | OddsRatio | ExpCount | Count | Size | Term |
| GO:0019787 | 4e-04 | 2.7363 | 6.6519 | 17 | 388 | ubiquitin-like protein transferase activity |
| GO:0001618 | 0.001 | 5.7444 | 1.1486 | 6 | 67 | virus receptor activity |
| GO:0008574 | 0.0019 | 14.4822 | 0.2572 | 3 | 15 | ATP-dependent microtubule motor activity, plus-end-directed |
| GO:0031628 | 0.0028 | 38.4975 | 0.0857 | 2 | 5 | opioid receptor binding |
| GO:0017137 | 0.003 | 4.546 | 1.4229 | 6 | 83 | Rab GTPase binding |
| GO:0086083 | 0.0042 | 28.8713 | 0.1029 | 2 | 6 | cell adhesive protein binding involved in bundle of His cell-Purkinje myocyte communication |
| GO:0061630 | 0.0044 | 3.0331 | 3.1373 | 9 | 183 | ubiquitin protein ligase activity |
| GO:0004176 | 0.0097 | 16.4947 | 0.1543 | 2 | 9 | ATP-dependent peptidase activity |
| GOMFID | Pvalue | OddsRatio | ExpCount | Count | Size | Term |
| GO:0035663 | 7e-04 | 124.9839 | 0.0476 | 2 | 3 | Toll-like receptor 2 binding |
| GO:0003743 | 0.006 | 5.9841 | 0.7302 | 4 | 46 | translation initiation factor activity |
| GO:0070700 | 0.0084 | 17.8479 | 0.1429 | 2 | 9 | BMP receptor binding |
| GOMFID | Pvalue | OddsRatio | ExpCount | Count | Size | Term |
| GO:0061631 | 1e-04 | 12.1796 | 0.5023 | 5 | 27 | ubiquitin conjugating enzyme activity |
| GO:0046977 | 2e-04 | 39.9621 | 0.1302 | 3 | 7 | TAP binding |
| GO:0003777 | 0.0025 | 4.7309 | 1.3767 | 6 | 74 | microtubule motor activity |
| GO:0050998 | 0.0042 | 10.649 | 0.3349 | 3 | 18 | nitric-oxide synthase binding |
| GO:0008601 | 0.005 | 9.9828 | 0.3535 | 3 | 19 | protein phosphatase type 2A regulator activity |
| GO:0019208 | 0.005 | 4.0692 | 1.5814 | 6 | 85 | phosphatase regulator activity |
| GO:0044822 | 0.0061 | 1.6728 | 20.8927 | 33 | 1123 | poly(A) RNA binding |
| GO:0019787 | 0.0062 | 2.1819 | 7.2185 | 15 | 388 | ubiquitin-like protein transferase activity |
| GO:0031491 | 0.0082 | 5.4714 | 0.8 | 4 | 43 | nucleosome binding |
| GO:0004726 | 0.009 | 17.6976 | 0.1488 | 2 | 8 | non-membrane spanning protein tyrosine phosphatase activity |
| GO:0042605 | 0.0097 | 7.6034 | 0.4465 | 3 | 24 | peptide antigen binding |
| GOMFID | Pvalue | OddsRatio | ExpCount | Count | Size | Term |
| GO:0003845 | 3e-04 | Inf | 0.0333 | 2 | 2 | 11-beta-hydroxysteroid dehydrogenase [NAD(P)] activity |
| GO:0035663 | 8e-04 | 119.1231 | 0.0499 | 2 | 3 | Toll-like receptor 2 binding |
| GO:0004563 | 0.0027 | 39.7026 | 0.0832 | 2 | 5 | beta-N-acetylhexosaminidase activity |
| GO:0031625 | 0.0028 | 2.8443 | 4.0925 | 11 | 246 | ubiquitin protein ligase binding |
| GO:0016229 | 0.008 | 8.1423 | 0.4159 | 3 | 25 | steroid dehydrogenase activity |
| GOMFID | Pvalue | OddsRatio | ExpCount | Count | Size | Term |
| GO:0001875 | 0.003 | 37.225 | 0.0886 | 2 | 5 | lipopolysaccharide receptor activity |
| GO:0052866 | 0.0066 | 8.8392 | 0.3897 | 3 | 22 | phosphatidylinositol phosphate phosphatase activity |
| GO:0042802 | 0.0077 | 1.6583 | 20.4259 | 32 | 1153 | identical protein binding |
| GO:0016757 | 0.008 | 2.449 | 4.7123 | 11 | 266 | transferase activity, transferring glycosyl groups |
| GOMFID | Pvalue | OddsRatio | ExpCount | Count | Size | Term |
| GO:0035259 | 0.0012 | 17.7874 | 0.2179 | 3 | 13 | glucocorticoid receptor binding |
| GO:0015016 | 0.0016 | 59.0954 | 0.0671 | 2 | 4 | [heparan sulfate]-glucosamine N-sulfotransferase activity |
| GO:0005111 | 0.0027 | 39.3944 | 0.0838 | 2 | 5 | type 2 fibroblast growth factor receptor binding |
| GOMFID | Pvalue | OddsRatio | ExpCount | Count | Size | Term |
| GO:0043167 | 1e-04 | 1.5725 | 101.9522 | 132 | 5755 | ion binding |
| GO:0000253 | 9e-04 | 111.6895 | 0.0531 | 2 | 3 | 3-keto sterol reductase activity |
| GO:0046872 | 0.0015 | 1.4902 | 68.8067 | 91 | 3884 | metal ion binding |
| GO:0004090 | 0.0018 | 55.8412 | 0.0709 | 2 | 4 | carbonyl reductase (NADPH) activity |
| GO:0004693 | 0.0018 | 8.64 | 0.5315 | 4 | 30 | cyclin-dependent protein serine/threonine kinase activity |
| GO:0005154 | 0.0018 | 8.64 | 0.5315 | 4 | 30 | epidermal growth factor receptor binding |
| GO:0031995 | 0.0082 | 18.6089 | 0.1417 | 2 | 8 | insulin-like growth factor II binding |
| GO:0035256 | 0.0082 | 18.6089 | 0.1417 | 2 | 8 | G-protein coupled glutamate receptor binding |
| GOMFID | Pvalue | OddsRatio | ExpCount | Count | Size | Term |
| GO:0003723 | 7e-04 | 1.7858 | 26.7693 | 44 | 1495 | RNA binding |
| GO:0008172 | 0.0063 | 22.0886 | 0.1253 | 2 | 7 | S-methyltransferase activity |
| GOMFID | Pvalue | OddsRatio | ExpCount | Count | Size | Term |
| GO:0046872 | 0.0015 | 1.4715 | 73.9856 | 97 | 3884 | metal ion binding |
| GO:0015631 | 0.0038 | 2.5965 | 4.8765 | 12 | 256 | tubulin binding |
| GO:0003684 | 0.0056 | 4.7439 | 1.1429 | 5 | 60 | damaged DNA binding |
| GO:0034452 | 0.0094 | 17.274 | 0.1524 | 2 | 8 | dynactin binding |
| GOMFID | Pvalue | OddsRatio | ExpCount | Count | Size | Term |
| GO:0004579 | 2e-04 | 37.6372 | 0.127 | 3 | 8 | dolichyl-diphosphooligosaccharide-protein glycotransferase activity |
| GO:0031996 | 0.001 | 18.8126 | 0.2064 | 3 | 13 | thioesterase binding |
| GO:0000702 | 0.0015 | 62.4879 | 0.0635 | 2 | 4 | oxidized base lesion DNA N-glycosylase activity |
| GO:0004594 | 0.0015 | 62.4879 | 0.0635 | 2 | 4 | pantothenate kinase activity |
| GO:0017162 | 0.0015 | 62.4879 | 0.0635 | 2 | 4 | aryl hydrocarbon receptor binding |
| GO:0048037 | 0.0073 | 2.6159 | 4.0161 | 10 | 253 | cofactor binding |
| GO:0005515 | 0.0082 | 1.4076 | 160.7245 | 179 | 10125 | protein binding |
| GO:0051371 | 0.0084 | 17.8479 | 0.1429 | 2 | 9 | muscle alpha-actinin binding |
| GO:0005525 | 0.0085 | 2.3248 | 5.413 | 12 | 341 | GTP binding |
| GOMFID | Pvalue | OddsRatio | ExpCount | Count | Size | Term |
| GO:0050840 | 9e-04 | 7.3825 | 0.756 | 5 | 49 | extracellular matrix binding |
| GO:0017176 | 0.0014 | 64.332 | 0.0617 | 2 | 4 | phosphatidylinositol N-acetylglucosaminyltransferase activity |
| GO:0003954 | 0.0024 | 7.8473 | 0.5709 | 4 | 37 | NADH dehydrogenase activity |
| GO:0008137 | 0.0024 | 7.8473 | 0.5709 | 4 | 37 | NADH dehydrogenase (ubiquinone) activity |
| GO:0016655 | 0.0078 | 5.5049 | 0.7869 | 4 | 51 | oxidoreductase activity, acting on NAD(P)H, quinone or similar compound as acceptor |
| GOMFID | Pvalue | OddsRatio | ExpCount | Count | Size | Term |
| GO:0001025 | 0.0015 | 62.4879 | 0.0635 | 2 | 4 | RNA polymerase III transcription factor binding |
| GO:0000166 | 0.0016 | 1.6448 | 34.7006 | 52 | 2186 | nucleotide binding |
| GO:0044822 | 0.0018 | 1.8675 | 17.8265 | 31 | 1123 | poly(A) RNA binding |
| GO:0008171 | 0.0023 | 13.4341 | 0.2699 | 3 | 17 | O-methyltransferase activity |
| GO:0016597 | 0.004 | 4.2577 | 1.508 | 6 | 95 | amino acid binding |
| GO:0032555 | 0.0041 | 1.6304 | 27.7795 | 42 | 1750 | purine ribonucleotide binding |
| GO:0003824 | 0.0048 | 1.4145 | 84.053 | 104 | 5295 | catalytic activity |
| GO:0003950 | 0.0049 | 9.8956 | 0.3492 | 3 | 22 | NAD+ ADP-ribosyltransferase activity |
| GO:0000182 | 0.005 | 24.9903 | 0.1111 | 2 | 7 | rDNA binding |
| GO:0003689 | 0.005 | 24.9903 | 0.1111 | 2 | 7 | DNA clamp loader activity |
| GO:0008519 | 0.0055 | 9.4002 | 0.3651 | 3 | 23 | ammonium transmembrane transporter activity |
| GO:0003676 | 0.0069 | 1.4317 | 58.718 | 76 | 3699 | nucleic acid binding |
| GO:0035639 | 0.0078 | 1.5784 | 27.1287 | 40 | 1709 | purine ribonucleoside triphosphate binding |
| GO:0008504 | 0.0084 | 17.8479 | 0.1429 | 2 | 9 | monoamine transmembrane transporter activity |
| GO:0032550 | 0.0085 | 1.5678 | 27.2874 | 40 | 1719 | purine ribonucleoside binding |
| GO:0043167 | 0.0087 | 1.3716 | 91.355 | 110 | 5755 | ion binding |
| GO:0001882 | 0.0093 | 1.5585 | 27.4303 | 40 | 1728 | nucleoside binding |
| GO:0016765 | 0.0099 | 5.1269 | 0.8413 | 4 | 53 | transferase activity, transferring alkyl or aryl (other than methyl) groups |
| GOMFID | Pvalue | OddsRatio | ExpCount | Count | Size | Term |
| GO:0042609 | 6e-04 | 86.0771 | 0.0391 | 2 | 5 | CD4 receptor binding |
| GO:0017128 | 0.0026 | 32.2686 | 0.0781 | 2 | 10 | phospholipid scramblase activity |
| GO:0004108 | 0.0078 | Inf | 0.0078 | 1 | 1 | citrate (Si)-synthase activity |
| GO:0004124 | 0.0078 | Inf | 0.0078 | 1 | 1 | cysteine synthase activity |
| GO:0004411 | 0.0078 | Inf | 0.0078 | 1 | 1 | homogentisate 1,2-dioxygenase activity |
| GO:0008768 | 0.0078 | Inf | 0.0078 | 1 | 1 | UDP-sugar diphosphatase activity |
| GO:0047273 | 0.0078 | Inf | 0.0078 | 1 | 1 | galactosylgalactosylglucosylceramide beta-D-acetylgalactosaminyltransferase activity |
| GO:0047290 | 0.0078 | Inf | 0.0078 | 1 | 1 | (alpha-N-acetylneuraminyl-2,3-beta-galactosyl-1,3)-N-acetyl-galactosaminide 6-alpha-sialyltransferase activity |
| GO:0050421 | 0.0078 | Inf | 0.0078 | 1 | 1 | nitrite reductase (NO-forming) activity |
| GO:0070025 | 0.0078 | Inf | 0.0078 | 1 | 1 | carbon monoxide binding |
| GO:0097655 | 0.0078 | Inf | 0.0078 | 1 | 1 | serpin family protein binding |
| GO:1904047 | 0.0078 | Inf | 0.0078 | 1 | 1 | S-adenosyl-L-methionine binding |
| NA. |
| n/a |
| GOMFID | Pvalue | OddsRatio | ExpCount | Count | Size | Term |
| GO:0004372 | 2e-04 | Inf | 0.0316 | 2 | 2 | glycine hydroxymethyltransferase activity |
| GO:0008732 | 2e-04 | Inf | 0.0316 | 2 | 2 | L-allo-threonine aldolase activity |
| GO:0042975 | 0.001 | 18.8902 | 0.2055 | 3 | 13 | peroxisome proliferator activated receptor binding |
| GO:0031698 | 0.0024 | 41.8273 | 0.0791 | 2 | 5 | beta-2 adrenergic receptor binding |
| GO:0008373 | 0.0042 | 10.4892 | 0.332 | 3 | 21 | sialyltransferase activity |
| GO:0016861 | 0.0065 | 20.9096 | 0.1265 | 2 | 8 | intramolecular oxidoreductase activity, interconverting aldoses and ketoses |
| GO:0016741 | 0.0067 | 2.8258 | 3.3518 | 9 | 212 | transferase activity, transferring one-carbon groups |
| GO:0016832 | 0.0083 | 17.9213 | 0.1423 | 2 | 9 | aldehyde-lyase activity |
| GOMFID | Pvalue | OddsRatio | ExpCount | Count | Size | Term |
| GO:0004176 | 0.0079 | 18.3746 | 0.1389 | 2 | 9 | ATP-dependent peptidase activity |
| GO:0031702 | 0.0098 | 16.0768 | 0.1543 | 2 | 10 | type 1 angiotensin receptor binding |
| GOMFID | Pvalue | OddsRatio | ExpCount | Count | Size | Term |
| GO:0016748 | 2e-04 | Inf | 0.03 | 2 | 2 | succinyltransferase activity |
| GO:0005534 | 0.0013 | 66.2863 | 0.0599 | 2 | 4 | galactose binding |
| GO:0016433 | 0.0032 | 33.1389 | 0.0899 | 2 | 6 | rRNA (adenine) methyltransferase activity |
| GO:0061133 | 0.0032 | 33.1389 | 0.0899 | 2 | 6 | endopeptidase activator activity |
| GO:0050291 | 0.0045 | 26.5094 | 0.1049 | 2 | 7 | sphingosine N-acyltransferase activity |
| GO:0016861 | 0.0059 | 22.0897 | 0.1199 | 2 | 8 | intramolecular oxidoreductase activity, interconverting aldoses and ketoses |
| GO:0004364 | 0.0067 | 8.6714 | 0.3896 | 3 | 26 | glutathione transferase activity |
| GO:0005515 | 0.0099 | 1.4079 | 151.7239 | 169 | 10125 | protein binding |
| GOMFID | Pvalue | OddsRatio | ExpCount | Count | Size | Term |
| GO:0050816 | 0.001 | 107.3472 | 0.0552 | 2 | 3 | phosphothreonine binding |
| GO:0003677 | 0.0016 | 1.5775 | 42.9964 | 62 | 2335 | DNA binding |
| GO:0043021 | 0.0045 | 4.166 | 1.5468 | 6 | 84 | ribonucleoprotein complex binding |
| GO:0036402 | 0.0048 | 26.8316 | 0.1105 | 2 | 6 | proteasome-activating ATPase activity |
| GO:1901363 | 0.0057 | 1.3686 | 100.9264 | 122 | 5481 | heterocyclic compound binding |
| GO:0008134 | 0.006 | 2.0302 | 9.3174 | 18 | 506 | transcription factor binding |
| GO:0031593 | 0.0061 | 5.9918 | 0.7366 | 4 | 40 | polyubiquitin binding |
| GO:0022884 | 0.0064 | 8.9669 | 0.3867 | 3 | 21 | macromolecule transmembrane transporter activity |
| GO:0097159 | 0.0068 | 1.3576 | 102.3811 | 123 | 5560 | organic cyclic compound binding |
| GO:0005113 | 0.0088 | 17.8854 | 0.1473 | 2 | 8 | patched binding |
| GO:0015450 | 0.0088 | 17.8854 | 0.1473 | 2 | 8 | P-P-bond-hydrolysis-driven protein transmembrane transporter activity |
| GO:0045502 | 0.0094 | 7.6844 | 0.4419 | 3 | 24 | dynein binding |
| GOMFID | Pvalue | OddsRatio | ExpCount | Count | Size | Term |
| GO:0031072 | 8e-04 | 5.0688 | 1.5094 | 7 | 84 | heat shock protein binding |
| GO:0009922 | 0.001 | 110.0712 | 0.0539 | 2 | 3 | fatty acid elongase activity |
| GO:0001601 | 0.0019 | 55.032 | 0.0719 | 2 | 4 | peptide YY receptor activity |
| GO:0001602 | 0.0019 | 55.032 | 0.0719 | 2 | 4 | pancreatic polypeptide receptor activity |
| GO:0019238 | 0.0031 | 36.6856 | 0.0898 | 2 | 5 | cyclohydrolase activity |
| GO:0046870 | 0.0031 | 36.6856 | 0.0898 | 2 | 5 | cadmium ion binding |
| GO:0004438 | 0.0046 | 27.5125 | 0.1078 | 2 | 6 | phosphatidylinositol-3-phosphatase activity |
| GO:0052866 | 0.0069 | 8.7107 | 0.3953 | 3 | 22 | phosphatidylinositol phosphate phosphatase activity |
| GO:0060590 | 0.0078 | 8.2746 | 0.4133 | 3 | 23 | ATPase regulator activity |
| GOMFID | Pvalue | OddsRatio | ExpCount | Count | Size | Term |
| GO:0004563 | 0.0025 | 41.1501 | 0.0803 | 2 | 5 | beta-N-acetylhexosaminidase activity |
| GO:0046870 | 0.0025 | 41.1501 | 0.0803 | 2 | 5 | cadmium ion binding |
| GO:0050998 | 0.0028 | 12.3848 | 0.2892 | 3 | 18 | nitric-oxide synthase binding |
| GO:0008134 | 0.0079 | 2.0675 | 8.1286 | 16 | 506 | transcription factor binding |
| GO:0030295 | 0.0096 | 5.17 | 0.8354 | 4 | 52 | protein kinase activator activity |
| GOMFID | Pvalue | OddsRatio | ExpCount | Count | Size | Term |
| GO:0008823 | 0.0012 | 99.9159 | 0.0592 | 2 | 3 | cupric reductase activity |
| GO:0052851 | 0.0012 | 99.9159 | 0.0592 | 2 | 3 | ferric-chelate reductase (NADPH) activity |
| GO:0045545 | 0.0037 | 33.301 | 0.0987 | 2 | 5 | syndecan binding |
| GO:0004767 | 0.0076 | 19.978 | 0.1382 | 2 | 7 | sphingomyelin phosphodiesterase activity |
| GO:0003723 | 0.0077 | 1.5455 | 29.5222 | 43 | 1495 | RNA binding |
| GO:0035586 | 0.0078 | 8.3442 | 0.4147 | 3 | 21 | purinergic receptor activity |
| GOMFID | Pvalue | OddsRatio | ExpCount | Count | Size | Term |
| GO:0005031 | 9e-04 | 10.8253 | 0.444 | 4 | 23 | tumor necrosis factor-activated receptor activity |
| GO:0005483 | 0.0011 | 102.2781 | 0.0579 | 2 | 3 | soluble NSF attachment protein activity |
| GO:0008502 | 0.0011 | 102.2781 | 0.0579 | 2 | 3 | melatonin receptor activity |
| GO:0008172 | 0.0073 | 20.4503 | 0.1351 | 2 | 7 | S-methyltransferase activity |
| GO:0003723 | 0.0085 | 1.5437 | 28.8577 | 42 | 1495 | RNA binding |
| GO:0004065 | 0.0096 | 17.0408 | 0.1544 | 2 | 8 | arylsulfatase activity |
| GOMFID | Pvalue | OddsRatio | ExpCount | Count | Size | Term |
| GO:0004468 | 0.0023 | 42.7052 | 0.0775 | 2 | 5 | lysine N-acetyltransferase activity, acting on acetyl phosphate as donor |
| GO:0004114 | 0.0058 | 9.1784 | 0.3718 | 3 | 24 | 3',5'-cyclic-nucleotide phosphodiesterase activity |
| GO:0003841 | 0.0099 | 16.0093 | 0.1549 | 2 | 10 | 1-acylglycerol-3-phosphate O-acyltransferase activity |
| GO:0005522 | 0.0099 | 16.0093 | 0.1549 | 2 | 10 | profilin binding |
| GOMFID | Pvalue | OddsRatio | ExpCount | Count | Size | Term |
| GO:0098505 | 0.0047 | 25.8367 | 0.1076 | 2 | 7 | G-rich strand telomeric DNA binding |
| GO:0043014 | 0.0051 | 9.7199 | 0.3534 | 3 | 23 | alpha-tubulin binding |
| GO:0003777 | 0.0056 | 4.7202 | 1.1371 | 5 | 74 | microtubule motor activity |
| GO:0070181 | 0.0062 | 21.5292 | 0.1229 | 2 | 8 | small ribosomal subunit rRNA binding |
| GO:0098847 | 0.0079 | 18.4524 | 0.1383 | 2 | 9 | sequence-specific single stranded DNA binding |
| GOMFID | Pvalue | OddsRatio | ExpCount | Count | Size | Term |
| GO:0032394 | 3e-04 | Inf | 0.0329 | 2 | 2 | MHC class Ib receptor activity |
| GO:0097153 | 7e-04 | 22.6787 | 0.1809 | 3 | 11 | cysteine-type endopeptidase activity involved in apoptotic process |
| GO:0070577 | 0.0025 | 12.9542 | 0.2796 | 3 | 17 | lysine-acetylated histone binding |
| GO:0046934 | 0.0026 | 40.1738 | 0.0822 | 2 | 5 | phosphatidylinositol-4,5-bisphosphate 3-kinase activity |
| GO:0034713 | 0.009 | 17.2129 | 0.148 | 2 | 9 | type I transforming growth factor beta receptor binding |
| GO:0016772 | 0.0094 | 1.7634 | 14.3405 | 24 | 872 | transferase activity, transferring phosphorus-containing groups |
| GO:0016655 | 0.0098 | 5.1541 | 0.8387 | 4 | 51 | oxidoreductase activity, acting on NAD(P)H, quinone or similar compound as acceptor |
| GOMFID | Pvalue | OddsRatio | ExpCount | Count | Size | Term |
| GO:0071535 | 0.0016 | 60.2646 | 0.0658 | 2 | 4 | RING-like zinc finger domain binding |
| GO:0050811 | 0.0017 | 15.1152 | 0.2467 | 3 | 15 | GABA receptor binding |
| GO:0008376 | 0.0022 | 8.0837 | 0.5591 | 4 | 34 | acetylgalactosaminyltransferase activity |
| GO:0005515 | 0.0026 | 1.4797 | 166.5106 | 188 | 10125 | protein binding |
| GO:0016796 | 0.0045 | 6.5514 | 0.6743 | 4 | 41 | exonuclease activity, active with either ribo- or deoxyribonucleic acids and producing 5'-phosphomonoesters |
| GO:0008408 | 0.0058 | 6.0588 | 0.7236 | 4 | 44 | 3'-5' exonuclease activity |
| GO:0004726 | 0.0071 | 20.083 | 0.1316 | 2 | 8 | non-membrane spanning protein tyrosine phosphatase activity |
| GO:0016857 | 0.009 | 17.2129 | 0.148 | 2 | 9 | racemase and epimerase activity, acting on carbohydrates and derivatives |
| GOMFID | Pvalue | OddsRatio | ExpCount | Count | Size | Term |
| GO:0070567 | 2e-04 | 35.7254 | 0.1336 | 3 | 8 | cytidylyltransferase activity |
| GO:0004602 | 0.0018 | 14.8788 | 0.2505 | 3 | 15 | glutathione peroxidase activity |
| GO:0046923 | 0.0027 | 39.5479 | 0.0835 | 2 | 5 | ER retention sequence binding |
| GO:0015288 | 0.004 | 29.659 | 0.1002 | 2 | 6 | porin activity |
| GO:0043167 | 0.0046 | 1.3998 | 96.1055 | 117 | 5755 | ion binding |
| GO:0005544 | 0.0056 | 6.117 | 0.7181 | 4 | 43 | calcium-dependent phospholipid binding |
| GO:0005516 | 0.0078 | 2.9676 | 2.8389 | 8 | 170 | calmodulin binding |
| GOMFID | Pvalue | OddsRatio | ExpCount | Count | Size | Term |
| GO:0051787 | 0.0012 | 18.0082 | 0.2202 | 3 | 12 | misfolded protein binding |
| GO:0002039 | 0.0013 | 5.4417 | 1.2111 | 6 | 66 | p53 binding |
| GO:0070034 | 0.0015 | 16.2063 | 0.2386 | 3 | 13 | telomerase RNA binding |
| GO:0030554 | 0.0031 | 1.6603 | 26.4429 | 41 | 1441 | adenyl nucleotide binding |
| GO:0003697 | 0.0047 | 4.1278 | 1.5598 | 6 | 85 | single-stranded DNA binding |
| GO:0043167 | 0.0054 | 1.3695 | 105.6064 | 127 | 5755 | ion binding |
| GO:0005524 | 0.0056 | 1.6174 | 25.6722 | 39 | 1399 | ATP binding |
| GO:0008312 | 0.0066 | 21.5401 | 0.1285 | 2 | 7 | 7S RNA binding |
| GO:0008603 | 0.0066 | 21.5401 | 0.1285 | 2 | 7 | cAMP-dependent protein kinase regulator activity |
| GO:0030306 | 0.0066 | 21.5401 | 0.1285 | 2 | 7 | ADP-ribosylation factor binding |
| GO:0035613 | 0.0087 | 17.9489 | 0.1468 | 2 | 8 | RNA stem-loop binding |
| GO:0030234 | 0.0088 | 1.7136 | 16.5887 | 27 | 904 | enzyme regulator activity |
| GOMFID | Pvalue | OddsRatio | ExpCount | Count | Size | Term |
| GO:0051959 | 9e-04 | 113.7794 | 0.0522 | 2 | 3 | dynein light intermediate chain binding |
| GO:0005525 | 0.0027 | 2.4944 | 5.9327 | 14 | 341 | GTP binding |
| GO:0019212 | 0.0034 | 7.1495 | 0.6263 | 4 | 36 | phosphatase inhibitor activity |
| GO:0019001 | 0.0042 | 2.3614 | 6.2459 | 14 | 359 | guanyl nucleotide binding |
| GO:0005031 | 0.0071 | 8.5544 | 0.4002 | 3 | 23 | tumor necrosis factor-activated receptor activity |
| GO:0015450 | 0.0079 | 18.9571 | 0.1392 | 2 | 8 | P-P-bond-hydrolysis-driven protein transmembrane transporter activity |
| GO:0005070 | 0.0089 | 5.3168 | 0.8177 | 4 | 47 | SH3/SH2 adaptor activity |
| GOMFID | Pvalue | OddsRatio | ExpCount | Count | Size | Term |
| GO:0045519 | 3e-04 | Inf | 0.0364 | 2 | 2 | interleukin-23 receptor binding |
| GO:2001070 | 0.001 | 108.4982 | 0.0547 | 2 | 3 | starch binding |
| GO:0061631 | 0.0014 | 9.4878 | 0.492 | 4 | 27 | ubiquitin conjugating enzyme activity |
| GO:0061630 | 0.002 | 3.1905 | 3.3349 | 10 | 183 | ubiquitin protein ligase activity |
| GO:0004693 | 0.002 | 8.3914 | 0.5467 | 4 | 30 | cyclin-dependent protein serine/threonine kinase activity |
| GO:0008312 | 0.0065 | 21.694 | 0.1276 | 2 | 7 | 7S RNA binding |
| GO:0035184 | 0.0065 | 21.694 | 0.1276 | 2 | 7 | histone threonine kinase activity |
| GO:0046977 | 0.0065 | 21.694 | 0.1276 | 2 | 7 | TAP binding |
| GO:0047372 | 0.0065 | 21.694 | 0.1276 | 2 | 7 | acylglycerol lipase activity |
| GO:0005515 | 0.0073 | 1.3837 | 183.1807 | 203 | 10118 | protein binding |
| GO:0035591 | 0.0079 | 4.3338 | 1.2392 | 5 | 68 | signaling adaptor activity |
| GO:0005031 | 0.0081 | 8.156 | 0.4191 | 3 | 23 | tumor necrosis factor-activated receptor activity |
| GO:0030159 | 0.0081 | 8.156 | 0.4191 | 3 | 23 | receptor signaling complex scaffold activity |
| GOMFID | Pvalue | OddsRatio | ExpCount | Count | Size | Term |
| GO:0016788 | 0 | 2.6147 | 11.7166 | 28 | 671 | hydrolase activity, acting on ester bonds |
| GO:0008195 | 8e-04 | 21.3226 | 0.1921 | 3 | 11 | phosphatidate phosphatase activity |
| GO:0004082 | 0.0018 | 56.674 | 0.0698 | 2 | 4 | bisphosphoglycerate mutase activity |
| GO:0034604 | 0.0018 | 56.674 | 0.0698 | 2 | 4 | pyruvate dehydrogenase (NAD+) activity |
| GO:0046538 | 0.0018 | 56.674 | 0.0698 | 2 | 4 | 2,3-bisphosphoglycerate-dependent phosphoglycerate mutase activity |
| GO:0031434 | 0.0021 | 14.2114 | 0.2619 | 3 | 15 | mitogen-activated protein kinase kinase binding |
| GO:0005509 | 0.0028 | 2.0287 | 11.4896 | 22 | 658 | calcium ion binding |
| GO:0004083 | 0.0029 | 37.7802 | 0.0873 | 2 | 5 | bisphosphoglycerate 2-phosphatase activity |
| GO:0004738 | 0.0029 | 37.7802 | 0.0873 | 2 | 5 | pyruvate dehydrogenase activity |
| GO:0031694 | 0.0029 | 37.7802 | 0.0873 | 2 | 5 | alpha-2A adrenergic receptor binding |
| GO:0046923 | 0.0029 | 37.7802 | 0.0873 | 2 | 5 | ER retention sequence binding |
| GO:0016791 | 0.0033 | 2.7796 | 4.1825 | 11 | 242 | phosphatase activity |
| GO:0004860 | 0.0035 | 4.4026 | 1.4668 | 6 | 84 | protein kinase inhibitor activity |
| GO:0031625 | 0.0041 | 2.702 | 4.2955 | 11 | 246 | ubiquitin protein ligase binding |
| GO:0003689 | 0.006 | 22.6652 | 0.1222 | 2 | 7 | DNA clamp loader activity |
| GO:0036310 | 0.006 | 22.6652 | 0.1222 | 2 | 7 | annealing helicase activity |
| GO:0045502 | 0.0081 | 8.1161 | 0.4191 | 3 | 24 | dynein binding |
| GOMFID | Pvalue | OddsRatio | ExpCount | Count | Size | Term |
| GO:2001070 | 9e-04 | 111.6895 | 0.0531 | 2 | 3 | starch binding |
| GO:0016740 | 0.0048 | 1.5335 | 37.2909 | 53 | 2105 | transferase activity |
| GO:0046977 | 0.0062 | 22.3321 | 0.124 | 2 | 7 | TAP binding |
| GOMFID | Pvalue | OddsRatio | ExpCount | Count | Size | Term |
| GO:0050211 | 8e-04 | 121.0156 | 0.0491 | 2 | 3 | procollagen galactosyltransferase activity |
| GO:0070579 | 0.0016 | 60.5039 | 0.0655 | 2 | 4 | methylcytosine dioxygenase activity |
| GO:0015288 | 0.0038 | 30.248 | 0.0983 | 2 | 6 | porin activity |
| GO:0032027 | 0.0038 | 30.248 | 0.0983 | 2 | 6 | myosin light chain binding |
| GO:0003708 | 0.0053 | 24.1969 | 0.1147 | 2 | 7 | retinoic acid receptor activity |
| GO:0015651 | 0.0053 | 24.1969 | 0.1147 | 2 | 7 | quaternary ammonium group transmembrane transporter activity |
| GO:0016670 | 0.0053 | 24.1969 | 0.1147 | 2 | 7 | oxidoreductase activity, acting on a sulfur group of donors, oxygen as acceptor |
| GO:0008519 | 0.006 | 9.1006 | 0.3768 | 3 | 23 | ammonium transmembrane transporter activity |
| GO:0051879 | 0.006 | 9.1006 | 0.3768 | 3 | 23 | Hsp90 protein binding |
| GO:0000155 | 0.007 | 20.1628 | 0.1311 | 2 | 8 | phosphorelay sensor kinase activity |
| GO:0050308 | 0.0089 | 17.2812 | 0.1474 | 2 | 9 | sugar-phosphatase activity |
| GOMFID | Pvalue | OddsRatio | ExpCount | Count | Size | Term |
| GO:0003954 | 5e-04 | 8.8036 | 0.6555 | 5 | 37 | NADH dehydrogenase activity |
| GO:0008137 | 5e-04 | 8.8036 | 0.6555 | 5 | 37 | NADH dehydrogenase (ubiquinone) activity |
| GO:0015226 | 9e-04 | 111.6895 | 0.0531 | 2 | 3 | carnitine transmembrane transporter activity |
| GO:0034604 | 0.0018 | 55.8412 | 0.0709 | 2 | 4 | pyruvate dehydrogenase (NAD+) activity |
| GO:0016655 | 0.002 | 6.1187 | 0.9035 | 5 | 51 | oxidoreductase activity, acting on NAD(P)H, quinone or similar compound as acceptor |
| GO:0004738 | 0.003 | 37.225 | 0.0886 | 2 | 5 | pyruvate dehydrogenase activity |
| GO:0046923 | 0.003 | 37.225 | 0.0886 | 2 | 5 | ER retention sequence binding |
| GO:0022891 | 0.0039 | 1.8575 | 14.8278 | 26 | 837 | substrate-specific transmembrane transporter activity |
| GO:0008046 | 0.0045 | 27.917 | 0.1063 | 2 | 6 | axon guidance receptor activity |
| GO:0015288 | 0.0045 | 27.917 | 0.1063 | 2 | 6 | porin activity |
| GO:0032027 | 0.0045 | 27.917 | 0.1063 | 2 | 6 | myosin light chain binding |
| GO:0015651 | 0.0062 | 22.3321 | 0.124 | 2 | 7 | quaternary ammonium group transmembrane transporter activity |
| GOMFID | Pvalue | OddsRatio | ExpCount | Count | Size | Term |
| GO:0004364 | 8e-04 | 11.0289 | 0.4276 | 4 | 26 | glutathione transferase activity |
| GO:0016773 | 0.0037 | 2.0112 | 11.0514 | 21 | 672 | phosphotransferase activity, alcohol group as acceptor |
| GO:0035242 | 0.0054 | 24.1012 | 0.1151 | 2 | 7 | protein-arginine omega-N asymmetric methyltransferase activity |
| GO:0008469 | 0.0071 | 20.083 | 0.1316 | 2 | 8 | histone-arginine N-methyltransferase activity |
| GO:0031995 | 0.0071 | 20.083 | 0.1316 | 2 | 8 | insulin-like growth factor II binding |
| GO:0016273 | 0.009 | 17.2129 | 0.148 | 2 | 9 | arginine N-methyltransferase activity |
| GO:0031994 | 0.009 | 17.2129 | 0.148 | 2 | 9 | insulin-like growth factor I binding |
| GO:0016301 | 0.0096 | 1.8341 | 12.0381 | 21 | 732 | kinase activity |
| GOMFID | Pvalue | OddsRatio | ExpCount | Count | Size | Term |
| GO:0003823 | 0.0022 | 4.8573 | 1.3396 | 6 | 77 | antigen binding |
| GO:0005488 | 0.0048 | 1.6759 | 225.8984 | 241 | 13210 | binding |
| GO:0046977 | 0.006 | 22.75 | 0.1218 | 2 | 7 | TAP binding |
| GO:0070097 | 0.006 | 22.75 | 0.1218 | 2 | 7 | delta-catenin binding |
| GO:0005031 | 0.0071 | 8.5544 | 0.4002 | 3 | 23 | tumor necrosis factor-activated receptor activity |
| GO:1990459 | 0.0079 | 18.9571 | 0.1392 | 2 | 8 | transferrin receptor binding |
| GO:0016740 | 0.0084 | 1.4943 | 36.6226 | 51 | 2105 | transferase activity |
| GO:0008080 | 0.0093 | 4.1501 | 1.2874 | 5 | 74 | N-acetyltransferase activity |
| GOMFID | Pvalue | OddsRatio | ExpCount | Count | Size | Term |
| GO:0031625 | 3e-04 | 3.3496 | 4.1706 | 13 | 246 | ubiquitin protein ligase binding |
| GO:0004364 | 9e-04 | 10.6879 | 0.4408 | 4 | 26 | glutathione transferase activity |
| GO:0034604 | 0.0017 | 58.4151 | 0.0678 | 2 | 4 | pyruvate dehydrogenase (NAD+) activity |
| GO:0004430 | 0.0028 | 38.9409 | 0.0848 | 2 | 5 | 1-phosphatidylinositol 4-kinase activity |
| GO:0004738 | 0.0028 | 38.9409 | 0.0848 | 2 | 5 | pyruvate dehydrogenase activity |
| GO:0046912 | 0.0028 | 38.9409 | 0.0848 | 2 | 5 | transferase activity, transferring acyl groups, acyl groups converted into alkyl on transfer |
| GO:0004716 | 0.0095 | 16.6846 | 0.1526 | 2 | 9 | receptor signaling protein tyrosine kinase activity |
| GO:0016668 | 0.0095 | 16.6846 | 0.1526 | 2 | 9 | oxidoreductase activity, acting on a sulfur group of donors, NAD(P) as acceptor |
| GO:0070410 | 0.0095 | 16.6846 | 0.1526 | 2 | 9 | co-SMAD binding |
| GOMFID | Pvalue | OddsRatio | ExpCount | Count | Size | Term |
| GO:0031800 | 0.001 | 108.8873 | 0.0545 | 2 | 3 | type 3 metabotropic glutamate receptor binding |
| GO:0031997 | 0.001 | 108.8873 | 0.0545 | 2 | 3 | N-terminal myristoylation domain binding |
| GO:0015186 | 0.0032 | 36.2911 | 0.0908 | 2 | 5 | L-glutamine transmembrane transporter activity |
| GO:0019209 | 0.004 | 5.1736 | 1.0533 | 5 | 58 | kinase activator activity |
| GO:0043539 | 0.0046 | 10.2343 | 0.345 | 3 | 19 | protein serine/threonine kinase activator activity |
| GO:0071889 | 0.0054 | 9.6317 | 0.3632 | 3 | 20 | 14-3-3 protein binding |
| GO:0015180 | 0.0065 | 21.7718 | 0.1271 | 2 | 7 | L-alanine transmembrane transporter activity |
| GO:0015193 | 0.0065 | 21.7718 | 0.1271 | 2 | 7 | L-proline transmembrane transporter activity |
| GO:0008139 | 0.0071 | 8.6167 | 0.3995 | 3 | 22 | nuclear localization sequence binding |
| GO:0001222 | 0.0086 | 18.142 | 0.1453 | 2 | 8 | transcription corepressor binding |
| GO:0072542 | 0.0086 | 18.142 | 0.1453 | 2 | 8 | protein phosphatase activator activity |
| GO:0019887 | 0.0089 | 2.8987 | 2.9056 | 8 | 160 | protein kinase regulator activity |
| GOMFID | Pvalue | OddsRatio | ExpCount | Count | Size | Term |
| GO:0015144 | 0.002 | 8.2843 | 0.5445 | 4 | 35 | carbohydrate transmembrane transporter activity |
| GO:0010521 | 0.0063 | 21.2593 | 0.1245 | 2 | 8 | telomerase inhibitor activity |
| GO:0022857 | 0.0086 | 1.7811 | 14.2342 | 24 | 915 | transmembrane transporter activity |
| GOMFID | Pvalue | OddsRatio | ExpCount | Count | Size | Term |
| GO:0016772 | 5e-04 | 2.4066 | 9.5234 | 21 | 872 | transferase activity, transferring phosphorus-containing groups |
| GO:0004672 | 0.0015 | 2.5908 | 6.2142 | 15 | 569 | protein kinase activity |
| GO:0005509 | 0.0023 | 2.386 | 7.1862 | 16 | 658 | calcium ion binding |
| GO:0043167 | 0.0028 | 1.5535 | 62.8522 | 81 | 5755 | ion binding |
| GO:0031681 | 0.0041 | 26.1681 | 0.0983 | 2 | 9 | G-protein beta-subunit binding |
| GO:0043422 | 0.005 | 22.8956 | 0.1092 | 2 | 10 | protein kinase B binding |
| GO:0005524 | 0.0051 | 1.8423 | 15.2789 | 26 | 1399 | ATP binding |
| GO:0001618 | 0.0062 | 5.8632 | 0.7317 | 4 | 67 | virus receptor activity |
| GO:0030554 | 0.0074 | 1.7823 | 15.7376 | 26 | 1441 | adenyl nucleotide binding |
| GO:0032553 | 0.0093 | 1.6844 | 19.2871 | 30 | 1766 | ribonucleotide binding |
| GOMFID | Pvalue | OddsRatio | ExpCount | Count | Size | Term |
| GO:0047961 | 0.0015 | 63.0041 | 0.063 | 2 | 4 | glycine N-acyltransferase activity |
| GO:0030515 | 0.0069 | 8.6154 | 0.3937 | 3 | 25 | snoRNA binding |
| GO:0009931 | 0.0083 | 17.9954 | 0.1417 | 2 | 9 | calcium-dependent protein serine/threonine kinase activity |
| GO:0051059 | 0.0095 | 7.5801 | 0.4409 | 3 | 28 | NF-kappaB binding |
| GOMFID | Pvalue | OddsRatio | ExpCount | Count | Size | Term |
| GO:0001850 | 2e-04 | Inf | 0.0301 | 2 | 2 | complement component C3a binding |
| GO:0051747 | 2e-04 | Inf | 0.0301 | 2 | 2 | cytosine C-5 DNA demethylase activity |
| GO:0044822 | 4e-04 | 2.0633 | 16.8995 | 32 | 1123 | poly(A) RNA binding |
| GO:0043734 | 7e-04 | 132.0085 | 0.0451 | 2 | 3 | DNA-N1-methyladenine dioxygenase activity |
| GO:0047961 | 0.0013 | 66 | 0.0602 | 2 | 4 | glycine N-acyltransferase activity |
| GO:0070051 | 0.0013 | 66 | 0.0602 | 2 | 4 | fibrinogen binding |
| GO:0016504 | 0.002 | 8.3047 | 0.5417 | 4 | 36 | peptidase activator activity |
| GO:0008526 | 0.0033 | 32.9957 | 0.0903 | 2 | 6 | phosphatidylinositol transporter activity |
| GO:0008198 | 0.0037 | 11.0356 | 0.316 | 3 | 21 | ferrous iron binding |
| GO:0046977 | 0.0045 | 26.3949 | 0.1053 | 2 | 7 | TAP binding |
| GO:0008022 | 0.006 | 3.1157 | 2.7087 | 8 | 180 | protein C-terminus binding |
| GO:0016747 | 0.0068 | 3.0441 | 2.7689 | 8 | 184 | transferase activity, transferring acyl groups other than amino-acyl groups |
| GO:0019903 | 0.0085 | 3.6038 | 1.7607 | 6 | 117 | protein phosphatase binding |
| GO:0043422 | 0.0094 | 16.4936 | 0.1505 | 2 | 10 | protein kinase B binding |
| GO:0016779 | 0.01 | 3.4776 | 1.8209 | 6 | 121 | nucleotidyltransferase activity |
| GOMFID | Pvalue | OddsRatio | ExpCount | Count | Size | Term |
| GO:0061631 | 5e-04 | 12.4847 | 0.3772 | 4 | 27 | ubiquitin conjugating enzyme activity |
| GO:0032813 | 0.0032 | 7.1708 | 0.6146 | 4 | 44 | tumor necrosis factor receptor superfamily binding |
| GO:0030507 | 0.0049 | 9.7447 | 0.3492 | 3 | 25 | spectrin binding |
| GOMFID | Pvalue | OddsRatio | ExpCount | Count | Size | Term |
| GO:0001850 | 3e-04 | Inf | 0.0334 | 2 | 2 | complement component C3a binding |
| GO:0005166 | 0.0016 | 59.3257 | 0.0668 | 2 | 4 | neurotrophin p75 receptor binding |
| GO:0051219 | 0.0024 | 5.8653 | 0.9352 | 5 | 56 | phosphoprotein binding |
| GO:0050815 | 0.0027 | 39.5479 | 0.0835 | 2 | 5 | phosphoserine binding |
| GO:0003723 | 0.0034 | 1.6777 | 24.9657 | 39 | 1495 | RNA binding |
| GO:0043325 | 0.0037 | 11.1562 | 0.3173 | 3 | 19 | phosphatidylinositol-3,4-bisphosphate binding |
| GO:0004652 | 0.0073 | 19.7701 | 0.1336 | 2 | 8 | polynucleotide adenylyltransferase activity |
| GO:0003887 | 0.009 | 7.7574 | 0.4342 | 3 | 26 | DNA-directed DNA polymerase activity |
| GO:0005388 | 0.0093 | 16.9447 | 0.1503 | 2 | 9 | calcium-transporting ATPase activity |
| GO:0046933 | 0.0093 | 16.9447 | 0.1503 | 2 | 9 | proton-transporting ATP synthase activity, rotational mechanism |
| GOMFID | Pvalue | OddsRatio | ExpCount | Count | Size | Term |
| GO:0005515 | 0.0061 | 1.437 | 156.2242 | 175 | 10125 | protein binding |
| GO:0000150 | 0.0062 | 21.4385 | 0.1234 | 2 | 8 | recombinase activity |
| GO:0016861 | 0.0062 | 21.4385 | 0.1234 | 2 | 8 | intramolecular oxidoreductase activity, interconverting aldoses and ketoses |
| GO:0036442 | 0.0065 | 8.7977 | 0.3857 | 3 | 25 | hydrogen-exporting ATPase activity |
| GO:0016853 | 0.0078 | 3.2555 | 2.2681 | 7 | 147 | isomerase activity |
| GO:0009931 | 0.0079 | 18.3746 | 0.1389 | 2 | 9 | calcium-dependent protein serine/threonine kinase activity |
| GOMFID | Pvalue | OddsRatio | ExpCount | Count | Size | Term |
| GO:0004471 | 9e-04 | 110.4714 | 0.0537 | 2 | 3 | malate dehydrogenase (decarboxylating) (NAD+) activity |
| GO:0008948 | 0.0019 | 55.2321 | 0.0716 | 2 | 4 | oxaloacetate decarboxylase activity |
| GO:0016615 | 0.0063 | 22.0886 | 0.1253 | 2 | 7 | malate dehydrogenase activity |
| GO:0016812 | 0.0063 | 22.0886 | 0.1253 | 2 | 7 | hydrolase activity, acting on carbon-nitrogen (but not peptide) bonds, in cyclic amides |
| GO:0070679 | 0.0083 | 18.406 | 0.1432 | 2 | 8 | inositol 1,4,5 trisphosphate binding |
| GOMFID | Pvalue | OddsRatio | ExpCount | Count | Size | Term |
| GO:0004483 | 3e-04 | Inf | 0.0368 | 2 | 2 | mRNA (nucleoside-2'-O-)-methyltransferase activity |
| GO:0035254 | 0.0034 | 7.193 | 0.6261 | 4 | 34 | glutamate receptor binding |
| GO:0005168 | 0.0067 | 21.4639 | 0.1289 | 2 | 7 | neurotrophin TRKA receptor binding |
| GO:0008173 | 0.0073 | 5.6757 | 0.7734 | 4 | 42 | RNA methyltransferase activity |
| GO:0043167 | 0.0086 | 1.3417 | 105.9718 | 126 | 5755 | ion binding |
| GO:0046030 | 0.0088 | 17.8854 | 0.1473 | 2 | 8 | inositol trisphosphate phosphatase activity |
| GOMFID | Pvalue | OddsRatio | ExpCount | Count | Size | Term |
| GO:0015238 | 0.0011 | 17.7936 | 0.2105 | 3 | 15 | drug transmembrane transporter activity |
| GO:0044822 | 0.0081 | 1.754 | 15.7587 | 26 | 1123 | poly(A) RNA binding |
| GO:0034450 | 0.0099 | 15.7473 | 0.1544 | 2 | 11 | ubiquitin-ubiquitin ligase activity |
| GOMFID | Pvalue | OddsRatio | ExpCount | Count | Size | Term |
| GO:0045569 | 0.0013 | 67.1602 | 0.0592 | 2 | 4 | TRAIL binding |
| GO:0004468 | 0.0021 | 44.7706 | 0.074 | 2 | 5 | lysine N-acetyltransferase activity, acting on acetyl phosphate as donor |
| GO:0001530 | 0.0035 | 11.2304 | 0.3107 | 3 | 21 | lipopolysaccharide binding |
| GO:0015279 | 0.0091 | 16.7835 | 0.1479 | 2 | 10 | store-operated calcium channel activity |
| GOMFID | Pvalue | OddsRatio | ExpCount | Count | Size | Term |
| GO:0000309 | 8e-04 | 117.2879 | 0.0507 | 2 | 3 | nicotinamide-nucleotide adenylyltransferase activity |
| GO:0005119 | 8e-04 | 117.2879 | 0.0507 | 2 | 3 | smoothened binding |
| GO:0097108 | 8e-04 | 117.2879 | 0.0507 | 2 | 3 | hedgehog family protein binding |
| GO:0045296 | 0.0012 | 9.834 | 0.4729 | 4 | 28 | cadherin binding |
| GO:0004515 | 0.0017 | 58.6402 | 0.0676 | 2 | 4 | nicotinate-nucleotide adenylyltransferase activity |
| GO:0017025 | 0.0038 | 11.0269 | 0.3209 | 3 | 19 | TBP-class protein binding |
| GO:0036402 | 0.0041 | 29.3163 | 0.1013 | 2 | 6 | proteasome-activating ATPase activity |
| GO:0001530 | 0.0051 | 9.8004 | 0.3547 | 3 | 21 | lipopolysaccharide binding |
| GO:0017091 | 0.0066 | 8.8192 | 0.3885 | 3 | 23 | AU-rich element binding |
| GO:0003688 | 0.0095 | 16.7489 | 0.152 | 2 | 9 | DNA replication origin binding |
| GO:0008158 | 0.0095 | 16.7489 | 0.152 | 2 | 9 | hedgehog receptor activity |
| GOMFID | Pvalue | OddsRatio | ExpCount | Count | Size | Term |
| GO:0003708 | 0.005 | 25.0931 | 0.1107 | 2 | 7 | retinoic acid receptor activity |
| GO:0008061 | 0.0065 | 20.9096 | 0.1265 | 2 | 8 | chitin binding |
| GO:0070181 | 0.0065 | 20.9096 | 0.1265 | 2 | 8 | small ribosomal subunit rRNA binding |
| GO:0015405 | 0.0074 | 3.7274 | 1.7075 | 6 | 108 | P-P-bond-hydrolysis-driven transmembrane transporter activity |
| GO:0004176 | 0.0083 | 17.9213 | 0.1423 | 2 | 9 | ATP-dependent peptidase activity |
| GOMFID | Pvalue | OddsRatio | ExpCount | Count | Size | Term |
| GO:0004647 | 0.001 | 106.5931 | 0.0556 | 2 | 3 | phosphoserine phosphatase activity |
| GO:0016972 | 0.002 | 53.2931 | 0.0742 | 2 | 4 | thiol oxidase activity |
| GO:0008083 | 0.0021 | 3.4057 | 2.8182 | 9 | 152 | growth factor activity |
| GO:0016627 | 0.0037 | 5.2627 | 1.0383 | 5 | 56 | oxidoreductase activity, acting on the CH-CH group of donors |
| GO:0019899 | 0.0048 | 1.5812 | 30.4441 | 45 | 1642 | enzyme binding |
| GO:0003899 | 0.0068 | 5.7883 | 0.7602 | 4 | 41 | DNA-directed RNA polymerase activity |
| GO:0051537 | 0.0075 | 8.4345 | 0.4079 | 3 | 22 | 2 iron, 2 sulfur cluster binding |
| GO:0004725 | 0.0085 | 3.6225 | 1.7614 | 6 | 95 | protein tyrosine phosphatase activity |
| GO:0030552 | 0.0085 | 8.0123 | 0.4264 | 3 | 23 | cAMP binding |
| GO:0072542 | 0.0089 | 17.7598 | 0.1483 | 2 | 8 | protein phosphatase activator activity |
| GOMFID | Pvalue | OddsRatio | ExpCount | Count | Size | Term |
| GO:0047961 | 0 | 162.1573 | 0.0734 | 3 | 4 | glycine N-acyltransferase activity |
| GO:0019238 | 0.0032 | 35.9048 | 0.0918 | 2 | 5 | cyclohydrolase activity |
| GO:0035252 | 0.0032 | 35.9048 | 0.0918 | 2 | 5 | UDP-xylosyltransferase activity |
| GO:0043022 | 0.006 | 6.0133 | 0.734 | 4 | 40 | ribosome binding |
| GO:0019957 | 0.0066 | 21.5401 | 0.1285 | 2 | 7 | C-C chemokine binding |
| GO:0072509 | 0.0073 | 3.007 | 2.8076 | 8 | 153 | divalent inorganic cation transmembrane transporter activity |
| GO:0001222 | 0.0087 | 17.9489 | 0.1468 | 2 | 8 | transcription corepressor binding |
| NA. |
| n/a |
| NA. |
| n/a |
| NA. |
| n/a |
| NA. |
| n/a |
| NA. |
| n/a |
| NA. |
| n/a |
| NA. |
| n/a |
| NA. |
| n/a |
| NA. |
| n/a |
| NA. |
| n/a |
| NA. |
| n/a |
| NA. |
| n/a |
| NA. |
| n/a |
| NA. |
| n/a |
| NA. |
| n/a |
| NA. |
| n/a |
| NA. |
| n/a |
| NA. |
| n/a |
| NA. |
| n/a |
| NA. |
| n/a |
| NA. |
| n/a |
| NA. |
| n/a |
| NA. |
| n/a |
| NA. |
| n/a |
| NA. |
| n/a |
| NA. |
| n/a |
| NA. |
| n/a |
| NA. |
| n/a |
| NA. |
| n/a |
| NA. |
| n/a |
| NA. |
| n/a |
| NA. |
| n/a |
| NA. |
| n/a |
| NA. |
| n/a |
| NA. |
| n/a |
| NA. |
| n/a |
| NA. |
| n/a |
| NA. |
| n/a |
| NA. |
| n/a |
| NA. |
| n/a |
| NA. |
| n/a |
| NA. |
| n/a |
| NA. |
| n/a |
| NA. |
| n/a |
| NA. |
| n/a |
| NA. |
| n/a |
| NA. |
| n/a |
| NA. |
| n/a |
| NA. |
| n/a |
| NA. |
| n/a |
| NA. |
| n/a |
| NA. |
| n/a |
| NA. |
| n/a |
| NA. |
| n/a |
| NA. |
| n/a |
| NA. |
| n/a |
| NA. |
| n/a |
| NA. |
| n/a |
| NA. |
| n/a |
| NA. |
| n/a |
| NA. |
| n/a |
| NA. |
| n/a |
| NA. |
| n/a |
| NA. |
| n/a |
| NA. |
| n/a |
| NA. |
| n/a |
| NA. |
| n/a |
| NA. |
| n/a |
| NA. |
| n/a |
| NA. |
| n/a |
| NA. |
| n/a |
| NA. |
| n/a |
| NA. |
| n/a |
| NA. |
| n/a |
| NA. |
| n/a |
| NA. |
| n/a |
| NA. |
| n/a |
| NA. |
| n/a |
| NA. |
| n/a |
| NA. |
| n/a |
| NA. |
| n/a |
| NA. |
| n/a |
| NA. |
| n/a |
| NA. |
| n/a |
| NA. |
| n/a |
| NA. |
| n/a |
| NA. |
| n/a |
| NA. |
| n/a |
| NA. |
| n/a |
| NA. |
| n/a |
| NA. |
| n/a |
| NA. |
| n/a |
| NA. |
| n/a |
| NA. |
| n/a |
| NA. |
| n/a |
| NA. |
| n/a |
| NA. |
| n/a |
| NA. |
| n/a |
| NA. |
| n/a |
| NA. |
| n/a |
| NA. |
| n/a |
| NA. |
| n/a |
| NA. |
| n/a |
| NA. |
| n/a |
| NA. |
| n/a |
| NA. |
| n/a |
| NA. |
| n/a |
| NA. |
| n/a |
| NA. |
| n/a |
| NA. |
| n/a |
| NA. |
| n/a |
| NA. |
| n/a |
| NA. |
| n/a |
| NA. |
| n/a |
| NA. |
| n/a |
| NA. |
| n/a |
| NA. |
| n/a |
| NA. |
| n/a |
| NA. |
| n/a |
| NA. |
| n/a |
| NA. |
| n/a |
| NA. |
| n/a |
| NA. |
| n/a |
| NA. |
| n/a |
| NA. |
| n/a |
| NA. |
| n/a |
| NA. |
| n/a |
| NA. |
| n/a |
| NA. |
| n/a |
| NA. |
| n/a |
| NA. |
| n/a |
| NA. |
| n/a |
| NA. |
| n/a |
| NA. |
| n/a |
| NA. |
| n/a |
| NA. |
| n/a |
| NA. |
| n/a |
| NA. |
| n/a |
| NA. |
| n/a |
| NA. |
| n/a |
| NA. |
| n/a |
| NA. |
| n/a |
| NA. |
| n/a |
| NA. |
| n/a |
| NA. |
| n/a |
| NA. |
| n/a |
| NA. |
| n/a |
| NA. |
| n/a |
| NA. |
| n/a |
| NA. |
| n/a |
| NA. |
| n/a |
| NA. |
| n/a |
| NA. |
| n/a |
| NA. |
| n/a |
| NA. |
| n/a |
| NA. |
| n/a |
| NA. |
| n/a |
| NA. |
| n/a |
| NA. |
| n/a |
| NA. |
| n/a |
| NA. |
| n/a |
| NA. |
| n/a |
| NA. |
| n/a |
| NA. |
| n/a |
| NA. |
| n/a |
| NA. |
| n/a |
| NA. |
| n/a |
| NA. |
| n/a |
| NA. |
| n/a |
| NA. |
| n/a |
| NA. |
| n/a |
| NA. |
| n/a |
| NA. |
| n/a |
| NA. |
| n/a |
| NA. |
| n/a |
| NA. |
| n/a |
| NA. |
| n/a |
| NA. |
| n/a |
| NA. |
| n/a |
| NA. |
| n/a |
| NA. |
| n/a |
| NA. |
| n/a |
| NA. |
| n/a |
| NA. |
| n/a |
| NA. |
| n/a |
| NA. |
| n/a |
| NA. |
| n/a |
| NA. |
| n/a |
| NA. |
| n/a |
| NA. |
| n/a |
| NA. |
| n/a |
| NA. |
| n/a |
| NA. |
| n/a |
| NA. |
| n/a |
| NA. |
| n/a |
| NA. |
| n/a |
| NA. |
| n/a |
| NA. |
| n/a |
| NA. |
| n/a |
| NA. |
| n/a |
| NA. |
| n/a |
| NA. |
| n/a |
| NA. |
| n/a |
| NA. |
| n/a |
| NA. |
| n/a |
| NA. |
| n/a |
| NA. |
| n/a |
| NA. |
| n/a |
| NA. |
| n/a |
| NA. |
| n/a |
| NA. |
| n/a |
| NA. |
| n/a |
| NA. |
| n/a |
| NA. |
| n/a |
| NA. |
| n/a |
| NA. |
| n/a |
| NA. |
| n/a |
| NA. |
| n/a |
| NA. |
| n/a |
| NA. |
| n/a |
| NA. |
| n/a |
| NA. |
| n/a |
| NA. |
| n/a |
| NA. |
| n/a |
| NA. |
| n/a |
| NA. |
| n/a |
| NA. |
| n/a |
| NA. |
| n/a |
| NA. |
| n/a |
| NA. |
| n/a |
| NA. |
| n/a |
| NA. |
| n/a |
| NA. |
| n/a |
| NA. |
| n/a |
| NA. |
| n/a |
| NA. |
| n/a |
| NA. |
| n/a |
| NA. |
| n/a |
| NA. |
| n/a |
| NA. |
| n/a |
| GOMFID | Pvalue | OddsRatio | ExpCount | Count | Size | Term |
| GO:0006891 | 5e-04 | 8.4539 | 0.6709 | 5 | 43 | intra-Golgi vesicle-mediated transport |
| GO:0070966 | 7e-04 | 127.2181 | 0.0468 | 2 | 3 | nuclear-transcribed mRNA catabolic process, no-go decay |
| GO:0042742 | 9e-04 | 3.3016 | 3.5573 | 11 | 228 | defense response to bacterium |
| GO:0071025 | 0.0012 | 17.4083 | 0.2184 | 3 | 14 | RNA surveillance |
| GO:0016557 | 0.0014 | 63.6049 | 0.0624 | 2 | 4 | peroxisome membrane biogenesis |
| GO:0009607 | 0.0014 | 1.9916 | 14.5412 | 27 | 932 | response to biotic stimulus |
| GO:0032735 | 0.0019 | 8.5355 | 0.5305 | 4 | 34 | positive regulation of interleukin-12 production |
| GO:0032747 | 0.0024 | 42.4005 | 0.078 | 2 | 5 | positive regulation of interleukin-23 production |
| GO:0051135 | 0.0024 | 42.4005 | 0.078 | 2 | 5 | positive regulation of NK T cell activation |
| GO:0000042 | 0.0026 | 12.7628 | 0.2808 | 3 | 18 | protein targeting to Golgi |
| GO:0042773 | 0.0026 | 5.7299 | 0.9517 | 5 | 61 | ATP synthesis coupled electron transport |
| GO:0042508 | 0.003 | 11.9644 | 0.2964 | 3 | 19 | tyrosine phosphorylation of Stat1 protein |
| GO:0032755 | 0.0034 | 5.3465 | 1.0141 | 5 | 65 | positive regulation of interleukin-6 production |
| GO:0044829 | 0.0035 | 31.7984 | 0.0936 | 2 | 6 | positive regulation by host of viral genome replication |
| GO:0051707 | 0.0035 | 1.9031 | 13.9795 | 25 | 896 | response to other organism |
| GO:0042506 | 0.0067 | 8.698 | 0.3901 | 3 | 25 | tyrosine phosphorylation of Stat5 protein |
| GO:0031424 | 0.0071 | 5.6848 | 0.7645 | 4 | 49 | keratinization |
| GO:0006122 | 0.0081 | 18.167 | 0.1404 | 2 | 9 | mitochondrial electron transport, ubiquinol to cytochrome c |
| GO:0042104 | 0.0083 | 7.9721 | 0.4213 | 3 | 27 | positive regulation of activated T cell proliferation |
| GOMFID | Pvalue | OddsRatio | ExpCount | Count | Size | Term |
| GO:0070458 | 0 | Inf | 0.0516 | 3 | 3 | cellular detoxification of nitrogen compound |
| GO:0018916 | 0 | 173.3933 | 0.0688 | 3 | 4 | nitrobenzene metabolic process |
| GO:0010467 | 1e-04 | 1.5977 | 86.1256 | 115 | 5009 | gene expression |
| GO:0006725 | 2e-04 | 1.5689 | 94.4132 | 123 | 5491 | cellular aromatic compound metabolic process |
| GO:1901360 | 3e-04 | 1.5459 | 98.0755 | 126 | 5704 | organic cyclic compound metabolic process |
| GO:0050873 | 5e-04 | 8.5455 | 0.6706 | 5 | 39 | brown fat cell differentiation |
| GO:0034641 | 5e-04 | 1.9547 | 21.4517 | 37 | 1401 | cellular nitrogen compound metabolic process |
| GO:0042178 | 6e-04 | 24.7608 | 0.1719 | 3 | 10 | xenobiotic catabolic process |
| GO:0046483 | 6e-04 | 1.5064 | 94.1037 | 120 | 5473 | heterocycle metabolic process |
| GO:0090304 | 9e-04 | 1.5034 | 81.6035 | 106 | 4746 | nucleic acid metabolic process |
| GO:0072657 | 0.0013 | 2.3783 | 8.0469 | 18 | 468 | protein localization to membrane |
| GO:0000956 | 0.0015 | 3.3151 | 3.2153 | 10 | 187 | nuclear-transcribed mRNA catabolic process |
| GO:0070673 | 0.0017 | 57.5784 | 0.0688 | 2 | 4 | response to interleukin-18 |
| GO:0006614 | 0.0019 | 4.2972 | 1.7538 | 7 | 102 | SRP-dependent cotranslational protein targeting to membrane |
| GO:0043488 | 0.0023 | 3.68 | 2.3212 | 8 | 135 | regulation of mRNA stability |
| GO:0098754 | 0.0025 | 4.7171 | 1.3755 | 6 | 80 | detoxification |
| GO:0070671 | 0.0028 | 38.3831 | 0.086 | 2 | 5 | response to interleukin-12 |
| GO:0072599 | 0.0029 | 3.9614 | 1.8914 | 7 | 110 | establishment of protein localization to endoplasmic reticulum |
| GO:0006415 | 0.003 | 3.2304 | 2.9574 | 9 | 172 | translational termination |
| GO:0043043 | 0.0031 | 2.0459 | 10.8667 | 21 | 632 | peptide biosynthetic process |
| GO:1901576 | 0.0032 | 1.4134 | 100.7922 | 123 | 5862 | organic substance biosynthetic process |
| GO:0016259 | 0.0032 | 4.4741 | 1.4443 | 6 | 84 | selenocysteine metabolic process |
| GO:0045986 | 0.0034 | 11.5491 | 0.3095 | 3 | 18 | negative regulation of smooth muscle contraction |
| GO:0070459 | 0.0042 | 28.7854 | 0.1032 | 2 | 6 | prolactin secretion |
| GO:0031649 | 0.0046 | 10.189 | 0.3439 | 3 | 20 | heat generation |
| GO:0006413 | 0.0049 | 2.6329 | 4.4017 | 11 | 256 | translational initiation |
| GO:0042254 | 0.005 | 2.7747 | 3.7999 | 10 | 221 | ribosome biogenesis |
| GO:0032755 | 0.0052 | 4.8343 | 1.1176 | 5 | 65 | positive regulation of interleukin-6 production |
| GO:0000027 | 0.0053 | 9.6223 | 0.3611 | 3 | 21 | ribosomal large subunit assembly |
| GO:0034645 | 0.0054 | 1.4103 | 76.5607 | 96 | 4547 | cellular macromolecule biosynthetic process |
| GO:1903146 | 0.0057 | 6.0922 | 0.7222 | 4 | 42 | regulation of mitophagy |
| GO:0044271 | 0.0057 | 1.3992 | 78.4742 | 98 | 4564 | cellular nitrogen compound biosynthetic process |
| GO:0060406 | 0.0058 | 23.0269 | 0.1204 | 2 | 7 | positive regulation of penile erection |
| GO:0030279 | 0.0059 | 4.6777 | 1.152 | 5 | 67 | negative regulation of ossification |
| GO:0009110 | 0.0061 | 9.1153 | 0.3783 | 3 | 22 | vitamin biosynthetic process |
| GO:0032774 | 0.0063 | 1.4219 | 62.0022 | 80 | 3606 | RNA biosynthetic process |
| GO:0051171 | 0.0065 | 1.4047 | 69.4644 | 88 | 4040 | regulation of nitrogen compound metabolic process |
| GO:0006401 | 0.0068 | 2.6474 | 3.9719 | 10 | 231 | RNA catabolic process |
| GO:0045672 | 0.0069 | 8.659 | 0.3955 | 3 | 23 | positive regulation of osteoclast differentiation |
| GO:0044238 | 0.007 | 1.391 | 167.282 | 187 | 9729 | primary metabolic process |
| GO:0007620 | 0.0078 | 8.2461 | 0.4127 | 3 | 24 | copulation |
| GO:0043603 | 0.0081 | 1.7454 | 15.7155 | 26 | 914 | cellular amide metabolic process |
| GO:0090002 | 0.0082 | 3.2334 | 2.2868 | 7 | 133 | establishment of protein localization to plasma membrane |
| GO:0032984 | 0.0083 | 2.3304 | 5.399 | 12 | 314 | macromolecular complex disassembly |
| GO:0006414 | 0.0084 | 2.7229 | 3.4732 | 9 | 202 | translational elongation |
| GO:1990778 | 0.0084 | 2.7229 | 3.4732 | 9 | 202 | protein localization to cell periphery |
| GO:0038061 | 0.0087 | 3.5933 | 1.771 | 6 | 103 | NIK/NF-kappaB signaling |
| GO:0042346 | 0.0087 | 7.8708 | 0.4299 | 3 | 25 | positive regulation of NF-kappaB import into nucleus |
| GO:0010534 | 0.0098 | 16.4456 | 0.1547 | 2 | 9 | regulation of activation of JAK2 kinase activity |
| GO:0033617 | 0.0098 | 16.4456 | 0.1547 | 2 | 9 | mitochondrial respiratory chain complex IV assembly |
| GO:0031398 | 0.0099 | 2.8429 | 2.9574 | 8 | 172 | positive regulation of protein ubiquitination |
| GOMFID | Pvalue | OddsRatio | ExpCount | Count | Size | Term |
| GO:0042255 | 0.0033 | 7.1334 | 0.6144 | 4 | 48 | ribosome assembly |
| GO:0000079 | 0.0054 | 4.7391 | 1.1264 | 5 | 88 | regulation of cyclin-dependent protein serine/threonine kinase activity |
| GO:0009301 | 0.0069 | 19.4648 | 0.128 | 2 | 10 | snRNA transcription |
| GO:0071242 | 0.0078 | 8.0841 | 0.4096 | 3 | 32 | cellular response to ammonium ion |
| GO:0042511 | 0.0083 | 17.3009 | 0.1408 | 2 | 11 | positive regulation of tyrosine phosphorylation of Stat1 protein |
| GOMFID | Pvalue | OddsRatio | ExpCount | Count | Size | Term |
| GO:0006414 | 9e-04 | 3.3112 | 3.5504 | 11 | 202 | translational elongation |
| GO:0034641 | 0.0017 | 1.4402 | 107.7776 | 132 | 6132 | cellular nitrogen compound metabolic process |
| GO:0018916 | 0.0018 | 56.2956 | 0.0703 | 2 | 4 | nitrobenzene metabolic process |
| GO:0009058 | 0.0021 | 1.4308 | 104.403 | 128 | 5940 | biosynthetic process |
| GO:0009211 | 0.003 | 37.528 | 0.0879 | 2 | 5 | pyrimidine deoxyribonucleoside triphosphate metabolic process |
| GO:0055129 | 0.003 | 37.528 | 0.0879 | 2 | 5 | L-proline biosynthetic process |
| GO:0006415 | 0.0034 | 3.1565 | 3.0231 | 9 | 172 | translational termination |
| GO:0031398 | 0.0034 | 3.1565 | 3.0231 | 9 | 172 | positive regulation of protein ubiquitination |
| GO:0043043 | 0.004 | 1.997 | 11.1082 | 21 | 632 | peptide biosynthetic process |
| GO:0070911 | 0.004 | 5.1567 | 1.0546 | 5 | 60 | global genome nucleotide-excision repair |
| GO:0009221 | 0.0044 | 28.1442 | 0.1055 | 2 | 6 | pyrimidine deoxyribonucleotide biosynthetic process |
| GO:0009249 | 0.0044 | 28.1442 | 0.1055 | 2 | 6 | protein lipoylation |
| GO:0033601 | 0.0044 | 28.1442 | 0.1055 | 2 | 6 | positive regulation of mammary gland epithelial cell proliferation |
| GO:0006364 | 0.0045 | 3.2832 | 2.5837 | 8 | 147 | rRNA processing |
| GO:1903320 | 0.0046 | 2.5326 | 4.9917 | 12 | 284 | regulation of protein modification by small protein conjugation or removal |
| GO:0032543 | 0.0046 | 3.6235 | 2.0564 | 7 | 117 | mitochondrial translation |
| GO:0097300 | 0.0057 | 6.1169 | 0.7206 | 4 | 41 | programmed necrotic cell death |
| GO:0034645 | 0.006 | 1.3995 | 77.734 | 97 | 4547 | cellular macromolecule biosynthetic process |
| GO:0009204 | 0.0061 | 22.5139 | 0.123 | 2 | 7 | deoxyribonucleoside triphosphate catabolic process |
| GO:0036297 | 0.0062 | 5.9555 | 0.7382 | 4 | 42 | interstrand cross-link repair |
| GO:0050852 | 0.0066 | 3.0608 | 2.7595 | 8 | 157 | T cell receptor signaling pathway |
| GO:0051351 | 0.0073 | 3.7451 | 1.7049 | 6 | 97 | positive regulation of ligase activity |
| GO:0016051 | 0.0074 | 2.7772 | 3.4098 | 9 | 194 | carbohydrate biosynthetic process |
| GO:0005981 | 0.008 | 18.7603 | 0.1406 | 2 | 8 | regulation of glycogen catabolic process |
| GO:0006610 | 0.008 | 18.7603 | 0.1406 | 2 | 8 | ribosomal protein import into nucleus |
| GO:0051438 | 0.0084 | 3.2114 | 2.3025 | 7 | 131 | regulation of ubiquitin-protein transferase activity |
| GO:0051437 | 0.0092 | 4.1673 | 1.2831 | 5 | 73 | positive regulation of ubiquitin-protein ligase activity involved in regulation of mitotic cell cycle transition |
| GO:0090304 | 0.0092 | 1.3611 | 83.4169 | 102 | 4746 | nucleic acid metabolic process |
| GOMFID | Pvalue | OddsRatio | ExpCount | Count | Size | Term |
| GO:0090502 | 0.0013 | 6.7734 | 0.8131 | 5 | 57 | RNA phosphodiester bond hydrolysis, endonucleolytic |
| GO:0035912 | 0.002 | 46.4745 | 0.0713 | 2 | 5 | dorsal aorta morphogenesis |
| GO:0050911 | 0.0026 | 2.6098 | 5.278 | 13 | 370 | detection of chemical stimulus involved in sensory perception of smell |
| GO:0070647 | 0.0027 | 1.9497 | 13.7227 | 25 | 962 | protein modification by small protein conjugation or removal |
| GO:0048743 | 0.0029 | 34.8536 | 0.0856 | 2 | 6 | positive regulation of skeletal muscle fiber development |
| GO:0005981 | 0.0054 | 23.2327 | 0.1141 | 2 | 8 | regulation of glycogen catabolic process |
| GO:0060947 | 0.0054 | 23.2327 | 0.1141 | 2 | 8 | cardiac vascular smooth muscle cell differentiation |
| GO:0016579 | 0.0054 | 3.9916 | 1.5977 | 6 | 112 | protein deubiquitination |
| GO:0007008 | 0.0068 | 19.9125 | 0.1284 | 2 | 9 | outer mitochondrial membrane organization |
| GO:0014060 | 0.0068 | 19.9125 | 0.1284 | 2 | 9 | regulation of epinephrine secretion |
| GO:0005979 | 0.008 | 8.068 | 0.4137 | 3 | 29 | regulation of glycogen biosynthetic process |
| GO:0043473 | 0.0081 | 4.2869 | 1.241 | 5 | 87 | pigmentation |
| GO:0071287 | 0.0085 | 17.4223 | 0.1426 | 2 | 10 | cellular response to manganese ion |
| GO:0007600 | 0.0087 | 1.8311 | 12.7099 | 22 | 891 | sensory perception |
| GO:0009952 | 0.0088 | 2.9029 | 2.8958 | 8 | 203 | anterior/posterior pattern specification |
| GO:1903533 | 0.0091 | 2.5274 | 4.1511 | 10 | 291 | regulation of protein targeting |
| GO:0009798 | 0.0093 | 4.1348 | 1.2838 | 5 | 90 | axis specification |
| GO:0044265 | 0.0095 | 1.8134 | 12.824 | 22 | 899 | cellular macromolecule catabolic process |
| GO:0042755 | 0.0096 | 7.4908 | 0.4422 | 3 | 31 | eating behavior |
| GOMFID | Pvalue | OddsRatio | ExpCount | Count | Size | Term |
| GO:0060155 | 2e-04 | 35.7591 | 0.1335 | 3 | 8 | platelet dense granule organization |
| GO:1902524 | 3e-04 | Inf | 0.0334 | 2 | 2 | positive regulation of protein K48-linked ubiquitination |
| GO:0001959 | 5e-04 | 4.2895 | 2.2691 | 9 | 136 | regulation of cytokine-mediated signaling pathway |
| GO:0006818 | 5e-04 | 4.2224 | 2.3025 | 9 | 138 | hydrogen transport |
| GO:0007006 | 8e-04 | 5.0186 | 1.5183 | 7 | 91 | mitochondrial membrane organization |
| GO:0035025 | 9e-04 | 19.861 | 0.2002 | 3 | 12 | positive regulation of Rho protein signal transduction |
| GO:0043330 | 0.0011 | 7.1331 | 0.7842 | 5 | 47 | response to exogenous dsRNA |
| GO:0016070 | 0.0011 | 1.5133 | 71.1102 | 94 | 4262 | RNA metabolic process |
| GO:0048873 | 0.0015 | 9.192 | 0.5005 | 4 | 30 | homeostasis of number of cells within a tissue |
| GO:0050689 | 0.0016 | 59.3808 | 0.0667 | 2 | 4 | negative regulation of defense response to virus by host |
| GO:0070423 | 0.0021 | 8.2395 | 0.5506 | 4 | 33 | nucleotide-binding oligomerization domain containing signaling pathway |
| GO:0048490 | 0.0022 | 13.7464 | 0.267 | 3 | 16 | anterograde synaptic vesicle transport |
| GO:0099514 | 0.0022 | 13.7464 | 0.267 | 3 | 16 | synaptic vesicle cytoskeletal transport |
| GO:2000045 | 0.0024 | 3.6528 | 2.3359 | 8 | 140 | regulation of G1/S transition of mitotic cell cycle |
| GO:0032647 | 0.0026 | 12.7637 | 0.2836 | 3 | 17 | regulation of interferon-alpha production |
| GO:0032792 | 0.0027 | 39.5846 | 0.0834 | 2 | 5 | negative regulation of CREB transcription factor activity |
| GO:0000042 | 0.0031 | 11.912 | 0.3003 | 3 | 18 | protein targeting to Golgi |
| GO:0030857 | 0.0032 | 7.2389 | 0.6173 | 4 | 37 | negative regulation of epithelial cell differentiation |
| GO:0051607 | 0.0034 | 2.5234 | 5.4392 | 13 | 326 | defense response to virus |
| GO:0009249 | 0.004 | 29.6865 | 0.1001 | 2 | 6 | protein lipoylation |
| GO:0031119 | 0.004 | 29.6865 | 0.1001 | 2 | 6 | tRNA pseudouridine synthesis |
| GO:0002719 | 0.0042 | 10.5092 | 0.3337 | 3 | 20 | negative regulation of cytokine production involved in immune response |
| GO:0097300 | 0.0047 | 6.4546 | 0.6841 | 4 | 41 | programmed necrotic cell death |
| GO:0006367 | 0.0048 | 2.6415 | 4.3881 | 11 | 263 | transcription initiation from RNA polymerase II promoter |
| GO:0001818 | 0.005 | 2.9654 | 3.2039 | 9 | 194 | negative regulation of cytokine production |
| GO:0019236 | 0.0055 | 23.7477 | 0.1168 | 2 | 7 | response to pheromone |
| GO:0032463 | 0.0055 | 23.7477 | 0.1168 | 2 | 7 | negative regulation of protein homooligomerization |
| GO:0070508 | 0.0055 | 23.7477 | 0.1168 | 2 | 7 | cholesterol import |
| GO:0032967 | 0.0056 | 9.4017 | 0.3671 | 3 | 22 | positive regulation of collagen biosynthetic process |
| GO:0006839 | 0.0058 | 2.5689 | 4.5049 | 11 | 270 | mitochondrial transport |
| GO:1902600 | 0.006 | 3.9102 | 1.6351 | 6 | 98 | hydrogen ion transmembrane transport |
| GO:0045088 | 0.006 | 2.2618 | 6.507 | 14 | 390 | regulation of innate immune response |
| GO:0042744 | 0.0064 | 8.9311 | 0.3837 | 3 | 23 | hydrogen peroxide catabolic process |
| GO:0044253 | 0.0064 | 8.9311 | 0.3837 | 3 | 23 | positive regulation of multicellular organismal metabolic process |
| GO:0006139 | 0.0065 | 1.3848 | 88.4123 | 108 | 5299 | nucleobase-containing compound metabolic process |
| GO:0098869 | 0.0079 | 4.3343 | 1.2347 | 5 | 74 | cellular oxidant detoxification |
| GO:0015980 | 0.0081 | 2.2511 | 6.0565 | 13 | 363 | energy derivation by oxidation of organic compounds |
| GO:0032635 | 0.0083 | 3.6321 | 1.7519 | 6 | 105 | interleukin-6 production |
| GO:0050709 | 0.0083 | 3.6321 | 1.7519 | 6 | 105 | negative regulation of protein secretion |
| GO:0044843 | 0.0085 | 2.5567 | 4.1044 | 10 | 246 | cell cycle G1/S phase transition |
| GO:0031424 | 0.0089 | 5.3044 | 0.8176 | 4 | 49 | keratinization |
| GO:0046785 | 0.0089 | 5.3044 | 0.8176 | 4 | 49 | microtubule polymerization |
| GO:0010467 | 0.009 | 1.3685 | 83.5737 | 102 | 5009 | gene expression |
| GO:0032494 | 0.0092 | 16.9604 | 0.1502 | 2 | 9 | response to peptidoglycan |
| GO:1901203 | 0.0092 | 16.9604 | 0.1502 | 2 | 9 | positive regulation of extracellular matrix assembly |
| GO:0009206 | 0.0096 | 5.1887 | 0.8342 | 4 | 50 | purine ribonucleoside triphosphate biosynthetic process |
| GO:0001906 | 0.0099 | 3.4901 | 1.8186 | 6 | 109 | cell killing |
| GOMFID | Pvalue | OddsRatio | ExpCount | Count | Size | Term |
| GO:0044033 | 0 | 3.6241 | 4.5083 | 15 | 207 | multi-organism metabolic process |
| GO:0006807 | 2e-04 | 1.4947 | 139.7576 | 173 | 6417 | nitrogen compound metabolic process |
| GO:0006413 | 2e-04 | 3.0922 | 5.5755 | 16 | 256 | translational initiation |
| GO:0070534 | 4e-04 | 7.2007 | 0.9583 | 6 | 44 | protein K63-linked ubiquitination |
| GO:0006614 | 4e-04 | 4.4371 | 2.2215 | 9 | 102 | SRP-dependent cotranslational protein targeting to membrane |
| GO:0006415 | 4e-04 | 3.4548 | 3.746 | 12 | 172 | translational termination |
| GO:1903902 | 4e-04 | 4.3896 | 2.2433 | 9 | 103 | positive regulation of viral life cycle |
| GO:0072599 | 7e-04 | 4.0835 | 2.3957 | 9 | 110 | establishment of protein localization to endoplasmic reticulum |
| GO:0043488 | 7e-04 | 3.6713 | 2.9402 | 10 | 135 | regulation of mRNA stability |
| GO:0033182 | 0.0011 | 19.4109 | 0.2178 | 3 | 10 | regulation of histone ubiquitination |
| GO:0050792 | 0.0013 | 2.983 | 4.2905 | 12 | 197 | regulation of viral process |
| GO:0046782 | 0.0015 | 4.4999 | 1.6988 | 7 | 78 | regulation of viral transcription |
| GO:0006414 | 0.0016 | 2.9035 | 4.3994 | 12 | 202 | translational elongation |
| GO:0034198 | 0.0017 | 9.0775 | 0.5227 | 4 | 24 | cellular response to amino acid starvation |
| GO:0044249 | 0.0018 | 1.3882 | 125.6229 | 152 | 5768 | cellular biosynthetic process |
| GO:0045899 | 0.0019 | 15.0954 | 0.2614 | 3 | 12 | positive regulation of RNA polymerase II transcriptional preinitiation complex assembly |
| GO:0060260 | 0.0019 | 8.6447 | 0.5445 | 4 | 25 | regulation of transcription initiation from RNA polymerase II promoter |
| GO:0031123 | 0.002 | 3.8086 | 2.265 | 8 | 104 | RNA 3'-end processing |
| GO:0031055 | 0.0021 | 6.1448 | 0.9147 | 5 | 42 | chromatin remodeling at centromere |
| GO:0044764 | 0.0021 | 1.855 | 17.1403 | 30 | 787 | multi-organism cellular process |
| GO:0006612 | 0.0023 | 2.9347 | 3.9856 | 11 | 183 | protein targeting to membrane |
| GO:0016259 | 0.0024 | 4.1476 | 1.8295 | 7 | 84 | selenocysteine metabolic process |
| GO:2001168 | 0.0028 | 45.1735 | 0.0871 | 2 | 4 | positive regulation of histone H2B ubiquitination |
| GO:0033209 | 0.0028 | 3.034 | 3.5065 | 10 | 161 | tumor necrosis factor-mediated signaling pathway |
| GO:0043241 | 0.0028 | 2.3923 | 6.6209 | 15 | 304 | protein complex disassembly |
| GO:0006139 | 0.003 | 1.3706 | 115.4084 | 140 | 5299 | nucleobase-containing compound metabolic process |
| GO:0031440 | 0.003 | 7.5626 | 0.6098 | 4 | 28 | regulation of mRNA 3'-end processing |
| GO:0034389 | 0.0031 | 12.3492 | 0.3049 | 3 | 14 | lipid particle organization |
| GO:0044403 | 0.0033 | 1.7926 | 17.6848 | 30 | 812 | symbiosis, encompassing mutualism through parasitism |
| GO:0031497 | 0.0034 | 3.1665 | 3.0273 | 9 | 139 | chromatin assembly |
| GO:0071824 | 0.0035 | 5.3815 | 1.0275 | 5 | 48 | protein-DNA complex subunit organization |
| GO:0006259 | 0.0038 | 1.7282 | 20.1894 | 33 | 927 | DNA metabolic process |
| GO:0030730 | 0.0038 | 11.3193 | 0.3267 | 3 | 15 | sequestering of triglyceride |
| GO:0045736 | 0.0039 | 6.98 | 0.6534 | 4 | 30 | negative regulation of cyclin-dependent protein serine/threonine kinase activity |
| GO:0050686 | 0.0039 | 6.98 | 0.6534 | 4 | 30 | negative regulation of mRNA processing |
| GO:0034508 | 0.0041 | 5.1649 | 1.0672 | 5 | 49 | centromere complex assembly |
| GO:1901687 | 0.0044 | 6.721 | 0.6752 | 4 | 31 | glutathione derivative biosynthetic process |
| GO:0031398 | 0.0045 | 2.8259 | 3.746 | 10 | 172 | positive regulation of protein ubiquitination |
| GO:0030223 | 0.0045 | 30.1137 | 0.1089 | 2 | 5 | neutrophil differentiation |
| GO:0055129 | 0.0045 | 30.1137 | 0.1089 | 2 | 5 | L-proline biosynthetic process |
| GO:0014912 | 0.0046 | 10.4479 | 0.3485 | 3 | 16 | negative regulation of smooth muscle cell migration |
| GO:0071103 | 0.0048 | 2.5142 | 5.031 | 12 | 231 | DNA conformation change |
| GO:0034728 | 0.0049 | 2.9814 | 3.2016 | 9 | 147 | nucleosome organization |
| GO:0016071 | 0.0051 | 1.8847 | 12.828 | 23 | 589 | mRNA metabolic process |
| GO:0043603 | 0.0055 | 1.6946 | 19.9063 | 32 | 914 | cellular amide metabolic process |
| GO:0034114 | 0.0056 | 9.701 | 0.3702 | 3 | 17 | regulation of heterotypic cell-cell adhesion |
| GO:0080111 | 0.0056 | 9.701 | 0.3702 | 3 | 17 | DNA demethylation |
| GO:0006749 | 0.0058 | 4.7332 | 1.1543 | 5 | 53 | glutathione metabolic process |
| GO:0000082 | 0.0059 | 2.4462 | 5.1617 | 12 | 237 | G1/S transition of mitotic cell cycle |
| GO:0043043 | 0.006 | 1.8313 | 13.7645 | 24 | 632 | peptide biosynthetic process |
| GO:0009084 | 0.0066 | 9.0537 | 0.392 | 3 | 18 | glutamine family amino acid biosynthetic process |
| GO:0010467 | 0.0066 | 1.3342 | 109.0924 | 131 | 5009 | gene expression |
| GO:0060353 | 0.0067 | 22.5838 | 0.1307 | 2 | 6 | regulation of cell adhesion molecule production |
| GO:0006352 | 0.0072 | 2.2104 | 6.6427 | 14 | 305 | DNA-templated transcription, initiation |
| GO:0006378 | 0.0075 | 5.669 | 0.7841 | 4 | 36 | mRNA polyadenylation |
| GO:0009059 | 0.0076 | 1.3281 | 106.6749 | 128 | 4898 | macromolecule biosynthetic process |
| GO:0019083 | 0.0086 | 3.2095 | 2.3155 | 7 | 108 | viral transcription |
| GO:0033591 | 0.0092 | 18.0659 | 0.1525 | 2 | 7 | response to L-ascorbic acid |
| GO:0031331 | 0.0099 | 2.1212 | 6.904 | 14 | 317 | positive regulation of cellular catabolic process |
| GOMFID | Pvalue | OddsRatio | ExpCount | Count | Size | Term |
| GO:0006925 | 4e-04 | 13.7213 | 0.3666 | 4 | 19 | inflammatory cell apoptotic process |
| GO:0015891 | 0.0011 | 102.3189 | 0.0579 | 2 | 3 | siderophore transport |
| GO:0097332 | 0.0011 | 102.3189 | 0.0579 | 2 | 3 | response to antipsychotic drug |
| GO:0043066 | 0.0013 | 1.9444 | 15.8996 | 29 | 824 | negative regulation of apoptotic process |
| GO:0043067 | 0.0018 | 1.695 | 27.2455 | 43 | 1412 | regulation of programmed cell death |
| GO:0002943 | 0.0022 | 51.1561 | 0.0772 | 2 | 4 | tRNA dihydrouridine synthesis |
| GO:0014805 | 0.0022 | 51.1561 | 0.0772 | 2 | 4 | smooth muscle adaptation |
| GO:0061086 | 0.0022 | 51.1561 | 0.0772 | 2 | 4 | negative regulation of histone H3-K27 methylation |
| GO:0050911 | 0.0023 | 2.3695 | 7.1394 | 16 | 370 | detection of chemical stimulus involved in sensory perception of smell |
| GO:0060548 | 0.0023 | 1.8465 | 17.2696 | 30 | 895 | negative regulation of cell death |
| GO:0002429 | 0.0023 | 2.5329 | 5.8466 | 14 | 303 | immune response-activating cell surface receptor signaling pathway |
| GO:0010332 | 0.0027 | 5.7252 | 0.9648 | 5 | 50 | response to gamma radiation |
| GO:0071901 | 0.0028 | 3.5731 | 2.3927 | 8 | 124 | negative regulation of protein serine/threonine kinase activity |
| GO:0033077 | 0.0028 | 4.6232 | 1.4086 | 6 | 73 | T cell differentiation in thymus |
| GO:0006995 | 0.0033 | 11.8362 | 0.3087 | 3 | 16 | cellular response to nitrogen starvation |
| GO:0071279 | 0.0036 | 34.1019 | 0.0965 | 2 | 5 | cellular response to cobalt ion |
| GO:2000110 | 0.0036 | 34.1019 | 0.0965 | 2 | 5 | negative regulation of macrophage apoptotic process |
| GO:0075733 | 0.0036 | 7.0908 | 0.6368 | 4 | 33 | intracellular transport of virus |
| GO:0071356 | 0.0037 | 2.6048 | 4.8625 | 12 | 252 | cellular response to tumor necrosis factor |
| GO:0007606 | 0.004 | 2.1176 | 8.9532 | 18 | 464 | sensory perception of chemical stimulus |
| GO:0050906 | 0.004 | 2.1176 | 8.9532 | 18 | 464 | detection of stimulus involved in sensory perception |
| GO:2000106 | 0.0045 | 4.184 | 1.5437 | 6 | 80 | regulation of leukocyte apoptotic process |
| GO:0060374 | 0.0053 | 25.5748 | 0.1158 | 2 | 6 | mast cell differentiation |
| GO:0097527 | 0.0053 | 25.5748 | 0.1158 | 2 | 6 | necroptotic signaling pathway |
| GO:0044766 | 0.0054 | 6.2297 | 0.7139 | 4 | 37 | multi-organism transport |
| GO:0006903 | 0.006 | 3.9179 | 1.6401 | 6 | 85 | vesicle targeting |
| GO:0051984 | 0.0064 | 9.0488 | 0.3859 | 3 | 20 | positive regulation of chromosome segregation |
| GO:0009593 | 0.0068 | 2.0497 | 8.7023 | 17 | 451 | detection of chemical stimulus |
| GO:0045454 | 0.0071 | 3.7738 | 1.698 | 6 | 88 | cell redox homeostasis |
| GO:0032355 | 0.0072 | 3.0213 | 2.7979 | 8 | 145 | response to estradiol |
| GO:0006678 | 0.0073 | 20.4585 | 0.1351 | 2 | 7 | glucosylceramide metabolic process |
| GO:0007144 | 0.0073 | 20.4585 | 0.1351 | 2 | 7 | female meiosis I |
| GO:0010193 | 0.0073 | 20.4585 | 0.1351 | 2 | 7 | response to ozone |
| GO:0033591 | 0.0073 | 20.4585 | 0.1351 | 2 | 7 | response to L-ascorbic acid |
| GO:0050862 | 0.0073 | 20.4585 | 0.1351 | 2 | 7 | positive regulation of T cell receptor signaling pathway |
| GO:0007154 | 0.0084 | 1.3324 | 115.3496 | 136 | 5978 | cell communication |
| GO:0042093 | 0.0085 | 5.4082 | 0.8104 | 4 | 42 | T-helper cell differentiation |
| GO:0007568 | 0.0086 | 2.3195 | 5.4221 | 12 | 281 | aging |
| GO:0006879 | 0.0089 | 4.2191 | 1.2735 | 5 | 66 | cellular iron ion homeostasis |
| GO:0000059 | 0.0096 | 17.0476 | 0.1544 | 2 | 8 | protein import into nucleus, docking |
| GO:0006610 | 0.0096 | 17.0476 | 0.1544 | 2 | 8 | ribosomal protein import into nucleus |
| GO:0019740 | 0.0096 | 17.0476 | 0.1544 | 2 | 8 | nitrogen utilization |
| GO:0032930 | 0.0096 | 17.0476 | 0.1544 | 2 | 8 | positive regulation of superoxide anion generation |
| GO:0072610 | 0.0096 | 17.0476 | 0.1544 | 2 | 8 | interleukin-12 secretion |
| GO:0035335 | 0.0097 | 3.5152 | 1.8138 | 6 | 94 | peptidyl-tyrosine dephosphorylation |
| GOMFID | Pvalue | OddsRatio | ExpCount | Count | Size | Term |
| GO:0050911 | 0 | 3.8843 | 4.2412 | 15 | 370 | detection of chemical stimulus involved in sensory perception of smell |
| GO:0070900 | 1e-04 | 52.6034 | 0.0917 | 3 | 8 | mitochondrial tRNA modification |
| GO:0051953 | 1e-04 | 18.5455 | 0.2636 | 4 | 23 | negative regulation of amine transport |
| GO:0009593 | 2e-04 | 3.1457 | 5.1697 | 15 | 451 | detection of chemical stimulus |
| GO:0007606 | 3e-04 | 3.052 | 5.3187 | 15 | 464 | sensory perception of chemical stimulus |
| GO:0050906 | 3e-04 | 3.052 | 5.3187 | 15 | 464 | detection of stimulus involved in sensory perception |
| GO:0032103 | 5e-04 | 3.5825 | 3.3013 | 11 | 288 | positive regulation of response to external stimulus |
| GO:1903036 | 5e-04 | 4.7035 | 1.834 | 8 | 160 | positive regulation of response to wounding |
| GO:0007186 | 8e-04 | 2.1423 | 13.2968 | 26 | 1160 | G-protein coupled receptor signaling pathway |
| GO:0006413 | 8e-04 | 3.653 | 2.9345 | 10 | 256 | translational initiation |
| GO:0006415 | 8e-04 | 4.3559 | 1.9716 | 8 | 172 | translational termination |
| GO:0043043 | 0.001 | 2.5282 | 7.2445 | 17 | 632 | peptide biosynthetic process |
| GO:0051048 | 0.0015 | 3.9424 | 2.1665 | 8 | 189 | negative regulation of secretion |
| GO:0098869 | 0.0016 | 6.3992 | 0.8482 | 5 | 74 | cellular oxidant detoxification |
| GO:0060664 | 0.0019 | 43.5927 | 0.0688 | 2 | 6 | epithelial cell proliferation involved in salivary gland morphogenesis |
| GO:0060259 | 0.0022 | 13.1381 | 0.2636 | 3 | 23 | regulation of feeding behavior |
| GO:0098754 | 0.0022 | 5.885 | 0.917 | 5 | 80 | detoxification |
| GO:0006414 | 0.0023 | 3.6751 | 2.3155 | 8 | 202 | translational elongation |
| GO:1901409 | 0.0026 | 34.8719 | 0.0802 | 2 | 7 | positive regulation of phosphorylation of RNA polymerase II C-terminal domain |
| GO:0043241 | 0.0027 | 3.047 | 3.4847 | 10 | 304 | protein complex disassembly |
| GO:0051412 | 0.0028 | 11.9422 | 0.2866 | 3 | 25 | response to corticosterone |
| GO:0030595 | 0.0043 | 3.6542 | 2.0289 | 7 | 177 | leukocyte chemotaxis |
| GO:0002863 | 0.0045 | 24.9053 | 0.1032 | 2 | 9 | positive regulation of inflammatory response to antigenic stimulus |
| GO:0010700 | 0.0045 | 24.9053 | 0.1032 | 2 | 9 | negative regulation of norepinephrine secretion |
| GO:0060405 | 0.0045 | 24.9053 | 0.1032 | 2 | 9 | regulation of penile erection |
| GO:0050686 | 0.0048 | 9.7276 | 0.3439 | 3 | 30 | negative regulation of mRNA processing |
| GO:1901687 | 0.0053 | 9.3795 | 0.3553 | 3 | 31 | glutathione derivative biosynthetic process |
| GO:0031622 | 0.0055 | 21.7907 | 0.1146 | 2 | 10 | positive regulation of fever generation |
| GO:0034116 | 0.0055 | 21.7907 | 0.1146 | 2 | 10 | positive regulation of heterotypic cell-cell adhesion |
| GO:0000959 | 0.0058 | 9.0555 | 0.3668 | 3 | 32 | mitochondrial RNA metabolic process |
| GO:0006613 | 0.0069 | 4.4514 | 1.1921 | 5 | 104 | cotranslational protein targeting to membrane |
| GO:0045047 | 0.0075 | 4.3627 | 1.2151 | 5 | 106 | protein targeting to ER |
| GO:0017085 | 0.008 | 17.4303 | 0.1376 | 2 | 12 | response to insecticide |
| GO:0045777 | 0.0086 | 7.7213 | 0.4241 | 3 | 37 | positive regulation of blood pressure |
| GO:0002687 | 0.0087 | 4.1954 | 1.2609 | 5 | 110 | positive regulation of leukocyte migration |
| GO:0043603 | 0.0087 | 1.9288 | 10.477 | 19 | 914 | cellular amide metabolic process |
| GO:0006402 | 0.0088 | 3.1806 | 2.3155 | 7 | 202 | mRNA catabolic process |
| GOMFID | Pvalue | OddsRatio | ExpCount | Count | Size | Term |
| GO:0050911 | 0 | 3.7978 | 4.9245 | 17 | 370 | detection of chemical stimulus involved in sensory perception of smell |
| GO:0009593 | 1e-04 | 3.0724 | 6.0026 | 17 | 451 | detection of chemical stimulus |
| GO:0007186 | 2e-04 | 2.2159 | 15.4391 | 31 | 1160 | G-protein coupled receptor signaling pathway |
| GO:0007606 | 2e-04 | 2.9805 | 6.1756 | 17 | 464 | sensory perception of chemical stimulus |
| GO:0050906 | 2e-04 | 2.9805 | 6.1756 | 17 | 464 | detection of stimulus involved in sensory perception |
| GO:0000956 | 9e-04 | 3.872 | 2.4889 | 9 | 187 | nuclear-transcribed mRNA catabolic process |
| GO:0045925 | 0.001 | 74.8406 | 0.0532 | 2 | 4 | positive regulation of female receptivity |
| GO:0006401 | 0.0011 | 3.4728 | 3.0745 | 10 | 231 | RNA catabolic process |
| GO:0034113 | 0.003 | 7.3542 | 0.5989 | 4 | 45 | heterotypic cell-cell adhesion |
| GO:0060509 | 0.0035 | 29.9304 | 0.0932 | 2 | 7 | Type I pneumocyte differentiation |
| GO:0050806 | 0.0056 | 3.9526 | 1.6105 | 6 | 121 | positive regulation of synaptic transmission |
| GO:0050877 | 0.0058 | 1.7881 | 16.1578 | 27 | 1214 | neurological system process |
| GO:0001706 | 0.0065 | 5.7944 | 0.7453 | 4 | 56 | endoderm formation |
| GO:0010831 | 0.0066 | 8.6639 | 0.386 | 3 | 29 | positive regulation of myotube differentiation |
| GO:0090502 | 0.0069 | 5.6847 | 0.7586 | 4 | 57 | RNA phosphodiester bond hydrolysis, endonucleolytic |
| GO:0070972 | 0.0073 | 3.7241 | 1.7036 | 6 | 128 | protein localization to endoplasmic reticulum |
| GO:0060180 | 0.0074 | 18.7029 | 0.1331 | 2 | 10 | female mating behavior |
| GO:0006415 | 0.0083 | 3.2194 | 2.2892 | 7 | 172 | translational termination |
| GO:0090266 | 0.009 | 16.6237 | 0.1464 | 2 | 11 | regulation of mitotic cell cycle spindle assembly checkpoint |
| GO:2000142 | 0.0095 | 7.5068 | 0.4392 | 3 | 33 | regulation of DNA-templated transcription, initiation |
| GO:0030595 | 0.0096 | 3.1237 | 2.3558 | 7 | 177 | leukocyte chemotaxis |
| GOMFID | Pvalue | OddsRatio | ExpCount | Count | Size | Term |
| GO:0042742 | 3e-04 | 3.8715 | 3.0636 | 11 | 228 | defense response to bacterium |
| GO:0009593 | 4e-04 | 2.8401 | 6.0601 | 16 | 451 | detection of chemical stimulus |
| GO:0007186 | 4e-04 | 2.1066 | 15.5868 | 30 | 1160 | G-protein coupled receptor signaling pathway |
| GO:0018206 | 5e-04 | 24.8125 | 0.1612 | 3 | 12 | peptidyl-methionine modification |
| GO:0050911 | 5e-04 | 3.0215 | 4.9717 | 14 | 370 | detection of chemical stimulus involved in sensory perception of smell |
| GO:0014038 | 5e-04 | 148.2392 | 0.0403 | 2 | 3 | regulation of Schwann cell differentiation |
| GO:0071409 | 5e-04 | 148.2392 | 0.0403 | 2 | 3 | cellular response to cycloheximide |
| GO:0007606 | 5e-04 | 2.7553 | 6.2347 | 16 | 464 | sensory perception of chemical stimulus |
| GO:0050906 | 5e-04 | 2.7553 | 6.2347 | 16 | 464 | detection of stimulus involved in sensory perception |
| GO:0009620 | 8e-04 | 7.6496 | 0.7256 | 5 | 54 | response to fungus |
| GO:0031640 | 8e-04 | 10.6722 | 0.43 | 4 | 32 | killing of cells of other organism |
| GO:0001992 | 0.0011 | 74.1148 | 0.0537 | 2 | 4 | regulation of systemic arterial blood pressure by vasopressin |
| GO:0003151 | 0.0013 | 6.6904 | 0.8197 | 5 | 61 | outflow tract morphogenesis |
| GO:0042596 | 0.0015 | 9.0523 | 0.4972 | 4 | 37 | fear response |
| GO:0043308 | 0.0017 | 49.4067 | 0.0672 | 2 | 5 | eosinophil degranulation |
| GO:0048865 | 0.0017 | 49.4067 | 0.0672 | 2 | 5 | stem cell fate commitment |
| GO:0006415 | 0.0023 | 3.6833 | 2.3112 | 8 | 172 | translational termination |
| GO:0042273 | 0.0024 | 7.8586 | 0.5644 | 4 | 42 | ribosomal large subunit biogenesis |
| GO:0043307 | 0.0026 | 37.0526 | 0.0806 | 2 | 6 | eosinophil activation |
| GO:0050428 | 0.0026 | 37.0526 | 0.0806 | 2 | 6 | 3'-phosphoadenosine 5'-phosphosulfate biosynthetic process |
| GO:2000630 | 0.0026 | 37.0526 | 0.0806 | 2 | 6 | positive regulation of miRNA metabolic process |
| GO:0002227 | 0.0031 | 11.7457 | 0.2956 | 3 | 22 | innate immune response in mucosa |
| GO:0030520 | 0.0031 | 7.2822 | 0.6047 | 4 | 45 | intracellular estrogen receptor signaling pathway |
| GO:0003357 | 0.0036 | 29.6402 | 0.0941 | 2 | 7 | noradrenergic neuron differentiation |
| GO:0051705 | 0.0042 | 5.0571 | 1.0615 | 5 | 79 | multi-organism behavior |
| GO:0034654 | 0.0044 | 1.4966 | 53.6402 | 71 | 3992 | nucleobase-containing compound biosynthetic process |
| GO:0050851 | 0.0048 | 3.243 | 2.6068 | 8 | 194 | antigen receptor-mediated signaling pathway |
| GO:0006268 | 0.0048 | 24.6986 | 0.1075 | 2 | 8 | DNA unwinding involved in DNA replication |
| GO:2000252 | 0.0048 | 24.6986 | 0.1075 | 2 | 8 | negative regulation of feeding behavior |
| GO:0031365 | 0.0055 | 9.2957 | 0.3628 | 3 | 27 | N-terminal protein amino acid modification |
| GO:0006414 | 0.006 | 3.1076 | 2.7143 | 8 | 202 | translational elongation |
| GO:0045924 | 0.0061 | 21.1688 | 0.1209 | 2 | 9 | regulation of female receptivity |
| GO:0006968 | 0.0063 | 5.8505 | 0.739 | 4 | 55 | cellular defense response |
| GO:0030814 | 0.0063 | 3.8462 | 1.6527 | 6 | 123 | regulation of cAMP metabolic process |
| GO:0008284 | 0.0066 | 1.9435 | 10.9108 | 20 | 812 | positive regulation of cell proliferation |
| GO:0045938 | 0.0075 | 18.5215 | 0.1344 | 2 | 10 | positive regulation of circadian sleep/wake cycle, sleep |
| GO:0032965 | 0.0089 | 7.6905 | 0.43 | 3 | 32 | regulation of collagen biosynthetic process |
| GO:0042535 | 0.0091 | 16.4625 | 0.1478 | 2 | 11 | positive regulation of tumor necrosis factor biosynthetic process |
| GO:0043207 | 0.0093 | 1.8464 | 12.0395 | 21 | 896 | response to external biotic stimulus |
| GO:0006739 | 0.0097 | 7.4337 | 0.4434 | 3 | 33 | NADP metabolic process |
| GOMFID | Pvalue | OddsRatio | ExpCount | Count | Size | Term |
| GO:0050911 | 0 | 3.9277 | 3.9114 | 14 | 370 | detection of chemical stimulus involved in sensory perception of smell |
| GO:0050906 | 1e-04 | 3.3381 | 4.905 | 15 | 464 | detection of stimulus involved in sensory perception |
| GO:0043043 | 1e-04 | 2.956 | 6.681 | 18 | 632 | peptide biosynthetic process |
| GO:0009593 | 3e-04 | 3.1826 | 4.7676 | 14 | 451 | detection of chemical stimulus |
| GO:0030423 | 3e-04 | 189.4634 | 0.0317 | 2 | 3 | targeting of mRNA for destruction involved in RNA interference |
| GO:0043489 | 3e-04 | 13.6764 | 0.3383 | 4 | 32 | RNA stabilization |
| GO:1903543 | 4e-04 | 25.9777 | 0.148 | 3 | 14 | positive regulation of exosomal secretion |
| GO:0007606 | 4e-04 | 3.088 | 4.905 | 14 | 464 | sensory perception of chemical stimulus |
| GO:0043603 | 7e-04 | 2.375 | 9.6621 | 21 | 914 | cellular amide metabolic process |
| GO:0035087 | 7e-04 | 94.7256 | 0.0423 | 2 | 4 | siRNA loading onto RISC involved in RNA interference |
| GO:1903553 | 7e-04 | 94.7256 | 0.0423 | 2 | 4 | positive regulation of extracellular exosome assembly |
| GO:0006415 | 0.0024 | 4.1015 | 1.8183 | 7 | 172 | translational termination |
| GO:0007218 | 0.0029 | 5.5151 | 0.9726 | 5 | 92 | neuropeptide signaling pathway |
| GO:0060452 | 0.003 | 31.5671 | 0.0846 | 2 | 8 | positive regulation of cardiac muscle contraction |
| GO:0030432 | 0.0038 | 27.0557 | 0.0951 | 2 | 9 | peristalsis |
| GO:0043241 | 0.0051 | 2.9618 | 3.2137 | 9 | 304 | protein complex disassembly |
| GO:0006414 | 0.0057 | 3.4638 | 2.1354 | 7 | 202 | translational elongation |
| GO:0006417 | 0.0064 | 2.8533 | 3.3299 | 9 | 315 | regulation of translation |
| GO:0018206 | 0.0068 | 18.9354 | 0.1269 | 2 | 12 | peptidyl-methionine modification |
| GO:0070935 | 0.0068 | 18.9354 | 0.1269 | 2 | 12 | 3'-UTR-mediated mRNA stabilization |
| GO:0007186 | 0.0069 | 1.9493 | 11.0145 | 20 | 1068 | G-protein coupled receptor signaling pathway |
| GO:0008217 | 0.0082 | 3.6269 | 1.7443 | 6 | 165 | regulation of blood pressure |
| GO:0007270 | 0.0089 | 4.1647 | 1.2685 | 5 | 120 | neuron-neuron synaptic transmission |
| GO:0050877 | 0.009 | 1.8386 | 12.8335 | 22 | 1214 | neurological system process |
| GO:0006457 | 0.0098 | 3.1081 | 2.368 | 7 | 224 | protein folding |
| GOMFID | Pvalue | OddsRatio | ExpCount | Count | Size | Term |
| GO:0006413 | 1e-04 | 3.5896 | 4.2224 | 14 | 256 | translational initiation |
| GO:0002506 | 3e-04 | Inf | 0.033 | 2 | 2 | polysaccharide assembly with MHC class II protein complex |
| GO:0071823 | 3e-04 | Inf | 0.033 | 2 | 2 | protein-carbohydrate complex subunit organization |
| GO:0043043 | 3e-04 | 2.374 | 10.424 | 23 | 632 | peptide biosynthetic process |
| GO:0043241 | 5e-04 | 2.986 | 5.0141 | 14 | 304 | protein complex disassembly |
| GO:0043603 | 6e-04 | 2.0742 | 15.0752 | 29 | 914 | cellular amide metabolic process |
| GO:0006415 | 6e-04 | 3.7885 | 2.8369 | 10 | 172 | translational termination |
| GO:0001878 | 0.0011 | 18.0867 | 0.2144 | 3 | 13 | response to yeast |
| GO:0002503 | 0.0016 | 60.0856 | 0.066 | 2 | 4 | peptide antigen assembly with MHC class II protein complex |
| GO:0006414 | 0.002 | 3.1903 | 3.3317 | 10 | 202 | translational elongation |
| GO:0044419 | 0.002 | 1.9897 | 13.3929 | 25 | 812 | interspecies interaction between organisms |
| GO:0032689 | 0.002 | 8.3381 | 0.5443 | 4 | 33 | negative regulation of interferon-gamma production |
| GO:0072599 | 0.0023 | 4.1373 | 1.8143 | 7 | 110 | establishment of protein localization to endoplasmic reticulum |
| GO:0016045 | 0.0025 | 12.9157 | 0.2804 | 3 | 17 | detection of bacterium |
| GO:0002396 | 0.0026 | 40.0545 | 0.0825 | 2 | 5 | MHC protein complex assembly |
| GO:0070934 | 0.0026 | 40.0545 | 0.0825 | 2 | 5 | CRD-mediated mRNA stabilization |
| GO:0098734 | 0.0026 | 40.0545 | 0.0825 | 2 | 5 | macromolecule depalmitoylation |
| GO:0006612 | 0.0034 | 3.1593 | 3.0183 | 9 | 183 | protein targeting to membrane |
| GO:0060374 | 0.0039 | 30.0389 | 0.099 | 2 | 6 | mast cell differentiation |
| GO:1903332 | 0.0039 | 30.0389 | 0.099 | 2 | 6 | regulation of protein folding |
| GO:2000774 | 0.0039 | 30.0389 | 0.099 | 2 | 6 | positive regulation of cellular senescence |
| GO:0050862 | 0.0054 | 24.0296 | 0.1155 | 2 | 7 | positive regulation of T cell receptor signaling pathway |
| GO:0009108 | 0.0056 | 3.4886 | 2.1277 | 7 | 129 | coenzyme biosynthetic process |
| GO:0034112 | 0.006 | 2.8749 | 3.2987 | 9 | 200 | positive regulation of homotypic cell-cell adhesion |
| GO:0009607 | 0.0061 | 1.7906 | 15.3721 | 26 | 932 | response to biotic stimulus |
| GO:0010894 | 0.0062 | 9.0375 | 0.3794 | 3 | 23 | negative regulation of steroid biosynthetic process |
| GO:0098581 | 0.0062 | 9.0375 | 0.3794 | 3 | 23 | detection of external biotic stimulus |
| GO:1903039 | 0.0064 | 2.8447 | 3.3317 | 9 | 202 | positive regulation of leukocyte cell-cell adhesion |
| GO:0006614 | 0.0068 | 3.7915 | 1.6824 | 6 | 102 | SRP-dependent cotranslational protein targeting to membrane |
| GO:0044711 | 0.0075 | 1.5723 | 27.8908 | 41 | 1691 | single-organism biosynthetic process |
| GO:0044272 | 0.0077 | 2.7579 | 3.4307 | 9 | 208 | sulfur compound biosynthetic process |
| GO:1901564 | 0.0079 | 1.5134 | 34.8346 | 49 | 2112 | organonitrogen compound metabolic process |
| GO:0032387 | 0.0083 | 3.2222 | 2.2926 | 7 | 139 | negative regulation of intracellular transport |
| GO:0019884 | 0.0083 | 2.9334 | 2.8699 | 8 | 174 | antigen processing and presentation of exogenous antigen |
| GO:0045932 | 0.0087 | 7.8572 | 0.4288 | 3 | 26 | negative regulation of muscle contraction |
| GO:0000463 | 0.009 | 17.1618 | 0.1484 | 2 | 9 | maturation of LSU-rRNA from tricistronic rRNA transcript (SSU-rRNA, 5.8S rRNA, LSU-rRNA) |
| GO:0002679 | 0.009 | 17.1618 | 0.1484 | 2 | 9 | respiratory burst involved in defense response |
| GO:0032933 | 0.009 | 17.1618 | 0.1484 | 2 | 9 | SREBP signaling pathway |
| GO:0016032 | 0.0093 | 1.8136 | 12.7661 | 22 | 774 | viral process |
| GO:0001887 | 0.0098 | 3.498 | 1.8143 | 6 | 110 | selenium compound metabolic process |
| GOMFID | Pvalue | OddsRatio | ExpCount | Count | Size | Term |
| GO:1901576 | 0 | 1.6429 | 165.0006 | 217 | 5862 | organic substance biosynthetic process |
| GO:0034641 | 0 | 1.4818 | 172.6004 | 214 | 6132 | cellular nitrogen compound metabolic process |
| GO:0044238 | 0 | 1.5062 | 273.8469 | 313 | 9729 | primary metabolic process |
| GO:0034645 | 1e-04 | 1.9412 | 28.4886 | 50 | 1093 | cellular macromolecule biosynthetic process |
| GO:0034654 | 1e-04 | 1.4951 | 112.3648 | 148 | 3992 | nucleobase-containing compound biosynthetic process |
| GO:0006725 | 1e-04 | 1.4576 | 154.5579 | 193 | 5491 | cellular aromatic compound metabolic process |
| GO:1901360 | 1e-04 | 1.4513 | 160.5533 | 199 | 5704 | organic cyclic compound metabolic process |
| GO:0046483 | 1e-04 | 1.4376 | 154.0512 | 191 | 5473 | heterocycle metabolic process |
| GO:0051122 | 2e-04 | 52.1378 | 0.1407 | 3 | 5 | hepoxilin biosynthetic process |
| GO:0044711 | 2e-04 | 1.6397 | 47.5974 | 72 | 1691 | single-organism biosynthetic process |
| GO:0097659 | 4e-04 | 3.2407 | 4.3585 | 13 | 166 | nucleic acid-templated transcription |
| GO:0030730 | 7e-04 | 12.6609 | 0.4222 | 4 | 15 | sequestering of triglyceride |
| GO:0043124 | 8e-04 | 5.209 | 1.52 | 7 | 54 | negative regulation of I-kappaB kinase/NF-kappaB signaling |
| GO:0006742 | 8e-04 | Inf | 0.0563 | 2 | 2 | NADP catabolic process |
| GO:0043543 | 0.0013 | 2.7101 | 5.5169 | 14 | 196 | protein acylation |
| GO:0006362 | 0.0016 | 6.7044 | 0.8726 | 5 | 31 | transcription elongation from RNA polymerase I promoter |
| GO:0006363 | 0.0016 | 6.7044 | 0.8726 | 5 | 31 | termination of RNA polymerase I transcription |
| GO:0016573 | 0.0016 | 3.0904 | 3.8281 | 11 | 136 | histone acetylation |
| GO:0031665 | 0.0016 | 17.3747 | 0.2533 | 3 | 9 | negative regulation of lipopolysaccharide-mediated signaling pathway |
| GO:0031943 | 0.0016 | 17.3747 | 0.2533 | 3 | 9 | regulation of glucocorticoid metabolic process |
| GO:0008285 | 0.0022 | 1.8272 | 17.9018 | 31 | 636 | negative regulation of cell proliferation |
| GO:0040007 | 0.0023 | 1.6695 | 26.5994 | 42 | 945 | growth |
| GO:0034116 | 0.0023 | 14.8916 | 0.2815 | 3 | 10 | positive regulation of heterotypic cell-cell adhesion |
| GO:0033484 | 0.0023 | 69.3636 | 0.0844 | 2 | 3 | nitric oxide homeostasis |
| GO:0034441 | 0.0023 | 69.3636 | 0.0844 | 2 | 3 | plasma lipoprotein particle oxidation |
| GO:0044375 | 0.0023 | 69.3636 | 0.0844 | 2 | 3 | regulation of peroxisome size |
| GO:0046136 | 0.0023 | 69.3636 | 0.0844 | 2 | 3 | positive regulation of vitamin metabolic process |
| GO:0060129 | 0.0023 | 69.3636 | 0.0844 | 2 | 3 | thyroid-stimulating hormone-secreting cell differentiation |
| GO:0060559 | 0.0023 | 69.3636 | 0.0844 | 2 | 3 | positive regulation of calcidiol 1-monooxygenase activity |
| GO:0006361 | 0.0025 | 6.0096 | 0.957 | 5 | 34 | transcription initiation from RNA polymerase I promoter |
| GO:0035914 | 0.0025 | 4.1463 | 1.8577 | 7 | 66 | skeletal muscle cell differentiation |
| GO:2001234 | 0.0027 | 2.5973 | 5.3199 | 13 | 189 | negative regulation of apoptotic signaling pathway |
| GO:0006475 | 0.0028 | 2.8596 | 4.1095 | 11 | 146 | internal protein amino acid acetylation |
| GO:0018394 | 0.0028 | 2.8596 | 4.1095 | 11 | 146 | peptidyl-lysine acetylation |
| GO:0006047 | 0.0031 | 13.0293 | 0.3096 | 3 | 11 | UDP-N-acetylglucosamine metabolic process |
| GO:2000112 | 0.0032 | 1.3522 | 103.1042 | 128 | 3663 | regulation of cellular macromolecule biosynthetic process |
| GO:0006325 | 0.0033 | 2.9797 | 3.5913 | 10 | 131 | chromatin organization |
| GO:0016070 | 0.0033 | 1.7205 | 21.6687 | 35 | 820 | RNA metabolic process |
| GO:0006366 | 0.0034 | 2.5293 | 5.4578 | 13 | 203 | transcription from RNA polymerase II promoter |
| GO:0010467 | 0.0035 | 1.3796 | 89.0464 | 112 | 3307 | gene expression |
| GO:0034599 | 0.0037 | 2.4024 | 6.1643 | 14 | 219 | cellular response to oxidative stress |
| GO:0050810 | 0.0039 | 5.3125 | 1.0633 | 5 | 38 | regulation of steroid biosynthetic process |
| GO:0045073 | 0.004 | 11.5809 | 0.3378 | 3 | 12 | regulation of chemokine biosynthetic process |
| GO:1903506 | 0.0042 | 1.3515 | 93.6467 | 117 | 3327 | regulation of nucleic acid-templated transcription |
| GO:1902932 | 0.0042 | 6.9594 | 0.6755 | 4 | 24 | positive regulation of alcohol biosynthetic process |
| GO:0001558 | 0.0045 | 2.0074 | 10.4709 | 20 | 372 | regulation of cell growth |
| GO:0002503 | 0.0046 | 34.6795 | 0.1126 | 2 | 4 | peptide antigen assembly with MHC class II protein complex |
| GO:0006041 | 0.0046 | 34.6795 | 0.1126 | 2 | 4 | glucosamine metabolic process |
| GO:0090666 | 0.0046 | 34.6795 | 0.1126 | 2 | 4 | scaRNA localization to Cajal body |
| GO:1903553 | 0.0046 | 34.6795 | 0.1126 | 2 | 4 | positive regulation of extracellular exosome assembly |
| GO:0019372 | 0.0051 | 10.4221 | 0.3659 | 3 | 13 | lipoxygenase pathway |
| GO:0007623 | 0.0052 | 2.3909 | 5.7421 | 13 | 204 | circadian rhythm |
| GO:0071356 | 0.0053 | 2.2269 | 7.0932 | 15 | 252 | cellular response to tumor necrosis factor |
| GO:0016568 | 0.0053 | 1.7804 | 15.9033 | 27 | 565 | chromatin modification |
| GO:0006357 | 0.0054 | 1.445 | 48.3855 | 66 | 1719 | regulation of transcription from RNA polymerase II promoter |
| GO:0070301 | 0.0055 | 3.543 | 2.1392 | 7 | 76 | cellular response to hydrogen peroxide |
| GO:0010557 | 0.0057 | 1.4569 | 45.0078 | 62 | 1599 | positive regulation of macromolecule biosynthetic process |
| GO:0044249 | 0.0059 | 1.6866 | 20.9264 | 33 | 866 | cellular biosynthetic process |
| GO:0048871 | 0.0061 | 2.0274 | 9.3168 | 18 | 331 | multicellular organismal homeostasis |
| GO:0019216 | 0.0064 | 2.1173 | 7.9376 | 16 | 282 | regulation of lipid metabolic process |
| GO:0010893 | 0.0064 | 9.474 | 0.3941 | 3 | 14 | positive regulation of steroid biosynthetic process |
| GO:0032691 | 0.0064 | 9.474 | 0.3941 | 3 | 14 | negative regulation of interleukin-1 beta production |
| GO:0050755 | 0.0064 | 9.474 | 0.3941 | 3 | 14 | chemokine metabolic process |
| GO:0071168 | 0.0064 | 9.474 | 0.3941 | 3 | 14 | protein localization to chromatin |
| GO:0010628 | 0.0066 | 1.4339 | 47.9352 | 65 | 1703 | positive regulation of gene expression |
| GO:0006446 | 0.0068 | 3.3947 | 2.2237 | 7 | 79 | regulation of translational initiation |
| GO:0032720 | 0.0069 | 4.5836 | 1.2103 | 5 | 43 | negative regulation of tumor necrosis factor production |
| GO:0006633 | 0.0069 | 2.6531 | 3.9969 | 10 | 142 | fatty acid biosynthetic process |
| GO:0060759 | 0.0069 | 2.6531 | 3.9969 | 10 | 142 | regulation of response to cytokine stimulus |
| GO:0006334 | 0.0072 | 2.8114 | 3.4058 | 9 | 121 | nucleosome assembly |
| GO:0009889 | 0.0074 | 1.3033 | 112.1677 | 135 | 3985 | regulation of biosynthetic process |
| GO:0002396 | 0.0075 | 23.1182 | 0.1407 | 2 | 5 | MHC protein complex assembly |
| GO:0002439 | 0.0075 | 23.1182 | 0.1407 | 2 | 5 | chronic inflammatory response to antigenic stimulus |
| GO:0031339 | 0.0075 | 23.1182 | 0.1407 | 2 | 5 | negative regulation of vesicle fusion |
| GO:0035912 | 0.0075 | 23.1182 | 0.1407 | 2 | 5 | dorsal aorta morphogenesis |
| GO:0042160 | 0.0075 | 23.1182 | 0.1407 | 2 | 5 | lipoprotein modification |
| GO:0072162 | 0.0075 | 23.1182 | 0.1407 | 2 | 5 | metanephric mesenchymal cell differentiation |
| GO:0072526 | 0.0075 | 23.1182 | 0.1407 | 2 | 5 | pyridine-containing compound catabolic process |
| GO:2000064 | 0.0075 | 23.1182 | 0.1407 | 2 | 5 | regulation of cortisol biosynthetic process |
| GO:2000254 | 0.0075 | 23.1182 | 0.1407 | 2 | 5 | regulation of male germ cell proliferation |
| GO:2000767 | 0.0075 | 23.1182 | 0.1407 | 2 | 5 | positive regulation of cytoplasmic translation |
| GO:0006646 | 0.0078 | 8.6839 | 0.4222 | 3 | 15 | phosphatidylethanolamine biosynthetic process |
| GO:0046165 | 0.008 | 2.7594 | 3.464 | 9 | 124 | alcohol biosynthetic process |
| GO:0009636 | 0.0082 | 2.1761 | 6.7554 | 14 | 240 | response to toxic substance |
| GO:0000302 | 0.0083 | 2.2478 | 6.0799 | 13 | 216 | response to reactive oxygen species |
| GO:0031328 | 0.0084 | 1.4155 | 48.47 | 65 | 1722 | positive regulation of cellular biosynthetic process |
| GO:0051252 | 0.0093 | 1.3069 | 96.9399 | 118 | 3444 | regulation of RNA metabolic process |
| GO:0071824 | 0.0093 | 2.2994 | 5.4888 | 12 | 195 | protein-DNA complex subunit organization |
| GO:0030949 | 0.0094 | 8.0154 | 0.4504 | 3 | 16 | positive regulation of vascular endothelial growth factor receptor signaling pathway |
| GO:0051150 | 0.0094 | 8.0154 | 0.4504 | 3 | 16 | regulation of smooth muscle cell differentiation |
| GO:0061436 | 0.0094 | 8.0154 | 0.4504 | 3 | 16 | establishment of skin barrier |
| GO:0006839 | 0.0097 | 2.0672 | 7.5998 | 15 | 270 | mitochondrial transport |
| GOMFID | Pvalue | OddsRatio | ExpCount | Count | Size | Term |
| GO:0006614 | 0 | 7.2323 | 1.5654 | 10 | 102 | SRP-dependent cotranslational protein targeting to membrane |
| GO:0016259 | 0 | 7.9588 | 1.2892 | 9 | 84 | selenocysteine metabolic process |
| GO:0090304 | 0 | 1.8001 | 72.8387 | 105 | 4746 | nucleic acid metabolic process |
| GO:0072599 | 0 | 6.6502 | 1.6882 | 10 | 110 | establishment of protein localization to endoplasmic reticulum |
| GO:0006415 | 0 | 5.0116 | 2.6398 | 12 | 172 | translational termination |
| GO:0044033 | 0 | 4.4873 | 3.1769 | 13 | 207 | multi-organism metabolic process |
| GO:0043241 | 0 | 3.7467 | 4.6656 | 16 | 304 | protein complex disassembly |
| GO:0006612 | 0 | 4.6858 | 2.8086 | 12 | 183 | protein targeting to membrane |
| GO:0019083 | 0 | 4.6041 | 2.8546 | 12 | 186 | viral transcription |
| GO:0022411 | 0 | 2.5908 | 11.4338 | 27 | 745 | cellular component disassembly |
| GO:0000184 | 1e-04 | 5.6738 | 1.7496 | 9 | 114 | nuclear-transcribed mRNA catabolic process, nonsense-mediated decay |
| GO:0006402 | 1e-04 | 4.212 | 3.1002 | 12 | 202 | mRNA catabolic process |
| GO:0006414 | 1e-04 | 4.212 | 3.1002 | 12 | 202 | translational elongation |
| GO:0033365 | 1e-04 | 2.3625 | 12.9378 | 28 | 843 | protein localization to organelle |
| GO:0034655 | 1e-04 | 3.2293 | 5.3597 | 16 | 353 | nucleobase-containing compound catabolic process |
| GO:0016482 | 2e-04 | 2.0948 | 18.3401 | 35 | 1195 | cytoplasmic transport |
| GO:0042534 | 2e-04 | 17.3806 | 0.2916 | 4 | 19 | regulation of tumor necrosis factor biosynthetic process |
| GO:0019438 | 3e-04 | 1.6342 | 62.295 | 87 | 4059 | aromatic compound biosynthetic process |
| GO:0044271 | 3e-04 | 1.6006 | 70.0455 | 95 | 4564 | cellular nitrogen compound biosynthetic process |
| GO:1902582 | 3e-04 | 1.8802 | 25.2311 | 43 | 1644 | single-organism intracellular transport |
| GO:0018130 | 4e-04 | 1.6061 | 62.249 | 86 | 4056 | heterocycle biosynthetic process |
| GO:1901362 | 4e-04 | 1.5987 | 64.1367 | 88 | 4179 | organic cyclic compound biosynthetic process |
| GO:0010870 | 5e-04 | 24.3498 | 0.1688 | 3 | 11 | positive regulation of receptor biosynthetic process |
| GO:0006413 | 6e-04 | 3.2682 | 3.9289 | 12 | 256 | translational initiation |
| GO:0006106 | 7e-04 | 129.3808 | 0.046 | 2 | 3 | fumarate metabolic process |
| GO:0044403 | 7e-04 | 2.1582 | 12.4621 | 25 | 812 | symbiosis, encompassing mutualism through parasitism |
| GO:0044265 | 8e-04 | 2.1179 | 13.2248 | 26 | 871 | cellular macromolecule catabolic process |
| GO:0032640 | 8e-04 | 4.9977 | 1.5194 | 7 | 99 | tumor necrosis factor production |
| GO:1903555 | 9e-04 | 4.8907 | 1.5501 | 7 | 101 | regulation of tumor necrosis factor superfamily cytokine production |
| GO:0070727 | 0.001 | 1.8326 | 22.576 | 38 | 1471 | cellular macromolecule localization |
| GO:0006807 | 0.001 | 1.7585 | 33.0388 | 50 | 2379 | nitrogen compound metabolic process |
| GO:0044764 | 0.0011 | 2.1307 | 12.0784 | 24 | 787 | multi-organism cellular process |
| GO:0010468 | 0.0012 | 1.5425 | 61.5584 | 83 | 4011 | regulation of gene expression |
| GO:0002865 | 0.0014 | 64.6862 | 0.0614 | 2 | 4 | negative regulation of acute inflammatory response to antigenic stimulus |
| GO:0051541 | 0.0014 | 64.6862 | 0.0614 | 2 | 4 | elastin metabolic process |
| GO:0009889 | 0.0016 | 1.5273 | 61.1593 | 82 | 3985 | regulation of biosynthetic process |
| GO:0009451 | 0.0021 | 4.2136 | 1.7803 | 7 | 116 | RNA modification |
| GO:0006886 | 0.0022 | 2.12 | 10.5639 | 21 | 706 | intracellular protein transport |
| GO:0002819 | 0.0022 | 4.175 | 1.7956 | 7 | 117 | regulation of adaptive immune response |
| GO:0032364 | 0.0023 | 43.1213 | 0.0767 | 2 | 5 | oxygen homeostasis |
| GO:0043308 | 0.0023 | 43.1213 | 0.0767 | 2 | 5 | eosinophil degranulation |
| GO:2000110 | 0.0023 | 43.1213 | 0.0767 | 2 | 5 | negative regulation of macrophage apoptotic process |
| GO:0042990 | 0.0025 | 4.7308 | 1.3659 | 6 | 89 | regulation of transcription factor import into nucleus |
| GO:0032869 | 0.0029 | 2.4745 | 5.9855 | 14 | 390 | cellular response to insulin stimulus |
| GO:0048025 | 0.0029 | 12.1686 | 0.2916 | 3 | 19 | negative regulation of mRNA splicing, via spliceosome |
| GO:0019058 | 0.0031 | 2.3713 | 6.6915 | 15 | 436 | viral life cycle |
| GO:1903036 | 0.0033 | 3.4583 | 2.4556 | 8 | 160 | positive regulation of response to wounding |
| GO:0031119 | 0.0034 | 32.3389 | 0.0921 | 2 | 6 | tRNA pseudouridine synthesis |
| GO:0043307 | 0.0034 | 32.3389 | 0.0921 | 2 | 6 | eosinophil activation |
| GO:0048304 | 0.0034 | 32.3389 | 0.0921 | 2 | 6 | positive regulation of isotype switching to IgG isotypes |
| GO:0045184 | 0.0037 | 1.6274 | 29.3135 | 44 | 1910 | establishment of protein localization |
| GO:1901575 | 0.0038 | 1.6508 | 26.8426 | 41 | 1749 | organic substance catabolic process |
| GO:0043524 | 0.0041 | 3.7002 | 2.0105 | 7 | 131 | negative regulation of neuron apoptotic process |
| GO:0008054 | 0.0047 | 25.8695 | 0.1074 | 2 | 7 | negative regulation of cyclin-dependent protein serine/threonine kinase by cyclin degradation |
| GO:0014745 | 0.0047 | 25.8695 | 0.1074 | 2 | 7 | negative regulation of muscle adaptation |
| GO:2000112 | 0.0049 | 1.4659 | 56.2175 | 74 | 3663 | regulation of cellular macromolecule biosynthetic process |
| GO:0001832 | 0.005 | 9.7324 | 0.353 | 3 | 23 | blastocyst growth |
| GO:0030206 | 0.005 | 9.7324 | 0.353 | 3 | 23 | chondroitin sulfate biosynthetic process |
| GO:0051169 | 0.0052 | 2.3046 | 6.3999 | 14 | 417 | nuclear transport |
| GO:1903533 | 0.0054 | 2.5932 | 4.4661 | 11 | 291 | regulation of protein targeting |
| GO:1901605 | 0.0055 | 2.4717 | 5.1107 | 12 | 333 | alpha-amino acid metabolic process |
| GO:0045137 | 0.0059 | 2.8872 | 3.2843 | 9 | 214 | development of primary sexual characteristics |
| GO:0006915 | 0.006 | 1.6001 | 27.5793 | 41 | 1797 | apoptotic process |
| GO:0044260 | 0.0061 | 1.4299 | 101.4031 | 120 | 7081 | cellular macromolecule metabolic process |
| GO:0032774 | 0.0061 | 1.4721 | 50.4724 | 67 | 3420 | RNA biosynthetic process |
| GO:0051342 | 0.0062 | 21.5565 | 0.1228 | 2 | 8 | regulation of cyclic-nucleotide phosphodiesterase activity |
| GO:1902895 | 0.0062 | 21.5565 | 0.1228 | 2 | 8 | positive regulation of pri-miRNA transcription from RNA polymerase II promoter |
| GO:0009749 | 0.0063 | 3.0885 | 2.7318 | 8 | 178 | response to glucose |
| GO:0000083 | 0.0064 | 8.8464 | 0.3837 | 3 | 25 | regulation of transcription involved in G1/S transition of mitotic cell cycle |
| GO:0051412 | 0.0064 | 8.8464 | 0.3837 | 3 | 25 | response to corticosterone |
| GO:0070918 | 0.0064 | 8.8464 | 0.3837 | 3 | 25 | production of small RNA involved in gene silencing by RNA |
| GO:0010467 | 0.0065 | 1.9346 | 11.7364 | 21 | 870 | gene expression |
| GO:0045639 | 0.0069 | 4.4663 | 1.1971 | 5 | 78 | positive regulation of myeloid cell differentiation |
| GO:0006351 | 0.0071 | 1.4473 | 53.3936 | 70 | 3479 | transcription, DNA-templated |
| GO:0033120 | 0.0072 | 8.4613 | 0.399 | 3 | 26 | positive regulation of RNA splicing |
| GO:0051125 | 0.0072 | 8.4613 | 0.399 | 3 | 26 | regulation of actin nucleation |
| GO:0034470 | 0.0072 | 2.4879 | 4.6448 | 11 | 305 | ncRNA processing |
| GO:2000106 | 0.0077 | 4.3466 | 1.2278 | 5 | 80 | regulation of leukocyte apoptotic process |
| GO:0031053 | 0.0079 | 18.4758 | 0.1381 | 2 | 9 | primary miRNA processing |
| GO:0006606 | 0.008 | 2.5816 | 4.0671 | 10 | 265 | protein import into nucleus |
| GO:0070229 | 0.008 | 8.1082 | 0.4144 | 3 | 27 | negative regulation of lymphocyte apoptotic process |
| GO:0051171 | 0.0082 | 1.4159 | 62.0034 | 79 | 4040 | regulation of nitrogen compound metabolic process |
| GO:0051252 | 0.0084 | 1.4367 | 52.8564 | 69 | 3444 | regulation of RNA metabolic process |
| GO:0002377 | 0.0086 | 4.2332 | 1.2585 | 5 | 82 | immunoglobulin production |
| GO:0051170 | 0.0088 | 2.5411 | 4.1284 | 10 | 269 | nuclear import |
| GO:0006953 | 0.0088 | 5.3089 | 0.8134 | 4 | 53 | acute-phase response |
| GO:0006308 | 0.0088 | 7.7834 | 0.4297 | 3 | 28 | DNA catabolic process |
| GO:1901522 | 0.0088 | 7.7834 | 0.4297 | 3 | 28 | positive regulation of transcription from RNA polymerase II promoter involved in cellular response to chemical stimulus |
| GO:0043043 | 0.0088 | 1.9519 | 9.6995 | 18 | 632 | peptide biosynthetic process |
| GO:0034284 | 0.0091 | 2.8826 | 2.916 | 8 | 190 | response to monosaccharide |
| GO:0043069 | 0.0093 | 1.8148 | 12.7844 | 22 | 833 | negative regulation of programmed cell death |
| GO:0019043 | 0.0097 | 16.1653 | 0.1535 | 2 | 10 | establishment of viral latency |
| GO:0033690 | 0.0097 | 16.1653 | 0.1535 | 2 | 10 | positive regulation of osteoblast proliferation |
| GO:0042747 | 0.0097 | 16.1653 | 0.1535 | 2 | 10 | circadian sleep/wake cycle, REM sleep |
| GO:0051024 | 0.0097 | 16.1653 | 0.1535 | 2 | 10 | positive regulation of immunoglobulin secretion |
| GO:0060992 | 0.0097 | 16.1653 | 0.1535 | 2 | 10 | response to fungicide |
| GOMFID | Pvalue | OddsRatio | ExpCount | Count | Size | Term |
| GO:0009593 | 0 | 5.0183 | 4.8251 | 21 | 451 | detection of chemical stimulus |
| GO:0050911 | 0 | 5.5163 | 3.9585 | 19 | 370 | detection of chemical stimulus involved in sensory perception of smell |
| GO:0007606 | 0 | 4.5931 | 4.9641 | 20 | 464 | sensory perception of chemical stimulus |
| GO:0050906 | 0 | 4.5931 | 4.9641 | 20 | 464 | detection of stimulus involved in sensory perception |
| GO:0007186 | 0 | 2.7713 | 12.4104 | 30 | 1160 | G-protein coupled receptor signaling pathway |
| GO:0050877 | 0 | 2.635 | 12.9881 | 30 | 1214 | neurological system process |
| GO:0002317 | 7e-04 | 93.5723 | 0.0428 | 2 | 4 | plasma cell differentiation |
| GO:0051602 | 0.0011 | 9.6911 | 0.46 | 4 | 43 | response to electrical stimulus |
| GO:0055082 | 0.0013 | 2.528 | 6.815 | 16 | 637 | cellular chemical homeostasis |
| GO:0048247 | 0.002 | 8.2126 | 0.5349 | 4 | 50 | lymphocyte chemotaxis |
| GO:0090313 | 0.0029 | 11.7508 | 0.2889 | 3 | 27 | regulation of protein targeting to membrane |
| GO:0032501 | 0.003 | 1.5494 | 71.9052 | 90 | 6721 | multicellular organismal process |
| GO:0015684 | 0.0031 | 31.1827 | 0.0856 | 2 | 8 | ferrous iron transport |
| GO:0051971 | 0.0031 | 31.1827 | 0.0856 | 2 | 8 | positive regulation of transmission of nerve impulse |
| GO:0045861 | 0.0038 | 2.8982 | 3.6589 | 10 | 342 | negative regulation of proteolysis |
| GO:0010459 | 0.0039 | 26.7263 | 0.0963 | 2 | 9 | negative regulation of heart rate |
| GO:0039530 | 0.0039 | 26.7263 | 0.0963 | 2 | 9 | MDA-5 signaling pathway |
| GO:0060586 | 0.0039 | 26.7263 | 0.0963 | 2 | 9 | multicellular organismal iron ion homeostasis |
| GO:0071281 | 0.0048 | 23.384 | 0.107 | 2 | 10 | cellular response to iron ion |
| GO:0032530 | 0.0059 | 20.7845 | 0.1177 | 2 | 11 | regulation of microvillus organization |
| GO:0090009 | 0.0059 | 20.7845 | 0.1177 | 2 | 11 | primitive streak formation |
| GO:0031668 | 0.0059 | 3.4381 | 2.1504 | 7 | 201 | cellular response to extracellular stimulus |
| GO:0032435 | 0.0067 | 5.7166 | 0.7489 | 4 | 70 | negative regulation of proteasomal ubiquitin-dependent protein catabolic process |
| GO:0042110 | 0.0068 | 2.5153 | 4.6218 | 11 | 432 | T cell activation |
| GO:0071593 | 0.007 | 2.5092 | 4.6325 | 11 | 433 | lymphocyte aggregation |
| GO:1904294 | 0.007 | 18.7048 | 0.1284 | 2 | 12 | positive regulation of ERAD pathway |
| GO:0032964 | 0.0077 | 8.0519 | 0.4065 | 3 | 38 | collagen biosynthetic process |
| GO:0071333 | 0.0079 | 4.3015 | 1.2303 | 5 | 115 | cellular response to glucose stimulus |
| GO:0001819 | 0.0084 | 2.5657 | 4.1083 | 10 | 384 | positive regulation of cytokine production |
| GO:0071326 | 0.0088 | 4.1864 | 1.2624 | 5 | 118 | cellular response to monosaccharide stimulus |
| GO:0030199 | 0.0089 | 7.6157 | 0.4279 | 3 | 40 | collagen fibril organization |
| GO:0009267 | 0.0094 | 4.1131 | 1.2838 | 5 | 120 | cellular response to starvation |
| GO:0006754 | 0.0095 | 7.4148 | 0.4386 | 3 | 41 | ATP biosynthetic process |
| GOMFID | Pvalue | OddsRatio | ExpCount | Count | Size | Term |
| GO:0070488 | 1e-04 | Inf | 0.0234 | 2 | 2 | neutrophil aggregation |
| GO:0006021 | 8e-04 | 85.2582 | 0.0469 | 2 | 4 | inositol biosynthetic process |
| GO:0035990 | 8e-04 | 85.2582 | 0.0469 | 2 | 4 | tendon cell differentiation |
| GO:0042401 | 0.001 | 18.3564 | 0.1992 | 3 | 17 | cellular biogenic amine biosynthetic process |
| GO:0001707 | 0.001 | 7.0785 | 0.7734 | 5 | 66 | mesoderm formation |
| GO:0006614 | 0.0013 | 5.4154 | 1.1952 | 6 | 102 | SRP-dependent cotranslational protein targeting to membrane |
| GO:0009446 | 0.0013 | 56.8352 | 0.0586 | 2 | 5 | putrescine biosynthetic process |
| GO:0001710 | 0.0013 | 16.0597 | 0.2226 | 3 | 19 | mesodermal cell fate commitment |
| GO:0072599 | 0.0019 | 4.9962 | 1.2889 | 6 | 110 | establishment of protein localization to endoplasmic reticulum |
| GO:0003129 | 0.002 | 42.6236 | 0.0703 | 2 | 6 | heart induction |
| GO:0009249 | 0.002 | 42.6236 | 0.0703 | 2 | 6 | protein lipoylation |
| GO:0035989 | 0.002 | 42.6236 | 0.0703 | 2 | 6 | tendon development |
| GO:0010862 | 0.0022 | 7.9979 | 0.5507 | 4 | 47 | positive regulation of pathway-restricted SMAD protein phosphorylation |
| GO:0061311 | 0.0024 | 12.8445 | 0.2695 | 3 | 23 | cell surface receptor signaling pathway involved in heart development |
| GO:0045992 | 0.0027 | 12.232 | 0.2812 | 3 | 24 | negative regulation of embryonic development |
| GO:0016259 | 0.0031 | 5.4593 | 0.9843 | 5 | 84 | selenocysteine metabolic process |
| GO:2001185 | 0.0037 | 28.4121 | 0.0937 | 2 | 8 | regulation of CD8-positive, alpha-beta T cell activation |
| GO:0002793 | 0.0039 | 5.1327 | 1.0429 | 5 | 89 | positive regulation of peptide secretion |
| GO:0060395 | 0.0042 | 6.6098 | 0.6562 | 4 | 56 | SMAD protein signal transduction |
| GO:1903707 | 0.0043 | 4.1849 | 1.5233 | 6 | 130 | negative regulation of hemopoiesis |
| GO:0007369 | 0.0052 | 3.5287 | 2.0974 | 7 | 179 | gastrulation |
| GO:2001235 | 0.0055 | 3.4877 | 2.1209 | 7 | 181 | positive regulation of apoptotic signaling pathway |
| GO:0002523 | 0.0058 | 21.3063 | 0.1172 | 2 | 10 | leukocyte migration involved in inflammatory response |
| GO:0009071 | 0.0058 | 21.3063 | 0.1172 | 2 | 10 | serine family amino acid catabolic process |
| GO:0018119 | 0.0058 | 21.3063 | 0.1172 | 2 | 10 | peptidyl-cysteine S-nitrosylation |
| GO:0097286 | 0.0058 | 21.3063 | 0.1172 | 2 | 10 | iron ion import |
| GO:0006612 | 0.0058 | 3.4476 | 2.1443 | 7 | 183 | protein targeting to membrane |
| GO:0010092 | 0.0061 | 8.8531 | 0.375 | 3 | 32 | specification of organ identity |
| GO:0002695 | 0.0061 | 3.8701 | 1.6405 | 6 | 140 | negative regulation of leukocyte activation |
| GO:0048708 | 0.0063 | 5.823 | 0.7382 | 4 | 63 | astrocyte differentiation |
| GO:0031128 | 0.0067 | 8.5575 | 0.3867 | 3 | 33 | developmental induction |
| GO:0060433 | 0.007 | 18.9377 | 0.1289 | 2 | 11 | bronchus development |
| GO:2000105 | 0.007 | 18.9377 | 0.1289 | 2 | 11 | positive regulation of DNA-dependent DNA replication |
| GO:0003156 | 0.0073 | 8.2809 | 0.3984 | 3 | 34 | regulation of organ formation |
| GO:0071773 | 0.0075 | 3.7028 | 1.7108 | 6 | 146 | cellular response to BMP stimulus |
| GO:0045646 | 0.0079 | 8.0216 | 0.4101 | 3 | 35 | regulation of erythrocyte differentiation |
| GO:0046165 | 0.008 | 3.6502 | 1.7342 | 6 | 148 | alcohol biosynthetic process |
| GO:0032119 | 0.0083 | 17.0429 | 0.1406 | 2 | 12 | sequestering of zinc ion |
| GO:0060439 | 0.0083 | 17.0429 | 0.1406 | 2 | 12 | trachea morphogenesis |
| GO:0060536 | 0.0083 | 17.0429 | 0.1406 | 2 | 12 | cartilage morphogenesis |
| GO:0060272 | 0.0098 | 15.4925 | 0.1523 | 2 | 13 | embryonic skeletal joint morphogenesis |
| GOMFID | Pvalue | OddsRatio | ExpCount | Count | Size | Term |
| GO:0051135 | 1e-04 | 78.0507 | 0.0952 | 3 | 5 | positive regulation of NK T cell activation |
| GO:0033197 | 1e-04 | 18.9744 | 0.2856 | 4 | 15 | response to vitamin E |
| GO:1902626 | 4e-04 | Inf | 0.0381 | 2 | 2 | assembly of large subunit precursor of preribosome |
| GO:0071704 | 5e-04 | 1.5326 | 191.0378 | 218 | 10033 | organic substance metabolic process |
| GO:0070966 | 0.0011 | 103.7239 | 0.0571 | 2 | 3 | nuclear-transcribed mRNA catabolic process, no-go decay |
| GO:0042273 | 0.0012 | 7.0633 | 0.7997 | 5 | 42 | ribosomal large subunit biogenesis |
| GO:0098542 | 0.0019 | 2.1325 | 10.4344 | 21 | 548 | defense response to other organism |
| GO:0042520 | 0.0021 | 51.8586 | 0.0762 | 2 | 4 | positive regulation of tyrosine phosphorylation of Stat4 protein |
| GO:0043137 | 0.0021 | 51.8586 | 0.0762 | 2 | 4 | DNA replication, removal of RNA primer |
| GO:1902822 | 0.0021 | 51.8586 | 0.0762 | 2 | 4 | regulation of late endosome to lysosome transport |
| GO:0010467 | 0.0022 | 1.4215 | 95.3761 | 119 | 5009 | gene expression |
| GO:0034375 | 0.0026 | 13 | 0.2856 | 3 | 15 | high-density lipoprotein particle remodeling |
| GO:0035458 | 0.0026 | 13 | 0.2856 | 3 | 15 | cellular response to interferon-beta |
| GO:0006139 | 0.0029 | 1.4006 | 100.898 | 124 | 5299 | nucleobase-containing compound metabolic process |
| GO:0016126 | 0.003 | 5.5569 | 0.9901 | 5 | 52 | sterol biosynthetic process |
| GO:0048255 | 0.003 | 7.446 | 0.6093 | 4 | 32 | mRNA stabilization |
| GO:0031100 | 0.0037 | 4.3606 | 1.4852 | 6 | 78 | organ regeneration |
| GO:0008535 | 0.0038 | 11.1414 | 0.3237 | 3 | 17 | respiratory chain complex IV assembly |
| GO:0034502 | 0.0039 | 5.2224 | 1.0473 | 5 | 55 | protein localization to chromosome |
| GO:0007034 | 0.0047 | 4.1301 | 1.5614 | 6 | 82 | vacuolar transport |
| GO:0032481 | 0.0047 | 4.1301 | 1.5614 | 6 | 82 | positive regulation of type I interferon production |
| GO:0016070 | 0.0049 | 1.3953 | 80.4994 | 101 | 4254 | RNA metabolic process |
| GO:0043487 | 0.0049 | 3.23 | 2.6277 | 8 | 138 | regulation of RNA stability |
| GO:0044260 | 0.0055 | 1.4734 | 63.6944 | 81 | 3718 | cellular macromolecule metabolic process |
| GO:0000082 | 0.0059 | 2.5651 | 4.5127 | 11 | 237 | G1/S transition of mitotic cell cycle |
| GO:0046907 | 0.0061 | 1.5302 | 34.2356 | 49 | 1798 | intracellular transport |
| GO:1903650 | 0.0062 | 3.4272 | 2.1707 | 7 | 114 | negative regulation of cytoplasmic transport |
| GO:0060828 | 0.0064 | 2.531 | 4.5698 | 11 | 240 | regulation of canonical Wnt signaling pathway |
| GO:0044238 | 0.0071 | 1.4706 | 74.5146 | 91 | 4430 | primary metabolic process |
| GO:0009057 | 0.0079 | 1.6389 | 21.2687 | 33 | 1117 | macromolecule catabolic process |
| GO:0032660 | 0.008 | 8.2068 | 0.4189 | 3 | 22 | regulation of interleukin-17 production |
| GO:0007050 | 0.0081 | 2.4443 | 4.7222 | 11 | 248 | cell cycle arrest |
| GO:0051726 | 0.0085 | 1.6687 | 18.9457 | 30 | 995 | regulation of cell cycle |
| GO:0048002 | 0.0088 | 2.7007 | 3.5035 | 9 | 184 | antigen processing and presentation of peptide antigen |
| GO:0006891 | 0.0089 | 5.342 | 0.8188 | 4 | 43 | intra-Golgi vesicle-mediated transport |
| GO:0090281 | 0.0091 | 7.7959 | 0.4379 | 3 | 23 | negative regulation of calcium ion import |
| GO:0002589 | 0.0094 | 17.2817 | 0.1523 | 2 | 8 | regulation of antigen processing and presentation of peptide antigen via MHC class I |
| GO:0006273 | 0.0094 | 17.2817 | 0.1523 | 2 | 8 | lagging strand elongation |
| GO:2001185 | 0.0094 | 17.2817 | 0.1523 | 2 | 8 | regulation of CD8-positive, alpha-beta T cell activation |
| GO:0042325 | 0.0098 | 1.5448 | 27.419 | 40 | 1440 | regulation of phosphorylation |
| GOMFID | Pvalue | OddsRatio | ExpCount | Count | Size | Term |
| GO:1901566 | 0 | 2.1721 | 23.6439 | 46 | 1326 | organonitrogen compound biosynthetic process |
| GO:0009145 | 0 | 8.9621 | 0.9094 | 7 | 51 | purine nucleoside triphosphate biosynthetic process |
| GO:1901659 | 0 | 5.2521 | 2.1041 | 10 | 118 | glycosyl compound biosynthetic process |
| GO:0009201 | 1e-04 | 8.2131 | 0.9807 | 7 | 55 | ribonucleoside triphosphate biosynthetic process |
| GO:0006091 | 1e-04 | 2.8475 | 7.9883 | 21 | 448 | generation of precursor metabolites and energy |
| GO:0043604 | 1e-04 | 2.409 | 12.6243 | 28 | 708 | amide biosynthetic process |
| GO:0006754 | 1e-04 | 9.6275 | 0.7311 | 6 | 41 | ATP biosynthetic process |
| GO:0010792 | 1e-04 | 55.6679 | 0.107 | 3 | 6 | DNA double-strand break processing involved in repair via single-strand annealing |
| GO:0000002 | 1e-04 | 11.6659 | 0.5171 | 5 | 29 | mitochondrial genome maintenance |
| GO:0048490 | 2e-04 | 18.6123 | 0.2853 | 4 | 16 | anterograde synaptic vesicle transport |
| GO:0099514 | 2e-04 | 18.6123 | 0.2853 | 4 | 16 | synaptic vesicle cytoskeletal transport |
| GO:0042776 | 2e-04 | 17.1795 | 0.3031 | 4 | 17 | mitochondrial ATP synthesis coupled proton transport |
| GO:0010939 | 2e-04 | 10.3677 | 0.5706 | 5 | 32 | regulation of necrotic cell death |
| GO:0000042 | 2e-04 | 15.9513 | 0.321 | 4 | 18 | protein targeting to Golgi |
| GO:0015853 | 3e-04 | Inf | 0.0357 | 2 | 2 | adenine transport |
| GO:1902824 | 3e-04 | Inf | 0.0357 | 2 | 2 | positive regulation of late endosome to lysosome transport |
| GO:2000663 | 3e-04 | Inf | 0.0357 | 2 | 2 | negative regulation of interleukin-5 secretion |
| GO:2000666 | 3e-04 | Inf | 0.0357 | 2 | 2 | negative regulation of interleukin-13 secretion |
| GO:0034470 | 5e-04 | 2.8631 | 5.5989 | 15 | 314 | ncRNA processing |
| GO:0015985 | 7e-04 | 11.7498 | 0.4101 | 4 | 23 | energy coupled proton transport, down electrochemical gradient |
| GO:0034641 | 7e-04 | 1.4849 | 109.3396 | 136 | 6132 | cellular nitrogen compound metabolic process |
| GO:0036297 | 9e-04 | 7.5607 | 0.7489 | 5 | 42 | interstrand cross-link repair |
| GO:0009127 | 0.001 | 5.801 | 1.1412 | 6 | 64 | purine nucleoside monophosphate biosynthetic process |
| GO:0006518 | 0.001 | 2.0752 | 13.3911 | 26 | 751 | peptide metabolic process |
| GO:0006414 | 0.001 | 3.2611 | 3.6019 | 11 | 202 | translational elongation |
| GO:0042451 | 0.0011 | 4.739 | 1.6048 | 7 | 90 | purine nucleoside biosynthetic process |
| GO:0009069 | 0.0015 | 3.9849 | 2.1575 | 8 | 121 | serine family amino acid metabolic process |
| GO:0016072 | 0.0017 | 3.5238 | 2.7281 | 9 | 153 | rRNA metabolic process |
| GO:0045324 | 0.0018 | 15.1743 | 0.2496 | 3 | 14 | late endosome to vacuole transport |
| GO:0097411 | 0.0019 | 55.4712 | 0.0713 | 2 | 4 | hypoxia-inducible factor-1alpha signaling pathway |
| GO:1903335 | 0.0019 | 55.4712 | 0.0713 | 2 | 4 | regulation of vacuolar transport |
| GO:1904431 | 0.0019 | 55.4712 | 0.0713 | 2 | 4 | positive regulation of t-circle formation |
| GO:0009156 | 0.0022 | 4.8727 | 1.3373 | 6 | 75 | ribonucleoside monophosphate biosynthetic process |
| GO:0006399 | 0.0022 | 3.1364 | 3.3879 | 10 | 190 | tRNA metabolic process |
| GO:0047496 | 0.003 | 7.4362 | 0.6063 | 4 | 34 | vesicle transport along microtubule |
| GO:0042455 | 0.003 | 3.929 | 1.9079 | 7 | 107 | ribonucleoside biosynthetic process |
| GO:0015992 | 0.003 | 3.5145 | 2.425 | 8 | 136 | proton transport |
| GO:0006113 | 0.0031 | 36.9784 | 0.0892 | 2 | 5 | fermentation |
| GO:0061737 | 0.0031 | 36.9784 | 0.0892 | 2 | 5 | leukotriene signaling pathway |
| GO:0006415 | 0.0038 | 3.1091 | 3.0669 | 9 | 172 | translational termination |
| GO:0009141 | 0.0038 | 2.7252 | 4.2616 | 11 | 239 | nucleoside triphosphate metabolic process |
| GO:0000154 | 0.0044 | 10.4289 | 0.3388 | 3 | 19 | rRNA modification |
| GO:0046597 | 0.0044 | 10.4289 | 0.3388 | 3 | 19 | negative regulation of viral entry into host cell |
| GO:0000447 | 0.0045 | 27.732 | 0.107 | 2 | 6 | endonucleolytic cleavage in ITS1 to separate SSU-rRNA from 5.8S rRNA and LSU-rRNA from tricistronic rRNA transcript (SSU-rRNA, 5.8S rRNA, LSU-rRNA) |
| GO:0000966 | 0.0045 | 27.732 | 0.107 | 2 | 6 | RNA 5'-end processing |
| GO:0031119 | 0.0045 | 27.732 | 0.107 | 2 | 6 | tRNA pseudouridine synthesis |
| GO:0042518 | 0.0045 | 27.732 | 0.107 | 2 | 6 | negative regulation of tyrosine phosphorylation of Stat3 protein |
| GO:0055114 | 0.0049 | 1.7457 | 18.2233 | 30 | 1022 | oxidation-reduction process |
| GO:0008088 | 0.005 | 6.3718 | 0.6954 | 4 | 39 | axo-dendritic transport |
| GO:0009205 | 0.005 | 2.7769 | 3.798 | 10 | 213 | purine ribonucleoside triphosphate metabolic process |
| GO:0000027 | 0.0059 | 9.269 | 0.3745 | 3 | 21 | ribosomal large subunit assembly |
| GO:0030488 | 0.0059 | 9.269 | 0.3745 | 3 | 21 | tRNA methylation |
| GO:0032438 | 0.0059 | 9.269 | 0.3745 | 3 | 21 | melanosome organization |
| GO:0097300 | 0.006 | 6.0266 | 0.7311 | 4 | 41 | programmed necrotic cell death |
| GO:0045333 | 0.0062 | 2.8606 | 3.3166 | 9 | 186 | cellular respiration |
| GO:0015851 | 0.0063 | 22.1842 | 0.1248 | 2 | 7 | nucleobase transport |
| GO:0009165 | 0.0067 | 2.4041 | 5.2423 | 12 | 294 | nucleotide biosynthetic process |
| GO:0050911 | 0.0068 | 2.2275 | 6.5975 | 14 | 370 | detection of chemical stimulus involved in sensory perception of smell |
| GO:0006520 | 0.007 | 2.043 | 8.7372 | 17 | 490 | cellular amino acid metabolic process |
| GO:0006891 | 0.0071 | 5.7168 | 0.7667 | 4 | 43 | intra-Golgi vesicle-mediated transport |
| GO:0009451 | 0.0074 | 3.7264 | 1.7131 | 6 | 97 | RNA modification |
| GO:0097480 | 0.0082 | 3.6491 | 1.7474 | 6 | 98 | establishment of synaptic vesicle localization |
| GO:0060155 | 0.0083 | 18.4856 | 0.1426 | 2 | 8 | platelet dense granule organization |
| GO:0006412 | 0.0089 | 2.1529 | 6.8163 | 14 | 394 | translation |
| GO:0042274 | 0.0097 | 5.1837 | 0.8381 | 4 | 47 | ribosomal small subunit biogenesis |
| GOMFID | Pvalue | OddsRatio | ExpCount | Count | Size | Term |
| GO:0009059 | 1e-04 | 1.5162 | 117.9038 | 153 | 4898 | macromolecule biosynthetic process |
| GO:0015980 | 1e-04 | 2.7155 | 8.7381 | 22 | 363 | energy derivation by oxidation of organic compounds |
| GO:0006807 | 1e-04 | 1.4766 | 154.469 | 190 | 6417 | nitrogen compound metabolic process |
| GO:0006364 | 2e-04 | 3.6891 | 3.5386 | 12 | 147 | rRNA processing |
| GO:0043043 | 3e-04 | 2.1083 | 15.2134 | 30 | 632 | peptide biosynthetic process |
| GO:0007005 | 3e-04 | 2.0288 | 17.4039 | 33 | 723 | mitochondrion organization |
| GO:0045082 | 6e-04 | Inf | 0.0481 | 2 | 2 | positive regulation of interleukin-10 biosynthetic process |
| GO:0090304 | 8e-04 | 1.4174 | 114.2449 | 143 | 4746 | nucleic acid metabolic process |
| GO:0044710 | 0.0011 | 1.4122 | 115.2113 | 143 | 4900 | single-organism metabolic process |
| GO:0061418 | 0.0011 | 7.3233 | 0.7944 | 5 | 33 | regulation of transcription from RNA polymerase II promoter in response to hypoxia |
| GO:0051881 | 0.0013 | 5.5056 | 1.2215 | 6 | 51 | regulation of mitochondrial membrane potential |
| GO:0044271 | 0.0014 | 1.3994 | 109.8638 | 137 | 4564 | cellular nitrogen compound biosynthetic process |
| GO:0006725 | 0.0016 | 1.3759 | 132.1784 | 160 | 5491 | cellular aromatic compound metabolic process |
| GO:0006333 | 0.002 | 2.992 | 3.9237 | 11 | 163 | chromatin assembly or disassembly |
| GO:0071704 | 0.0021 | 1.3872 | 241.5127 | 268 | 10033 | organic substance metabolic process |
| GO:0044238 | 0.0022 | 1.38 | 234.1949 | 261 | 9729 | primary metabolic process |
| GO:2000112 | 0.0025 | 1.3961 | 88.1751 | 112 | 3663 | regulation of cellular macromolecule biosynthetic process |
| GO:0016568 | 0.0026 | 1.9391 | 13.6006 | 25 | 565 | chromatin modification |
| GO:0044267 | 0.003 | 1.3574 | 115.8096 | 141 | 4811 | cellular protein metabolic process |
| GO:0036297 | 0.0032 | 5.5387 | 1.011 | 5 | 42 | interstrand cross-link repair |
| GO:1903019 | 0.0033 | 12.252 | 0.3129 | 3 | 13 | negative regulation of glycoprotein metabolic process |
| GO:0010917 | 0.0034 | 40.7527 | 0.0963 | 2 | 4 | negative regulation of mitochondrial membrane potential |
| GO:0051541 | 0.0034 | 40.7527 | 0.0963 | 2 | 4 | elastin metabolic process |
| GO:0006414 | 0.0037 | 2.6117 | 4.8625 | 12 | 202 | translational elongation |
| GO:0046483 | 0.0037 | 1.3376 | 131.7451 | 157 | 5473 | heterocycle metabolic process |
| GO:0006396 | 0.0037 | 1.7583 | 18.5835 | 31 | 772 | RNA processing |
| GO:0006413 | 0.0037 | 2.3972 | 6.1624 | 14 | 256 | translational initiation |
| GO:0044249 | 0.0038 | 1.6642 | 26.0494 | 40 | 1204 | cellular biosynthetic process |
| GO:0034660 | 0.0039 | 1.9946 | 11.073 | 21 | 460 | ncRNA metabolic process |
| GO:0022411 | 0.0041 | 1.7615 | 17.9335 | 30 | 745 | cellular component disassembly |
| GO:1902803 | 0.0043 | 6.8186 | 0.674 | 4 | 28 | regulation of synaptic vesicle transport |
| GO:0000187 | 0.0051 | 2.9659 | 3.2256 | 9 | 134 | activation of MAPK activity |
| GO:0051135 | 0.0055 | 27.1667 | 0.1204 | 2 | 5 | positive regulation of NK T cell activation |
| GO:0033363 | 0.0055 | 6.2933 | 0.7222 | 4 | 30 | secretory granule organization |
| GO:0016570 | 0.0069 | 1.9988 | 9.4362 | 18 | 392 | histone modification |
| GO:0006357 | 0.0076 | 1.4598 | 41.3795 | 57 | 1719 | regulation of transcription from RNA polymerase II promoter |
| GO:1901362 | 0.0077 | 1.3236 | 100.5962 | 122 | 4179 | organic cyclic compound biosynthetic process |
| GO:0006868 | 0.0081 | 20.3737 | 0.1444 | 2 | 6 | glutamine transport |
| GO:0033601 | 0.0081 | 20.3737 | 0.1444 | 2 | 6 | positive regulation of mammary gland epithelial cell proliferation |
| GO:0071763 | 0.0081 | 20.3737 | 0.1444 | 2 | 6 | nuclear membrane organization |
| GO:2000370 | 0.0081 | 20.3737 | 0.1444 | 2 | 6 | positive regulation of clathrin-mediated endocytosis |
| GO:0060255 | 0.0082 | 1.2989 | 132.3229 | 155 | 5497 | regulation of macromolecule metabolic process |
| GO:0009267 | 0.0085 | 2.9369 | 2.8886 | 8 | 120 | cellular response to starvation |
| GO:0042832 | 0.0086 | 8.1653 | 0.4333 | 3 | 18 | defense response to protozoan |
| GO:0006334 | 0.0089 | 2.9107 | 2.9127 | 8 | 121 | nucleosome assembly |
| GO:0009069 | 0.0089 | 2.9107 | 2.9127 | 8 | 121 | serine family amino acid metabolic process |
| GO:0022904 | 0.0089 | 2.9107 | 2.9127 | 8 | 121 | respiratory electron transport chain |
| GO:0006323 | 0.0092 | 2.5277 | 4.1644 | 10 | 173 | DNA packaging |
| GOMFID | Pvalue | OddsRatio | ExpCount | Count | Size | Term |
| GO:0034470 | 1e-04 | 2.8594 | 7.1586 | 19 | 314 | ncRNA processing |
| GO:0006139 | 1e-04 | 1.4966 | 120.8076 | 154 | 5299 | nucleobase-containing compound metabolic process |
| GO:0031119 | 2e-04 | 43.2169 | 0.1368 | 3 | 6 | tRNA pseudouridine synthesis |
| GO:0071763 | 2e-04 | 43.2169 | 0.1368 | 3 | 6 | nuclear membrane organization |
| GO:0071704 | 2e-04 | 1.5126 | 228.7343 | 260 | 10033 | organic substance metabolic process |
| GO:0007005 | 3e-04 | 2.0817 | 16.4831 | 32 | 723 | mitochondrion organization |
| GO:0022616 | 4e-04 | 7.0522 | 0.9803 | 6 | 43 | DNA strand elongation |
| GO:0006399 | 4e-04 | 3.2291 | 4.3317 | 13 | 190 | tRNA metabolic process |
| GO:0006273 | 6e-04 | 25.9268 | 0.1824 | 3 | 8 | lagging strand elongation |
| GO:0048255 | 7e-04 | 8.0359 | 0.7295 | 5 | 32 | mRNA stabilization |
| GO:0051260 | 9e-04 | 2.7065 | 5.9047 | 15 | 259 | protein homooligomerization |
| GO:0006612 | 0.001 | 3.0776 | 4.1721 | 12 | 183 | protein targeting to membrane |
| GO:0044249 | 0.0011 | 1.403 | 131.5 | 160 | 5768 | cellular biosynthetic process |
| GO:0051085 | 0.0013 | 18.5167 | 0.228 | 3 | 10 | chaperone mediated protein folding requiring cofactor |
| GO:0009451 | 0.0013 | 3.6725 | 2.6446 | 9 | 116 | RNA modification |
| GO:0032781 | 0.0016 | 6.5722 | 0.8663 | 5 | 38 | positive regulation of ATPase activity |
| GO:0006448 | 0.0017 | 9.1145 | 0.5244 | 4 | 23 | regulation of translational elongation |
| GO:0043604 | 0.0017 | 1.9039 | 16.1411 | 29 | 708 | amide biosynthetic process |
| GO:1903310 | 0.0021 | 4.2304 | 1.8011 | 7 | 79 | positive regulation of chromatin modification |
| GO:0070525 | 0.0022 | 14.4 | 0.2736 | 3 | 12 | tRNA threonylcarbamoyladenosine metabolic process |
| GO:0000083 | 0.0023 | 8.2454 | 0.57 | 4 | 25 | regulation of transcription involved in G1/S transition of mitotic cell cycle |
| GO:0009059 | 0.0024 | 1.3781 | 111.6655 | 137 | 4898 | macromolecule biosynthetic process |
| GO:0014826 | 0.003 | 43.0983 | 0.0912 | 2 | 4 | vein smooth muscle contraction |
| GO:0043137 | 0.003 | 43.0983 | 0.0912 | 2 | 4 | DNA replication, removal of RNA primer |
| GO:0071389 | 0.003 | 43.0983 | 0.0912 | 2 | 4 | cellular response to mineralocorticoid stimulus |
| GO:0090646 | 0.003 | 43.0983 | 0.0912 | 2 | 4 | mitochondrial tRNA processing |
| GO:1904431 | 0.003 | 43.0983 | 0.0912 | 2 | 4 | positive regulation of t-circle formation |
| GO:0008380 | 0.0031 | 2.2337 | 8.025 | 17 | 352 | RNA splicing |
| GO:0016070 | 0.0032 | 1.3872 | 91.9024 | 115 | 4138 | RNA metabolic process |
| GO:0072599 | 0.0037 | 3.4158 | 2.5078 | 8 | 110 | establishment of protein localization to endoplasmic reticulum |
| GO:0044710 | 0.0038 | 1.3488 | 120.648 | 145 | 5292 | single-organism metabolic process |
| GO:0000045 | 0.0039 | 4.3423 | 1.5047 | 6 | 66 | autophagosome assembly |
| GO:0010467 | 0.0041 | 1.3721 | 97.4102 | 120 | 4403 | gene expression |
| GO:0001889 | 0.0044 | 3.0418 | 3.1462 | 9 | 138 | liver development |
| GO:0032747 | 0.005 | 28.7303 | 0.114 | 2 | 5 | positive regulation of interleukin-23 production |
| GO:0043456 | 0.005 | 28.7303 | 0.114 | 2 | 5 | regulation of pentose-phosphate shunt |
| GO:0051343 | 0.005 | 28.7303 | 0.114 | 2 | 5 | positive regulation of cyclic-nucleotide phosphodiesterase activity |
| GO:0051771 | 0.005 | 28.7303 | 0.114 | 2 | 5 | negative regulation of nitric-oxide synthase biosynthetic process |
| GO:0010608 | 0.0051 | 2.0214 | 9.8716 | 19 | 433 | posttranscriptional regulation of gene expression |
| GO:0048490 | 0.0053 | 9.9666 | 0.3648 | 3 | 16 | anterograde synaptic vesicle transport |
| GO:0099514 | 0.0053 | 9.9666 | 0.3648 | 3 | 16 | synaptic vesicle cytoskeletal transport |
| GO:0031062 | 0.0058 | 6.1812 | 0.7295 | 4 | 32 | positive regulation of histone methylation |
| GO:0071548 | 0.0058 | 6.1812 | 0.7295 | 4 | 32 | response to dexamethasone |
| GO:0031960 | 0.0059 | 2.7101 | 3.8985 | 10 | 171 | response to corticosteroid |
| GO:0035794 | 0.006 | 4.7109 | 1.1627 | 5 | 51 | positive regulation of mitochondrial membrane permeability |
| GO:0006412 | 0.0063 | 1.8227 | 13.8157 | 24 | 606 | translation |
| GO:0034641 | 0.0065 | 1.7779 | 16.3333 | 27 | 833 | cellular nitrogen compound metabolic process |
| GO:0006261 | 0.0065 | 3.0811 | 2.7586 | 8 | 121 | DNA-dependent DNA replication |
| GO:0031056 | 0.0072 | 3.0271 | 2.8042 | 8 | 123 | regulation of histone modification |
| GO:0010792 | 0.0073 | 21.5463 | 0.1368 | 2 | 6 | DNA double-strand break processing involved in repair via single-strand annealing |
| GO:0019388 | 0.0073 | 21.5463 | 0.1368 | 2 | 6 | galactose catabolic process |
| GO:0044829 | 0.0073 | 21.5463 | 0.1368 | 2 | 6 | positive regulation by host of viral genome replication |
| GO:2000382 | 0.0073 | 21.5463 | 0.1368 | 2 | 6 | positive regulation of mesoderm development |
| GO:0060795 | 0.008 | 5.5819 | 0.7979 | 4 | 35 | cell fate commitment involved in formation of primary germ layer |
| GO:0006397 | 0.0082 | 1.9629 | 9.598 | 18 | 421 | mRNA processing |
| GO:0006614 | 0.0088 | 3.2014 | 2.3254 | 7 | 102 | SRP-dependent cotranslational protein targeting to membrane |
| GO:0072384 | 0.0095 | 4.1657 | 1.2995 | 5 | 57 | organelle transport along microtubule |
| GO:0044283 | 0.0096 | 1.8274 | 12.0146 | 21 | 527 | small molecule biosynthetic process |
| GO:0061024 | 0.0099 | 1.5735 | 24.0293 | 36 | 1054 | membrane organization |
| GOMFID | Pvalue | OddsRatio | ExpCount | Count | Size | Term |
| GO:0045414 | 0.0046 | 24.118 | 0.1038 | 2 | 10 | regulation of interleukin-8 biosynthetic process |
| GO:0003337 | 0.0066 | 19.2919 | 0.1246 | 2 | 12 | mesenchymal to epithelial transition involved in metanephros morphogenesis |
| GO:0032230 | 0.0077 | 17.537 | 0.1349 | 2 | 13 | positive regulation of synaptic transmission, GABAergic |
| GO:0031058 | 0.008 | 5.4046 | 0.7889 | 4 | 76 | positive regulation of histone modification |
| GO:0009268 | 0.0082 | 7.8563 | 0.4152 | 3 | 40 | response to pH |
| GO:0090128 | 0.009 | 16.0745 | 0.1453 | 2 | 14 | regulation of synapse maturation |
| GO:0050906 | 0.0092 | 2.4102 | 4.8164 | 11 | 464 | detection of stimulus involved in sensory perception |
| GOMFID | Pvalue | OddsRatio | ExpCount | Count | Size | Term |
| GO:0007005 | 3e-04 | 2.2116 | 13.6285 | 28 | 723 | mitochondrion organization |
| GO:0042254 | 3e-04 | 3.3567 | 4.1658 | 13 | 221 | ribosome biogenesis |
| GO:0045082 | 4e-04 | Inf | 0.0377 | 2 | 2 | positive regulation of interleukin-10 biosynthetic process |
| GO:0016072 | 7e-04 | 3.7322 | 2.884 | 10 | 153 | rRNA metabolic process |
| GO:0015891 | 0.001 | 104.8027 | 0.0565 | 2 | 3 | siderophore transport |
| GO:0009987 | 0.0022 | 2.3951 | 71.5329 | 83 | 4588 | cellular process |
| GO:0010467 | 0.0031 | 1.4049 | 94.4192 | 117 | 5009 | gene expression |
| GO:0061087 | 0.0034 | 34.9297 | 0.0942 | 2 | 5 | positive regulation of histone H3-K27 methylation |
| GO:0090630 | 0.0045 | 6.5818 | 0.6786 | 4 | 36 | activation of GTPase activity |
| GO:0034551 | 0.0051 | 26.1956 | 0.1131 | 2 | 6 | mitochondrial respiratory chain complex III assembly |
| GO:1902177 | 0.0051 | 26.1956 | 0.1131 | 2 | 6 | positive regulation of oxidative stress-induced intrinsic apoptotic signaling pathway |
| GO:0000154 | 0.0051 | 9.8492 | 0.3581 | 3 | 19 | rRNA modification |
| GO:0006259 | 0.0052 | 1.7549 | 17.4739 | 29 | 927 | DNA metabolic process |
| GO:0006139 | 0.0057 | 1.3659 | 99.8856 | 121 | 5299 | nucleobase-containing compound metabolic process |
| GO:0034645 | 0.006 | 1.3727 | 89.5182 | 110 | 4749 | cellular macromolecule biosynthetic process |
| GO:0046173 | 0.0061 | 6.0164 | 0.7351 | 4 | 39 | polyol biosynthetic process |
| GO:0032259 | 0.0061 | 2.2542 | 6.5221 | 14 | 346 | methylation |
| GO:0009268 | 0.0066 | 5.8489 | 0.754 | 4 | 40 | response to pH |
| GO:0034470 | 0.0068 | 2.3054 | 5.9189 | 13 | 314 | ncRNA processing |
| GO:0006782 | 0.007 | 20.9551 | 0.1319 | 2 | 7 | protoporphyrinogen IX biosynthetic process |
| GO:0032049 | 0.007 | 20.9551 | 0.1319 | 2 | 7 | cardiolipin biosynthetic process |
| GO:0060710 | 0.007 | 20.9551 | 0.1319 | 2 | 7 | chorio-allantoic fusion |
| GO:0006807 | 0.0074 | 1.3419 | 120.9598 | 142 | 6417 | nitrogen compound metabolic process |
| GO:0016071 | 0.0083 | 1.8897 | 11.1026 | 20 | 589 | mRNA metabolic process |
| GO:0017004 | 0.0089 | 7.8773 | 0.4335 | 3 | 23 | cytochrome complex assembly |
| GO:0016584 | 0.0092 | 17.4615 | 0.1508 | 2 | 8 | nucleosome positioning |
| GO:0009058 | 0.0095 | 1.3302 | 111.9684 | 132 | 5940 | biosynthetic process |
| GO:0044237 | 0.0098 | 1.3465 | 182.3539 | 202 | 9674 | cellular metabolic process |
| GOMFID | Pvalue | OddsRatio | ExpCount | Count | Size | Term |
| GO:1901360 | 0 | 1.6306 | 98.4388 | 130 | 5704 | organic cyclic compound metabolic process |
| GO:0046483 | 1e-04 | 1.6144 | 94.4522 | 125 | 5473 | heterocycle metabolic process |
| GO:0006725 | 1e-04 | 1.6061 | 94.7628 | 125 | 5491 | cellular aromatic compound metabolic process |
| GO:0034641 | 5e-04 | 1.5155 | 105.8251 | 133 | 6132 | cellular nitrogen compound metabolic process |
| GO:0036378 | 9e-04 | 114.7286 | 0.0518 | 2 | 3 | calcitriol biosynthetic process from calciol |
| GO:0044107 | 9e-04 | 114.7286 | 0.0518 | 2 | 3 | cellular alcohol metabolic process |
| GO:0044249 | 0.0013 | 1.4629 | 99.5433 | 124 | 5768 | cellular biosynthetic process |
| GO:0090304 | 0.0015 | 2.4257 | 7.5724 | 17 | 484 | nucleic acid metabolic process |
| GO:1901576 | 0.0017 | 1.4468 | 101.1655 | 125 | 5862 | organic substance biosynthetic process |
| GO:0006397 | 0.0027 | 2.3281 | 7.2656 | 16 | 421 | mRNA processing |
| GO:0051343 | 0.0029 | 38.2379 | 0.0863 | 2 | 5 | positive regulation of cyclic-nucleotide phosphodiesterase activity |
| GO:0060718 | 0.0029 | 38.2379 | 0.0863 | 2 | 5 | chorionic trophoblast cell differentiation |
| GO:0032465 | 0.0037 | 5.2553 | 1.0355 | 5 | 60 | regulation of cytokinesis |
| GO:0044238 | 0.0042 | 1.4235 | 167.9016 | 189 | 9729 | primary metabolic process |
| GO:0015980 | 0.0043 | 2.3543 | 6.2646 | 14 | 363 | energy derivation by oxidation of organic compounds |
| GO:0046697 | 0.0054 | 9.5858 | 0.3624 | 3 | 21 | decidualization |
| GO:0032049 | 0.0059 | 22.9398 | 0.1208 | 2 | 7 | cardiolipin biosynthetic process |
| GO:0042023 | 0.0059 | 22.9398 | 0.1208 | 2 | 7 | DNA endoreduplication |
| GO:0044332 | 0.0059 | 22.9398 | 0.1208 | 2 | 7 | Wnt signaling pathway involved in dorsal/ventral axis specification |
| GO:0060406 | 0.0059 | 22.9398 | 0.1208 | 2 | 7 | positive regulation of penile erection |
| GO:1903430 | 0.0059 | 22.9398 | 0.1208 | 2 | 7 | negative regulation of cell maturation |
| GO:1903867 | 0.0059 | 22.9398 | 0.1208 | 2 | 7 | extraembryonic membrane development |
| GO:2000288 | 0.0059 | 22.9398 | 0.1208 | 2 | 7 | positive regulation of myoblast proliferation |
| GO:0042981 | 0.0061 | 1.6295 | 24.1955 | 37 | 1402 | regulation of apoptotic process |
| GO:0051055 | 0.0069 | 5.7648 | 0.7593 | 4 | 44 | negative regulation of lipid biosynthetic process |
| GO:0008053 | 0.007 | 8.6261 | 0.3969 | 3 | 23 | mitochondrial fusion |
| GO:0032897 | 0.007 | 8.6261 | 0.3969 | 3 | 23 | negative regulation of viral transcription |
| GO:0034654 | 0.0076 | 1.3957 | 68.8933 | 87 | 3992 | nucleobase-containing compound biosynthetic process |
| GO:0016070 | 0.0076 | 1.3881 | 73.553 | 92 | 4262 | RNA metabolic process |
| GO:0001839 | 0.0078 | 19.1152 | 0.1381 | 2 | 8 | neural plate morphogenesis |
| GO:0031077 | 0.0078 | 19.1152 | 0.1381 | 2 | 8 | post-embryonic camera-type eye development |
| GO:0045617 | 0.0078 | 19.1152 | 0.1381 | 2 | 8 | negative regulation of keratinocyte differentiation |
| GO:0010906 | 0.0085 | 3.617 | 1.7603 | 6 | 102 | regulation of glucose metabolic process |
| GO:0001649 | 0.0091 | 2.6841 | 3.5206 | 9 | 204 | osteoblast differentiation |
| GO:0044711 | 0.0098 | 1.533 | 29.183 | 42 | 1691 | single-organism biosynthetic process |
| GO:0031943 | 0.0099 | 16.3834 | 0.1553 | 2 | 9 | regulation of glucocorticoid metabolic process |
| GOMFID | Pvalue | OddsRatio | ExpCount | Count | Size | Term |
| GO:0043241 | 0 | 4.2843 | 4.3946 | 17 | 304 | protein complex disassembly |
| GO:0006415 | 0 | 5.3428 | 2.4864 | 12 | 172 | translational termination |
| GO:0006614 | 0 | 6.8288 | 1.4745 | 9 | 102 | SRP-dependent cotranslational protein targeting to membrane |
| GO:0019083 | 0 | 4.9084 | 2.6888 | 12 | 186 | viral transcription |
| GO:0043603 | 0 | 2.5137 | 13.2126 | 30 | 914 | cellular amide metabolic process |
| GO:0016259 | 0 | 7.4021 | 1.2143 | 8 | 84 | selenocysteine metabolic process |
| GO:0072599 | 0 | 6.2846 | 1.5901 | 9 | 110 | establishment of protein localization to endoplasmic reticulum |
| GO:0006414 | 0 | 4.4904 | 2.9201 | 12 | 202 | translational elongation |
| GO:0000184 | 0 | 6.0436 | 1.648 | 9 | 114 | nuclear-transcribed mRNA catabolic process, nonsense-mediated decay |
| GO:0044033 | 0 | 4.3738 | 2.9924 | 12 | 207 | multi-organism metabolic process |
| GO:0031047 | 1e-04 | 5.0847 | 2.1539 | 10 | 149 | gene silencing by RNA |
| GO:0006612 | 1e-04 | 4.5312 | 2.6454 | 11 | 183 | protein targeting to membrane |
| GO:0006413 | 1e-04 | 3.8081 | 3.7007 | 13 | 256 | translational initiation |
| GO:0043043 | 1e-04 | 2.6154 | 9.1361 | 22 | 632 | peptide biosynthetic process |
| GO:0030220 | 1e-04 | 18.4885 | 0.2747 | 4 | 19 | platelet formation |
| GO:0006402 | 2e-04 | 4.0754 | 2.9201 | 11 | 202 | mRNA catabolic process |
| GO:0017187 | 6e-04 | 23.0164 | 0.1735 | 3 | 12 | peptidyl-glutamic acid carboxylation |
| GO:0010641 | 6e-04 | 137.5556 | 0.0434 | 2 | 3 | positive regulation of platelet-derived growth factor receptor signaling pathway |
| GO:0019058 | 6e-04 | 2.7183 | 6.3027 | 16 | 436 | viral life cycle |
| GO:0022411 | 0.0012 | 2.1898 | 10.7696 | 22 | 745 | cellular component disassembly |
| GO:0007598 | 0.0012 | 68.7733 | 0.0578 | 2 | 4 | blood coagulation, extrinsic pathway |
| GO:0044265 | 0.0013 | 2.0677 | 12.9958 | 25 | 899 | cellular macromolecule catabolic process |
| GO:0034655 | 0.0013 | 2.7059 | 5.5077 | 14 | 381 | nucleobase-containing compound catabolic process |
| GO:0019896 | 0.002 | 45.8459 | 0.0723 | 2 | 5 | axon transport of mitochondrion |
| GO:0032571 | 0.002 | 45.8459 | 0.0723 | 2 | 5 | response to vitamin K |
| GO:0042989 | 0.002 | 45.8459 | 0.0723 | 2 | 5 | sequestering of actin monomers |
| GO:0006465 | 0.0021 | 13.8045 | 0.2602 | 3 | 18 | signal peptide processing |
| GO:0001938 | 0.0028 | 5.5994 | 0.9685 | 5 | 67 | positive regulation of endothelial cell proliferation |
| GO:0006354 | 0.0028 | 3.9716 | 1.8793 | 7 | 130 | DNA-templated transcription, elongation |
| GO:0002866 | 0.003 | 34.3822 | 0.0867 | 2 | 6 | positive regulation of acute inflammatory response to antigenic stimulus |
| GO:0032103 | 0.0032 | 2.7943 | 4.1633 | 11 | 288 | positive regulation of response to external stimulus |
| GO:0050927 | 0.0048 | 9.8565 | 0.3469 | 3 | 24 | positive regulation of positive chemotaxis |
| GO:0071345 | 0.005 | 1.9976 | 10.6106 | 20 | 734 | cellular response to cytokine stimulus |
| GO:0048520 | 0.0052 | 3.5364 | 2.0961 | 7 | 145 | positive regulation of behavior |
| GO:0010467 | 0.0053 | 1.4365 | 72.4093 | 91 | 5009 | gene expression |
| GO:0030219 | 0.0054 | 6.1509 | 0.7083 | 4 | 49 | megakaryocyte differentiation |
| GO:0017183 | 0.0055 | 22.9185 | 0.1156 | 2 | 8 | peptidyl-diphthamide biosynthetic process from peptidyl-histidine |
| GO:0072610 | 0.0055 | 22.9185 | 0.1156 | 2 | 8 | interleukin-12 secretion |
| GO:0009059 | 0.006 | 1.4305 | 70.8047 | 89 | 4898 | macromolecule biosynthetic process |
| GO:0002690 | 0.006 | 4.6249 | 1.1565 | 5 | 80 | positive regulation of leukocyte chemotaxis |
| GO:0016482 | 0.0061 | 1.8204 | 14.6233 | 25 | 1033 | cytoplasmic transport |
| GO:0032329 | 0.007 | 19.6432 | 0.1301 | 2 | 9 | serine transport |
| GO:0006886 | 0.0072 | 1.8138 | 14.0366 | 24 | 971 | intracellular protein transport |
| GO:0044403 | 0.0072 | 1.8926 | 11.7381 | 21 | 812 | symbiosis, encompassing mutualism through parasitism |
| GO:0097529 | 0.0074 | 3.2953 | 2.2407 | 7 | 155 | myeloid leukocyte migration |
| GO:1902582 | 0.0074 | 1.6255 | 23.7654 | 36 | 1644 | single-organism intracellular transport |
| GO:0009058 | 0.008 | 1.3967 | 85.8677 | 104 | 5940 | biosynthetic process |
| GO:0044271 | 0.0084 | 1.4143 | 65.9764 | 83 | 4564 | cellular nitrogen compound biosynthetic process |
| GO:1904030 | 0.0086 | 4.2282 | 1.2577 | 5 | 87 | negative regulation of cyclin-dependent protein kinase activity |
| GO:0018202 | 0.0087 | 17.1867 | 0.1446 | 2 | 10 | peptidyl-histidine modification |
| GO:0019043 | 0.0087 | 17.1867 | 0.1446 | 2 | 10 | establishment of viral latency |
| GO:0060158 | 0.0087 | 17.1867 | 0.1446 | 2 | 10 | phospholipase C-activating dopamine receptor signaling pathway |
| GO:0051384 | 0.009 | 3.1657 | 2.3274 | 7 | 161 | response to glucocorticoid |
| GO:0014911 | 0.0091 | 7.6632 | 0.4337 | 3 | 30 | positive regulation of smooth muscle cell migration |
| GO:0006888 | 0.0093 | 3.1451 | 2.3418 | 7 | 162 | ER to Golgi vesicle-mediated transport |
| GO:0071901 | 0.0093 | 3.5336 | 1.7925 | 6 | 124 | negative regulation of protein serine/threonine kinase activity |
| GO:1901605 | 0.0093 | 2.3967 | 4.8138 | 11 | 333 | alpha-amino acid metabolic process |
| GO:0006919 | 0.0094 | 4.127 | 1.2866 | 5 | 89 | activation of cysteine-type endopeptidase activity involved in apoptotic process |
| GO:0048661 | 0.0098 | 5.1227 | 0.8384 | 4 | 58 | positive regulation of smooth muscle cell proliferation |
| GO:0051646 | 0.0099 | 7.389 | 0.4481 | 3 | 31 | mitochondrion localization |
| GOMFID | Pvalue | OddsRatio | ExpCount | Count | Size | Term |
| GO:0006364 | 3e-04 | 4.4941 | 2.1762 | 9 | 125 | rRNA processing |
| GO:0034660 | 4e-04 | 2.6358 | 7.3105 | 18 | 421 | ncRNA metabolic process |
| GO:0000462 | 9e-04 | 10.7885 | 0.4394 | 4 | 25 | maturation of SSU-rRNA from tricistronic rRNA transcript (SSU-rRNA, 5.8S rRNA, LSU-rRNA) |
| GO:0006396 | 0.0012 | 2.0467 | 13.5689 | 26 | 772 | RNA processing |
| GO:0051771 | 0.003 | 37.528 | 0.0879 | 2 | 5 | negative regulation of nitric-oxide synthase biosynthetic process |
| GO:0098789 | 0.003 | 37.528 | 0.0879 | 2 | 5 | pre-mRNA cleavage required for polyadenylation |
| GO:0006402 | 0.0031 | 2.983 | 3.5504 | 10 | 202 | mRNA catabolic process |
| GO:0072599 | 0.0033 | 3.8715 | 1.9334 | 7 | 110 | establishment of protein localization to endoplasmic reticulum |
| GO:0000184 | 0.004 | 3.7258 | 2.0037 | 7 | 114 | nuclear-transcribed mRNA catabolic process, nonsense-mediated decay |
| GO:1902177 | 0.0044 | 28.1442 | 0.1055 | 2 | 6 | positive regulation of oxidative stress-induced intrinsic apoptotic signaling pathway |
| GO:0015931 | 0.0044 | 3.0252 | 3.1462 | 9 | 179 | nucleobase-containing compound transport |
| GO:0098781 | 0.0047 | 6.4672 | 0.6855 | 4 | 39 | ncRNA transcription |
| GO:0006403 | 0.0048 | 2.9896 | 3.1813 | 9 | 181 | RNA localization |
| GO:0050658 | 0.0049 | 3.2362 | 2.6189 | 8 | 149 | RNA transport |
| GO:0010193 | 0.0061 | 22.5139 | 0.123 | 2 | 7 | response to ozone |
| GO:0042045 | 0.0061 | 22.5139 | 0.123 | 2 | 7 | epithelial fluid transport |
| GO:0060040 | 0.0061 | 22.5139 | 0.123 | 2 | 7 | retinal bipolar neuron differentiation |
| GO:0000460 | 0.0065 | 8.9115 | 0.3867 | 3 | 22 | maturation of 5.8S rRNA |
| GO:0032930 | 0.008 | 18.7603 | 0.1406 | 2 | 8 | positive regulation of superoxide anion generation |
| GO:0071493 | 0.008 | 18.7603 | 0.1406 | 2 | 8 | cellular response to UV-B |
| GO:0022613 | 0.0082 | 2.3365 | 5.3858 | 12 | 310 | ribonucleoprotein complex biogenesis |
| GO:0042274 | 0.0092 | 5.2613 | 0.8261 | 4 | 47 | ribosomal small subunit biogenesis |
| GO:0006614 | 0.0092 | 3.5488 | 1.7928 | 6 | 102 | SRP-dependent cotranslational protein targeting to membrane |
| GO:0042255 | 0.0099 | 5.1414 | 0.8437 | 4 | 48 | ribosome assembly |
| GOMFID | Pvalue | OddsRatio | ExpCount | Count | Size | Term |
| GO:0044711 | 0 | 1.7451 | 47.1667 | 75 | 1691 | single-organism biosynthetic process |
| GO:0034645 | 2e-04 | 1.4368 | 132.4627 | 167 | 4749 | cellular macromolecule biosynthetic process |
| GO:0006048 | 4e-04 | 35.0851 | 0.1674 | 3 | 6 | UDP-N-acetylglucosamine biosynthetic process |
| GO:0006261 | 6e-04 | 3.5492 | 3.375 | 11 | 121 | DNA-dependent DNA replication |
| GO:0019369 | 0.0016 | 4.4915 | 1.7294 | 7 | 62 | arachidonic acid metabolic process |
| GO:0006807 | 0.0019 | 1.3315 | 178.9878 | 209 | 6417 | nitrogen compound metabolic process |
| GO:0035914 | 0.0024 | 4.1859 | 1.8409 | 7 | 66 | skeletal muscle cell differentiation |
| GO:0033108 | 0.003 | 3.9825 | 1.9246 | 7 | 69 | mitochondrial respiratory chain complex assembly |
| GO:0000079 | 0.0031 | 3.5314 | 2.4546 | 8 | 88 | regulation of cyclin-dependent protein serine/threonine kinase activity |
| GO:0006139 | 0.0034 | 1.3169 | 147.8037 | 175 | 5299 | nucleobase-containing compound metabolic process |
| GO:1901362 | 0.0036 | 1.3343 | 116.5638 | 142 | 4179 | organic cyclic compound biosynthetic process |
| GO:0006488 | 0.0042 | 3.7402 | 2.0362 | 7 | 73 | dolichol-linked oligosaccharide biosynthetic process |
| GO:0006041 | 0.0045 | 35.0069 | 0.1116 | 2 | 4 | glucosamine metabolic process |
| GO:0046292 | 0.0045 | 35.0069 | 0.1116 | 2 | 4 | formaldehyde metabolic process |
| GO:1901566 | 0.0049 | 1.5131 | 36.9858 | 53 | 1326 | organonitrogen compound biosynthetic process |
| GO:0043604 | 0.0051 | 1.701 | 19.7481 | 32 | 708 | amide biosynthetic process |
| GO:0009058 | 0.0053 | 1.3393 | 110.0761 | 133 | 4249 | biosynthetic process |
| GO:0018130 | 0.0055 | 1.3177 | 113.133 | 137 | 4056 | heterocycle biosynthetic process |
| GO:0044271 | 0.0062 | 1.3257 | 104.4039 | 127 | 3856 | cellular nitrogen compound biosynthetic process |
| GO:0030150 | 0.0062 | 9.5636 | 0.3905 | 3 | 14 | protein import into mitochondrial matrix |
| GO:0006760 | 0.0063 | 6.1078 | 0.7531 | 4 | 27 | folic acid-containing compound metabolic process |
| GO:0010557 | 0.0071 | 1.4441 | 44.6005 | 61 | 1599 | positive regulation of macromolecule biosynthetic process |
| GO:0051122 | 0.0073 | 23.3364 | 0.1395 | 2 | 5 | hepoxilin biosynthetic process |
| GO:0061370 | 0.0073 | 23.3364 | 0.1395 | 2 | 5 | testosterone biosynthetic process |
| GO:0007059 | 0.0087 | 2.0957 | 7.5032 | 15 | 269 | chromosome segregation |
| GO:0070124 | 0.009 | 3.2035 | 2.343 | 7 | 84 | mitochondrial translational initiation |
| GO:0019637 | 0.0094 | 1.5304 | 28.0601 | 41 | 1006 | organophosphate metabolic process |
| GOMFID | Pvalue | OddsRatio | ExpCount | Count | Size | Term |
| GO:0044238 | 0 | 1.6067 | 257.7383 | 300 | 9729 | primary metabolic process |
| GO:0010467 | 1e-04 | 1.4921 | 132.6972 | 170 | 5009 | gene expression |
| GO:0009058 | 1e-04 | 1.4655 | 157.361 | 195 | 5940 | biosynthetic process |
| GO:0090304 | 1e-04 | 1.4737 | 125.7299 | 161 | 4746 | nucleic acid metabolic process |
| GO:0044267 | 2e-04 | 1.4443 | 127.4518 | 161 | 4811 | cellular protein metabolic process |
| GO:0009451 | 3e-04 | 3.9271 | 3.073 | 11 | 116 | RNA modification |
| GO:0006725 | 4e-04 | 1.7335 | 35.0498 | 55 | 1432 | cellular aromatic compound metabolic process |
| GO:0016071 | 5e-04 | 2.0477 | 15.6036 | 30 | 589 | mRNA metabolic process |
| GO:0044710 | 6e-04 | 1.3998 | 140.1944 | 172 | 5292 | single-organism metabolic process |
| GO:0032446 | 6e-04 | 1.8441 | 22.5445 | 39 | 851 | protein modification by small protein conjugation |
| GO:0006415 | 7e-04 | 3.0692 | 4.5566 | 13 | 172 | translational termination |
| GO:0031398 | 7e-04 | 3.0692 | 4.5566 | 13 | 172 | positive regulation of protein ubiquitination |
| GO:1902361 | 7e-04 | Inf | 0.053 | 2 | 2 | mitochondrial pyruvate transmembrane transport |
| GO:0006414 | 0.001 | 2.797 | 5.3513 | 14 | 202 | translational elongation |
| GO:0034641 | 0.001 | 1.6922 | 33.1991 | 51 | 1401 | cellular nitrogen compound metabolic process |
| GO:0044271 | 0.0011 | 1.3891 | 120.9084 | 150 | 4564 | cellular nitrogen compound biosynthetic process |
| GO:0043487 | 0.0011 | 3.2422 | 3.6559 | 11 | 138 | regulation of RNA stability |
| GO:0034645 | 0.0013 | 1.3863 | 117.921 | 146 | 4547 | cellular macromolecule biosynthetic process |
| GO:0032095 | 0.0014 | 9.8848 | 0.5033 | 4 | 19 | regulation of response to food |
| GO:0006695 | 0.0014 | 5.4418 | 1.2451 | 6 | 47 | cholesterol biosynthetic process |
| GO:0043043 | 0.0015 | 1.8959 | 16.7428 | 30 | 632 | peptide biosynthetic process |
| GO:0046483 | 0.0017 | 1.6345 | 34.6737 | 52 | 1417 | heterocycle metabolic process |
| GO:0034470 | 0.0018 | 2.2905 | 8.3184 | 18 | 314 | ncRNA processing |
| GO:0051798 | 0.0019 | 15.8561 | 0.2649 | 3 | 10 | positive regulation of hair follicle development |
| GO:0030488 | 0.002 | 8.7207 | 0.5563 | 4 | 21 | tRNA methylation |
| GO:0006848 | 0.0021 | 73.8454 | 0.0795 | 2 | 3 | pyruvate transport |
| GO:0014038 | 0.0021 | 73.8454 | 0.0795 | 2 | 3 | regulation of Schwann cell differentiation |
| GO:0030423 | 0.0021 | 73.8454 | 0.0795 | 2 | 3 | targeting of mRNA for destruction involved in RNA interference |
| GO:0032218 | 0.0021 | 73.8454 | 0.0795 | 2 | 3 | riboflavin transport |
| GO:0051795 | 0.0021 | 73.8454 | 0.0795 | 2 | 3 | positive regulation of catagen |
| GO:0097428 | 0.0021 | 73.8454 | 0.0795 | 2 | 3 | protein maturation by iron-sulfur cluster transfer |
| GO:0043603 | 0.0023 | 1.7039 | 24.2135 | 39 | 914 | cellular amide metabolic process |
| GO:0032774 | 0.0028 | 1.3724 | 95.5293 | 120 | 3606 | RNA biosynthetic process |
| GO:0031323 | 0.0028 | 1.3307 | 147.612 | 175 | 5572 | regulation of cellular metabolic process |
| GO:0019058 | 0.003 | 2.006 | 11.5504 | 22 | 436 | viral life cycle |
| GO:0046130 | 0.0034 | 12.3309 | 0.3179 | 3 | 12 | purine ribonucleoside catabolic process |
| GO:0046415 | 0.0034 | 12.3309 | 0.3179 | 3 | 12 | urate metabolic process |
| GO:0006413 | 0.0035 | 2.3353 | 6.7819 | 15 | 256 | translational initiation |
| GO:0009987 | 0.0038 | 1.747 | 377.8254 | 393 | 14262 | cellular process |
| GO:1901360 | 0.0038 | 1.557 | 36.9208 | 53 | 1525 | organic cyclic compound metabolic process |
| GO:0010917 | 0.0041 | 36.9203 | 0.106 | 2 | 4 | negative regulation of mitochondrial membrane potential |
| GO:0035087 | 0.0041 | 36.9203 | 0.106 | 2 | 4 | siRNA loading onto RISC involved in RNA interference |
| GO:0061732 | 0.0041 | 36.9203 | 0.106 | 2 | 4 | mitochondrial acetyl-CoA biosynthetic process from pyruvate |
| GO:0070427 | 0.0041 | 36.9203 | 0.106 | 2 | 4 | nucleotide-binding oligomerization domain containing 1 signaling pathway |
| GO:0000956 | 0.0042 | 2.565 | 4.954 | 12 | 187 | nuclear-transcribed mRNA catabolic process |
| GO:0070166 | 0.0043 | 11.0971 | 0.3444 | 3 | 13 | enamel mineralization |
| GO:0051246 | 0.0047 | 1.3971 | 66.7592 | 87 | 2520 | regulation of protein metabolic process |
| GO:0018130 | 0.0051 | 1.3306 | 107.4506 | 131 | 4056 | heterocycle biosynthetic process |
| GO:0000209 | 0.0051 | 2.3969 | 5.7222 | 13 | 216 | protein polyubiquitination |
| GO:0019438 | 0.0052 | 1.3292 | 107.53 | 131 | 4059 | aromatic compound biosynthetic process |
| GO:0043516 | 0.0053 | 6.4432 | 0.7153 | 4 | 27 | regulation of DNA damage response, signal transduction by p53 class mediator |
| GO:0035195 | 0.0054 | 4.8819 | 1.1391 | 5 | 43 | gene silencing by miRNA |
| GO:0030157 | 0.0054 | 10.0876 | 0.3709 | 3 | 14 | pancreatic juice secretion |
| GO:0006614 | 0.0057 | 3.1692 | 2.7022 | 8 | 102 | SRP-dependent cotranslational protein targeting to membrane |
| GO:0071704 | 0.0058 | 1.4172 | 97.8452 | 117 | 4329 | organic substance metabolic process |
| GO:0031440 | 0.006 | 6.1744 | 0.7418 | 4 | 28 | regulation of mRNA 3'-end processing |
| GO:0042254 | 0.0061 | 2.3386 | 5.8547 | 13 | 221 | ribosome biogenesis |
| GO:0045682 | 0.0063 | 3.9101 | 1.669 | 6 | 63 | regulation of epidermis development |
| GO:0006694 | 0.0064 | 2.6842 | 3.9473 | 10 | 149 | steroid biosynthetic process |
| GO:0031123 | 0.0064 | 3.1027 | 2.7551 | 8 | 104 | RNA 3'-end processing |
| GO:0071826 | 0.0066 | 2.4115 | 5.2454 | 12 | 198 | ribonucleoprotein complex subunit organization |
| GO:0006771 | 0.0066 | 24.6119 | 0.1325 | 2 | 5 | riboflavin metabolic process |
| GO:0048819 | 0.0066 | 24.6119 | 0.1325 | 2 | 5 | regulation of hair follicle maturation |
| GO:0051122 | 0.0066 | 24.6119 | 0.1325 | 2 | 5 | hepoxilin biosynthetic process |
| GO:0072526 | 0.0066 | 24.6119 | 0.1325 | 2 | 5 | pyridine-containing compound catabolic process |
| GO:2000343 | 0.0066 | 24.6119 | 0.1325 | 2 | 5 | positive regulation of chemokine (C-X-C motif) ligand 2 production |
| GO:0032635 | 0.0068 | 3.0705 | 2.7816 | 8 | 105 | interleukin-6 production |
| GO:0016259 | 0.0068 | 3.3808 | 2.2253 | 7 | 84 | selenocysteine metabolic process |
| GO:1903321 | 0.007 | 2.6458 | 4.0003 | 10 | 151 | negative regulation of protein modification by small protein conjugation or removal |
| GO:0031145 | 0.0073 | 3.3372 | 2.2518 | 7 | 85 | anaphase-promoting complex-dependent proteasomal ubiquitin-dependent protein catabolic process |
| GO:0010604 | 0.0074 | 1.356 | 74.2299 | 94 | 2802 | positive regulation of macromolecule metabolic process |
| GO:0016441 | 0.0078 | 4.4158 | 1.2451 | 5 | 47 | posttranscriptional gene silencing |
| GO:0035914 | 0.0079 | 3.7139 | 1.7485 | 6 | 66 | skeletal muscle cell differentiation |
| GO:1901362 | 0.0081 | 1.3115 | 105.1935 | 127 | 4030 | organic cyclic compound biosynthetic process |
| GO:0030433 | 0.0085 | 3.6528 | 1.7749 | 6 | 67 | ER-associated ubiquitin-dependent protein catabolic process |
| GO:0048641 | 0.0086 | 4.3128 | 1.2716 | 5 | 48 | regulation of skeletal muscle tissue development |
| GO:0009057 | 0.0086 | 1.5256 | 29.5913 | 43 | 1117 | macromolecule catabolic process |
| GO:0006401 | 0.0088 | 2.2298 | 6.1196 | 13 | 231 | RNA catabolic process |
| GO:0072599 | 0.0089 | 2.9191 | 2.9141 | 8 | 110 | establishment of protein localization to endoplasmic reticulum |
| GO:0022613 | 0.0092 | 2.6893 | 3.5401 | 9 | 136 | ribonucleoprotein complex biogenesis |
| GO:0006612 | 0.0097 | 2.3868 | 4.848 | 11 | 183 | protein targeting to membrane |
| GO:0010939 | 0.0097 | 5.2909 | 0.8477 | 4 | 32 | regulation of necrotic cell death |
| GO:0048255 | 0.0097 | 5.2909 | 0.8477 | 4 | 32 | mRNA stabilization |
| GO:0030422 | 0.0098 | 18.4577 | 0.159 | 2 | 6 | production of siRNA involved in RNA interference |
| GO:0044851 | 0.0098 | 18.4577 | 0.159 | 2 | 6 | hair cycle phase |
| GOMFID | Pvalue | OddsRatio | ExpCount | Count | Size | Term |
| GO:0006880 | 1e-04 | Inf | 0.0213 | 2 | 2 | intracellular sequestering of iron ion |
| GO:0002572 | 3e-04 | 188.303 | 0.0319 | 2 | 3 | pro-T cell differentiation |
| GO:0050911 | 6e-04 | 3.2823 | 3.9349 | 12 | 370 | detection of chemical stimulus involved in sensory perception of smell |
| GO:0000042 | 9e-04 | 18.928 | 0.1914 | 3 | 18 | protein targeting to Golgi |
| GO:0006891 | 0.0011 | 9.7511 | 0.4573 | 4 | 43 | intra-Golgi vesicle-mediated transport |
| GO:0006396 | 0.0015 | 2.3684 | 8.2102 | 18 | 772 | RNA processing |
| GO:0090502 | 0.0031 | 7.1689 | 0.6062 | 4 | 57 | RNA phosphodiester bond hydrolysis, endonucleolytic |
| GO:0009593 | 0.0032 | 2.6624 | 4.7963 | 12 | 451 | detection of chemical stimulus |
| GO:0050650 | 0.0035 | 10.9123 | 0.3084 | 3 | 29 | chondroitin sulfate proteoglycan biosynthetic process |
| GO:0002639 | 0.0039 | 10.5075 | 0.319 | 3 | 30 | positive regulation of immunoglobulin production |
| GO:0007606 | 0.0041 | 2.5836 | 4.9346 | 12 | 464 | sensory perception of chemical stimulus |
| GO:0050906 | 0.0041 | 2.5836 | 4.9346 | 12 | 464 | detection of stimulus involved in sensory perception |
| GO:0045472 | 0.0058 | 20.9118 | 0.117 | 2 | 11 | response to ether |
| GO:0006264 | 0.0069 | 18.8194 | 0.1276 | 2 | 12 | mitochondrial DNA replication |
| GO:0021766 | 0.0072 | 5.5821 | 0.7657 | 4 | 72 | hippocampus development |
| GO:0071243 | 0.0081 | 17.1074 | 0.1383 | 2 | 13 | cellular response to arsenic-containing substance |
| GO:0006839 | 0.0083 | 2.9332 | 2.8714 | 8 | 270 | mitochondrial transport |
| GO:0009156 | 0.0084 | 5.3452 | 0.7976 | 4 | 75 | ribonucleoside monophosphate biosynthetic process |
| GO:0045069 | 0.0084 | 5.3452 | 0.7976 | 4 | 75 | regulation of viral genome replication |
| GO:1901659 | 0.0085 | 4.2126 | 1.2549 | 5 | 118 | glycosyl compound biosynthetic process |
| GO:0006754 | 0.0094 | 7.4605 | 0.436 | 3 | 41 | ATP biosynthetic process |
| GO:0050877 | 0.0097 | 1.8258 | 12.9108 | 22 | 1214 | neurological system process |
| GOMFID | Pvalue | OddsRatio | ExpCount | Count | Size | Term |
| GO:0009593 | 1e-04 | 3.1769 | 6.1749 | 18 | 451 | detection of chemical stimulus |
| GO:0050911 | 1e-04 | 3.4373 | 5.0659 | 16 | 370 | detection of chemical stimulus involved in sensory perception of smell |
| GO:0007606 | 2e-04 | 2.889 | 6.3529 | 17 | 464 | sensory perception of chemical stimulus |
| GO:0050906 | 2e-04 | 2.889 | 6.3529 | 17 | 464 | detection of stimulus involved in sensory perception |
| GO:0042742 | 3e-04 | 3.7946 | 3.1217 | 11 | 228 | defense response to bacterium |
| GO:0034162 | 0.0029 | 5.5635 | 0.9721 | 5 | 71 | toll-like receptor 9 signaling pathway |
| GO:0002757 | 0.0034 | 2.4275 | 6.1065 | 14 | 446 | immune response-activating signal transduction |
| GO:0007144 | 0.0037 | 29.0761 | 0.0958 | 2 | 7 | female meiosis I |
| GO:0002755 | 0.0046 | 4.9595 | 1.0816 | 5 | 79 | MyD88-dependent toll-like receptor signaling pathway |
| GO:0050851 | 0.0053 | 3.1795 | 2.6562 | 8 | 194 | antigen receptor-mediated signaling pathway |
| GO:0050778 | 0.0058 | 2.0941 | 8.5847 | 17 | 627 | positive regulation of immune response |
| GO:2000543 | 0.0063 | 20.7659 | 0.1232 | 2 | 9 | positive regulation of gastrulation |
| GO:0018149 | 0.0068 | 5.7381 | 0.753 | 4 | 55 | peptide cross-linking |
| GO:0002862 | 0.0078 | 18.169 | 0.1369 | 2 | 10 | negative regulation of inflammatory response to antigenic stimulus |
| GO:0051024 | 0.0078 | 18.169 | 0.1369 | 2 | 10 | positive regulation of immunoglobulin secretion |
| GO:0048706 | 0.0084 | 3.6158 | 1.7525 | 6 | 128 | embryonic skeletal system development |
| GO:0045060 | 0.0095 | 16.1492 | 0.1506 | 2 | 11 | negative thymic T cell selection |
| GO:0045835 | 0.0095 | 16.1492 | 0.1506 | 2 | 11 | negative regulation of meiotic nuclear division |
| GO:0071888 | 0.0095 | 16.1492 | 0.1506 | 2 | 11 | macrophage apoptotic process |
| GOMFID | Pvalue | OddsRatio | ExpCount | Count | Size | Term |
| GO:0050911 | 0 | 4.6535 | 4.8538 | 20 | 370 | detection of chemical stimulus involved in sensory perception of smell |
| GO:0050906 | 0 | 4.0725 | 6.087 | 22 | 464 | detection of stimulus involved in sensory perception |
| GO:0009593 | 0 | 3.9775 | 5.9164 | 21 | 451 | detection of chemical stimulus |
| GO:0007606 | 0 | 3.8574 | 6.087 | 21 | 464 | sensory perception of chemical stimulus |
| GO:0006402 | 3e-04 | 4.067 | 2.6499 | 10 | 202 | mRNA catabolic process |
| GO:0000184 | 8e-04 | 5.0594 | 1.4955 | 7 | 114 | nuclear-transcribed mRNA catabolic process, nonsense-mediated decay |
| GO:0061737 | 0.0017 | 50.634 | 0.0656 | 2 | 5 | leukotriene signaling pathway |
| GO:0051055 | 0.0026 | 7.652 | 0.5772 | 4 | 44 | negative regulation of lipid biosynthetic process |
| GO:0019083 | 0.0032 | 3.4772 | 2.44 | 8 | 186 | viral transcription |
| GO:0006364 | 0.0033 | 3.8585 | 1.9284 | 7 | 147 | rRNA processing |
| GO:0034382 | 0.0034 | 30.3765 | 0.0918 | 2 | 7 | chylomicron remnant clearance |
| GO:0006446 | 0.0038 | 5.1846 | 1.0364 | 5 | 79 | regulation of translational initiation |
| GO:0031424 | 0.0038 | 6.7996 | 0.6428 | 4 | 49 | keratinization |
| GO:0050877 | 0.0048 | 1.8184 | 15.9259 | 27 | 1214 | neurological system process |
| GO:0016259 | 0.0049 | 4.8548 | 1.102 | 5 | 84 | selenocysteine metabolic process |
| GO:1902652 | 0.0054 | 3.9778 | 1.6005 | 6 | 122 | secondary alcohol metabolic process |
| GO:0046164 | 0.0055 | 6.1176 | 0.7084 | 4 | 54 | alcohol catabolic process |
| GO:0031440 | 0.0057 | 9.146 | 0.3673 | 3 | 28 | regulation of mRNA 3'-end processing |
| GO:0044033 | 0.0061 | 3.106 | 2.7155 | 8 | 207 | multi-organism metabolic process |
| GO:0046825 | 0.0063 | 8.7937 | 0.3804 | 3 | 29 | regulation of protein export from nucleus |
| GO:0060180 | 0.0072 | 18.9816 | 0.1312 | 2 | 10 | female mating behavior |
| GO:0016482 | 0.0074 | 1.7704 | 15.6766 | 26 | 1195 | cytoplasmic transport |
| GO:0034660 | 0.0078 | 2.2679 | 6.0345 | 13 | 460 | ncRNA metabolic process |
| GO:0007186 | 0.0082 | 1.7753 | 15.0096 | 25 | 1155 | G-protein coupled receptor signaling pathway |
| GO:0000291 | 0.0083 | 7.8825 | 0.4198 | 3 | 32 | nuclear-transcribed mRNA catabolic process, exonucleolytic |
| GO:0006506 | 0.0083 | 7.8825 | 0.4198 | 3 | 32 | GPI anchor biosynthetic process |
| GO:0045124 | 0.0083 | 7.8825 | 0.4198 | 3 | 32 | regulation of bone resorption |
| GO:0042304 | 0.0099 | 7.373 | 0.446 | 3 | 34 | regulation of fatty acid biosynthetic process |
| GOMFID | Pvalue | OddsRatio | ExpCount | Count | Size | Term |
| GO:0008327 | 0.0026 | 12.691 | 0.2799 | 3 | 19 | methyl-CpG binding |
| GO:0044822 | 0.0044 | 1.8059 | 16.5588 | 28 | 1124 | poly(A) RNA binding |
| GO:0003676 | 0.0074 | 1.4455 | 54.479 | 71 | 3698 | nucleic acid binding |
| GOMFID | Pvalue | OddsRatio | ExpCount | Count | Size | Term |
| GO:0003735 | 2e-04 | 3.7976 | 3.4176 | 12 | 195 | structural constituent of ribosome |
| GO:0043295 | 8e-04 | 21.2418 | 0.1928 | 3 | 11 | glutathione binding |
| GO:0004298 | 0.0056 | 9.4347 | 0.368 | 3 | 21 | threonine-type endopeptidase activity |
| GO:0003676 | 0.0066 | 1.4105 | 64.8113 | 83 | 3698 | nucleic acid binding |
| GO:0008080 | 0.0096 | 4.1187 | 1.2969 | 5 | 74 | N-acetyltransferase activity |
| GOMFID | Pvalue | OddsRatio | ExpCount | Count | Size | Term |
| GO:0004082 | 9e-04 | 80.1546 | 0.0498 | 2 | 4 | bisphosphoglycerate mutase activity |
| GO:0004305 | 9e-04 | 80.1546 | 0.0498 | 2 | 4 | ethanolamine kinase activity |
| GO:0046538 | 9e-04 | 80.1546 | 0.0498 | 2 | 4 | 2,3-bisphosphoglycerate-dependent phosphoglycerate mutase activity |
| GO:0004083 | 0.0015 | 53.433 | 0.0622 | 2 | 5 | bisphosphoglycerate 2-phosphatase activity |
| GO:0004468 | 0.0015 | 53.433 | 0.0622 | 2 | 5 | lysine N-acetyltransferase activity, acting on acetyl phosphate as donor |
| GO:0005112 | 0.0016 | 15.0933 | 0.2365 | 3 | 19 | Notch binding |
| GO:0004129 | 0.0028 | 12.0715 | 0.2863 | 3 | 23 | cytochrome-c oxidase activity |
| GO:0003735 | 0.0031 | 3.4964 | 2.427 | 8 | 195 | structural constituent of ribosome |
| GO:0016675 | 0.0032 | 11.4959 | 0.2987 | 3 | 24 | oxidoreductase activity, acting on a heme group of donors |
| GO:0070888 | 0.0086 | 7.7826 | 0.4232 | 3 | 34 | E-box binding |
| GO:0015077 | 0.0099 | 2.4954 | 4.2068 | 10 | 338 | monovalent inorganic cation transmembrane transporter activity |
| GOMFID | Pvalue | OddsRatio | ExpCount | Count | Size | Term |
| GO:0016893 | 0.0012 | 9.6448 | 0.4676 | 4 | 37 | endonuclease activity, active with either ribo- or deoxyribonucleic acids and producing 5'-phosphomonoesters |
| GO:0016894 | 0.0017 | 14.8594 | 0.2401 | 3 | 19 | endonuclease activity, active with either ribo- or deoxyribonucleic acids and producing 3'-phosphomonoesters |
| GO:0008821 | 0.0023 | 39.4543 | 0.0758 | 2 | 6 | crossover junction endodeoxyribonuclease activity |
| GO:0017108 | 0.0023 | 39.4543 | 0.0758 | 2 | 6 | 5'-flap endonuclease activity |
| GO:0046977 | 0.0032 | 31.5614 | 0.0885 | 2 | 7 | TAP binding |
| GO:0042605 | 0.0033 | 11.3178 | 0.3033 | 3 | 24 | peptide antigen binding |
| GO:0005179 | 0.0037 | 4.3238 | 1.4785 | 6 | 117 | hormone activity |
| GO:0001846 | 0.0081 | 17.5296 | 0.139 | 2 | 11 | opsonin binding |
| GOMFID | Pvalue | OddsRatio | ExpCount | Count | Size | Term |
| GO:0015272 | 9e-04 | 81 | 0.0493 | 2 | 4 | ATP-activated inward rectifier potassium channel activity |
| GO:0019843 | 0.0031 | 7.2557 | 0.6036 | 4 | 49 | rRNA binding |
| GO:0008168 | 0.0038 | 3.3702 | 2.5131 | 8 | 204 | methyltransferase activity |
| GO:0045125 | 0.0092 | 16.1917 | 0.1478 | 2 | 12 | bioactive lipid receptor activity |
| GOMFID | Pvalue | OddsRatio | ExpCount | Count | Size | Term |
| GO:0003735 | 0 | 5.0853 | 2.6003 | 12 | 195 | structural constituent of ribosome |
| GO:0004082 | 0.001 | 74.6923 | 0.0533 | 2 | 4 | bisphosphoglycerate mutase activity |
| GO:0046538 | 0.001 | 74.6923 | 0.0533 | 2 | 4 | 2,3-bisphosphoglycerate-dependent phosphoglycerate mutase activity |
| GO:0004083 | 0.0017 | 49.7917 | 0.0667 | 2 | 5 | bisphosphoglycerate 2-phosphatase activity |
| GO:0005125 | 0.0024 | 3.3326 | 2.867 | 9 | 215 | cytokine activity |
| GO:0004129 | 0.0034 | 11.2449 | 0.3067 | 3 | 23 | cytochrome-c oxidase activity |
| GO:0046977 | 0.0036 | 29.8712 | 0.0933 | 2 | 7 | TAP binding |
| GO:0016675 | 0.0038 | 10.7088 | 0.32 | 3 | 24 | oxidoreductase activity, acting on a heme group of donors |
| GO:0042605 | 0.0038 | 10.7088 | 0.32 | 3 | 24 | peptide antigen binding |
| GO:0016866 | 0.0043 | 10.2213 | 0.3334 | 3 | 25 | intramolecular transferase activity |
| GO:0043295 | 0.009 | 16.5908 | 0.1467 | 2 | 11 | glutathione binding |
| GOMFID | Pvalue | OddsRatio | ExpCount | Count | Size | Term |
| GO:0005184 | 4e-04 | 12.9912 | 0.3649 | 4 | 26 | neuropeptide hormone activity |
| GO:0019843 | 6e-04 | 8.1455 | 0.6876 | 5 | 49 | rRNA binding |
| GO:0030346 | 0.0066 | 20.2479 | 0.1263 | 2 | 9 | protein phosphatase 2B binding |
| GO:0046703 | 0.0066 | 20.2479 | 0.1263 | 2 | 9 | natural killer cell lectin-like receptor binding |
| GOMFID | Pvalue | OddsRatio | ExpCount | Count | Size | Term |
| GO:0042379 | 0.0051 | 6.2082 | 0.6961 | 4 | 58 | chemokine receptor binding |
| GO:0004984 | 0.0052 | 2.6165 | 4.4406 | 11 | 370 | olfactory receptor activity |
| GOMFID | Pvalue | OddsRatio | ExpCount | Count | Size | Term |
| GO:0004984 | 4e-04 | 3.1104 | 4.84 | 14 | 370 | olfactory receptor activity |
| GO:0016891 | 4e-04 | 13.3612 | 0.3532 | 4 | 27 | endoribonuclease activity, producing 5'-phosphomonoesters |
| GO:0044822 | 0.0016 | 1.9862 | 14.7031 | 27 | 1124 | poly(A) RNA binding |
| GO:0050544 | 0.0017 | 50.781 | 0.0654 | 2 | 5 | arachidonic acid binding |
| GO:1901567 | 0.0025 | 38.0833 | 0.0785 | 2 | 6 | fatty acid derivative binding |
| GO:0003676 | 0.003 | 1.5459 | 48.3736 | 66 | 3698 | nucleic acid binding |
| GO:0004540 | 0.0046 | 4.9318 | 1.0857 | 5 | 83 | ribonuclease activity |
| GO:0016832 | 0.0058 | 21.7577 | 0.1177 | 2 | 9 | aldehyde-lyase activity |
| GO:0004930 | 0.0069 | 1.9707 | 10.2163 | 19 | 781 | G-protein coupled receptor activity |
| GOMFID | Pvalue | OddsRatio | ExpCount | Count | Size | Term |
| GO:0003735 | 2e-04 | 3.783 | 3.43 | 12 | 195 | structural constituent of ribosome |
| GO:0016706 | 0.0052 | 6.2821 | 0.7036 | 4 | 40 | oxidoreductase activity, acting on paired donors, with incorporation or reduction of molecular oxygen, 2-oxoglutarate as one donor, and incorporation of one atom each of oxygen into both donors |
| GO:0047429 | 0.008 | 18.7455 | 0.1407 | 2 | 8 | nucleoside-triphosphate diphosphatase activity |
| GO:0044822 | 0.0085 | 1.6577 | 19.7706 | 31 | 1124 | poly(A) RNA binding |
| GOMFID | Pvalue | OddsRatio | ExpCount | Count | Size | Term |
| GO:0017025 | 0.0038 | 11.0261 | 0.3209 | 3 | 19 | TBP-class protein binding |
| GO:0036402 | 0.0041 | 29.3144 | 0.1013 | 2 | 6 | proteasome-activating ATPase activity |
| GO:0051920 | 0.0041 | 29.3144 | 0.1013 | 2 | 6 | peroxiredoxin activity |
| GO:0015078 | 0.0044 | 4.1802 | 1.5371 | 6 | 91 | hydrogen ion transmembrane transporter activity |
| GO:0016667 | 0.0093 | 5.2373 | 0.8277 | 4 | 49 | oxidoreductase activity, acting on a sulfur group of donors |
| GO:0004673 | 0.0095 | 16.7478 | 0.152 | 2 | 9 | protein histidine kinase activity |
| GO:0046703 | 0.0095 | 16.7478 | 0.152 | 2 | 9 | natural killer cell lectin-like receptor binding |
| GOMFID | Pvalue | OddsRatio | ExpCount | Count | Size | Term |
| GO:0004984 | 0 | 4.108 | 5.7093 | 21 | 370 | olfactory receptor activity |
| GO:0004930 | 0 | 2.767 | 12.0512 | 30 | 781 | G-protein coupled receptor activity |
| GO:0008073 | 7e-04 | 128.6639 | 0.0463 | 2 | 3 | ornithine decarboxylase inhibitor activity |
| GO:0099600 | 0.0011 | 1.9025 | 18.7635 | 33 | 1216 | transmembrane receptor activity |
| GO:0038023 | 0.0011 | 1.8797 | 19.5813 | 34 | 1269 | signaling receptor activity |
| GO:0016866 | 0.0065 | 8.7972 | 0.3858 | 3 | 25 | intramolecular transferase activity |
| GO:0008190 | 0.0079 | 18.3734 | 0.1389 | 2 | 9 | eukaryotic initiation factor 4E binding |
| GO:0046703 | 0.0079 | 18.3734 | 0.1389 | 2 | 9 | natural killer cell lectin-like receptor binding |
| GOMFID | Pvalue | OddsRatio | ExpCount | Count | Size | Term |
| GO:0047429 | 2e-04 | 39.4169 | 0.1214 | 3 | 8 | nucleoside-triphosphate diphosphatase activity |
| GO:0031696 | 2e-04 | Inf | 0.0304 | 2 | 2 | alpha-2C adrenergic receptor binding |
| GO:0008821 | 0.0033 | 32.711 | 0.0911 | 2 | 6 | crossover junction endodeoxyribonuclease activity |
| GO:0017108 | 0.0033 | 32.711 | 0.0911 | 2 | 6 | 5'-flap endonuclease activity |
| GO:0030957 | 0.006 | 21.8045 | 0.1214 | 2 | 8 | Tat protein binding |
| GO:0030515 | 0.0062 | 8.9486 | 0.3794 | 3 | 25 | snoRNA binding |
| GO:0005179 | 0.0089 | 3.5722 | 1.7757 | 6 | 117 | hormone activity |
| GOMFID | Pvalue | OddsRatio | ExpCount | Count | Size | Term |
| GO:0046703 | 5e-04 | 25.9077 | 0.172 | 3 | 9 | natural killer cell lectin-like receptor binding |
| GO:0004307 | 0.0011 | 103.3177 | 0.0573 | 2 | 3 | ethanolaminephosphotransferase activity |
| GO:0005126 | 0.0019 | 2.7108 | 5.0842 | 13 | 266 | cytokine receptor binding |
| GO:0004634 | 0.0021 | 51.6555 | 0.0765 | 2 | 4 | phosphopyruvate hydratase activity |
| GO:0004468 | 0.0035 | 34.4348 | 0.0956 | 2 | 5 | lysine N-acetyltransferase activity, acting on acetyl phosphate as donor |
| GO:0003910 | 0.0052 | 25.8244 | 0.1147 | 2 | 6 | DNA ligase (ATP) activity |
| GO:0001664 | 0.0088 | 2.4136 | 4.7784 | 11 | 250 | G-protein coupled receptor binding |
| GO:0016799 | 0.0092 | 7.7653 | 0.4396 | 3 | 23 | hydrolase activity, hydrolyzing N-glycosyl compounds |
| GO:0016886 | 0.0094 | 17.214 | 0.1529 | 2 | 8 | ligase activity, forming phosphoric ester bonds |
| GOMFID | Pvalue | OddsRatio | ExpCount | Count | Size | Term |
| GO:0004984 | 5e-04 | 2.8715 | 5.5918 | 15 | 370 | olfactory receptor activity |
| GO:0004930 | 8e-04 | 2.1857 | 11.8033 | 24 | 781 | G-protein coupled receptor activity |
| GO:0051380 | 0.0013 | 65.7119 | 0.0605 | 2 | 4 | norepinephrine binding |
| GO:0031690 | 0.0028 | 12.3622 | 0.2871 | 3 | 19 | adrenergic receptor binding |
| GO:0003735 | 0.0029 | 3.2379 | 2.947 | 9 | 195 | structural constituent of ribosome |
| GO:0051379 | 0.0033 | 32.8517 | 0.0907 | 2 | 6 | epinephrine binding |
| GO:0099600 | 0.0053 | 1.742 | 18.3774 | 30 | 1216 | transmembrane receptor activity |
| GO:0016866 | 0.0061 | 8.9872 | 0.3778 | 3 | 25 | intramolecular transferase activity |
| GO:0004935 | 0.0076 | 18.7688 | 0.136 | 2 | 9 | adrenergic receptor activity |
| GO:0042301 | 0.0094 | 16.4216 | 0.1511 | 2 | 10 | phosphate ion binding |
| GOMFID | Pvalue | OddsRatio | ExpCount | Count | Size | Term |
| GO:0004096 | 0.0012 | 99.5806 | 0.0594 | 2 | 3 | catalase activity |
| GO:0004305 | 0.0023 | 49.7871 | 0.0792 | 2 | 4 | ethanolamine kinase activity |
| GO:0017150 | 0.0023 | 49.7871 | 0.0792 | 2 | 4 | tRNA dihydrouridine synthase activity |
| GO:0019788 | 0.0023 | 49.7871 | 0.0792 | 2 | 4 | NEDD8 transferase activity |
| GO:0004984 | 0.003 | 2.3029 | 7.3305 | 16 | 370 | olfactory receptor activity |
| GO:0008467 | 0.0038 | 33.1892 | 0.0991 | 2 | 5 | [heparan sulfate]-glucosamine 3-sulfotransferase 1 activity |
| GO:1990247 | 0.0077 | 19.911 | 0.1387 | 2 | 7 | N6-methyladenosine-containing RNA binding |
| GO:0005525 | 0.0083 | 2.1707 | 6.7559 | 14 | 341 | GTP binding |
| GOMFID | Pvalue | OddsRatio | ExpCount | Count | Size | Term |
| GO:0004984 | 0 | 7.4425 | 3.9002 | 24 | 370 | olfactory receptor activity |
| GO:0004930 | 0 | 3.9957 | 8.2325 | 28 | 781 | G-protein coupled receptor activity |
| GO:0099600 | 0 | 2.5671 | 12.8179 | 29 | 1216 | transmembrane receptor activity |
| GO:0038023 | 1e-04 | 2.4483 | 13.3766 | 29 | 1269 | signaling receptor activity |
| GO:0034513 | 3e-04 | 190.0122 | 0.0316 | 2 | 3 | box H/ACA snoRNA binding |
| GO:0060089 | 5e-04 | 2.1097 | 15.8642 | 30 | 1505 | molecular transducer activity |
| GO:0070739 | 7e-04 | 95 | 0.0422 | 2 | 4 | protein-glutamic acid ligase activity |
| GO:0004865 | 0.003 | 31.6585 | 0.0843 | 2 | 8 | protein serine/threonine phosphatase inhibitor activity |
| GO:0030881 | 0.0038 | 27.1341 | 0.0949 | 2 | 9 | beta-2-microglobulin binding |
| GO:0019212 | 0.0064 | 8.6721 | 0.3795 | 3 | 36 | phosphatase inhibitor activity |
| GO:0070034 | 0.008 | 17.2627 | 0.137 | 2 | 13 | telomerase RNA binding |
| GOMFID | Pvalue | OddsRatio | ExpCount | Count | Size | Term |
| GO:0004984 | 0 | 3.613 | 4.84 | 16 | 370 | olfactory receptor activity |
| GO:0004930 | 0.0069 | 1.9707 | 10.2163 | 19 | 781 | G-protein coupled receptor activity |
| GOMFID | Pvalue | OddsRatio | ExpCount | Count | Size | Term |
| GO:0004930 | 0 | 5.6465 | 5.1081 | 23 | 781 | G-protein coupled receptor activity |
| GO:0004984 | 0 | 6.1856 | 2.42 | 13 | 370 | olfactory receptor activity |
| GO:0099600 | 0 | 3.4828 | 7.9533 | 23 | 1216 | transmembrane receptor activity |
| GO:0038023 | 0 | 3.3224 | 8.2999 | 23 | 1269 | signaling receptor activity |
| GO:0060089 | 0 | 2.9055 | 9.8435 | 24 | 1505 | molecular transducer activity |
| GO:0004602 | 0.0042 | 23.8111 | 0.0981 | 2 | 15 | glutathione peroxidase activity |
| GO:0005132 | 0.0054 | 20.6337 | 0.1112 | 2 | 17 | type I interferon receptor binding |
| GO:0000035 | 0.0065 | Inf | 0.0065 | 1 | 1 | acyl binding |
| GO:0004475 | 0.0065 | Inf | 0.0065 | 1 | 1 | mannose-1-phosphate guanylyltransferase activity |
| GO:0016913 | 0.0065 | Inf | 0.0065 | 1 | 1 | follicle-stimulating hormone activity |
| GO:0003735 | 0.0091 | 4.1501 | 1.2754 | 5 | 195 | structural constituent of ribosome |
| GOMFID | Pvalue | OddsRatio | ExpCount | Count | Size | Term |
| GO:0004984 | 0 | 3.8486 | 4.2761 | 15 | 370 | olfactory receptor activity |
| GO:0009019 | 1e-04 | Inf | 0.0231 | 2 | 2 | tRNA (guanine-N1-)-methyltransferase activity |
| GO:0004930 | 3e-04 | 2.5411 | 9.026 | 21 | 781 | G-protein coupled receptor activity |
| GO:0003735 | 4e-04 | 4.3017 | 2.2536 | 9 | 195 | structural constituent of ribosome |
| GO:0008009 | 0.0023 | 7.9275 | 0.5547 | 4 | 48 | chemokine activity |
| GO:0005549 | 0.0027 | 5.6092 | 0.9592 | 5 | 83 | odorant binding |
| GO:0005184 | 0.0032 | 11.326 | 0.3005 | 3 | 26 | neuropeptide hormone activity |
| GO:0016538 | 0.0032 | 11.326 | 0.3005 | 3 | 26 | cyclin-dependent protein serine/threonine kinase regulator activity |
| GO:0017069 | 0.0059 | 8.9792 | 0.3698 | 3 | 32 | snRNA binding |
| GO:0038023 | 0.006 | 1.8333 | 14.6659 | 25 | 1269 | signaling receptor activity |
| GO:0016209 | 0.0064 | 5.8075 | 0.7396 | 4 | 64 | antioxidant activity |
| GO:0008200 | 0.0076 | 8.1358 | 0.4045 | 3 | 35 | ion channel inhibitor activity |
| GO:0048020 | 0.0076 | 8.1358 | 0.4045 | 3 | 35 | CCR chemokine receptor binding |
| GO:0060089 | 0.0078 | 1.7344 | 17.3933 | 28 | 1505 | molecular transducer activity |
| GO:0001664 | 0.0087 | 2.9114 | 2.8893 | 8 | 250 | G-protein coupled receptor binding |
| GOMFID | Pvalue | OddsRatio | ExpCount | Count | Size | Term |
| GO:0004984 | 0 | 3.9768 | 4.7225 | 17 | 370 | olfactory receptor activity |
| GO:0004930 | 1e-04 | 2.6492 | 9.9683 | 24 | 781 | G-protein coupled receptor activity |
| GO:0035497 | 5e-04 | 23.5409 | 0.1659 | 3 | 13 | cAMP response element binding |
| GO:0099600 | 0.0017 | 1.9562 | 15.5204 | 28 | 1216 | transmembrane receptor activity |
| GO:0004518 | 0.0026 | 3.5994 | 2.3613 | 8 | 185 | nuclease activity |
| GO:0004521 | 0.0032 | 7.1541 | 0.6126 | 4 | 48 | endoribonuclease activity |
| GO:0005179 | 0.0039 | 4.2789 | 1.4933 | 6 | 117 | hormone activity |
| GO:0060089 | 0.0052 | 1.741 | 19.2091 | 31 | 1505 | molecular transducer activity |
| GO:0038023 | 0.006 | 1.7872 | 16.1969 | 27 | 1269 | signaling receptor activity |
| GO:0004526 | 0.0083 | 17.3512 | 0.1404 | 2 | 11 | ribonuclease P activity |
| GO:0015266 | 0.0083 | 17.3512 | 0.1404 | 2 | 11 | protein channel activity |
| GO:0003723 | 0.0086 | 1.6851 | 19.0942 | 30 | 1496 | RNA binding |
| GO:0001102 | 0.0099 | 7.3461 | 0.4467 | 3 | 35 | RNA polymerase II activating transcription factor binding |
| GOMFID | Pvalue | OddsRatio | ExpCount | Count | Size | Term |
| GO:0004930 | 0 | 2.6715 | 10.3155 | 25 | 781 | G-protein coupled receptor activity |
| GO:0004984 | 4e-04 | 3.078 | 4.887 | 14 | 370 | olfactory receptor activity |
| GO:0099600 | 7e-04 | 2.0398 | 16.061 | 30 | 1216 | transmembrane receptor activity |
| GO:0070888 | 0.001 | 10.1373 | 0.4491 | 4 | 34 | E-box binding |
| GO:0001601 | 0.001 | 75.4272 | 0.0528 | 2 | 4 | peptide YY receptor activity |
| GO:0038023 | 0.0013 | 1.9453 | 16.761 | 30 | 1269 | signaling receptor activity |
| GO:0061133 | 0.0025 | 37.7087 | 0.0792 | 2 | 6 | endopeptidase activator activity |
| GO:0008080 | 0.0029 | 5.5226 | 0.9774 | 5 | 74 | N-acetyltransferase activity |
| GO:0043425 | 0.0047 | 9.873 | 0.3434 | 3 | 26 | bHLH transcription factor binding |
| GO:0003676 | 0.006 | 1.4898 | 48.8433 | 65 | 3698 | nucleic acid binding |
| GO:0017022 | 0.0064 | 5.8401 | 0.7396 | 4 | 56 | myosin binding |
| GO:0003700 | 0.0071 | 1.7986 | 14.8194 | 25 | 1122 | transcription factor activity, sequence-specific DNA binding |
| GO:0060089 | 0.0085 | 1.6713 | 19.8781 | 31 | 1505 | molecular transducer activity |
| GOMFID | Pvalue | OddsRatio | ExpCount | Count | Size | Term |
| GO:0004984 | 0 | 3.9657 | 3.8767 | 14 | 370 | olfactory receptor activity |
| GO:0004930 | 2e-04 | 2.6865 | 8.1829 | 20 | 781 | G-protein coupled receptor activity |
| GO:0001601 | 6e-04 | 95.589 | 0.0419 | 2 | 4 | peptide YY receptor activity |
| GO:0001602 | 6e-04 | 95.589 | 0.0419 | 2 | 4 | pancreatic polypeptide receptor activity |
| GO:0019957 | 0.0022 | 38.2282 | 0.0733 | 2 | 7 | C-C chemokine binding |
| GO:0005184 | 0.0025 | 12.5282 | 0.2724 | 3 | 26 | neuropeptide hormone activity |
| GO:0071855 | 0.0027 | 12.0054 | 0.2829 | 3 | 27 | neuropeptide receptor binding |
| GO:0005525 | 0.0032 | 2.9728 | 3.5728 | 10 | 341 | GTP binding |
| GO:0019001 | 0.0046 | 2.8162 | 3.7614 | 10 | 359 | guanyl nucleotide binding |
| GO:0016859 | 0.0096 | 7.3808 | 0.4401 | 3 | 42 | cis-trans isomerase activity |
| GOMFID | Pvalue | OddsRatio | ExpCount | Count | Size | Term |
| GO:0032395 | 5e-04 | 26.2309 | 0.1626 | 3 | 10 | MHC class II receptor activity |
| GO:0003735 | 0.0014 | 3.3634 | 3.1699 | 10 | 195 | structural constituent of ribosome |
| GO:0070717 | 0.002 | 14.1189 | 0.2601 | 3 | 16 | poly-purine tract binding |
| GO:0008474 | 0.0025 | 40.6535 | 0.0813 | 2 | 5 | palmitoyl-(protein) hydrolase activity |
| GO:0042605 | 0.0067 | 8.7357 | 0.3901 | 3 | 24 | peptide antigen binding |
| GO:0016175 | 0.0069 | 20.3228 | 0.13 | 2 | 8 | superoxide-generating NADPH oxidase activity |
| GO:0030515 | 0.0075 | 8.3381 | 0.4064 | 3 | 25 | snoRNA binding |
| GOMFID | Pvalue | OddsRatio | ExpCount | Count | Size | Term |
| GO:0003676 | 6e-04 | 1.4224 | 105.9054 | 136 | 3698 | nucleic acid binding |
| GO:0004052 | 0.0024 | 68.1336 | 0.0859 | 2 | 3 | arachidonate 12-lipoxygenase activity |
| GO:0004307 | 0.0024 | 68.1336 | 0.0859 | 2 | 3 | ethanolaminephosphotransferase activity |
| GO:0051120 | 0.0024 | 68.1336 | 0.0859 | 2 | 3 | hepoxilin A3 synthase activity |
| GO:0001601 | 0.0047 | 34.0646 | 0.1146 | 2 | 4 | peptide YY receptor activity |
| GO:0004634 | 0.0047 | 34.0646 | 0.1146 | 2 | 4 | phosphopyruvate hydratase activity |
| GO:0008080 | 0.0052 | 3.5838 | 2.1193 | 7 | 74 | N-acetyltransferase activity |
| GO:0000975 | 0.0053 | 1.6551 | 22.1949 | 35 | 775 | regulatory region DNA binding |
| GO:0000983 | 0.0054 | 10.2368 | 0.3723 | 3 | 13 | transcription factor activity, RNA polymerase II core promoter sequence-specific |
| GO:0016747 | 0.0068 | 2.4037 | 5.2695 | 12 | 184 | transferase activity, transferring acyl groups other than amino-acyl groups |
| GO:0008174 | 0.0077 | 22.7082 | 0.1432 | 2 | 5 | mRNA methyltransferase activity |
| GO:0000976 | 0.0088 | 1.6717 | 18.1282 | 29 | 633 | transcription regulatory region sequence-specific DNA binding |
| GO:0008353 | 0.0099 | 7.8729 | 0.4582 | 3 | 16 | RNA polymerase II carboxy-terminal domain kinase activity |
| GOMFID | Pvalue | OddsRatio | ExpCount | Count | Size | Term |
| GO:0003735 | 1e-04 | 4.2743 | 3.0585 | 12 | 195 | structural constituent of ribosome |
| GO:0044822 | 1e-04 | 2.1849 | 17.6294 | 35 | 1124 | poly(A) RNA binding |
| GO:0003676 | 1e-04 | 1.695 | 58.0014 | 84 | 3698 | nucleic acid binding |
| GO:0015450 | 0.0064 | 21.0816 | 0.1255 | 2 | 8 | P-P-bond-hydrolysis-driven protein transmembrane transporter activity |
| GO:0005549 | 0.0098 | 4.0853 | 1.3018 | 5 | 83 | odorant binding |
| GOMFID | Pvalue | OddsRatio | ExpCount | Count | Size | Term |
| GO:0004984 | 0 | 5.2144 | 4.1586 | 19 | 370 | olfactory receptor activity |
| GO:0004930 | 1e-04 | 2.7699 | 8.7781 | 22 | 781 | G-protein coupled receptor activity |
| GO:1901612 | 7e-04 | 88.9657 | 0.045 | 2 | 4 | cardiolipin binding |
| GO:0005518 | 0.0068 | 5.6915 | 0.753 | 4 | 67 | collagen binding |
| GO:0048020 | 0.007 | 8.3723 | 0.3934 | 3 | 35 | CCR chemokine receptor binding |
| GO:0001664 | 0.0074 | 2.9985 | 2.8099 | 8 | 250 | G-protein coupled receptor binding |
| GO:0051787 | 0.0077 | 17.784 | 0.1349 | 2 | 12 | misfolded protein binding |
| GO:0099600 | 0.0096 | 1.8 | 13.6673 | 23 | 1216 | transmembrane receptor activity |
| GOMFID | Pvalue | OddsRatio | ExpCount | Count | Size | Term |
| GO:0003735 | 1e-04 | 4.3678 | 2.7365 | 11 | 195 | structural constituent of ribosome |
| GO:0004939 | 6e-04 | 141.79 | 0.0421 | 2 | 3 | beta-adrenergic receptor activity |
| GO:0035662 | 6e-04 | 141.79 | 0.0421 | 2 | 3 | Toll-like receptor 4 binding |
| GO:0047223 | 6e-04 | 141.79 | 0.0421 | 2 | 3 | beta-1,3-galactosyl-O-glycosyl-glycoprotein beta-1,3-N-acetylglucosaminyltransferase activity |
| GO:0036041 | 7e-04 | 21.3537 | 0.1824 | 3 | 13 | long-chain fatty acid binding |
| GO:0001601 | 0.0012 | 70.8904 | 0.0561 | 2 | 4 | peptide YY receptor activity |
| GO:0004082 | 0.0012 | 70.8904 | 0.0561 | 2 | 4 | bisphosphoglycerate mutase activity |
| GO:0046538 | 0.0012 | 70.8904 | 0.0561 | 2 | 4 | 2,3-bisphosphoglycerate-dependent phosphoglycerate mutase activity |
| GO:0051380 | 0.0012 | 70.8904 | 0.0561 | 2 | 4 | norepinephrine binding |
| GO:0090484 | 0.0019 | 14.2312 | 0.2526 | 3 | 18 | drug transporter activity |
| GO:0004083 | 0.0019 | 47.2572 | 0.0702 | 2 | 5 | bisphosphoglycerate 2-phosphatase activity |
| GO:0050544 | 0.0019 | 47.2572 | 0.0702 | 2 | 5 | arachidonic acid binding |
| GO:0016894 | 0.0022 | 13.3409 | 0.2666 | 3 | 19 | endonuclease activity, active with either ribo- or deoxyribonucleic acids and producing 3'-phosphomonoesters |
| GO:0008188 | 0.0028 | 7.5135 | 0.5894 | 4 | 42 | neuropeptide receptor activity |
| GO:0008821 | 0.0028 | 35.4406 | 0.0842 | 2 | 6 | crossover junction endodeoxyribonuclease activity |
| GO:0017108 | 0.0028 | 35.4406 | 0.0842 | 2 | 6 | 5'-flap endonuclease activity |
| GO:0051379 | 0.0028 | 35.4406 | 0.0842 | 2 | 6 | epinephrine binding |
| GO:1901567 | 0.0028 | 35.4406 | 0.0842 | 2 | 6 | fatty acid derivative binding |
| GO:0003887 | 0.0056 | 9.2764 | 0.3649 | 3 | 26 | DNA-directed DNA polymerase activity |
| GO:0033293 | 0.0074 | 5.5936 | 0.7718 | 4 | 55 | monocarboxylic acid binding |
| GO:0005154 | 0.0084 | 7.9001 | 0.421 | 3 | 30 | epidermal growth factor receptor binding |
| GO:0005515 | 0.0093 | 1.4306 | 142.1035 | 159 | 10126 | protein binding |
| GO:0016884 | 0.0099 | 15.7463 | 0.1544 | 2 | 11 | carbon-nitrogen ligase activity, with glutamine as amido-N-donor |
| GO:0050786 | 0.0099 | 15.7463 | 0.1544 | 2 | 11 | RAGE receptor binding |
| GOMFID | Pvalue | OddsRatio | ExpCount | Count | Size | Term |
| GO:0070700 | 1e-04 | 42.0378 | 0.1074 | 3 | 9 | BMP receptor binding |
| GO:0035662 | 4e-04 | 167.3011 | 0.0358 | 2 | 3 | Toll-like receptor 4 binding |
| GO:0033612 | 7e-04 | 21.0108 | 0.1791 | 3 | 15 | receptor serine/threonine kinase binding |
| GO:0001601 | 8e-04 | 83.6452 | 0.0478 | 2 | 4 | peptide YY receptor activity |
| GO:0050544 | 0.0014 | 55.7599 | 0.0597 | 2 | 5 | arachidonic acid binding |
| GO:1901567 | 0.0021 | 41.8172 | 0.0716 | 2 | 6 | fatty acid derivative binding |
| GO:0005160 | 0.0027 | 7.4952 | 0.585 | 4 | 49 | transforming growth factor beta receptor binding |
| GO:0039706 | 0.0038 | 27.8746 | 0.0955 | 2 | 8 | co-receptor binding |
| GO:0008378 | 0.007 | 8.3946 | 0.394 | 3 | 33 | galactosyltransferase activity |
| GO:0050786 | 0.0073 | 18.5795 | 0.1313 | 2 | 11 | RAGE receptor binding |
| GO:0019864 | 0.0086 | 16.7204 | 0.1433 | 2 | 12 | IgG binding |
| GO:0008083 | 0.0099 | 3.4805 | 1.8146 | 6 | 152 | growth factor activity |
| GOMFID | Pvalue | OddsRatio | ExpCount | Count | Size | Term |
| GO:0016538 | 1e-04 | 12.5815 | 0.4903 | 5 | 26 | cyclin-dependent protein serine/threonine kinase regulator activity |
| GO:0019776 | 0.0011 | 104.7458 | 0.0566 | 2 | 3 | Atg8 ligase activity |
| GO:0016893 | 0.005 | 6.3783 | 0.6978 | 4 | 37 | endonuclease activity, active with either ribo- or deoxyribonucleic acids and producing 5'-phosphomonoesters |
| GO:0008327 | 0.0051 | 9.8438 | 0.3583 | 3 | 19 | methyl-CpG binding |
| GO:0070064 | 0.0051 | 9.8438 | 0.3583 | 3 | 19 | proline-rich region binding |
| GO:0004523 | 0.007 | 20.9437 | 0.132 | 2 | 7 | RNA-DNA hybrid ribonuclease activity |
| GO:0070097 | 0.007 | 20.9437 | 0.132 | 2 | 7 | delta-catenin binding |
| GO:0001664 | 0.008 | 2.448 | 4.7149 | 11 | 250 | G-protein coupled receptor binding |
| GO:0004518 | 0.0086 | 2.7122 | 3.489 | 9 | 185 | nuclease activity |
| GOMFID | Pvalue | OddsRatio | ExpCount | Count | Size | Term |
| GO:0097159 | 0.0011 | 1.4446 | 106.9582 | 133 | 5559 | organic cyclic compound binding |
| GO:1901363 | 0.0013 | 1.4375 | 105.4382 | 131 | 5480 | heterocyclic compound binding |
| GO:0015932 | 0.0017 | 8.9702 | 0.5195 | 4 | 27 | nucleobase-containing compound transmembrane transporter activity |
| GO:0003743 | 0.0018 | 6.3038 | 0.8851 | 5 | 46 | translation initiation factor activity |
| GO:0003723 | 0.0024 | 1.6582 | 28.4727 | 44 | 1489 | RNA binding |
| GO:0005525 | 0.0026 | 2.4155 | 6.561 | 15 | 341 | GTP binding |
| GO:0016717 | 0.0036 | 34.2016 | 0.0962 | 2 | 5 | oxidoreductase activity, acting on paired donors, with oxidation of a pair of donors resulting in the reduction of molecular oxygen to two molecules of water |
| GO:0019863 | 0.0036 | 34.2016 | 0.0962 | 2 | 5 | IgE binding |
| GO:0019001 | 0.0042 | 2.2864 | 6.9074 | 15 | 359 | guanyl nucleotide binding |
| GO:0051379 | 0.0053 | 25.6495 | 0.1154 | 2 | 6 | epinephrine binding |
| GO:1990247 | 0.0073 | 20.5183 | 0.1347 | 2 | 7 | N6-methyladenosine-containing RNA binding |
| GO:0003924 | 0.0076 | 2.6015 | 4.0405 | 10 | 210 | GTPase activity |
| GOMFID | Pvalue | OddsRatio | ExpCount | Count | Size | Term |
| GO:0001632 | 3e-04 | Inf | 0.0366 | 2 | 2 | leukotriene B4 receptor activity |
| GO:0044822 | 7e-04 | 1.8871 | 20.5558 | 36 | 1124 | poly(A) RNA binding |
| GO:0003735 | 9e-04 | 3.2969 | 3.5662 | 11 | 195 | structural constituent of ribosome |
| GO:0016853 | 0.0014 | 3.6347 | 2.6518 | 9 | 145 | isomerase activity |
| GO:0008320 | 0.004 | 10.8386 | 0.3292 | 3 | 18 | protein transmembrane transporter activity |
| GO:0008821 | 0.0048 | 27.021 | 0.1097 | 2 | 6 | crossover junction endodeoxyribonuclease activity |
| GO:0017108 | 0.0048 | 27.021 | 0.1097 | 2 | 6 | 5'-flap endonuclease activity |
| GO:0051920 | 0.0048 | 27.021 | 0.1097 | 2 | 6 | peroxiredoxin activity |
| GO:0022891 | 0.006 | 1.7902 | 15.3254 | 26 | 838 | substrate-specific transmembrane transporter activity |
| GO:0008173 | 0.0071 | 5.7161 | 0.7681 | 4 | 42 | RNA methyltransferase activity |
| GO:0004984 | 0.0084 | 2.1678 | 6.7666 | 14 | 370 | olfactory receptor activity |
| GOMFID | Pvalue | OddsRatio | ExpCount | Count | Size | Term |
| GO:0019841 | 0.001 | 19.1259 | 0.2031 | 3 | 13 | retinol binding |
| GO:0016918 | 0.0012 | 17.3861 | 0.2187 | 3 | 14 | retinal binding |
| GO:0015450 | 0.0064 | 21.1694 | 0.125 | 2 | 8 | P-P-bond-hydrolysis-driven protein transmembrane transporter activity |
| GO:0032404 | 0.0064 | 21.1694 | 0.125 | 2 | 8 | mismatch repair complex binding |
| GO:0005549 | 0.0097 | 4.1026 | 1.2965 | 5 | 83 | odorant binding |
| GOMFID | Pvalue | OddsRatio | ExpCount | Count | Size | Term |
| GO:1990841 | 0.0017 | 82.8787 | 0.0711 | 2 | 3 | promoter-specific chromatin binding |
| GO:0003735 | 0.0024 | 2.7595 | 4.6187 | 12 | 195 | structural constituent of ribosome |
| GO:0003723 | 0.0031 | 1.5628 | 35.4336 | 52 | 1496 | RNA binding |
| GO:0008599 | 0.004 | 11.3248 | 0.3316 | 3 | 14 | protein phosphatase type 1 regulator activity |
| GO:0015186 | 0.0053 | 27.6226 | 0.1184 | 2 | 5 | L-glutamine transmembrane transporter activity |
| GO:0042887 | 0.0059 | 9.5813 | 0.379 | 3 | 16 | amide transmembrane transporter activity |
| GOMFID | Pvalue | OddsRatio | ExpCount | Count | Size | Term |
| GO:0016209 | 5e-04 | 5.644 | 1.3858 | 7 | 64 | antioxidant activity |
| GO:0016667 | 6e-04 | 6.3994 | 1.061 | 6 | 49 | oxidoreductase activity, acting on a sulfur group of donors |
| GO:0004096 | 0.0014 | 90.8909 | 0.065 | 2 | 3 | catalase activity |
| GO:0019787 | 0.0021 | 2.2585 | 8.4232 | 18 | 389 | ubiquitin-like protein transferase activity |
| GO:0061630 | 0.0022 | 2.9525 | 3.9626 | 11 | 183 | ubiquitin protein ligase activity |
| GO:0019001 | 0.0022 | 2.3113 | 7.7736 | 17 | 359 | guanyl nucleotide binding |
| GO:0043021 | 0.0023 | 4.1726 | 1.8189 | 7 | 84 | ribonucleoprotein complex binding |
| GO:0004735 | 0.0027 | 45.4425 | 0.0866 | 2 | 4 | pyrroline-5-carboxylate reductase activity |
| GO:0031014 | 0.0027 | 45.4425 | 0.0866 | 2 | 4 | troponin T binding |
| GO:0005525 | 0.0032 | 2.2846 | 7.3839 | 16 | 341 | GTP binding |
| GO:0003735 | 0.0035 | 2.7578 | 4.2224 | 11 | 195 | structural constituent of ribosome |
| GO:0000774 | 0.0045 | 30.293 | 0.1083 | 2 | 5 | adenyl-nucleotide exchange factor activity |
| GO:0003924 | 0.0062 | 2.5474 | 4.5472 | 11 | 210 | GTPase activity |
| GO:0003823 | 0.0064 | 3.8687 | 1.6673 | 6 | 77 | antigen binding |
| GO:0015204 | 0.0066 | 22.7183 | 0.1299 | 2 | 6 | urea transmembrane transporter activity |
| GO:0001849 | 0.0091 | 18.1735 | 0.1516 | 2 | 7 | complement component C1q binding |
| GO:0015037 | 0.0091 | 18.1735 | 0.1516 | 2 | 7 | peptide disulfide oxidoreductase activity |
| GOMFID | Pvalue | OddsRatio | ExpCount | Count | Size | Term |
| GO:0004348 | 5e-04 | Inf | 0.0434 | 2 | 2 | glucosylceramidase activity |
| GO:0003841 | 0.0011 | 19.4678 | 0.2172 | 3 | 10 | 1-acylglycerol-3-phosphate O-acyltransferase activity |
| GO:0004939 | 0.0014 | 90.6176 | 0.0652 | 2 | 3 | beta-adrenergic receptor activity |
| GO:0071617 | 0.0019 | 15.1396 | 0.2606 | 3 | 12 | lysophospholipid acyltransferase activity |
| GO:1990381 | 0.0019 | 15.1396 | 0.2606 | 3 | 12 | ubiquitin-specific protease binding |
| GO:0051380 | 0.0027 | 45.3059 | 0.0869 | 2 | 4 | norepinephrine binding |
| GO:0003743 | 0.0031 | 5.5602 | 0.999 | 5 | 46 | translation initiation factor activity |
| GO:0003723 | 0.0063 | 1.5346 | 32.4887 | 47 | 1496 | RNA binding |
| GO:0036402 | 0.0067 | 22.65 | 0.1303 | 2 | 6 | proteasome-activating ATPase activity |
| GO:0051379 | 0.0067 | 22.65 | 0.1303 | 2 | 6 | epinephrine binding |
| GOMFID | Pvalue | OddsRatio | ExpCount | Count | Size | Term |
| GO:0008808 | 4e-04 | Inf | 0.0377 | 2 | 2 | cardiolipin synthase activity |
| GO:0003676 | 5e-04 | 1.5465 | 69.7426 | 95 | 3698 | nucleic acid binding |
| GO:0044822 | 0.0013 | 1.8209 | 21.1981 | 36 | 1124 | poly(A) RNA binding |
| GO:0005047 | 0.0034 | 34.9107 | 0.0943 | 2 | 5 | signal recognition particle binding |
| GO:0008198 | 0.0069 | 8.7489 | 0.3961 | 3 | 21 | ferrous iron binding |
| GO:0016410 | 0.0071 | 3.772 | 1.6974 | 6 | 90 | N-acyltransferase activity |
| GO:0050699 | 0.0078 | 8.2879 | 0.4149 | 3 | 22 | WW domain binding |
| GOMFID | Pvalue | OddsRatio | ExpCount | Count | Size | Term |
| GO:0008808 | 3e-04 | Inf | 0.034 | 2 | 2 | cardiolipin synthase activity |
| GO:0016717 | 0.0028 | 38.7895 | 0.0851 | 2 | 5 | oxidoreductase activity, acting on paired donors, with oxidation of a pair of donors resulting in the reduction of molecular oxygen to two molecules of water |
| GO:0044822 | 0.0029 | 1.7866 | 19.1283 | 32 | 1124 | poly(A) RNA binding |
| GO:0036402 | 0.0041 | 29.0902 | 0.1021 | 2 | 6 | proteasome-activating ATPase activity |
| GO:0016423 | 0.0057 | 23.2707 | 0.1191 | 2 | 7 | tRNA (guanine) methyltransferase activity |
| GO:0004521 | 0.0089 | 5.3154 | 0.8169 | 4 | 48 | endoribonuclease activity |
| GO:0019843 | 0.0095 | 5.197 | 0.8339 | 4 | 49 | rRNA binding |
| GO:0015271 | 0.0096 | 16.6198 | 0.1532 | 2 | 9 | outward rectifier potassium channel activity |
| GO:0051400 | 0.0096 | 16.6198 | 0.1532 | 2 | 9 | BH domain binding |
| GO:1901363 | 0.0098 | 1.3524 | 93.2588 | 112 | 5480 | heterocyclic compound binding |
| GOMFID | Pvalue | OddsRatio | ExpCount | Count | Size | Term |
| GO:0004984 | 0 | 6.7024 | 3.5243 | 20 | 370 | olfactory receptor activity |
| GO:0004930 | 0 | 3.7343 | 7.439 | 24 | 781 | G-protein coupled receptor activity |
| GO:0099600 | 1e-04 | 2.5387 | 11.5824 | 26 | 1216 | transmembrane receptor activity |
| GO:0038023 | 4e-04 | 2.3077 | 12.0872 | 25 | 1269 | signaling receptor activity |
| GO:0000774 | 9e-04 | 70.2477 | 0.0476 | 2 | 5 | adenyl-nucleotide exchange factor activity |
| GO:0060089 | 0.002 | 2.0016 | 14.3352 | 26 | 1505 | molecular transducer activity |
| GO:0005549 | 0.0081 | 5.382 | 0.7906 | 4 | 83 | odorant binding |
| GO:0004632 | 0.0095 | Inf | 0.0095 | 1 | 1 | phosphopantothenate--cysteine ligase activity |
| GO:0017168 | 0.0095 | Inf | 0.0095 | 1 | 1 | 5-oxoprolinase (ATP-hydrolyzing) activity |
| GO:0052856 | 0.0095 | Inf | 0.0095 | 1 | 1 | NADHX epimerase activity |
| GO:0052857 | 0.0095 | Inf | 0.0095 | 1 | 1 | NADPHX epimerase activity |
| GO:0052858 | 0.0095 | Inf | 0.0095 | 1 | 1 | peptidyl-lysine N-acetyltransferase activity, acting on acetyl phosphate as donor |
| GO:0072572 | 0.0095 | Inf | 0.0095 | 1 | 1 | poly-ADP-D-ribose binding |
| GOMFID | Pvalue | OddsRatio | ExpCount | Count | Size | Term |
| GO:0004540 | 2e-04 | 6.5569 | 1.1806 | 7 | 83 | ribonuclease activity |
| GO:0004519 | 2e-04 | 5.3871 | 1.6215 | 8 | 114 | endonuclease activity |
| GO:0005504 | 6e-04 | 11.7424 | 0.3983 | 4 | 28 | fatty acid binding |
| GO:0003735 | 0.0019 | 3.4519 | 2.7737 | 9 | 195 | structural constituent of ribosome |
| GO:0004523 | 0.004 | 27.9622 | 0.0996 | 2 | 7 | RNA-DNA hybrid ribonuclease activity |
| GO:0005549 | 0.0066 | 4.5211 | 1.1806 | 5 | 83 | odorant binding |
| GO:0030881 | 0.0068 | 19.9704 | 0.128 | 2 | 9 | beta-2-microglobulin binding |
| GO:0016892 | 0.0084 | 17.473 | 0.1422 | 2 | 10 | endoribonuclease activity, producing 3'-phosphomonoesters |
| GOMFID | Pvalue | OddsRatio | ExpCount | Count | Size | Term |
| GO:0005509 | 0 | 6.5418 | 6.2257 | 32 | 658 | calcium ion binding |
| GO:0004984 | 0 | 5.9517 | 3.5008 | 18 | 370 | olfactory receptor activity |
| GO:0004930 | 0 | 4.156 | 7.3894 | 26 | 781 | G-protein coupled receptor activity |
| GO:0038023 | 0 | 2.7985 | 12.0067 | 29 | 1269 | signaling receptor activity |
| GO:0099600 | 0 | 2.8071 | 11.5052 | 28 | 1216 | transmembrane receptor activity |
| GO:0060089 | 1e-04 | 2.414 | 14.2396 | 30 | 1505 | molecular transducer activity |
| GO:0005184 | 1e-04 | 19.5323 | 0.246 | 4 | 26 | neuropeptide hormone activity |
| GO:0051380 | 5e-04 | 106.102 | 0.0378 | 2 | 4 | norepinephrine binding |
| GO:0051379 | 0.0013 | 53.0442 | 0.0568 | 2 | 6 | epinephrine binding |
| GO:0004935 | 0.0031 | 30.3052 | 0.0852 | 2 | 9 | adrenergic receptor activity |
| GO:0005549 | 0.0079 | 5.4195 | 0.7853 | 4 | 83 | odorant binding |
| GO:0004940 | 0.0095 | Inf | 0.0095 | 1 | 1 | beta1-adrenergic receptor activity |
| GO:0005307 | 0.0095 | Inf | 0.0095 | 1 | 1 | choline:sodium symporter activity |
| GO:0031857 | 0.0095 | Inf | 0.0095 | 1 | 1 | type 1 parathyroid hormone receptor binding |
| GO:0001664 | 0.0098 | 3.1152 | 2.3654 | 7 | 250 | G-protein coupled receptor binding |
| GOMFID | Pvalue | OddsRatio | ExpCount | Count | Size | Term |
| GO:0010576 | 0.0017 | 15.2747 | 0.248 | 3 | 14 | metalloenzyme regulator activity |
| GO:0001601 | 0.0018 | 55.8375 | 0.0709 | 2 | 4 | peptide YY receptor activity |
| GO:0008301 | 0.0031 | 11.9992 | 0.3012 | 3 | 17 | DNA binding, bending |
| GO:0001588 | 0.0045 | 27.9152 | 0.1063 | 2 | 6 | dopamine neurotransmitter receptor activity, coupled via Gs |
| GO:0098505 | 0.0062 | 22.3307 | 0.124 | 2 | 7 | G-rich strand telomeric DNA binding |
| GO:0003735 | 0.0081 | 2.7389 | 3.4547 | 9 | 195 | structural constituent of ribosome |
| GOMFID | Pvalue | OddsRatio | ExpCount | Count | Size | Term |
| GO:0003735 | 0 | 4.6343 | 2.8356 | 12 | 195 | structural constituent of ribosome |
| GO:0044822 | 4e-04 | 2.0664 | 16.3447 | 31 | 1124 | poly(A) RNA binding |
| GO:0001588 | 0.003 | 34.174 | 0.0872 | 2 | 6 | dopamine neurotransmitter receptor activity, coupled via Gs |
| GO:0003785 | 0.0033 | 11.4314 | 0.3054 | 3 | 21 | actin monomer binding |
| GO:0019957 | 0.0042 | 27.3374 | 0.1018 | 2 | 7 | C-C chemokine binding |
| GO:0005549 | 0.0072 | 4.4188 | 1.2069 | 5 | 83 | odorant binding |
| GO:0001055 | 0.0088 | 17.0826 | 0.1454 | 2 | 10 | RNA polymerase II activity |
| GO:0035240 | 0.0088 | 17.0826 | 0.1454 | 2 | 10 | dopamine binding |
| GOMFID | Pvalue | OddsRatio | ExpCount | Count | Size | Term |
| GO:0004984 | 0 | 5.9209 | 2.514 | 13 | 370 | olfactory receptor activity |
| GO:0099600 | 5e-04 | 2.6053 | 8.2621 | 19 | 1216 | transmembrane receptor activity |
| GO:0004930 | 8e-04 | 2.9193 | 5.3065 | 14 | 781 | G-protein coupled receptor activity |
| GO:0038023 | 0.0022 | 2.3264 | 8.6222 | 18 | 1269 | signaling receptor activity |
| GO:0060089 | 0.0026 | 2.1914 | 10.2257 | 20 | 1505 | molecular transducer activity |
| GO:0019864 | 0.0029 | 29.7733 | 0.0815 | 2 | 12 | IgG binding |
| GO:0001872 | 0.0068 | Inf | 0.0068 | 1 | 1 | (1->3)-beta-D-glucan binding |
| GO:0004853 | 0.0068 | Inf | 0.0068 | 1 | 1 | uroporphyrinogen decarboxylase activity |
| GO:0005130 | 0.0068 | Inf | 0.0068 | 1 | 1 | granulocyte colony-stimulating factor receptor binding |
| GO:0005140 | 0.0068 | Inf | 0.0068 | 1 | 1 | interleukin-9 receptor binding |
| GO:0031855 | 0.0068 | Inf | 0.0068 | 1 | 1 | oxytocin receptor binding |
| GO:0051139 | 0.0068 | Inf | 0.0068 | 1 | 1 | metal ion:proton antiporter activity |
| GO:0070037 | 0.0068 | Inf | 0.0068 | 1 | 1 | rRNA (pseudouridine) methyltransferase activity |
| GOMFID | Pvalue | OddsRatio | ExpCount | Count | Size | Term |
| GO:0003735 | 8e-04 | 2.8568 | 5.2502 | 14 | 195 | structural constituent of ribosome |
| GO:0043024 | 0.0014 | 18.1924 | 0.2423 | 3 | 9 | ribosomal small subunit binding |
| GO:0004792 | 0.0021 | 72.6209 | 0.0808 | 2 | 3 | thiosulfate sulfurtransferase activity |
| GO:0010997 | 0.0021 | 72.6209 | 0.0808 | 2 | 3 | anaphase-promoting complex binding |
| GO:0003954 | 0.003 | 5.7026 | 0.9962 | 5 | 37 | NADH dehydrogenase activity |
| GO:0008137 | 0.003 | 5.7026 | 0.9962 | 5 | 37 | NADH dehydrogenase (ubiquinone) activity |
| GO:0003676 | 0.0032 | 1.3589 | 99.5652 | 124 | 3698 | nucleic acid binding |
| GO:0016671 | 0.0045 | 10.9126 | 0.35 | 3 | 13 | oxidoreductase activity, acting on a sulfur group of donors, disulfide as acceptor |
| GO:0008135 | 0.0061 | 3.4594 | 2.1808 | 7 | 81 | translation factor activity, RNA binding |
| GO:0044822 | 0.0079 | 1.5271 | 30.2626 | 44 | 1124 | poly(A) RNA binding |
| GO:0005521 | 0.0084 | 8.3927 | 0.4308 | 3 | 16 | lamin binding |
| GOMFID | Pvalue | OddsRatio | ExpCount | Count | Size | Term |
| GO:0042134 | 0.0018 | 56.6703 | 0.0699 | 2 | 4 | rRNA primary transcript binding |
| GO:0043236 | 0.002 | 8.4439 | 0.5413 | 4 | 31 | laminin binding |
| GO:0003729 | 0.0041 | 3.3295 | 2.5495 | 8 | 146 | mRNA binding |
| GOMFID | Pvalue | OddsRatio | ExpCount | Count | Size | Term |
| GO:0046703 | 1e-04 | 27.4314 | 0.2572 | 4 | 9 | natural killer cell lectin-like receptor binding |
| GO:0016538 | 7e-04 | 8.1739 | 0.743 | 5 | 26 | cyclin-dependent protein serine/threonine kinase regulator activity |
| GO:0035034 | 8e-04 | Inf | 0.0572 | 2 | 2 | histone acetyltransferase regulator activity |
| GO:0004052 | 0.0024 | 68.2902 | 0.0857 | 2 | 3 | arachidonate 12-lipoxygenase activity |
| GO:0019864 | 0.0042 | 11.4012 | 0.3429 | 3 | 12 | IgG binding |
| GO:0008392 | 0.0082 | 8.5492 | 0.4286 | 3 | 15 | arachidonic acid epoxygenase activity |
| GO:0000975 | 0.0088 | 1.6056 | 22.1457 | 34 | 775 | regulatory region DNA binding |
| GOMFID | Pvalue | OddsRatio | ExpCount | Count | Size | Term |
| GO:0070883 | 1e-04 | 111.9197 | 0.1052 | 3 | 4 | pre-miRNA binding |
| GO:0003729 | 5e-04 | 3.3861 | 3.8382 | 12 | 146 | mRNA binding |
| GO:0003735 | 7e-04 | 2.9301 | 5.1264 | 14 | 195 | structural constituent of ribosome |
| GO:0031765 | 7e-04 | Inf | 0.0526 | 2 | 2 | type 2 galanin receptor binding |
| GO:0031766 | 7e-04 | Inf | 0.0526 | 2 | 2 | type 3 galanin receptor binding |
| GO:0003723 | 0.0013 | 1.5959 | 38.878 | 58 | 1489 | RNA binding |
| GO:0032217 | 0.002 | 74.432 | 0.0789 | 2 | 3 | riboflavin transporter activity |
| GO:0050833 | 0.002 | 74.432 | 0.0789 | 2 | 3 | pyruvate transmembrane transporter activity |
| GO:0004966 | 0.004 | 37.2136 | 0.1052 | 2 | 4 | galanin receptor activity |
| GO:0008173 | 0.0047 | 5.0542 | 1.1041 | 5 | 42 | RNA methyltransferase activity |
| GO:0003923 | 0.0065 | 24.8074 | 0.1314 | 2 | 5 | GPI-anchor transamidase activity |
| GO:0035197 | 0.0065 | 24.8074 | 0.1314 | 2 | 5 | siRNA binding |
| GO:0008009 | 0.0083 | 4.3472 | 1.2619 | 5 | 48 | chemokine activity |
| GOMFID | Pvalue | OddsRatio | ExpCount | Count | Size | Term |
| GO:0004984 | 4e-04 | 3.4493 | 3.7592 | 12 | 370 | olfactory receptor activity |
| GO:1901612 | 6e-04 | 98.6456 | 0.0406 | 2 | 4 | cardiolipin binding |
| GO:0034046 | 0.001 | 65.7595 | 0.0508 | 2 | 5 | poly(G) binding |
| GO:0004521 | 0.0014 | 9.0583 | 0.4877 | 4 | 48 | endoribonuclease activity |
| GO:0003696 | 0.0021 | 39.4506 | 0.0711 | 2 | 7 | satellite DNA binding |
| GO:0004523 | 0.0021 | 39.4506 | 0.0711 | 2 | 7 | RNA-DNA hybrid ribonuclease activity |
| GO:0016893 | 0.0062 | 8.7415 | 0.3759 | 3 | 37 | endonuclease activity, active with either ribo- or deoxyribonucleic acids and producing 5'-phosphomonoesters |
| GO:0035198 | 0.0099 | 15.1655 | 0.1524 | 2 | 15 | miRNA binding |
| GOMFID | Pvalue | OddsRatio | ExpCount | Count | Size | Term |
| GO:0004984 | 0 | 4.7438 | 4.2761 | 18 | 370 | olfactory receptor activity |
| GO:0004930 | 7e-04 | 2.4018 | 9.026 | 20 | 781 | G-protein coupled receptor activity |
| GO:0004468 | 0.0013 | 57.6407 | 0.0578 | 2 | 5 | lysine N-acetyltransferase activity, acting on acetyl phosphate as donor |
| GO:0004521 | 0.0023 | 7.9275 | 0.5547 | 4 | 48 | endoribonuclease activity |
| GO:0008168 | 0.0026 | 3.6054 | 2.3576 | 8 | 204 | methyltransferase activity |
| GO:0004523 | 0.0027 | 34.58 | 0.0809 | 2 | 7 | RNA-DNA hybrid ribonuclease activity |
| GO:0043047 | 0.0045 | 24.6968 | 0.104 | 2 | 9 | single-stranded telomeric DNA binding |
| GO:0004518 | 0.0058 | 3.458 | 2.138 | 7 | 185 | nuclease activity |
| GO:0005319 | 0.0058 | 4.6496 | 1.1441 | 5 | 99 | lipid transporter activity |
| GO:0099600 | 0.0069 | 1.8317 | 14.0533 | 24 | 1216 | transmembrane receptor activity |
| GO:0003723 | 0.0073 | 1.7461 | 17.2893 | 28 | 1496 | RNA binding |
| GO:0051787 | 0.0081 | 17.2844 | 0.1387 | 2 | 12 | misfolded protein binding |
| GO:1990381 | 0.0081 | 17.2844 | 0.1387 | 2 | 12 | ubiquitin-specific protease binding |
| GO:0016893 | 0.0088 | 7.6563 | 0.4276 | 3 | 37 | endonuclease activity, active with either ribo- or deoxyribonucleic acids and producing 5'-phosphomonoesters |
| GO:0008649 | 0.0095 | 15.7121 | 0.1502 | 2 | 13 | rRNA methyltransferase activity |
| GOMFID | Pvalue | OddsRatio | ExpCount | Count | Size | Term |
| GO:0004984 | 0 | 3.5561 | 4.9105 | 16 | 370 | olfactory receptor activity |
| GO:0045159 | 0.0017 | 50.0354 | 0.0664 | 2 | 5 | myosin II binding |
| GO:0043024 | 0.0059 | 21.4382 | 0.1194 | 2 | 9 | ribosomal small subunit binding |
| GOMFID | Pvalue | OddsRatio | ExpCount | Count | Size | Term |
| GO:0004984 | 0 | 3.8623 | 3.9707 | 14 | 370 | olfactory receptor activity |
| GO:0004062 | 0.0017 | 46.6317 | 0.0644 | 2 | 6 | aryl sulfotransferase activity |
| GO:0004930 | 0.0018 | 2.3147 | 8.3813 | 18 | 781 | G-protein coupled receptor activity |
| GO:0038023 | 0.0022 | 2.0006 | 13.6183 | 25 | 1269 | signaling receptor activity |
| GO:0060089 | 0.0054 | 1.8141 | 16.1509 | 27 | 1505 | molecular transducer activity |
| GO:0001618 | 0.0058 | 5.9706 | 0.719 | 4 | 67 | virus receptor activity |
| GO:0050786 | 0.0059 | 20.7186 | 0.118 | 2 | 11 | RAGE receptor binding |
| GOMFID | Pvalue | OddsRatio | ExpCount | Count | Size | Term |
| GO:0004984 | 0 | 4.6673 | 4.84 | 20 | 370 | olfactory receptor activity |
| GO:0004930 | 2e-04 | 2.4513 | 10.2163 | 23 | 781 | G-protein coupled receptor activity |
| GO:0034513 | 5e-04 | 152.3627 | 0.0392 | 2 | 3 | box H/ACA snoRNA binding |
| GO:0070034 | 6e-04 | 22.9537 | 0.1701 | 3 | 13 | telomerase RNA binding |
| GO:0000774 | 0.0017 | 50.781 | 0.0654 | 2 | 5 | adenyl-nucleotide exchange factor activity |
| GO:0034046 | 0.0017 | 50.781 | 0.0654 | 2 | 5 | poly(G) binding |
| GO:0046703 | 0.0058 | 21.7577 | 0.1177 | 2 | 9 | natural killer cell lectin-like receptor binding |
| GO:0003727 | 0.0074 | 5.5759 | 0.7718 | 4 | 59 | single-stranded RNA binding |
| GO:0038023 | 0.0082 | 1.7367 | 16.5998 | 27 | 1269 | signaling receptor activity |
| GOMFID | Pvalue | OddsRatio | ExpCount | Count | Size | Term |
| GO:0004109 | 3e-04 | Inf | 0.034 | 2 | 2 | coproporphyrinogen oxidase activity |
| GO:0003735 | 0.0019 | 3.2045 | 3.3185 | 10 | 195 | structural constituent of ribosome |
| GO:0051536 | 0.0038 | 5.2363 | 1.0381 | 5 | 61 | iron-sulfur cluster binding |
| GO:0044822 | 0.0053 | 1.7217 | 19.1283 | 31 | 1124 | poly(A) RNA binding |
| GO:0016742 | 0.0076 | 19.391 | 0.1361 | 2 | 8 | hydroxymethyl-, formyl- and related transferase activity |
| GO:0019843 | 0.0095 | 5.197 | 0.8339 | 4 | 49 | rRNA binding |
| GO:0009055 | 0.0099 | 3.487 | 1.8209 | 6 | 107 | electron carrier activity |
| NA. |
| n/a |
| NA. |
| n/a |
| NA. |
| n/a |
| NA. |
| n/a |
| NA. |
| n/a |
| NA. |
| n/a |
| NA. |
| n/a |
| NA. |
| n/a |
| NA. |
| n/a |
| NA. |
| n/a |
| NA. |
| n/a |
| NA. |
| n/a |
| NA. |
| n/a |
| NA. |
| n/a |
| NA. |
| n/a |
| NA. |
| n/a |
| NA. |
| n/a |
| NA. |
| n/a |
| NA. |
| n/a |
| NA. |
| n/a |
| NA. |
| n/a |
| NA. |
| n/a |
| NA. |
| n/a |
| NA. |
| n/a |
| NA. |
| n/a |
| NA. |
| n/a |
| NA. |
| n/a |
| NA. |
| n/a |
| NA. |
| n/a |
| NA. |
| n/a |
| NA. |
| n/a |
| NA. |
| n/a |
| NA. |
| n/a |
| NA. |
| n/a |
| NA. |
| n/a |
| NA. |
| n/a |
| NA. |
| n/a |
| NA. |
| n/a |
| NA. |
| n/a |
| NA. |
| n/a |
| NA. |
| n/a |
| NA. |
| n/a |
| NA. |
| n/a |
| NA. |
| n/a |
| NA. |
| n/a |
| NA. |
| n/a |
| NA. |
| n/a |
| NA. |
| n/a |
| NA. |
| n/a |
| NA. |
| n/a |
| NA. |
| n/a |
| NA. |
| n/a |
| NA. |
| n/a |
| NA. |
| n/a |
| NA. |
| n/a |
| NA. |
| n/a |
| NA. |
| n/a |
| NA. |
| n/a |
| NA. |
| n/a |
| NA. |
| n/a |
| NA. |
| n/a |
| NA. |
| n/a |
| NA. |
| n/a |
| NA. |
| n/a |
| NA. |
| n/a |
| NA. |
| n/a |
| NA. |
| n/a |
| NA. |
| n/a |
| NA. |
| n/a |
| NA. |
| n/a |
| NA. |
| n/a |
| NA. |
| n/a |
| NA. |
| n/a |
| NA. |
| n/a |
| NA. |
| n/a |
| NA. |
| n/a |
| NA. |
| n/a |
| NA. |
| n/a |
| NA. |
| n/a |
| NA. |
| n/a |
| NA. |
| n/a |
| NA. |
| n/a |
| NA. |
| n/a |
| NA. |
| n/a |
| NA. |
| n/a |
| NA. |
| n/a |
| NA. |
| n/a |
| NA. |
| n/a |
| NA. |
| n/a |
| NA. |
| n/a |
| NA. |
| n/a |
| NA. |
| n/a |
| NA. |
| n/a |
| NA. |
| n/a |
| NA. |
| n/a |
| NA. |
| n/a |
| NA. |
| n/a |
| NA. |
| n/a |
| NA. |
| n/a |
| NA. |
| n/a |
| NA. |
| n/a |
| NA. |
| n/a |
| NA. |
| n/a |
| NA. |
| n/a |
| NA. |
| n/a |
| NA. |
| n/a |
| NA. |
| n/a |
| NA. |
| n/a |
| NA. |
| n/a |
| NA. |
| n/a |
| NA. |
| n/a |
| NA. |
| n/a |
| NA. |
| n/a |
| NA. |
| n/a |
| NA. |
| n/a |
| NA. |
| n/a |
| NA. |
| n/a |
| NA. |
| n/a |
| NA. |
| n/a |
| NA. |
| n/a |
| NA. |
| n/a |
| NA. |
| n/a |
| NA. |
| n/a |
| NA. |
| n/a |
| NA. |
| n/a |
| NA. |
| n/a |
| NA. |
| n/a |
| NA. |
| n/a |
| NA. |
| n/a |
| NA. |
| n/a |
| NA. |
| n/a |
| NA. |
| n/a |
| NA. |
| n/a |
| NA. |
| n/a |
| NA. |
| n/a |
| NA. |
| n/a |
| NA. |
| n/a |
| NA. |
| n/a |
| NA. |
| n/a |
| NA. |
| n/a |
| NA. |
| n/a |
| NA. |
| n/a |
| NA. |
| n/a |
| NA. |
| n/a |
| NA. |
| n/a |
| NA. |
| n/a |
| NA. |
| n/a |
| NA. |
| n/a |
| NA. |
| n/a |
| NA. |
| n/a |
| NA. |
| n/a |
| NA. |
| n/a |
| NA. |
| n/a |
| NA. |
| n/a |
| NA. |
| n/a |
| NA. |
| n/a |
| NA. |
| n/a |
| NA. |
| n/a |
| NA. |
| n/a |
| NA. |
| n/a |
| NA. |
| n/a |
| NA. |
| n/a |
| NA. |
| n/a |
| NA. |
| n/a |
| NA. |
| n/a |
| NA. |
| n/a |
| NA. |
| n/a |
| NA. |
| n/a |
| NA. |
| n/a |
| NA. |
| n/a |
| NA. |
| n/a |
| NA. |
| n/a |
| NA. |
| n/a |
| NA. |
| n/a |
| NA. |
| n/a |
| NA. |
| n/a |
| NA. |
| n/a |
| NA. |
| n/a |
| NA. |
| n/a |
| NA. |
| n/a |
| NA. |
| n/a |
| NA. |
| n/a |
| NA. |
| n/a |
| NA. |
| n/a |
| NA. |
| n/a |
| NA. |
| n/a |
| NA. |
| n/a |
| NA. |
| n/a |
| NA. |
| n/a |
| NA. |
| n/a |
| NA. |
| n/a |
| NA. |
| n/a |
| NA. |
| n/a |
| NA. |
| n/a |
| NA. |
| n/a |
| NA. |
| n/a |
| NA. |
| n/a |
| NA. |
| n/a |
| NA. |
| n/a |
| NA. |
| n/a |
| NA. |
| n/a |
| NA. |
| n/a |
| NA. |
| n/a |
| NA. |
| n/a |
| NA. |
| n/a |
| NA. |
| n/a |
| NA. |
| n/a |
| NA. |
| n/a |
| NA. |
| n/a |
| NA. |
| n/a |
| NA. |
| n/a |
| NA. |
| n/a |
| NA. |
| n/a |
| NA. |
| n/a |
| NA. |
| n/a |
| NA. |
| n/a |
| NA. |
| n/a |
| NA. |
| n/a |
| NA. |
| n/a |
| NA. |
| n/a |
| NA. |
| n/a |
| NA. |
| n/a |
| NA. |
| n/a |
| NA. |
| n/a |
| NA. |
| n/a |
| NA. |
| n/a |
| NA. |
| n/a |
| NA. |
| n/a |
| NA. |
| n/a |
| NA. |
| n/a |
| NA. |
| n/a |
| NA. |
| n/a |
| NA. |
| n/a |
| NA. |
| n/a |
| NA. |
| n/a |
| NA. |
| n/a |
| NA. |
| n/a |
| NA. |
| n/a |
| NA. |
| n/a |
| NA. |
| n/a |
| GOMFID | Pvalue | OddsRatio | ExpCount | Count | Size | Term |
| GO:1900041 | 0 | Inf | 0.1337 | 4 | 4 | negative regulation of interleukin-2 secretion |
| GO:0002407 | 7e-04 | 8.5769 | 0.7354 | 5 | 22 | dendritic cell chemotaxis |
| GO:0000395 | 7e-04 | 29.0766 | 0.2006 | 3 | 6 | mRNA 5'-splice site recognition |
| GO:1900390 | 0.0011 | Inf | 0.0669 | 2 | 2 | regulation of iron ion import |
| GO:1903070 | 0.0011 | Inf | 0.0669 | 2 | 2 | negative regulation of ER-associated ubiquitin-dependent protein catabolic process |
| GO:1903991 | 0.0011 | Inf | 0.0669 | 2 | 2 | positive regulation of ferrous iron import into cell |
| GO:1904434 | 0.0011 | Inf | 0.0669 | 2 | 2 | positive regulation of ferrous iron binding |
| GO:1904437 | 0.0011 | Inf | 0.0669 | 2 | 2 | positive regulation of transferrin receptor binding |
| GO:0046598 | 0.0012 | 21.806 | 0.234 | 3 | 7 | positive regulation of viral entry into host cell |
| GO:0008360 | 0.0028 | 2.8794 | 4.1115 | 11 | 123 | regulation of cell shape |
| GO:0010288 | 0.0032 | 7.7625 | 0.6351 | 4 | 19 | response to lead ion |
| GO:0010513 | 0.0033 | 58.0497 | 0.1003 | 2 | 3 | positive regulation of phosphatidylinositol biosynthetic process |
| GO:0034436 | 0.0033 | 58.0497 | 0.1003 | 2 | 3 | glycoprotein transport |
| GO:1903225 | 0.0033 | 58.0497 | 0.1003 | 2 | 3 | negative regulation of endodermal cell differentiation |
| GO:0042269 | 0.0045 | 5.2036 | 1.1031 | 5 | 33 | regulation of natural killer cell mediated cytotoxicity |
| GO:0000724 | 0.0048 | 2.5314 | 5.0474 | 12 | 151 | double-strand break repair via homologous recombination |
| GO:0006897 | 0.005 | 1.701 | 19.7218 | 32 | 590 | endocytosis |
| GO:0015937 | 0.005 | 10.9001 | 0.3677 | 3 | 11 | coenzyme A biosynthetic process |
| GO:0021702 | 0.005 | 10.9001 | 0.3677 | 3 | 11 | cerebellar Purkinje cell differentiation |
| GO:0051988 | 0.005 | 10.9001 | 0.3677 | 3 | 11 | regulation of attachment of spindle microtubules to kinetochore |
| GO:0071320 | 0.0051 | 4.1671 | 1.6045 | 6 | 48 | cellular response to cAMP |
| GO:0016043 | 0.0058 | 1.2612 | 194.8443 | 223 | 5829 | cellular component organization |
| GO:0006303 | 0.0058 | 3.5235 | 2.1727 | 7 | 65 | double-strand break repair via nonhomologous end joining |
| GO:0016192 | 0.0061 | 1.6253 | 23.2215 | 36 | 712 | vesicle-mediated transport |
| GO:0003241 | 0.0064 | 29.0229 | 0.1337 | 2 | 4 | growth involved in heart morphogenesis |
| GO:0016557 | 0.0064 | 29.0229 | 0.1337 | 2 | 4 | peroxisome membrane biogenesis |
| GO:0035426 | 0.0064 | 29.0229 | 0.1337 | 2 | 4 | extracellular matrix-cell signaling |
| GO:0000278 | 0.0075 | 1.5007 | 33.4936 | 48 | 1002 | mitotic cell cycle |
| GO:0051493 | 0.0077 | 1.8139 | 13.2704 | 23 | 397 | regulation of cytoskeleton organization |
| GO:0046636 | 0.0077 | 5.82 | 0.8022 | 4 | 24 | negative regulation of alpha-beta T cell activation |
| GO:0070208 | 0.0083 | 8.719 | 0.4345 | 3 | 13 | protein heterotrimerization |
| GO:0006793 | 0.0083 | 1.3015 | 98.9765 | 121 | 2961 | phosphorus metabolic process |
| GOMFID | Pvalue | OddsRatio | ExpCount | Count | Size | Term |
| GO:0043524 | 0.001 | 3.0914 | 4.2037 | 12 | 131 | negative regulation of neuron apoptotic process |
| GO:0021680 | 0.0013 | 7.2435 | 0.8343 | 5 | 26 | cerebellar Purkinje cell layer development |
| GO:0072673 | 0.0014 | 10.1267 | 0.5134 | 4 | 16 | lamellipodium morphogenesis |
| GO:0071650 | 0.003 | 60.5618 | 0.0963 | 2 | 3 | negative regulation of chemokine (C-C motif) ligand 5 production |
| GO:0071320 | 0.0041 | 4.3488 | 1.5403 | 6 | 48 | cellular response to cAMP |
| GO:0032507 | 0.0047 | 3.2973 | 2.6314 | 8 | 82 | maintenance of protein location in cell |
| GO:0042994 | 0.0057 | 6.3928 | 0.7381 | 4 | 23 | cytoplasmic sequestering of transcription factor |
| GO:0043570 | 0.0059 | 30.2789 | 0.1284 | 2 | 4 | maintenance of DNA repeat elements |
| GO:0061732 | 0.0059 | 30.2789 | 0.1284 | 2 | 4 | mitochondrial acetyl-CoA biosynthetic process from pyruvate |
| GO:0098501 | 0.0059 | 30.2789 | 0.1284 | 2 | 4 | polynucleotide dephosphorylation |
| GO:0043517 | 0.0074 | 9.097 | 0.4172 | 3 | 13 | positive regulation of DNA damage response, signal transduction by p53 class mediator |
| GO:0071514 | 0.0089 | 5.52 | 0.8343 | 4 | 26 | genetic imprinting |
| GO:0060973 | 0.0092 | 8.2695 | 0.4493 | 3 | 14 | cell migration involved in heart development |
| GO:0030072 | 0.0096 | 2.0183 | 8.3112 | 16 | 259 | peptide hormone secretion |
| GO:0002439 | 0.0096 | 20.1846 | 0.1604 | 2 | 5 | chronic inflammatory response to antigenic stimulus |
| GO:0061056 | 0.0096 | 20.1846 | 0.1604 | 2 | 5 | sclerotome development |
| GO:0061197 | 0.0096 | 20.1846 | 0.1604 | 2 | 5 | fungiform papilla morphogenesis |
| GO:0021549 | 0.01 | 2.8685 | 2.9843 | 8 | 93 | cerebellum development |
| GOMFID | Pvalue | OddsRatio | ExpCount | Count | Size | Term |
| GO:1900025 | 5e-04 | 14.7665 | 0.3958 | 4 | 12 | negative regulation of substrate adhesion-dependent cell spreading |
| GO:0002537 | 0.0011 | Inf | 0.066 | 2 | 2 | nitric oxide production involved in inflammatory response |
| GO:0060545 | 0.0011 | Inf | 0.066 | 2 | 2 | positive regulation of necroptotic process |
| GO:0034142 | 0.0011 | 3.2735 | 3.6609 | 11 | 111 | toll-like receptor 4 signaling pathway |
| GO:0007249 | 0.0013 | 2.3727 | 8.0804 | 18 | 245 | I-kappaB kinase/NF-kappaB signaling |
| GO:0002757 | 0.0018 | 1.9383 | 14.7095 | 27 | 446 | immune response-activating signal transduction |
| GO:0021762 | 0.0024 | 4.9323 | 1.3852 | 6 | 42 | substantia nigra development |
| GO:0030534 | 0.0025 | 2.7685 | 4.6503 | 12 | 141 | adult behavior |
| GO:0007130 | 0.0025 | 8.4347 | 0.5937 | 4 | 18 | synaptonemal complex assembly |
| GO:0034138 | 0.0028 | 3.2978 | 2.9683 | 9 | 90 | toll-like receptor 3 signaling pathway |
| GO:1903596 | 0.0032 | 58.8643 | 0.0989 | 2 | 3 | regulation of gap junction assembly |
| GO:0007157 | 0.0034 | 4.552 | 1.4841 | 6 | 45 | heterophilic cell-cell adhesion via plasma membrane cell adhesion molecules |
| GO:0030031 | 0.0038 | 1.9666 | 11.7742 | 22 | 357 | cell projection assembly |
| GO:0046717 | 0.0039 | 2.9115 | 3.6939 | 10 | 112 | acid secretion |
| GO:0032412 | 0.0042 | 2.4646 | 5.6068 | 13 | 170 | regulation of ion transmembrane transporter activity |
| GO:0031953 | 0.0048 | 11.0534 | 0.3628 | 3 | 11 | negative regulation of protein autophosphorylation |
| GO:0007166 | 0.0051 | 1.3454 | 85.635 | 108 | 2621 | cell surface receptor signaling pathway |
| GO:0051592 | 0.0056 | 2.9487 | 3.2819 | 9 | 100 | response to calcium ion |
| GO:0007215 | 0.0059 | 3.5127 | 2.1767 | 7 | 66 | glutamate receptor signaling pathway |
| GO:0010572 | 0.0062 | 29.4302 | 0.1319 | 2 | 4 | positive regulation of platelet activation |
| GO:0030050 | 0.0062 | 29.4302 | 0.1319 | 2 | 4 | vesicle transport along actin filament |
| GO:0032483 | 0.0062 | 29.4302 | 0.1319 | 2 | 4 | regulation of Rab protein signal transduction |
| GO:0042424 | 0.0062 | 29.4302 | 0.1319 | 2 | 4 | catecholamine catabolic process |
| GO:1900041 | 0.0062 | 29.4302 | 0.1319 | 2 | 4 | negative regulation of interleukin-2 secretion |
| GO:1900084 | 0.0062 | 29.4302 | 0.1319 | 2 | 4 | regulation of peptidyl-tyrosine autophosphorylation |
| GO:1903215 | 0.0062 | 29.4302 | 0.1319 | 2 | 4 | negative regulation of protein targeting to mitochondrion |
| GO:0003376 | 0.0063 | 9.8246 | 0.3958 | 3 | 12 | sphingosine-1-phosphate signaling pathway |
| GO:0019321 | 0.0063 | 9.8246 | 0.3958 | 3 | 12 | pentose metabolic process |
| GO:0042340 | 0.0063 | 9.8246 | 0.3958 | 3 | 12 | keratan sulfate catabolic process |
| GO:0060384 | 0.0063 | 6.213 | 0.7586 | 4 | 23 | innervation |
| GO:0051092 | 0.0064 | 2.6983 | 3.9577 | 10 | 120 | positive regulation of NF-kappaB transcription factor activity |
| GO:0001885 | 0.007 | 3.8575 | 1.715 | 6 | 52 | endothelial cell development |
| GO:0002221 | 0.0071 | 2.3015 | 5.9696 | 13 | 181 | pattern recognition receptor signaling pathway |
| GO:2001020 | 0.0074 | 2.4937 | 4.6833 | 11 | 142 | regulation of response to DNA damage stimulus |
| GO:0060079 | 0.0077 | 3.7752 | 1.748 | 6 | 53 | excitatory postsynaptic potential |
| GO:0001666 | 0.0078 | 1.9742 | 9.5645 | 18 | 290 | response to hypoxia |
| GO:0001570 | 0.0081 | 3.2888 | 2.3087 | 7 | 70 | vasculogenesis |
| GO:0007265 | 0.0083 | 1.753 | 14.9074 | 25 | 452 | Ras protein signal transduction |
| GO:0051489 | 0.0097 | 4.2197 | 1.3192 | 5 | 40 | regulation of filopodium assembly |
| GO:0050778 | 0.0098 | 1.6149 | 20.6791 | 32 | 627 | positive regulation of immune response |
| GO:1901654 | 0.0099 | 2.2852 | 5.5408 | 12 | 168 | response to ketone |
| GO:0005513 | 0.0099 | 8.0372 | 0.4617 | 3 | 14 | detection of calcium ion |
| GOMFID | Pvalue | OddsRatio | ExpCount | Count | Size | Term |
| GO:0033197 | 1e-04 | 15.1597 | 0.4833 | 5 | 15 | response to vitamin E |
| GO:0031573 | 4e-04 | 15.1315 | 0.3866 | 4 | 12 | intra-S DNA damage checkpoint |
| GO:0048285 | 9e-04 | 1.905 | 18.3637 | 33 | 570 | organelle fission |
| GO:0007067 | 9e-04 | 2.0733 | 13.3056 | 26 | 413 | mitotic nuclear division |
| GO:0061346 | 0.001 | Inf | 0.0644 | 2 | 2 | planar cell polarity pathway involved in heart morphogenesis |
| GO:0033591 | 0.0011 | 22.6581 | 0.2255 | 3 | 7 | response to L-ascorbic acid |
| GO:0019068 | 0.0014 | 5.5153 | 1.2565 | 6 | 39 | virion assembly |
| GO:0045410 | 0.0016 | 18.1252 | 0.2577 | 3 | 8 | positive regulation of interleukin-6 biosynthetic process |
| GO:0002855 | 0.0024 | 15.1034 | 0.29 | 3 | 9 | regulation of natural killer cell mediated immune response to tumor cell |
| GO:0002860 | 0.0024 | 15.1034 | 0.29 | 3 | 9 | positive regulation of natural killer cell mediated cytotoxicity directed against tumor cell target |
| GO:0032729 | 0.0028 | 4.0865 | 1.9008 | 7 | 59 | positive regulation of interferon-gamma production |
| GO:0030887 | 0.003 | 60.3135 | 0.0967 | 2 | 3 | positive regulation of myeloid dendritic cell activation |
| GO:0070340 | 0.003 | 60.3135 | 0.0967 | 2 | 3 | detection of bacterial lipopeptide |
| GO:1902415 | 0.003 | 60.3135 | 0.0967 | 2 | 3 | regulation of mRNA binding |
| GO:2000502 | 0.003 | 60.3135 | 0.0967 | 2 | 3 | negative regulation of natural killer cell chemotaxis |
| GO:0051783 | 0.0033 | 2.5429 | 5.4447 | 13 | 169 | regulation of nuclear division |
| GO:1904903 | 0.0034 | 12.9449 | 0.3222 | 3 | 10 | ESCRT III complex disassembly |
| GO:0050999 | 0.0034 | 4.548 | 1.482 | 6 | 46 | regulation of nitric-oxide synthase activity |
| GO:0007080 | 0.0038 | 5.4078 | 1.0632 | 5 | 33 | mitotic metaphase plate congression |
| GO:0001840 | 0.0045 | 11.326 | 0.3544 | 3 | 11 | neural plate development |
| GO:0002839 | 0.0045 | 11.326 | 0.3544 | 3 | 11 | positive regulation of immune response to tumor cell |
| GO:0009414 | 0.0045 | 11.326 | 0.3544 | 3 | 11 | response to water deprivation |
| GO:0045835 | 0.0045 | 11.326 | 0.3544 | 3 | 11 | negative regulation of meiotic nuclear division |
| GO:0007018 | 0.0054 | 2.2969 | 6.4434 | 14 | 200 | microtubule-based movement |
| GO:0018198 | 0.0058 | 6.3665 | 0.741 | 4 | 23 | peptidyl-cysteine modification |
| GO:0072606 | 0.0058 | 6.3665 | 0.741 | 4 | 23 | interleukin-8 secretion |
| GO:0002834 | 0.0059 | 10.0669 | 0.3866 | 3 | 12 | regulation of response to tumor cell |
| GO:0040015 | 0.0059 | 10.0669 | 0.3866 | 3 | 12 | negative regulation of multicellular organism growth |
| GO:0018230 | 0.006 | 30.1548 | 0.1289 | 2 | 4 | peptidyl-L-cysteine S-palmitoylation |
| GO:0006900 | 0.0061 | 2.716 | 3.9305 | 10 | 122 | membrane budding |
| GO:0030301 | 0.0061 | 3.4815 | 2.1908 | 7 | 68 | cholesterol transport |
| GO:0006888 | 0.0063 | 2.4372 | 5.2192 | 12 | 162 | ER to Golgi vesicle-mediated transport |
| GO:0051301 | 0.0064 | 1.6688 | 20.0712 | 32 | 623 | cell division |
| GO:0008152 | 0.0068 | 1.2992 | 360.1215 | 385 | 11178 | metabolic process |
| GO:0070925 | 0.0069 | 1.7061 | 17.7838 | 29 | 552 | organelle assembly |
| GO:0003382 | 0.0069 | 3.8689 | 1.7075 | 6 | 53 | epithelial cell morphogenesis |
| GO:0007051 | 0.0076 | 2.6217 | 4.0593 | 10 | 126 | spindle organization |
| GO:0046907 | 0.0077 | 1.3843 | 57.8939 | 76 | 1797 | intracellular transport |
| GO:0051445 | 0.0088 | 4.3242 | 1.2887 | 5 | 40 | regulation of meiotic cell cycle |
| GO:0010875 | 0.0093 | 8.2355 | 0.451 | 3 | 14 | positive regulation of cholesterol efflux |
| GO:1903543 | 0.0093 | 8.2355 | 0.451 | 3 | 14 | positive regulation of exosomal secretion |
| GO:0002741 | 0.0097 | 20.1019 | 0.1611 | 2 | 5 | positive regulation of cytokine secretion involved in immune response |
| GO:0090110 | 0.0097 | 20.1019 | 0.1611 | 2 | 5 | cargo loading into COPII-coated vesicle |
| GO:0090611 | 0.0097 | 20.1019 | 0.1611 | 2 | 5 | ubiquitin-independent protein catabolic process via the multivesicular body sorting pathway |
| GO:2000002 | 0.0097 | 20.1019 | 0.1611 | 2 | 5 | negative regulation of DNA damage checkpoint |
| GO:0044093 | 0.0098 | 1.3761 | 55.7998 | 73 | 1732 | positive regulation of molecular function |
| GOMFID | Pvalue | OddsRatio | ExpCount | Count | Size | Term |
| GO:0044237 | 4e-04 | 1.3839 | 317.309 | 354 | 9677 | cellular metabolic process |
| GO:0006000 | 5e-04 | 14.8562 | 0.3935 | 4 | 12 | fructose metabolic process |
| GO:0051289 | 6e-04 | 4.6842 | 1.9346 | 8 | 59 | protein homotetramerization |
| GO:0044238 | 0.0013 | 1.3378 | 319.1124 | 352 | 9732 | primary metabolic process |
| GO:0032103 | 0.0014 | 2.2498 | 9.4435 | 20 | 288 | positive regulation of response to external stimulus |
| GO:0090407 | 0.0017 | 1.8363 | 18.3952 | 32 | 561 | organophosphate biosynthetic process |
| GO:0043589 | 0.0025 | 14.8291 | 0.2951 | 3 | 9 | skin morphogenesis |
| GO:0033036 | 0.0032 | 1.3659 | 87.0575 | 111 | 2655 | macromolecule localization |
| GO:0022618 | 0.0037 | 2.4117 | 6.1645 | 14 | 188 | ribonucleoprotein complex assembly |
| GO:0015031 | 0.0039 | 1.425 | 58.0055 | 78 | 1769 | protein transport |
| GO:0035194 | 0.0041 | 4.3557 | 1.5411 | 6 | 47 | posttranscriptional gene silencing by RNA |
| GO:0048745 | 0.0044 | 6.987 | 0.6886 | 4 | 21 | smooth muscle tissue development |
| GO:0006195 | 0.0046 | 4.2518 | 1.5739 | 6 | 48 | purine nucleotide catabolic process |
| GO:1901564 | 0.0049 | 1.3792 | 69.2525 | 90 | 2112 | organonitrogen compound metabolic process |
| GO:0080135 | 0.0051 | 1.6854 | 20.5266 | 33 | 626 | regulation of cellular response to stress |
| GO:0050728 | 0.0055 | 2.9514 | 3.279 | 9 | 100 | negative regulation of inflammatory response |
| GO:0001997 | 0.0062 | 29.6082 | 0.1312 | 2 | 4 | positive regulation of the force of heart contraction by epinephrine-norepinephrine |
| GO:0006041 | 0.0062 | 29.6082 | 0.1312 | 2 | 4 | glucosamine metabolic process |
| GO:0009794 | 0.0062 | 29.6082 | 0.1312 | 2 | 4 | regulation of mitotic cell cycle, embryonic |
| GO:0031146 | 0.0062 | 6.2507 | 0.7542 | 4 | 23 | SCF-dependent proteasomal ubiquitin-dependent protein catabolic process |
| GO:0002726 | 0.0062 | 9.8841 | 0.3935 | 3 | 12 | positive regulation of T cell cytokine production |
| GO:1901292 | 0.0067 | 2.8566 | 3.3774 | 9 | 103 | nucleoside phosphate catabolic process |
| GO:0001666 | 0.0074 | 1.9865 | 9.5091 | 18 | 290 | response to hypoxia |
| GO:0014051 | 0.0078 | 8.8951 | 0.4263 | 3 | 13 | gamma-aminobutyric acid secretion |
| GO:0072182 | 0.0078 | 8.8951 | 0.4263 | 3 | 13 | regulation of nephron tubule epithelial cell differentiation |
| GO:0006644 | 0.0082 | 1.8568 | 11.8372 | 21 | 361 | phospholipid metabolic process |
| GO:0071453 | 0.0083 | 2.4524 | 4.7546 | 11 | 145 | cellular response to oxygen levels |
| GO:0008089 | 0.0084 | 5.6546 | 0.8198 | 4 | 25 | anterograde axonal transport |
| GO:0070918 | 0.0084 | 5.6546 | 0.8198 | 4 | 25 | production of small RNA involved in gene silencing by RNA |
| GO:0072332 | 0.0085 | 3.2569 | 2.3281 | 7 | 71 | intrinsic apoptotic signaling pathway by p53 class mediator |
| GO:0072655 | 0.0091 | 2.3114 | 5.4815 | 12 | 168 | establishment of protein localization to mitochondrion |
| GO:0044712 | 0.0091 | 1.5025 | 31.3271 | 45 | 966 | single-organism catabolic process |
| GO:0030150 | 0.0097 | 8.0859 | 0.4591 | 3 | 14 | protein import into mitochondrial matrix |
| GO:0039531 | 0.0097 | 8.0859 | 0.4591 | 3 | 14 | regulation of viral-induced cytoplasmic pattern recognition receptor signaling pathway |
| GOMFID | Pvalue | OddsRatio | ExpCount | Count | Size | Term |
| GO:0001996 | 3e-04 | 43.8786 | 0.1662 | 3 | 5 | positive regulation of heart rate by epinephrine-norepinephrine |
| GO:1902017 | 0.0015 | 6.9831 | 0.8641 | 5 | 26 | regulation of cilium assembly |
| GO:0090102 | 0.0022 | 5.0329 | 1.3627 | 6 | 41 | cochlea development |
| GO:0001993 | 0.0026 | 14.6224 | 0.2991 | 3 | 9 | regulation of systemic arterial blood pressure by norepinephrine-epinephrine |
| GO:0046548 | 0.0026 | 14.6224 | 0.2991 | 3 | 9 | retinal rod cell development |
| GO:0060073 | 0.0026 | 14.6224 | 0.2991 | 3 | 9 | micturition |
| GO:0051028 | 0.0027 | 2.8968 | 4.088 | 11 | 123 | mRNA transport |
| GO:0060113 | 0.003 | 4.0332 | 1.9277 | 7 | 58 | inner ear receptor cell differentiation |
| GO:0006667 | 0.0032 | 58.3962 | 0.0997 | 2 | 3 | sphinganine metabolic process |
| GO:0032929 | 0.0032 | 58.3962 | 0.0997 | 2 | 3 | negative regulation of superoxide anion generation |
| GO:0050893 | 0.0032 | 58.3962 | 0.0997 | 2 | 3 | sensory processing |
| GO:1904705 | 0.0032 | 58.3962 | 0.0997 | 2 | 3 | regulation of vascular smooth muscle cell proliferation |
| GO:0032402 | 0.0038 | 7.3205 | 0.6647 | 4 | 20 | melanosome transport |
| GO:0051905 | 0.0046 | 6.8894 | 0.6979 | 4 | 21 | establishment of pigment granule localization |
| GO:0060271 | 0.0058 | 2.2054 | 7.1789 | 15 | 216 | cilium morphogenesis |
| GO:0001994 | 0.0063 | 29.1962 | 0.1329 | 2 | 4 | norepinephrine-epinephrine vasoconstriction involved in regulation of systemic arterial blood pressure |
| GO:0001997 | 0.0063 | 29.1962 | 0.1329 | 2 | 4 | positive regulation of the force of heart contraction by epinephrine-norepinephrine |
| GO:0045777 | 0.0072 | 4.5793 | 1.2297 | 5 | 37 | positive regulation of blood pressure |
| GO:0000398 | 0.0073 | 2.0357 | 8.7742 | 17 | 264 | mRNA splicing, via spliceosome |
| GO:0007605 | 0.0074 | 2.4928 | 4.6862 | 11 | 141 | sensory perception of sound |
| GO:0016024 | 0.0081 | 8.7711 | 0.4321 | 3 | 13 | CDP-diacylglycerol biosynthetic process |
| GO:0046541 | 0.0081 | 8.7711 | 0.4321 | 3 | 13 | saliva secretion |
| GO:0000375 | 0.0084 | 2.0028 | 8.9072 | 17 | 268 | RNA splicing, via transesterification reactions |
| GO:0006986 | 0.0096 | 2.2964 | 5.5171 | 12 | 166 | response to unfolded protein |
| GOMFID | Pvalue | OddsRatio | ExpCount | Count | Size | Term |
| GO:0090023 | 1e-04 | 9.3182 | 0.8277 | 6 | 25 | positive regulation of neutrophil chemotaxis |
| GO:0043312 | 3e-04 | 16.8095 | 0.3642 | 4 | 11 | neutrophil degranulation |
| GO:0051649 | 5e-04 | 1.4566 | 82.6385 | 111 | 2496 | establishment of localization in cell |
| GO:1902622 | 7e-04 | 6.5538 | 1.0926 | 6 | 33 | regulation of neutrophil migration |
| GO:0031098 | 8e-04 | 2.3609 | 9.0386 | 20 | 273 | stress-activated protein kinase signaling cascade |
| GO:1902582 | 0.001 | 1.5117 | 54.397 | 77 | 1643 | single-organism intracellular transport |
| GO:0007254 | 0.0011 | 2.6713 | 6.0257 | 15 | 182 | JNK cascade |
| GO:0042119 | 0.0012 | 7.3621 | 0.8277 | 5 | 25 | neutrophil activation |
| GO:0008037 | 0.0014 | 2.9909 | 4.3372 | 12 | 131 | cell recognition |
| GO:0015031 | 0.0016 | 1.714 | 25.3393 | 41 | 796 | protein transport |
| GO:0072610 | 0.0018 | 17.6182 | 0.2649 | 3 | 8 | interleukin-12 secretion |
| GO:2000665 | 0.0018 | 17.6182 | 0.2649 | 3 | 8 | regulation of interleukin-13 secretion |
| GO:0070727 | 0.0019 | 1.5054 | 48.6693 | 69 | 1470 | cellular macromolecule localization |
| GO:0071622 | 0.0019 | 5.2021 | 1.3243 | 6 | 40 | regulation of granulocyte chemotaxis |
| GO:0006886 | 0.0021 | 1.6113 | 32.1151 | 49 | 970 | intracellular protein transport |
| GO:0032303 | 0.0025 | 8.4009 | 0.596 | 4 | 18 | regulation of icosanoid secretion |
| GO:0061024 | 0.0025 | 1.5729 | 34.8962 | 52 | 1054 | membrane organization |
| GO:0071902 | 0.0027 | 2.1602 | 9.3035 | 19 | 281 | positive regulation of protein serine/threonine kinase activity |
| GO:0034138 | 0.0029 | 3.2844 | 2.9798 | 9 | 90 | toll-like receptor 3 signaling pathway |
| GO:0002444 | 0.003 | 3.5795 | 2.45 | 8 | 74 | myeloid leukocyte mediated immunity |
| GO:0070458 | 0.0032 | 58.6293 | 0.0993 | 2 | 3 | cellular detoxification of nitrogen compound |
| GO:2000547 | 0.0032 | 58.6293 | 0.0993 | 2 | 3 | regulation of dendritic cell dendrite assembly |
| GO:2000562 | 0.0032 | 58.6293 | 0.0993 | 2 | 3 | negative regulation of CD4-positive, alpha-beta T cell proliferation |
| GO:0016482 | 0.0032 | 1.5212 | 39.5314 | 57 | 1194 | cytoplasmic transport |
| GO:0072599 | 0.0035 | 2.958 | 3.6419 | 10 | 110 | establishment of protein localization to endoplasmic reticulum |
| GO:0097530 | 0.0035 | 2.958 | 3.6419 | 10 | 110 | granulocyte migration |
| GO:0006518 | 0.0037 | 1.6483 | 24.8644 | 39 | 751 | peptide metabolic process |
| GO:0050704 | 0.0037 | 5.4509 | 1.0595 | 5 | 32 | regulation of interleukin-1 secretion |
| GO:0006911 | 0.0043 | 5.2559 | 1.0926 | 5 | 33 | phagocytosis, engulfment |
| GO:0070423 | 0.0043 | 5.2559 | 1.0926 | 5 | 33 | nucleotide-binding oligomerization domain containing signaling pathway |
| GO:0008064 | 0.0044 | 2.5571 | 4.9994 | 12 | 151 | regulation of actin polymerization or depolymerization |
| GO:0010803 | 0.0048 | 4.209 | 1.5892 | 6 | 48 | regulation of tumor necrosis factor-mediated signaling pathway |
| GO:0032651 | 0.0048 | 4.209 | 1.5892 | 6 | 48 | regulation of interleukin-1 beta production |
| GO:0001771 | 0.0049 | 11.0092 | 0.3642 | 3 | 11 | immunological synapse formation |
| GO:0002690 | 0.0049 | 3.2799 | 2.6487 | 8 | 80 | positive regulation of leukocyte chemotaxis |
| GO:0000187 | 0.005 | 2.6466 | 4.4365 | 11 | 134 | activation of MAPK activity |
| GO:0016192 | 0.0055 | 1.4644 | 43.1071 | 60 | 1302 | vesicle-mediated transport |
| GO:0046638 | 0.0056 | 4.9049 | 1.1588 | 5 | 35 | positive regulation of alpha-beta T cell differentiation |
| GO:0043506 | 0.0057 | 3.1909 | 2.7149 | 8 | 82 | regulation of JUN kinase activity |
| GO:0050920 | 0.0061 | 2.3487 | 5.8602 | 13 | 177 | regulation of chemotaxis |
| GO:0050863 | 0.0062 | 2.0267 | 9.3366 | 18 | 282 | regulation of T cell activation |
| GO:0002408 | 0.0063 | 29.3127 | 0.1324 | 2 | 4 | myeloid dendritic cell chemotaxis |
| GO:0018916 | 0.0063 | 29.3127 | 0.1324 | 2 | 4 | nitrobenzene metabolic process |
| GO:0046021 | 0.0063 | 29.3127 | 0.1324 | 2 | 4 | regulation of transcription from RNA polymerase II promoter, mitotic |
| GO:0070086 | 0.0063 | 29.3127 | 0.1324 | 2 | 4 | ubiquitin-dependent endocytosis |
| GO:0097029 | 0.0063 | 29.3127 | 0.1324 | 2 | 4 | mature conventional dendritic cell differentiation |
| GO:0022607 | 0.0063 | 1.3492 | 77.0763 | 98 | 2328 | cellular component assembly |
| GO:0019082 | 0.0063 | 9.7853 | 0.3973 | 3 | 12 | viral protein processing |
| GO:0032308 | 0.0063 | 9.7853 | 0.3973 | 3 | 12 | positive regulation of prostaglandin secretion |
| GO:0050718 | 0.0064 | 6.1881 | 0.7615 | 4 | 23 | positive regulation of interleukin-1 beta secretion |
| GO:0006412 | 0.0064 | 1.6693 | 20.0637 | 32 | 606 | translation |
| GO:0006614 | 0.0067 | 2.8583 | 3.3771 | 9 | 102 | SRP-dependent cotranslational protein targeting to membrane |
| GO:0014070 | 0.0068 | 1.5309 | 30.7908 | 45 | 930 | response to organic cyclic compound |
| GO:0033875 | 0.0071 | 4.5977 | 1.225 | 5 | 37 | ribonucleoside bisphosphate metabolic process |
| GO:0034032 | 0.0071 | 4.5977 | 1.225 | 5 | 37 | purine nucleoside bisphosphate metabolic process |
| GO:0018196 | 0.0074 | 2.0827 | 8.0784 | 16 | 244 | peptidyl-asparagine modification |
| GO:0032786 | 0.0075 | 5.8783 | 0.7946 | 4 | 24 | positive regulation of DNA-templated transcription, elongation |
| GO:0046640 | 0.0075 | 5.8783 | 0.7946 | 4 | 24 | regulation of alpha-beta T cell proliferation |
| GO:0032602 | 0.0077 | 3.3286 | 2.2845 | 7 | 69 | chemokine production |
| GO:0099518 | 0.0079 | 4.4581 | 1.2581 | 5 | 38 | vesicle cytoskeletal trafficking |
| GO:0006612 | 0.008 | 2.2649 | 6.0588 | 13 | 183 | protein targeting to membrane |
| GO:0043084 | 0.0081 | 8.8062 | 0.4304 | 3 | 13 | penile erection |
| GO:0060544 | 0.0081 | 8.8062 | 0.4304 | 3 | 13 | regulation of necroptotic process |
| GO:0030838 | 0.0081 | 2.9879 | 2.8804 | 8 | 87 | positive regulation of actin filament polymerization |
| GO:0042346 | 0.0086 | 5.598 | 0.8277 | 4 | 25 | positive regulation of NF-kappaB import into nucleus |
| GO:0044249 | 0.0096 | 1.2427 | 191.0022 | 217 | 5769 | cellular biosynthetic process |
| GO:0032872 | 0.0099 | 2.1994 | 6.2244 | 13 | 188 | regulation of stress-activated MAPK cascade |
| GOMFID | Pvalue | OddsRatio | ExpCount | Count | Size | Term |
| GO:0070925 | 3e-04 | 2.0823 | 16.4131 | 32 | 552 | organelle assembly |
| GO:0006730 | 4e-04 | 7.0705 | 1.011 | 6 | 34 | one-carbon metabolic process |
| GO:0034551 | 5e-04 | 32.8362 | 0.1784 | 3 | 6 | mitochondrial respiratory chain complex III assembly |
| GO:0006271 | 7e-04 | 6.385 | 1.1002 | 6 | 37 | DNA strand elongation involved in DNA replication |
| GO:0031667 | 0.001 | 2.0086 | 14.7777 | 28 | 497 | response to nutrient levels |
| GO:0042273 | 0.0014 | 5.4964 | 1.2488 | 6 | 42 | ribosomal large subunit biogenesis |
| GO:0060271 | 0.0021 | 2.4828 | 6.4225 | 15 | 216 | cilium morphogenesis |
| GO:0006556 | 0.0026 | 65.5398 | 0.0892 | 2 | 3 | S-adenosylmethionine biosynthetic process |
| GO:0007097 | 0.0027 | 14.069 | 0.2973 | 3 | 10 | nuclear migration |
| GO:0006471 | 0.0031 | 7.7357 | 0.6244 | 4 | 21 | protein ADP-ribosylation |
| GO:0006259 | 0.0043 | 1.6028 | 27.5633 | 42 | 927 | DNA metabolic process |
| GO:0017004 | 0.0044 | 6.9205 | 0.6839 | 4 | 23 | cytochrome complex assembly |
| GO:1901566 | 0.0047 | 1.4987 | 39.4271 | 56 | 1326 | organonitrogen compound biosynthetic process |
| GO:0036158 | 0.0047 | 10.9411 | 0.3568 | 3 | 12 | outer dynein arm assembly |
| GO:0033683 | 0.0051 | 4.9869 | 1.1299 | 5 | 38 | nucleotide-excision repair, DNA incision |
| GO:0045213 | 0.0051 | 32.7677 | 0.1189 | 2 | 4 | neurotransmitter receptor metabolic process |
| GO:2000574 | 0.0051 | 32.7677 | 0.1189 | 2 | 4 | regulation of microtubule motor activity |
| GO:0006024 | 0.0052 | 2.9749 | 3.241 | 9 | 109 | glycosaminoglycan biosynthetic process |
| GO:0007005 | 0.0056 | 1.6607 | 21.4678 | 34 | 722 | mitochondrion organization |
| GO:0043388 | 0.0057 | 4.8399 | 1.1596 | 5 | 39 | positive regulation of DNA binding |
| GO:0051412 | 0.0059 | 6.2606 | 0.7433 | 4 | 25 | response to corticosterone |
| GO:0001824 | 0.0064 | 3.4459 | 2.2003 | 7 | 74 | blastocyst development |
| GO:0030166 | 0.0067 | 3.876 | 1.6948 | 6 | 57 | proteoglycan biosynthetic process |
| GO:0035058 | 0.0069 | 5.9757 | 0.7731 | 4 | 26 | nonmotile primary cilium assembly |
| GO:0034645 | 0.0071 | 1.2819 | 141.2358 | 166 | 4750 | cellular macromolecule biosynthetic process |
| GO:0014074 | 0.0073 | 2.4937 | 4.6682 | 11 | 157 | response to purine-containing compound |
| GO:0060973 | 0.0074 | 8.9506 | 0.4163 | 3 | 14 | cell migration involved in heart development |
| GO:0044782 | 0.0075 | 2.2801 | 6.0062 | 13 | 202 | cilium organization |
| GO:0016236 | 0.0076 | 1.9401 | 10.2582 | 19 | 345 | macroautophagy |
| GO:0009100 | 0.008 | 1.7379 | 15.64 | 26 | 526 | glycoprotein metabolic process |
| GO:0006526 | 0.0083 | 21.8437 | 0.1487 | 2 | 5 | arginine biosynthetic process |
| GO:0051461 | 0.0083 | 21.8437 | 0.1487 | 2 | 5 | positive regulation of corticotropin secretion |
| GO:0070911 | 0.0086 | 3.6599 | 1.784 | 6 | 60 | global genome nucleotide-excision repair |
| GO:0006575 | 0.0088 | 1.9893 | 8.9499 | 17 | 301 | cellular modified amino acid metabolic process |
| GO:0001833 | 0.0091 | 8.2042 | 0.446 | 3 | 15 | inner cell mass cell proliferation |
| GO:0010592 | 0.0091 | 8.2042 | 0.446 | 3 | 15 | positive regulation of lamellipodium assembly |
| GO:0042754 | 0.0091 | 8.2042 | 0.446 | 3 | 15 | negative regulation of circadian rhythm |
| GO:0035082 | 0.0095 | 4.218 | 1.3083 | 5 | 44 | axoneme assembly |
| GOMFID | Pvalue | OddsRatio | ExpCount | Count | Size | Term |
| GO:0008637 | 3e-04 | 3.7954 | 3.1804 | 11 | 112 | apoptotic mitochondrial changes |
| GO:0034470 | 7e-04 | 2.3899 | 8.9166 | 20 | 314 | ncRNA processing |
| GO:0002731 | 8e-04 | Inf | 0.0568 | 2 | 2 | negative regulation of dendritic cell cytokine production |
| GO:0090201 | 9e-04 | 11.4992 | 0.4543 | 4 | 16 | negative regulation of release of cytochrome c from mitochondria |
| GO:0034605 | 0.001 | 3.5485 | 3.0669 | 10 | 108 | cellular response to heat |
| GO:1901687 | 0.0017 | 6.6431 | 0.8803 | 5 | 31 | glutathione derivative biosynthetic process |
| GO:0000154 | 0.0018 | 9.1976 | 0.5395 | 4 | 19 | rRNA modification |
| GO:0035455 | 0.0018 | 9.1976 | 0.5395 | 4 | 19 | response to interferon-alpha |
| GO:0034612 | 0.002 | 2.3318 | 7.7239 | 17 | 272 | response to tumor necrosis factor |
| GO:0042178 | 0.0024 | 14.7562 | 0.284 | 3 | 10 | xenobiotic catabolic process |
| GO:0070886 | 0.0024 | 14.7562 | 0.284 | 3 | 10 | positive regulation of calcineurin-NFAT signaling cascade |
| GO:0009397 | 0.0024 | 68.7342 | 0.0852 | 2 | 3 | folic acid-containing compound catabolic process |
| GO:0070458 | 0.0024 | 68.7342 | 0.0852 | 2 | 3 | cellular detoxification of nitrogen compound |
| GO:0019221 | 0.0029 | 1.8289 | 16.6973 | 29 | 588 | cytokine-mediated signaling pathway |
| GO:0009143 | 0.0032 | 12.9108 | 0.3124 | 3 | 11 | nucleoside triphosphate catabolic process |
| GO:0006749 | 0.0038 | 4.4138 | 1.505 | 6 | 53 | glutathione metabolic process |
| GO:2001237 | 0.0038 | 3.4227 | 2.5273 | 8 | 89 | negative regulation of extrinsic apoptotic signaling pathway |
| GO:0009266 | 0.0042 | 2.3683 | 6.2473 | 14 | 220 | response to temperature stimulus |
| GO:0016072 | 0.0043 | 2.6922 | 4.3447 | 11 | 153 | rRNA metabolic process |
| GO:0002408 | 0.0046 | 34.3649 | 0.1136 | 2 | 4 | myeloid dendritic cell chemotaxis |
| GO:0018916 | 0.0046 | 34.3649 | 0.1136 | 2 | 4 | nitrobenzene metabolic process |
| GO:0060283 | 0.0046 | 34.3649 | 0.1136 | 2 | 4 | negative regulation of oocyte development |
| GO:0030595 | 0.0047 | 2.5295 | 5.0262 | 12 | 177 | leukocyte chemotaxis |
| GO:0042346 | 0.0051 | 6.5671 | 0.7099 | 4 | 25 | positive regulation of NF-kappaB import into nucleus |
| GO:0016558 | 0.0053 | 10.3273 | 0.3692 | 3 | 13 | protein import into peroxisome matrix |
| GO:1901564 | 0.0058 | 1.4005 | 59.974 | 79 | 2112 | organonitrogen compound metabolic process |
| GO:0006376 | 0.0058 | 6.2682 | 0.7383 | 4 | 26 | mRNA splice site selection |
| GO:0001911 | 0.0066 | 9.3879 | 0.3976 | 3 | 14 | negative regulation of leukocyte mediated cytotoxicity |
| GO:0052548 | 0.0069 | 1.9585 | 10.1661 | 19 | 358 | regulation of endopeptidase activity |
| GO:0050798 | 0.0072 | 4.5417 | 1.2211 | 5 | 43 | activated T cell proliferation |
| GO:0098754 | 0.0076 | 3.3173 | 2.2717 | 7 | 80 | detoxification |
| GO:0006771 | 0.0076 | 22.9084 | 0.142 | 2 | 5 | riboflavin metabolic process |
| GO:0010032 | 0.0076 | 22.9084 | 0.142 | 2 | 5 | meiotic chromosome condensation |
| GO:0048554 | 0.0076 | 22.9084 | 0.142 | 2 | 5 | positive regulation of metalloenzyme activity |
| GO:0070475 | 0.0076 | 22.9084 | 0.142 | 2 | 5 | rRNA base methylation |
| GO:0036037 | 0.008 | 8.605 | 0.426 | 3 | 15 | CD8-positive, alpha-beta T cell activation |
| GO:0043649 | 0.008 | 8.605 | 0.426 | 3 | 15 | dicarboxylic acid catabolic process |
| GO:0010827 | 0.008 | 2.9787 | 2.8681 | 8 | 101 | regulation of glucose transport |
| GO:0051701 | 0.0082 | 2.3428 | 5.3954 | 12 | 190 | interaction with host |
| GO:0051081 | 0.0087 | 4.3141 | 1.2779 | 5 | 45 | nuclear envelope disassembly |
| GO:2001267 | 0.0087 | 5.5149 | 0.8235 | 4 | 29 | regulation of cysteine-type endopeptidase activity involved in apoptotic signaling pathway |
| GO:0006921 | 0.0088 | 3.6371 | 1.789 | 6 | 63 | cellular component disassembly involved in execution phase of apoptosis |
| GO:0046677 | 0.0095 | 4.2086 | 1.3063 | 5 | 46 | response to antibiotic |
| GO:0065002 | 0.0095 | 4.2086 | 1.3063 | 5 | 46 | intracellular protein transmembrane transport |
| GO:0031998 | 0.0097 | 7.9425 | 0.4543 | 3 | 16 | regulation of fatty acid beta-oxidation |
| GO:0070125 | 0.0098 | 3.1441 | 2.3853 | 7 | 84 | mitochondrial translational elongation |
| GOMFID | Pvalue | OddsRatio | ExpCount | Count | Size | Term |
| GO:0006600 | 3e-04 | 17.8537 | 0.3623 | 4 | 10 | creatine metabolic process |
| GO:0006303 | 5e-04 | 4.3281 | 2.3548 | 9 | 65 | double-strand break repair via nonhomologous end joining |
| GO:0006338 | 6e-04 | 3.0052 | 5.0719 | 14 | 140 | chromatin remodeling |
| GO:0014736 | 0.0013 | Inf | 0.0725 | 2 | 2 | negative regulation of muscle atrophy |
| GO:0006974 | 0.0017 | 1.6709 | 27.787 | 44 | 767 | cellular response to DNA damage stimulus |
| GO:0034508 | 0.0018 | 4.4766 | 1.7752 | 7 | 49 | centromere complex assembly |
| GO:0019932 | 0.0019 | 2.2889 | 8.3687 | 18 | 231 | second-messenger-mediated signaling |
| GO:0075713 | 0.0023 | 16.041 | 0.2898 | 3 | 8 | establishment of integrated proviral latency |
| GO:1901841 | 0.0023 | 16.041 | 0.2898 | 3 | 8 | regulation of high voltage-gated calcium channel activity |
| GO:1904322 | 0.0023 | 16.041 | 0.2898 | 3 | 8 | cellular response to forskolin |
| GO:0061182 | 0.0038 | 53.3898 | 0.1087 | 2 | 3 | negative regulation of chondrocyte development |
| GO:0071285 | 0.0043 | 7.1372 | 0.6883 | 4 | 19 | cellular response to lithium ion |
| GO:0009185 | 0.0045 | 3.0633 | 3.1881 | 9 | 88 | ribonucleoside diphosphate metabolic process |
| GO:0010226 | 0.0046 | 11.5264 | 0.3602 | 3 | 10 | response to lithium ion |
| GO:0019042 | 0.0047 | 11.4563 | 0.3623 | 3 | 10 | viral latency |
| GO:2000345 | 0.0047 | 11.4563 | 0.3623 | 3 | 10 | regulation of hepatocyte proliferation |
| GO:0048661 | 0.0048 | 3.6844 | 2.1012 | 7 | 58 | positive regulation of smooth muscle cell proliferation |
| GO:0031570 | 0.0055 | 2.3843 | 5.7965 | 13 | 160 | DNA integrity checkpoint |
| GO:0071822 | 0.0056 | 1.3818 | 64.1239 | 84 | 1770 | protein complex subunit organization |
| GO:0034501 | 0.0063 | 10.0236 | 0.3985 | 3 | 11 | protein localization to kinetochore |
| GO:0031572 | 0.0063 | 4.7838 | 1.1955 | 5 | 33 | G2 DNA damage checkpoint |
| GO:0003091 | 0.0072 | 4.6185 | 1.2318 | 5 | 34 | renal water homeostasis |
| GO:2001259 | 0.0072 | 4.6185 | 1.2318 | 5 | 34 | positive regulation of cation channel activity |
| GO:0048488 | 0.0074 | 5.9465 | 0.797 | 4 | 22 | synaptic vesicle endocytosis |
| GO:0032484 | 0.0075 | 26.6931 | 0.1449 | 2 | 4 | Ral protein signal transduction |
| GO:0034626 | 0.0075 | 26.6931 | 0.1449 | 2 | 4 | fatty acid elongation, polyunsaturated fatty acid |
| GO:0035522 | 0.0075 | 26.6931 | 0.1449 | 2 | 4 | monoubiquitinated histone H2A deubiquitination |
| GO:0051031 | 0.0075 | 26.6931 | 0.1449 | 2 | 4 | tRNA transport |
| GO:0061051 | 0.0075 | 26.6931 | 0.1449 | 2 | 4 | positive regulation of cell growth involved in cardiac muscle cell development |
| GO:1900158 | 0.0075 | 26.6931 | 0.1449 | 2 | 4 | negative regulation of bone mineralization involved in bone maturation |
| GO:1903553 | 0.0075 | 26.6931 | 0.1449 | 2 | 4 | positive regulation of extracellular exosome assembly |
| GO:0030104 | 0.0075 | 3.3543 | 2.2824 | 7 | 63 | water homeostasis |
| GO:0036109 | 0.0081 | 8.9093 | 0.4347 | 3 | 12 | alpha-linolenic acid metabolic process |
| GO:0043525 | 0.009 | 3.6557 | 1.8114 | 6 | 50 | positive regulation of neuron apoptotic process |
| GO:0043486 | 0.0099 | 3.5742 | 1.8476 | 6 | 51 | histone exchange |
| GOMFID | Pvalue | OddsRatio | ExpCount | Count | Size | Term |
| GO:0034626 | 1e-04 | 88.6459 | 0.1317 | 3 | 4 | fatty acid elongation, polyunsaturated fatty acid |
| GO:0033365 | 3e-04 | 1.8106 | 27.7164 | 47 | 842 | protein localization to organelle |
| GO:0009142 | 3e-04 | 4.6219 | 2.2055 | 9 | 67 | nucleoside triphosphate biosynthetic process |
| GO:0051383 | 9e-04 | 11.8355 | 0.4608 | 4 | 14 | kinetochore organization |
| GO:0051654 | 0.0012 | 10.7588 | 0.4938 | 4 | 15 | establishment of mitochondrion localization |
| GO:0010970 | 0.0012 | 3.4638 | 3.1601 | 10 | 96 | establishment of localization by movement along microtubule |
| GO:0051301 | 0.0015 | 1.8031 | 20.5075 | 35 | 623 | cell division |
| GO:0008104 | 0.0023 | 1.4032 | 76.2695 | 100 | 2317 | protein localization |
| GO:0070727 | 0.0025 | 1.4893 | 48.3885 | 68 | 1470 | cellular macromolecule localization |
| GO:0007017 | 0.0025 | 1.7899 | 18.8287 | 32 | 572 | microtubule-based process |
| GO:0070925 | 0.0027 | 1.7958 | 18.1704 | 31 | 552 | organelle assembly |
| GO:0014858 | 0.0032 | 58.9825 | 0.0988 | 2 | 3 | positive regulation of skeletal muscle cell proliferation |
| GO:0034625 | 0.0032 | 58.9825 | 0.0988 | 2 | 3 | fatty acid elongation, monounsaturated fatty acid |
| GO:0044339 | 0.0032 | 58.9825 | 0.0988 | 2 | 3 | canonical Wnt signaling pathway involved in osteoblast differentiation |
| GO:0045875 | 0.0032 | 58.9825 | 0.0988 | 2 | 3 | negative regulation of sister chromatid cohesion |
| GO:1901315 | 0.0032 | 58.9825 | 0.0988 | 2 | 3 | negative regulation of histone H2A K63-linked ubiquitination |
| GO:0007088 | 0.0032 | 2.6697 | 4.8059 | 12 | 146 | regulation of mitotic nuclear division |
| GO:0010948 | 0.0036 | 2.2016 | 8.1635 | 17 | 248 | negative regulation of cell cycle process |
| GO:0051650 | 0.0043 | 2.2857 | 6.9456 | 15 | 211 | establishment of vesicle localization |
| GO:0030705 | 0.0047 | 2.8335 | 3.7855 | 10 | 115 | cytoskeleton-dependent intracellular transport |
| GO:2001259 | 0.0048 | 5.1051 | 1.1192 | 5 | 34 | positive regulation of cation channel activity |
| GO:0009396 | 0.0048 | 11.0756 | 0.3621 | 3 | 11 | folic acid-containing compound biosynthetic process |
| GO:0042761 | 0.0048 | 11.0756 | 0.3621 | 3 | 11 | very long-chain fatty acid biosynthetic process |
| GO:0009168 | 0.0049 | 3.6438 | 2.1067 | 7 | 64 | purine ribonucleoside monophosphate biosynthetic process |
| GO:0051188 | 0.005 | 2.518 | 5.0693 | 12 | 154 | cofactor biosynthetic process |
| GO:0034508 | 0.0052 | 4.1358 | 1.613 | 6 | 49 | centromere complex assembly |
| GO:0006807 | 0.0053 | 1.2637 | 211.2636 | 240 | 6418 | nitrogen compound metabolic process |
| GO:0071731 | 0.0053 | 6.5718 | 0.7242 | 4 | 22 | response to nitric oxide |
| GO:0009206 | 0.0058 | 4.0415 | 1.6459 | 6 | 50 | purine ribonucleoside triphosphate biosynthetic process |
| GO:0009199 | 0.0058 | 2.2059 | 7.176 | 15 | 218 | ribonucleoside triphosphate metabolic process |
| GO:0009124 | 0.0059 | 3.1673 | 2.7321 | 8 | 83 | nucleoside monophosphate biosynthetic process |
| GO:0097190 | 0.0062 | 1.6739 | 20.0138 | 32 | 608 | apoptotic signaling pathway |
| GO:0003150 | 0.0062 | 29.4893 | 0.1317 | 2 | 4 | muscular septum morphogenesis |
| GO:0009181 | 0.0062 | 29.4893 | 0.1317 | 2 | 4 | purine ribonucleoside diphosphate catabolic process |
| GO:1902915 | 0.0062 | 29.4893 | 0.1317 | 2 | 4 | negative regulation of protein polyubiquitination |
| GO:1903553 | 0.0062 | 29.4893 | 0.1317 | 2 | 4 | positive regulation of extracellular exosome assembly |
| GO:0030497 | 0.0062 | 9.8444 | 0.395 | 3 | 12 | fatty acid elongation |
| GO:0036109 | 0.0062 | 9.8444 | 0.395 | 3 | 12 | alpha-linolenic acid metabolic process |
| GO:1990138 | 0.0063 | 2.5579 | 4.5755 | 11 | 139 | neuron projection extension |
| GO:0009161 | 0.0063 | 2.124 | 7.9331 | 16 | 241 | ribonucleoside monophosphate metabolic process |
| GO:0008156 | 0.0063 | 3.9515 | 1.6788 | 6 | 51 | negative regulation of DNA replication |
| GO:0044085 | 0.0067 | 1.3359 | 82.7213 | 104 | 2513 | cellular component biogenesis |
| GO:0044782 | 0.0071 | 2.2209 | 6.6493 | 14 | 202 | cilium organization |
| GO:0006139 | 0.0073 | 1.2587 | 174.462 | 201 | 5300 | nucleobase-containing compound metabolic process |
| GO:0030516 | 0.0073 | 3.0449 | 2.8309 | 8 | 86 | regulation of axon extension |
| GO:0022900 | 0.0074 | 2.6315 | 4.0488 | 10 | 123 | electron transport chain |
| GO:0043651 | 0.0079 | 8.8593 | 0.4279 | 3 | 13 | linoleic acid metabolic process |
| GO:0047497 | 0.0079 | 8.8593 | 0.4279 | 3 | 13 | mitochondrion transport along microtubule |
| GO:0051726 | 0.0079 | 1.5022 | 32.7528 | 47 | 995 | regulation of cell cycle |
| GO:0008089 | 0.0085 | 5.6319 | 0.8229 | 4 | 25 | anterograde axonal transport |
| GO:0016050 | 0.0085 | 1.9992 | 8.9206 | 17 | 271 | vesicle organization |
| GO:0007420 | 0.0087 | 1.6055 | 22.1205 | 34 | 672 | brain development |
| GO:0045333 | 0.0087 | 2.2388 | 6.1226 | 13 | 186 | cellular respiration |
| GO:0043044 | 0.0087 | 3.2437 | 2.3371 | 7 | 71 | ATP-dependent chromatin remodeling |
| GO:0051784 | 0.0087 | 3.2437 | 2.3371 | 7 | 71 | negative regulation of nuclear division |
| GO:0009132 | 0.0088 | 2.7282 | 3.5222 | 9 | 107 | nucleoside diphosphate metabolic process |
| GO:0009126 | 0.0097 | 2.0713 | 7.6039 | 15 | 231 | purine nucleoside monophosphate metabolic process |
| GO:0051640 | 0.0097 | 1.7504 | 14.3191 | 24 | 435 | organelle localization |
| GO:0071168 | 0.0098 | 8.0534 | 0.4608 | 3 | 14 | protein localization to chromatin |
| GO:1903427 | 0.0098 | 8.0534 | 0.4608 | 3 | 14 | negative regulation of reactive oxygen species biosynthetic process |
| GO:1903543 | 0.0098 | 8.0534 | 0.4608 | 3 | 14 | positive regulation of exosomal secretion |
| GOMFID | Pvalue | OddsRatio | ExpCount | Count | Size | Term |
| GO:1903044 | 1e-04 | 21.9827 | 0.2967 | 4 | 10 | protein localization to membrane raft |
| GO:2001238 | 2e-04 | 5.8981 | 1.5725 | 8 | 53 | positive regulation of extrinsic apoptotic signaling pathway |
| GO:0048002 | 0.0012 | 2.7457 | 5.4593 | 14 | 184 | antigen processing and presentation of peptide antigen |
| GO:0032594 | 0.0013 | 19.743 | 0.2374 | 3 | 8 | protein transport within lipid bilayer |
| GO:0021762 | 0.0014 | 5.5087 | 1.2461 | 6 | 42 | substantia nigra development |
| GO:0033555 | 0.0022 | 3.7854 | 2.3143 | 8 | 78 | multicellular organismal response to stress |
| GO:0045216 | 0.0025 | 2.4273 | 6.5571 | 15 | 221 | cell-cell junction organization |
| GO:0032377 | 0.0026 | 65.6853 | 0.089 | 2 | 3 | regulation of intracellular lipid transport |
| GO:0032383 | 0.0026 | 65.6853 | 0.089 | 2 | 3 | regulation of intracellular cholesterol transport |
| GO:0044861 | 0.0026 | 65.6853 | 0.089 | 2 | 3 | protein transport into plasma membrane raft |
| GO:0060800 | 0.0026 | 65.6853 | 0.089 | 2 | 3 | regulation of cell differentiation involved in embryonic placenta development |
| GO:0098909 | 0.0026 | 65.6853 | 0.089 | 2 | 3 | regulation of cardiac muscle cell action potential involved in regulation of contraction |
| GO:0001765 | 0.0027 | 14.1003 | 0.2967 | 3 | 10 | membrane raft assembly |
| GO:0060546 | 0.0027 | 14.1003 | 0.2967 | 3 | 10 | negative regulation of necroptotic process |
| GO:0051591 | 0.0029 | 3.2785 | 2.967 | 9 | 100 | response to cAMP |
| GO:0034329 | 0.003 | 2.3804 | 6.6758 | 15 | 225 | cell junction assembly |
| GO:0043065 | 0.0033 | 1.81 | 16.8527 | 29 | 568 | positive regulation of apoptotic process |
| GO:0043268 | 0.0035 | 5.4989 | 1.0385 | 5 | 35 | positive regulation of potassium ion transport |
| GO:0006047 | 0.0036 | 12.3369 | 0.3264 | 3 | 11 | UDP-N-acetylglucosamine metabolic process |
| GO:0071218 | 0.0036 | 12.3369 | 0.3264 | 3 | 11 | cellular response to misfolded protein |
| GO:0010942 | 0.0042 | 1.7581 | 17.9208 | 30 | 604 | positive regulation of cell death |
| GO:0043067 | 0.0045 | 1.4879 | 41.8943 | 59 | 1412 | regulation of programmed cell death |
| GO:0002125 | 0.0051 | 32.8405 | 0.1187 | 2 | 4 | maternal aggressive behavior |
| GO:0002906 | 0.0051 | 32.8405 | 0.1187 | 2 | 4 | negative regulation of mature B cell apoptotic process |
| GO:0070836 | 0.0051 | 32.8405 | 0.1187 | 2 | 4 | caveola assembly |
| GO:1901624 | 0.0051 | 32.8405 | 0.1187 | 2 | 4 | negative regulation of lymphocyte chemotaxis |
| GO:1903525 | 0.0051 | 32.8405 | 0.1187 | 2 | 4 | regulation of membrane tubulation |
| GO:0003158 | 0.0051 | 2.9816 | 3.2341 | 9 | 109 | endothelium development |
| GO:0070830 | 0.0056 | 4.0437 | 1.6319 | 6 | 55 | bicellular tight junction assembly |
| GO:0001960 | 0.0056 | 4.8507 | 1.1571 | 5 | 39 | negative regulation of cytokine-mediated signaling pathway |
| GO:0016568 | 0.0057 | 1.7503 | 16.7637 | 28 | 565 | chromatin modification |
| GO:0016043 | 0.0068 | 1.2722 | 172.9475 | 199 | 5829 | cellular component organization |
| GO:1901016 | 0.007 | 4.5806 | 1.2165 | 5 | 41 | regulation of potassium ion transmembrane transporter activity |
| GO:0007166 | 0.008 | 1.3363 | 79.7238 | 100 | 2687 | cell surface receptor signaling pathway |
| GO:0031033 | 0.0083 | 21.8922 | 0.1484 | 2 | 5 | myosin filament organization |
| GO:0044857 | 0.0083 | 21.8922 | 0.1484 | 2 | 5 | plasma membrane raft organization |
| GO:2000146 | 0.0083 | 2.2492 | 6.0824 | 13 | 205 | negative regulation of cell motility |
| GO:0023051 | 0.0084 | 1.3244 | 85.3908 | 106 | 2878 | regulation of signaling |
| GO:0006515 | 0.0091 | 8.2225 | 0.4451 | 3 | 15 | misfolded or incompletely synthesized protein catabolic process |
| GO:0019218 | 0.0095 | 3.1686 | 2.3736 | 7 | 80 | regulation of steroid metabolic process |
| GO:0010646 | 0.01 | 1.3145 | 85.8952 | 106 | 2895 | regulation of cell communication |
| GO:0007585 | 0.01 | 3.5366 | 1.8396 | 6 | 62 | respiratory gaseous exchange |
| GO:0050805 | 0.01 | 3.5366 | 1.8396 | 6 | 62 | negative regulation of synaptic transmission |
| GOMFID | Pvalue | OddsRatio | ExpCount | Count | Size | Term |
| GO:0007005 | 6e-04 | 1.743 | 27.9955 | 46 | 722 | mitochondrion organization |
| GO:0006207 | 0.0011 | 24.9076 | 0.2326 | 3 | 6 | 'de novo' pyrimidine nucleobase biosynthetic process |
| GO:0097359 | 0.0015 | Inf | 0.0775 | 2 | 2 | UDP-glucosylation |
| GO:1903796 | 0.0015 | Inf | 0.0775 | 2 | 2 | negative regulation of inorganic anion transmembrane transport |
| GO:0043043 | 0.0016 | 1.7224 | 24.5058 | 40 | 632 | peptide biosynthetic process |
| GO:0034660 | 0.0021 | 1.8338 | 17.8365 | 31 | 460 | ncRNA metabolic process |
| GO:0006413 | 0.0024 | 2.1382 | 9.9264 | 20 | 256 | translational initiation |
| GO:0034637 | 0.0024 | 3.4161 | 2.9081 | 9 | 75 | cellular carbohydrate biosynthetic process |
| GO:0044260 | 0.0025 | 1.2674 | 309.5407 | 344 | 7983 | cellular macromolecule metabolic process |
| GO:0008033 | 0.0028 | 2.6126 | 5.3509 | 13 | 138 | tRNA processing |
| GO:0051488 | 0.0028 | 14.9426 | 0.3102 | 3 | 8 | activation of anaphase-promoting complex activity |
| GO:0043603 | 0.0035 | 1.5417 | 35.4403 | 52 | 914 | cellular amide metabolic process |
| GO:0009057 | 0.004 | 1.4816 | 43.2729 | 61 | 1116 | macromolecule catabolic process |
| GO:0006396 | 0.0042 | 1.5771 | 29.9343 | 45 | 772 | RNA processing |
| GO:0044205 | 0.0044 | 49.7397 | 0.1163 | 2 | 3 | 'de novo' UMP biosynthetic process |
| GO:0006694 | 0.0053 | 2.3995 | 5.7775 | 13 | 149 | steroid biosynthetic process |
| GO:0009451 | 0.0054 | 2.6264 | 4.4979 | 11 | 116 | RNA modification |
| GO:0036258 | 0.0055 | 4.9907 | 1.1632 | 5 | 30 | multivesicular body assembly |
| GO:0060999 | 0.0055 | 4.9907 | 1.1632 | 5 | 30 | positive regulation of dendritic spine development |
| GO:0022618 | 0.0066 | 2.1784 | 7.2897 | 15 | 188 | ribonucleoprotein complex assembly |
| GO:0070534 | 0.0067 | 3.9432 | 1.7061 | 6 | 44 | protein K63-linked ubiquitination |
| GO:0033554 | 0.0067 | 1.3501 | 72.548 | 93 | 1871 | cellular response to stress |
| GO:0000271 | 0.0072 | 3.0784 | 2.8306 | 8 | 73 | polysaccharide biosynthetic process |
| GO:0010939 | 0.0073 | 4.6204 | 1.2408 | 5 | 32 | regulation of necrotic cell death |
| GO:0015937 | 0.0076 | 9.3373 | 0.4265 | 3 | 11 | coenzyme A biosynthetic process |
| GO:0032465 | 0.0083 | 3.3006 | 2.3265 | 7 | 60 | regulation of cytokinesis |
| GO:0000056 | 0.0085 | 24.8682 | 0.1551 | 2 | 4 | ribosomal small subunit export from nucleus |
| GO:0003104 | 0.0085 | 24.8682 | 0.1551 | 2 | 4 | positive regulation of glomerular filtration |
| GO:0035696 | 0.0085 | 24.8682 | 0.1551 | 2 | 4 | monocyte extravasation |
| GO:0061051 | 0.0085 | 24.8682 | 0.1551 | 2 | 4 | positive regulation of cell growth involved in cardiac muscle cell development |
| GO:1903553 | 0.0085 | 24.8682 | 0.1551 | 2 | 4 | positive regulation of extracellular exosome assembly |
| GO:0044248 | 0.0091 | 1.3541 | 63.5134 | 82 | 1638 | cellular catabolic process |
| GO:0006695 | 0.0092 | 3.6539 | 1.8224 | 6 | 47 | cholesterol biosynthetic process |
| GO:0010976 | 0.0093 | 2.0303 | 8.2978 | 16 | 214 | positive regulation of neuron projection development |
| GO:0090335 | 0.0098 | 8.2992 | 0.4653 | 3 | 12 | regulation of brown fat cell differentiation |
| GOMFID | Pvalue | OddsRatio | ExpCount | Count | Size | Term |
| GO:0016339 | 1e-04 | 8.8009 | 1.0229 | 7 | 29 | calcium-dependent cell-cell adhesion via plasma membrane cell adhesion molecules |
| GO:0060491 | 6e-04 | 3.1147 | 4.5502 | 13 | 129 | regulation of cell projection assembly |
| GO:0032438 | 7e-04 | 8.6157 | 0.7407 | 5 | 21 | melanosome organization |
| GO:0015031 | 8e-04 | 1.4919 | 62.3982 | 87 | 1769 | protein transport |
| GO:0002314 | 0.0012 | Inf | 0.0705 | 2 | 2 | germinal center B cell differentiation |
| GO:0046638 | 0.0013 | 5.7097 | 1.2346 | 6 | 35 | positive regulation of alpha-beta T cell differentiation |
| GO:0034628 | 0.0036 | 54.8949 | 0.1058 | 2 | 3 | 'de novo' NAD biosynthetic process from aspartate |
| GO:0046337 | 0.0039 | 7.3392 | 0.6702 | 4 | 19 | phosphatidylethanolamine metabolic process |
| GO:0000302 | 0.0042 | 2.2233 | 7.619 | 16 | 216 | response to reactive oxygen species |
| GO:1902692 | 0.0043 | 5.2984 | 1.0935 | 5 | 31 | regulation of neuroblast proliferation |
| GO:0016264 | 0.0044 | 11.7799 | 0.3527 | 3 | 10 | gap junction assembly |
| GO:0086014 | 0.0044 | 11.7799 | 0.3527 | 3 | 10 | atrial cardiac muscle cell action potential |
| GO:0086066 | 0.0044 | 11.7799 | 0.3527 | 3 | 10 | atrial cardiac muscle cell to AV node cell communication |
| GO:0090407 | 0.0053 | 1.6946 | 19.7882 | 32 | 561 | organophosphate biosynthetic process |
| GO:0033059 | 0.0053 | 4.1365 | 1.6226 | 6 | 46 | cellular pigmentation |
| GO:1900037 | 0.0058 | 10.3067 | 0.388 | 3 | 11 | regulation of cellular response to hypoxia |
| GO:0006767 | 0.0059 | 2.9272 | 3.3157 | 9 | 94 | water-soluble vitamin metabolic process |
| GO:0006195 | 0.0065 | 3.939 | 1.6931 | 6 | 48 | purine nucleotide catabolic process |
| GO:0002636 | 0.0071 | 27.4457 | 0.1411 | 2 | 4 | positive regulation of germinal center formation |
| GO:0006041 | 0.0071 | 27.4457 | 0.1411 | 2 | 4 | glucosamine metabolic process |
| GO:1990086 | 0.0071 | 27.4457 | 0.1411 | 2 | 4 | lens fiber cell apoptotic process |
| GO:0048854 | 0.0073 | 4.5908 | 1.2346 | 5 | 35 | brain morphogenesis |
| GO:0010460 | 0.008 | 5.7925 | 0.8113 | 4 | 23 | positive regulation of heart rate |
| GO:0003073 | 0.0082 | 2.9854 | 2.8924 | 8 | 82 | regulation of systemic arterial blood pressure |
| GO:0007283 | 0.0084 | 1.7315 | 15.6965 | 26 | 445 | spermatogenesis |
| GO:0009987 | 0.0086 | 1.5144 | 503.2419 | 519 | 14267 | cellular process |
| GO:0060964 | 0.0096 | 8.2443 | 0.4586 | 3 | 13 | regulation of gene silencing by miRNA |
| GOMFID | Pvalue | OddsRatio | ExpCount | Count | Size | Term |
| GO:0018003 | 8e-04 | Inf | 0.0569 | 2 | 2 | peptidyl-lysine N6-acetylation |
| GO:0007084 | 0.0017 | 17.1768 | 0.2561 | 3 | 9 | mitotic nuclear envelope reassembly |
| GO:0006383 | 0.0022 | 4.9509 | 1.3604 | 6 | 48 | transcription from RNA polymerase III promoter |
| GO:0034727 | 0.0024 | 68.5753 | 0.0854 | 2 | 3 | piecemeal microautophagy of nucleus |
| GO:0044805 | 0.0024 | 68.5753 | 0.0854 | 2 | 3 | late nucleophagy |
| GO:0071651 | 0.0024 | 68.5753 | 0.0854 | 2 | 3 | positive regulation of chemokine (C-C motif) ligand 5 production |
| GO:0071926 | 0.0024 | 68.5753 | 0.0854 | 2 | 3 | endocannabinoid signaling pathway |
| GO:0090304 | 0.0024 | 1.3366 | 135.1018 | 163 | 4747 | nucleic acid metabolic process |
| GO:0002092 | 0.0037 | 7.2425 | 0.6546 | 4 | 23 | positive regulation of receptor internalization |
| GO:0034641 | 0.0042 | 1.2967 | 174.548 | 202 | 6133 | cellular nitrogen compound metabolic process |
| GO:0006725 | 0.0045 | 1.2991 | 156.3049 | 183 | 5492 | cellular aromatic compound metabolic process |
| GO:0032417 | 0.0047 | 34.2854 | 0.1138 | 2 | 4 | positive regulation of sodium:proton antiporter activity |
| GO:1902534 | 0.0047 | 34.2854 | 0.1138 | 2 | 4 | single-organism membrane invagination |
| GO:0006998 | 0.005 | 3.6073 | 2.1061 | 7 | 74 | nuclear envelope organization |
| GO:0044260 | 0.0057 | 1.2822 | 227.1999 | 254 | 7983 | cellular macromolecule metabolic process |
| GO:0090174 | 0.006 | 3.1416 | 2.7322 | 8 | 96 | organelle membrane fusion |
| GO:0042273 | 0.0065 | 4.6539 | 1.1953 | 5 | 42 | ribosomal large subunit biogenesis |
| GO:0051788 | 0.0066 | 9.3661 | 0.3984 | 3 | 14 | response to misfolded protein |
| GO:0061024 | 0.0068 | 1.5403 | 29.9973 | 44 | 1054 | membrane organization |
| GO:0070911 | 0.007 | 3.8309 | 1.7076 | 6 | 60 | global genome nucleotide-excision repair |
| GO:0002250 | 0.0072 | 1.9905 | 9.4773 | 18 | 333 | adaptive immune response |
| GO:0035811 | 0.0076 | 22.8554 | 0.1423 | 2 | 5 | negative regulation of urine volume |
| GO:0042796 | 0.0076 | 22.8554 | 0.1423 | 2 | 5 | snRNA transcription from RNA polymerase III promoter |
| GO:0046499 | 0.0076 | 22.8554 | 0.1423 | 2 | 5 | S-adenosylmethioninamine metabolic process |
| GO:0090383 | 0.0076 | 22.8554 | 0.1423 | 2 | 5 | phagosome acidification |
| GO:0001833 | 0.0081 | 8.585 | 0.4269 | 3 | 15 | inner cell mass cell proliferation |
| GO:0048026 | 0.0081 | 8.585 | 0.4269 | 3 | 15 | positive regulation of mRNA splicing, via spliceosome |
| GO:0046483 | 0.009 | 1.269 | 155.7926 | 180 | 5474 | heterocycle metabolic process |
| GO:1903313 | 0.0096 | 4.1988 | 1.3092 | 5 | 46 | positive regulation of mRNA metabolic process |
| GO:0006501 | 0.0099 | 5.2902 | 0.8538 | 4 | 30 | C-terminal protein lipidation |
| GOMFID | Pvalue | OddsRatio | ExpCount | Count | Size | Term |
| GO:1901019 | 7e-04 | 4.6015 | 1.9519 | 8 | 64 | regulation of calcium ion transmembrane transporter activity |
| GO:0046543 | 0.0021 | 15.9884 | 0.2745 | 3 | 9 | development of secondary female sexual characteristics |
| GO:0030887 | 0.0027 | 63.8407 | 0.0915 | 2 | 3 | positive regulation of myeloid dendritic cell activation |
| GO:0033292 | 0.0027 | 63.8407 | 0.0915 | 2 | 3 | T-tubule organization |
| GO:2000502 | 0.0027 | 63.8407 | 0.0915 | 2 | 3 | negative regulation of natural killer cell chemotaxis |
| GO:0060294 | 0.0029 | 13.7035 | 0.305 | 3 | 10 | cilium movement involved in cell motility |
| GO:0007214 | 0.004 | 7.1153 | 0.671 | 4 | 22 | gamma-aminobutyric acid signaling pathway |
| GO:2001257 | 0.0041 | 3.3861 | 2.5618 | 8 | 84 | regulation of cation channel activity |
| GO:0002027 | 0.0044 | 3.3419 | 2.5923 | 8 | 85 | regulation of heart rate |
| GO:0035640 | 0.0048 | 6.7404 | 0.7015 | 4 | 23 | exploration behavior |
| GO:0032483 | 0.0053 | 31.9182 | 0.122 | 2 | 4 | regulation of Rab protein signal transduction |
| GO:0042552 | 0.0054 | 2.9562 | 3.2633 | 9 | 107 | myelination |
| GO:0046058 | 0.0054 | 2.6081 | 4.4832 | 11 | 147 | cAMP metabolic process |
| GO:0097194 | 0.0062 | 3.1371 | 2.7448 | 8 | 90 | execution phase of apoptosis |
| GO:0070166 | 0.0064 | 9.5905 | 0.3965 | 3 | 13 | enamel mineralization |
| GO:0007272 | 0.0065 | 2.8678 | 3.3548 | 9 | 110 | ensheathment of neurons |
| GO:0071375 | 0.008 | 1.7598 | 14.8525 | 25 | 487 | cellular response to peptide hormone stimulus |
| GO:0030262 | 0.0086 | 5.5667 | 0.8234 | 4 | 27 | apoptotic nuclear changes |
| GO:0008582 | 0.0087 | 21.2774 | 0.1525 | 2 | 5 | regulation of synaptic growth at neuromuscular junction |
| GO:0090611 | 0.0087 | 21.2774 | 0.1525 | 2 | 5 | ubiquitin-independent protein catabolic process via the multivesicular body sorting pathway |
| GO:1990416 | 0.0087 | 21.2774 | 0.1525 | 2 | 5 | cellular response to brain-derived neurotrophic factor stimulus |
| GO:0045429 | 0.0096 | 4.2164 | 1.3114 | 5 | 43 | positive regulation of nitric oxide biosynthetic process |
| GO:0046834 | 0.0096 | 4.2164 | 1.3114 | 5 | 43 | lipid phosphorylation |
| GO:0006665 | 0.0097 | 2.5152 | 4.2087 | 10 | 138 | sphingolipid metabolic process |
| GO:0036294 | 0.0097 | 2.5152 | 4.2087 | 10 | 138 | cellular response to decreased oxygen levels |
| GO:0006308 | 0.0098 | 5.3344 | 0.8539 | 4 | 28 | DNA catabolic process |
| GOMFID | Pvalue | OddsRatio | ExpCount | Count | Size | Term |
| GO:0070207 | 2e-04 | 11.2905 | 0.5879 | 5 | 19 | protein homotrimerization |
| GO:1901029 | 3e-04 | 47.2609 | 0.1547 | 3 | 5 | negative regulation of mitochondrial outer membrane permeabilization involved in apoptotic signaling pathway |
| GO:0019372 | 5e-04 | 14.0258 | 0.4023 | 4 | 13 | lipoxygenase pathway |
| GO:0006529 | 0.001 | Inf | 0.0619 | 2 | 2 | asparagine biosynthetic process |
| GO:1901568 | 0.0011 | 3.5317 | 3.0944 | 10 | 100 | fatty acid derivative metabolic process |
| GO:0051642 | 0.0024 | 8.4122 | 0.5879 | 4 | 19 | centrosome localization |
| GO:0019369 | 0.0029 | 4.0294 | 1.9185 | 7 | 62 | arachidonic acid metabolic process |
| GO:0009987 | 0.0035 | 1.6714 | 441.4722 | 458 | 14267 | cellular process |
| GO:0009267 | 0.0041 | 2.8858 | 3.7132 | 10 | 120 | cellular response to starvation |
| GO:0043933 | 0.0048 | 1.3674 | 76.4616 | 98 | 2471 | macromolecular complex subunit organization |
| GO:0051053 | 0.0049 | 3.004 | 3.2181 | 9 | 104 | negative regulation of DNA metabolic process |
| GO:0002457 | 0.0055 | 31.4421 | 0.1238 | 2 | 4 | T cell antigen processing and presentation |
| GO:0045213 | 0.0055 | 31.4421 | 0.1238 | 2 | 4 | neurotransmitter receptor metabolic process |
| GO:0046456 | 0.0057 | 4.0354 | 1.64 | 6 | 53 | icosanoid biosynthetic process |
| GO:0032048 | 0.0067 | 9.4472 | 0.4023 | 3 | 13 | cardiolipin metabolic process |
| GO:0006807 | 0.0078 | 1.2566 | 198.596 | 225 | 6418 | nitrogen compound metabolic process |
| GO:0006824 | 0.009 | 20.9601 | 0.1547 | 2 | 5 | cobalt ion transport |
| GO:0015889 | 0.009 | 20.9601 | 0.1547 | 2 | 5 | cobalamin transport |
| GO:0046469 | 0.009 | 20.9601 | 0.1547 | 2 | 5 | platelet activating factor metabolic process |
| GO:0007264 | 0.0091 | 1.5412 | 27.1375 | 40 | 877 | small GTPase mediated signal transduction |
| GO:0031668 | 0.0099 | 2.1976 | 6.2197 | 13 | 201 | cellular response to extracellular stimulus |
| GO:0007286 | 0.0099 | 2.665 | 3.5895 | 9 | 116 | spermatid development |
| GOMFID | Pvalue | OddsRatio | ExpCount | Count | Size | Term |
| GO:0051482 | 0 | 19.1894 | 0.4139 | 5 | 13 | positive regulation of cytosolic calcium ion concentration involved in phospholipase C-activating G-protein coupled signaling pathway |
| GO:0042559 | 0.0014 | 10.211 | 0.5094 | 4 | 16 | pteridine-containing compound biosynthetic process |
| GO:0032456 | 0.0024 | 6.1337 | 0.955 | 5 | 30 | endocytic recycling |
| GO:0033512 | 0.003 | 61.0643 | 0.0955 | 2 | 3 | L-lysine catabolic process to acetyl-CoA via saccharopine |
| GO:0034421 | 0.003 | 61.0643 | 0.0955 | 2 | 3 | post-translational protein acetylation |
| GO:0065002 | 0.0032 | 4.6051 | 1.4644 | 6 | 46 | intracellular protein transmembrane transport |
| GO:0072661 | 0.0056 | 6.4461 | 0.7322 | 4 | 23 | protein targeting to plasma membrane |
| GO:0051597 | 0.0057 | 10.1925 | 0.382 | 3 | 12 | response to methylmercury |
| GO:0019477 | 0.0058 | 30.5301 | 0.1273 | 2 | 4 | L-lysine catabolic process |
| GO:0021855 | 0.0058 | 30.5301 | 0.1273 | 2 | 4 | hypothalamus cell migration |
| GO:0051031 | 0.0058 | 30.5301 | 0.1273 | 2 | 4 | tRNA transport |
| GO:0060300 | 0.0058 | 30.5301 | 0.1273 | 2 | 4 | regulation of cytokine activity |
| GO:0043473 | 0.0065 | 3.1135 | 2.7696 | 8 | 87 | pigmentation |
| GO:0046640 | 0.0065 | 6.1234 | 0.764 | 4 | 24 | regulation of alpha-beta T cell proliferation |
| GO:0072170 | 0.0065 | 6.1234 | 0.764 | 4 | 24 | metanephric tubule development |
| GO:2000001 | 0.0072 | 9.1726 | 0.4139 | 3 | 13 | regulation of DNA damage checkpoint |
| GO:0042098 | 0.0087 | 2.3271 | 5.4438 | 12 | 171 | T cell proliferation |
| GO:0030150 | 0.009 | 8.3382 | 0.4457 | 3 | 14 | protein import into mitochondrial matrix |
| GO:0006398 | 0.0095 | 20.3521 | 0.1592 | 2 | 5 | mRNA 3'-end processing by stem-loop binding and cleavage |
| GO:0021825 | 0.0095 | 20.3521 | 0.1592 | 2 | 5 | substrate-dependent cerebral cortex tangential migration |
| GO:0060126 | 0.0095 | 20.3521 | 0.1592 | 2 | 5 | somatotropin secreting cell differentiation |
| GOMFID | Pvalue | OddsRatio | ExpCount | Count | Size | Term |
| GO:0016311 | 0 | 2.5956 | 13.0087 | 31 | 407 | dephosphorylation |
| GO:0051156 | 0.0012 | 7.2736 | 0.831 | 5 | 26 | glucose 6-phosphate metabolic process |
| GO:0021891 | 0.0016 | 18.2754 | 0.2557 | 3 | 8 | olfactory bulb interneuron development |
| GO:0046512 | 0.0016 | 18.2754 | 0.2557 | 3 | 8 | sphingosine biosynthetic process |
| GO:0003350 | 0.003 | 60.812 | 0.0959 | 2 | 3 | pulmonary myocardium development |
| GO:0009395 | 0.0042 | 5.2643 | 1.0867 | 5 | 34 | phospholipid catabolic process |
| GO:0034311 | 0.0044 | 11.4198 | 0.3516 | 3 | 11 | diol metabolic process |
| GO:1903830 | 0.0058 | 10.1503 | 0.3835 | 3 | 12 | magnesium ion transmembrane transport |
| GO:0015760 | 0.0059 | 30.404 | 0.1278 | 2 | 4 | glucose-6-phosphate transport |
| GO:0045354 | 0.0059 | 30.404 | 0.1278 | 2 | 4 | regulation of interferon-alpha biosynthetic process |
| GO:0051031 | 0.0059 | 30.404 | 0.1278 | 2 | 4 | tRNA transport |
| GO:0061732 | 0.0059 | 30.404 | 0.1278 | 2 | 4 | mitochondrial acetyl-CoA biosynthetic process from pyruvate |
| GO:0071502 | 0.0059 | 30.404 | 0.1278 | 2 | 4 | cellular response to temperature stimulus |
| GO:0030203 | 0.0062 | 2.4414 | 5.2099 | 12 | 163 | glycosaminoglycan metabolic process |
| GO:0032048 | 0.0073 | 9.1347 | 0.4155 | 3 | 13 | cardiolipin metabolic process |
| GO:0046519 | 0.0073 | 9.1347 | 0.4155 | 3 | 13 | sphingoid metabolic process |
| GO:2000378 | 0.0077 | 4.4887 | 1.2465 | 5 | 39 | negative regulation of reactive oxygen species metabolic process |
| GO:0006807 | 0.0077 | 1.2526 | 205.1341 | 232 | 6418 | nitrogen compound metabolic process |
| GO:0006023 | 0.0087 | 2.7298 | 3.5159 | 9 | 110 | aminoglycan biosynthetic process |
| GO:0060413 | 0.0091 | 8.3037 | 0.4475 | 3 | 14 | atrial septum morphogenesis |
| GO:1903727 | 0.0095 | 4.2388 | 1.3105 | 5 | 41 | positive regulation of phospholipid metabolic process |
| GO:0038170 | 0.0096 | 20.268 | 0.1598 | 2 | 5 | somatostatin signaling pathway |
| GO:0043456 | 0.0096 | 20.268 | 0.1598 | 2 | 5 | regulation of pentose-phosphate shunt |
| GO:0060126 | 0.0096 | 20.268 | 0.1598 | 2 | 5 | somatotropin secreting cell differentiation |
| GOMFID | Pvalue | OddsRatio | ExpCount | Count | Size | Term |
| GO:0006695 | 1e-04 | 6.1179 | 1.5441 | 8 | 47 | cholesterol biosynthetic process |
| GO:0044711 | 3e-04 | 1.5706 | 55.5556 | 81 | 1691 | single-organism biosynthetic process |
| GO:0070498 | 0.0012 | 10.7805 | 0.4928 | 4 | 15 | interleukin-1-mediated signaling pathway |
| GO:0060119 | 0.0012 | 5.7529 | 1.2156 | 6 | 37 | inner ear receptor cell development |
| GO:0046165 | 0.0012 | 2.8822 | 4.8623 | 13 | 148 | alcohol biosynthetic process |
| GO:0021891 | 0.0017 | 17.7602 | 0.2628 | 3 | 8 | olfactory bulb interneuron development |
| GO:2000344 | 0.0017 | 17.7602 | 0.2628 | 3 | 8 | positive regulation of acrosome reaction |
| GO:0006120 | 0.0021 | 5.0941 | 1.347 | 6 | 41 | mitochondrial electron transport, NADH to ubiquinone |
| GO:0006807 | 0.0021 | 1.2995 | 210.855 | 243 | 6418 | nitrogen compound metabolic process |
| GO:0050434 | 0.0025 | 4.1642 | 1.8727 | 7 | 57 | positive regulation of viral transcription |
| GO:0043406 | 0.0028 | 2.4021 | 6.6364 | 15 | 202 | positive regulation of MAP kinase activity |
| GO:0008380 | 0.0031 | 2.0054 | 11.5645 | 22 | 352 | RNA splicing |
| GO:0003285 | 0.0032 | 59.1012 | 0.0986 | 2 | 3 | septum secundum development |
| GO:0010513 | 0.0032 | 59.1012 | 0.0986 | 2 | 3 | positive regulation of phosphatidylinositol biosynthetic process |
| GO:0051660 | 0.0032 | 59.1012 | 0.0986 | 2 | 3 | establishment of centrosome localization |
| GO:0061146 | 0.0032 | 59.1012 | 0.0986 | 2 | 3 | Peyer's patch morphogenesis |
| GO:1904742 | 0.0032 | 59.1012 | 0.0986 | 2 | 3 | regulation of telomeric DNA binding |
| GO:0006694 | 0.0038 | 2.6161 | 4.8952 | 12 | 149 | steroid biosynthetic process |
| GO:0016125 | 0.0044 | 2.6903 | 4.3695 | 11 | 133 | sterol metabolic process |
| GO:0021761 | 0.0053 | 2.9783 | 3.2525 | 9 | 99 | limbic system development |
| GO:0021988 | 0.0061 | 4.7847 | 1.1827 | 5 | 36 | olfactory lobe development |
| GO:0002906 | 0.0062 | 29.5486 | 0.1314 | 2 | 4 | negative regulation of mature B cell apoptotic process |
| GO:0032532 | 0.0062 | 29.5486 | 0.1314 | 2 | 4 | regulation of microvillus length |
| GO:0043622 | 0.0062 | 29.5486 | 0.1314 | 2 | 4 | cortical microtubule organization |
| GO:0061732 | 0.0062 | 29.5486 | 0.1314 | 2 | 4 | mitochondrial acetyl-CoA biosynthetic process from pyruvate |
| GO:0051354 | 0.0062 | 6.2381 | 0.7556 | 4 | 23 | negative regulation of oxidoreductase activity |
| GO:0007018 | 0.0064 | 2.2497 | 6.5707 | 14 | 200 | microtubule-based movement |
| GO:0006397 | 0.0065 | 1.8177 | 13.8314 | 24 | 421 | mRNA processing |
| GO:0006139 | 0.0067 | 1.2628 | 174.1245 | 201 | 5300 | nucleobase-containing compound metabolic process |
| GO:0021954 | 0.0068 | 3.4108 | 2.2341 | 7 | 68 | central nervous system neuron development |
| GO:1902652 | 0.0069 | 2.6606 | 4.0081 | 10 | 122 | secondary alcohol metabolic process |
| GO:0070198 | 0.0073 | 5.9258 | 0.7885 | 4 | 24 | protein localization to chromosome, telomeric region |
| GO:0051347 | 0.0075 | 1.6121 | 22.7019 | 35 | 691 | positive regulation of transferase activity |
| GO:0016070 | 0.0076 | 1.2724 | 140.0553 | 165 | 4263 | RNA metabolic process |
| GO:0008654 | 0.0088 | 2.0952 | 7.5235 | 15 | 229 | phospholipid biosynthetic process |
| GO:1902230 | 0.0097 | 5.3864 | 0.8542 | 4 | 26 | negative regulation of intrinsic apoptotic signaling pathway in response to DNA damage |
| GO:1902808 | 0.0097 | 5.3864 | 0.8542 | 4 | 26 | positive regulation of cell cycle G1/S phase transition |
| GO:0048524 | 0.0097 | 2.6787 | 3.5811 | 9 | 109 | positive regulation of viral process |
| GO:0030320 | 0.0098 | 8.0696 | 0.46 | 3 | 14 | cellular monovalent inorganic anion homeostasis |
| GO:0045475 | 0.0098 | 8.0696 | 0.46 | 3 | 14 | locomotor rhythm |
| GO:0060413 | 0.0098 | 8.0696 | 0.46 | 3 | 14 | atrial septum morphogenesis |
| GOMFID | Pvalue | OddsRatio | ExpCount | Count | Size | Term |
| GO:0006433 | 9e-04 | Inf | 0.0591 | 2 | 2 | prolyl-tRNA aminoacylation |
| GO:0006749 | 9e-04 | 5.06 | 1.5658 | 7 | 53 | glutathione metabolic process |
| GO:0044342 | 0.0013 | 10.1866 | 0.5022 | 4 | 17 | type B pancreatic cell proliferation |
| GO:1901687 | 0.002 | 6.3751 | 0.9158 | 5 | 31 | glutathione derivative biosynthetic process |
| GO:0032402 | 0.0025 | 8.275 | 0.5909 | 4 | 20 | melanosome transport |
| GO:0007018 | 0.0025 | 2.5183 | 5.9086 | 14 | 200 | microtubule-based movement |
| GO:0061511 | 0.0026 | 65.9784 | 0.0886 | 2 | 3 | centriole elongation |
| GO:0051905 | 0.003 | 7.7877 | 0.6204 | 4 | 21 | establishment of pigment granule localization |
| GO:0034969 | 0.0046 | 11.0145 | 0.3545 | 3 | 12 | histone arginine methylation |
| GO:1902806 | 0.0047 | 2.6577 | 4.4019 | 11 | 149 | regulation of cell cycle G1/S phase transition |
| GO:0019886 | 0.0048 | 3.2837 | 2.6293 | 8 | 89 | antigen processing and presentation of exogenous peptide antigen via MHC class II |
| GO:0046854 | 0.0049 | 5.0205 | 1.1226 | 5 | 38 | phosphatidylinositol phosphorylation |
| GO:1901998 | 0.0055 | 4.8725 | 1.1522 | 5 | 39 | toxin transport |
| GO:0019884 | 0.0056 | 2.4713 | 5.1405 | 12 | 174 | antigen processing and presentation of exogenous antigen |
| GO:2000001 | 0.0059 | 9.9124 | 0.3841 | 3 | 13 | regulation of DNA damage checkpoint |
| GO:0042267 | 0.006 | 3.9804 | 1.6544 | 6 | 56 | natural killer cell mediated cytotoxicity |
| GO:0002504 | 0.0066 | 3.0918 | 2.777 | 8 | 94 | antigen processing and presentation of peptide or polysaccharide antigen via MHC class II |
| GO:0002418 | 0.0073 | 9.0106 | 0.4136 | 3 | 14 | immune response to tumor cell |
| GO:0060126 | 0.0082 | 21.9899 | 0.1477 | 2 | 5 | somatotropin secreting cell differentiation |
| GO:1902035 | 0.0082 | 21.9899 | 0.1477 | 2 | 5 | positive regulation of hematopoietic stem cell proliferation |
| GO:0006888 | 0.0088 | 2.4268 | 4.7859 | 11 | 162 | ER to Golgi vesicle-mediated transport |
| GO:0098534 | 0.0088 | 5.5138 | 0.8272 | 4 | 28 | centriole assembly |
| GO:0071900 | 0.0099 | 1.6713 | 17.4894 | 28 | 592 | regulation of protein serine/threonine kinase activity |
| GOMFID | Pvalue | OddsRatio | ExpCount | Count | Size | Term |
| GO:0006529 | 0.001 | Inf | 0.0627 | 2 | 2 | asparagine biosynthetic process |
| GO:0060450 | 0.001 | Inf | 0.0627 | 2 | 2 | positive regulation of hindgut contraction |
| GO:1900108 | 0.001 | Inf | 0.0627 | 2 | 2 | negative regulation of nodal signaling pathway |
| GO:0006749 | 0.0013 | 4.7591 | 1.6603 | 7 | 53 | glutathione metabolic process |
| GO:0006085 | 0.0013 | 10.3839 | 0.5012 | 4 | 16 | acetyl-CoA biosynthetic process |
| GO:0006367 | 0.0016 | 2.3202 | 8.2386 | 18 | 263 | transcription initiation from RNA polymerase II promoter |
| GO:0051656 | 0.0019 | 2.1365 | 10.4001 | 21 | 332 | establishment of organelle localization |
| GO:1901687 | 0.0026 | 5.9975 | 0.9711 | 5 | 31 | glutathione derivative biosynthetic process |
| GO:0018125 | 0.0029 | 62.0939 | 0.094 | 2 | 3 | peptidyl-cysteine methylation |
| GO:1904742 | 0.0029 | 62.0939 | 0.094 | 2 | 3 | regulation of telomeric DNA binding |
| GO:0010510 | 0.0031 | 13.3278 | 0.3133 | 3 | 10 | regulation of acetyl-CoA biosynthetic process from pyruvate |
| GO:0071312 | 0.0039 | 5.376 | 1.0651 | 5 | 34 | cellular response to alkaloid |
| GO:0007018 | 0.0043 | 2.3664 | 6.2651 | 14 | 200 | microtubule-based movement |
| GO:0006541 | 0.0044 | 6.9199 | 0.6892 | 4 | 22 | glutamine metabolic process |
| GO:0032354 | 0.0054 | 10.3647 | 0.3759 | 3 | 12 | response to follicle-stimulating hormone |
| GO:0009786 | 0.0056 | 31.0449 | 0.1253 | 2 | 4 | regulation of asymmetric cell division |
| GO:0045925 | 0.0056 | 31.0449 | 0.1253 | 2 | 4 | positive regulation of female receptivity |
| GO:0061732 | 0.0056 | 31.0449 | 0.1253 | 2 | 4 | mitochondrial acetyl-CoA biosynthetic process from pyruvate |
| GO:0090116 | 0.0056 | 31.0449 | 0.1253 | 2 | 4 | C-5 methylation of cytosine |
| GO:0047497 | 0.0069 | 9.3276 | 0.4072 | 3 | 13 | mitochondrion transport along microtubule |
| GO:0032925 | 0.0071 | 5.9301 | 0.7831 | 4 | 25 | regulation of activin receptor signaling pathway |
| GOMFID | Pvalue | OddsRatio | ExpCount | Count | Size | Term |
| GO:0006349 | 1e-04 | 13.3668 | 0.5308 | 5 | 16 | regulation of gene expression by genetic imprinting |
| GO:0007080 | 7e-04 | 6.5407 | 1.0947 | 6 | 33 | mitotic metaphase plate congression |
| GO:0007059 | 7e-04 | 2.3946 | 8.9233 | 20 | 269 | chromosome segregation |
| GO:2000653 | 7e-04 | 29.3089 | 0.199 | 3 | 6 | regulation of genetic imprinting |
| GO:0051303 | 8e-04 | 4.5383 | 1.9903 | 8 | 60 | establishment of chromosome localization |
| GO:0035337 | 0.0012 | 4.7957 | 1.6586 | 7 | 50 | fatty-acyl-CoA metabolic process |
| GO:0044237 | 0.0018 | 1.3208 | 321.0058 | 353 | 9677 | cellular metabolic process |
| GO:0035338 | 0.0019 | 5.1917 | 1.3269 | 6 | 40 | long-chain fatty-acyl-CoA biosynthetic process |
| GO:0035383 | 0.0023 | 3.4045 | 2.886 | 9 | 87 | thioester metabolic process |
| GO:0032386 | 0.0024 | 1.7759 | 19.5715 | 33 | 590 | regulation of intracellular transport |
| GO:0051338 | 0.0031 | 1.5678 | 33.6033 | 50 | 1013 | regulation of transferase activity |
| GO:0007113 | 0.0032 | 58.5125 | 0.0995 | 2 | 3 | endomitotic cell cycle |
| GO:0009397 | 0.0032 | 58.5125 | 0.0995 | 2 | 3 | folic acid-containing compound catabolic process |
| GO:0070054 | 0.0032 | 58.5125 | 0.0995 | 2 | 3 | mRNA splicing, via endonucleolytic cleavage and ligation |
| GO:0070055 | 0.0032 | 58.5125 | 0.0995 | 2 | 3 | mRNA endonucleolytic cleavage involved in unfolded protein response |
| GO:1901837 | 0.0032 | 58.5125 | 0.0995 | 2 | 3 | negative regulation of transcription of nuclear large rRNA transcript from RNA polymerase I promoter |
| GO:0001935 | 0.0033 | 2.9821 | 3.6158 | 10 | 109 | endothelial cell proliferation |
| GO:0006396 | 0.0035 | 1.642 | 25.6088 | 40 | 772 | RNA processing |
| GO:0034605 | 0.0036 | 5.5009 | 1.0503 | 5 | 32 | cellular response to heat |
| GO:1900034 | 0.0036 | 3.4668 | 2.5211 | 8 | 76 | regulation of cellular response to heat |
| GO:0060315 | 0.0037 | 12.5576 | 0.3317 | 3 | 10 | negative regulation of ryanodine-sensitive calcium-release channel activity |
| GO:0031399 | 0.0038 | 1.4284 | 57.0891 | 77 | 1721 | regulation of protein modification process |
| GO:0000819 | 0.0041 | 2.5895 | 4.9426 | 12 | 149 | sister chromatid segregation |
| GO:0072594 | 0.0042 | 1.6942 | 21.0642 | 34 | 635 | establishment of protein localization to organelle |
| GO:0010882 | 0.0046 | 6.9032 | 0.6966 | 4 | 21 | regulation of cardiac muscle contraction by calcium ion signaling |
| GO:0007017 | 0.0052 | 1.7125 | 18.9744 | 31 | 572 | microtubule-based process |
| GO:0001825 | 0.0056 | 4.895 | 1.161 | 5 | 35 | blastocyst formation |
| GO:0019432 | 0.0058 | 3.1844 | 2.7201 | 8 | 82 | triglyceride biosynthetic process |
| GO:0051726 | 0.0058 | 1.5257 | 33.0062 | 48 | 995 | regulation of cell cycle |
| GO:0045859 | 0.0061 | 1.5663 | 28.0967 | 42 | 847 | regulation of protein kinase activity |
| GO:0007079 | 0.0063 | 29.2543 | 0.1327 | 2 | 4 | mitotic chromosome movement towards spindle pole |
| GO:0036109 | 0.0064 | 9.7658 | 0.3981 | 3 | 12 | alpha-linolenic acid metabolic process |
| GO:0043950 | 0.0064 | 9.7658 | 0.3981 | 3 | 12 | positive regulation of cAMP-mediated signaling |
| GO:0016043 | 0.0065 | 1.258 | 193.3598 | 221 | 5829 | cellular component organization |
| GO:0046460 | 0.0067 | 3.1002 | 2.7865 | 8 | 84 | neutral lipid biosynthetic process |
| GO:0006367 | 0.0069 | 2.0484 | 8.7242 | 17 | 263 | transcription initiation from RNA polymerase II promoter |
| GO:0071426 | 0.0071 | 3.0598 | 2.8196 | 8 | 85 | ribonucleoprotein complex export from nucleus |
| GO:0006635 | 0.0072 | 3.3765 | 2.2557 | 7 | 68 | fatty acid beta-oxidation |
| GO:0019054 | 0.0079 | 3.7524 | 1.7581 | 6 | 53 | modulation by virus of host process |
| GO:0046498 | 0.0081 | 8.7886 | 0.4312 | 3 | 13 | S-adenosylhomocysteine metabolic process |
| GO:0044267 | 0.0087 | 1.2564 | 159.6238 | 185 | 4812 | cellular protein metabolic process |
| GO:0016925 | 0.0087 | 2.5645 | 4.1465 | 10 | 125 | protein sumoylation |
| GO:0051641 | 0.0087 | 1.3037 | 95.4359 | 117 | 2877 | cellular localization |
| GO:0044238 | 0.0088 | 1.2547 | 322.8303 | 349 | 9732 | primary metabolic process |
| GO:0043666 | 0.0095 | 3.5988 | 1.8245 | 6 | 55 | regulation of phosphoprotein phosphatase activity |
| GO:0044272 | 0.0097 | 2.1338 | 6.8998 | 14 | 208 | sulfur compound biosynthetic process |
| GOMFID | Pvalue | OddsRatio | ExpCount | Count | Size | Term |
| GO:0045654 | 1e-04 | 31.501 | 0.2481 | 4 | 8 | positive regulation of megakaryocyte differentiation |
| GO:0006833 | 0.0012 | 5.7403 | 1.2093 | 6 | 39 | water transport |
| GO:0006120 | 0.0015 | 5.4116 | 1.2713 | 6 | 41 | mitochondrial electron transport, NADH to ubiquinone |
| GO:0045954 | 0.0024 | 8.3942 | 0.5891 | 4 | 19 | positive regulation of natural killer cell mediated cytotoxicity |
| GO:0042773 | 0.0027 | 4.0955 | 1.8914 | 7 | 61 | ATP synthesis coupled electron transport |
| GO:0001827 | 0.0028 | 62.7546 | 0.093 | 2 | 3 | inner cell mass cell fate commitment |
| GO:0001828 | 0.0028 | 62.7546 | 0.093 | 2 | 3 | inner cell mass cellular morphogenesis |
| GO:0071464 | 0.0028 | 62.7546 | 0.093 | 2 | 3 | cellular response to hydrostatic pressure |
| GO:0097296 | 0.003 | 7.869 | 0.6201 | 4 | 20 | activation of cysteine-type endopeptidase activity involved in apoptotic signaling pathway |
| GO:0010561 | 0.003 | 13.4699 | 0.3101 | 3 | 10 | negative regulation of glycoprotein biosynthetic process |
| GO:0006446 | 0.0031 | 3.5633 | 2.4496 | 8 | 79 | regulation of translational initiation |
| GO:0033762 | 0.0031 | 4.6178 | 1.4573 | 6 | 47 | response to glucagon |
| GO:0022900 | 0.0049 | 2.8025 | 3.8139 | 10 | 123 | electron transport chain |
| GO:0042994 | 0.0051 | 6.6253 | 0.7132 | 4 | 23 | cytoplasmic sequestering of transcription factor |
| GO:0008152 | 0.0051 | 1.321 | 346.5991 | 372 | 11178 | metabolic process |
| GO:0007252 | 0.0053 | 10.4752 | 0.3721 | 3 | 12 | I-kappaB phosphorylation |
| GO:0032202 | 0.0055 | 31.3753 | 0.124 | 2 | 4 | telomere assembly |
| GO:0072218 | 0.0055 | 31.3753 | 0.124 | 2 | 4 | metanephric ascending thin limb development |
| GO:0016310 | 0.0058 | 1.3848 | 64.3401 | 84 | 2075 | phosphorylation |
| GO:0006793 | 0.0063 | 1.3282 | 91.8125 | 114 | 2961 | phosphorus metabolic process |
| GO:1902578 | 0.0069 | 1.2935 | 120.9903 | 145 | 3902 | single-organism localization |
| GO:0032727 | 0.0084 | 8.5695 | 0.4341 | 3 | 14 | positive regulation of interferon-alpha production |
| GO:0071168 | 0.0084 | 8.5695 | 0.4341 | 3 | 14 | protein localization to chromatin |
| GO:0002730 | 0.009 | 20.9155 | 0.155 | 2 | 5 | regulation of dendritic cell cytokine production |
| GO:0006896 | 0.009 | 20.9155 | 0.155 | 2 | 5 | Golgi to vacuole transport |
| GO:0045359 | 0.009 | 20.9155 | 0.155 | 2 | 5 | positive regulation of interferon-beta biosynthetic process |
| GO:0051414 | 0.009 | 20.9155 | 0.155 | 2 | 5 | response to cortisol |
| GO:0061737 | 0.009 | 20.9155 | 0.155 | 2 | 5 | leukotriene signaling pathway |
| GO:1903708 | 0.0098 | 2.3858 | 4.8681 | 11 | 157 | positive regulation of hemopoiesis |
| GOMFID | Pvalue | OddsRatio | ExpCount | Count | Size | Term |
| GO:0006622 | 6e-04 | 12.9366 | 0.4135 | 4 | 15 | protein targeting to lysosome |
| GO:0007497 | 8e-04 | Inf | 0.0551 | 2 | 2 | posterior midgut development |
| GO:0000910 | 9e-04 | 3.3194 | 3.584 | 11 | 130 | cytokinesis |
| GO:0010256 | 0.0015 | 1.9649 | 14.5289 | 27 | 527 | endomembrane system organization |
| GO:0001773 | 0.002 | 6.3606 | 0.9098 | 5 | 33 | myeloid dendritic cell activation |
| GO:0006726 | 0.0022 | 70.8677 | 0.0827 | 2 | 3 | eye pigment biosynthetic process |
| GO:0043324 | 0.0022 | 70.8677 | 0.0827 | 2 | 3 | pigment metabolic process involved in developmental pigmentation |
| GO:0061624 | 0.0022 | 70.8677 | 0.0827 | 2 | 3 | fructose catabolic process to hydroxyacetone phosphate and glyceraldehyde-3-phosphate |
| GO:0070458 | 0.0022 | 70.8677 | 0.0827 | 2 | 3 | cellular detoxification of nitrogen compound |
| GO:0010332 | 0.0024 | 4.8634 | 1.3785 | 6 | 50 | response to gamma radiation |
| GO:0043482 | 0.0029 | 13.3125 | 0.3033 | 3 | 11 | cellular pigment accumulation |
| GO:0032092 | 0.0039 | 3.7861 | 2.0125 | 7 | 73 | positive regulation of protein binding |
| GO:0018916 | 0.0044 | 35.4316 | 0.1103 | 2 | 4 | nitrobenzene metabolic process |
| GO:0070918 | 0.0046 | 6.7719 | 0.6892 | 4 | 25 | production of small RNA involved in gene silencing by RNA |
| GO:0072666 | 0.0046 | 6.7719 | 0.6892 | 4 | 25 | establishment of protein localization to vacuole |
| GO:0031054 | 0.006 | 9.6799 | 0.386 | 3 | 14 | pre-miRNA processing |
| GO:0006261 | 0.0063 | 2.8733 | 3.3359 | 9 | 121 | DNA-dependent DNA replication |
| GO:0051238 | 0.0067 | 2.8477 | 3.3634 | 9 | 122 | sequestering of metal ion |
| GO:2000272 | 0.0069 | 5.9242 | 0.7719 | 4 | 28 | negative regulation of receptor activity |
| GO:0051138 | 0.0072 | 23.6195 | 0.1378 | 2 | 5 | positive regulation of NK T cell differentiation |
| GO:0070327 | 0.0072 | 23.6195 | 0.1378 | 2 | 5 | thyroid hormone transport |
| GO:0046037 | 0.0074 | 8.8727 | 0.4135 | 3 | 15 | GMP metabolic process |
| GO:0007034 | 0.0074 | 3.3298 | 2.2607 | 7 | 82 | vacuolar transport |
| GO:0045444 | 0.0077 | 2.3634 | 5.3484 | 12 | 194 | fat cell differentiation |
| GO:0051209 | 0.008 | 2.9759 | 2.8672 | 8 | 104 | release of sequestered calcium ion into cytosol |
| GO:0030041 | 0.0083 | 2.5739 | 4.1078 | 10 | 149 | actin filament polymerization |
| GO:0016482 | 0.0084 | 1.4996 | 32.9175 | 47 | 1194 | cytoplasmic transport |
| GO:0051282 | 0.0085 | 2.945 | 2.8948 | 8 | 105 | regulation of sequestering of calcium ion |
| GO:0060401 | 0.0086 | 2.7262 | 3.5013 | 9 | 127 | cytosolic calcium ion transport |
| GO:0070588 | 0.0088 | 2.1568 | 6.8096 | 14 | 247 | calcium ion transmembrane transport |
| GO:1902656 | 0.009 | 2.9148 | 2.9223 | 8 | 106 | calcium ion import into cytosol |
| GO:0014047 | 0.0092 | 4.2365 | 1.2957 | 5 | 47 | glutamate secretion |
| GO:0032228 | 0.0099 | 5.265 | 0.8546 | 4 | 31 | regulation of synaptic transmission, GABAergic |
| GOMFID | Pvalue | OddsRatio | ExpCount | Count | Size | Term |
| GO:0016556 | 1e-04 | 17.273 | 0.4577 | 5 | 13 | mRNA modification |
| GO:1900006 | 1e-04 | 5.4333 | 1.9365 | 9 | 55 | positive regulation of dendrite development |
| GO:0031022 | 0.0012 | Inf | 0.0704 | 2 | 2 | nuclear migration along microfilament |
| GO:0036451 | 0.0012 | Inf | 0.0704 | 2 | 2 | cap mRNA methylation |
| GO:0031346 | 0.0028 | 2.1 | 10.0699 | 20 | 286 | positive regulation of cell projection organization |
| GO:0008065 | 0.0036 | 54.9982 | 0.1056 | 2 | 3 | establishment of blood-nerve barrier |
| GO:0042488 | 0.0036 | 54.9982 | 0.1056 | 2 | 3 | positive regulation of odontogenesis of dentin-containing tooth |
| GO:0070681 | 0.0036 | 54.9982 | 0.1056 | 2 | 3 | glutaminyl-tRNAGln biosynthesis via transamidation |
| GO:0097112 | 0.0036 | 54.9982 | 0.1056 | 2 | 3 | gamma-aminobutyric acid receptor clustering |
| GO:0050808 | 0.004 | 2.239 | 7.57 | 16 | 215 | synapse organization |
| GO:0044705 | 0.0042 | 5.3085 | 1.0915 | 5 | 31 | multi-organism reproductive behavior |
| GO:0098911 | 0.0043 | 11.8021 | 0.3521 | 3 | 10 | regulation of ventricular cardiac muscle cell action potential |
| GO:0016242 | 0.0056 | 6.4871 | 0.7394 | 4 | 21 | negative regulation of macroautophagy |
| GO:0034205 | 0.0058 | 10.3261 | 0.3873 | 3 | 11 | beta-amyloid formation |
| GO:0018916 | 0.0071 | 27.4973 | 0.1408 | 2 | 4 | nitrobenzene metabolic process |
| GO:1902410 | 0.0071 | 27.4973 | 0.1408 | 2 | 4 | mitotic cytokinetic process |
| GO:0048812 | 0.0074 | 1.537 | 29.2591 | 43 | 831 | neuron projection morphogenesis |
| GO:0002002 | 0.0075 | 9.1782 | 0.4225 | 3 | 12 | regulation of angiotensin levels in blood |
| GO:0061003 | 0.0075 | 9.1782 | 0.4225 | 3 | 12 | positive regulation of dendritic spine morphogenesis |
| GO:0090335 | 0.0075 | 9.1782 | 0.4225 | 3 | 12 | regulation of brown fat cell differentiation |
| GO:1904294 | 0.0075 | 9.1782 | 0.4225 | 3 | 12 | positive regulation of ERAD pathway |
| GO:0060998 | 0.0079 | 3.7666 | 1.7605 | 6 | 50 | regulation of dendritic spine development |
| GO:0048814 | 0.0084 | 3.2799 | 2.3238 | 7 | 66 | regulation of dendrite morphogenesis |
| GO:0048667 | 0.0095 | 1.5271 | 28.0267 | 41 | 796 | cell morphogenesis involved in neuron differentiation |
| GOMFID | Pvalue | OddsRatio | ExpCount | Count | Size | Term |
| GO:0048742 | 3e-04 | 17.3657 | 0.353 | 4 | 11 | regulation of skeletal muscle fiber development |
| GO:0021548 | 6e-04 | 13.5049 | 0.4172 | 4 | 13 | pons development |
| GO:0007051 | 7e-04 | 3.2281 | 4.0433 | 12 | 126 | spindle organization |
| GO:0043525 | 0.001 | 4.9653 | 1.6045 | 7 | 50 | positive regulation of neuron apoptotic process |
| GO:0021633 | 0.001 | Inf | 0.0642 | 2 | 2 | optic nerve structural organization |
| GO:0015696 | 0.0019 | 3.5254 | 2.7918 | 9 | 87 | ammonium transport |
| GO:0008347 | 0.0024 | 4.9381 | 1.3799 | 6 | 43 | glial cell migration |
| GO:0000070 | 0.0026 | 2.9018 | 4.0754 | 11 | 127 | mitotic sister chromatid segregation |
| GO:0009957 | 0.003 | 60.5618 | 0.0963 | 2 | 3 | epidermal cell fate specification |
| GO:0014056 | 0.003 | 60.5618 | 0.0963 | 2 | 3 | regulation of acetylcholine secretion, neurotransmission |
| GO:0032439 | 0.003 | 60.5618 | 0.0963 | 2 | 3 | endosome localization |
| GO:0034628 | 0.003 | 60.5618 | 0.0963 | 2 | 3 | 'de novo' NAD biosynthetic process from aspartate |
| GO:0014904 | 0.0043 | 5.2426 | 1.091 | 5 | 34 | myotube cell development |
| GO:2001259 | 0.0043 | 5.2426 | 1.091 | 5 | 34 | positive regulation of cation channel activity |
| GO:0051123 | 0.0048 | 6.7484 | 0.706 | 4 | 22 | RNA polymerase II transcriptional preinitiation complex assembly |
| GO:0097193 | 0.0056 | 2.0483 | 9.2418 | 18 | 288 | intrinsic apoptotic signaling pathway |
| GO:0003376 | 0.0058 | 10.1084 | 0.3851 | 3 | 12 | sphingosine-1-phosphate signaling pathway |
| GO:0030205 | 0.0058 | 10.1084 | 0.3851 | 3 | 12 | dermatan sulfate metabolic process |
| GO:0030207 | 0.0058 | 10.1084 | 0.3851 | 3 | 12 | chondroitin sulfate catabolic process |
| GO:0000492 | 0.0059 | 30.2789 | 0.1284 | 2 | 4 | box C/D snoRNP assembly |
| GO:0051791 | 0.0059 | 30.2789 | 0.1284 | 2 | 4 | medium-chain fatty acid metabolic process |
| GO:0061526 | 0.0059 | 30.2789 | 0.1284 | 2 | 4 | acetylcholine secretion |
| GO:0070779 | 0.0059 | 30.2789 | 0.1284 | 2 | 4 | D-aspartate import |
| GO:1902075 | 0.0059 | 30.2789 | 0.1284 | 2 | 4 | cellular response to salt |
| GO:2001016 | 0.0059 | 30.2789 | 0.1284 | 2 | 4 | positive regulation of skeletal muscle cell differentiation |
| GO:0030856 | 0.0063 | 2.7031 | 3.947 | 10 | 123 | regulation of epithelial cell differentiation |
| GO:0030032 | 0.0068 | 3.8849 | 1.7008 | 6 | 53 | lamellipodium assembly |
| GO:0098813 | 0.0071 | 2.2219 | 6.6426 | 14 | 207 | nuclear chromosome segregation |
| GO:0070507 | 0.0074 | 2.6326 | 4.0433 | 10 | 126 | regulation of microtubule cytoskeleton organization |
| GO:1903513 | 0.0074 | 3.8037 | 1.7328 | 6 | 54 | endoplasmic reticulum to cytosol transport |
| GO:0021603 | 0.0096 | 20.1846 | 0.1604 | 2 | 5 | cranial nerve formation |
| GO:0071681 | 0.0096 | 20.1846 | 0.1604 | 2 | 5 | cellular response to indole-3-methanol |
| GO:2000110 | 0.0096 | 20.1846 | 0.1604 | 2 | 5 | negative regulation of macrophage apoptotic process |
| GOMFID | Pvalue | OddsRatio | ExpCount | Count | Size | Term |
| GO:0016702 | 8e-04 | 8.2044 | 0.7594 | 5 | 23 | oxidoreductase activity, acting on single donors with incorporation of molecular oxygen, incorporation of two atoms of oxygen |
| GO:0005515 | 0.0016 | 1.3321 | 334.3069 | 366 | 10125 | protein binding |
| GO:0019870 | 0.0018 | 17.6681 | 0.2641 | 3 | 8 | potassium channel inhibitor activity |
| GO:0016248 | 0.0062 | 4.7598 | 1.1886 | 5 | 36 | channel inhibitor activity |
| GO:0031544 | 0.0062 | 29.3958 | 0.1321 | 2 | 4 | peptidyl-proline 3-dioxygenase activity |
| GO:0043533 | 0.0062 | 29.3958 | 0.1321 | 2 | 4 | inositol 1,3,4,5 tetrakisphosphate binding |
| GO:0048030 | 0.0062 | 29.3958 | 0.1321 | 2 | 4 | disaccharide binding |
| GO:0071535 | 0.0062 | 29.3958 | 0.1321 | 2 | 4 | RING-like zinc finger domain binding |
| GOMFID | Pvalue | OddsRatio | ExpCount | Count | Size | Term |
| GO:0005525 | 0 | 2.567 | 10.956 | 26 | 341 | GTP binding |
| GO:0019001 | 1e-04 | 2.4253 | 11.5343 | 26 | 359 | guanyl nucleotide binding |
| GO:0051015 | 3e-04 | 3.6418 | 3.6306 | 12 | 113 | actin filament binding |
| GO:0003924 | 5e-04 | 2.7109 | 6.7471 | 17 | 210 | GTPase activity |
| GO:0000253 | 0.003 | 60.4841 | 0.0964 | 2 | 3 | 3-keto sterol reductase activity |
| GO:0008092 | 0.0045 | 1.6275 | 25.157 | 39 | 783 | cytoskeletal protein binding |
| GO:0043522 | 0.0045 | 11.3581 | 0.3534 | 3 | 11 | leucine zipper domain binding |
| GO:0034604 | 0.0059 | 30.2401 | 0.1285 | 2 | 4 | pyruvate dehydrogenase (NAD+) activity |
| GO:0098518 | 0.0059 | 30.2401 | 0.1285 | 2 | 4 | polynucleotide phosphatase activity |
| GO:0016462 | 0.006 | 1.6148 | 24.0004 | 37 | 747 | pyrophosphatase activity |
| GO:0016817 | 0.0066 | 1.6053 | 24.1289 | 37 | 751 | hydrolase activity, acting on acid anhydrides |
| GO:0004738 | 0.0097 | 20.1587 | 0.1606 | 2 | 5 | pyruvate dehydrogenase activity |
| GO:0016796 | 0.0097 | 4.2157 | 1.3173 | 5 | 41 | exonuclease activity, active with either ribo- or deoxyribonucleic acids and producing 5'-phosphomonoesters |
| GOMFID | Pvalue | OddsRatio | ExpCount | Count | Size | Term |
| GO:0016417 | 0.001 | 7.5915 | 0.7921 | 5 | 27 | S-acyltransferase activity |
| GO:0005005 | 0.0018 | 16.646 | 0.264 | 3 | 9 | transmembrane-ephrin receptor activity |
| GO:0000064 | 0.0025 | 66.4609 | 0.088 | 2 | 3 | L-ornithine transmembrane transporter activity |
| GO:0015181 | 0.0025 | 66.4609 | 0.088 | 2 | 3 | arginine transmembrane transporter activity |
| GO:0015189 | 0.0025 | 66.4609 | 0.088 | 2 | 3 | L-lysine transmembrane transporter activity |
| GO:0047844 | 0.0025 | 66.4609 | 0.088 | 2 | 3 | deoxycytidine deaminase activity |
| GO:0016779 | 0.003 | 3.0248 | 3.5496 | 10 | 121 | nucleotidyltransferase activity |
| GO:0019706 | 0.0042 | 7.0182 | 0.6747 | 4 | 23 | protein-cysteine S-palmitoyltransferase activity |
| GO:0003954 | 0.0043 | 5.2157 | 1.0854 | 5 | 37 | NADH dehydrogenase activity |
| GO:0008137 | 0.0043 | 5.2157 | 1.0854 | 5 | 37 | NADH dehydrogenase (ubiquinone) activity |
| GO:0004661 | 0.005 | 33.2283 | 0.1173 | 2 | 4 | protein geranylgeranyltransferase activity |
| GO:0005294 | 0.005 | 33.2283 | 0.1173 | 2 | 4 | neutral L-amino acid secondary active transmembrane transporter activity |
| GO:0034604 | 0.005 | 33.2283 | 0.1173 | 2 | 4 | pyruvate dehydrogenase (NAD+) activity |
| GO:0035259 | 0.0058 | 9.985 | 0.3814 | 3 | 13 | glucocorticoid receptor binding |
| GO:0015297 | 0.0064 | 3.4432 | 2.2001 | 7 | 75 | antiporter activity |
| GO:0008022 | 0.0069 | 2.3998 | 5.2803 | 12 | 180 | protein C-terminus binding |
| GO:0004659 | 0.0072 | 9.0766 | 0.4107 | 3 | 14 | prenyltransferase activity |
| GO:0004430 | 0.0081 | 22.1507 | 0.1467 | 2 | 5 | 1-phosphatidylinositol 4-kinase activity |
| GO:0004738 | 0.0081 | 22.1507 | 0.1467 | 2 | 5 | pyruvate dehydrogenase activity |
| GO:0045545 | 0.0081 | 22.1507 | 0.1467 | 2 | 5 | syndecan binding |
| GO:0004435 | 0.0086 | 5.5542 | 0.8214 | 4 | 28 | phosphatidylinositol phospholipase C activity |
| GOMFID | Pvalue | OddsRatio | ExpCount | Count | Size | Term |
| GO:0045502 | 7e-04 | 8.3045 | 0.7437 | 5 | 24 | dynein binding |
| GO:0032394 | 0.001 | Inf | 0.062 | 2 | 2 | MHC class Ib receptor activity |
| GO:0004813 | 0.0028 | 62.7984 | 0.093 | 2 | 3 | alanine-tRNA ligase activity |
| GO:0002161 | 0.0041 | 11.7936 | 0.3408 | 3 | 11 | aminoacyl-tRNA editing activity |
| GO:1904288 | 0.0055 | 31.3971 | 0.1239 | 2 | 4 | BAT3 complex binding |
| GO:0042393 | 0.0056 | 2.473 | 5.1437 | 12 | 166 | histone binding |
| GO:0042015 | 0.009 | 20.93 | 0.1549 | 2 | 5 | interleukin-20 binding |
| GOMFID | Pvalue | OddsRatio | ExpCount | Count | Size | Term |
| GO:0004372 | 8e-04 | Inf | 0.0574 | 2 | 2 | glycine hydroxymethyltransferase activity |
| GO:0008732 | 8e-04 | Inf | 0.0574 | 2 | 2 | L-allo-threonine aldolase activity |
| GO:0015501 | 8e-04 | Inf | 0.0574 | 2 | 2 | glutamate:sodium symporter activity |
| GO:0019172 | 8e-04 | Inf | 0.0574 | 2 | 2 | glyoxalase III activity |
| GO:0034235 | 0.0012 | 20.4347 | 0.2296 | 3 | 8 | GPI anchor binding |
| GO:0016832 | 0.0017 | 17.0278 | 0.2583 | 3 | 9 | aldehyde-lyase activity |
| GO:0015111 | 0.0024 | 67.9822 | 0.0861 | 2 | 3 | iodide transmembrane transporter activity |
| GO:0016829 | 0.0034 | 2.647 | 4.8216 | 12 | 168 | lyase activity |
| GO:0042134 | 0.0047 | 33.9889 | 0.1148 | 2 | 4 | rRNA primary transcript binding |
| GO:0070402 | 0.0054 | 10.214 | 0.3731 | 3 | 13 | NADPH binding |
| GO:0003923 | 0.0078 | 22.6578 | 0.1435 | 2 | 5 | GPI-anchor transamidase activity |
| GO:0030911 | 0.0078 | 22.6578 | 0.1435 | 2 | 5 | TPR domain binding |
| GO:0005416 | 0.0083 | 8.5106 | 0.4305 | 3 | 15 | cation:amino acid symporter activity |
| GO:0008536 | 0.009 | 5.4543 | 0.8323 | 4 | 29 | Ran GTPase binding |
| GOMFID | Pvalue | OddsRatio | ExpCount | Count | Size | Term |
| GO:0016206 | 0.001 | Inf | 0.0645 | 2 | 2 | catechol O-methyltransferase activity |
| GO:0031755 | 0.001 | Inf | 0.0645 | 2 | 2 | Edg-2 lysophosphatidic acid receptor binding |
| GO:0005102 | 0.002 | 1.5196 | 45.3842 | 65 | 1407 | receptor binding |
| GO:0004842 | 0.0023 | 2.0235 | 11.9992 | 23 | 372 | ubiquitin-protein transferase activity |
| GO:0042296 | 0.006 | 30.1166 | 0.129 | 2 | 4 | ISG15 transferase activity |
| GO:0042500 | 0.006 | 30.1166 | 0.129 | 2 | 4 | aspartic endopeptidase activity, intramembrane cleaving |
| GO:0019904 | 0.0065 | 1.6819 | 19.2891 | 31 | 598 | protein domain specific binding |
| GO:0015078 | 0.0091 | 2.922 | 2.9353 | 8 | 91 | hydrogen ion transmembrane transporter activity |
| GO:0005161 | 0.0093 | 8.225 | 0.4516 | 3 | 14 | platelet-derived growth factor receptor binding |
| GO:0042015 | 0.0097 | 20.0764 | 0.1613 | 2 | 5 | interleukin-20 binding |
| GOMFID | Pvalue | OddsRatio | ExpCount | Count | Size | Term |
| GO:0035257 | 0.0053 | 2.6204 | 4.4673 | 11 | 143 | nuclear hormone receptor binding |
| GO:0004427 | 0.0056 | 31.1327 | 0.125 | 2 | 4 | inorganic diphosphatase activity |
| GO:0034604 | 0.0056 | 31.1327 | 0.125 | 2 | 4 | pyruvate dehydrogenase (NAD+) activity |
| GO:0070579 | 0.0056 | 31.1327 | 0.125 | 2 | 4 | methylcytosine dioxygenase activity |
| GO:0004738 | 0.0091 | 20.7537 | 0.1562 | 2 | 5 | pyruvate dehydrogenase activity |
| GO:0005007 | 0.0091 | 20.7537 | 0.1562 | 2 | 5 | fibroblast growth factor-activated receptor activity |
| GO:0016417 | 0.0093 | 5.4291 | 0.8435 | 4 | 27 | S-acyltransferase activity |
| GOMFID | Pvalue | OddsRatio | ExpCount | Count | Size | Term |
| GO:0001730 | 0.0028 | 62.6653 | 0.0931 | 2 | 3 | 2'-5'-oligoadenylate synthetase activity |
| GO:0004813 | 0.0028 | 62.6653 | 0.0931 | 2 | 3 | alanine-tRNA ligase activity |
| GO:0035663 | 0.0028 | 62.6653 | 0.0931 | 2 | 3 | Toll-like receptor 2 binding |
| GO:0004842 | 0.003 | 2.0069 | 11.5504 | 22 | 372 | ubiquitin-protein transferase activity |
| GO:0043167 | 0.0032 | 1.2961 | 178.6904 | 208 | 5755 | ion binding |
| GO:0002161 | 0.0041 | 11.7685 | 0.3415 | 3 | 11 | aminoacyl-tRNA editing activity |
| GO:0017137 | 0.0042 | 3.3674 | 2.5771 | 8 | 83 | Rab GTPase binding |
| GO:0046872 | 0.0045 | 1.312 | 120.5966 | 146 | 3884 | metal ion binding |
| GO:0005534 | 0.0055 | 31.3306 | 0.1242 | 2 | 4 | galactose binding |
| GO:0061659 | 0.0059 | 2.3542 | 5.8373 | 13 | 188 | ubiquitin-like protein ligase activity |
| GO:0003725 | 0.0076 | 3.7789 | 1.7388 | 6 | 56 | double-stranded RNA binding |
| GO:0031628 | 0.009 | 20.8857 | 0.1552 | 2 | 5 | opioid receptor binding |
| GO:0042015 | 0.009 | 20.8857 | 0.1552 | 2 | 5 | interleukin-20 binding |
| GOMFID | Pvalue | OddsRatio | ExpCount | Count | Size | Term |
| GO:0004886 | 0.0025 | 67.0614 | 0.0872 | 2 | 3 | 9-cis retinoic acid receptor activity |
| GO:0035663 | 0.0025 | 67.0614 | 0.0872 | 2 | 3 | Toll-like receptor 2 binding |
| GO:0004713 | 0.0071 | 2.6442 | 4.0132 | 10 | 138 | protein tyrosine kinase activity |
| GO:0008135 | 0.0092 | 3.1917 | 2.3556 | 7 | 81 | translation factor activity, RNA binding |
| GO:0046966 | 0.0094 | 5.3801 | 0.8434 | 4 | 29 | thyroid hormone receptor binding |
| GOMFID | Pvalue | OddsRatio | ExpCount | Count | Size | Term |
| GO:0061631 | 2e-04 | 8.4877 | 0.8881 | 6 | 27 | ubiquitin conjugating enzyme activity |
| GO:0046977 | 0.0011 | 22.1752 | 0.2302 | 3 | 7 | TAP binding |
| GO:0044822 | 0.0019 | 1.5753 | 36.9366 | 55 | 1123 | poly(A) RNA binding |
| GO:0005515 | 0.0047 | 1.2894 | 331.0107 | 359 | 10118 | protein binding |
| GO:0004090 | 0.0062 | 29.5136 | 0.1316 | 2 | 4 | carbonyl reductase (NADPH) activity |
| GO:0004784 | 0.0062 | 29.5136 | 0.1316 | 2 | 4 | superoxide dismutase activity |
| GO:0042500 | 0.0062 | 29.5136 | 0.1316 | 2 | 4 | aspartic endopeptidase activity, intramembrane cleaving |
| GO:0061630 | 0.0076 | 2.2806 | 6.019 | 13 | 183 | ubiquitin protein ligase activity |
| GO:0044389 | 0.0087 | 2.0427 | 8.2227 | 16 | 250 | ubiquitin-like protein ligase binding |
| GO:0019787 | 0.0095 | 1.8015 | 12.7617 | 22 | 388 | ubiquitin-like protein transferase activity |
| GOMFID | Pvalue | OddsRatio | ExpCount | Count | Size | Term |
| GO:0003845 | 0.001 | Inf | 0.0648 | 2 | 2 | 11-beta-hydroxysteroid dehydrogenase [NAD(P)] activity |
| GO:0032394 | 0.001 | Inf | 0.0648 | 2 | 2 | MHC class Ib receptor activity |
| GO:0004693 | 0.0025 | 6.0253 | 0.9715 | 5 | 30 | cyclin-dependent protein serine/threonine kinase activity |
| GO:0035663 | 0.0031 | 59.9921 | 0.0971 | 2 | 3 | Toll-like receptor 2 binding |
| GO:0004713 | 0.0053 | 2.6231 | 4.4689 | 11 | 138 | protein tyrosine kinase activity |
| GO:0004563 | 0.0098 | 19.9948 | 0.1619 | 2 | 5 | beta-N-acetylhexosaminidase activity |
| GOMFID | Pvalue | OddsRatio | ExpCount | Count | Size | Term |
| GO:0050998 | 0.0024 | 8.4756 | 0.5909 | 4 | 18 | nitric-oxide synthase binding |
| GO:0003976 | 0.0032 | 59.1495 | 0.0985 | 2 | 3 | UDP-N-acetylglucosamine-lysosomal-enzyme N-acetylglucosaminephosphotransferase activity |
| GO:0050567 | 0.0032 | 59.1495 | 0.0985 | 2 | 3 | glutaminyl-tRNA synthase (glutamine-hydrolyzing) activity |
| GO:0042500 | 0.0062 | 29.5728 | 0.1313 | 2 | 4 | aspartic endopeptidase activity, intramembrane cleaving |
| GOMFID | Pvalue | OddsRatio | ExpCount | Count | Size | Term |
| GO:0016874 | 0.0019 | 2.0513 | 11.8471 | 23 | 380 | ligase activity |
| GO:0000064 | 0.0028 | 62.4008 | 0.0935 | 2 | 3 | L-ornithine transmembrane transporter activity |
| GO:0061630 | 0.0049 | 2.4138 | 5.7053 | 13 | 183 | ubiquitin protein ligase activity |
| GO:0019787 | 0.0052 | 1.9086 | 12.0965 | 22 | 388 | ubiquitin-like protein transferase activity |
| GO:1990381 | 0.0054 | 10.416 | 0.3741 | 3 | 12 | ubiquitin-specific protease binding |
| GO:0015016 | 0.0056 | 31.1984 | 0.1247 | 2 | 4 | [heparan sulfate]-glucosamine N-sulfotransferase activity |
| GO:0030619 | 0.0056 | 31.1984 | 0.1247 | 2 | 4 | U1 snRNA binding |
| GO:0035259 | 0.0068 | 9.3738 | 0.4053 | 3 | 13 | glucocorticoid receptor binding |
| GO:0005488 | 0.0089 | 1.3962 | 414.2433 | 433 | 13287 | binding |
| GO:0005111 | 0.0091 | 20.7975 | 0.1559 | 2 | 5 | type 2 fibroblast growth factor receptor binding |
| GOMFID | Pvalue | OddsRatio | ExpCount | Count | Size | Term |
| GO:0004090 | 2e-04 | 86.1226 | 0.1354 | 3 | 4 | carbonyl reductase (NADPH) activity |
| GO:0004693 | 0.0031 | 5.7542 | 1.0153 | 5 | 30 | cyclin-dependent protein serine/threonine kinase activity |
| GO:0000253 | 0.0034 | 57.307 | 0.1015 | 2 | 3 | 3-keto sterol reductase activity |
| GO:0004937 | 0.0034 | 57.307 | 0.1015 | 2 | 3 | alpha1-adrenergic receptor activity |
| GO:0035663 | 0.0034 | 57.307 | 0.1015 | 2 | 3 | Toll-like receptor 2 binding |
| GO:0043398 | 0.0034 | 57.307 | 0.1015 | 2 | 3 | HLH domain binding |
| GO:0097322 | 0.0034 | 57.307 | 0.1015 | 2 | 3 | 7SK snRNA binding |
| GO:0004861 | 0.0067 | 9.5642 | 0.4061 | 3 | 12 | cyclin-dependent protein serine/threonine kinase inhibitor activity |
| GO:0070566 | 0.0069 | 6.048 | 0.7784 | 4 | 23 | adenylyltransferase activity |
| GO:0046872 | 0.0077 | 1.2751 | 131.4478 | 156 | 3884 | metal ion binding |
| GOMFID | Pvalue | OddsRatio | ExpCount | Count | Size | Term |
| GO:0016788 | 0.0018 | 1.7485 | 22.3255 | 37 | 671 | hydrolase activity, acting on ester bonds |
| GO:0030943 | 0.0032 | 58.3295 | 0.0998 | 2 | 3 | mitochondrion targeting sequence binding |
| GO:0022884 | 0.0046 | 6.8814 | 0.6987 | 4 | 21 | macromolecule transmembrane transporter activity |
| GO:0015266 | 0.0049 | 10.9527 | 0.366 | 3 | 11 | protein channel activity |
| GO:0043522 | 0.0049 | 10.9527 | 0.366 | 3 | 11 | leucine zipper domain binding |
| GO:0016763 | 0.0061 | 3.9964 | 1.6636 | 6 | 50 | transferase activity, transferring pentosyl groups |
| GO:0017162 | 0.0063 | 29.1628 | 0.1331 | 2 | 4 | aryl hydrocarbon receptor binding |
| GO:0004114 | 0.0076 | 5.8481 | 0.7985 | 4 | 24 | 3',5'-cyclic-nucleotide phosphodiesterase activity |
| GO:0008081 | 0.0078 | 3.0107 | 2.8614 | 8 | 86 | phosphoric diester hydrolase activity |
| GOMFID | Pvalue | OddsRatio | ExpCount | Count | Size | Term |
| GO:0042284 | 0.0011 | Inf | 0.0676 | 2 | 2 | sphingolipid delta-4 desaturase activity |
| GO:0004937 | 0.0033 | 57.4189 | 0.1013 | 2 | 3 | alpha1-adrenergic receptor activity |
| GO:0005488 | 0.0048 | 1.4195 | 448.8338 | 470 | 13287 | binding |
| GO:1990381 | 0.0067 | 9.5829 | 0.4054 | 3 | 12 | ubiquitin-specific protease binding |
| GO:0046872 | 0.0072 | 1.2786 | 131.2012 | 156 | 3884 | metal ion binding |
| GO:0008092 | 0.0099 | 1.5389 | 26.4497 | 39 | 783 | cytoskeletal protein binding |
| GOMFID | Pvalue | OddsRatio | ExpCount | Count | Size | Term |
| GO:0004579 | 0.0016 | 18.1393 | 0.2575 | 3 | 8 | dolichyl-diphosphooligosaccharide-protein glycotransferase activity |
| GO:0005522 | 0.0034 | 12.9549 | 0.3219 | 3 | 10 | profilin binding |
| GO:0005515 | 0.0053 | 1.2884 | 321.8188 | 349 | 10101 | protein binding |
| GO:0003906 | 0.0059 | 10.0747 | 0.3863 | 3 | 12 | DNA-(apurinic or apyrimidinic site) lyase activity |
| GO:0000702 | 0.0059 | 30.1782 | 0.1288 | 2 | 4 | oxidized base lesion DNA N-glycosylase activity |
| GO:0004594 | 0.0059 | 30.1782 | 0.1288 | 2 | 4 | pantothenate kinase activity |
| GO:0005534 | 0.0059 | 30.1782 | 0.1288 | 2 | 4 | galactose binding |
| GO:0017162 | 0.0059 | 30.1782 | 0.1288 | 2 | 4 | aryl hydrocarbon receptor binding |
| GO:0032357 | 0.0059 | 30.1782 | 0.1288 | 2 | 4 | oxidized purine DNA binding |
| GO:0031625 | 0.0062 | 2.1269 | 7.9194 | 16 | 246 | ubiquitin protein ligase binding |
| GO:0031996 | 0.0075 | 9.0667 | 0.4185 | 3 | 13 | thioesterase binding |
| GO:0044183 | 0.0093 | 8.2419 | 0.4507 | 3 | 14 | protein binding involved in protein folding |
| GO:0035197 | 0.0097 | 20.1175 | 0.161 | 2 | 5 | siRNA binding |
| GOMFID | Pvalue | OddsRatio | ExpCount | Count | Size | Term |
| GO:0003954 | 8e-04 | 6.263 | 1.1206 | 6 | 37 | NADH dehydrogenase activity |
| GO:0008137 | 8e-04 | 6.263 | 1.1206 | 6 | 37 | NADH dehydrogenase (ubiquinone) activity |
| GO:0033906 | 9e-04 | Inf | 0.0606 | 2 | 2 | hyaluronoglucuronidase activity |
| GO:0008157 | 0.0027 | 8.0634 | 0.6058 | 4 | 20 | protein phosphatase 1 binding |
| GO:0050840 | 0.0035 | 4.5116 | 1.4841 | 6 | 49 | extracellular matrix binding |
| GO:0016655 | 0.0042 | 4.3105 | 1.5447 | 6 | 51 | oxidoreductase activity, acting on NAD(P)H, quinone or similar compound as acceptor |
| GO:0000386 | 0.0053 | 32.1474 | 0.1212 | 2 | 4 | second spliceosomal transesterification activity |
| GO:0017176 | 0.0053 | 32.1474 | 0.1212 | 2 | 4 | phosphatidylinositol N-acetylglucosaminyltransferase activity |
| GO:0015057 | 0.0086 | 21.4302 | 0.1514 | 2 | 5 | thrombin receptor activity |
| GO:0019238 | 0.0086 | 21.4302 | 0.1514 | 2 | 5 | cyclohydrolase activity |
| GOMFID | Pvalue | OddsRatio | ExpCount | Count | Size | Term |
| GO:0000166 | 8e-04 | 1.4926 | 64.4043 | 89 | 2186 | nucleotide binding |
| GO:0043168 | 0.0022 | 1.4148 | 73.7439 | 97 | 2503 | anion binding |
| GO:0047374 | 0.0025 | 66.1645 | 0.0884 | 2 | 3 | methylumbelliferyl-acetate deacetylase activity |
| GO:0072345 | 0.0025 | 66.1645 | 0.0884 | 2 | 3 | NAADP-sensitive calcium-release channel activity |
| GO:0035254 | 0.003 | 5.7306 | 1.0017 | 5 | 34 | glutamate receptor binding |
| GO:0032555 | 0.0032 | 1.464 | 51.5588 | 71 | 1750 | purine ribonucleotide binding |
| GO:0032549 | 0.0032 | 1.4662 | 50.7339 | 70 | 1722 | ribonucleoside binding |
| GO:0003950 | 0.0036 | 7.3754 | 0.6482 | 4 | 22 | NAD+ ADP-ribosyltransferase activity |
| GO:0001883 | 0.0049 | 1.4406 | 50.7339 | 69 | 1722 | purine nucleoside binding |
| GO:0001025 | 0.005 | 33.0801 | 0.1178 | 2 | 4 | RNA polymerase III transcription factor binding |
| GO:0045505 | 0.005 | 33.0801 | 0.1178 | 2 | 4 | dynein intermediate chain binding |
| GO:0051219 | 0.0059 | 3.9917 | 1.6499 | 6 | 56 | phosphoprotein binding |
| GO:0005525 | 0.0061 | 1.9841 | 10.0466 | 19 | 341 | GTP binding |
| GO:0004364 | 0.0066 | 6.0328 | 0.766 | 4 | 26 | glutathione transferase activity |
| GO:0016597 | 0.0069 | 3.0647 | 2.7989 | 8 | 95 | amino acid binding |
| GO:1901363 | 0.0071 | 1.2741 | 161.4823 | 187 | 5481 | heterocyclic compound binding |
| GO:0097159 | 0.0079 | 1.2686 | 163.8098 | 189 | 5560 | organic cyclic compound binding |
| GO:0016788 | 0.0091 | 1.6383 | 19.7691 | 31 | 671 | hydrolase activity, acting on ester bonds |
| GOMFID | Pvalue | OddsRatio | ExpCount | Count | Size | Term |
| GO:0004579 | 3e-04 | 35.04 | 0.1361 | 3 | 8 | dolichyl-diphosphooligosaccharide-protein glycotransferase activity |
| GO:0004095 | 0.0017 | 58.1917 | 0.0681 | 2 | 4 | carnitine O-palmitoyltransferase activity |
| GO:0008745 | 0.0017 | 58.1917 | 0.0681 | 2 | 4 | N-acetylmuramoyl-L-alanine amidase activity |
| GO:0016019 | 0.0028 | 38.792 | 0.0851 | 2 | 5 | peptidoglycan receptor activity |
| GO:0042609 | 0.0028 | 38.792 | 0.0851 | 2 | 5 | CD4 receptor binding |
| GO:0046912 | 0.0028 | 38.792 | 0.0851 | 2 | 5 | transferase activity, transferring acyl groups, acyl groups converted into alkyl on transfer |
| GO:0031726 | 0.0041 | 29.0921 | 0.1021 | 2 | 6 | CCR1 chemokine receptor binding |
| GO:0031730 | 0.0041 | 29.0921 | 0.1021 | 2 | 6 | CCR5 chemokine receptor binding |
| GO:0004984 | 0.0049 | 2.3217 | 6.3473 | 14 | 373 | olfactory receptor activity |
| GO:0005319 | 0.0069 | 3.7892 | 1.6847 | 6 | 99 | lipid transporter activity |
| GO:0008009 | 0.0089 | 5.3158 | 0.8168 | 4 | 48 | chemokine activity |
| GOMFID | Pvalue | OddsRatio | ExpCount | Count | Size | Term |
| GO:0048038 | 0.0076 | 8.6107 | 0.4156 | 3 | 17 | quinone binding |
| GO:0036402 | 0.0084 | 20.0522 | 0.1467 | 2 | 6 | proteasome-activating ATPase activity |
| GOMFID | Pvalue | OddsRatio | ExpCount | Count | Size | Term |
| GO:0004372 | 8e-04 | Inf | 0.058 | 2 | 2 | glycine hydroxymethyltransferase activity |
| GO:0008732 | 8e-04 | Inf | 0.058 | 2 | 2 | L-allo-threonine aldolase activity |
| GO:0031014 | 0.0048 | 33.6044 | 0.1161 | 2 | 4 | troponin T binding |
| GO:0042975 | 0.0056 | 10.0982 | 0.3772 | 3 | 13 | peroxisome proliferator activated receptor binding |
| GO:0016896 | 0.0072 | 5.862 | 0.7835 | 4 | 27 | exoribonuclease activity, producing 5'-phosphomonoesters |
| GO:0004301 | 0.0079 | 22.4015 | 0.1451 | 2 | 5 | epoxide hydrolase activity |
| GO:0004568 | 0.0079 | 22.4015 | 0.1451 | 2 | 5 | chitinase activity |
| GO:0031698 | 0.0079 | 22.4015 | 0.1451 | 2 | 5 | beta-2 adrenergic receptor binding |
| GO:0070006 | 0.0085 | 8.4141 | 0.4353 | 3 | 15 | metalloaminopeptidase activity |
| GO:0016782 | 0.009 | 3.6196 | 1.7991 | 6 | 62 | transferase activity, transferring sulfur-containing groups |
| GO:0031492 | 0.0094 | 5.3923 | 0.8415 | 4 | 29 | nucleosomal DNA binding |
| GOMFID | Pvalue | OddsRatio | ExpCount | Count | Size | Term |
| GO:0003676 | 0.0049 | 1.3186 | 111.5642 | 136 | 3699 | nucleic acid binding |
| GO:0046624 | 0.0085 | 21.5236 | 0.1508 | 2 | 5 | sphingolipid transporter activity |
| GO:1990050 | 0.0085 | 21.5236 | 0.1508 | 2 | 5 | phosphatidic acid transporter activity |
| GOMFID | Pvalue | OddsRatio | ExpCount | Count | Size | Term |
| GO:0001025 | 2e-04 | 80.6018 | 0.1443 | 3 | 4 | RNA polymerase III transcription factor binding |
| GO:0004693 | 6e-04 | 6.7424 | 1.082 | 6 | 30 | cyclin-dependent protein serine/threonine kinase activity |
| GO:0015450 | 0.0023 | 16.1161 | 0.2885 | 3 | 8 | P-P-bond-hydrolysis-driven protein transmembrane transporter activity |
| GO:0031593 | 0.0029 | 4.7562 | 1.4426 | 6 | 40 | polyubiquitin binding |
| GO:0043021 | 0.0032 | 3.2428 | 3.0295 | 9 | 84 | ribonucleoprotein complex binding |
| GO:0050816 | 0.0038 | 53.6396 | 0.1082 | 2 | 3 | phosphothreonine binding |
| GO:0022884 | 0.0061 | 6.3262 | 0.7574 | 4 | 21 | macromolecule transmembrane transporter activity |
| GO:0004016 | 0.0062 | 10.0706 | 0.3967 | 3 | 11 | adenylate cyclase activity |
| GO:0001601 | 0.0074 | 26.818 | 0.1443 | 2 | 4 | peptide YY receptor activity |
| GO:0001602 | 0.0074 | 26.818 | 0.1443 | 2 | 4 | pancreatic polypeptide receptor activity |
| GO:0019894 | 0.008 | 4.4852 | 1.2623 | 5 | 35 | kinesin binding |
| GOMFID | Pvalue | OddsRatio | ExpCount | Count | Size | Term |
| GO:0016748 | 0.0011 | Inf | 0.0674 | 2 | 2 | succinyltransferase activity |
| GO:0004647 | 0.0033 | 57.5312 | 0.1011 | 2 | 3 | phosphoserine phosphatase activity |
| GO:0009922 | 0.0033 | 57.5312 | 0.1011 | 2 | 3 | fatty acid elongase activity |
| GO:0030628 | 0.0033 | 57.5312 | 0.1011 | 2 | 3 | pre-mRNA 3'-splice site binding |
| GO:0043262 | 0.0033 | 57.5312 | 0.1011 | 2 | 3 | adenosine-diphosphatase activity |
| GO:0001601 | 0.0065 | 28.7637 | 0.1349 | 2 | 4 | peptide YY receptor activity |
| GO:0001602 | 0.0065 | 28.7637 | 0.1349 | 2 | 4 | pancreatic polypeptide receptor activity |
| GO:0070300 | 0.0067 | 9.6016 | 0.4046 | 3 | 12 | phosphatidic acid binding |
| GO:0008266 | 0.0085 | 8.6409 | 0.4383 | 3 | 13 | poly(U) RNA binding |
| GO:0035259 | 0.0085 | 8.6409 | 0.4383 | 3 | 13 | glucocorticoid receptor binding |
| GOMFID | Pvalue | OddsRatio | ExpCount | Count | Size | Term |
| GO:0005149 | 8e-04 | 12.0473 | 0.4429 | 4 | 15 | interleukin-1 receptor binding |
| GO:0016410 | 0.0013 | 3.7044 | 2.6573 | 9 | 90 | N-acyltransferase activity |
| GO:0034212 | 0.0014 | 4.6567 | 1.683 | 7 | 57 | peptide N-acetyltransferase activity |
| GO:0050998 | 0.0017 | 9.4639 | 0.5315 | 4 | 18 | nitric-oxide synthase binding |
| GO:0004465 | 0.0026 | 66.0173 | 0.0886 | 2 | 3 | lipoprotein lipase activity |
| GO:0004614 | 0.0026 | 66.0173 | 0.0886 | 2 | 3 | phosphoglucomutase activity |
| GO:0043027 | 0.0036 | 7.3589 | 0.6496 | 4 | 22 | cysteine-type endopeptidase inhibitor activity involved in apoptotic process |
| GO:0003854 | 0.005 | 33.0065 | 0.1181 | 2 | 4 | 3-beta-hydroxy-delta5-steroid dehydrogenase activity |
| GO:0016407 | 0.0051 | 3.2453 | 2.6573 | 8 | 90 | acetyltransferase activity |
| GO:0016866 | 0.0058 | 6.3064 | 0.7381 | 4 | 25 | intramolecular transferase activity |
| GO:0031402 | 0.0073 | 9.0159 | 0.4134 | 3 | 14 | sodium ion binding |
| GO:0004563 | 0.0082 | 22.0029 | 0.1476 | 2 | 5 | beta-N-acetylhexosaminidase activity |
| GO:0046870 | 0.0082 | 22.0029 | 0.1476 | 2 | 5 | cadmium ion binding |
| GO:0032266 | 0.0099 | 5.296 | 0.8562 | 4 | 29 | phosphatidylinositol-3-phosphate binding |
| GOMFID | Pvalue | OddsRatio | ExpCount | Count | Size | Term |
| GO:0003980 | 0.0016 | Inf | 0.0792 | 2 | 2 | UDP-glucose:glycoprotein glucosyltransferase activity |
| GO:0003723 | 0.0033 | 1.4249 | 59.2342 | 80 | 1495 | RNA binding |
| GO:0008823 | 0.0046 | 48.6302 | 0.1189 | 2 | 3 | cupric reductase activity |
| GO:0052851 | 0.0046 | 48.6302 | 0.1189 | 2 | 3 | ferric-chelate reductase (NADPH) activity |
| GO:0034061 | 0.008 | 4.5168 | 1.2679 | 5 | 32 | DNA polymerase activity |
| GO:0030165 | 0.008 | 2.7872 | 3.4867 | 9 | 88 | PDZ domain binding |
| GO:0035586 | 0.0085 | 5.7336 | 0.8321 | 4 | 21 | purinergic receptor activity |
| GO:0004594 | 0.0089 | 24.3135 | 0.1585 | 2 | 4 | pantothenate kinase activity |
| GO:0017162 | 0.0089 | 24.3135 | 0.1585 | 2 | 4 | aryl hydrocarbon receptor binding |
| GO:0034604 | 0.0089 | 24.3135 | 0.1585 | 2 | 4 | pyruvate dehydrogenase (NAD+) activity |
| GOMFID | Pvalue | OddsRatio | ExpCount | Count | Size | Term |
| GO:0045296 | 0.0028 | 5.9516 | 0.9938 | 5 | 28 | cadherin binding |
| GO:0000309 | 0.0037 | 54.5386 | 0.1065 | 2 | 3 | nicotinamide-nucleotide adenylyltransferase activity |
| GO:0005483 | 0.0037 | 54.5386 | 0.1065 | 2 | 3 | soluble NSF attachment protein activity |
| GO:0008502 | 0.0037 | 54.5386 | 0.1065 | 2 | 3 | melatonin receptor activity |
| GO:0035374 | 0.0037 | 54.5386 | 0.1065 | 2 | 3 | chondroitin sulfate binding |
| GO:0043422 | 0.0044 | 11.7032 | 0.3549 | 3 | 10 | protein kinase B binding |
| GO:0004515 | 0.0072 | 27.2675 | 0.142 | 2 | 4 | nicotinate-nucleotide adenylyltransferase activity |
| GO:0005031 | 0.0081 | 5.7548 | 0.8164 | 4 | 23 | tumor necrosis factor-activated receptor activity |
| GO:0004114 | 0.0095 | 5.4667 | 0.8519 | 4 | 24 | 3',5'-cyclic-nucleotide phosphodiesterase activity |
| GO:0003723 | 0.0097 | 1.3828 | 53.064 | 70 | 1495 | RNA binding |
| GOMFID | Pvalue | OddsRatio | ExpCount | Count | Size | Term |
| GO:0034450 | 2e-04 | 19.0643 | 0.3227 | 4 | 11 | ubiquitin-ubiquitin ligase activity |
| GO:0044822 | 0.002 | 1.6076 | 32.9434 | 50 | 1123 | poly(A) RNA binding |
| GO:0005497 | 0.0025 | 66.4609 | 0.088 | 2 | 3 | androgen binding |
| GO:0003676 | 0.0044 | 1.3287 | 108.5109 | 133 | 3699 | nucleic acid binding |
| GO:0030983 | 0.0045 | 11.0951 | 0.352 | 3 | 12 | mismatched DNA binding |
| GO:0019784 | 0.005 | 33.2283 | 0.1173 | 2 | 4 | NEDD8-specific protease activity |
| GO:0031625 | 0.0062 | 2.1872 | 7.2165 | 15 | 246 | ubiquitin protein ligase binding |
| GO:0004468 | 0.0081 | 22.1507 | 0.1467 | 2 | 5 | lysine N-acetyltransferase activity, acting on acetyl phosphate as donor |
| GO:0008503 | 0.0081 | 22.1507 | 0.1467 | 2 | 5 | benzodiazepine receptor activity |
| GO:0070290 | 0.0081 | 22.1507 | 0.1467 | 2 | 5 | N-acylphosphatidylethanolamine-specific phospholipase D activity |
| GOMFID | Pvalue | OddsRatio | ExpCount | Count | Size | Term |
| GO:0051434 | 0.005 | 32.9332 | 0.1184 | 2 | 4 | BH3 domain binding |
| GO:0001665 | 0.0082 | 21.954 | 0.1479 | 2 | 5 | alpha-N-acetylgalactosaminide alpha-2,6-sialyltransferase activity |
| GOMFID | Pvalue | OddsRatio | ExpCount | Count | Size | Term |
| GO:0097153 | 2e-04 | 18.2821 | 0.336 | 4 | 11 | cysteine-type endopeptidase activity involved in apoptotic process |
| GO:0032394 | 9e-04 | Inf | 0.0611 | 2 | 2 | MHC class Ib receptor activity |
| GO:0004980 | 0.0027 | 63.7453 | 0.0916 | 2 | 3 | melanocyte-stimulating hormone receptor activity |
| GO:0016429 | 0.0027 | 63.7453 | 0.0916 | 2 | 3 | tRNA (adenine-N1-)-methyltransferase activity |
| GO:0016635 | 0.0027 | 63.7453 | 0.0916 | 2 | 3 | oxidoreductase activity, acting on the CH-CH group of donors, quinone or related compound as acceptor |
| GO:0004305 | 0.0054 | 31.8706 | 0.1222 | 2 | 4 | ethanolamine kinase activity |
| GO:0048039 | 0.0054 | 31.8706 | 0.1222 | 2 | 4 | ubiquinone binding |
| GO:0046934 | 0.0088 | 21.2457 | 0.1527 | 2 | 5 | phosphatidylinositol-4,5-bisphosphate 3-kinase activity |
| GOMFID | Pvalue | OddsRatio | ExpCount | Count | Size | Term |
| GO:0003723 | 0.003 | 1.4899 | 46.2293 | 65 | 1495 | RNA binding |
| GO:0071535 | 0.0055 | 31.4639 | 0.1237 | 2 | 4 | RING-like zinc finger domain binding |
| GO:0005515 | 0.0068 | 1.2817 | 313.0913 | 339 | 10125 | protein binding |
| GOMFID | Pvalue | OddsRatio | ExpCount | Count | Size | Term |
| GO:0004066 | 0.001 | Inf | 0.0639 | 2 | 2 | asparagine synthase (glutamine-hydrolyzing) activity |
| GO:0004464 | 0.001 | Inf | 0.0639 | 2 | 2 | leukotriene-C4 synthase activity |
| GO:0004602 | 0.0011 | 11.1022 | 0.4791 | 4 | 15 | glutathione peroxidase activity |
| GO:0043167 | 0.0016 | 1.3189 | 183.8063 | 216 | 5755 | ion binding |
| GO:0070567 | 0.0016 | 18.2892 | 0.2555 | 3 | 8 | cytidylyltransferase activity |
| GO:0019001 | 0.0058 | 1.9217 | 11.4659 | 21 | 359 | guanyl nucleotide binding |
| GO:0005525 | 0.0068 | 1.9253 | 10.891 | 20 | 341 | GTP binding |
| GO:0046624 | 0.0095 | 20.2834 | 0.1597 | 2 | 5 | sphingolipid transporter activity |
| GO:0046923 | 0.0095 | 20.2834 | 0.1597 | 2 | 5 | ER retention sequence binding |
| GOMFID | Pvalue | OddsRatio | ExpCount | Count | Size | Term |
| GO:0043167 | 1e-04 | 1.3918 | 198.4231 | 240 | 5755 | ion binding |
| GO:0046872 | 6e-04 | 1.3728 | 133.914 | 167 | 3884 | metal ion binding |
| GO:0070034 | 8e-04 | 12.531 | 0.4482 | 4 | 13 | telomerase RNA binding |
| GO:0030554 | 0.002 | 1.4934 | 49.6833 | 70 | 1441 | adenyl nucleotide binding |
| GO:0005524 | 0.0023 | 1.4923 | 48.2353 | 68 | 1399 | ATP binding |
| GO:0030158 | 0.0035 | 56.2107 | 0.1034 | 2 | 3 | protein xylosyltransferase activity |
| GO:0030276 | 0.0037 | 3.8808 | 1.9997 | 7 | 58 | clathrin binding |
| GO:0015016 | 0.0068 | 28.1035 | 0.1379 | 2 | 4 | [heparan sulfate]-glucosamine N-sulfotransferase activity |
| GO:0051787 | 0.0071 | 9.3809 | 0.4137 | 3 | 12 | misfolded protein binding |
| GO:0045502 | 0.0086 | 5.6349 | 0.8275 | 4 | 24 | dynein binding |
| GOMFID | Pvalue | OddsRatio | ExpCount | Count | Size | Term |
| GO:0005070 | 7e-04 | 5.3539 | 1.5041 | 7 | 47 | SH3/SH2 adaptor activity |
| GO:0004920 | 0.001 | Inf | 0.064 | 2 | 2 | interleukin-10 receptor activity |
| GO:0016748 | 0.001 | Inf | 0.064 | 2 | 2 | succinyltransferase activity |
| GO:0016838 | 0.001 | Inf | 0.064 | 2 | 2 | carbon-oxygen lyase activity, acting on phosphates |
| GO:0015450 | 0.0016 | 18.2515 | 0.256 | 3 | 8 | P-P-bond-hydrolysis-driven protein transmembrane transporter activity |
| GO:0051959 | 0.003 | 60.7331 | 0.096 | 2 | 3 | dynein light intermediate chain binding |
| GO:0071209 | 0.003 | 60.7331 | 0.096 | 2 | 3 | U7 snRNA binding |
| GO:0015266 | 0.0044 | 11.4049 | 0.352 | 3 | 11 | protein channel activity |
| GOMFID | Pvalue | OddsRatio | ExpCount | Count | Size | Term |
| GO:0031625 | 0 | 2.8131 | 8.5129 | 22 | 246 | ubiquitin protein ligase binding |
| GO:0045519 | 0.0012 | Inf | 0.0692 | 2 | 2 | interleukin-23 receptor binding |
| GO:0035184 | 0.0013 | 21.0332 | 0.2422 | 3 | 7 | histone threonine kinase activity |
| GO:0005515 | 0.0013 | 1.3334 | 345.0706 | 378 | 10059 | protein binding |
| GO:0061630 | 0.0018 | 2.533 | 6.3328 | 15 | 183 | ubiquitin protein ligase activity |
| GO:0003723 | 0.0024 | 1.4742 | 51.735 | 72 | 1495 | RNA binding |
| GO:0031749 | 0.0035 | 55.9963 | 0.1038 | 2 | 3 | D2 dopamine receptor binding |
| GO:2001070 | 0.0035 | 55.9963 | 0.1038 | 2 | 3 | starch binding |
| GO:0005487 | 0.0044 | 7.0185 | 0.6921 | 4 | 20 | nucleocytoplasmic transporter activity |
| GO:0050786 | 0.0055 | 10.5138 | 0.3807 | 3 | 11 | RAGE receptor binding |
| GO:0015379 | 0.0068 | 27.9963 | 0.1384 | 2 | 4 | potassium:chloride symporter activity |
| GO:0022820 | 0.0068 | 27.9963 | 0.1384 | 2 | 4 | potassium ion symporter activity |
| GO:0048185 | 0.0072 | 9.345 | 0.4153 | 3 | 12 | activin binding |
| GO:0030159 | 0.0074 | 5.9091 | 0.7959 | 4 | 23 | receptor signaling complex scaffold activity |
| GO:0019212 | 0.0076 | 4.532 | 1.2458 | 5 | 36 | phosphatase inhibitor activity |
| GO:0002039 | 0.0076 | 3.3399 | 2.284 | 7 | 66 | p53 binding |
| GO:0004860 | 0.0085 | 2.9654 | 2.9069 | 8 | 84 | protein kinase inhibitor activity |
| GO:0035591 | 0.009 | 3.23 | 2.3532 | 7 | 68 | signaling adaptor activity |
| GOMFID | Pvalue | OddsRatio | ExpCount | Count | Size | Term |
| GO:0016788 | 1e-04 | 2.0589 | 21.4308 | 41 | 671 | hydrolase activity, acting on ester bonds |
| GO:0016791 | 0.0019 | 2.3485 | 7.6884 | 17 | 242 | phosphatase activity |
| GO:0016668 | 0.0024 | 15.24 | 0.2874 | 3 | 9 | oxidoreductase activity, acting on a sulfur group of donors, NAD(P) as acceptor |
| GO:0071209 | 0.003 | 60.8583 | 0.0958 | 2 | 3 | U7 snRNA binding |
| GO:0005326 | 0.004 | 7.181 | 0.6707 | 4 | 21 | neurotransmitter transporter activity |
| GO:0008195 | 0.0044 | 11.4285 | 0.3513 | 3 | 11 | phosphatidate phosphatase activity |
| GO:0015095 | 0.0057 | 10.158 | 0.3833 | 3 | 12 | magnesium ion transmembrane transporter activity |
| GO:0004082 | 0.0059 | 30.4271 | 0.1278 | 2 | 4 | bisphosphoglycerate mutase activity |
| GO:0034604 | 0.0059 | 30.4271 | 0.1278 | 2 | 4 | pyruvate dehydrogenase (NAD+) activity |
| GO:0046538 | 0.0059 | 30.4271 | 0.1278 | 2 | 4 | 2,3-bisphosphoglycerate-dependent phosphoglycerate mutase activity |
| GO:0004083 | 0.0095 | 20.2834 | 0.1597 | 2 | 5 | bisphosphoglycerate 2-phosphatase activity |
| GO:0004738 | 0.0095 | 20.2834 | 0.1597 | 2 | 5 | pyruvate dehydrogenase activity |
| GO:0004994 | 0.0095 | 20.2834 | 0.1597 | 2 | 5 | somatostatin receptor activity |
| GO:0031694 | 0.0095 | 20.2834 | 0.1597 | 2 | 5 | alpha-2A adrenergic receptor binding |
| GO:0045545 | 0.0095 | 20.2834 | 0.1597 | 2 | 5 | syndecan binding |
| GO:0046923 | 0.0095 | 20.2834 | 0.1597 | 2 | 5 | ER retention sequence binding |
| GOMFID | Pvalue | OddsRatio | ExpCount | Count | Size | Term |
| GO:0061631 | 0.0017 | 6.6975 | 0.8932 | 5 | 27 | ubiquitin conjugating enzyme activity |
| GO:0072345 | 0.0032 | 58.6782 | 0.0992 | 2 | 3 | NAADP-sensitive calcium-release channel activity |
| GO:2001070 | 0.0032 | 58.6782 | 0.0992 | 2 | 3 | starch binding |
| GO:0005294 | 0.0063 | 29.3372 | 0.1323 | 2 | 4 | neutral L-amino acid secondary active transmembrane transporter activity |
| GO:0005488 | 0.0084 | 1.3851 | 439.5534 | 459 | 13287 | binding |
| GOMFID | Pvalue | OddsRatio | ExpCount | Count | Size | Term |
| GO:0004464 | 0.001 | Inf | 0.0622 | 2 | 2 | leukotriene-C4 synthase activity |
| GO:0050211 | 0.0028 | 62.5328 | 0.0933 | 2 | 3 | procollagen galactosyltransferase activity |
| GO:0016667 | 0.004 | 4.3867 | 1.5245 | 6 | 49 | oxidoreductase activity, acting on a sulfur group of donors |
| GO:0008519 | 0.0051 | 6.6017 | 0.7156 | 4 | 23 | ammonium transmembrane transporter activity |
| GO:0051879 | 0.0051 | 6.6017 | 0.7156 | 4 | 23 | Hsp90 protein binding |
| GO:0034604 | 0.0056 | 31.2643 | 0.1245 | 2 | 4 | pyruvate dehydrogenase (NAD+) activity |
| GO:0070579 | 0.0056 | 31.2643 | 0.1245 | 2 | 4 | methylcytosine dioxygenase activity |
| GO:0015101 | 0.0084 | 8.5391 | 0.4356 | 3 | 14 | organic cation transmembrane transporter activity |
| GO:0004738 | 0.0091 | 20.8415 | 0.1556 | 2 | 5 | pyruvate dehydrogenase activity |
| GO:0046624 | 0.0091 | 20.8415 | 0.1556 | 2 | 5 | sphingolipid transporter activity |
| GOMFID | Pvalue | OddsRatio | ExpCount | Count | Size | Term |
| GO:0004364 | 1e-04 | 10.0214 | 0.7644 | 6 | 26 | glutathione transferase activity |
| GO:0004827 | 9e-04 | Inf | 0.0588 | 2 | 2 | proline-tRNA ligase activity |
| GO:0017162 | 0.005 | 33.154 | 0.1176 | 2 | 4 | aryl hydrocarbon receptor binding |
| GO:0046934 | 0.0081 | 22.1012 | 0.147 | 2 | 5 | phosphatidylinositol-4,5-bisphosphate 3-kinase activity |
| GO:0016740 | 0.0088 | 1.3679 | 61.8842 | 80 | 2105 | transferase activity |
| GO:0016773 | 0.009 | 1.6395 | 19.7559 | 31 | 672 | phosphotransferase activity, alcohol group as acceptor |
| GOMFID | Pvalue | OddsRatio | ExpCount | Count | Size | Term |
| GO:0005031 | 7e-04 | 8.4764 | 0.736 | 5 | 23 | tumor necrosis factor-activated receptor activity |
| GO:0070097 | 0.001 | 22.8159 | 0.224 | 3 | 7 | delta-catenin binding |
| GO:0008375 | 0.0023 | 4.9521 | 1.3761 | 6 | 43 | acetylglucosaminyltransferase activity |
| GO:0016740 | 0.0033 | 1.4073 | 67.3643 | 89 | 2105 | transferase activity |
| GO:0001055 | 0.0033 | 13.0351 | 0.32 | 3 | 10 | RNA polymerase II activity |
| GO:0004842 | 0.0043 | 1.9424 | 11.9048 | 22 | 372 | ubiquitin-protein transferase activity |
| GO:0046624 | 0.0096 | 20.2417 | 0.16 | 2 | 5 | sphingolipid transporter activity |
| GO:0046912 | 0.0096 | 20.2417 | 0.16 | 2 | 5 | transferase activity, transferring acyl groups, acyl groups converted into alkyl on transfer |
| GO:0070324 | 0.0096 | 20.2417 | 0.16 | 2 | 5 | thyroid hormone binding |
| GOMFID | Pvalue | OddsRatio | ExpCount | Count | Size | Term |
| GO:0031625 | 0 | 3.0117 | 7.607 | 21 | 246 | ubiquitin protein ligase binding |
| GO:0004364 | 1e-04 | 9.5064 | 0.804 | 6 | 26 | glutathione transferase activity |
| GO:0004066 | 0.001 | Inf | 0.0618 | 2 | 2 | asparagine synthase (glutamine-hydrolyzing) activity |
| GO:1901363 | 0.0015 | 1.3287 | 169.4868 | 201 | 5481 | heterocyclic compound binding |
| GO:0003924 | 0.0023 | 2.4555 | 6.4937 | 15 | 210 | GTPase activity |
| GO:0097159 | 0.0024 | 1.3101 | 171.9296 | 202 | 5560 | organic cyclic compound binding |
| GO:0016817 | 0.0036 | 1.6753 | 23.2229 | 37 | 751 | hydrolase activity, acting on acid anhydrides |
| GO:0005525 | 0.0048 | 1.9934 | 10.5446 | 20 | 341 | GTP binding |
| GO:0003886 | 0.0055 | 31.4639 | 0.1237 | 2 | 4 | DNA (cytosine-5-)-methyltransferase activity |
| GO:0005237 | 0.0055 | 31.4639 | 0.1237 | 2 | 4 | inhibitory extracellular ligand-gated ion channel activity |
| GO:0034604 | 0.0055 | 31.4639 | 0.1237 | 2 | 4 | pyruvate dehydrogenase (NAD+) activity |
| GO:0043125 | 0.0055 | 31.4639 | 0.1237 | 2 | 4 | ErbB-3 class receptor binding |
| GO:0016462 | 0.0057 | 1.6336 | 23.0992 | 36 | 747 | pyrophosphatase activity |
| GO:0019001 | 0.0083 | 1.8853 | 11.1012 | 20 | 359 | guanyl nucleotide binding |
| GO:0004430 | 0.009 | 20.9746 | 0.1546 | 2 | 5 | 1-phosphatidylinositol 4-kinase activity |
| GO:0004738 | 0.009 | 20.9746 | 0.1546 | 2 | 5 | pyruvate dehydrogenase activity |
| GO:0005131 | 0.009 | 20.9746 | 0.1546 | 2 | 5 | growth hormone receptor binding |
| GO:0046912 | 0.009 | 20.9746 | 0.1546 | 2 | 5 | transferase activity, transferring acyl groups, acyl groups converted into alkyl on transfer |
| GO:0050815 | 0.009 | 20.9746 | 0.1546 | 2 | 5 | phosphoserine binding |
| GOMFID | Pvalue | OddsRatio | ExpCount | Count | Size | Term |
| GO:0008440 | 0.0011 | 22.1308 | 0.2307 | 3 | 7 | inositol-1,4,5-trisphosphate 3-kinase activity |
| GO:0030295 | 0.0015 | 4.6135 | 1.7136 | 7 | 52 | protein kinase activator activity |
| GO:0072542 | 0.0018 | 17.7035 | 0.2636 | 3 | 8 | protein phosphatase activator activity |
| GO:0019207 | 0.0023 | 2.5468 | 5.8659 | 14 | 178 | kinase regulator activity |
| GO:0031800 | 0.0032 | 58.913 | 0.0989 | 2 | 3 | type 3 metabotropic glutamate receptor binding |
| GO:0031997 | 0.0032 | 58.913 | 0.0989 | 2 | 3 | N-terminal myristoylation domain binding |
| GO:0071889 | 0.0037 | 7.3854 | 0.6591 | 4 | 20 | 14-3-3 protein binding |
| GO:0019145 | 0.0062 | 29.4545 | 0.1318 | 2 | 4 | aminobutyraldehyde dehydrogenase activity |
| GO:0047105 | 0.0062 | 29.4545 | 0.1318 | 2 | 4 | 4-trimethylammoniobutyraldehyde dehydrogenase activity |
| GO:0003676 | 0.0073 | 1.2864 | 121.8986 | 146 | 3699 | nucleic acid binding |
| GO:0017056 | 0.008 | 8.8488 | 0.4284 | 3 | 13 | structural constituent of nuclear pore |
| GO:0044822 | 0.008 | 1.4721 | 37.0079 | 52 | 1123 | poly(A) RNA binding |
| GO:0030554 | 0.0084 | 1.4151 | 47.4874 | 64 | 1441 | adenyl nucleotide binding |
| GO:0005524 | 0.0099 | 1.4097 | 46.1033 | 62 | 1399 | ATP binding |
| GOMFID | Pvalue | OddsRatio | ExpCount | Count | Size | Term |
| GO:0001729 | 0.001 | Inf | 0.0618 | 2 | 2 | ceramide kinase activity |
| GO:0047844 | 0.0028 | 62.932 | 0.0928 | 2 | 3 | deoxycytidine deaminase activity |
| GO:0005372 | 0.0052 | 10.5048 | 0.3711 | 3 | 12 | water transmembrane transporter activity |
| GO:0003954 | 0.0053 | 4.9371 | 1.1441 | 5 | 37 | NADH dehydrogenase activity |
| GO:0008137 | 0.0053 | 4.9371 | 1.1441 | 5 | 37 | NADH dehydrogenase (ubiquinone) activity |
| GO:0004974 | 0.0055 | 31.4639 | 0.1237 | 2 | 4 | leukotriene receptor activity |
| GO:0022857 | 0.0068 | 1.5556 | 28.2942 | 42 | 915 | transmembrane transporter activity |
| GO:0072509 | 0.008 | 2.4606 | 4.7312 | 11 | 153 | divalent inorganic cation transmembrane transporter activity |
| GO:0032559 | 0.0097 | 1.4203 | 44.343 | 60 | 1434 | adenyl ribonucleotide binding |
| GOMFID | Pvalue | OddsRatio | ExpCount | Count | Size | Term |
| GO:0043169 | 0.0027 | 1.4043 | 85.9723 | 109 | 3959 | cation binding |
| GO:0003958 | 0.0027 | 45.3088 | 0.0869 | 2 | 4 | NADPH-hemoprotein reductase activity |
| GO:0005509 | 0.0049 | 1.8407 | 14.2889 | 25 | 658 | calcium ion binding |
| GO:0045322 | 0.0067 | 22.6515 | 0.1303 | 2 | 6 | unmethylated CpG binding |
| GO:0004017 | 0.0092 | 18.12 | 0.152 | 2 | 7 | adenylate kinase activity |
| GOMFID | Pvalue | OddsRatio | ExpCount | Count | Size | Term |
| GO:0047429 | 0.0015 | 18.6747 | 0.2504 | 3 | 8 | nucleoside-triphosphate diphosphatase activity |
| GO:0030544 | 0.0019 | 6.5027 | 0.9078 | 5 | 29 | Hsp70 protein binding |
| GO:0008134 | 0.0026 | 1.8616 | 15.8396 | 28 | 506 | transcription factor binding |
| GO:0015403 | 0.0029 | 62.1385 | 0.0939 | 2 | 3 | thiamine uptake transmembrane transporter activity |
| GO:0044822 | 0.0029 | 1.5617 | 35.1539 | 52 | 1123 | poly(A) RNA binding |
| GO:0001540 | 0.0029 | 5.7791 | 1.0017 | 5 | 32 | beta-amyloid binding |
| GO:0019003 | 0.0037 | 4.4629 | 1.5026 | 6 | 48 | GDP binding |
| GO:0019213 | 0.0044 | 5.2001 | 1.0956 | 5 | 35 | deacetylase activity |
| GO:0004095 | 0.0056 | 31.0672 | 0.1252 | 2 | 4 | carnitine O-palmitoyltransferase activity |
| GO:0047961 | 0.0056 | 31.0672 | 0.1252 | 2 | 4 | glycine N-acyltransferase activity |
| GO:0008142 | 0.0092 | 20.7101 | 0.1565 | 2 | 5 | oxysterol binding |
| GOMFID | Pvalue | OddsRatio | ExpCount | Count | Size | Term |
| GO:0016504 | 5e-04 | 6.7681 | 1.0446 | 6 | 36 | peptidase activator activity |
| GO:0001850 | 8e-04 | Inf | 0.058 | 2 | 2 | complement component C3a binding |
| GO:0004348 | 8e-04 | Inf | 0.058 | 2 | 2 | glucosylceramidase activity |
| GO:0051747 | 8e-04 | Inf | 0.058 | 2 | 2 | cytosine C-5 DNA demethylase activity |
| GO:0015403 | 0.0025 | 67.2132 | 0.0871 | 2 | 3 | thiamine uptake transmembrane transporter activity |
| GO:0031871 | 0.0025 | 67.2132 | 0.0871 | 2 | 3 | proteinase activated receptor binding |
| GO:0043734 | 0.0025 | 67.2132 | 0.0871 | 2 | 3 | DNA-N1-methyladenine dioxygenase activity |
| GO:0032451 | 0.0041 | 5.2752 | 1.0737 | 5 | 37 | demethylase activity |
| GO:0047961 | 0.0048 | 33.6044 | 0.1161 | 2 | 4 | glycine N-acyltransferase activity |
| GO:0070051 | 0.0048 | 33.6044 | 0.1161 | 2 | 4 | fibrinogen binding |
| GO:0000979 | 0.005 | 4.1386 | 1.596 | 6 | 55 | RNA polymerase II core promoter sequence-specific DNA binding |
| GO:0043028 | 0.0051 | 4.9642 | 1.1317 | 5 | 39 | cysteine-type endopeptidase regulator activity involved in apoptotic process |
| GO:0004197 | 0.0056 | 3.5348 | 2.1473 | 7 | 74 | cysteine-type endopeptidase activity |
| GO:0042609 | 0.0079 | 22.4015 | 0.1451 | 2 | 5 | CD4 receptor binding |
| GO:0015238 | 0.0085 | 8.4141 | 0.4353 | 3 | 15 | drug transmembrane transporter activity |
| GO:0016903 | 0.0095 | 4.2179 | 1.3058 | 5 | 45 | oxidoreductase activity, acting on the aldehyde or oxo group of donors |
| GOMFID | Pvalue | OddsRatio | ExpCount | Count | Size | Term |
| GO:0015278 | 6e-04 | 13.1623 | 0.4067 | 4 | 15 | calcium-release channel activity |
| GO:0015349 | 0.0022 | 72.0988 | 0.0813 | 2 | 3 | thyroid hormone transmembrane transporter activity |
| GO:0016823 | 0.0022 | 72.0988 | 0.0813 | 2 | 3 | hydrolase activity, acting on acid carbon-carbon bonds, in ketonic substances |
| GO:0000979 | 0.0036 | 4.4422 | 1.4912 | 6 | 55 | RNA polymerase II core promoter sequence-specific DNA binding |
| GO:0000149 | 0.0041 | 3.0907 | 3.118 | 9 | 115 | SNARE binding |
| GO:0061631 | 0.0057 | 6.2901 | 0.732 | 4 | 27 | ubiquitin conjugating enzyme activity |
| GO:0046982 | 0.0059 | 1.8858 | 12.2279 | 22 | 451 | protein heterodimerization activity |
| GO:0070628 | 0.0085 | 8.3322 | 0.4338 | 3 | 16 | proteasome binding |
| GOMFID | Pvalue | OddsRatio | ExpCount | Count | Size | Term |
| GO:0050815 | 3e-04 | 48.6401 | 0.1505 | 3 | 5 | phosphoserine binding |
| GO:0044822 | 4e-04 | 1.7086 | 33.7991 | 54 | 1123 | poly(A) RNA binding |
| GO:0001850 | 9e-04 | Inf | 0.0602 | 2 | 2 | complement component C3a binding |
| GO:0051219 | 0.0014 | 4.6577 | 1.6854 | 7 | 56 | phosphoprotein binding |
| GO:0008502 | 0.0027 | 64.7203 | 0.0903 | 2 | 3 | melatonin receptor activity |
| GO:0003676 | 0.0033 | 1.3368 | 111.3294 | 137 | 3699 | nucleic acid binding |
| GO:0015631 | 0.0048 | 2.1885 | 7.7049 | 16 | 256 | tubulin binding |
| GO:0005166 | 0.0052 | 32.3581 | 0.1204 | 2 | 4 | neurotrophin p75 receptor binding |
| GO:0003725 | 0.0065 | 3.9038 | 1.6854 | 6 | 56 | double-stranded RNA binding |
| GO:0003887 | 0.0072 | 5.9006 | 0.7825 | 4 | 26 | DNA-directed DNA polymerase activity |
| GO:0004568 | 0.0085 | 21.5706 | 0.1505 | 2 | 5 | chitinase activity |
| GO:0015085 | 0.0098 | 2.6683 | 3.5816 | 9 | 119 | calcium ion transmembrane transporter activity |
| GOMFID | Pvalue | OddsRatio | ExpCount | Count | Size | Term |
| GO:0015294 | 0.0045 | 3.3295 | 2.6014 | 8 | 85 | solute:cation symporter activity |
| GO:0008519 | 0.0048 | 6.7157 | 0.7039 | 4 | 23 | ammonium transmembrane transporter activity |
| GO:0009982 | 0.0051 | 10.618 | 0.3673 | 3 | 12 | pseudouridine synthase activity |
| GO:0008381 | 0.0054 | 31.8021 | 0.1224 | 2 | 4 | mechanically-gated ion channel activity |
| GO:0042500 | 0.0054 | 31.8021 | 0.1224 | 2 | 4 | aspartic endopeptidase activity, intramembrane cleaving |
| GO:0017056 | 0.0065 | 9.5555 | 0.3979 | 3 | 13 | structural constituent of nuclear pore |
| GO:0036442 | 0.0066 | 6.0753 | 0.7651 | 4 | 25 | hydrogen-exporting ATPase activity |
| GO:0015186 | 0.0088 | 21.2 | 0.153 | 2 | 5 | L-glutamine transmembrane transporter activity |
| GO:0005096 | 0.0089 | 2.0907 | 7.5289 | 15 | 246 | GTPase activator activity |
| GO:0031625 | 0.0089 | 2.0907 | 7.5289 | 15 | 246 | ubiquitin protein ligase binding |
| GO:0005525 | 0.009 | 1.9046 | 10.4363 | 19 | 341 | GTP binding |
| GOMFID | Pvalue | OddsRatio | ExpCount | Count | Size | Term |
| GO:0017162 | 2e-04 | 83.989 | 0.1387 | 3 | 4 | aryl hydrocarbon receptor binding |
| GO:0004471 | 0.0035 | 55.8897 | 0.104 | 2 | 3 | malate dehydrogenase (decarboxylating) (NAD+) activity |
| GO:0004477 | 0.0035 | 55.8897 | 0.104 | 2 | 3 | methenyltetrahydrofolate cyclohydrolase activity |
| GO:0004487 | 0.0035 | 55.8897 | 0.104 | 2 | 3 | methylenetetrahydrofolate dehydrogenase (NAD+) activity |
| GO:0004488 | 0.0035 | 55.8897 | 0.104 | 2 | 3 | methylenetetrahydrofolate dehydrogenase (NADP+) activity |
| GO:0005119 | 0.0035 | 55.8897 | 0.104 | 2 | 3 | smoothened binding |
| GO:0034584 | 0.0035 | 55.8897 | 0.104 | 2 | 3 | piRNA binding |
| GO:0097322 | 0.0035 | 55.8897 | 0.104 | 2 | 3 | 7SK snRNA binding |
| GO:0017080 | 0.004 | 5.3949 | 1.0747 | 5 | 31 | sodium channel regulator activity |
| GO:0005166 | 0.0069 | 27.943 | 0.1387 | 2 | 4 | neurotrophin p75 receptor binding |
| GO:0008948 | 0.0069 | 27.943 | 0.1387 | 2 | 4 | oxaloacetate decarboxylase activity |
| GO:0017150 | 0.0069 | 27.943 | 0.1387 | 2 | 4 | tRNA dihydrouridine synthase activity |
| GO:0005488 | 0.0072 | 1.3851 | 460.6452 | 481 | 13287 | binding |
| GO:0045309 | 0.0087 | 5.6026 | 0.8321 | 4 | 24 | protein phosphorylated amino acid binding |
| GO:0050839 | 0.0096 | 2.2094 | 6.2057 | 13 | 179 | cell adhesion molecule binding |
| GOMFID | Pvalue | OddsRatio | ExpCount | Count | Size | Term |
| GO:0001851 | 0.0013 | Inf | 0.0718 | 2 | 2 | complement component C3b binding |
| GO:0004483 | 0.0013 | Inf | 0.0718 | 2 | 2 | mRNA (nucleoside-2'-O-)-methyltransferase activity |
| GO:0070853 | 0.0013 | Inf | 0.0718 | 2 | 2 | myosin VI binding |
| GO:0016934 | 0.0038 | 53.9361 | 0.1076 | 2 | 3 | extracellular-glycine-gated chloride channel activity |
| GO:0050567 | 0.0038 | 53.9361 | 0.1076 | 2 | 3 | glutaminyl-tRNA synthase (glutamine-hydrolyzing) activity |
| GO:0001540 | 0.0053 | 5.0122 | 1.148 | 5 | 32 | beta-amyloid binding |
| GO:0016594 | 0.0061 | 10.1263 | 0.3946 | 3 | 11 | glycine binding |
| GO:0015016 | 0.0073 | 26.9663 | 0.1435 | 2 | 4 | [heparan sulfate]-glucosamine N-sulfotransferase activity |
| GO:0017162 | 0.0073 | 26.9663 | 0.1435 | 2 | 4 | aryl hydrocarbon receptor binding |
| GO:0042296 | 0.0073 | 26.9663 | 0.1435 | 2 | 4 | ISG15 transferase activity |
| GOMFID | Pvalue | OddsRatio | ExpCount | Count | Size | Term |
| GO:0016402 | 8e-04 | Inf | 0.0573 | 2 | 2 | pristanoyl-CoA oxidase activity |
| GO:0015485 | 0.0039 | 5.3482 | 1.0596 | 5 | 37 | cholesterol binding |
| GO:0004839 | 0.0047 | 34.0668 | 0.1145 | 2 | 4 | ubiquitin activating enzyme activity |
| GO:0070326 | 0.0047 | 34.0668 | 0.1145 | 2 | 4 | very-low-density lipoprotein particle receptor binding |
| GO:0070579 | 0.0047 | 34.0668 | 0.1145 | 2 | 4 | methylcytosine dioxygenase activity |
| GO:0043178 | 0.0052 | 3.2321 | 2.6632 | 8 | 93 | alcohol binding |
| GO:0016810 | 0.0072 | 2.8114 | 3.4078 | 9 | 119 | hydrolase activity, acting on carbon-nitrogen (but not peptide) bonds |
| GO:0004468 | 0.0077 | 22.7097 | 0.1432 | 2 | 5 | lysine N-acetyltransferase activity, acting on acetyl phosphate as donor |
| GO:0008467 | 0.0077 | 22.7097 | 0.1432 | 2 | 5 | [heparan sulfate]-glucosamine 3-sulfotransferase 1 activity |
| GO:0001784 | 0.0082 | 8.5301 | 0.4296 | 3 | 15 | phosphotyrosine binding |
| GO:0015238 | 0.0082 | 8.5301 | 0.4296 | 3 | 15 | drug transmembrane transporter activity |
| GO:0030296 | 0.0082 | 8.5301 | 0.4296 | 3 | 15 | protein tyrosine kinase activator activity |
| GO:0008234 | 0.0084 | 2.4424 | 4.7537 | 11 | 166 | cysteine-type peptidase activity |
| GO:0005126 | 0.0099 | 2.0624 | 7.6174 | 15 | 266 | cytokine receptor binding |
| GOMFID | Pvalue | OddsRatio | ExpCount | Count | Size | Term |
| GO:0019864 | 0.0038 | 11.8376 | 0.3307 | 3 | 12 | IgG binding |
| GO:0045569 | 0.0044 | 35.4468 | 0.1102 | 2 | 4 | TRAIL binding |
| GO:0005229 | 0.006 | 9.684 | 0.3858 | 3 | 14 | intracellular calcium activated chloride channel activity |
| GO:0004468 | 0.0072 | 23.6296 | 0.1378 | 2 | 5 | lysine N-acetyltransferase activity, acting on acetyl phosphate as donor |
| GO:0003697 | 0.009 | 3.2024 | 2.3424 | 7 | 85 | single-stranded DNA binding |
| GOMFID | Pvalue | OddsRatio | ExpCount | Count | Size | Term |
| GO:0017025 | 0.0028 | 8.0892 | 0.6105 | 4 | 19 | TBP-class protein binding |
| GO:0000309 | 0.003 | 60.4841 | 0.0964 | 2 | 3 | nicotinamide-nucleotide adenylyltransferase activity |
| GO:0003726 | 0.003 | 60.4841 | 0.0964 | 2 | 3 | double-stranded RNA adenosine deaminase activity |
| GO:0005119 | 0.003 | 60.4841 | 0.0964 | 2 | 3 | smoothened binding |
| GO:0097108 | 0.003 | 60.4841 | 0.0964 | 2 | 3 | hedgehog family protein binding |
| GO:0070888 | 0.0043 | 5.2357 | 1.0924 | 5 | 34 | E-box binding |
| GO:0046982 | 0.0059 | 1.8078 | 14.4902 | 25 | 451 | protein heterodimerization activity |
| GO:0001025 | 0.0059 | 30.2401 | 0.1285 | 2 | 4 | RNA polymerase III transcription factor binding |
| GO:0004515 | 0.0059 | 30.2401 | 0.1285 | 2 | 4 | nicotinate-nucleotide adenylyltransferase activity |
| GO:0005515 | 0.0075 | 1.2722 | 323.9863 | 350 | 10122 | protein binding |
| GO:0001047 | 0.0079 | 2.4685 | 4.723 | 11 | 147 | core promoter binding |
| GO:0003677 | 0.0079 | 1.3418 | 75.0213 | 95 | 2335 | DNA binding |
| GO:0008017 | 0.0082 | 2.2574 | 6.0724 | 13 | 189 | microtubule binding |
| GO:0070290 | 0.0097 | 20.1587 | 0.1606 | 2 | 5 | N-acylphosphatidylethanolamine-specific phospholipase D activity |
| GOMFID | Pvalue | OddsRatio | ExpCount | Count | Size | Term |
| GO:0019887 | 0.0024 | 2.7721 | 4.6225 | 12 | 160 | protein kinase regulator activity |
| GO:0003886 | 0.0048 | 33.7572 | 0.1156 | 2 | 4 | DNA (cytosine-5-)-methyltransferase activity |
| GO:0005534 | 0.0048 | 33.7572 | 0.1156 | 2 | 4 | galactose binding |
| GOMFID | Pvalue | OddsRatio | ExpCount | Count | Size | Term |
| GO:0005001 | 0.0019 | 9.1282 | 0.5581 | 4 | 17 | transmembrane receptor protein tyrosine phosphatase activity |
| GO:0016627 | 0.0023 | 4.2529 | 1.8383 | 7 | 56 | oxidoreductase activity, acting on the CH-CH group of donors |
| GO:0004616 | 0.0032 | 59.1495 | 0.0985 | 2 | 3 | phosphogluconate dehydrogenase (decarboxylating) activity |
| GO:0004647 | 0.0032 | 59.1495 | 0.0985 | 2 | 3 | phosphoserine phosphatase activity |
| GO:0000386 | 0.0062 | 29.5728 | 0.1313 | 2 | 4 | second spliceosomal transesterification activity |
| GO:0015184 | 0.0062 | 29.5728 | 0.1313 | 2 | 4 | L-cystine transmembrane transporter activity |
| GO:0016972 | 0.0062 | 29.5728 | 0.1313 | 2 | 4 | thiol oxidase activity |
| GO:0019899 | 0.0064 | 1.4079 | 53.9027 | 72 | 1642 | enzyme binding |
| GO:0016614 | 0.0077 | 2.6157 | 4.0706 | 10 | 124 | oxidoreductase activity, acting on CH-OH group of donors |
| GO:0050660 | 0.0079 | 3.3048 | 2.2979 | 7 | 70 | flavin adenine dinucleotide binding |
| GO:0019904 | 0.0083 | 1.6498 | 19.6308 | 31 | 598 | protein domain specific binding |
| GOMFID | Pvalue | OddsRatio | ExpCount | Count | Size | Term |
| GO:0047961 | 1e-04 | 88.8969 | 0.1313 | 3 | 4 | glycine N-acyltransferase activity |
| GO:0004385 | 0.0025 | 14.8113 | 0.2954 | 3 | 9 | guanylate kinase activity |
| GO:0017147 | 0.0027 | 5.9402 | 0.9848 | 5 | 30 | Wnt-protein binding |
| GO:0030235 | 0.0036 | 12.6946 | 0.3283 | 3 | 10 | nitric-oxide synthase regulator activity |
| GO:0022884 | 0.0044 | 6.9786 | 0.6894 | 4 | 21 | macromolecule transmembrane transporter activity |
| GO:0070300 | 0.0062 | 9.8722 | 0.3939 | 3 | 12 | phosphatidic acid binding |
| NA. |
| n/a |
| NA. |
| n/a |
| NA. |
| n/a |
| NA. |
| n/a |
| NA. |
| n/a |
| NA. |
| n/a |
| NA. |
| n/a |
| NA. |
| n/a |
| NA. |
| n/a |
| NA. |
| n/a |
| NA. |
| n/a |
| NA. |
| n/a |
| NA. |
| n/a |
| NA. |
| n/a |
| NA. |
| n/a |
| NA. |
| n/a |
| NA. |
| n/a |
| NA. |
| n/a |
| NA. |
| n/a |
| NA. |
| n/a |
| NA. |
| n/a |
| NA. |
| n/a |
| NA. |
| n/a |
| NA. |
| n/a |
| NA. |
| n/a |
| NA. |
| n/a |
| NA. |
| n/a |
| NA. |
| n/a |
| NA. |
| n/a |
| NA. |
| n/a |
| NA. |
| n/a |
| NA. |
| n/a |
| NA. |
| n/a |
| NA. |
| n/a |
| NA. |
| n/a |
| NA. |
| n/a |
| NA. |
| n/a |
| NA. |
| n/a |
| NA. |
| n/a |
| NA. |
| n/a |
| NA. |
| n/a |
| NA. |
| n/a |
| NA. |
| n/a |
| NA. |
| n/a |
| NA. |
| n/a |
| NA. |
| n/a |
| NA. |
| n/a |
| NA. |
| n/a |
| NA. |
| n/a |
| NA. |
| n/a |
| NA. |
| n/a |
| NA. |
| n/a |
| NA. |
| n/a |
| NA. |
| n/a |
| NA. |
| n/a |
| NA. |
| n/a |
| NA. |
| n/a |
| NA. |
| n/a |
| NA. |
| n/a |
| NA. |
| n/a |
| NA. |
| n/a |
| NA. |
| n/a |
| NA. |
| n/a |
| NA. |
| n/a |
| NA. |
| n/a |
| NA. |
| n/a |
| NA. |
| n/a |
| NA. |
| n/a |
| NA. |
| n/a |
| NA. |
| n/a |
| NA. |
| n/a |
| NA. |
| n/a |
| NA. |
| n/a |
| NA. |
| n/a |
| NA. |
| n/a |
| NA. |
| n/a |
| NA. |
| n/a |
| NA. |
| n/a |
| NA. |
| n/a |
| NA. |
| n/a |
| NA. |
| n/a |
| NA. |
| n/a |
| NA. |
| n/a |
| NA. |
| n/a |
| NA. |
| n/a |
| NA. |
| n/a |
| NA. |
| n/a |
| NA. |
| n/a |
| NA. |
| n/a |
| NA. |
| n/a |
| NA. |
| n/a |
| NA. |
| n/a |
| NA. |
| n/a |
| NA. |
| n/a |
| NA. |
| n/a |
| NA. |
| n/a |
| NA. |
| n/a |
| NA. |
| n/a |
| NA. |
| n/a |
| NA. |
| n/a |
| NA. |
| n/a |
| NA. |
| n/a |
| NA. |
| n/a |
| NA. |
| n/a |
| NA. |
| n/a |
| NA. |
| n/a |
| NA. |
| n/a |
| NA. |
| n/a |
| NA. |
| n/a |
| NA. |
| n/a |
| NA. |
| n/a |
| NA. |
| n/a |
| NA. |
| n/a |
| NA. |
| n/a |
| NA. |
| n/a |
| NA. |
| n/a |
| NA. |
| n/a |
| NA. |
| n/a |
| NA. |
| n/a |
| NA. |
| n/a |
| NA. |
| n/a |
| NA. |
| n/a |
| NA. |
| n/a |
| NA. |
| n/a |
| NA. |
| n/a |
| NA. |
| n/a |
| NA. |
| n/a |
| NA. |
| n/a |
| NA. |
| n/a |
| NA. |
| n/a |
| NA. |
| n/a |
| NA. |
| n/a |
| NA. |
| n/a |
| NA. |
| n/a |
| NA. |
| n/a |
| NA. |
| n/a |
| NA. |
| n/a |
| NA. |
| n/a |
| NA. |
| n/a |
| NA. |
| n/a |
| NA. |
| n/a |
| NA. |
| n/a |
| NA. |
| n/a |
| NA. |
| n/a |
| NA. |
| n/a |
| NA. |
| n/a |
| NA. |
| n/a |
| NA. |
| n/a |
| NA. |
| n/a |
| NA. |
| n/a |
| NA. |
| n/a |
| NA. |
| n/a |
| NA. |
| n/a |
| NA. |
| n/a |
| NA. |
| n/a |
| NA. |
| n/a |
| NA. |
| n/a |
| NA. |
| n/a |
| NA. |
| n/a |
| NA. |
| n/a |
| NA. |
| n/a |
| NA. |
| n/a |
| NA. |
| n/a |
| NA. |
| n/a |
| NA. |
| n/a |
| NA. |
| n/a |
| NA. |
| n/a |
| NA. |
| n/a |
| NA. |
| n/a |
| NA. |
| n/a |
| NA. |
| n/a |
| NA. |
| n/a |
| NA. |
| n/a |
| NA. |
| n/a |
| NA. |
| n/a |
| NA. |
| n/a |
| NA. |
| n/a |
| NA. |
| n/a |
| NA. |
| n/a |
| NA. |
| n/a |
| NA. |
| n/a |
| NA. |
| n/a |
| NA. |
| n/a |
| NA. |
| n/a |
| NA. |
| n/a |
| NA. |
| n/a |
| NA. |
| n/a |
| NA. |
| n/a |
| NA. |
| n/a |
| NA. |
| n/a |
| NA. |
| n/a |
| NA. |
| n/a |
| NA. |
| n/a |
| NA. |
| n/a |
| NA. |
| n/a |
| NA. |
| n/a |
| NA. |
| n/a |
| NA. |
| n/a |
| NA. |
| n/a |
| NA. |
| n/a |
| NA. |
| n/a |
| NA. |
| n/a |
| NA. |
| n/a |
| NA. |
| n/a |
| NA. |
| n/a |
| NA. |
| n/a |
| NA. |
| n/a |
| NA. |
| n/a |
| NA. |
| n/a |
| NA. |
| n/a |
| NA. |
| n/a |
| NA. |
| n/a |
| NA. |
| n/a |
| NA. |
| n/a |
| NA. |
| n/a |
| NA. |
| n/a |
| NA. |
| n/a |
| NA. |
| n/a |
| NA. |
| n/a |
| NA. |
| n/a |
| NA. |
| n/a |
| NA. |
| n/a |
| NA. |
| n/a |
| NA. |
| n/a |
| NA. |
| n/a |
| NA. |
| n/a |
| NA. |
| n/a |
| NA. |
| n/a |
| NA. |
| n/a |
| NA. |
| n/a |
| NA. |
| n/a |
| NA. |
| n/a |
| NA. |
| n/a |
| NA. |
| n/a |
| NA. |
| n/a |
| NA. |
| n/a |
| NA. |
| n/a |
| NA. |
| n/a |
| NA. |
| n/a |
| NA. |
| n/a |
| NA. |
| n/a |
| NA. |
| n/a |
| NA. |
| n/a |
| NA. |
| n/a |
| NA. |
| n/a |
| NA. |
| n/a |
| NA. |
| n/a |
| NA. |
| n/a |
| NA. |
| n/a |
| NA. |
| n/a |
| NA. |
| n/a |
| NA. |
| n/a |
| NA. |
| n/a |
| NA. |
| n/a |
| NA. |
| n/a |
| NA. |
| n/a |
| NA. |
| n/a |
| NA. |
| n/a |
| NA. |
| n/a |
| NA. |
| n/a |
| NA. |
| n/a |
| NA. |
| n/a |
| NA. |
| n/a |
| NA. |
| n/a |
| NA. |
| n/a |
| NA. |
| n/a |
| NA. |
| n/a |
| NA. |
| n/a |
| NA. |
| n/a |
| NA. |
| n/a |
| NA. |
| n/a |
| NA. |
| n/a |
| NA. |
| n/a |
| NA. |
| n/a |
| NA. |
| n/a |
| NA. |
| n/a |
| NA. |
| n/a |
| NA. |
| n/a |
| NA. |
| n/a |
| NA. |
| n/a |
| NA. |
| n/a |
| NA. |
| n/a |
| NA. |
| n/a |
| NA. |
| n/a |
| NA. |
| n/a |
| NA. |
| n/a |
| NA. |
| n/a |
| NA. |
| n/a |
| NA. |
| n/a |
| NA. |
| n/a |
| NA. |
| n/a |
| NA. |
| n/a |
| NA. |
| n/a |
| NA. |
| n/a |
| NA. |
| n/a |
| NA. |
| n/a |
| NA. |
| n/a |
| NA. |
| n/a |
| NA. |
| n/a |
| NA. |
| n/a |
| NA. |
| n/a |
| NA. |
| n/a |
| NA. |
| n/a |
| NA. |
| n/a |
| NA. |
| n/a |
| NA. |
| n/a |
| NA. |
| n/a |
| NA. |
| n/a |
| NA. |
| n/a |
| NA. |
| n/a |
| NA. |
| n/a |
| NA. |
| n/a |
| NA. |
| n/a |
| NA. |
| n/a |
| NA. |
| n/a |
| NA. |
| n/a |
| NA. |
| n/a |
| NA. |
| n/a |
| NA. |
| n/a |
| NA. |
| n/a |
| NA. |
| n/a |
| NA. |
| n/a |
| NA. |
| n/a |
| NA. |
| n/a |
| NA. |
| n/a |
| NA. |
| n/a |
| NA. |
| n/a |
| NA. |
| n/a |
| NA. |
| n/a |
| NA. |
| n/a |
| NA. |
| n/a |
| NA. |
| n/a |
| NA. |
| n/a |
| NA. |
| n/a |
| NA. |
| n/a |
| NA. |
| n/a |
| NA. |
| n/a |
| NA. |
| n/a |
| NA. |
| n/a |
| NA. |
| n/a |
| NA. |
| n/a |
| NA. |
| n/a |
| NA. |
| n/a |
| NA. |
| n/a |
| NA. |
| n/a |
| NA. |
| n/a |
| NA. |
| n/a |
| NA. |
| n/a |
| NA. |
| n/a |
| NA. |
| n/a |
| NA. |
| n/a |
| NA. |
| n/a |
| NA. |
| n/a |
| NA. |
| n/a |
| NA. |
| n/a |
| NA. |
| n/a |
| NA. |
| n/a |
| NA. |
| n/a |
| NA. |
| n/a |
| NA. |
| n/a |
| NA. |
| n/a |
| NA. |
| n/a |
| NA. |
| n/a |
| NA. |
| n/a |
| NA. |
| n/a |
| NA. |
| n/a |
| NA. |
| n/a |
| NA. |
| n/a |
| NA. |
| n/a |
| NA. |
| n/a |
| NA. |
| n/a |
| NA. |
| n/a |
| NA. |
| n/a |
| NA. |
| n/a |
| NA. |
| n/a |
| NA. |
| n/a |
| NA. |
| n/a |
| NA. |
| n/a |
| NA. |
| n/a |
| NA. |
| n/a |
| NA. |
| n/a |
| NA. |
| n/a |
| NA. |
| n/a |
| NA. |
| n/a |
| NA. |
| n/a |
| NA. |
| n/a |
| NA. |
| n/a |
| NA. |
| n/a |
| NA. |
| n/a |
| NA. |
| n/a |
| NA. |
| n/a |
| NA. |
| n/a |
| NA. |
| n/a |
| NA. |
| n/a |
| NA. |
| n/a |
| NA. |
| n/a |
| NA. |
| n/a |
| NA. |
| n/a |
| NA. |
| n/a |
| NA. |
| n/a |
| NA. |
| n/a |
| NA. |
| n/a |
| NA. |
| n/a |
| NA. |
| n/a |
| NA. |
| n/a |
| NA. |
| n/a |
| NA. |
| n/a |
| NA. |
| n/a |
| NA. |
| n/a |
| NA. |
| n/a |
| NA. |
| n/a |
| NA. |
| n/a |
| NA. |
| n/a |
| NA. |
| n/a |
| NA. |
| n/a |
| NA. |
| n/a |
| NA. |
| n/a |
| NA. |
| n/a |
| NA. |
| n/a |
| NA. |
| n/a |
| NA. |
| n/a |
| NA. |
| n/a |
| NA. |
| n/a |
| NA. |
| n/a |
| NA. |
| n/a |
| NA. |
| n/a |
| NA. |
| n/a |
| NA. |
| n/a |
| NA. |
| n/a |
| NA. |
| n/a |
| NA. |
| n/a |
| NA. |
| n/a |
| NA. |
| n/a |
| NA. |
| n/a |
| NA. |
| n/a |
| NA. |
| n/a |
| NA. |
| n/a |
| NA. |
| n/a |
| NA. |
| n/a |
| NA. |
| n/a |
| NA. |
| n/a |
| NA. |
| n/a |
| NA. |
| n/a |
| NA. |
| n/a |
| NA. |
| n/a |
| NA. |
| n/a |
| NA. |
| n/a |
| NA. |
| n/a |
| NA. |
| n/a |
| NA. |
| n/a |
| NA. |
| n/a |
| NA. |
| n/a |
| NA. |
| n/a |
| NA. |
| n/a |
| NA. |
| n/a |
| NA. |
| n/a |
| NA. |
| n/a |
| NA. |
| n/a |
| NA. |
| n/a |
| NA. |
| n/a |
| NA. |
| n/a |
| NA. |
| n/a |
| NA. |
| n/a |
| NA. |
| n/a |
| NA. |
| n/a |
| NA. |
| n/a |
| NA. |
| n/a |
| NA. |
| n/a |
| NA. |
| n/a |
| NA. |
| n/a |
| NA. |
| n/a |
| NA. |
| n/a |
| NA. |
| n/a |
| NA. |
| n/a |
| NA. |
| n/a |
| NA. |
| n/a |
| NA. |
| n/a |
| NA. |
| n/a |
| NA. |
| n/a |
| NA. |
| n/a |
| NA. |
| n/a |
| NA. |
| n/a |
| NA. |
| n/a |
| NA. |
| n/a |
| NA. |
| n/a |
| NA. |
| n/a |
| NA. |
| n/a |
| NA. |
| n/a |
| NA. |
| n/a |
| NA. |
| n/a |
| NA. |
| n/a |
| NA. |
| n/a |
| NA. |
| n/a |
| NA. |
| n/a |
| NA. |
| n/a |
| NA. |
| n/a |
| NA. |
| n/a |
| NA. |
| n/a |
| NA. |
| n/a |
| NA. |
| n/a |
| NA. |
| n/a |
| NA. |
| n/a |
| NA. |
| n/a |
| NA. |
| n/a |
| NA. |
| n/a |
| NA. |
| n/a |
| NA. |
| n/a |
| NA. |
| n/a |
| NA. |
| n/a |
| NA. |
| n/a |
| NA. |
| n/a |
| NA. |
| n/a |
| NA. |
| n/a |
| NA. |
| n/a |
| NA. |
| n/a |
| NA. |
| n/a |
| NA. |
| n/a |
| NA. |
| n/a |
| NA. |
| n/a |
| NA. |
| n/a |
| NA. |
| n/a |
| NA. |
| n/a |
| NA. |
| n/a |
| NA. |
| n/a |
| NA. |
| n/a |
| NA. |
| n/a |
| NA. |
| n/a |
| NA. |
| n/a |
| NA. |
| n/a |
| NA. |
| n/a |
| NA. |
| n/a |
| NA. |
| n/a |
| NA. |
| n/a |
| NA. |
| n/a |
| NA. |
| n/a |
| NA. |
| n/a |
| NA. |
| n/a |
| NA. |
| n/a |
| NA. |
| n/a |
| NA. |
| n/a |
| NA. |
| n/a |
| NA. |
| n/a |
| NA. |
| n/a |
| NA. |
| n/a |
| NA. |
| n/a |
| NA. |
| n/a |
| NA. |
| n/a |
| NA. |
| n/a |
| NA. |
| n/a |
| NA. |
| n/a |
| NA. |
| n/a |
| NA. |
| n/a |
| NA. |
| n/a |
| NA. |
| n/a |
| NA. |
| n/a |
| NA. |
| n/a |
| NA. |
| n/a |
| NA. |
| n/a |
| NA. |
| n/a |
| NA. |
| n/a |
| NA. |
| n/a |
| NA. |
| n/a |
| NA. |
| n/a |
| NA. |
| n/a |
| NA. |
| n/a |
| NA. |
| n/a |
| NA. |
| n/a |
| NA. |
| n/a |
| NA. |
| n/a |
| NA. |
| n/a |
| NA. |
| n/a |
| NA. |
| n/a |
| NA. |
| n/a |
| NA. |
| n/a |
| NA. |
| n/a |
| NA. |
| n/a |
| NA. |
| n/a |
| NA. |
| n/a |
| NA. |
| n/a |
| NA. |
| n/a |
| NA. |
| n/a |
| NA. |
| n/a |
| NA. |
| n/a |
| NA. |
| n/a |
| NA. |
| n/a |
| NA. |
| n/a |
| NA. |
| n/a |
| NA. |
| n/a |
| NA. |
| n/a |
| NA. |
| n/a |
| NA. |
| n/a |
| NA. |
| n/a |
| NA. |
| n/a |
| NA. |
| n/a |
| NA. |
| n/a |
| NA. |
| n/a |
| NA. |
| n/a |
| NA. |
| n/a |
| NA. |
| n/a |
| NA. |
| n/a |
| NA. |
| n/a |
| NA. |
| n/a |
| NA. |
| n/a |
| NA. |
| n/a |
| NA. |
| n/a |
| NA. |
| n/a |
| NA. |
| n/a |
| NA. |
| n/a |
| NA. |
| n/a |
| NA. |
| n/a |
| NA. |
| n/a |
| NA. |
| n/a |
| NA. |
| n/a |
| NA. |
| n/a |
| NA. |
| n/a |
| NA. |
| n/a |
| NA. |
| n/a |
| NA. |
| n/a |
| NA. |
| n/a |
| NA. |
| n/a |
| NA. |
| n/a |
| NA. |
| n/a |
| NA. |
| n/a |
| NA. |
| n/a |
| NA. |
| n/a |
| NA. |
| n/a |
| NA. |
| n/a |
| NA. |
| n/a |
| NA. |
| n/a |
| NA. |
| n/a |
| NA. |
| n/a |
| NA. |
| n/a |
| NA. |
| n/a |
| NA. |
| n/a |
| NA. |
| n/a |
| NA. |
| n/a |
| NA. |
| n/a |
| NA. |
| n/a |
| NA. |
| n/a |
| NA. |
| n/a |
| NA. |
| n/a |
| NA. |
| n/a |
| NA. |
| n/a |
| NA. |
| n/a |
| NA. |
| n/a |
| NA. |
| n/a |
| NA. |
| n/a |
| NA. |
| n/a |
| NA. |
| n/a |
| NA. |
| n/a |
| NA. |
| n/a |
| NA. |
| n/a |
| NA. |
| n/a |
| NA. |
| n/a |
| NA. |
| n/a |
| NA. |
| n/a |
| NA. |
| n/a |
| NA. |
| n/a |
| NA. |
| n/a |
| NA. |
| n/a |
| NA. |
| n/a |
| NA. |
| n/a |
| NA. |
| n/a |
| NA. |
| n/a |
| NA. |
| n/a |
| NA. |
| n/a |
| NA. |
| n/a |
| NA. |
| n/a |
| NA. |
| n/a |
| NA. |
| n/a |
| NA. |
| n/a |
| NA. |
| n/a |
| NA. |
| n/a |
| NA. |
| n/a |
| NA. |
| n/a |
| NA. |
| n/a |
| NA. |
| n/a |
| NA. |
| n/a |
| NA. |
| n/a |
| NA. |
| n/a |
| NA. |
| n/a |
| NA. |
| n/a |
| NA. |
| n/a |
| NA. |
| n/a |
| NA. |
| n/a |
| NA. |
| n/a |
| NA. |
| n/a |
| NA. |
| n/a |
| NA. |
| n/a |
| NA. |
| n/a |
| NA. |
| n/a |
| NA. |
| n/a |
| NA. |
| n/a |
| NA. |
| n/a |
| NA. |
| n/a |
| NA. |
| n/a |
| NA. |
| n/a |
| NA. |
| n/a |
| NA. |
| n/a |
| NA. |
| n/a |
| NA. |
| n/a |
| NA. |
| n/a |
| NA. |
| n/a |
| NA. |
| n/a |
| NA. |
| n/a |
| NA. |
| n/a |
| NA. |
| n/a |
| NA. |
| n/a |
| NA. |
| n/a |
| NA. |
| n/a |
| NA. |
| n/a |
| NA. |
| n/a |
| NA. |
| n/a |
| NA. |
| n/a |
| NA. |
| n/a |
| NA. |
| n/a |
| NA. |
| n/a |
| NA. |
| n/a |
| NA. |
| n/a |
| NA. |
| n/a |
| NA. |
| n/a |
| NA. |
| n/a |
| NA. |
| n/a |
| NA. |
| n/a |
| NA. |
| n/a |
| NA. |
| n/a |
| NA. |
| n/a |
| NA. |
| n/a |
| NA. |
| n/a |
| NA. |
| n/a |
| NA. |
| n/a |
| NA. |
| n/a |
| NA. |
| n/a |
| NA. |
| n/a |
| NA. |
| n/a |
| NA. |
| n/a |
| NA. |
| n/a |
| NA. |
| n/a |
| NA. |
| n/a |
| NA. |
| n/a |
| NA. |
| n/a |
| NA. |
| n/a |
| NA. |
| n/a |
| NA. |
| n/a |
| NA. |
| n/a |
| NA. |
| n/a |
| NA. |
| n/a |
| NA. |
| n/a |
| NA. |
| n/a |
| NA. |
| n/a |
| NA. |
| n/a |
| NA. |
| n/a |
| NA. |
| n/a |
| NA. |
| n/a |
| NA. |
| n/a |
| NA. |
| n/a |
| NA. |
| n/a |
| NA. |
| n/a |
| NA. |
| n/a |
| NA. |
| n/a |
| NA. |
| n/a |
| NA. |
| n/a |
| NA. |
| n/a |
| NA. |
| n/a |
| NA. |
| n/a |
| NA. |
| n/a |
| NA. |
| n/a |
| NA. |
| n/a |
| NA. |
| n/a |
| NA. |
| n/a |
| NA. |
| n/a |
| NA. |
| n/a |
| NA. |
| n/a |
| NA. |
| n/a |
| NA. |
| n/a |
| NA. |
| n/a |
| NA. |
| n/a |
| NA. |
| n/a |
| NA. |
| n/a |
| NA. |
| n/a |
| NA. |
| n/a |
| NA. |
| n/a |
| NA. |
| n/a |
| NA. |
| n/a |
| NA. |
| n/a |
| NA. |
| n/a |
| NA. |
| n/a |
| NA. |
| n/a |
| NA. |
| n/a |
| NA. |
| n/a |
| NA. |
| n/a |
| NA. |
| n/a |
| NA. |
| n/a |
| NA. |
| n/a |
| NA. |
| n/a |
| NA. |
| n/a |
| NA. |
| n/a |
| NA. |
| n/a |
| NA. |
| n/a |
| NA. |
| n/a |
| NA. |
| n/a |
| NA. |
| n/a |
| NA. |
| n/a |
| NA. |
| n/a |
| NA. |
| n/a |
| NA. |
| n/a |
| NA. |
| n/a |
| NA. |
| n/a |
| NA. |
| n/a |
| NA. |
| n/a |
| NA. |
| n/a |
| NA. |
| n/a |
| NA. |
| n/a |
| NA. |
| n/a |
| NA. |
| n/a |
| NA. |
| n/a |
| NA. |
| n/a |
| NA. |
| n/a |
| NA. |
| n/a |
| NA. |
| n/a |
| NA. |
| n/a |
| NA. |
| n/a |
| NA. |
| n/a |
| NA. |
| n/a |
| NA. |
| n/a |
| NA. |
| n/a |
| NA. |
| n/a |
| NA. |
| n/a |
| NA. |
| n/a |
| NA. |
| n/a |
| NA. |
| n/a |
| NA. |
| n/a |
| NA. |
| n/a |
| NA. |
| n/a |
| NA. |
| n/a |
| NA. |
| n/a |
| NA. |
| n/a |
| NA. |
| n/a |
| NA. |
| n/a |
| NA. |
| n/a |
| NA. |
| n/a |
| NA. |
| n/a |
| NA. |
| n/a |
| NA. |
| n/a |
| NA. |
| n/a |
| NA. |
| n/a |
| NA. |
| n/a |
| NA. |
| n/a |
| NA. |
| n/a |
| NA. |
| n/a |
| NA. |
| n/a |
| NA. |
| n/a |
| NA. |
| n/a |
| NA. |
| n/a |
| NA. |
| n/a |
| NA. |
| n/a |
| NA. |
| n/a |
| NA. |
| n/a |
| NA. |
| n/a |
| NA. |
| n/a |
| NA. |
| n/a |
| NA. |
| n/a |
| NA. |
| n/a |
| NA. |
| n/a |
| NA. |
| n/a |
| NA. |
| n/a |
| NA. |
| n/a |
| NA. |
| n/a |
| NA. |
| n/a |
| NA. |
| n/a |
| NA. |
| n/a |
| NA. |
| n/a |
| NA. |
| n/a |
| NA. |
| n/a |
| NA. |
| n/a |
| NA. |
| n/a |
| NA. |
| n/a |
| NA. |
| n/a |
| NA. |
| n/a |
| NA. |
| n/a |
| NA. |
| n/a |
| NA. |
| n/a |
| NA. |
| n/a |
| NA. |
| n/a |
| NA. |
| n/a |
| NA. |
| n/a |
| NA. |
| n/a |
| NA. |
| n/a |
| NA. |
| n/a |
| NA. |
| n/a |
| NA. |
| n/a |
| NA. |
| n/a |
| NA. |
| n/a |
| NA. |
| n/a |
| NA. |
| n/a |
| NA. |
| n/a |
| NA. |
| n/a |
| NA. |
| n/a |
| NA. |
| n/a |
| NA. |
| n/a |
| NA. |
| n/a |
| NA. |
| n/a |
| NA. |
| n/a |
| NA. |
| n/a |
| NA. |
| n/a |
| NA. |
| n/a |
| NA. |
| n/a |
| NA. |
| n/a |
| NA. |
| n/a |
| NA. |
| n/a |
| NA. |
| n/a |
| NA. |
| n/a |
| NA. |
| n/a |
| NA. |
| n/a |
| NA. |
| n/a |
| NA. |
| n/a |
| NA. |
| n/a |
| NA. |
| n/a |
| NA. |
| n/a |
| NA. |
| n/a |
| NA. |
| n/a |
| NA. |
| n/a |
| NA. |
| n/a |
| NA. |
| n/a |
| NA. |
| n/a |
| NA. |
| n/a |
| NA. |
| n/a |
| NA. |
| n/a |
| NA. |
| n/a |
| NA. |
| n/a |
| NA. |
| n/a |
| NA. |
| n/a |
| NA. |
| n/a |
| NA. |
| n/a |
| NA. |
| n/a |
| NA. |
| n/a |
| NA. |
| n/a |
| NA. |
| n/a |
| NA. |
| n/a |
| NA. |
| n/a |
| NA. |
| n/a |
| NA. |
| n/a |
| NA. |
| n/a |
| NA. |
| n/a |
| NA. |
| n/a |
| NA. |
| n/a |
| NA. |
| n/a |
| NA. |
| n/a |
| NA. |
| n/a |
| NA. |
| n/a |
| NA. |
| n/a |
| NA. |
| n/a |
| NA. |
| n/a |
| NA. |
| n/a |
| NA. |
| n/a |
| NA. |
| n/a |
| NA. |
| n/a |
| NA. |
| n/a |
| NA. |
| n/a |
| NA. |
| n/a |