Differential methylation on the region level was computed based on a variety of metrics. Of particular interest for the following plots and analyses are the following quantities for each region: the mean methylation difference in a region of the two groups being and of quotient of mean methylation levelsas well as a p-value obtained from statistical testing (limma or t-test; depending on parameter settings). Additionally each region was assigned a rank based on each of these three criteria. A combined rank is computed as the maximum (i.e. worst) value among the three ranks. The smaller the combined rank for a region, the more evidence for differential methylation it exhibits. Regions were defined based on the region types specified in the analysis. This section includes scatterplots of the region group means as well as volcano plots of each pairwise comparison colored according to the combined rank of a given region.
The following rank cutfoffs have been automatically selected for the analysis of differentially methylated regions:
| tiling | cpgislands | genes | promoters | ensembleRegBuildBPall | ensembleRegBuildBPallMerged | |
| CMP vs. GMP (based on cmp_ct_CMPvGMP) | 0 | 0 | 0 | 0 | 0 | 0 |
| CLP vs. CMP (based on cmp_ct_CMPvCLP) | 0 | 0 | 0 | 0 | 0 | 0 |
| CLP vs. MLP0 (based on cmp_ct_CLPvMLP0) | 0 | 0 | 0 | 0 | 0 | 0 |
| HSC vs. MPP (based on cmp_ct_HSCvMPP) | 0 | 0 | 0 | 0 | 0 | 0 |
| CMP vs. MPP (based on cmp_ct_MPPvCMP) | 0 | 0 | 0 | 0 | 0 | 0 |
| MLP0 vs. MPP (based on cmp_ct_MPPvMLP0) | 0 | 0 | 0 | 0 | 0 | 0 |
| CLP vs. MPP (based on cmp_ct_MPPvCLP) | 0 | 0 | 0 | 0 | 0 | 0 |
| HSC vs. ML (based on cmp_ct_HSCvML) | 0 | 0 | 0 | 0 | 0 | 0 |
| comparison | |
| regions | |
| differential methylation measure |
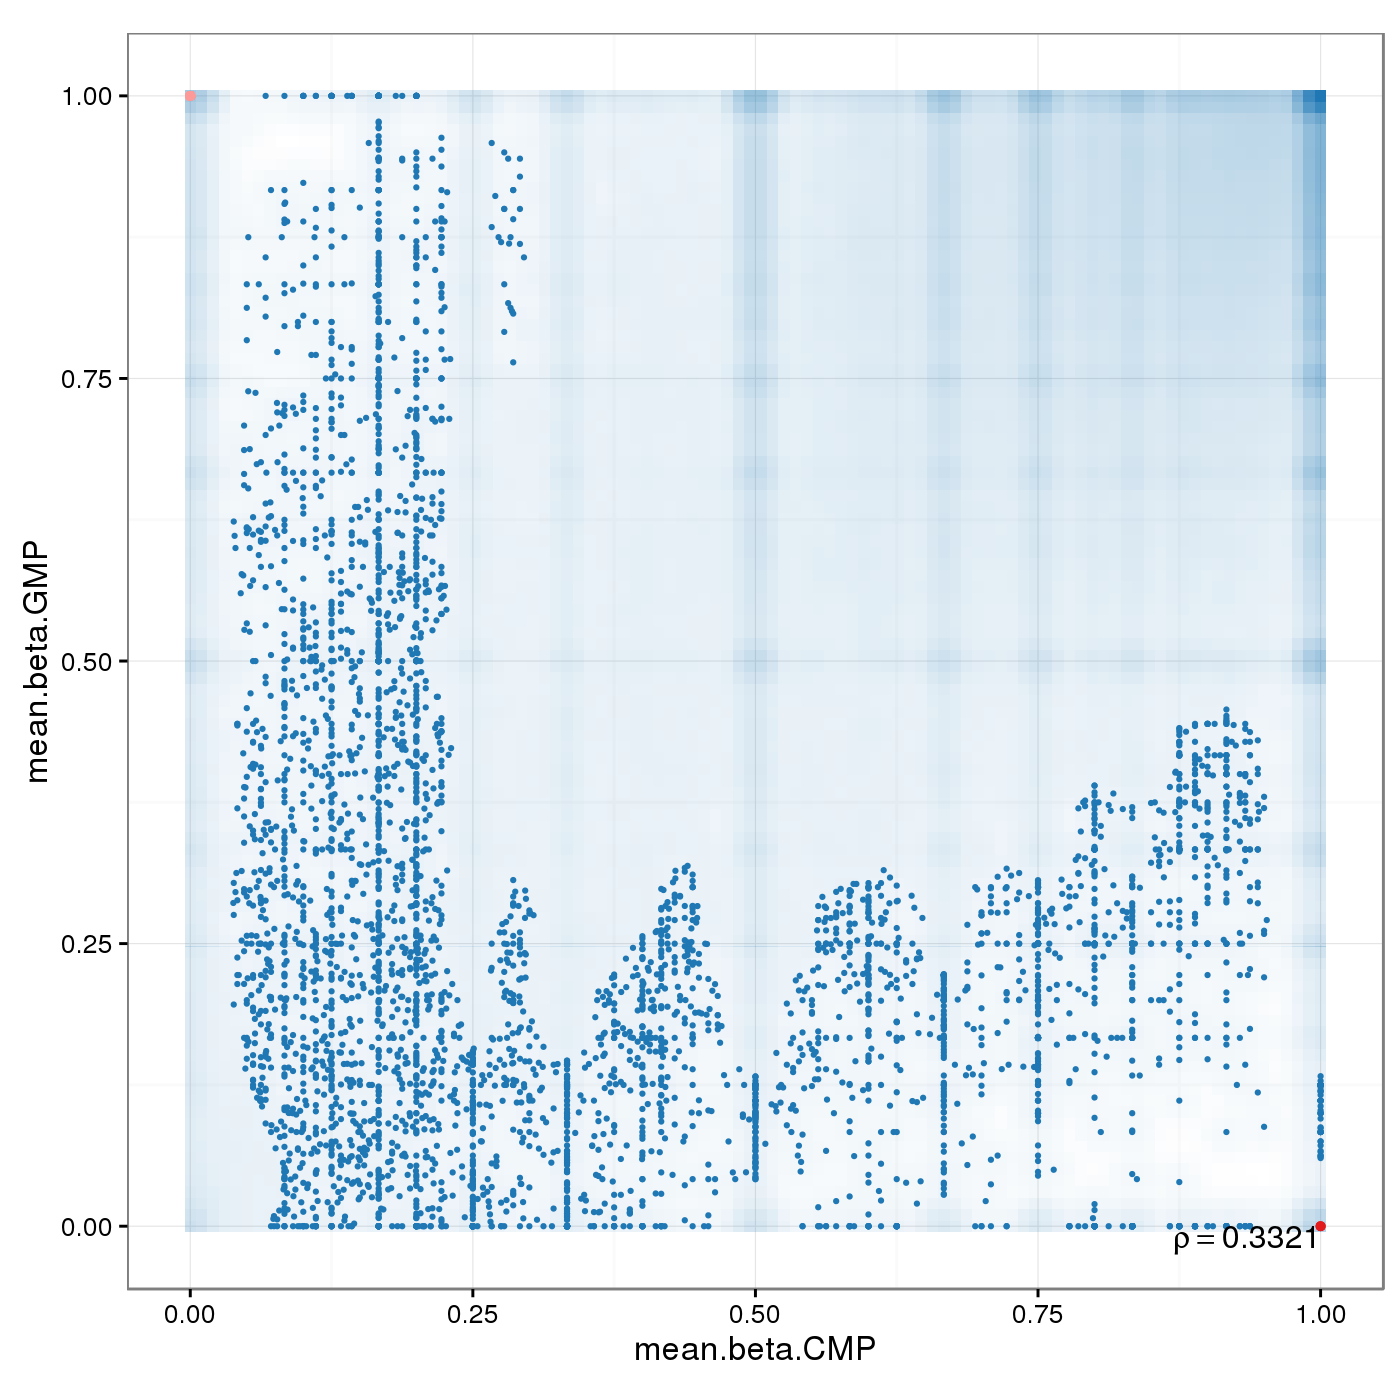
Scatterplot for differential methylation (regions). If the selected criterion is not rankGradient:
The transparency corresponds to point density. The 1% of the points in the sparsest populated plot regions are drawn explicitly.
Additionally, the colored points represent differentially methylated regions (according to the selected criterion).
If the selected criterion is rankGradient: median combined ranks accross hexagonal bins are shown
as a gradient according to the color legend.
| comparison | |
| regions | |
| difference metric | |
| significance metric |
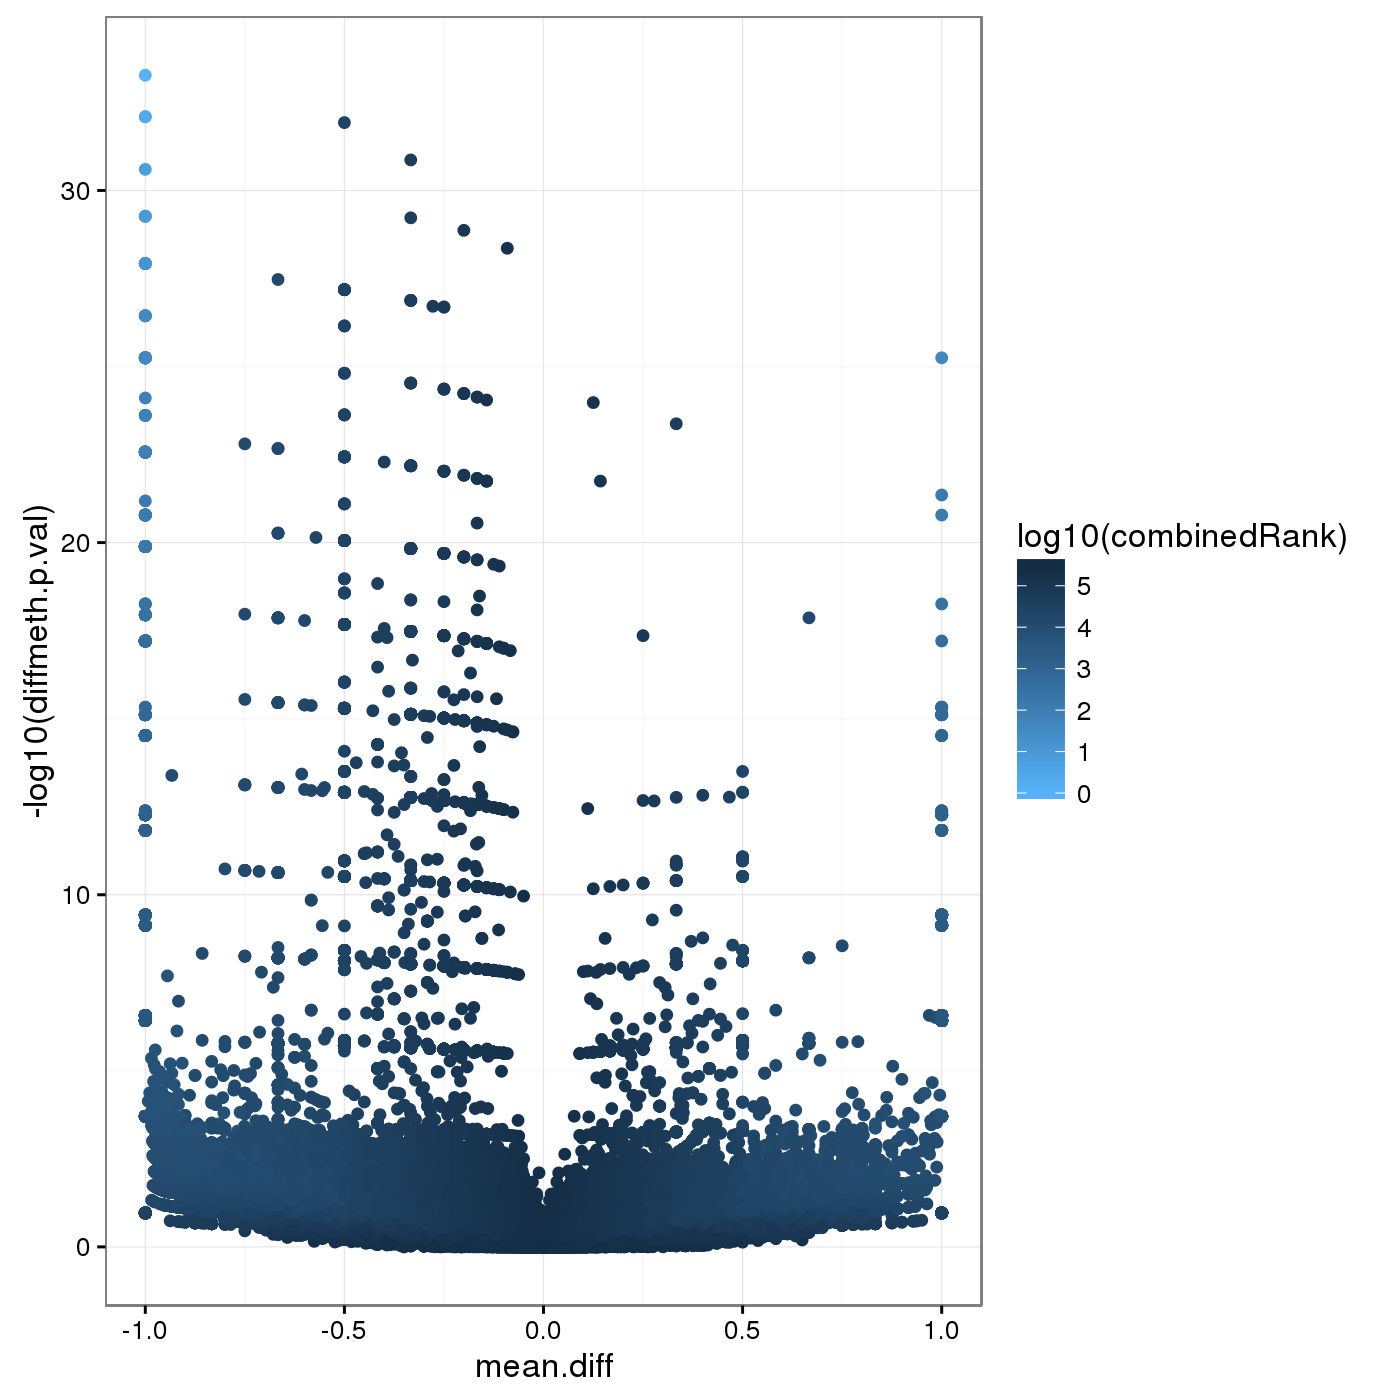
Volcano plot for differential methylation quantified by various metrics. Color scale according to combined ranking.
Differential Methylation Tables
A tabular overview of measures for differential methylation on the region level for the individual comparisons are provided in this section.
- id: region id
- Chromosome: chromosome of the region
- Start: start coordinate of the region
- End: end coordinate of the region
- mean.g1,mean.g2: (where g1 and g2 is replaced by the respective group names in the table) mean methylation in each of the two groups
- mean.diff: difference in methylation means between the two groups: mean.g1-mean.g2. In case of paired analysis, it is the mean of the pairwise differences.
- mean.quot.log2: log2 of the quotient in methylation: log2((mean.g1+epsilon)/(mean.g2+epsilon)), where epsilon:=0.01. In case of paired analysis, it is the mean of the pairwise quotients.
- diffmeth.p.val: p-value obtained from linear models employed in the limma package (or alternatively from a two-sided Welch t-test; which type of p-value is computed is specified in the differential.site.test.method option).
- max.g1,max.g2: maximum methylation level in group 1 and 2 respectively
- min.g1,min.g2: minimum methylation level in group 1 and 2 respectively
- sd.g1,sd.g2: standard deviation of methylation levels
- min.diff: Minimum of 0 and the smallest pairwise difference between samples of the two groups
- diffmeth.p.adj.fdr: FDR adjusted p-value of all sites
- combinedRank: mean.diff, mean.quot.log2 and diffmeth.p.val are ranked for all regions. This aggregates them using the maximum, i.e. worst rank of a site among the three measures
- num.na.g1,num.na.g2: number of NA methylation values for groups 1 and 2 respectively
- mean.covg.g1,mean.covg.g2: mean coverage of groups 1 and 2 respectively (In case of Infinium array methylation data, coverage is defined as combined beadcount.)
- min.covg.g1,min.covg.g2: minimum coverage of groups 1 and 2 respectively
- max.covg.g1,max.covg.g2: maximum coverage of groups 1 and 2 respectively
- covg.thresh.nsamples.g1,covg.thresh.nsamples.g2: number of samples in group 1 and 2 respectively exceeding the coverage threshold (1) for this region.
The tables for the individual comparisons can be found here:
| tiling | cpgislands | genes | promoters | ensembleRegBuildBPall | ensembleRegBuildBPallMerged | |
| CMP vs. GMP (based on cmp_ct_CMPvGMP) | csv | csv | csv | csv | csv | csv |
| CLP vs. CMP (based on cmp_ct_CMPvCLP) | csv | csv | csv | csv | csv | csv |
| CLP vs. MLP0 (based on cmp_ct_CLPvMLP0) | csv | csv | csv | csv | csv | csv |
| HSC vs. MPP (based on cmp_ct_HSCvMPP) | csv | csv | csv | csv | csv | csv |
| CMP vs. MPP (based on cmp_ct_MPPvCMP) | csv | csv | csv | csv | csv | csv |
| MLP0 vs. MPP (based on cmp_ct_MPPvMLP0) | csv | csv | csv | csv | csv | csv |
| CLP vs. MPP (based on cmp_ct_MPPvCLP) | csv | csv | csv | csv | csv | csv |
| HSC vs. ML (based on cmp_ct_HSCvML) | csv | csv | csv | csv | csv | csv |
Enrichment Analysis
Enrichment Analysis was conducted. The wordclouds and tables below contains significant GO terms as determined by a hypergeometric test.
| comparison | |
| Hypermethylation/hypomethylation | |
| ontology | |
| regions | |
| differential methylation measure |
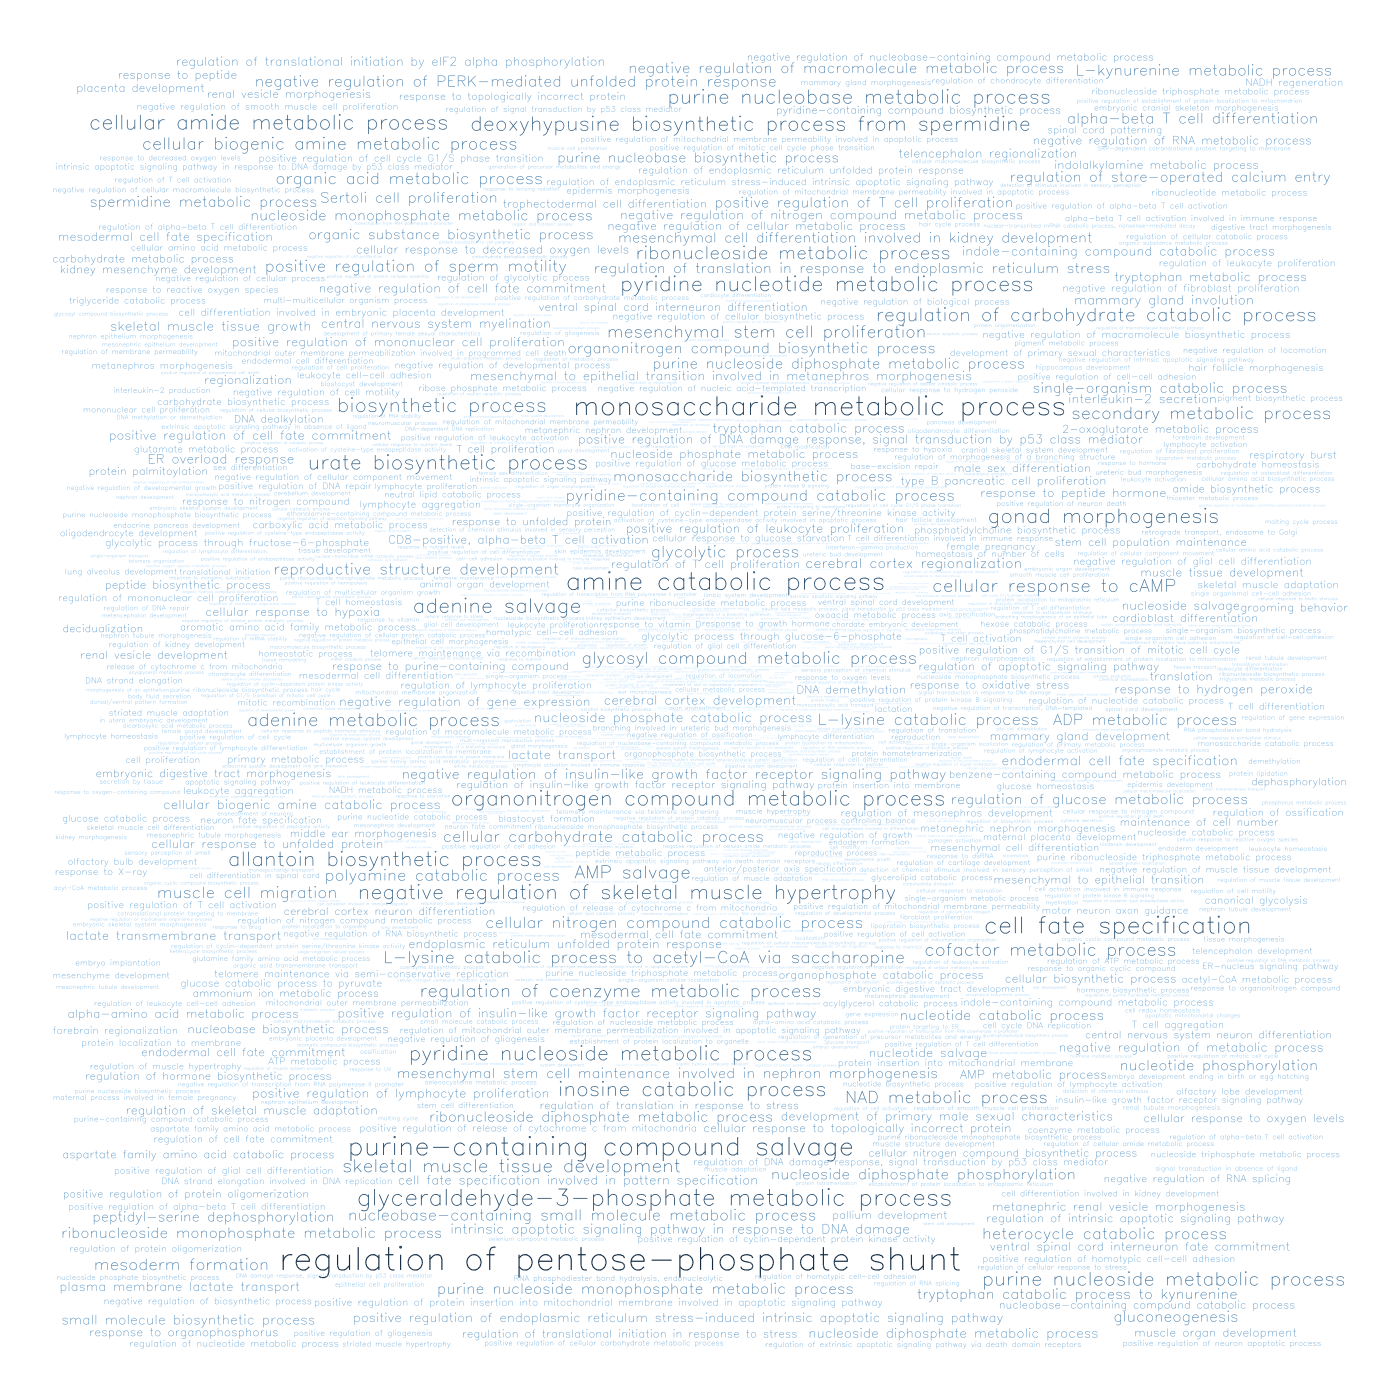
Wordclouds for GO enrichment terms.
| comparison | |
| Hypermethylation/hypomethylation | |
| ontology | |
| regions | |
| differential methylation measure |
| GOMFID | Pvalue | OddsRatio | ExpCount | Count | Size | Term |
| GO:0090155 | 0.0017 | 979.3125 | 0.0017 | 1 | 3 | negative regulation of sphingolipid biosynthetic process |
| GO:0032277 | 0.0052 | 244.7344 | 0.0052 | 1 | 9 | negative regulation of gonadotropin secretion |
| GO:0048245 | 0.0063 | 195.7625 | 0.0063 | 1 | 11 | eosinophil chemotaxis |
| GO:0016558 | 0.0074 | 163.1146 | 0.0075 | 1 | 13 | protein import into peroxisome matrix |
| GO:0050930 | 0.008 | 150.5577 | 0.008 | 1 | 14 | induction of positive chemotaxis |
| GO:1904874 | 0.008 | 150.5577 | 0.008 | 1 | 14 | positive regulation of telomerase RNA localization to Cajal body |
| GO:0090670 | 0.0086 | 139.7946 | 0.0086 | 1 | 15 | RNA localization to Cajal body |
| GO:0090672 | 0.0086 | 139.7946 | 0.0086 | 1 | 15 | telomerase RNA localization |
| GO:0001522 | 0.0091 | 130.4667 | 0.0092 | 1 | 16 | pseudouridine synthesis |
| GO:0043574 | 0.0097 | 122.3047 | 0.0098 | 1 | 17 | peroxisomal transport |
| GO:0072663 | 0.0097 | 122.3047 | 0.0098 | 1 | 17 | establishment of protein localization to peroxisome |
| GOMFID | Pvalue | OddsRatio | ExpCount | Count | Size | Term |
| GO:1904431 | 0 | 921.1176 | 0.0048 | 2 | 4 | positive regulation of t-circle formation |
| GO:0010792 | 0 | 460.5 | 0.0073 | 2 | 6 | DNA double-strand break processing involved in repair via single-strand annealing |
| GO:0050911 | 8e-04 | 11.3341 | 0.4411 | 4 | 364 | detection of chemical stimulus involved in sensory perception of smell |
| GO:0036297 | 0.0012 | 45.9441 | 0.0509 | 2 | 42 | interstrand cross-link repair |
| GO:0031424 | 0.0015 | 39.9361 | 0.0582 | 2 | 48 | keratinization |
| GO:0009593 | 0.0018 | 9.2033 | 0.5392 | 4 | 445 | detection of chemical stimulus |
| GO:0018149 | 0.0019 | 35.3145 | 0.0654 | 2 | 54 | peptide cross-linking |
| GO:0007606 | 0.002 | 8.9322 | 0.555 | 4 | 458 | sensory perception of chemical stimulus |
| GO:0050906 | 0.002 | 8.9322 | 0.555 | 4 | 458 | detection of stimulus involved in sensory perception |
| GO:0060474 | 0.0024 | 870 | 0.0024 | 1 | 2 | positive regulation of sperm motility involved in capacitation |
| GO:0032204 | 0.0027 | 29.5996 | 0.0776 | 2 | 64 | regulation of telomere maintenance |
| GO:0000726 | 0.0034 | 26.2034 | 0.0872 | 2 | 72 | non-recombinational repair |
| GO:0003008 | 0.0048 | 4.289 | 2.2805 | 7 | 1882 | system process |
| GO:1901317 | 0.0085 | 144.9537 | 0.0085 | 1 | 7 | regulation of sperm motility |
| GOMFID | Pvalue | OddsRatio | ExpCount | Count | Size | Term |
| GO:0000042 | 2e-04 | 115.0368 | 0.0218 | 2 | 18 | protein targeting to Golgi |
| GO:0072594 | 8e-04 | 8.5069 | 0.7707 | 5 | 636 | establishment of protein localization to organelle |
| GO:0032812 | 0.0012 | Inf | 0.0012 | 1 | 1 | positive regulation of epinephrine secretion |
| GO:1900131 | 0.0012 | Inf | 0.0012 | 1 | 1 | negative regulation of lipid binding |
| GO:0006891 | 0.0012 | 44.8207 | 0.0521 | 2 | 43 | intra-Golgi vesicle-mediated transport |
| GO:0045216 | 0.0023 | 13.2824 | 0.2678 | 3 | 221 | cell-cell junction organization |
| GO:0034329 | 0.0024 | 13.0397 | 0.2726 | 3 | 225 | cell junction assembly |
| GO:0000964 | 0.0024 | 870 | 0.0024 | 1 | 2 | mitochondrial RNA 5'-end processing |
| GO:1902766 | 0.0024 | 870 | 0.0024 | 1 | 2 | skeletal muscle satellite cell migration |
| GO:0043297 | 0.0026 | 30.0868 | 0.0763 | 2 | 63 | apical junction assembly |
| GO:0006452 | 0.0036 | 434.9722 | 0.0036 | 1 | 3 | translational frameshifting |
| GO:0045905 | 0.0036 | 434.9722 | 0.0036 | 1 | 3 | positive regulation of translational termination |
| GO:0060392 | 0.0036 | 434.9722 | 0.0036 | 1 | 3 | negative regulation of SMAD protein import into nucleus |
| GO:0070093 | 0.0036 | 434.9722 | 0.0036 | 1 | 3 | negative regulation of glucagon secretion |
| GO:0008104 | 0.0037 | 4.2034 | 2.8088 | 8 | 2318 | protein localization |
| GO:0016557 | 0.0048 | 289.963 | 0.0048 | 1 | 4 | peroxisome membrane biogenesis |
| GO:0045901 | 0.0048 | 289.963 | 0.0048 | 1 | 4 | positive regulation of translational elongation |
| GO:0090646 | 0.0048 | 289.963 | 0.0048 | 1 | 4 | mitochondrial tRNA processing |
| GO:0006886 | 0.0051 | 5.4329 | 1.1766 | 5 | 971 | intracellular protein transport |
| GO:0017038 | 0.006 | 9.3155 | 0.3781 | 3 | 312 | protein import |
| GO:0070727 | 0.0063 | 4.4724 | 1.7825 | 6 | 1471 | cellular macromolecule localization |
| GO:0045046 | 0.0072 | 173.9556 | 0.0073 | 1 | 6 | protein import into peroxisome membrane |
| GO:0070253 | 0.0072 | 173.9556 | 0.0073 | 1 | 6 | somatostatin secretion |
| GO:0090150 | 0.0081 | 8.2993 | 0.4229 | 3 | 349 | establishment of protein localization to membrane |
| GO:0019236 | 0.0085 | 144.9537 | 0.0085 | 1 | 7 | response to pheromone |
| GO:0006610 | 0.0097 | 124.2381 | 0.0097 | 1 | 8 | ribosomal protein import into nucleus |
| GO:0051971 | 0.0097 | 124.2381 | 0.0097 | 1 | 8 | positive regulation of transmission of nerve impulse |
| GO:0070900 | 0.0097 | 124.2381 | 0.0097 | 1 | 8 | mitochondrial tRNA modification |
| GO:0072321 | 0.0097 | 124.2381 | 0.0097 | 1 | 8 | chaperone-mediated protein transport |
| GOMFID | Pvalue | OddsRatio | ExpCount | Count | Size | Term |
| GO:1902559 | 0.0013 | Inf | 0.0013 | 1 | 1 | 3'-phospho-5'-adenylyl sulfate transmembrane transport |
| GO:1903723 | 0.0013 | Inf | 0.0013 | 1 | 1 | negative regulation of centriole elongation |
| GO:0060392 | 0.004 | 391.425 | 0.004 | 1 | 3 | negative regulation of SMAD protein import into nucleus |
| GO:1903361 | 0.0053 | 260.9333 | 0.0054 | 1 | 4 | protein localization to basolateral plasma membrane |
| GO:0006931 | 0.0067 | 195.6875 | 0.0067 | 1 | 5 | substrate-dependent cell migration, cell attachment to substrate |
| GO:0042760 | 0.0067 | 195.6875 | 0.0067 | 1 | 5 | very long-chain fatty acid catabolic process |
| GO:0015868 | 0.008 | 156.54 | 0.008 | 1 | 6 | purine ribonucleotide transport |
| GO:0050428 | 0.008 | 156.54 | 0.008 | 1 | 6 | 3'-phosphoadenosine 5'-phosphosulfate biosynthetic process |
| GO:0009967 | 0.0086 | 4.0676 | 1.8857 | 6 | 1408 | positive regulation of signal transduction |
| GO:0045199 | 0.0093 | 130.4417 | 0.0094 | 1 | 7 | maintenance of epithelial cell apical/basal polarity |
| GO:0051503 | 0.0093 | 130.4417 | 0.0094 | 1 | 7 | adenine nucleotide transport |
| GOMFID | Pvalue | OddsRatio | ExpCount | Count | Size | Term |
| GO:0016259 | 0 | 60.6933 | 0.09 | 4 | 83 | selenocysteine metabolic process |
| GO:0006614 | 0 | 45.3761 | 0.1171 | 4 | 102 | SRP-dependent cotranslational protein targeting to membrane |
| GO:0072599 | 0 | 41.9299 | 0.1263 | 4 | 110 | establishment of protein localization to endoplasmic reticulum |
| GO:0000184 | 0 | 40.3948 | 0.1309 | 4 | 114 | nuclear-transcribed mRNA catabolic process, nonsense-mediated decay |
| GO:1901605 | 0 | 17.9808 | 0.3823 | 5 | 333 | alpha-amino acid metabolic process |
| GO:0006415 | 0 | 26.3503 | 0.1974 | 4 | 172 | translational termination |
| GO:0006612 | 0 | 24.7135 | 0.2101 | 4 | 183 | protein targeting to membrane |
| GO:0019083 | 1e-04 | 24.3014 | 0.2135 | 4 | 186 | viral transcription |
| GO:0006402 | 1e-04 | 22.3146 | 0.2319 | 4 | 202 | mRNA catabolic process |
| GO:0006414 | 1e-04 | 22.3146 | 0.2319 | 4 | 202 | translational elongation |
| GO:0044033 | 1e-04 | 21.7579 | 0.2376 | 4 | 207 | multi-organism metabolic process |
| GO:0006413 | 2e-04 | 17.4717 | 0.2939 | 4 | 256 | translational initiation |
| GO:0016482 | 2e-04 | 7.7531 | 1.3718 | 7 | 1195 | cytoplasmic transport |
| GO:0000027 | 3e-04 | 102.9145 | 0.0241 | 2 | 21 | ribosomal large subunit assembly |
| GO:0043241 | 3e-04 | 14.6305 | 0.349 | 4 | 304 | protein complex disassembly |
| GO:0044265 | 4e-04 | 8.2693 | 1.032 | 6 | 899 | cellular macromolecule catabolic process |
| GO:0006886 | 5e-04 | 7.615 | 1.1147 | 6 | 971 | intracellular protein transport |
| GO:0019752 | 8e-04 | 7.0443 | 1.1985 | 6 | 1044 | carboxylic acid metabolic process |
| GO:0034655 | 8e-04 | 11.5839 | 0.4374 | 4 | 381 | nucleobase-containing compound catabolic process |
| GO:0007634 | 0.0011 | Inf | 0.0011 | 1 | 1 | optokinetic behavior |
| GO:0016260 | 0.0011 | Inf | 0.0011 | 1 | 1 | selenocysteine biosynthetic process |
| GO:0021560 | 0.0011 | Inf | 0.0011 | 1 | 1 | abducens nerve development |
| GO:0021599 | 0.0011 | Inf | 0.0011 | 1 | 1 | abducens nerve formation |
| GO:0019058 | 0.0013 | 10.0728 | 0.5005 | 4 | 436 | viral life cycle |
| GO:0006082 | 0.0015 | 6.1874 | 1.3511 | 6 | 1177 | organic acid metabolic process |
| GO:1902582 | 0.0015 | 5.452 | 1.8872 | 7 | 1644 | single-organism intracellular transport |
| GO:0033365 | 0.0021 | 6.8037 | 0.9677 | 5 | 843 | protein localization to organelle |
| GO:0001808 | 0.0023 | 921.2353 | 0.0023 | 1 | 2 | negative regulation of type IV hypersensitivity |
| GO:0021754 | 0.0023 | 921.2353 | 0.0023 | 1 | 2 | facial nucleus development |
| GO:0060474 | 0.0023 | 921.2353 | 0.0023 | 1 | 2 | positive regulation of sperm motility involved in capacitation |
| GO:0060876 | 0.0023 | 921.2353 | 0.0023 | 1 | 2 | semicircular canal formation |
| GO:0021570 | 0.0034 | 460.5882 | 0.0034 | 1 | 3 | rhombomere 4 development |
| GO:0071702 | 0.004 | 4.236 | 2.8653 | 8 | 2496 | organic substance transport |
| GO:0002865 | 0.0046 | 307.0392 | 0.0046 | 1 | 4 | negative regulation of acute inflammatory response to antigenic stimulus |
| GO:0008628 | 0.0046 | 307.0392 | 0.0046 | 1 | 4 | hormone-mediated apoptotic signaling pathway |
| GO:0021569 | 0.0046 | 307.0392 | 0.0046 | 1 | 4 | rhombomere 3 development |
| GO:0021571 | 0.0046 | 307.0392 | 0.0046 | 1 | 4 | rhombomere 5 development |
| GO:0070727 | 0.0047 | 4.8454 | 1.6886 | 6 | 1471 | cellular macromolecule localization |
| GO:0043043 | 0.0051 | 6.8399 | 0.7255 | 4 | 632 | peptide biosynthetic process |
| GO:0051179 | 0.0051 | 3.8353 | 6.176 | 12 | 5380 | localization |
| GO:1901564 | 0.0065 | 4.1007 | 2.4233 | 7 | 2111 | organonitrogen compound metabolic process |
| GO:0002883 | 0.008 | 153.4902 | 0.008 | 1 | 7 | regulation of hypersensitivity |
| GO:0048702 | 0.008 | 153.4902 | 0.008 | 1 | 7 | embryonic neurocranium morphogenesis |
| GO:1901317 | 0.008 | 153.4902 | 0.008 | 1 | 7 | regulation of sperm motility |
| GO:0022411 | 0.0091 | 5.7532 | 0.8552 | 4 | 745 | cellular component disassembly |
| GO:0021612 | 0.0091 | 131.5546 | 0.0092 | 1 | 8 | facial nerve structural organization |
| GO:0048706 | 0.0093 | 15.4127 | 0.1469 | 2 | 128 | embryonic skeletal system development |
| GOMFID | Pvalue | OddsRatio | ExpCount | Count | Size | Term |
| GO:0000042 | 1e-04 | 195.65 | 0.0138 | 2 | 18 | protein targeting to Golgi |
| GO:0050911 | 1e-04 | 21.2611 | 0.2786 | 4 | 364 | detection of chemical stimulus involved in sensory perception of smell |
| GO:0009593 | 3e-04 | 17.2642 | 0.3406 | 4 | 445 | detection of chemical stimulus |
| GO:0007606 | 3e-04 | 16.7555 | 0.3505 | 4 | 458 | sensory perception of chemical stimulus |
| GO:0050906 | 3e-04 | 16.7555 | 0.3505 | 4 | 458 | detection of stimulus involved in sensory perception |
| GO:0006891 | 5e-04 | 76.2293 | 0.0329 | 2 | 43 | intra-Golgi vesicle-mediated transport |
| GO:0007186 | 0.0011 | 9.0343 | 0.8824 | 5 | 1153 | G-protein coupled receptor signaling pathway |
| GO:0005989 | 0.0023 | 712.0909 | 0.0023 | 1 | 3 | lactose biosynthetic process |
| GO:0070315 | 0.0023 | 712.0909 | 0.0023 | 1 | 3 | G1 to G0 transition involved in cell differentiation |
| GO:0005984 | 0.0061 | 203.3896 | 0.0061 | 1 | 8 | disaccharide metabolic process |
| GO:0001765 | 0.0076 | 158.1717 | 0.0077 | 1 | 10 | membrane raft assembly |
| GO:0009312 | 0.0099 | 118.6061 | 0.0099 | 1 | 13 | oligosaccharide biosynthetic process |
| GOMFID | Pvalue | OddsRatio | ExpCount | Count | Size | Term |
| GO:0001567 | 0.002 | 1047.3333 | 0.002 | 1 | 2 | cholesterol 25-hydroxylase activity |
| GO:0017099 | 0.002 | 1047.3333 | 0.002 | 1 | 2 | very-long-chain-acyl-CoA dehydrogenase activity |
| GO:0043183 | 0.002 | 1047.3333 | 0.002 | 1 | 2 | vascular endothelial growth factor receptor 1 binding |
| GO:0034513 | 0.003 | 523.6333 | 0.0031 | 1 | 3 | box H/ACA snoRNA binding |
| GO:0051434 | 0.0041 | 349.0667 | 0.0041 | 1 | 4 | BH3 domain binding |
| GO:0061133 | 0.0061 | 209.4133 | 0.0061 | 1 | 6 | endopeptidase activator activity |
| GO:0046982 | 0.0097 | 7.935 | 0.4548 | 3 | 447 | protein heterodimerization activity |
| GOMFID | Pvalue | OddsRatio | ExpCount | Count | Size | Term |
| GO:0004145 | 0.001 | Inf | 0.001 | 1 | 1 | diamine N-acetyltransferase activity |
| GO:0008311 | 0.001 | Inf | 0.001 | 1 | 1 | double-stranded DNA 3'-5' exodeoxyribonuclease activity |
| GO:0001567 | 0.002 | 1047.3333 | 0.002 | 1 | 2 | cholesterol 25-hydroxylase activity |
| GO:0016890 | 0.002 | 1047.3333 | 0.002 | 1 | 2 | site-specific endodeoxyribonuclease activity, specific for altered base |
| GO:0051434 | 0.0041 | 349.0667 | 0.0041 | 1 | 4 | BH3 domain binding |
| GO:0004528 | 0.0051 | 261.7833 | 0.0051 | 1 | 5 | phosphodiesterase I activity |
| GO:0004844 | 0.0051 | 261.7833 | 0.0051 | 1 | 5 | uracil DNA N-glycosylase activity |
| GO:0003691 | 0.0071 | 174.5 | 0.0071 | 1 | 7 | double-stranded telomeric DNA binding |
| GO:0004523 | 0.0071 | 174.5 | 0.0071 | 1 | 7 | RNA-DNA hybrid ribonuclease activity |
| GOMFID | Pvalue | OddsRatio | ExpCount | Count | Size | Term |
| GO:0046789 | 0.0011 | Inf | 0.0011 | 1 | 1 | host cell surface receptor binding |
| GO:0008134 | 0.0023 | 8.6551 | 0.5791 | 4 | 506 | transcription factor binding |
| GO:0004731 | 0.0023 | 924 | 0.0023 | 1 | 2 | purine-nucleoside phosphorylase activity |
| GO:0002060 | 0.0034 | 461.9706 | 0.0034 | 1 | 3 | purine nucleobase binding |
| GO:0008401 | 0.0034 | 461.9706 | 0.0034 | 1 | 3 | retinoic acid 4-hydroxylase activity |
| GO:0043426 | 0.0046 | 307.9608 | 0.0046 | 1 | 4 | MRF binding |
| GOMFID | Pvalue | OddsRatio | ExpCount | Count | Size | Term |
| GO:0031696 | 0.0033 | 628 | 0.0033 | 1 | 2 | alpha-2C adrenergic receptor binding |
| GO:0004938 | 0.005 | 313.98 | 0.005 | 1 | 3 | alpha2-adrenergic receptor activity |
| GO:0031692 | 0.005 | 313.98 | 0.005 | 1 | 3 | alpha-1B adrenergic receptor binding |
| GO:0032795 | 0.005 | 313.98 | 0.005 | 1 | 3 | heterotrimeric G-protein binding |
| GO:0004966 | 0.0066 | 209.3067 | 0.0066 | 1 | 4 | galanin receptor activity |
| GO:0051380 | 0.0066 | 209.3067 | 0.0066 | 1 | 4 | norepinephrine binding |
| GO:0001664 | 0.0079 | 8.1609 | 0.4133 | 3 | 250 | G-protein coupled receptor binding |
| GO:0004930 | 0.0079 | 4.6232 | 1.2796 | 5 | 774 | G-protein coupled receptor activity |
| GO:0031726 | 0.0099 | 125.568 | 0.0099 | 1 | 6 | CCR1 chemokine receptor binding |
| GO:0051379 | 0.0099 | 125.568 | 0.0099 | 1 | 6 | epinephrine binding |
| GO:0051920 | 0.0099 | 125.568 | 0.0099 | 1 | 6 | peroxiredoxin activity |
| GOMFID | Pvalue | OddsRatio | ExpCount | Count | Size | Term |
| GO:0034513 | 0.0013 | 1309.8333 | 0.0013 | 1 | 3 | box H/ACA snoRNA binding |
| GO:0070034 | 0.0058 | 218.1667 | 0.0058 | 1 | 13 | telomerase RNA binding |
| GOMFID | Pvalue | OddsRatio | ExpCount | Count | Size | Term |
| GO:0005549 | 0 | 52.7561 | 0.1003 | 4 | 83 | odorant binding |
| GO:0004984 | 1e-04 | 15.2696 | 0.4398 | 5 | 364 | olfactory receptor activity |
| GO:0004930 | 2e-04 | 8.9784 | 0.9351 | 6 | 774 | G-protein coupled receptor activity |
| GO:0038023 | 4e-04 | 6.7179 | 1.5246 | 7 | 1262 | signaling receptor activity |
| GO:0097162 | 0.0012 | Inf | 0.0012 | 1 | 1 | MADS box domain binding |
| GO:0060089 | 0.0013 | 5.5622 | 1.8098 | 7 | 1498 | molecular transducer activity |
| GO:0046982 | 0.0018 | 9.1889 | 0.54 | 4 | 447 | protein heterodimerization activity |
| GO:0099600 | 0.0023 | 5.5649 | 1.4606 | 6 | 1209 | transmembrane receptor activity |
| GO:0001567 | 0.0024 | 872.6111 | 0.0024 | 1 | 2 | cholesterol 25-hydroxylase activity |
| GO:0004464 | 0.0024 | 872.6111 | 0.0024 | 1 | 2 | leukotriene-C4 synthase activity |
| GO:0004882 | 0.0024 | 872.6111 | 0.0024 | 1 | 2 | androgen receptor activity |
| GO:0004966 | 0.0048 | 290.8333 | 0.0048 | 1 | 4 | galanin receptor activity |
| GO:0051434 | 0.0048 | 290.8333 | 0.0048 | 1 | 4 | BH3 domain binding |
| GO:0030284 | 0.006 | 218.1111 | 0.006 | 1 | 5 | estrogen receptor activity |
| GOMFID | Pvalue | OddsRatio | ExpCount | Count | Size | Term |
| GO:0008725 | 0.0023 | Inf | 0.0023 | 1 | 1 | DNA-3-methyladenine glycosylase activity |
| GO:0016807 | 0.0023 | Inf | 0.0023 | 1 | 1 | cysteine-type carboxypeptidase activity |
| GO:0043916 | 0.0023 | Inf | 0.0023 | 1 | 1 | DNA-7-methylguanine glycosylase activity |
| GO:0052731 | 0.0023 | Inf | 0.0023 | 1 | 1 | phosphocholine phosphatase activity |
| GO:0052732 | 0.0023 | Inf | 0.0023 | 1 | 1 | phosphoethanolamine phosphatase activity |
| GO:0052821 | 0.0023 | Inf | 0.0023 | 1 | 1 | DNA-7-methyladenine glycosylase activity |
| GO:0052822 | 0.0023 | Inf | 0.0023 | 1 | 1 | DNA-3-methylguanine glycosylase activity |
| GO:0004478 | 0.0046 | 448.2857 | 0.0046 | 1 | 2 | methionine adenosyltransferase activity |
| GO:0043565 | 0.0065 | 3.6038 | 2.2707 | 7 | 992 | sequence-specific DNA binding |
| GO:0008401 | 0.0069 | 224.1286 | 0.0069 | 1 | 3 | retinoic acid 4-hydroxylase activity |
| GO:0030984 | 0.0069 | 224.1286 | 0.0069 | 1 | 3 | kininogen binding |
| GO:0019788 | 0.0091 | 149.4095 | 0.0092 | 1 | 4 | NEDD8 transferase activity |
| GOMFID | Pvalue | OddsRatio | ExpCount | Count | Size | Term |
| GO:0004930 | 0.0029 | 8.6257 | 0.6398 | 4 | 774 | G-protein coupled receptor activity |
| GO:0004984 | 0.003 | 12.7587 | 0.3009 | 3 | 364 | olfactory receptor activity |
| GOMFID | Pvalue | OddsRatio | ExpCount | Count | Size | Term |
| GO:0008821 | 0 | 523.5333 | 0.0065 | 2 | 6 | crossover junction endodeoxyribonuclease activity |
| GO:0017108 | 0 | 523.5333 | 0.0065 | 2 | 6 | 5'-flap endonuclease activity |
| GO:0016894 | 2e-04 | 123.0824 | 0.0205 | 2 | 19 | endonuclease activity, active with either ribo- or deoxyribonucleic acids and producing 3'-phosphomonoesters |
| GO:0004984 | 5e-04 | 13.1197 | 0.3935 | 4 | 364 | olfactory receptor activity |
| GO:0016893 | 7e-04 | 59.7143 | 0.04 | 2 | 37 | endonuclease activity, active with either ribo- or deoxyribonucleic acids and producing 5'-phosphomonoesters |
| GO:0004520 | 0.0012 | 46.4148 | 0.0508 | 2 | 47 | endodeoxyribonuclease activity |
| GO:0005198 | 0.0053 | 6.843 | 0.735 | 4 | 680 | structural molecule activity |
| GO:0008508 | 0.0054 | 245.4062 | 0.0054 | 1 | 5 | bile acid:sodium symporter activity |
| GO:0052689 | 0.0071 | 17.9241 | 0.1276 | 2 | 118 | carboxylic ester hydrolase activity |
| GO:0004930 | 0.0083 | 5.97 | 0.8367 | 4 | 774 | G-protein coupled receptor activity |
| GOMFID | Pvalue | OddsRatio | ExpCount | Count | Size | Term |
| GO:0036105 | 0.0011 | Inf | 0.0011 | 1 | 1 | peroxisome membrane class-1 targeting sequence binding |
| GO:0070180 | 0.0011 | Inf | 0.0011 | 1 | 1 | large ribosomal subunit rRNA binding |
| GO:0009019 | 0.0022 | 981.8125 | 0.0022 | 1 | 2 | tRNA (guanine-N1-)-methyltransferase activity |
| GO:0016429 | 0.0032 | 490.875 | 0.0032 | 1 | 3 | tRNA (adenine-N1-)-methyltransferase activity |
| GO:0016503 | 0.0032 | 490.875 | 0.0032 | 1 | 3 | pheromone receptor activity |
| GO:0005549 | 0.0036 | 25.7267 | 0.0897 | 2 | 83 | odorant binding |
| GO:0004871 | 0.0046 | 4.937 | 1.696 | 6 | 1569 | signal transducer activity |
| GO:0000268 | 0.0054 | 245.4062 | 0.0054 | 1 | 5 | peroxisome targeting sequence binding |
| GO:0001222 | 0.0086 | 140.2054 | 0.0086 | 1 | 8 | transcription corepressor binding |
| GOMFID | Pvalue | OddsRatio | ExpCount | Count | Size | Term |
| GO:0046964 | 0.0013 | Inf | 0.0013 | 1 | 1 | 3'-phosphoadenosine 5'-phosphosulfate transmembrane transporter activity |
| GO:0072572 | 0.0013 | Inf | 0.0013 | 1 | 1 | poly-ADP-D-ribose binding |
| GO:0017099 | 0.0027 | 785.25 | 0.0027 | 1 | 2 | very-long-chain-acyl-CoA dehydrogenase activity |
| GO:0015216 | 0.0067 | 196.275 | 0.0067 | 1 | 5 | purine nucleotide transmembrane transporter activity |
| GOMFID | Pvalue | OddsRatio | ExpCount | Count | Size | Term |
| GO:0001664 | 3e-04 | 14.7872 | 0.3338 | 4 | 250 | G-protein coupled receptor binding |
| GO:0004145 | 0.0013 | Inf | 0.0013 | 1 | 1 | diamine N-acetyltransferase activity |
| GO:0015052 | 0.0013 | Inf | 0.0013 | 1 | 1 | beta3-adrenergic receptor activity |
| GO:0008009 | 0.0018 | 35.8352 | 0.0641 | 2 | 48 | chemokine activity |
| GO:0003735 | 0.0021 | 13.467 | 0.2604 | 3 | 195 | structural constituent of ribosome |
| GO:0005133 | 0.0027 | 785.25 | 0.0027 | 1 | 2 | interferon-gamma receptor binding |
| GO:0031699 | 0.0027 | 785.25 | 0.0027 | 1 | 2 | beta-3 adrenergic receptor binding |
| GO:0051380 | 0.0053 | 261.7167 | 0.0053 | 1 | 4 | norepinephrine binding |
| GO:0008532 | 0.0067 | 196.275 | 0.0067 | 1 | 5 | N-acetyllactosaminide beta-1,3-N-acetylglucosaminyltransferase activity |
| GO:0030911 | 0.0067 | 196.275 | 0.0067 | 1 | 5 | TPR domain binding |
| GO:0031726 | 0.008 | 157.01 | 0.008 | 1 | 6 | CCR1 chemokine receptor binding |
| GO:0031730 | 0.008 | 157.01 | 0.008 | 1 | 6 | CCR5 chemokine receptor binding |
| GO:0051379 | 0.008 | 157.01 | 0.008 | 1 | 6 | epinephrine binding |
| GO:0003680 | 0.0093 | 130.8333 | 0.0093 | 1 | 7 | AT DNA binding |
| GOMFID | Pvalue | OddsRatio | ExpCount | Count | Size | Term |
| GO:0003735 | 1e-04 | 21.6642 | 0.2356 | 4 | 195 | structural constituent of ribosome |
| GO:0031857 | 0.0012 | Inf | 0.0012 | 1 | 1 | type 1 parathyroid hormone receptor binding |
| GO:0019843 | 0.0016 | 39.2015 | 0.0592 | 2 | 49 | rRNA binding |
| GO:0004756 | 0.0024 | 872.6111 | 0.0024 | 1 | 2 | selenide, water dikinase activity |
| GO:0004758 | 0.006 | 218.1111 | 0.006 | 1 | 5 | serine C-palmitoyltransferase activity |
| GO:0031386 | 0.0096 | 124.6111 | 0.0097 | 1 | 8 | protein tag |
| GOMFID | Pvalue | OddsRatio | ExpCount | Count | Size | Term |
| GO:0004984 | 1e-04 | 21.3264 | 0.2777 | 4 | 364 | olfactory receptor activity |
| GO:0099600 | 0.0013 | 8.6088 | 0.9225 | 5 | 1209 | transmembrane receptor activity |
| GO:0038023 | 0.0016 | 8.2157 | 0.9629 | 5 | 1262 | signaling receptor activity |
| GO:0004930 | 0.0021 | 9.7045 | 0.5906 | 4 | 774 | G-protein coupled receptor activity |
| GO:0004461 | 0.0023 | 714.2273 | 0.0023 | 1 | 3 | lactose synthase activity |
| GO:0060089 | 0.0035 | 6.8041 | 1.143 | 5 | 1498 | molecular transducer activity |
| NA. |
| n/a |
| NA. |
| n/a |
| NA. |
| n/a |
| NA. |
| n/a |
| NA. |
| n/a |
| NA. |
| n/a |
| NA. |
| n/a |
| NA. |
| n/a |
| NA. |
| n/a |
| NA. |
| n/a |
| NA. |
| n/a |
| NA. |
| n/a |
| NA. |
| n/a |
| NA. |
| n/a |
| NA. |
| n/a |
| NA. |
| n/a |
| NA. |
| n/a |
| NA. |
| n/a |
| NA. |
| n/a |
| NA. |
| n/a |
| NA. |
| n/a |
| NA. |
| n/a |
| NA. |
| n/a |
| NA. |
| n/a |
| NA. |
| n/a |
| NA. |
| n/a |
| NA. |
| n/a |
| NA. |
| n/a |
| NA. |
| n/a |
| NA. |
| n/a |
| NA. |
| n/a |
| NA. |
| n/a |
| NA. |
| n/a |
| NA. |
| n/a |
| NA. |
| n/a |
| NA. |
| n/a |
| NA. |
| n/a |
| NA. |
| n/a |
| NA. |
| n/a |
| NA. |
| n/a |
| NA. |
| n/a |
| NA. |
| n/a |
| NA. |
| n/a |
| NA. |
| n/a |
| NA. |
| n/a |
| NA. |
| n/a |
| NA. |
| n/a |
| NA. |
| n/a |
| NA. |
| n/a |
| NA. |
| n/a |
| NA. |
| n/a |
| NA. |
| n/a |
| NA. |
| n/a |
| NA. |
| n/a |
| NA. |
| n/a |
| NA. |
| n/a |
| NA. |
| n/a |
| NA. |
| n/a |
| NA. |
| n/a |
| NA. |
| n/a |
| NA. |
| n/a |
| NA. |
| n/a |
| NA. |
| n/a |
| NA. |
| n/a |
| GOMFID | Pvalue | OddsRatio | ExpCount | Count | Size | Term |
| GO:0010939 | 2e-04 | 29.242 | 0.1187 | 3 | 32 | regulation of necrotic cell death |
| GO:0070266 | 3e-04 | 26.4955 | 0.1298 | 3 | 35 | necroptotic process |
| GO:0038061 | 6e-04 | 11.5802 | 0.3821 | 4 | 103 | NIK/NF-kappaB signaling |
| GO:0006732 | 7e-04 | 6.1907 | 1.0796 | 6 | 291 | coenzyme metabolic process |
| GO:0051188 | 0.0025 | 7.6178 | 0.5713 | 4 | 154 | cofactor biosynthetic process |
| GO:0033209 | 0.003 | 7.2748 | 0.5973 | 4 | 161 | tumor necrosis factor-mediated signaling pathway |
| GO:0034612 | 0.0033 | 5.4092 | 1.0091 | 5 | 272 | response to tumor necrosis factor |
| GO:0036031 | 0.0037 | Inf | 0.0037 | 1 | 1 | recruitment of mRNA capping enzyme to RNA polymerase II holoenzyme complex |
| GO:1900085 | 0.0037 | Inf | 0.0037 | 1 | 1 | negative regulation of peptidyl-tyrosine autophosphorylation |
| GO:1904779 | 0.0037 | Inf | 0.0037 | 1 | 1 | regulation of protein localization to centrosome |
| GO:0032446 | 0.0038 | 3.2181 | 3.1534 | 9 | 850 | protein modification by small protein conjugation |
| GO:0071345 | 0.0053 | 3.287 | 2.7119 | 8 | 731 | cellular response to cytokine stimulus |
| GO:0060429 | 0.0061 | 2.8103 | 4.0252 | 10 | 1085 | epithelium development |
| GO:0050931 | 0.0066 | 17.909 | 0.1224 | 2 | 33 | pigment cell differentiation |
| GO:0009107 | 0.0074 | 273.2456 | 0.0074 | 1 | 2 | lipoate biosynthetic process |
| GO:0046452 | 0.0074 | 273.2456 | 0.0074 | 1 | 2 | dihydrofolate metabolic process |
| GO:0086098 | 0.0074 | 273.2456 | 0.0074 | 1 | 2 | angiotensin-activated signaling pathway involved in heart process |
| GO:1903598 | 0.0074 | 273.2456 | 0.0074 | 1 | 2 | positive regulation of gap junction assembly |
| GO:0017015 | 0.0077 | 7.9605 | 0.4044 | 3 | 109 | regulation of transforming growth factor beta receptor signaling pathway |
| GO:0006040 | 0.0079 | 16.3256 | 0.1336 | 2 | 36 | amino sugar metabolic process |
| GO:0046794 | 0.0079 | 16.3256 | 0.1336 | 2 | 36 | transport of virus |
| GO:0000209 | 0.0083 | 5.3941 | 0.7976 | 4 | 215 | protein polyubiquitination |
| GO:1902579 | 0.0083 | 15.8582 | 0.1373 | 2 | 37 | multi-organism localization |
| GO:0002223 | 0.0096 | 7.3333 | 0.4378 | 3 | 118 | stimulatory C-type lectin receptor signaling pathway |
| GO:0035338 | 0.0096 | 14.6034 | 0.1484 | 2 | 40 | long-chain fatty-acyl-CoA biosynthetic process |
| GO:0036297 | 0.0096 | 14.6034 | 0.1484 | 2 | 40 | interstrand cross-link repair |
| GOMFID | Pvalue | OddsRatio | ExpCount | Count | Size | Term |
| GO:0002483 | 0.0022 | 33.2201 | 0.071 | 2 | 15 | antigen processing and presentation of endogenous peptide antigen |
| GO:0016032 | 0.0034 | 3.0302 | 3.6588 | 10 | 773 | viral process |
| GO:0045089 | 0.0042 | 4.2565 | 1.5241 | 6 | 322 | positive regulation of innate immune response |
| GO:0044419 | 0.0047 | 2.879 | 3.8387 | 10 | 811 | interspecies interaction between organisms |
| GO:0001193 | 0.0047 | Inf | 0.0047 | 1 | 1 | maintenance of transcriptional fidelity during DNA-templated transcription elongation from RNA polymerase II promoter |
| GO:0006174 | 0.0047 | Inf | 0.0047 | 1 | 1 | dADP phosphorylation |
| GO:0006186 | 0.0047 | Inf | 0.0047 | 1 | 1 | dGDP phosphorylation |
| GO:0006756 | 0.0047 | Inf | 0.0047 | 1 | 1 | AMP phosphorylation |
| GO:0050823 | 0.0047 | Inf | 0.0047 | 1 | 1 | peptide antigen stabilization |
| GO:0051232 | 0.0047 | Inf | 0.0047 | 1 | 1 | meiotic spindle elongation |
| GO:0061508 | 0.0047 | Inf | 0.0047 | 1 | 1 | CDP phosphorylation |
| GO:0061565 | 0.0047 | Inf | 0.0047 | 1 | 1 | dAMP phosphorylation |
| GO:0061566 | 0.0047 | Inf | 0.0047 | 1 | 1 | CMP phosphorylation |
| GO:0061567 | 0.0047 | Inf | 0.0047 | 1 | 1 | dCMP phosphorylation |
| GO:0061568 | 0.0047 | Inf | 0.0047 | 1 | 1 | GDP phosphorylation |
| GO:0061569 | 0.0047 | Inf | 0.0047 | 1 | 1 | UDP phosphorylation |
| GO:0061570 | 0.0047 | Inf | 0.0047 | 1 | 1 | dCDP phosphorylation |
| GO:0061571 | 0.0047 | Inf | 0.0047 | 1 | 1 | TDP phosphorylation |
| GO:1902389 | 0.0047 | Inf | 0.0047 | 1 | 1 | ceramide 1-phosphate transport |
| GO:1903538 | 0.0047 | Inf | 0.0047 | 1 | 1 | regulation of meiotic cell cycle process involved in oocyte maturation |
| GO:0002479 | 0.0048 | 9.4862 | 0.3408 | 3 | 72 | antigen processing and presentation of exogenous peptide antigen via MHC class I, TAP-dependent |
| GO:0008380 | 0.0064 | 3.8798 | 1.6661 | 6 | 352 | RNA splicing |
| GO:0048710 | 0.0067 | 17.9815 | 0.1231 | 2 | 26 | regulation of astrocyte differentiation |
| GO:0002478 | 0.0079 | 5.4314 | 0.7857 | 4 | 166 | antigen processing and presentation of exogenous peptide antigen |
| GO:0034587 | 0.0083 | 15.9805 | 0.1373 | 2 | 29 | piRNA metabolic process |
| GO:0002639 | 0.0088 | 15.4087 | 0.142 | 2 | 30 | positive regulation of immunoglobulin production |
| GO:0032759 | 0.0094 | 213.137 | 0.0095 | 1 | 2 | positive regulation of TRAIL production |
| GO:0072709 | 0.0094 | 213.137 | 0.0095 | 1 | 2 | cellular response to sorbitol |
| GOMFID | Pvalue | OddsRatio | ExpCount | Count | Size | Term |
| GO:0050880 | 0.0014 | 9.0847 | 0.4836 | 4 | 140 | regulation of blood vessel size |
| GO:0051341 | 0.003 | 11.2556 | 0.2901 | 3 | 84 | regulation of oxidoreductase activity |
| GO:1903522 | 0.0032 | 5.4567 | 1.0051 | 5 | 291 | regulation of blood circulation |
| GO:0010232 | 0.0035 | Inf | 0.0035 | 1 | 1 | vascular transport |
| GO:0060156 | 0.0035 | Inf | 0.0035 | 1 | 1 | milk ejection |
| GO:0071449 | 0.0035 | Inf | 0.0035 | 1 | 1 | cellular response to lipid hydroperoxide |
| GO:1904886 | 0.0035 | Inf | 0.0035 | 1 | 1 | beta-catenin destruction complex disassembly |
| GO:0042221 | 0.0039 | 2.1875 | 14.493 | 24 | 4196 | response to chemical |
| GO:0045907 | 0.0058 | 19.2916 | 0.114 | 2 | 33 | positive regulation of vasoconstriction |
| GO:0009605 | 0.0062 | 2.3089 | 8.3553 | 16 | 2419 | response to external stimulus |
| GO:0000738 | 0.0069 | 293.9434 | 0.0069 | 1 | 2 | DNA catabolic process, exonucleolytic |
| GO:0003294 | 0.0069 | 293.9434 | 0.0069 | 1 | 2 | atrial ventricular junction remodeling |
| GO:0010652 | 0.0069 | 293.9434 | 0.0069 | 1 | 2 | positive regulation of cell communication by chemical coupling |
| GO:0015920 | 0.0069 | 293.9434 | 0.0069 | 1 | 2 | lipopolysaccharide transport |
| GO:0034224 | 0.0069 | 293.9434 | 0.0069 | 1 | 2 | cellular response to zinc ion starvation |
| GO:0036496 | 0.0069 | 293.9434 | 0.0069 | 1 | 2 | regulation of translational initiation by eIF2 alpha dephosphorylation |
| GO:0042309 | 0.0069 | 293.9434 | 0.0069 | 1 | 2 | homoiothermy |
| GO:0060265 | 0.0069 | 293.9434 | 0.0069 | 1 | 2 | positive regulation of respiratory burst involved in inflammatory response |
| GO:1901877 | 0.0069 | 293.9434 | 0.0069 | 1 | 2 | negative regulation of calcium ion binding |
| GO:0042596 | 0.0072 | 17.0824 | 0.1278 | 2 | 37 | fear response |
| GO:0001508 | 0.0075 | 8.0515 | 0.4007 | 3 | 116 | action potential |
| GOMFID | Pvalue | OddsRatio | ExpCount | Count | Size | Term |
| GO:0030887 | 1e-04 | 432.1944 | 0.0142 | 2 | 3 | positive regulation of myeloid dendritic cell activation |
| GO:2000502 | 1e-04 | 432.1944 | 0.0142 | 2 | 3 | negative regulation of natural killer cell chemotaxis |
| GO:1901564 | 2e-04 | 2.7419 | 9.9493 | 22 | 2102 | organonitrogen compound metabolic process |
| GO:0015942 | 3e-04 | 108.0278 | 0.0284 | 2 | 6 | formate metabolic process |
| GO:0070328 | 4e-04 | 23.4386 | 0.1467 | 3 | 31 | triglyceride homeostasis |
| GO:0048702 | 5e-04 | 86.4167 | 0.0331 | 2 | 7 | embryonic neurocranium morphogenesis |
| GO:2000402 | 5e-04 | 86.4167 | 0.0331 | 2 | 7 | negative regulation of lymphocyte migration |
| GO:0008652 | 7e-04 | 10.9199 | 0.4023 | 4 | 85 | cellular amino acid biosynthetic process |
| GO:0002855 | 8e-04 | 61.7183 | 0.0426 | 2 | 9 | regulation of natural killer cell mediated immune response to tumor cell |
| GO:0002860 | 8e-04 | 61.7183 | 0.0426 | 2 | 9 | positive regulation of natural killer cell mediated cytotoxicity directed against tumor cell target |
| GO:0035999 | 0.001 | 54 | 0.0473 | 2 | 10 | tetrahydrofolate interconversion |
| GO:0002839 | 0.0012 | 47.9969 | 0.0521 | 2 | 11 | positive regulation of immune response to tumor cell |
| GO:0009396 | 0.0012 | 47.9969 | 0.0521 | 2 | 11 | folic acid-containing compound biosynthetic process |
| GO:0002834 | 0.0014 | 43.1944 | 0.0568 | 2 | 12 | regulation of response to tumor cell |
| GO:0002689 | 0.0017 | 39.2652 | 0.0615 | 2 | 13 | negative regulation of leukocyte chemotaxis |
| GO:0006809 | 0.0033 | 10.9155 | 0.2982 | 3 | 63 | nitric oxide biosynthetic process |
| GO:0042446 | 0.0034 | 10.7359 | 0.3029 | 3 | 64 | hormone biosynthetic process |
| GO:0008589 | 0.0038 | 10.3937 | 0.3124 | 3 | 66 | regulation of smoothened signaling pathway |
| GO:1901623 | 0.004 | 23.9846 | 0.0947 | 2 | 20 | regulation of lymphocyte chemotaxis |
| GO:0001756 | 0.0041 | 10.0726 | 0.3219 | 3 | 68 | somitogenesis |
| GO:0002717 | 0.0044 | 22.7208 | 0.0994 | 2 | 21 | positive regulation of natural killer cell mediated immunity |
| GO:0006174 | 0.0047 | Inf | 0.0047 | 1 | 1 | dADP phosphorylation |
| GO:0006186 | 0.0047 | Inf | 0.0047 | 1 | 1 | dGDP phosphorylation |
| GO:0006713 | 0.0047 | Inf | 0.0047 | 1 | 1 | glucocorticoid catabolic process |
| GO:0006756 | 0.0047 | Inf | 0.0047 | 1 | 1 | AMP phosphorylation |
| GO:0019510 | 0.0047 | Inf | 0.0047 | 1 | 1 | S-adenosylhomocysteine catabolic process |
| GO:0035350 | 0.0047 | Inf | 0.0047 | 1 | 1 | FAD transmembrane transport |
| GO:0045887 | 0.0047 | Inf | 0.0047 | 1 | 1 | positive regulation of synaptic growth at neuromuscular junction |
| GO:0046657 | 0.0047 | Inf | 0.0047 | 1 | 1 | folic acid catabolic process |
| GO:0050823 | 0.0047 | Inf | 0.0047 | 1 | 1 | peptide antigen stabilization |
| GO:0061508 | 0.0047 | Inf | 0.0047 | 1 | 1 | CDP phosphorylation |
| GO:0061565 | 0.0047 | Inf | 0.0047 | 1 | 1 | dAMP phosphorylation |
| GO:0061566 | 0.0047 | Inf | 0.0047 | 1 | 1 | CMP phosphorylation |
| GO:0061567 | 0.0047 | Inf | 0.0047 | 1 | 1 | dCMP phosphorylation |
| GO:0061568 | 0.0047 | Inf | 0.0047 | 1 | 1 | GDP phosphorylation |
| GO:0061569 | 0.0047 | Inf | 0.0047 | 1 | 1 | UDP phosphorylation |
| GO:0061570 | 0.0047 | Inf | 0.0047 | 1 | 1 | dCDP phosphorylation |
| GO:0061571 | 0.0047 | Inf | 0.0047 | 1 | 1 | TDP phosphorylation |
| GO:0071268 | 0.0047 | Inf | 0.0047 | 1 | 1 | homocysteine biosynthetic process |
| GO:0090321 | 0.0047 | Inf | 0.0047 | 1 | 1 | positive regulation of chylomicron remnant clearance |
| GO:0003416 | 0.0048 | 21.5833 | 0.1041 | 2 | 22 | endochondral bone growth |
| GO:0042632 | 0.0048 | 9.4862 | 0.3408 | 3 | 72 | cholesterol homeostasis |
| GO:0010575 | 0.0062 | 18.7645 | 0.1183 | 2 | 25 | positive regulation of vascular endothelial growth factor production |
| GO:2001057 | 0.0069 | 8.2801 | 0.3881 | 3 | 82 | reactive nitrogen species metabolic process |
| GO:0006766 | 0.0083 | 5.3645 | 0.7952 | 4 | 168 | vitamin metabolic process |
| GO:0001843 | 0.0086 | 7.6027 | 0.4213 | 3 | 89 | neural tube closure |
| GO:0006427 | 0.0094 | 213.137 | 0.0095 | 1 | 2 | histidyl-tRNA aminoacylation |
| GO:0006529 | 0.0094 | 213.137 | 0.0095 | 1 | 2 | asparagine biosynthetic process |
| GO:0015866 | 0.0094 | 213.137 | 0.0095 | 1 | 2 | ADP transport |
| GO:0015920 | 0.0094 | 213.137 | 0.0095 | 1 | 2 | lipopolysaccharide transport |
| GO:0016256 | 0.0094 | 213.137 | 0.0095 | 1 | 2 | N-glycan processing to lysosome |
| GO:0035349 | 0.0094 | 213.137 | 0.0095 | 1 | 2 | coenzyme A transmembrane transport |
| GO:0042357 | 0.0094 | 213.137 | 0.0095 | 1 | 2 | thiamine diphosphate metabolic process |
| GO:0043132 | 0.0094 | 213.137 | 0.0095 | 1 | 2 | NAD transport |
| GO:0045175 | 0.0094 | 213.137 | 0.0095 | 1 | 2 | basal protein localization |
| GO:0048210 | 0.0094 | 213.137 | 0.0095 | 1 | 2 | Golgi vesicle fusion to target membrane |
| GO:0060434 | 0.0094 | 213.137 | 0.0095 | 1 | 2 | bronchus morphogenesis |
| GO:0080121 | 0.0094 | 213.137 | 0.0095 | 1 | 2 | AMP transport |
| GO:0099601 | 0.0094 | 213.137 | 0.0095 | 1 | 2 | regulation of neurotransmitter receptor activity |
| GOMFID | Pvalue | OddsRatio | ExpCount | Count | Size | Term |
| GO:0009650 | 5e-04 | 72.4605 | 0.0345 | 2 | 12 | UV protection |
| GO:0007565 | 0.0023 | 7.9071 | 0.5584 | 4 | 194 | female pregnancy |
| GO:0015878 | 0.0029 | Inf | 0.0029 | 1 | 1 | biotin transport |
| GO:0015887 | 0.0029 | Inf | 0.0029 | 1 | 1 | pantothenate transmembrane transport |
| GO:0015913 | 0.0029 | Inf | 0.0029 | 1 | 1 | short-chain fatty acid import |
| GO:0006979 | 0.0046 | 5.0575 | 1.0966 | 5 | 381 | response to oxidative stress |
| GO:0048016 | 0.0048 | 21.2791 | 0.1036 | 2 | 36 | inositol phosphate-mediated signaling |
| GO:0032289 | 0.0057 | 354.2727 | 0.0058 | 1 | 2 | central nervous system myelin formation |
| GO:0035279 | 0.0057 | 354.2727 | 0.0058 | 1 | 2 | mRNA cleavage involved in gene silencing by miRNA |
| GO:0070075 | 0.0057 | 354.2727 | 0.0058 | 1 | 2 | tear secretion |
| GO:1904431 | 0.0057 | 354.2727 | 0.0058 | 1 | 2 | positive regulation of t-circle formation |
| GO:0032355 | 0.0083 | 7.7701 | 0.4174 | 3 | 145 | response to estradiol |
| GO:0000720 | 0.0086 | 177.125 | 0.0086 | 1 | 3 | pyrimidine dimer repair by nucleotide-excision repair |
| GO:0006295 | 0.0086 | 177.125 | 0.0086 | 1 | 3 | nucleotide-excision repair, DNA incision, 3'-to lesion |
| GO:0006296 | 0.0086 | 177.125 | 0.0086 | 1 | 3 | nucleotide-excision repair, DNA incision, 5'-to lesion |
| GO:0010961 | 0.0086 | 177.125 | 0.0086 | 1 | 3 | cellular magnesium ion homeostasis |
| GO:0035166 | 0.0086 | 177.125 | 0.0086 | 1 | 3 | post-embryonic hemopoiesis |
| GO:0046942 | 0.0089 | 5.3341 | 0.8174 | 4 | 284 | carboxylic acid transport |
| GO:0001755 | 0.0098 | 14.4549 | 0.1497 | 2 | 52 | neural crest cell migration |
| GOMFID | Pvalue | OddsRatio | ExpCount | Count | Size | Term |
| GO:0014059 | 0.001 | 50.2613 | 0.0464 | 2 | 22 | regulation of dopamine secretion |
| GO:0000281 | 0.0018 | 35.8825 | 0.0633 | 2 | 30 | mitotic cytokinesis |
| GO:0000066 | 0.0021 | Inf | 0.0021 | 1 | 1 | mitochondrial ornithine transport |
| GO:0035998 | 0.0021 | Inf | 0.0021 | 1 | 1 | 7,8-dihydroneopterin 3'-triphosphate biosynthetic process |
| GO:0015872 | 0.0022 | 32.4037 | 0.0697 | 2 | 33 | dopamine transport |
| GO:0050432 | 0.004 | 23.3428 | 0.095 | 2 | 45 | catecholamine secretion |
| GO:0007092 | 0.0042 | 487.5 | 0.0042 | 1 | 2 | activation of APC-Cdc20 complex activity |
| GO:0014916 | 0.0042 | 487.5 | 0.0042 | 1 | 2 | regulation of lung blood pressure |
| GO:0070194 | 0.0042 | 487.5 | 0.0042 | 1 | 2 | synaptonemal complex disassembly |
| GO:1904009 | 0.0042 | 487.5 | 0.0042 | 1 | 2 | cellular response to monosodium glutamate |
| GO:0045840 | 0.0044 | 22.3025 | 0.0992 | 2 | 47 | positive regulation of mitotic nuclear division |
| GO:0016321 | 0.0063 | 243.7344 | 0.0063 | 1 | 3 | female meiosis chromosome segregation |
| GO:0055014 | 0.0063 | 243.7344 | 0.0063 | 1 | 3 | atrial cardiac muscle cell development |
| GO:1903352 | 0.0063 | 243.7344 | 0.0063 | 1 | 3 | L-ornithine transmembrane transport |
| GO:2001168 | 0.0084 | 162.4792 | 0.0084 | 1 | 4 | positive regulation of histone H2B ubiquitination |
| GO:0015844 | 0.0088 | 15.4203 | 0.1414 | 2 | 67 | monoamine transport |
| GO:0001649 | 0.009 | 7.6617 | 0.4306 | 3 | 204 | osteoblast differentiation |
| GO:0051952 | 0.0093 | 14.9581 | 0.1456 | 2 | 69 | regulation of amine transport |
| GOMFID | Pvalue | OddsRatio | ExpCount | Count | Size | Term |
| GO:0055006 | 0.0014 | 43.2222 | 0.0555 | 2 | 62 | cardiac cell development |
| GO:0002576 | 0.0023 | 32.7869 | 0.0725 | 2 | 81 | platelet degranulation |
| GO:0030241 | 0.0027 | 600.6923 | 0.0027 | 1 | 3 | skeletal muscle myosin thick filament assembly |
| GO:0048769 | 0.0027 | 600.6923 | 0.0027 | 1 | 3 | sarcomerogenesis |
| GO:0055014 | 0.0027 | 600.6923 | 0.0027 | 1 | 3 | atrial cardiac muscle cell development |
| GO:0055007 | 0.0032 | 27.8262 | 0.0851 | 2 | 95 | cardiac muscle cell differentiation |
| GO:0031034 | 0.0036 | 400.4359 | 0.0036 | 1 | 4 | myosin filament assembly |
| GO:0035995 | 0.0036 | 400.4359 | 0.0036 | 1 | 4 | detection of muscle stretch |
| GO:0051919 | 0.0036 | 400.4359 | 0.0036 | 1 | 4 | positive regulation of fibrinolysis |
| GO:2000048 | 0.0036 | 400.4359 | 0.0036 | 1 | 4 | negative regulation of cell-cell adhesion mediated by cadherin |
| GO:0030240 | 0.0045 | 300.3077 | 0.0045 | 1 | 5 | skeletal muscle thin filament assembly |
| GO:0048496 | 0.0045 | 300.3077 | 0.0045 | 1 | 5 | maintenance of organ identity |
| GO:2000253 | 0.0063 | 200.1795 | 0.0063 | 1 | 7 | positive regulation of feeding behavior |
| GO:0055002 | 0.0065 | 19.1173 | 0.1227 | 2 | 137 | striated muscle cell development |
| GO:0048739 | 0.0071 | 171.5714 | 0.0072 | 1 | 8 | cardiac muscle fiber development |
| GO:0006694 | 0.0076 | 17.5431 | 0.1334 | 2 | 149 | steroid biosynthetic process |
| GO:0071625 | 0.008 | 150.1154 | 0.0081 | 1 | 9 | vocalization behavior |
| GO:0051918 | 0.0089 | 133.4274 | 0.009 | 1 | 10 | negative regulation of fibrinolysis |
| GO:0090129 | 0.0098 | 120.0769 | 0.0099 | 1 | 11 | positive regulation of synapse maturation |
| GOMFID | Pvalue | OddsRatio | ExpCount | Count | Size | Term |
| GO:0016874 | 5e-04 | 5.6098 | 1.406 | 7 | 380 | ligase activity |
| GO:0004139 | 0.0037 | Inf | 0.0037 | 1 | 1 | deoxyribose-phosphate aldolase activity |
| GO:0004913 | 0.0037 | Inf | 0.0037 | 1 | 1 | interleukin-4 receptor activity |
| GO:0018169 | 0.0037 | Inf | 0.0037 | 1 | 1 | ribosomal S6-glutamic acid ligase activity |
| GO:0033819 | 0.0037 | Inf | 0.0037 | 1 | 1 | lipoyl(octanoyl) transferase activity |
| GO:0070320 | 0.0037 | Inf | 0.0037 | 1 | 1 | inward rectifier potassium channel inhibitor activity |
| GO:0001042 | 0.0074 | 273.9825 | 0.0074 | 1 | 2 | RNA polymerase I core binding |
| GO:0001179 | 0.0074 | 273.9825 | 0.0074 | 1 | 2 | RNA polymerase I transcription factor binding |
| GO:0002094 | 0.0074 | 273.9825 | 0.0074 | 1 | 2 | polyprenyltransferase activity |
| GO:0003977 | 0.0074 | 273.9825 | 0.0074 | 1 | 2 | UDP-N-acetylglucosamine diphosphorylase activity |
| GO:0004146 | 0.0074 | 273.9825 | 0.0074 | 1 | 2 | dihydrofolate reductase activity |
| GO:0008781 | 0.0074 | 273.9825 | 0.0074 | 1 | 2 | N-acylneuraminate cytidylyltransferase activity |
| GO:0016415 | 0.0074 | 273.9825 | 0.0074 | 1 | 2 | octanoyltransferase activity |
| GO:1990715 | 0.0074 | 273.9825 | 0.0074 | 1 | 2 | mRNA CDS binding |
| GOMFID | Pvalue | OddsRatio | ExpCount | Count | Size | Term |
| GO:0042288 | 1e-04 | 43.907 | 0.085 | 3 | 18 | MHC class I protein binding |
| GO:0005134 | 2e-04 | 144.4352 | 0.0236 | 2 | 5 | interleukin-2 receptor binding |
| GO:0004458 | 0.0047 | Inf | 0.0047 | 1 | 1 | D-lactate dehydrogenase (cytochrome) activity |
| GO:0005519 | 0.0047 | Inf | 0.0047 | 1 | 1 | cytoskeletal regulatory protein binding |
| GO:0008545 | 0.0047 | Inf | 0.0047 | 1 | 1 | JUN kinase kinase activity |
| GO:0033919 | 0.0047 | Inf | 0.0047 | 1 | 1 | glucan 1,3-alpha-glucosidase activity |
| GO:0047395 | 0.0047 | Inf | 0.0047 | 1 | 1 | glycerophosphoinositol glycerophosphodiesterase activity |
| GO:0050104 | 0.0047 | Inf | 0.0047 | 1 | 1 | L-gulonate 3-dehydrogenase activity |
| GO:1902387 | 0.0047 | Inf | 0.0047 | 1 | 1 | ceramide 1-phosphate binding |
| GO:1902388 | 0.0047 | Inf | 0.0047 | 1 | 1 | ceramide 1-phosphate transporter activity |
| GO:0042605 | 0.0057 | 19.6717 | 0.1133 | 2 | 24 | peptide antigen binding |
| GO:0001641 | 0.0094 | 213.7123 | 0.0094 | 1 | 2 | group II metabotropic glutamate receptor activity |
| GO:0015433 | 0.0094 | 213.7123 | 0.0094 | 1 | 2 | peptide antigen-transporting ATPase activity |
| GO:0036505 | 0.0094 | 213.7123 | 0.0094 | 1 | 2 | prosaposin receptor activity |
| GO:0050145 | 0.0094 | 213.7123 | 0.0094 | 1 | 2 | nucleoside phosphate kinase activity |
| GOMFID | Pvalue | OddsRatio | ExpCount | Count | Size | Term |
| GO:0004742 | 0.0026 | Inf | 0.0026 | 1 | 1 | dihydrolipoyllysine-residue acetyltransferase activity |
| GO:0008859 | 0.0026 | Inf | 0.0026 | 1 | 1 | exoribonuclease II activity |
| GO:0008887 | 0.0026 | Inf | 0.0026 | 1 | 1 | glycerate kinase activity |
| GO:0033989 | 0.0026 | Inf | 0.0026 | 1 | 1 | 3alpha,7alpha,12alpha-trihydroxy-5beta-cholest-24-enoyl-CoA hydratase activity |
| GO:0035478 | 0.0026 | Inf | 0.0026 | 1 | 1 | chylomicron binding |
| GO:0039552 | 0.0026 | Inf | 0.0026 | 1 | 1 | RIG-I binding |
| GO:0044594 | 0.0026 | Inf | 0.0026 | 1 | 1 | 17-beta-hydroxysteroid dehydrogenase (NAD+) activity |
| GO:0004464 | 0.0051 | 400.8974 | 0.0051 | 1 | 2 | leukotriene-C4 synthase activity |
| GO:0008147 | 0.0051 | 400.8974 | 0.0051 | 1 | 2 | structural constituent of bone |
| GO:0016403 | 0.0051 | 400.8974 | 0.0051 | 1 | 2 | dimethylargininase activity |
| GO:0016508 | 0.0051 | 400.8974 | 0.0051 | 1 | 2 | long-chain-enoyl-CoA hydratase activity |
| GO:0016667 | 0.0069 | 17.4569 | 0.125 | 2 | 49 | oxidoreductase activity, acting on a sulfur group of donors |
| GO:0004332 | 0.0076 | 200.4359 | 0.0077 | 1 | 3 | fructose-bisphosphate aldolase activity |
| GO:0008310 | 0.0076 | 200.4359 | 0.0077 | 1 | 3 | single-stranded DNA 3'-5' exodeoxyribonuclease activity |
| GO:0035529 | 0.0076 | 200.4359 | 0.0077 | 1 | 3 | NADH pyrophosphatase activity |
| GO:0016829 | 0.0088 | 7.6493 | 0.4261 | 3 | 167 | lyase activity |
| GO:0030276 | 0.0096 | 14.6429 | 0.148 | 2 | 58 | clathrin binding |
| GOMFID | Pvalue | OddsRatio | ExpCount | Count | Size | Term |
| GO:0005109 | 9e-04 | 17.9068 | 0.1883 | 3 | 36 | frizzled binding |
| GO:0016874 | 0.0037 | 3.8087 | 1.9878 | 7 | 380 | ligase activity |
| GO:0003924 | 0.0049 | 4.8746 | 1.0985 | 5 | 210 | GTPase activity |
| GO:0008887 | 0.0052 | Inf | 0.0052 | 1 | 1 | glycerate kinase activity |
| GO:0043167 | 0.0086 | 1.7396 | 29.9889 | 41 | 5733 | ion binding |
| GO:0005525 | 0.0089 | 3.596 | 1.7837 | 6 | 341 | GTP binding |
| GOMFID | Pvalue | OddsRatio | ExpCount | Count | Size | Term |
| GO:0030515 | 0.0028 | 28.3673 | 0.0796 | 2 | 24 | snoRNA binding |
| GO:0004081 | 0.0033 | Inf | 0.0033 | 1 | 1 | bis(5'-nucleosyl)-tetraphosphatase (asymmetrical) activity |
| GO:0004152 | 0.0033 | Inf | 0.0033 | 1 | 1 | dihydroorotate dehydrogenase activity |
| GO:0004500 | 0.0033 | Inf | 0.0033 | 1 | 1 | dopamine beta-monooxygenase activity |
| GO:0008803 | 0.0033 | Inf | 0.0033 | 1 | 1 | bis(5'-nucleosyl)-tetraphosphatase (symmetrical) activity |
| GO:0008859 | 0.0033 | Inf | 0.0033 | 1 | 1 | exoribonuclease II activity |
| GO:0008887 | 0.0033 | Inf | 0.0033 | 1 | 1 | glycerate kinase activity |
| GO:0047747 | 0.0033 | Inf | 0.0033 | 1 | 1 | cholate-CoA ligase activity |
| GO:0070506 | 0.0066 | 306.3333 | 0.0066 | 1 | 2 | high-density lipoprotein particle receptor activity |
| GO:0086075 | 0.0066 | 306.3333 | 0.0066 | 1 | 2 | gap junction channel activity involved in cardiac conduction electrical coupling |
| GO:0097177 | 0.0066 | 306.3333 | 0.0066 | 1 | 2 | mitochondrial ribosome binding |
| GO:0008138 | 0.0089 | 15.2029 | 0.1426 | 2 | 43 | protein tyrosine/serine/threonine phosphatase activity |
| GO:0016791 | 0.0097 | 5.1667 | 0.8359 | 4 | 252 | phosphatase activity |
| GO:0005044 | 0.0098 | 14.494 | 0.1493 | 2 | 45 | scavenger receptor activity |
| GO:0004740 | 0.0099 | 153.1569 | 0.01 | 1 | 3 | pyruvate dehydrogenase (acetyl-transferring) kinase activity |
| GO:0004800 | 0.0099 | 153.1569 | 0.01 | 1 | 3 | thyroxine 5'-deiodinase activity |
| GO:0008310 | 0.0099 | 153.1569 | 0.01 | 1 | 3 | single-stranded DNA 3'-5' exodeoxyribonuclease activity |
| GO:0034186 | 0.0099 | 153.1569 | 0.01 | 1 | 3 | apolipoprotein A-I binding |
| GO:0097322 | 0.0099 | 153.1569 | 0.01 | 1 | 3 | 7SK snRNA binding |
| GOMFID | Pvalue | OddsRatio | ExpCount | Count | Size | Term |
| GO:0032394 | 0 | Inf | 0.0094 | 2 | 2 | MHC class Ib receptor activity |
| GO:0042288 | 1e-04 | 43.907 | 0.085 | 3 | 18 | MHC class I protein binding |
| GO:0097493 | 3e-04 | 108.3194 | 0.0283 | 2 | 6 | structural molecule activity conferring elasticity |
| GO:0008035 | 6e-04 | 72.2037 | 0.0378 | 2 | 8 | high-density lipoprotein particle binding |
| GO:0042803 | 0.0013 | 3.4661 | 3.2242 | 10 | 683 | protein homodimerization activity |
| GO:0016874 | 0.0021 | 4.2657 | 1.7938 | 7 | 380 | ligase activity |
| GO:0004013 | 0.0047 | Inf | 0.0047 | 1 | 1 | adenosylhomocysteinase activity |
| GO:0004874 | 0.0047 | Inf | 0.0047 | 1 | 1 | aryl hydrocarbon receptor activity |
| GO:0008887 | 0.0047 | Inf | 0.0047 | 1 | 1 | glycerate kinase activity |
| GO:0015230 | 0.0047 | Inf | 0.0047 | 1 | 1 | FAD transmembrane transporter activity |
| GO:0030272 | 0.0047 | Inf | 0.0047 | 1 | 1 | 5-formyltetrahydrofolate cyclo-ligase activity |
| GO:0035478 | 0.0047 | Inf | 0.0047 | 1 | 1 | chylomicron binding |
| GO:0044610 | 0.0047 | Inf | 0.0047 | 1 | 1 | FMN transmembrane transporter activity |
| GO:0050333 | 0.0047 | Inf | 0.0047 | 1 | 1 | thiamin-triphosphatase activity |
| GO:0051724 | 0.0047 | Inf | 0.0047 | 1 | 1 | NAD transporter activity |
| GO:0071814 | 0.0057 | 19.6717 | 0.1133 | 2 | 24 | protein-lipid complex binding |
| GO:0003839 | 0.0094 | 213.7123 | 0.0094 | 1 | 2 | gamma-glutamylcyclotransferase activity |
| GO:0004066 | 0.0094 | 213.7123 | 0.0094 | 1 | 2 | asparagine synthase (glutamine-hydrolyzing) activity |
| GO:0004329 | 0.0094 | 213.7123 | 0.0094 | 1 | 2 | formate-tetrahydrofolate ligase activity |
| GO:0004821 | 0.0094 | 213.7123 | 0.0094 | 1 | 2 | histidine-tRNA ligase activity |
| GO:0015217 | 0.0094 | 213.7123 | 0.0094 | 1 | 2 | ADP transmembrane transporter activity |
| GO:0015228 | 0.0094 | 213.7123 | 0.0094 | 1 | 2 | coenzyme A transmembrane transporter activity |
| GO:0015433 | 0.0094 | 213.7123 | 0.0094 | 1 | 2 | peptide antigen-transporting ATPase activity |
| GO:0050145 | 0.0094 | 213.7123 | 0.0094 | 1 | 2 | nucleoside phosphate kinase activity |
| GO:0070506 | 0.0094 | 213.7123 | 0.0094 | 1 | 2 | high-density lipoprotein particle receptor activity |
| GO:0080122 | 0.0094 | 213.7123 | 0.0094 | 1 | 2 | AMP transmembrane transporter activity |
| GOMFID | Pvalue | OddsRatio | ExpCount | Count | Size | Term |
| GO:0005519 | 0.0029 | Inf | 0.0029 | 1 | 1 | cytoskeletal regulatory protein binding |
| GO:0015636 | 0.0029 | Inf | 0.0029 | 1 | 1 | short-chain fatty acid uptake transporter activity |
| GO:0047874 | 0.0029 | Inf | 0.0029 | 1 | 1 | dolichyldiphosphatase activity |
| GO:0004649 | 0.0059 | 347.3111 | 0.0059 | 1 | 2 | poly(ADP-ribose) glycohydrolase activity |
| GO:0008523 | 0.0059 | 347.3111 | 0.0059 | 1 | 2 | sodium-dependent multivitamin transmembrane transporter activity |
| GO:0036505 | 0.0059 | 347.3111 | 0.0059 | 1 | 2 | prosaposin receptor activity |
| GO:0050135 | 0.0059 | 347.3111 | 0.0059 | 1 | 2 | NAD(P)+ nucleosidase activity |
| GO:0005102 | 0.0065 | 2.8435 | 4.1111 | 10 | 1401 | receptor binding |
| GO:0003953 | 0.0088 | 173.6444 | 0.0088 | 1 | 3 | NAD+ nucleosidase activity |
| GO:0031708 | 0.0088 | 173.6444 | 0.0088 | 1 | 3 | endothelin B receptor binding |
| GO:0097322 | 0.0088 | 173.6444 | 0.0088 | 1 | 3 | 7SK snRNA binding |
| GOMFID | Pvalue | OddsRatio | ExpCount | Count | Size | Term |
| GO:0019003 | 0.0011 | 16.4709 | 0.2021 | 3 | 48 | GDP binding |
| GO:0005132 | 0.0018 | 37.4928 | 0.0632 | 2 | 15 | type I interferon receptor binding |
| GO:0005031 | 0.0042 | 23.1979 | 0.0968 | 2 | 23 | tumor necrosis factor-activated receptor activity |
| GO:0004139 | 0.0042 | Inf | 0.0042 | 1 | 1 | deoxyribose-phosphate aldolase activity |
| GO:0004362 | 0.0042 | Inf | 0.0042 | 1 | 1 | glutathione-disulfide reductase activity |
| GO:0033819 | 0.0042 | Inf | 0.0042 | 1 | 1 | lipoyl(octanoyl) transferase activity |
| GO:0034647 | 0.0042 | Inf | 0.0042 | 1 | 1 | histone demethylase activity (H3-trimethyl-K4 specific) |
| GO:0072545 | 0.0042 | Inf | 0.0042 | 1 | 1 | tyrosine binding |
| GO:0016874 | 0.0052 | 4.0738 | 1.5999 | 6 | 380 | ligase activity |
| GO:0002094 | 0.0084 | 240.1385 | 0.0084 | 1 | 2 | polyprenyltransferase activity |
| GO:0004348 | 0.0084 | 240.1385 | 0.0084 | 1 | 2 | glucosylceramidase activity |
| GO:0004831 | 0.0084 | 240.1385 | 0.0084 | 1 | 2 | tyrosine-tRNA ligase activity |
| GO:0009882 | 0.0084 | 240.1385 | 0.0084 | 1 | 2 | blue light photoreceptor activity |
| GO:0016415 | 0.0084 | 240.1385 | 0.0084 | 1 | 2 | octanoyltransferase activity |
| GOMFID | Pvalue | OddsRatio | ExpCount | Count | Size | Term |
| GO:0003934 | 0.0022 | Inf | 0.0022 | 1 | 1 | GTP cyclohydrolase I activity |
| GO:0003713 | 0.0035 | 7.0788 | 0.6341 | 4 | 284 | transcription coactivator activity |
| GO:0008113 | 0.0045 | 460 | 0.0045 | 1 | 2 | peptide-methionine (S)-S-oxide reductase activity |
| GO:0030627 | 0.0045 | 460 | 0.0045 | 1 | 2 | pre-mRNA 5'-splice site binding |
| GO:0043812 | 0.0045 | 460 | 0.0045 | 1 | 2 | phosphatidylinositol-4-phosphate phosphatase activity |
| GO:0000064 | 0.0067 | 229.9853 | 0.0067 | 1 | 3 | L-ornithine transmembrane transporter activity |
| GO:0008184 | 0.0067 | 229.9853 | 0.0067 | 1 | 3 | glycogen phosphorylase activity |
| GO:0010997 | 0.0067 | 229.9853 | 0.0067 | 1 | 3 | anaphase-promoting complex binding |
| GO:0072345 | 0.0067 | 229.9853 | 0.0067 | 1 | 3 | NAADP-sensitive calcium-release channel activity |
| GO:0000989 | 0.0069 | 4.643 | 1.2213 | 5 | 547 | transcription factor activity, transcription factor binding |
| GOMFID | Pvalue | OddsRatio | ExpCount | Count | Size | Term |
| GO:0008117 | 0.0036 | Inf | 0.0036 | 1 | 1 | sphinganine-1-phosphate aldolase activity |
| GO:0050038 | 0.0036 | Inf | 0.0036 | 1 | 1 | L-xylulose reductase (NADP+) activity |
| GO:0098619 | 0.0036 | Inf | 0.0036 | 1 | 1 | selenocysteine-tRNA ligase activity |
| GO:0004485 | 0.0071 | 283.9818 | 0.0071 | 1 | 2 | methylcrotonoyl-CoA carboxylase activity |
| GO:0004828 | 0.0071 | 283.9818 | 0.0071 | 1 | 2 | serine-tRNA ligase activity |
| GO:0008511 | 0.0071 | 283.9818 | 0.0071 | 1 | 2 | sodium:potassium:chloride symporter activity |
| GO:0016362 | 0.0071 | 283.9818 | 0.0071 | 1 | 2 | activin receptor activity, type II |
| GO:0030362 | 0.0071 | 283.9818 | 0.0071 | 1 | 2 | protein phosphatase type 4 regulator activity |
| GO:0030627 | 0.0071 | 283.9818 | 0.0071 | 1 | 2 | pre-mRNA 5'-splice site binding |
| GO:0035402 | 0.0071 | 283.9818 | 0.0071 | 1 | 2 | histone kinase activity (H3-T11 specific) |
| GO:0051500 | 0.0071 | 283.9818 | 0.0071 | 1 | 2 | D-tyrosyl-tRNA(Tyr) deacylase activity |
| GO:2001069 | 0.0071 | 283.9818 | 0.0071 | 1 | 2 | glycogen binding |
| GOMFID | Pvalue | OddsRatio | ExpCount | Count | Size | Term |
| GO:0042393 | 0.0034 | 6.9882 | 0.6201 | 4 | 162 | histone binding |
| GO:0003721 | 0.0038 | Inf | 0.0038 | 1 | 1 | telomerase RNA reverse transcriptase activity |
| GO:0004838 | 0.0038 | Inf | 0.0038 | 1 | 1 | L-tyrosine:2-oxoglutarate aminotransferase activity |
| GO:0008117 | 0.0038 | Inf | 0.0038 | 1 | 1 | sphinganine-1-phosphate aldolase activity |
| GO:0008466 | 0.0038 | Inf | 0.0038 | 1 | 1 | glycogenin glucosyltransferase activity |
| GO:0036220 | 0.0038 | Inf | 0.0038 | 1 | 1 | ITP diphosphatase activity |
| GO:0036222 | 0.0038 | Inf | 0.0038 | 1 | 1 | XTP diphosphatase activity |
| GO:0044729 | 0.0038 | Inf | 0.0038 | 1 | 1 | hemi-methylated DNA-binding |
| GO:0051424 | 0.0038 | Inf | 0.0038 | 1 | 1 | corticotropin-releasing hormone binding |
| GO:0052909 | 0.0038 | Inf | 0.0038 | 1 | 1 | 18S rRNA (adenine(1779)-N(6)/adenine(1780)-N(6))-dimethyltransferase activity |
| GO:0046872 | 0.0062 | 2.0409 | 14.8086 | 24 | 3869 | metal ion binding |
| GO:0001042 | 0.0076 | 264.661 | 0.0077 | 1 | 2 | RNA polymerase I core binding |
| GO:0003968 | 0.0076 | 264.661 | 0.0077 | 1 | 2 | RNA-directed RNA polymerase activity |
| GO:0004119 | 0.0076 | 264.661 | 0.0077 | 1 | 2 | cGMP-inhibited cyclic-nucleotide phosphodiesterase activity |
| GO:0004464 | 0.0076 | 264.661 | 0.0077 | 1 | 2 | leukotriene-C4 synthase activity |
| GO:0010698 | 0.0076 | 264.661 | 0.0077 | 1 | 2 | acetyltransferase activator activity |
| GO:0015489 | 0.0076 | 264.661 | 0.0077 | 1 | 2 | putrescine transmembrane transporter activity |
| GO:0016150 | 0.0076 | 264.661 | 0.0077 | 1 | 2 | translation release factor activity, codon nonspecific |
| GO:0035870 | 0.0076 | 264.661 | 0.0077 | 1 | 2 | dITP diphosphatase activity |
| GO:0043812 | 0.0076 | 264.661 | 0.0077 | 1 | 2 | phosphatidylinositol-4-phosphate phosphatase activity |
| GOMFID | Pvalue | OddsRatio | ExpCount | Count | Size | Term |
| GO:0008466 | 0.0036 | Inf | 0.0036 | 1 | 1 | glycogenin glucosyltransferase activity |
| GO:0036220 | 0.0036 | Inf | 0.0036 | 1 | 1 | ITP diphosphatase activity |
| GO:0036222 | 0.0036 | Inf | 0.0036 | 1 | 1 | XTP diphosphatase activity |
| GO:0051424 | 0.0036 | Inf | 0.0036 | 1 | 1 | corticotropin-releasing hormone binding |
| GO:0098619 | 0.0036 | Inf | 0.0036 | 1 | 1 | selenocysteine-tRNA ligase activity |
| GO:0004776 | 0.0071 | 283.9818 | 0.0071 | 1 | 2 | succinate-CoA ligase (GDP-forming) activity |
| GO:0004828 | 0.0071 | 283.9818 | 0.0071 | 1 | 2 | serine-tRNA ligase activity |
| GO:0005427 | 0.0071 | 283.9818 | 0.0071 | 1 | 2 | proton-dependent oligopeptide secondary active transmembrane transporter activity |
| GO:0009882 | 0.0071 | 283.9818 | 0.0071 | 1 | 2 | blue light photoreceptor activity |
| GO:0030362 | 0.0071 | 283.9818 | 0.0071 | 1 | 2 | protein phosphatase type 4 regulator activity |
| GO:0035402 | 0.0071 | 283.9818 | 0.0071 | 1 | 2 | histone kinase activity (H3-T11 specific) |
| GO:0035870 | 0.0071 | 283.9818 | 0.0071 | 1 | 2 | dITP diphosphatase activity |
| GO:2001069 | 0.0071 | 283.9818 | 0.0071 | 1 | 2 | glycogen binding |
| GOMFID | Pvalue | OddsRatio | ExpCount | Count | Size | Term |
| GO:0004769 | 0.0019 | 1118.5714 | 0.0019 | 1 | 2 | steroid delta-isomerase activity |
| GO:0003854 | 0.0038 | 372.8095 | 0.0038 | 1 | 4 | 3-beta-hydroxy-delta5-steroid dehydrogenase activity |
| GO:0031433 | 0.0048 | 279.5893 | 0.0048 | 1 | 5 | telethonin binding |
| GO:0097109 | 0.0048 | 279.5893 | 0.0048 | 1 | 5 | neuroligin family protein binding |
| GO:0097493 | 0.0057 | 223.6571 | 0.0057 | 1 | 6 | structural molecule activity conferring elasticity |
| GO:0004713 | 0.0075 | 17.5622 | 0.132 | 2 | 138 | protein tyrosine kinase activity |
| GO:0051371 | 0.0086 | 139.7589 | 0.0086 | 1 | 9 | muscle alpha-actinin binding |
| NA. |
| n/a |
| NA. |
| n/a |
| NA. |
| n/a |
| NA. |
| n/a |
| NA. |
| n/a |
| NA. |
| n/a |
| NA. |
| n/a |
| NA. |
| n/a |
| NA. |
| n/a |
| NA. |
| n/a |
| NA. |
| n/a |
| NA. |
| n/a |
| NA. |
| n/a |
| NA. |
| n/a |
| NA. |
| n/a |
| NA. |
| n/a |
| NA. |
| n/a |
| NA. |
| n/a |
| NA. |
| n/a |
| NA. |
| n/a |
| NA. |
| n/a |
| NA. |
| n/a |
| NA. |
| n/a |
| NA. |
| n/a |
| NA. |
| n/a |
| NA. |
| n/a |
| NA. |
| n/a |
| NA. |
| n/a |
| NA. |
| n/a |
| NA. |
| n/a |
| NA. |
| n/a |
| NA. |
| n/a |
| NA. |
| n/a |
| NA. |
| n/a |
| NA. |
| n/a |
| NA. |
| n/a |
| NA. |
| n/a |
| NA. |
| n/a |
| NA. |
| n/a |
| NA. |
| n/a |
| NA. |
| n/a |
| NA. |
| n/a |
| NA. |
| n/a |
| NA. |
| n/a |
| NA. |
| n/a |
| NA. |
| n/a |
| NA. |
| n/a |
| NA. |
| n/a |
| NA. |
| n/a |
| NA. |
| n/a |
| NA. |
| n/a |
| NA. |
| n/a |
| NA. |
| n/a |
| NA. |
| n/a |
| NA. |
| n/a |
| NA. |
| n/a |
| NA. |
| n/a |
| NA. |
| n/a |
| NA. |
| n/a |
| NA. |
| n/a |
| NA. |
| n/a |
| NA. |
| n/a |
| NA. |
| n/a |
| NA. |
| n/a |
| GOMFID | Pvalue | OddsRatio | ExpCount | Count | Size | Term |
| GO:0044710 | 0 | 1.8099 | 58.9479 | 86 | 4222 | single-organism metabolic process |
| GO:0051186 | 1e-04 | 3.4095 | 5.0973 | 16 | 346 | cofactor metabolic process |
| GO:1901564 | 1e-04 | 1.8892 | 31.0996 | 52 | 2111 | organonitrogen compound metabolic process |
| GO:0006739 | 1e-04 | 12.1847 | 0.4862 | 5 | 33 | NADP metabolic process |
| GO:0001829 | 1e-04 | 19.4273 | 0.2652 | 4 | 18 | trophectodermal cell differentiation |
| GO:0043603 | 2e-04 | 2.2671 | 13.4652 | 28 | 914 | cellular amide metabolic process |
| GO:1901576 | 2e-04 | 1.6257 | 81.1821 | 107 | 5663 | organic substance biosynthetic process |
| GO:0016259 | 2e-04 | 6.2386 | 1.2375 | 7 | 84 | selenocysteine metabolic process |
| GO:0044248 | 2e-04 | 1.9275 | 24.146 | 42 | 1639 | cellular catabolic process |
| GO:0048519 | 4e-04 | 1.6069 | 65.175 | 89 | 4424 | negative regulation of biological process |
| GO:0043096 | 6e-04 | 134.917 | 0.0442 | 2 | 3 | purine nucleobase salvage |
| GO:0009108 | 6e-04 | 4.5445 | 1.9004 | 8 | 129 | coenzyme biosynthetic process |
| GO:0042058 | 9e-04 | 5.7758 | 1.1344 | 6 | 77 | regulation of epidermal growth factor receptor signaling pathway |
| GO:0016032 | 0.0011 | 2.1641 | 11.4027 | 23 | 774 | viral process |
| GO:0043409 | 0.0011 | 4.1628 | 2.0625 | 8 | 140 | negative regulation of MAPK cascade |
| GO:0034976 | 0.0012 | 3.1956 | 3.6683 | 11 | 249 | response to endoplasmic reticulum stress |
| GO:0046102 | 0.0013 | 67.4541 | 0.0589 | 2 | 4 | inosine metabolic process |
| GO:0006006 | 0.0014 | 3.3482 | 3.1821 | 10 | 216 | glucose metabolic process |
| GO:0006413 | 0.0015 | 3.1029 | 3.7714 | 11 | 256 | translational initiation |
| GO:0000184 | 0.0015 | 4.4807 | 1.6795 | 7 | 114 | nuclear-transcribed mRNA catabolic process, nonsense-mediated decay |
| GO:0060795 | 0.0017 | 8.764 | 0.5156 | 4 | 35 | cell fate commitment involved in formation of primary germ layer |
| GO:0006637 | 0.0018 | 5.0594 | 1.2817 | 6 | 87 | acyl-CoA metabolic process |
| GO:0009057 | 0.002 | 1.8968 | 16.4411 | 29 | 1116 | macromolecule catabolic process |
| GO:0000122 | 0.0021 | 2.1293 | 10.5188 | 21 | 714 | negative regulation of transcription from RNA polymerase II promoter |
| GO:0044419 | 0.0021 | 2.0546 | 11.9625 | 23 | 812 | interspecies interaction between organisms |
| GO:0043456 | 0.0021 | 44.9665 | 0.0737 | 2 | 5 | regulation of pentose-phosphate shunt |
| GO:0098734 | 0.0021 | 44.9665 | 0.0737 | 2 | 5 | macromolecule depalmitoylation |
| GO:0061097 | 0.0022 | 5.9742 | 0.9134 | 5 | 62 | regulation of protein tyrosine kinase activity |
| GO:0030323 | 0.0023 | 3.3633 | 2.8433 | 9 | 193 | respiratory tube development |
| GO:0016051 | 0.0024 | 3.3449 | 2.858 | 9 | 194 | carbohydrate biosynthetic process |
| GO:0044238 | 0.0024 | 1.5107 | 143.1522 | 164 | 9717 | primary metabolic process |
| GO:0071901 | 0.0024 | 4.0951 | 1.8268 | 7 | 124 | negative regulation of protein serine/threonine kinase activity |
| GO:0008584 | 0.0025 | 4.0601 | 1.8415 | 7 | 125 | male gonad development |
| GO:0044262 | 0.0026 | 2.8759 | 4.0513 | 11 | 275 | cellular carbohydrate metabolic process |
| GO:0043043 | 0.0026 | 2.1691 | 9.3107 | 19 | 632 | peptide biosynthetic process |
| GO:0006144 | 0.0028 | 7.5443 | 0.5893 | 4 | 40 | purine nucleobase metabolic process |
| GO:0019682 | 0.003 | 11.9443 | 0.2946 | 3 | 20 | glyceraldehyde-3-phosphate metabolic process |
| GO:0042592 | 0.003 | 1.7334 | 22.4371 | 36 | 1523 | homeostatic process |
| GO:0009146 | 0.0031 | 33.7227 | 0.0884 | 2 | 6 | purine nucleoside triphosphate catabolic process |
| GO:0032261 | 0.0031 | 33.7227 | 0.0884 | 2 | 6 | purine nucleotide salvage |
| GO:0071877 | 0.0031 | 33.7227 | 0.0884 | 2 | 6 | regulation of adrenergic receptor signaling pathway |
| GO:0045787 | 0.0033 | 2.6411 | 4.8027 | 12 | 326 | positive regulation of cell cycle |
| GO:0001759 | 0.0035 | 11.28 | 0.3094 | 3 | 21 | organ induction |
| GO:0044033 | 0.0036 | 3.1226 | 3.0496 | 9 | 207 | multi-organism metabolic process |
| GO:0001666 | 0.0039 | 2.7186 | 4.2723 | 11 | 290 | response to hypoxia |
| GO:0035336 | 0.0039 | 6.7881 | 0.6482 | 4 | 44 | long-chain fatty-acyl-CoA metabolic process |
| GO:1901605 | 0.004 | 2.5823 | 4.9058 | 12 | 333 | alpha-amino acid metabolic process |
| GO:0006614 | 0.004 | 4.2647 | 1.5027 | 6 | 102 | SRP-dependent cotranslational protein targeting to membrane |
| GO:0031398 | 0.004 | 3.3435 | 2.5339 | 8 | 172 | positive regulation of protein ubiquitination |
| GO:0072657 | 0.0041 | 2.2989 | 6.8946 | 15 | 468 | protein localization to membrane |
| GO:0034654 | 0.0042 | 1.4756 | 58.7371 | 77 | 3987 | nucleobase-containing compound biosynthetic process |
| GO:0044712 | 0.0043 | 1.83 | 15.7487 | 27 | 1069 | single-organism catabolic process |
| GO:0009204 | 0.0043 | 26.9764 | 0.1031 | 2 | 7 | deoxyribonucleoside triphosphate catabolic process |
| GO:0060373 | 0.0043 | 26.9764 | 0.1031 | 2 | 7 | regulation of ventricular cardiac muscle cell membrane depolarization |
| GO:0055069 | 0.0045 | 10.1507 | 0.3388 | 3 | 23 | zinc ion homeostasis |
| GO:0005996 | 0.0045 | 2.6604 | 4.3607 | 11 | 296 | monosaccharide metabolic process |
| GO:0048286 | 0.005 | 6.3133 | 0.6924 | 4 | 47 | lung alveolus development |
| GO:0060541 | 0.0053 | 2.9419 | 3.2263 | 9 | 219 | respiratory system development |
| GO:0019985 | 0.0054 | 6.1694 | 0.7071 | 4 | 48 | translesion synthesis |
| GO:0046635 | 0.0054 | 6.1694 | 0.7071 | 4 | 48 | positive regulation of alpha-beta T cell activation |
| GO:0051172 | 0.0055 | 1.6842 | 21.6562 | 34 | 1470 | negative regulation of nitrogen compound metabolic process |
| GO:0048548 | 0.0057 | 22.4789 | 0.1179 | 2 | 8 | regulation of pinocytosis |
| GO:0061179 | 0.0057 | 22.4789 | 0.1179 | 2 | 8 | negative regulation of insulin secretion involved in cellular response to glucose stimulus |
| GO:0071453 | 0.0057 | 3.4672 | 2.1362 | 7 | 145 | cellular response to oxygen levels |
| GO:0072599 | 0.0058 | 3.9346 | 1.6205 | 6 | 110 | establishment of protein localization to endoplasmic reticulum |
| GO:0015850 | 0.0059 | 2.8861 | 3.2853 | 9 | 223 | organic hydroxy compound transport |
| GO:0043525 | 0.0062 | 5.9004 | 0.7366 | 4 | 50 | positive regulation of neuron apoptotic process |
| GO:0034645 | 0.0063 | 1.4261 | 69.904 | 88 | 4745 | cellular macromolecule biosynthetic process |
| GO:0044257 | 0.0064 | 2.0246 | 9.3844 | 18 | 637 | cellular protein catabolic process |
| GO:0019083 | 0.0064 | 3.0777 | 2.7402 | 8 | 186 | viral transcription |
| GO:0000188 | 0.0064 | 8.8249 | 0.383 | 3 | 26 | inactivation of MAPK activity |
| GO:0051156 | 0.0064 | 8.8249 | 0.383 | 3 | 26 | glucose 6-phosphate metabolic process |
| GO:0060548 | 0.0067 | 1.8485 | 13.1853 | 23 | 895 | negative regulation of cell death |
| GO:0046661 | 0.0068 | 3.3448 | 2.2098 | 7 | 150 | male sex differentiation |
| GO:0043266 | 0.0069 | 4.4751 | 1.1933 | 5 | 81 | regulation of potassium ion transport |
| GO:0051253 | 0.0071 | 1.7187 | 17.9732 | 29 | 1220 | negative regulation of RNA metabolic process |
| GO:0031327 | 0.0072 | 1.6621 | 21.229 | 33 | 1441 | negative regulation of cellular biosynthetic process |
| GO:1903507 | 0.0072 | 1.7329 | 17.1924 | 28 | 1167 | negative regulation of nucleic acid-templated transcription |
| GO:0051348 | 0.0076 | 2.3638 | 5.333 | 12 | 362 | negative regulation of transferase activity |
| GO:0006725 | 0.0076 | 1.4009 | 80.8205 | 99 | 5486 | cellular aromatic compound metabolic process |
| GO:0019362 | 0.008 | 3.6517 | 1.7384 | 6 | 118 | pyridine nucleotide metabolic process |
| GO:0006082 | 0.0081 | 1.7166 | 17.3397 | 28 | 1177 | organic acid metabolic process |
| GO:0032413 | 0.0082 | 5.427 | 0.7955 | 4 | 54 | negative regulation of ion transmembrane transporter activity |
| GO:2001244 | 0.0082 | 5.427 | 0.7955 | 4 | 54 | positive regulation of intrinsic apoptotic signaling pathway |
| GO:1901360 | 0.0084 | 1.3918 | 83.9585 | 102 | 5699 | organic cyclic compound metabolic process |
| GO:0002223 | 0.0084 | 3.6191 | 1.7531 | 6 | 119 | stimulatory C-type lectin receptor signaling pathway |
| GO:0072523 | 0.0087 | 5.3202 | 0.8103 | 4 | 55 | purine-containing compound catabolic process |
| GO:0060056 | 0.009 | 16.857 | 0.1473 | 2 | 10 | mammary gland involution |
| GO:0060546 | 0.009 | 16.857 | 0.1473 | 2 | 10 | negative regulation of necroptotic process |
| GO:0072584 | 0.009 | 16.857 | 0.1473 | 2 | 10 | caveolin-mediated endocytosis |
| GO:1903524 | 0.0092 | 4.1461 | 1.2817 | 5 | 87 | positive regulation of blood circulation |
| GO:0007519 | 0.0093 | 3.1449 | 2.3424 | 7 | 159 | skeletal muscle tissue development |
| GO:1902235 | 0.0096 | 7.5156 | 0.442 | 3 | 30 | regulation of endoplasmic reticulum stress-induced intrinsic apoptotic signaling pathway |
| GO:0071158 | 0.0097 | 4.0959 | 1.2964 | 5 | 88 | positive regulation of cell cycle arrest |
| GO:0097006 | 0.0099 | 5.1188 | 0.8397 | 4 | 57 | regulation of plasma lipoprotein particle levels |
| GO:0018130 | 0.01 | 5.1018 | 0.8429 | 4 | 64 | heterocycle biosynthetic process |
| GOMFID | Pvalue | OddsRatio | ExpCount | Count | Size | Term |
| GO:0006415 | 0 | 8.8926 | 1.8319 | 14 | 172 | translational termination |
| GO:0016259 | 0 | 13.2889 | 0.8946 | 10 | 84 | selenocysteine metabolic process |
| GO:0006414 | 0 | 7.459 | 2.1514 | 14 | 202 | translational elongation |
| GO:0006614 | 0 | 10.6764 | 1.0864 | 10 | 102 | SRP-dependent cotranslational protein targeting to membrane |
| GO:0043241 | 0 | 5.6015 | 3.2378 | 16 | 304 | protein complex disassembly |
| GO:0072599 | 0 | 9.8172 | 1.1716 | 10 | 110 | establishment of protein localization to endoplasmic reticulum |
| GO:0000184 | 0 | 9.4372 | 1.2142 | 10 | 114 | nuclear-transcribed mRNA catabolic process, nonsense-mediated decay |
| GO:0006413 | 0 | 5.7742 | 2.7265 | 14 | 256 | translational initiation |
| GO:0006612 | 0 | 6.2892 | 1.949 | 11 | 183 | protein targeting to membrane |
| GO:0019083 | 0 | 6.1801 | 1.981 | 11 | 186 | viral transcription |
| GO:0044033 | 0 | 5.5104 | 2.2047 | 11 | 207 | multi-organism metabolic process |
| GO:0006402 | 1e-04 | 5.0826 | 2.1514 | 10 | 202 | mRNA catabolic process |
| GO:0034655 | 2e-04 | 3.4741 | 4.0578 | 13 | 381 | nucleobase-containing compound catabolic process |
| GO:0002181 | 6e-04 | 11.8719 | 0.3834 | 4 | 36 | cytoplasmic translation |
| GO:0033365 | 7e-04 | 2.4285 | 8.9784 | 20 | 843 | protein localization to organelle |
| GO:0019058 | 8e-04 | 3.0114 | 4.6436 | 13 | 436 | viral life cycle |
| GO:1901605 | 9e-04 | 3.3266 | 3.5466 | 11 | 333 | alpha-amino acid metabolic process |
| GO:0042273 | 0.001 | 9.9935 | 0.4473 | 4 | 42 | ribosomal large subunit biogenesis |
| GO:0048619 | 0.0011 | 62.6667 | 0.0533 | 2 | 5 | embryonic hindgut morphogenesis |
| GO:0016482 | 0.0019 | 2.0555 | 12.7274 | 24 | 1195 | cytoplasmic transport |
| GO:0010524 | 0.0023 | 7.9064 | 0.5538 | 4 | 52 | positive regulation of calcium ion transport into cytosol |
| GO:0022411 | 0.0025 | 2.3017 | 7.9346 | 17 | 745 | cellular component disassembly |
| GO:0044403 | 0.0026 | 2.2395 | 8.6482 | 18 | 812 | symbiosis, encompassing mutualism through parasitism |
| GO:0030947 | 0.0029 | 11.8056 | 0.2876 | 3 | 27 | regulation of vascular endothelial growth factor receptor signaling pathway |
| GO:0043043 | 0.0031 | 2.3825 | 6.7311 | 15 | 632 | peptide biosynthetic process |
| GO:0046134 | 0.0032 | 11.3327 | 0.2982 | 3 | 28 | pyrimidine nucleoside biosynthetic process |
| GO:0006082 | 0.0034 | 1.9874 | 12.5357 | 23 | 1177 | organic acid metabolic process |
| GO:0019752 | 0.0037 | 2.0373 | 11.1191 | 21 | 1044 | carboxylic acid metabolic process |
| GO:0043603 | 0.004 | 2.0968 | 9.7346 | 19 | 914 | cellular amide metabolic process |
| GO:0010467 | 0.004 | 1.5468 | 53.3058 | 70 | 5005 | gene expression |
| GO:0044764 | 0.0044 | 2.17 | 8.382 | 17 | 787 | multi-organism cellular process |
| GO:1901566 | 0.0044 | 2.296 | 7 | 15 | 693 | organonitrogen compound biosynthetic process |
| GO:0061525 | 0.0048 | 23.4924 | 0.1065 | 2 | 10 | hindgut development |
| GO:1901679 | 0.0048 | 23.4924 | 0.1065 | 2 | 10 | nucleotide transmembrane transport |
| GO:0006364 | 0.0049 | 4.0629 | 1.5656 | 6 | 147 | rRNA processing |
| GO:0034654 | 0.0073 | 1.5273 | 42.4636 | 57 | 3987 | nucleobase-containing compound biosynthetic process |
| GO:0006886 | 0.0075 | 1.9636 | 10.3416 | 19 | 971 | intracellular protein transport |
| GO:0002479 | 0.0076 | 5.4927 | 0.7775 | 4 | 73 | antigen processing and presentation of exogenous peptide antigen via MHC class I, TAP-dependent |
| GO:0044249 | 0.0079 | 1.4786 | 61.3789 | 77 | 5763 | cellular biosynthetic process |
| GO:0030819 | 0.008 | 5.4138 | 0.7881 | 4 | 74 | positive regulation of cAMP biosynthetic process |
| GO:0032543 | 0.0083 | 4.2441 | 1.2461 | 5 | 117 | mitochondrial translation |
| GO:0097192 | 0.0088 | 5.2628 | 0.8094 | 4 | 76 | extrinsic apoptotic signaling pathway in absence of ligand |
| GO:1902580 | 0.0098 | 1.8229 | 12.9297 | 22 | 1214 | single-organism cellular localization |
| GOMFID | Pvalue | OddsRatio | ExpCount | Count | Size | Term |
| GO:0046130 | 5e-04 | 24.8969 | 0.1607 | 3 | 12 | purine ribonucleoside catabolic process |
| GO:0009169 | 5e-04 | 148.7404 | 0.0402 | 2 | 3 | purine ribonucleoside monophosphate catabolic process |
| GO:0060279 | 5e-04 | 148.7404 | 0.0402 | 2 | 3 | positive regulation of ovulation |
| GO:0009952 | 0.0013 | 3.6559 | 2.6274 | 9 | 198 | anterior/posterior pattern specification |
| GO:0007386 | 0.0017 | 49.5737 | 0.067 | 2 | 5 | compartment pattern specification |
| GO:0035912 | 0.0017 | 49.5737 | 0.067 | 2 | 5 | dorsal aorta morphogenesis |
| GO:0009125 | 0.0026 | 37.1779 | 0.0804 | 2 | 6 | nucleoside monophosphate catabolic process |
| GO:0060842 | 0.0026 | 37.1779 | 0.0804 | 2 | 6 | arterial endothelial cell differentiation |
| GO:0048732 | 0.0027 | 2.4983 | 5.9464 | 14 | 444 | gland development |
| GO:0072161 | 0.0036 | 29.7404 | 0.0938 | 2 | 7 | mesenchymal cell differentiation involved in kidney development |
| GO:0050927 | 0.0039 | 10.6618 | 0.3214 | 3 | 24 | positive regulation of positive chemotaxis |
| GO:0002831 | 0.0041 | 3.0614 | 3.1071 | 9 | 232 | regulation of response to biotic stimulus |
| GO:0018146 | 0.0061 | 8.9536 | 0.375 | 3 | 28 | keratan sulfate biosynthetic process |
| GO:0008284 | 0.0064 | 1.9508 | 10.875 | 20 | 812 | positive regulation of cell proliferation |
| GO:0001656 | 0.0072 | 4.4146 | 1.2054 | 5 | 90 | metanephros development |
| GO:0007389 | 0.0073 | 2.2862 | 5.9866 | 13 | 447 | pattern specification process |
| GO:0031341 | 0.0075 | 5.5433 | 0.7768 | 4 | 58 | regulation of cell killing |
| GO:0009108 | 0.0078 | 3.6698 | 1.7277 | 6 | 129 | coenzyme biosynthetic process |
| GO:0010092 | 0.0088 | 7.7166 | 0.4286 | 3 | 32 | specification of organ identity |
| GO:0048704 | 0.009 | 4.168 | 1.2723 | 5 | 95 | embryonic skeletal system morphogenesis |
| GO:0060379 | 0.0091 | 16.5182 | 0.1473 | 2 | 11 | cardiac muscle cell myoblast differentiation |
| GO:0060433 | 0.0091 | 16.5182 | 0.1473 | 2 | 11 | bronchus development |
| GOMFID | Pvalue | OddsRatio | ExpCount | Count | Size | Term |
| GO:0060435 | 3e-04 | 196.443 | 0.0306 | 2 | 3 | bronchiole development |
| GO:0043308 | 0.001 | 65.4726 | 0.051 | 2 | 5 | eosinophil degranulation |
| GO:0043307 | 0.0015 | 49.1013 | 0.0612 | 2 | 6 | eosinophil activation |
| GO:0050926 | 0.002 | 13.4609 | 0.2551 | 3 | 25 | regulation of positive chemotaxis |
| GO:0009108 | 0.0021 | 4.8771 | 1.3163 | 6 | 129 | coenzyme biosynthetic process |
| GO:0045084 | 0.0021 | 39.2785 | 0.0714 | 2 | 7 | positive regulation of interleukin-12 biosynthetic process |
| GO:0097084 | 0.0021 | 39.2785 | 0.0714 | 2 | 7 | vascular smooth muscle cell development |
| GO:0009749 | 0.0023 | 4.1067 | 1.8163 | 7 | 178 | response to glucose |
| GO:2001252 | 0.0028 | 4.5769 | 1.398 | 6 | 137 | positive regulation of chromosome organization |
| GO:0034284 | 0.0034 | 3.8344 | 1.9388 | 7 | 190 | response to monosaccharide |
| GO:0051103 | 0.0036 | 28.0524 | 0.0918 | 2 | 9 | DNA ligation involved in DNA repair |
| GO:0072594 | 0.0056 | 2.2967 | 6.4898 | 14 | 636 | establishment of protein localization to organelle |
| GO:0007498 | 0.0067 | 4.4781 | 1.1837 | 5 | 116 | mesoderm development |
| GO:0016558 | 0.0075 | 17.847 | 0.1327 | 2 | 13 | protein import into peroxisome matrix |
| GO:0031274 | 0.0075 | 17.847 | 0.1327 | 2 | 13 | positive regulation of pseudopodium assembly |
| GO:0050884 | 0.0087 | 16.3586 | 0.1429 | 2 | 14 | neuromuscular process controlling posture |
| GO:0050930 | 0.0087 | 16.3586 | 0.1429 | 2 | 14 | induction of positive chemotaxis |
| GO:0070200 | 0.0087 | 16.3586 | 0.1429 | 2 | 14 | establishment of protein localization to telomere |
| GO:1904874 | 0.0087 | 16.3586 | 0.1429 | 2 | 14 | positive regulation of telomerase RNA localization to Cajal body |
| GO:0006094 | 0.0091 | 5.2105 | 0.8163 | 4 | 80 | gluconeogenesis |
| GO:0032481 | 0.0099 | 5.0763 | 0.8367 | 4 | 82 | positive regulation of type I interferon production |
| GO:0035458 | 0.01 | 15.0993 | 0.1531 | 2 | 15 | cellular response to interferon-beta |
| GO:0090670 | 0.01 | 15.0993 | 0.1531 | 2 | 15 | RNA localization to Cajal body |
| GO:0090672 | 0.01 | 15.0993 | 0.1531 | 2 | 15 | telomerase RNA localization |
| GOMFID | Pvalue | OddsRatio | ExpCount | Count | Size | Term |
| GO:0070124 | 1e-04 | 8.0109 | 0.975 | 7 | 84 | mitochondrial translational initiation |
| GO:0070125 | 1e-04 | 8.0109 | 0.975 | 7 | 84 | mitochondrial translational elongation |
| GO:0070126 | 1e-04 | 7.8071 | 0.9982 | 7 | 86 | mitochondrial translational termination |
| GO:0043624 | 3e-04 | 3.7554 | 3.1571 | 11 | 272 | cellular protein complex disassembly |
| GO:0060485 | 4e-04 | 3.9465 | 2.7277 | 10 | 235 | mesenchyme development |
| GO:0090068 | 6e-04 | 3.809 | 2.8205 | 10 | 243 | positive regulation of cell cycle process |
| GO:0051436 | 6e-04 | 6.2557 | 1.0446 | 6 | 90 | negative regulation of ubiquitin-protein ligase activity involved in mitotic cell cycle |
| GO:0060442 | 6e-04 | 21.6285 | 0.1741 | 3 | 15 | branching involved in prostate gland morphogenesis |
| GO:0060847 | 8e-04 | 86.0889 | 0.0464 | 2 | 4 | endothelial cell fate specification |
| GO:0051438 | 8e-04 | 4.9594 | 1.5205 | 7 | 131 | regulation of ubiquitin-protein transferase activity |
| GO:0051352 | 0.001 | 5.7087 | 1.1375 | 6 | 98 | negative regulation of ligase activity |
| GO:0007507 | 0.001 | 2.6832 | 6.0009 | 15 | 517 | heart development |
| GO:0032984 | 0.0011 | 3.2259 | 3.6446 | 11 | 314 | macromolecular complex disassembly |
| GO:0001756 | 0.0012 | 6.9209 | 0.7893 | 5 | 68 | somitogenesis |
| GO:0007292 | 0.0013 | 5.3571 | 1.2071 | 6 | 104 | female gamete generation |
| GO:0051437 | 0.0016 | 6.4099 | 0.8473 | 5 | 73 | positive regulation of ubiquitin-protein ligase activity involved in regulation of mitotic cell cycle transition |
| GO:0001709 | 0.0018 | 8.4719 | 0.5223 | 4 | 45 | cell fate determination |
| GO:0007186 | 0.0018 | 2.0286 | 13.383 | 25 | 1153 | G-protein coupled receptor signaling pathway |
| GO:0044711 | 0.0019 | 1.85 | 19.6161 | 33 | 1690 | single-organism biosynthetic process |
| GO:0035907 | 0.0019 | 43.0389 | 0.0696 | 2 | 6 | dorsal aorta development |
| GO:0060842 | 0.0019 | 43.0389 | 0.0696 | 2 | 6 | arterial endothelial cell differentiation |
| GO:0010467 | 0.002 | 1.5729 | 58.0938 | 77 | 5005 | gene expression |
| GO:0051726 | 0.0027 | 2.0526 | 11.5491 | 22 | 995 | regulation of cell cycle |
| GO:0031145 | 0.0031 | 5.4442 | 0.9866 | 5 | 85 | anaphase-promoting complex-dependent proteasomal ubiquitin-dependent protein catabolic process |
| GO:0051348 | 0.0034 | 2.776 | 4.2018 | 11 | 362 | negative regulation of transferase activity |
| GO:0048608 | 0.0038 | 2.6042 | 4.8866 | 12 | 421 | reproductive structure development |
| GO:0045446 | 0.004 | 5.1223 | 1.0446 | 5 | 90 | endothelial cell differentiation |
| GO:0048729 | 0.0042 | 2.2996 | 6.939 | 15 | 604 | tissue morphogenesis |
| GO:2000543 | 0.0046 | 24.5889 | 0.1045 | 2 | 9 | positive regulation of gastrulation |
| GO:2000058 | 0.005 | 4.8362 | 1.1027 | 5 | 95 | regulation of protein ubiquitination involved in ubiquitin-dependent protein catabolic process |
| GO:0001676 | 0.0052 | 4.7827 | 1.1143 | 5 | 96 | long-chain fatty acid metabolic process |
| GO:0051351 | 0.0054 | 4.7304 | 1.1259 | 5 | 97 | positive regulation of ligase activity |
| GO:0003198 | 0.0057 | 21.5139 | 0.1161 | 2 | 10 | epithelial to mesenchymal transition involved in endocardial cushion formation |
| GO:0035646 | 0.0057 | 21.5139 | 0.1161 | 2 | 10 | endosome to melanosome transport |
| GO:0048757 | 0.0057 | 21.5139 | 0.1161 | 2 | 10 | pigment granule maturation |
| GO:0044092 | 0.0062 | 1.9017 | 12.3848 | 22 | 1067 | negative regulation of molecular function |
| GO:0031397 | 0.0065 | 3.8224 | 1.6598 | 6 | 143 | negative regulation of protein ubiquitination |
| GO:0072359 | 0.0067 | 1.9495 | 10.9455 | 20 | 943 | circulatory system development |
| GO:0043476 | 0.0069 | 19.1222 | 0.1277 | 2 | 11 | pigment accumulation |
| GO:1900746 | 0.0069 | 19.1222 | 0.1277 | 2 | 11 | regulation of vascular endothelial growth factor signaling pathway |
| GO:0000075 | 0.007 | 3.0254 | 2.7857 | 8 | 240 | cell cycle checkpoint |
| GO:0060536 | 0.0082 | 17.2089 | 0.1393 | 2 | 12 | cartilage morphogenesis |
| GO:0043604 | 0.0084 | 2.0623 | 8.2179 | 16 | 708 | amide biosynthetic process |
| GO:0007050 | 0.0085 | 2.923 | 2.8786 | 8 | 248 | cell cycle arrest |
| GO:0048644 | 0.0093 | 5.1756 | 0.8241 | 4 | 71 | muscle organ morphogenesis |
| GO:0019372 | 0.0096 | 15.6434 | 0.1509 | 2 | 13 | lipoxygenase pathway |
| GO:2001212 | 0.0096 | 15.6434 | 0.1509 | 2 | 13 | regulation of vasculogenesis |
| GOMFID | Pvalue | OddsRatio | ExpCount | Count | Size | Term |
| GO:0010467 | 0 | 1.824 | 69.5848 | 100 | 5005 | gene expression |
| GO:0009952 | 0 | 4.6574 | 2.8223 | 12 | 203 | anterior/posterior pattern specification |
| GO:1901576 | 0 | 1.7218 | 81.4302 | 110 | 5857 | organic substance biosynthetic process |
| GO:0006614 | 1e-04 | 6.2282 | 1.4181 | 8 | 102 | SRP-dependent cotranslational protein targeting to membrane |
| GO:0048663 | 1e-04 | 7.401 | 1.0566 | 7 | 76 | neuron fate commitment |
| GO:0006415 | 1e-04 | 4.5406 | 2.3913 | 10 | 172 | translational termination |
| GO:0072599 | 1e-04 | 5.7367 | 1.5293 | 8 | 110 | establishment of protein localization to endoplasmic reticulum |
| GO:0016259 | 2e-04 | 6.6286 | 1.1679 | 7 | 84 | selenocysteine metabolic process |
| GO:0007389 | 2e-04 | 2.9567 | 6.2147 | 17 | 447 | pattern specification process |
| GO:0006725 | 2e-04 | 1.6459 | 76.2722 | 102 | 5486 | cellular aromatic compound metabolic process |
| GO:0043043 | 2e-04 | 2.591 | 8.7867 | 21 | 632 | peptide biosynthetic process |
| GO:0006413 | 3e-04 | 3.6331 | 3.5592 | 12 | 256 | translational initiation |
| GO:0034654 | 4e-04 | 1.6466 | 55.4315 | 78 | 3987 | nucleobase-containing compound biosynthetic process |
| GO:0044271 | 5e-04 | 2.7388 | 6.8485 | 17 | 572 | cellular nitrogen compound biosynthetic process |
| GO:0046483 | 5e-04 | 1.5936 | 76.0219 | 100 | 5468 | heterocycle metabolic process |
| GO:0006807 | 5e-04 | 1.6883 | 55.7872 | 77 | 4301 | nitrogen compound metabolic process |
| GO:0006414 | 5e-04 | 3.8236 | 2.8084 | 10 | 202 | translational elongation |
| GO:0021524 | 6e-04 | 143.1574 | 0.0417 | 2 | 3 | visceral motor neuron differentiation |
| GO:0009889 | 7e-04 | 1.6168 | 55.3481 | 77 | 3981 | regulation of biosynthetic process |
| GO:0034645 | 7e-04 | 1.6094 | 61.0508 | 83 | 4543 | cellular macromolecule biosynthetic process |
| GO:0021520 | 7e-04 | 21.5609 | 0.1807 | 3 | 13 | spinal cord motor neuron cell fate specification |
| GO:0048935 | 7e-04 | 21.5609 | 0.1807 | 3 | 13 | peripheral nervous system neuron development |
| GO:0016070 | 7e-04 | 1.5974 | 59.1992 | 81 | 4258 | RNA metabolic process |
| GO:0007501 | 9e-04 | 19.5996 | 0.1946 | 3 | 14 | mesodermal cell fate specification |
| GO:1901360 | 9e-04 | 1.5498 | 79.2335 | 102 | 5699 | organic cyclic compound metabolic process |
| GO:0000028 | 0.0013 | 16.5821 | 0.2224 | 3 | 16 | ribosomal small subunit assembly |
| GO:0048863 | 0.0014 | 3.1193 | 3.7538 | 11 | 270 | stem cell differentiation |
| GO:0051384 | 0.0019 | 3.8118 | 2.2384 | 8 | 161 | response to glucocorticoid |
| GO:0060750 | 0.0019 | 47.713 | 0.0695 | 2 | 5 | epithelial cell proliferation involved in mammary gland duct elongation |
| GO:0061056 | 0.0019 | 47.713 | 0.0695 | 2 | 5 | sclerotome development |
| GO:0033554 | 0.002 | 1.7255 | 26.0126 | 41 | 1871 | cellular response to stress |
| GO:0043009 | 0.0021 | 2.2766 | 8.4253 | 18 | 606 | chordate embryonic development |
| GO:0048704 | 0.0021 | 4.8886 | 1.3208 | 6 | 95 | embryonic skeletal system morphogenesis |
| GO:0003402 | 0.0028 | 35.7824 | 0.0834 | 2 | 6 | planar cell polarity pathway involved in axis elongation |
| GO:0045198 | 0.0028 | 35.7824 | 0.0834 | 2 | 6 | establishment of epithelial cell apical/basal polarity |
| GO:0060744 | 0.0028 | 35.7824 | 0.0834 | 2 | 6 | mammary gland branching involved in thelarche |
| GO:0003203 | 0.0029 | 11.9721 | 0.292 | 3 | 21 | endocardial cushion morphogenesis |
| GO:2001141 | 0.003 | 1.5453 | 46.4501 | 64 | 3341 | regulation of RNA biosynthetic process |
| GO:0060255 | 0.0035 | 1.4679 | 76.3556 | 96 | 5492 | regulation of macromolecule metabolic process |
| GO:2000027 | 0.0035 | 3.4268 | 2.4747 | 8 | 178 | regulation of organ morphogenesis |
| GO:0048565 | 0.0036 | 3.7949 | 1.9603 | 7 | 141 | digestive tract development |
| GO:0060017 | 0.0039 | 28.6241 | 0.0973 | 2 | 7 | parathyroid gland development |
| GO:0060028 | 0.0039 | 28.6241 | 0.0973 | 2 | 7 | convergent extension involved in axis elongation |
| GO:0021517 | 0.0041 | 6.7025 | 0.6534 | 4 | 47 | ventral spinal cord development |
| GO:0032330 | 0.0041 | 6.7025 | 0.6534 | 4 | 47 | regulation of chondrocyte differentiation |
| GO:0006612 | 0.0041 | 3.3278 | 2.5443 | 8 | 183 | protein targeting to membrane |
| GO:0032355 | 0.0042 | 3.6839 | 2.0159 | 7 | 145 | response to estradiol |
| GO:0045992 | 0.0043 | 10.2598 | 0.3337 | 3 | 24 | negative regulation of embryonic development |
| GO:0019083 | 0.0045 | 3.2711 | 2.586 | 8 | 186 | viral transcription |
| GO:0008284 | 0.0046 | 1.9771 | 11.2893 | 21 | 812 | positive regulation of cell proliferation |
| GO:0045814 | 0.0047 | 3.6048 | 2.0577 | 7 | 148 | negative regulation of gene expression, epigenetic |
| GO:0046661 | 0.005 | 3.5539 | 2.0855 | 7 | 150 | male sex differentiation |
| GO:2001185 | 0.0051 | 23.8519 | 0.1112 | 2 | 8 | regulation of CD8-positive, alpha-beta T cell activation |
| GO:0000184 | 0.0052 | 4.0236 | 1.5849 | 6 | 114 | nuclear-transcribed mRNA catabolic process, nonsense-mediated decay |
| GO:0097659 | 0.0053 | 1.4947 | 48.48 | 65 | 3487 | nucleic acid-templated transcription |
| GO:0019219 | 0.0054 | 1.4821 | 52.1365 | 69 | 3750 | regulation of nucleobase-containing compound metabolic process |
| GO:0060411 | 0.0055 | 6.1304 | 0.7091 | 4 | 51 | cardiac septum morphogenesis |
| GO:0006355 | 0.0058 | 1.4969 | 45.9635 | 62 | 3306 | regulation of transcription, DNA-templated |
| GO:0043374 | 0.0065 | 20.4431 | 0.1251 | 2 | 9 | CD8-positive, alpha-beta T cell differentiation |
| GO:0046543 | 0.0065 | 20.4431 | 0.1251 | 2 | 9 | development of secondary female sexual characteristics |
| GO:0030901 | 0.0066 | 4.5135 | 1.1818 | 5 | 85 | midbrain development |
| GO:0055008 | 0.0071 | 5.6482 | 0.7647 | 4 | 55 | cardiac muscle tissue morphogenesis |
| GO:0048568 | 0.0071 | 2.2936 | 5.9644 | 13 | 429 | embryonic organ development |
| GO:0006402 | 0.0074 | 2.9981 | 2.8084 | 8 | 202 | mRNA catabolic process |
| GO:0034698 | 0.0074 | 8.2841 | 0.4032 | 3 | 29 | response to gonadotropin |
| GO:0001501 | 0.0075 | 2.2036 | 6.6874 | 14 | 481 | skeletal system development |
| GO:0021515 | 0.0076 | 5.5392 | 0.7786 | 4 | 56 | cell differentiation in spinal cord |
| GO:0042102 | 0.008 | 4.2975 | 1.2374 | 5 | 89 | positive regulation of T cell proliferation |
| GO:0060158 | 0.008 | 17.8866 | 0.139 | 2 | 10 | phospholipase C-activating dopamine receptor signaling pathway |
| GO:0014911 | 0.0082 | 7.9767 | 0.4171 | 3 | 30 | positive regulation of smooth muscle cell migration |
| GO:0048333 | 0.0082 | 7.9767 | 0.4171 | 3 | 30 | mesodermal cell differentiation |
| GO:0044033 | 0.0085 | 2.9218 | 2.8779 | 8 | 207 | multi-organism metabolic process |
| GO:0043603 | 0.0086 | 1.8334 | 12.7074 | 22 | 914 | cellular amide metabolic process |
| GO:0006986 | 0.0086 | 3.193 | 2.3079 | 7 | 166 | response to unfolded protein |
| GO:0002478 | 0.0089 | 3.1728 | 2.3218 | 7 | 167 | antigen processing and presentation of exogenous peptide antigen |
| GO:0002720 | 0.0089 | 7.6914 | 0.431 | 3 | 31 | positive regulation of cytokine production involved in immune response |
| GO:0032729 | 0.0091 | 5.236 | 0.8203 | 4 | 59 | positive regulation of interferon-gamma production |
| GO:0060379 | 0.0097 | 15.8981 | 0.1529 | 2 | 11 | cardiac muscle cell myoblast differentiation |
| GO:0060453 | 0.0097 | 15.8981 | 0.1529 | 2 | 11 | regulation of gastric acid secretion |
| GO:0071242 | 0.0098 | 7.4257 | 0.4449 | 3 | 32 | cellular response to ammonium ion |
| GO:1901564 | 0.0099 | 1.5447 | 29.3494 | 42 | 2111 | organonitrogen compound metabolic process |
| GOMFID | Pvalue | OddsRatio | ExpCount | Count | Size | Term |
| GO:0006402 | 1e-04 | 4.7349 | 2.5379 | 11 | 202 | mRNA catabolic process |
| GO:0016259 | 1e-04 | 7.3713 | 1.0554 | 7 | 84 | selenocysteine metabolic process |
| GO:0034655 | 1e-04 | 3.4041 | 4.7868 | 15 | 381 | nucleobase-containing compound catabolic process |
| GO:0006413 | 1e-04 | 4.0511 | 3.2163 | 12 | 256 | translational initiation |
| GO:0043043 | 4e-04 | 2.5893 | 7.9403 | 19 | 632 | peptide biosynthetic process |
| GO:0044033 | 0.0012 | 3.6956 | 2.6007 | 9 | 207 | multi-organism metabolic process |
| GO:0001829 | 0.0014 | 15.9464 | 0.2261 | 3 | 18 | trophectodermal cell differentiation |
| GO:0006415 | 0.0015 | 3.9538 | 2.161 | 8 | 172 | translational termination |
| GO:0001710 | 0.0016 | 14.9488 | 0.2387 | 3 | 19 | mesodermal cell fate commitment |
| GO:0048557 | 0.0016 | 14.9488 | 0.2387 | 3 | 19 | embryonic digestive tract morphogenesis |
| GO:2000573 | 0.0017 | 8.652 | 0.5151 | 4 | 41 | positive regulation of DNA biosynthetic process |
| GO:0006614 | 0.0018 | 5.035 | 1.2815 | 6 | 102 | SRP-dependent cotranslational protein targeting to membrane |
| GO:0006612 | 0.0022 | 3.7026 | 2.2992 | 8 | 183 | protein targeting to membrane |
| GO:0008216 | 0.0023 | 39.6897 | 0.0754 | 2 | 6 | spermidine metabolic process |
| GO:0071877 | 0.0023 | 39.6897 | 0.0754 | 2 | 6 | regulation of adrenergic receptor signaling pathway |
| GO:0019083 | 0.0025 | 3.6395 | 2.3369 | 8 | 186 | viral transcription |
| GO:0010467 | 0.0025 | 1.5295 | 62.8817 | 82 | 5005 | gene expression |
| GO:0072599 | 0.0026 | 4.6453 | 1.382 | 6 | 110 | establishment of protein localization to endoplasmic reticulum |
| GO:1901576 | 0.0028 | 1.5078 | 73.586 | 93 | 5857 | organic substance biosynthetic process |
| GO:0000184 | 0.0032 | 4.4721 | 1.4323 | 6 | 114 | nuclear-transcribed mRNA catabolic process, nonsense-mediated decay |
| GO:0046898 | 0.0032 | 31.7497 | 0.0879 | 2 | 7 | response to cycloheximide |
| GO:0034641 | 0.0035 | 1.4897 | 76.9783 | 96 | 6127 | cellular nitrogen compound metabolic process |
| GO:0006414 | 0.0041 | 3.3358 | 2.5379 | 8 | 202 | translational elongation |
| GO:0034654 | 0.0042 | 1.5203 | 50.0918 | 67 | 3987 | nucleobase-containing compound biosynthetic process |
| GO:0009649 | 0.0046 | 9.9607 | 0.3392 | 3 | 27 | entrainment of circadian clock |
| GO:0034645 | 0.0058 | 1.489 | 55.474 | 72 | 4543 | cellular macromolecule biosynthetic process |
| GO:0016070 | 0.0058 | 1.4865 | 53.4966 | 70 | 4258 | RNA metabolic process |
| GO:0000289 | 0.0074 | 8.2407 | 0.402 | 3 | 32 | nuclear-transcribed mRNA poly(A) tail shortening |
| GO:0000291 | 0.0074 | 8.2407 | 0.402 | 3 | 32 | nuclear-transcribed mRNA catabolic process, exonucleolytic |
| GO:0035879 | 0.008 | 17.6342 | 0.1382 | 2 | 11 | plasma membrane lactate transport |
| GO:0071107 | 0.008 | 17.6342 | 0.1382 | 2 | 11 | response to parathyroid hormone |
| GO:1901564 | 0.0081 | 1.5976 | 26.5221 | 39 | 2111 | organonitrogen compound metabolic process |
| GO:0009168 | 0.0085 | 5.3275 | 0.8041 | 4 | 64 | purine ribonucleoside monophosphate biosynthetic process |
| GO:0001707 | 0.0095 | 5.1549 | 0.8292 | 4 | 66 | mesoderm formation |
| GO:0010454 | 0.0095 | 15.8697 | 0.1508 | 2 | 12 | negative regulation of cell fate commitment |
| GO:0015727 | 0.0095 | 15.8697 | 0.1508 | 2 | 12 | lactate transport |
| GO:1901605 | 0.0096 | 2.5099 | 4.1837 | 10 | 333 | alpha-amino acid metabolic process |
| GOMFID | Pvalue | OddsRatio | ExpCount | Count | Size | Term |
| GO:0016259 | 0 | 8.4899 | 1.0661 | 8 | 84 | selenocysteine metabolic process |
| GO:0044033 | 0 | 5.0304 | 2.6271 | 12 | 207 | multi-organism metabolic process |
| GO:0019083 | 0 | 5.1175 | 2.3606 | 11 | 186 | viral transcription |
| GO:0006614 | 0 | 6.8562 | 1.2945 | 8 | 102 | SRP-dependent cotranslational protein targeting to membrane |
| GO:0072599 | 1e-04 | 6.3152 | 1.396 | 8 | 110 | establishment of protein localization to endoplasmic reticulum |
| GO:0000184 | 1e-04 | 6.0753 | 1.4468 | 8 | 114 | nuclear-transcribed mRNA catabolic process, nonsense-mediated decay |
| GO:0006612 | 1e-04 | 4.6818 | 2.3225 | 10 | 183 | protein targeting to membrane |
| GO:0006414 | 3e-04 | 4.2132 | 2.5636 | 10 | 202 | translational elongation |
| GO:0006415 | 4e-04 | 4.4515 | 2.1829 | 9 | 172 | translational termination |
| GO:0043241 | 5e-04 | 3.338 | 3.8582 | 12 | 304 | protein complex disassembly |
| GO:0019058 | 0.0014 | 2.7005 | 5.5334 | 14 | 436 | viral life cycle |
| GO:0006413 | 0.0016 | 3.2768 | 3.249 | 10 | 256 | translational initiation |
| GO:0097211 | 0.0023 | 39.2817 | 0.0761 | 2 | 6 | cellular response to gonadotropin-releasing hormone |
| GO:0044403 | 0.0035 | 2.0723 | 10.3054 | 20 | 812 | symbiosis, encompassing mutualism through parasitism |
| GO:0006402 | 0.0043 | 3.3005 | 2.5636 | 8 | 202 | mRNA catabolic process |
| GO:0016482 | 0.0048 | 1.84 | 15.1661 | 26 | 1195 | cytoplasmic transport |
| GO:1904030 | 0.005 | 4.84 | 1.1041 | 5 | 87 | negative regulation of cyclin-dependent protein kinase activity |
| GO:0033365 | 0.0053 | 1.99 | 10.6988 | 20 | 843 | protein localization to organelle |
| GO:0006122 | 0.0054 | 22.4423 | 0.1142 | 2 | 9 | mitochondrial electron transport, ubiquinol to cytochrome c |
| GO:0044764 | 0.0054 | 2.0222 | 9.9881 | 19 | 787 | multi-organism cellular process |
| GO:1901679 | 0.0067 | 19.6358 | 0.1269 | 2 | 10 | nucleotide transmembrane transport |
| GO:0006047 | 0.0082 | 17.4529 | 0.1396 | 2 | 11 | UDP-N-acetylglucosamine metabolic process |
| GO:0002820 | 0.009 | 7.6284 | 0.4315 | 3 | 34 | negative regulation of adaptive immune response |
| GO:0034655 | 0.0095 | 2.3896 | 4.8354 | 11 | 381 | nucleobase-containing compound catabolic process |
| GO:1904293 | 0.0097 | 15.7066 | 0.1523 | 2 | 12 | negative regulation of ERAD pathway |
| GOMFID | Pvalue | OddsRatio | ExpCount | Count | Size | Term |
| GO:0043241 | 2e-04 | 3.6759 | 3.5286 | 12 | 304 | protein complex disassembly |
| GO:1903799 | 4e-04 | 172.1889 | 0.0348 | 2 | 3 | negative regulation of production of miRNAs involved in gene silencing by miRNA |
| GO:0051969 | 4e-04 | 25.9575 | 0.1509 | 3 | 13 | regulation of transmission of nerve impulse |
| GO:0016259 | 4e-04 | 6.7395 | 0.975 | 6 | 84 | selenocysteine metabolic process |
| GO:0006004 | 8e-04 | 19.9635 | 0.1857 | 3 | 16 | fucose metabolic process |
| GO:0045830 | 8e-04 | 19.9635 | 0.1857 | 3 | 16 | positive regulation of isotype switching |
| GO:0070920 | 8e-04 | 86.0889 | 0.0464 | 2 | 4 | regulation of production of small RNA involved in gene silencing by RNA |
| GO:0006413 | 8e-04 | 3.6047 | 2.9714 | 10 | 256 | translational initiation |
| GO:0006415 | 9e-04 | 4.2989 | 1.9964 | 8 | 172 | translational termination |
| GO:0006614 | 0.0012 | 5.4695 | 1.1839 | 6 | 102 | SRP-dependent cotranslational protein targeting to membrane |
| GO:0032612 | 0.0012 | 6.8123 | 0.8009 | 5 | 69 | interleukin-1 production |
| GO:0002361 | 0.0013 | 57.3889 | 0.058 | 2 | 5 | CD4-positive, CD25-positive, alpha-beta regulatory T cell differentiation |
| GO:0050713 | 0.0013 | 57.3889 | 0.058 | 2 | 5 | negative regulation of interleukin-1 beta secretion |
| GO:0019083 | 0.0015 | 3.9571 | 2.1589 | 8 | 186 | viral transcription |
| GO:0070286 | 0.0018 | 14.4134 | 0.2438 | 3 | 21 | axonemal dynein complex assembly |
| GO:0072599 | 0.0018 | 5.0461 | 1.2768 | 6 | 110 | establishment of protein localization to endoplasmic reticulum |
| GO:0033365 | 0.0019 | 2.2014 | 9.7848 | 20 | 843 | protein localization to organelle |
| GO:0009146 | 0.0019 | 43.0389 | 0.0696 | 2 | 6 | purine nucleoside triphosphate catabolic process |
| GO:0000184 | 0.0021 | 4.858 | 1.3232 | 6 | 114 | nuclear-transcribed mRNA catabolic process, nonsense-mediated decay |
| GO:0032651 | 0.0023 | 7.8927 | 0.5571 | 4 | 48 | regulation of interleukin-1 beta production |
| GO:0036065 | 0.0023 | 12.9704 | 0.267 | 3 | 23 | fucosylation |
| GO:0006414 | 0.0025 | 3.627 | 2.3446 | 8 | 202 | translational elongation |
| GO:0009204 | 0.0027 | 34.4289 | 0.0812 | 2 | 7 | deoxyribonucleoside triphosphate catabolic process |
| GO:0060149 | 0.0027 | 34.4289 | 0.0812 | 2 | 7 | negative regulation of posttranscriptional gene silencing |
| GO:0060967 | 0.0027 | 34.4289 | 0.0812 | 2 | 7 | negative regulation of gene silencing by RNA |
| GO:0044403 | 0.0029 | 2.1615 | 9.425 | 19 | 812 | symbiosis, encompassing mutualism through parasitism |
| GO:0044033 | 0.0029 | 3.5347 | 2.4027 | 8 | 207 | multi-organism metabolic process |
| GO:0016126 | 0.0031 | 7.2331 | 0.6036 | 4 | 52 | sterol biosynthetic process |
| GO:0030968 | 0.0035 | 4.3688 | 1.4625 | 6 | 126 | endoplasmic reticulum unfolded protein response |
| GO:0086013 | 0.0036 | 28.6889 | 0.0929 | 2 | 8 | membrane repolarization during cardiac muscle cell action potential |
| GO:1903897 | 0.0036 | 28.6889 | 0.0929 | 2 | 8 | regulation of PERK-mediated unfolded protein response |
| GO:0002714 | 0.0037 | 10.8059 | 0.3134 | 3 | 27 | positive regulation of B cell mediated immunity |
| GO:0015031 | 0.004 | 1.7546 | 20.5446 | 33 | 1770 | protein transport |
| GO:0002312 | 0.004 | 6.675 | 0.65 | 4 | 56 | B cell activation involved in immune response |
| GO:1901617 | 0.0043 | 3.2993 | 2.5652 | 8 | 221 | organic hydroxy compound biosynthetic process |
| GO:0042355 | 0.0046 | 24.5889 | 0.1045 | 2 | 9 | L-fucose catabolic process |
| GO:0043374 | 0.0046 | 24.5889 | 0.1045 | 2 | 9 | CD8-positive, alpha-beta T cell differentiation |
| GO:0044764 | 0.0047 | 2.1022 | 9.1348 | 18 | 787 | multi-organism cellular process |
| GO:0019058 | 0.005 | 2.5095 | 5.0607 | 12 | 436 | viral life cycle |
| GO:0035967 | 0.0051 | 4.0301 | 1.5786 | 6 | 136 | cellular response to topologically incorrect protein |
| GO:0006612 | 0.0056 | 3.4823 | 2.1241 | 7 | 183 | protein targeting to membrane |
| GO:0006983 | 0.0057 | 21.5139 | 0.1161 | 2 | 10 | ER overload response |
| GO:0016559 | 0.0057 | 21.5139 | 0.1161 | 2 | 10 | peroxisome fission |
| GO:0035437 | 0.0057 | 21.5139 | 0.1161 | 2 | 10 | maintenance of protein localization in endoplasmic reticulum |
| GO:0060180 | 0.0057 | 21.5139 | 0.1161 | 2 | 10 | female mating behavior |
| GO:0086014 | 0.0057 | 21.5139 | 0.1161 | 2 | 10 | atrial cardiac muscle cell action potential |
| GO:0086066 | 0.0057 | 21.5139 | 0.1161 | 2 | 10 | atrial cardiac muscle cell to AV node cell communication |
| GO:0002700 | 0.0057 | 4.6792 | 1.1375 | 5 | 98 | regulation of production of molecular mediator of immune response |
| GO:0016482 | 0.0059 | 1.8585 | 13.8705 | 24 | 1195 | cytoplasmic transport |
| GO:0050704 | 0.006 | 8.9399 | 0.3714 | 3 | 32 | regulation of interleukin-1 secretion |
| GO:0043297 | 0.0061 | 5.8804 | 0.7312 | 4 | 63 | apical junction assembly |
| GO:0043403 | 0.0065 | 8.6413 | 0.383 | 3 | 33 | skeletal muscle tissue regeneration |
| GO:0009141 | 0.0069 | 3.0387 | 2.7741 | 8 | 239 | nucleoside triphosphate metabolic process |
| GO:0043043 | 0.0069 | 2.1663 | 7.3357 | 15 | 632 | peptide biosynthetic process |
| GO:0042304 | 0.0071 | 8.362 | 0.3946 | 3 | 34 | regulation of fatty acid biosynthetic process |
| GO:0086009 | 0.0071 | 8.362 | 0.3946 | 3 | 34 | membrane repolarization |
| GO:1902580 | 0.0071 | 1.8264 | 14.0911 | 24 | 1214 | single-organism cellular localization |
| GO:0033036 | 0.0077 | 1.573 | 30.8286 | 44 | 2656 | macromolecule localization |
| GO:0001578 | 0.008 | 5.4192 | 0.7893 | 4 | 68 | microtubule bundle formation |
| GO:0043922 | 0.0082 | 17.2089 | 0.1393 | 2 | 12 | negative regulation by host of viral transcription |
| GO:0044458 | 0.0082 | 17.2089 | 0.1393 | 2 | 12 | motile cilium assembly |
| GO:0002204 | 0.0083 | 7.8542 | 0.4179 | 3 | 36 | somatic recombination of immunoglobulin genes involved in immune response |
| GO:0031668 | 0.0091 | 3.1555 | 2.333 | 7 | 201 | cellular response to extracellular stimulus |
| GO:0071356 | 0.0093 | 2.8743 | 2.925 | 8 | 252 | cellular response to tumor necrosis factor |
| GO:0006402 | 0.0093 | 3.1391 | 2.3446 | 7 | 202 | mRNA catabolic process |
| GO:0019372 | 0.0096 | 15.6434 | 0.1509 | 2 | 13 | lipoxygenase pathway |
| GO:0043084 | 0.0096 | 15.6434 | 0.1509 | 2 | 13 | penile erection |
| GO:0060964 | 0.0096 | 15.6434 | 0.1509 | 2 | 13 | regulation of gene silencing by miRNA |
| GOMFID | Pvalue | OddsRatio | ExpCount | Count | Size | Term |
| GO:0016259 | 0 | 11.9773 | 0.9857 | 10 | 84 | selenocysteine metabolic process |
| GO:0019083 | 0 | 6.1435 | 2.1827 | 12 | 186 | viral transcription |
| GO:0006614 | 0 | 8.5178 | 1.1969 | 9 | 102 | SRP-dependent cotranslational protein targeting to membrane |
| GO:0072599 | 0 | 7.839 | 1.2908 | 9 | 110 | establishment of protein localization to endoplasmic reticulum |
| GO:0044033 | 0 | 5.4744 | 2.4291 | 12 | 207 | multi-organism metabolic process |
| GO:0000184 | 0 | 7.5384 | 1.3378 | 9 | 114 | nuclear-transcribed mRNA catabolic process, nonsense-mediated decay |
| GO:0043241 | 0 | 4.3181 | 3.5673 | 14 | 304 | protein complex disassembly |
| GO:0006402 | 0 | 5.095 | 2.3704 | 11 | 202 | mRNA catabolic process |
| GO:0006414 | 0 | 5.095 | 2.3704 | 11 | 202 | translational elongation |
| GO:0006415 | 0 | 5.4399 | 2.0184 | 10 | 172 | translational termination |
| GO:1901605 | 2e-04 | 3.6054 | 3.9077 | 13 | 333 | alpha-amino acid metabolic process |
| GO:0043043 | 2e-04 | 2.7958 | 7.4163 | 19 | 632 | peptide biosynthetic process |
| GO:0006612 | 3e-04 | 4.5287 | 2.1474 | 9 | 183 | protein targeting to membrane |
| GO:1901564 | 3e-04 | 1.9195 | 24.7719 | 42 | 2111 | organonitrogen compound metabolic process |
| GO:0034655 | 6e-04 | 3.1252 | 4.4709 | 13 | 381 | nucleobase-containing compound catabolic process |
| GO:0019058 | 6e-04 | 2.9417 | 5.1163 | 14 | 436 | viral life cycle |
| GO:0006044 | 7e-04 | 21.3867 | 0.176 | 3 | 15 | N-acetylglucosamine metabolic process |
| GO:0043603 | 0.0011 | 2.2234 | 10.7255 | 22 | 914 | cellular amide metabolic process |
| GO:0044249 | 0.0013 | 1.5864 | 67.627 | 88 | 5763 | cellular biosynthetic process |
| GO:0009059 | 0.0014 | 1.5954 | 57.4296 | 77 | 4894 | macromolecule biosynthetic process |
| GO:0044265 | 0.002 | 2.145 | 10.5495 | 21 | 899 | cellular macromolecule catabolic process |
| GO:0015884 | 0.0028 | 34.0462 | 0.0821 | 2 | 7 | folic acid transport |
| GO:0006413 | 0.0033 | 3.175 | 3.0041 | 9 | 256 | translational initiation |
| GO:0046349 | 0.0037 | 28.37 | 0.0939 | 2 | 8 | amino sugar biosynthetic process |
| GO:0000398 | 0.004 | 3.0738 | 3.098 | 9 | 264 | mRNA splicing, via spliceosome |
| GO:0006396 | 0.0043 | 2.1201 | 9.0592 | 18 | 772 | RNA processing |
| GO:0044281 | 0.0043 | 1.6338 | 29.8531 | 44 | 2544 | small molecule metabolic process |
| GO:0006725 | 0.0043 | 1.5013 | 64.3765 | 82 | 5486 | cellular aromatic compound metabolic process |
| GO:0000375 | 0.0044 | 3.0255 | 3.1449 | 9 | 268 | RNA splicing, via transesterification reactions |
| GO:0034654 | 0.0046 | 1.5354 | 46.7862 | 63 | 3987 | nucleobase-containing compound biosynthetic process |
| GO:0001993 | 0.0047 | 24.3155 | 0.1056 | 2 | 9 | regulation of systemic arterial blood pressure by norepinephrine-epinephrine |
| GO:0044764 | 0.0052 | 2.0766 | 9.2352 | 18 | 787 | multi-organism cellular process |
| GO:0097191 | 0.0053 | 3.1856 | 2.652 | 8 | 226 | extrinsic apoptotic signaling pathway |
| GO:0001937 | 0.0056 | 9.1563 | 0.3638 | 3 | 31 | negative regulation of endothelial cell proliferation |
| GO:1901360 | 0.0057 | 1.4782 | 66.876 | 84 | 5699 | organic cyclic compound metabolic process |
| GO:0046483 | 0.0061 | 1.4757 | 64.1653 | 81 | 5468 | heterocycle metabolic process |
| GO:0022618 | 0.0068 | 3.3463 | 2.2061 | 7 | 188 | ribonucleoprotein complex assembly |
| GO:0021930 | 0.007 | 18.9096 | 0.1291 | 2 | 11 | cerebellar granule cell precursor proliferation |
| GO:0044403 | 0.0072 | 2.0078 | 9.5286 | 18 | 812 | symbiosis, encompassing mutualism through parasitism |
| GO:0008285 | 0.0081 | 2.126 | 7.4633 | 15 | 636 | negative regulation of cell proliferation |
| GO:0021534 | 0.0084 | 17.0176 | 0.1408 | 2 | 12 | cell proliferation in hindbrain |
| GO:0002181 | 0.0085 | 7.7664 | 0.4224 | 3 | 36 | cytoplasmic translation |
| GO:0071702 | 0.0087 | 1.5719 | 29.2898 | 42 | 2496 | organic substance transport |
| GO:0042311 | 0.0088 | 5.2756 | 0.8097 | 4 | 69 | vasodilation |
| GO:0008219 | 0.009 | 1.6367 | 22.5189 | 34 | 1919 | cell death |
| GO:0046655 | 0.0098 | 15.4695 | 0.1526 | 2 | 13 | folic acid metabolic process |
| GOMFID | Pvalue | OddsRatio | ExpCount | Count | Size | Term |
| GO:0050911 | 0 | 4.9404 | 2.4839 | 11 | 364 | detection of chemical stimulus involved in sensory perception of smell |
| GO:0009593 | 1e-04 | 4.4167 | 3.0367 | 12 | 445 | detection of chemical stimulus |
| GO:0007606 | 1e-04 | 4.2843 | 3.1254 | 12 | 458 | sensory perception of chemical stimulus |
| GO:0050906 | 1e-04 | 4.2843 | 3.1254 | 12 | 458 | detection of stimulus involved in sensory perception |
| GO:0006069 | 0.0029 | 29.6438 | 0.0819 | 2 | 12 | ethanol oxidation |
| GO:0048286 | 0.004 | 10.1807 | 0.3207 | 3 | 47 | lung alveolus development |
| GO:0032515 | 0.0046 | 22.7985 | 0.1024 | 2 | 15 | negative regulation of phosphoprotein phosphatase activity |
| GO:0060644 | 0.0046 | 22.7985 | 0.1024 | 2 | 15 | mammary gland epithelial cell differentiation |
| GO:0002070 | 0.0052 | 21.1687 | 0.1092 | 2 | 16 | epithelial cell maturation |
| GO:0006625 | 0.0059 | 19.7562 | 0.116 | 2 | 17 | protein targeting to peroxisome |
| GO:0000042 | 0.0066 | 18.5202 | 0.1228 | 2 | 18 | protein targeting to Golgi |
| GO:0001805 | 0.0068 | Inf | 0.0068 | 1 | 1 | positive regulation of type III hypersensitivity |
| GO:0015904 | 0.0068 | Inf | 0.0068 | 1 | 1 | tetracycline transport |
| GO:0045575 | 0.0068 | Inf | 0.0068 | 1 | 1 | basophil activation |
| GO:0050783 | 0.0068 | Inf | 0.0068 | 1 | 1 | cocaine metabolic process |
| GO:0080163 | 0.0068 | Inf | 0.0068 | 1 | 1 | regulation of protein serine/threonine phosphatase activity |
| GO:1900131 | 0.0068 | Inf | 0.0068 | 1 | 1 | negative regulation of lipid binding |
| GO:0051894 | 0.0081 | 16.4603 | 0.1365 | 2 | 20 | positive regulation of focal adhesion assembly |
| GO:0007186 | 0.0083 | 2.1561 | 7.5843 | 15 | 1131 | G-protein coupled receptor signaling pathway |
| GO:0007214 | 0.0097 | 14.8124 | 0.1501 | 2 | 22 | gamma-aminobutyric acid signaling pathway |
| GOMFID | Pvalue | OddsRatio | ExpCount | Count | Size | Term |
| GO:0003735 | 6e-04 | 3.7622 | 2.8518 | 10 | 195 | structural constituent of ribosome |
| GO:0002060 | 6e-04 | 135.9298 | 0.0439 | 2 | 3 | purine nucleobase binding |
| GO:0004082 | 0.0013 | 67.9605 | 0.0585 | 2 | 4 | bisphosphoglycerate mutase activity |
| GO:0046538 | 0.0013 | 67.9605 | 0.0585 | 2 | 4 | 2,3-bisphosphoglycerate-dependent phosphoglycerate mutase activity |
| GO:0004083 | 0.0021 | 45.3041 | 0.0731 | 2 | 5 | bisphosphoglycerate 2-phosphatase activity |
| GO:0008474 | 0.0021 | 45.3041 | 0.0731 | 2 | 5 | palmitoyl-(protein) hydrolase activity |
| GO:0043565 | 0.0056 | 1.8324 | 14.5075 | 25 | 992 | sequence-specific DNA binding |
| GO:0001162 | 0.0056 | 22.6477 | 0.117 | 2 | 8 | RNA polymerase II intronic transcription regulatory region sequence-specific DNA binding |
| GO:0031995 | 0.0056 | 22.6477 | 0.117 | 2 | 8 | insulin-like growth factor II binding |
| GO:0031994 | 0.0072 | 19.411 | 0.1316 | 2 | 9 | insulin-like growth factor I binding |
| GO:0001012 | 0.0086 | 2.0473 | 8.219 | 16 | 562 | RNA polymerase II regulatory region DNA binding |
| GO:0042301 | 0.0089 | 16.9836 | 0.1462 | 2 | 10 | phosphate ion binding |
| GOMFID | Pvalue | OddsRatio | ExpCount | Count | Size | Term |
| GO:0003735 | 0 | 7.2758 | 2.0334 | 13 | 195 | structural constituent of ribosome |
| GO:0003723 | 0.0033 | 1.8923 | 15.5898 | 27 | 1495 | RNA binding |
| GO:0005172 | 0.0037 | 27.4356 | 0.0939 | 2 | 9 | vascular endothelial growth factor receptor binding |
| GO:0051400 | 0.0037 | 27.4356 | 0.0939 | 2 | 9 | BH domain binding |
| GO:0008179 | 0.0046 | 24.0046 | 0.1043 | 2 | 10 | adenylate cyclase binding |
| GO:0005161 | 0.0091 | 15.999 | 0.146 | 2 | 14 | platelet-derived growth factor receptor binding |
| GOMFID | Pvalue | OddsRatio | ExpCount | Count | Size | Term |
| GO:0046982 | 1e-04 | 3.5745 | 4.6044 | 15 | 447 | protein heterodimerization activity |
| GO:0003723 | 6e-04 | 2.097 | 15.3996 | 29 | 1495 | RNA binding |
| GO:0051787 | 0.0065 | 19.4438 | 0.1236 | 2 | 12 | misfolded protein binding |
| GO:0003823 | 0.0082 | 5.3726 | 0.7932 | 4 | 77 | antigen binding |
| GO:0000981 | 0.0094 | 2.2223 | 6.1908 | 13 | 601 | RNA polymerase II transcription factor activity, sequence-specific DNA binding |
| GOMFID | Pvalue | OddsRatio | ExpCount | Count | Size | Term |
| GO:0000983 | 6e-04 | 22.3644 | 0.1744 | 3 | 13 | transcription factor activity, RNA polymerase II core promoter sequence-specific |
| GO:0003700 | 0.0045 | 1.8491 | 15.0532 | 26 | 1122 | transcription factor activity, sequence-specific DNA binding |
| GO:0030957 | 0.0048 | 24.7368 | 0.1073 | 2 | 8 | Tat protein binding |
| GO:0038036 | 0.0048 | 24.7368 | 0.1073 | 2 | 8 | sphingosine-1-phosphate receptor activity |
| GO:0043425 | 0.0049 | 9.7155 | 0.3488 | 3 | 26 | bHLH transcription factor binding |
| GO:0031681 | 0.0061 | 21.2016 | 0.1207 | 2 | 9 | G-protein beta-subunit binding |
| GO:0005102 | 0.0074 | 1.7032 | 18.8635 | 30 | 1406 | receptor binding |
| GO:0048487 | 0.0081 | 7.978 | 0.4159 | 3 | 31 | beta-tubulin binding |
| GOMFID | Pvalue | OddsRatio | ExpCount | Count | Size | Term |
| GO:0031681 | 0.0034 | 28.8757 | 0.0893 | 2 | 9 | G-protein beta-subunit binding |
| GO:0005149 | 0.0094 | 15.5425 | 0.1488 | 2 | 15 | interleukin-1 receptor binding |
| GO:0004306 | 0.0099 | Inf | 0.0099 | 1 | 1 | ethanolamine-phosphate cytidylyltransferase activity |
| GO:0004586 | 0.0099 | Inf | 0.0099 | 1 | 1 | ornithine decarboxylase activity |
| GO:0004778 | 0.0099 | Inf | 0.0099 | 1 | 1 | succinyl-CoA hydrolase activity |
| GO:0004807 | 0.0099 | Inf | 0.0099 | 1 | 1 | triose-phosphate isomerase activity |
| GO:0008437 | 0.0099 | Inf | 0.0099 | 1 | 1 | thyrotropin-releasing hormone activity |
| GO:0016992 | 0.0099 | Inf | 0.0099 | 1 | 1 | lipoate synthase activity |
| GO:0017174 | 0.0099 | Inf | 0.0099 | 1 | 1 | glycine N-methyltransferase activity |
| GO:0035438 | 0.0099 | Inf | 0.0099 | 1 | 1 | cyclic-di-GMP binding |
| GO:0048270 | 0.0099 | Inf | 0.0099 | 1 | 1 | methionine adenosyltransferase regulator activity |
| GO:0061507 | 0.0099 | Inf | 0.0099 | 1 | 1 | cyclic-GMP-AMP binding |
| GOMFID | Pvalue | OddsRatio | ExpCount | Count | Size | Term |
| GO:0003735 | 0 | 5.4346 | 2.2318 | 11 | 195 | structural constituent of ribosome |
| GO:0070888 | 0.0068 | 8.4833 | 0.3891 | 3 | 34 | E-box binding |
| GO:0001054 | 0.008 | 17.4573 | 0.1373 | 2 | 12 | RNA polymerase I activity |
| GO:0016290 | 0.008 | 17.4573 | 0.1373 | 2 | 12 | palmitoyl-CoA hydrolase activity |
| GO:0003700 | 0.0093 | 1.8287 | 12.8416 | 22 | 1122 | transcription factor activity, sequence-specific DNA binding |
| GO:0000983 | 0.0094 | 15.8693 | 0.1488 | 2 | 13 | transcription factor activity, RNA polymerase II core promoter sequence-specific |
| GOMFID | Pvalue | OddsRatio | ExpCount | Count | Size | Term |
| GO:0003676 | 0 | 1.9255 | 52.8343 | 83 | 3693 | nucleic acid binding |
| GO:0043565 | 2e-04 | 2.2338 | 14.1922 | 29 | 992 | sequence-specific DNA binding |
| GO:0003735 | 5e-04 | 3.8509 | 2.7898 | 10 | 195 | structural constituent of ribosome |
| GO:0061133 | 0.0029 | 34.7489 | 0.0858 | 2 | 6 | endopeptidase activator activity |
| GO:0042043 | 0.0054 | 23.1629 | 0.1145 | 2 | 8 | neurexin family protein binding |
| GO:0048027 | 0.0054 | 23.1629 | 0.1145 | 2 | 8 | mRNA 5'-UTR binding |
| GO:0003700 | 0.0057 | 2.2136 | 7.1644 | 15 | 521 | transcription factor activity, sequence-specific DNA binding |
| GO:0000981 | 0.0059 | 2.0878 | 8.5983 | 17 | 601 | RNA polymerase II transcription factor activity, sequence-specific DNA binding |
| GO:0008641 | 0.0069 | 19.8527 | 0.1288 | 2 | 9 | small protein activating enzyme activity |
| GOMFID | Pvalue | OddsRatio | ExpCount | Count | Size | Term |
| GO:0003735 | 8e-04 | 3.9492 | 2.4426 | 9 | 195 | structural constituent of ribosome |
| GO:0016702 | 0.0028 | 11.9923 | 0.2881 | 3 | 23 | oxidoreductase activity, acting on single donors with incorporation of molecular oxygen, incorporation of two atoms of oxygen |
| GO:0003676 | 0.0061 | 1.505 | 46.2594 | 62 | 3693 | nucleic acid binding |
| GO:0017070 | 0.0066 | 19.9 | 0.1253 | 2 | 10 | U6 snRNA binding |
| GO:0015129 | 0.008 | 17.6877 | 0.1378 | 2 | 11 | lactate transmembrane transporter activity |
| GOMFID | Pvalue | OddsRatio | ExpCount | Count | Size | Term |
| GO:0008821 | 0.0015 | 49.25 | 0.061 | 2 | 6 | crossover junction endodeoxyribonuclease activity |
| GO:0017108 | 0.0015 | 49.25 | 0.061 | 2 | 6 | 5'-flap endonuclease activity |
| GO:0016893 | 0.0062 | 8.7297 | 0.3764 | 3 | 37 | endonuclease activity, active with either ribo- or deoxyribonucleic acids and producing 5'-phosphomonoesters |
| GO:0016788 | 0.0086 | 2.1761 | 6.8265 | 14 | 671 | hydrolase activity, acting on ester bonds |
| GOMFID | Pvalue | OddsRatio | ExpCount | Count | Size | Term |
| GO:0004984 | 0 | 6.3613 | 2.5459 | 14 | 364 | olfactory receptor activity |
| GO:0004930 | 0 | 3.5883 | 5.4136 | 17 | 774 | G-protein coupled receptor activity |
| GO:0038023 | 1e-04 | 2.8986 | 8.8269 | 22 | 1262 | signaling receptor activity |
| GO:0099600 | 1e-04 | 2.8658 | 8.4562 | 21 | 1209 | transmembrane receptor activity |
| GO:0060089 | 6e-04 | 2.3952 | 10.4775 | 22 | 1498 | molecular transducer activity |
| GO:0005549 | 0.0027 | 7.422 | 0.5805 | 4 | 83 | odorant binding |
| GO:0008009 | 0.0046 | 9.7022 | 0.3357 | 3 | 48 | chemokine activity |
| GO:0008320 | 0.0069 | 18.0567 | 0.1259 | 2 | 18 | protein transmembrane transporter activity |
| GO:0050750 | 0.0069 | 18.0567 | 0.1259 | 2 | 18 | low-density lipoprotein particle receptor binding |
| GO:0000254 | 0.007 | Inf | 0.007 | 1 | 1 | C-4 methylsterol oxidase activity |
| GO:0000257 | 0.007 | Inf | 0.007 | 1 | 1 | nitrilase activity |
| GO:0004343 | 0.007 | Inf | 0.007 | 1 | 1 | glucosamine 6-phosphate N-acetyltransferase activity |
| GO:0031764 | 0.007 | Inf | 0.007 | 1 | 1 | type 1 galanin receptor binding |
| GO:0036105 | 0.007 | Inf | 0.007 | 1 | 1 | peroxisome membrane class-1 targeting sequence binding |
| GO:0046911 | 0.007 | Inf | 0.007 | 1 | 1 | metal chelating activity |
| GO:0047962 | 0.007 | Inf | 0.007 | 1 | 1 | glycine N-benzoyltransferase activity |
| GO:0070180 | 0.007 | Inf | 0.007 | 1 | 1 | large ribosomal subunit rRNA binding |
| GO:0097260 | 0.007 | Inf | 0.007 | 1 | 1 | eoxin A4 synthase activity |
| GOMFID | Pvalue | OddsRatio | ExpCount | Count | Size | Term |
| GO:0003735 | 7e-04 | 4.0361 | 2.393 | 9 | 195 | structural constituent of ribosome |
| GO:0050656 | 0.0022 | 40.6545 | 0.0736 | 2 | 6 | 3'-phosphoadenosine 5'-phosphosulfate binding |
| GO:0004032 | 0.003 | 32.5215 | 0.0859 | 2 | 7 | alditol:NADP+ 1-oxidoreductase activity |
| GO:0004860 | 0.0037 | 5.203 | 1.0308 | 5 | 84 | protein kinase inhibitor activity |
| GO:0016803 | 0.004 | 27.0995 | 0.0982 | 2 | 8 | ether hydrolase activity |
| GO:0031995 | 0.004 | 27.0995 | 0.0982 | 2 | 8 | insulin-like growth factor II binding |
| GO:0031994 | 0.0051 | 23.2266 | 0.1104 | 2 | 9 | insulin-like growth factor I binding |
| GO:0016892 | 0.0063 | 20.322 | 0.1227 | 2 | 10 | endoribonuclease activity, producing 3'-phosphomonoesters |
| GO:0019207 | 0.0065 | 3.3812 | 2.1844 | 7 | 178 | kinase regulator activity |
| GO:0016500 | 0.0077 | 18.0628 | 0.135 | 2 | 11 | protein-hormone receptor activity |
| GO:0016616 | 0.0095 | 4.1048 | 1.2885 | 5 | 105 | oxidoreductase activity, acting on the CH-OH group of donors, NAD or NADP as acceptor |
| GOMFID | Pvalue | OddsRatio | ExpCount | Count | Size | Term |
| GO:0003735 | 0.0022 | 3.7113 | 2.2938 | 8 | 195 | structural constituent of ribosome |
| GO:0046920 | 0.0037 | 28.2987 | 0.0941 | 2 | 8 | alpha-(1->3)-fucosyltransferase activity |
| GO:0047429 | 0.0037 | 28.2987 | 0.0941 | 2 | 8 | nucleoside-triphosphate diphosphatase activity |
| GO:0051787 | 0.0084 | 16.9749 | 0.1412 | 2 | 12 | misfolded protein binding |
| GOMFID | Pvalue | OddsRatio | ExpCount | Count | Size | Term |
| GO:0003735 | 0 | 5.6886 | 2.3434 | 12 | 195 | structural constituent of ribosome |
| GO:0008517 | 0.0021 | 41.5348 | 0.0721 | 2 | 6 | folic acid transporter activity |
| GO:0003723 | 0.0036 | 1.8125 | 17.9662 | 30 | 1495 | RNA binding |
| GO:0051082 | 0.0055 | 4.717 | 1.1296 | 5 | 94 | unfolded protein binding |
| GO:0043422 | 0.0061 | 20.762 | 0.1202 | 2 | 10 | protein kinase B binding |
| GO:0008143 | 0.0088 | 16.6075 | 0.1442 | 2 | 12 | poly(A) binding |
| GOMFID | Pvalue | OddsRatio | ExpCount | Count | Size | Term |
| GO:0004984 | 0 | 5.2296 | 2.3608 | 11 | 364 | olfactory receptor activity |
| GO:0038023 | 2e-04 | 2.8245 | 8.1849 | 20 | 1262 | signaling receptor activity |
| GO:0060089 | 2e-04 | 2.6362 | 9.7155 | 22 | 1498 | molecular transducer activity |
| GO:0004024 | 2e-04 | 156.23 | 0.0259 | 2 | 4 | alcohol dehydrogenase activity, zinc-dependent |
| GO:0099600 | 3e-04 | 2.7768 | 7.8412 | 19 | 1209 | transmembrane receptor activity |
| GO:0004930 | 0.0015 | 2.853 | 5.0199 | 13 | 774 | G-protein coupled receptor activity |
| GO:0004890 | 0.0047 | 22.3014 | 0.1038 | 2 | 16 | GABA-A receptor activity |
| GO:0004574 | 0.0065 | Inf | 0.0065 | 1 | 1 | oligo-1,6-glucosidase activity |
| GO:0004575 | 0.0065 | Inf | 0.0065 | 1 | 1 | sucrose alpha-glucosidase activity |
| GO:0008493 | 0.0065 | Inf | 0.0065 | 1 | 1 | tetracycline transporter activity |
| GO:0036105 | 0.0065 | Inf | 0.0065 | 1 | 1 | peroxisome membrane class-1 targeting sequence binding |
| GO:0047962 | 0.0065 | Inf | 0.0065 | 1 | 1 | glycine N-benzoyltransferase activity |
| NA. |
| n/a |
| NA. |
| n/a |
| NA. |
| n/a |
| NA. |
| n/a |
| NA. |
| n/a |
| NA. |
| n/a |
| NA. |
| n/a |
| NA. |
| n/a |
| NA. |
| n/a |
| NA. |
| n/a |
| NA. |
| n/a |
| NA. |
| n/a |
| NA. |
| n/a |
| NA. |
| n/a |
| NA. |
| n/a |
| NA. |
| n/a |
| NA. |
| n/a |
| NA. |
| n/a |
| NA. |
| n/a |
| NA. |
| n/a |
| NA. |
| n/a |
| NA. |
| n/a |
| NA. |
| n/a |
| NA. |
| n/a |
| NA. |
| n/a |
| NA. |
| n/a |
| NA. |
| n/a |
| NA. |
| n/a |
| NA. |
| n/a |
| NA. |
| n/a |
| NA. |
| n/a |
| NA. |
| n/a |
| NA. |
| n/a |
| NA. |
| n/a |
| NA. |
| n/a |
| NA. |
| n/a |
| NA. |
| n/a |
| NA. |
| n/a |
| NA. |
| n/a |
| NA. |
| n/a |
| NA. |
| n/a |
| NA. |
| n/a |
| NA. |
| n/a |
| NA. |
| n/a |
| NA. |
| n/a |
| NA. |
| n/a |
| NA. |
| n/a |
| NA. |
| n/a |
| NA. |
| n/a |
| NA. |
| n/a |
| NA. |
| n/a |
| NA. |
| n/a |
| NA. |
| n/a |
| NA. |
| n/a |
| NA. |
| n/a |
| NA. |
| n/a |
| NA. |
| n/a |
| NA. |
| n/a |
| NA. |
| n/a |
| NA. |
| n/a |
| NA. |
| n/a |
| NA. |
| n/a |
| NA. |
| n/a |
| NA. |
| n/a |
| GOMFID | Pvalue | OddsRatio | ExpCount | Count | Size | Term |
| GO:0019065 | 8e-04 | 121.0787 | 0.0491 | 2 | 3 | receptor-mediated endocytosis of virus by host cell |
| GO:0033489 | 8e-04 | 121.0787 | 0.0491 | 2 | 3 | cholesterol biosynthetic process via desmosterol |
| GO:0033490 | 8e-04 | 121.0787 | 0.0491 | 2 | 3 | cholesterol biosynthetic process via lathosterol |
| GO:0000209 | 9e-04 | 3.3396 | 3.5205 | 11 | 215 | protein polyubiquitination |
| GO:0033059 | 9e-04 | 7.4517 | 0.7532 | 5 | 46 | cellular pigmentation |
| GO:0045329 | 0.0016 | 60.5354 | 0.0655 | 2 | 4 | carnitine biosynthetic process |
| GO:0070836 | 0.0016 | 60.5354 | 0.0655 | 2 | 4 | caveola assembly |
| GO:0006968 | 0.002 | 6.1068 | 0.9006 | 5 | 55 | cellular defense response |
| GO:0044857 | 0.0026 | 40.3543 | 0.0819 | 2 | 5 | plasma membrane raft organization |
| GO:0046794 | 0.0027 | 7.6121 | 0.5895 | 4 | 36 | transport of virus |
| GO:1902579 | 0.003 | 7.381 | 0.6059 | 4 | 37 | multi-organism localization |
| GO:0032446 | 0.0034 | 1.9091 | 13.9184 | 25 | 850 | protein modification by small protein conjugation |
| GO:0014050 | 0.0038 | 30.2638 | 0.0982 | 2 | 6 | negative regulation of glutamate secretion |
| GO:0036297 | 0.004 | 6.7646 | 0.655 | 4 | 40 | interstrand cross-link repair |
| GO:0019941 | 0.0043 | 2.1064 | 9.0224 | 18 | 551 | modification-dependent protein catabolic process |
| GO:0048066 | 0.0053 | 6.243 | 0.7041 | 4 | 43 | developmental pigmentation |
| GO:0032400 | 0.0053 | 9.5854 | 0.3602 | 3 | 22 | melanosome localization |
| GO:0009108 | 0.0054 | 3.5154 | 2.1123 | 7 | 129 | coenzyme biosynthetic process |
| GO:1903307 | 0.0067 | 5.7959 | 0.7532 | 4 | 46 | positive regulation of regulated secretory pathway |
| GO:0006054 | 0.007 | 20.1732 | 0.131 | 2 | 8 | N-acetylneuraminate metabolic process |
| GO:0048813 | 0.0076 | 3.704 | 1.7193 | 6 | 105 | dendrite morphogenesis |
| GO:0043161 | 0.008 | 2.2574 | 6.0422 | 13 | 369 | proteasome-mediated ubiquitin-dependent protein catabolic process |
| GO:0044257 | 0.0084 | 1.9244 | 10.3815 | 19 | 634 | cellular protein catabolic process |
| GO:0030512 | 0.0086 | 4.2347 | 1.2608 | 5 | 77 | negative regulation of transforming growth factor beta receptor signaling pathway |
| GO:1903844 | 0.0091 | 3.5592 | 1.7848 | 6 | 109 | regulation of cellular response to transforming growth factor beta stimulus |
| GOMFID | Pvalue | OddsRatio | ExpCount | Count | Size | Term |
| GO:2000671 | 0.0026 | 36.8876 | 0.081 | 2 | 6 | regulation of motor neuron apoptotic process |
| GO:0002717 | 0.0027 | 12.3438 | 0.2834 | 3 | 21 | positive regulation of natural killer cell mediated immunity |
| GO:0051231 | 0.0061 | 21.0745 | 0.1215 | 2 | 9 | spindle elongation |
| GO:0002923 | 0.0092 | 16.3892 | 0.1485 | 2 | 11 | regulation of humoral immune response mediated by circulating immunoglobulin |
| GO:0042269 | 0.0098 | 7.4005 | 0.4454 | 3 | 33 | regulation of natural killer cell mediated cytotoxicity |
| GOMFID | Pvalue | OddsRatio | ExpCount | Count | Size | Term |
| GO:0006529 | 3e-04 | Inf | 0.0343 | 2 | 2 | asparagine biosynthetic process |
| GO:0002449 | 8e-04 | 3.3649 | 3.497 | 11 | 204 | lymphocyte mediated immunity |
| GO:0009397 | 9e-04 | 115.5263 | 0.0514 | 2 | 3 | folic acid-containing compound catabolic process |
| GO:0050893 | 9e-04 | 115.5263 | 0.0514 | 2 | 3 | sensory processing |
| GO:0007040 | 0.0015 | 6.6203 | 0.84 | 5 | 49 | lysosome organization |
| GO:0042092 | 0.0023 | 8.0131 | 0.5657 | 4 | 33 | type 2 immune response |
| GO:1902004 | 0.0028 | 38.5038 | 0.0857 | 2 | 5 | positive regulation of beta-amyloid formation |
| GO:0007257 | 0.0029 | 7.4951 | 0.6 | 4 | 35 | activation of JUN kinase activity |
| GO:0002460 | 0.003 | 2.9999 | 3.5313 | 10 | 206 | adaptive immune response based on somatic recombination of immune receptors built from immunoglobulin superfamily domains |
| GO:0043603 | 0.0039 | 1.8376 | 15.5993 | 27 | 910 | cellular amide metabolic process |
| GO:2000637 | 0.0042 | 28.8759 | 0.1029 | 2 | 6 | positive regulation of gene silencing by miRNA |
| GO:2000671 | 0.0042 | 28.8759 | 0.1029 | 2 | 6 | regulation of motor neuron apoptotic process |
| GO:0070230 | 0.0053 | 9.6528 | 0.36 | 3 | 21 | positive regulation of lymphocyte apoptotic process |
| GO:0042048 | 0.0058 | 23.0992 | 0.12 | 2 | 7 | olfactory behavior |
| GO:0048702 | 0.0058 | 23.0992 | 0.12 | 2 | 7 | embryonic neurocranium morphogenesis |
| GO:0032874 | 0.0071 | 3.3237 | 2.2285 | 7 | 130 | positive regulation of stress-activated MAPK cascade |
| GO:0097104 | 0.0077 | 19.2481 | 0.1371 | 2 | 8 | postsynaptic membrane assembly |
| GO:1900246 | 0.0077 | 19.2481 | 0.1371 | 2 | 8 | positive regulation of RIG-I signaling pathway |
| GO:0002369 | 0.0077 | 8.2722 | 0.4114 | 3 | 24 | T cell cytokine production |
| GO:0050435 | 0.0077 | 8.2722 | 0.4114 | 3 | 24 | beta-amyloid metabolic process |
| GO:0007612 | 0.0087 | 3.1928 | 2.3142 | 7 | 135 | learning |
| GO:0071625 | 0.0097 | 16.4973 | 0.1543 | 2 | 9 | vocalization behavior |
| GO:0086036 | 0.0097 | 16.4973 | 0.1543 | 2 | 9 | regulation of cardiac muscle cell membrane potential |
| GOMFID | Pvalue | OddsRatio | ExpCount | Count | Size | Term |
| GO:0044723 | 3e-04 | 2.2899 | 11.8146 | 25 | 786 | single-organism carbohydrate metabolic process |
| GO:0044281 | 5e-04 | 1.7103 | 38.0894 | 58 | 2534 | small molecule metabolic process |
| GO:0033120 | 6e-04 | 12.1031 | 0.3908 | 4 | 26 | positive regulation of RNA splicing |
| GO:0002673 | 6e-04 | 6.378 | 1.0372 | 6 | 69 | regulation of acute inflammatory response |
| GO:0018242 | 7e-04 | 132.1717 | 0.0451 | 2 | 3 | protein O-linked glycosylation via serine |
| GO:0018243 | 0.0013 | 66.0815 | 0.0601 | 2 | 4 | protein O-linked glycosylation via threonine |
| GO:0032100 | 0.0013 | 66.0815 | 0.0601 | 2 | 4 | positive regulation of appetite |
| GO:0048265 | 0.0016 | 8.871 | 0.5111 | 4 | 34 | response to pain |
| GO:0033138 | 0.002 | 4.9549 | 1.3077 | 6 | 87 | positive regulation of peptidyl-serine phosphorylation |
| GO:0022618 | 0.0021 | 3.4053 | 2.8109 | 9 | 187 | ribonucleoprotein complex assembly |
| GO:0006771 | 0.0022 | 44.0515 | 0.0752 | 2 | 5 | riboflavin metabolic process |
| GO:0051461 | 0.0022 | 44.0515 | 0.0752 | 2 | 5 | positive regulation of corticotropin secretion |
| GO:0060398 | 0.0022 | 44.0515 | 0.0752 | 2 | 5 | regulation of growth hormone receptor signaling pathway |
| GO:1901137 | 0.0022 | 2.0093 | 12.7616 | 24 | 849 | carbohydrate derivative biosynthetic process |
| GO:0044711 | 0.0023 | 1.7174 | 25.2977 | 40 | 1683 | single-organism biosynthetic process |
| GO:0009967 | 0.0037 | 1.7308 | 21.119 | 34 | 1405 | positive regulation of signal transduction |
| GO:0015871 | 0.0045 | 26.4275 | 0.1052 | 2 | 7 | choline transport |
| GO:0019318 | 0.0045 | 2.8192 | 3.7428 | 10 | 249 | hexose metabolic process |
| GO:0008154 | 0.0045 | 3.2739 | 2.5854 | 8 | 172 | actin polymerization or depolymerization |
| GO:0070613 | 0.0057 | 4.6932 | 1.1424 | 5 | 76 | regulation of protein processing |
| GO:0060426 | 0.0059 | 22.0215 | 0.1203 | 2 | 8 | lung vasculature development |
| GO:2000009 | 0.0059 | 22.0215 | 0.1203 | 2 | 8 | negative regulation of protein localization to cell surface |
| GO:0043243 | 0.0068 | 8.6447 | 0.3908 | 3 | 26 | positive regulation of protein complex disassembly |
| GO:0051125 | 0.0068 | 8.6447 | 0.3908 | 3 | 26 | regulation of actin nucleation |
| GO:0044249 | 0.0074 | 1.3952 | 86.4452 | 105 | 5751 | cellular biosynthetic process |
| GO:0008343 | 0.0076 | 18.8743 | 0.1353 | 2 | 9 | adult feeding behavior |
| GO:0016266 | 0.0087 | 5.3157 | 0.8117 | 4 | 54 | O-glycan processing |
| GO:0000212 | 0.0094 | 16.5139 | 0.1503 | 2 | 10 | meiotic spindle organization |
| GO:0051006 | 0.0094 | 16.5139 | 0.1503 | 2 | 10 | positive regulation of lipoprotein lipase activity |
| GOMFID | Pvalue | OddsRatio | ExpCount | Count | Size | Term |
| GO:0070727 | 0 | 2.0478 | 32.748 | 60 | 1467 | cellular macromolecule localization |
| GO:0031329 | 1e-04 | 2.3344 | 12.434 | 27 | 557 | regulation of cellular catabolic process |
| GO:0008104 | 1e-04 | 2.6569 | 8.5471 | 21 | 406 | protein localization |
| GO:2001241 | 1e-04 | 19.6792 | 0.2902 | 4 | 13 | positive regulation of extrinsic apoptotic signaling pathway in absence of ligand |
| GO:1903546 | 2e-04 | 44.1676 | 0.1339 | 3 | 6 | protein localization to photoreceptor outer segment |
| GO:0033365 | 3e-04 | 2.005 | 18.7514 | 35 | 840 | protein localization to organelle |
| GO:0030111 | 6e-04 | 2.6292 | 6.8979 | 17 | 309 | regulation of Wnt signaling pathway |
| GO:0090263 | 7e-04 | 3.6968 | 2.9243 | 10 | 131 | positive regulation of canonical Wnt signaling pathway |
| GO:0032446 | 7e-04 | 1.9139 | 18.9747 | 34 | 850 | protein modification by small protein conjugation |
| GO:0071158 | 8e-04 | 4.4589 | 1.9644 | 8 | 88 | positive regulation of cell cycle arrest |
| GO:0030163 | 0.001 | 1.9298 | 17.0995 | 31 | 766 | protein catabolic process |
| GO:0007030 | 0.001 | 4.2455 | 2.0537 | 8 | 92 | Golgi organization |
| GO:0048699 | 0.0011 | 1.6479 | 34.6232 | 53 | 1551 | generation of neurons |
| GO:0098869 | 0.0012 | 4.7197 | 1.6296 | 7 | 73 | cellular oxidant detoxification |
| GO:0010899 | 0.0015 | 88.0922 | 0.067 | 2 | 3 | regulation of phosphatidylcholine catabolic process |
| GO:0033489 | 0.0015 | 88.0922 | 0.067 | 2 | 3 | cholesterol biosynthetic process via desmosterol |
| GO:0033490 | 0.0015 | 88.0922 | 0.067 | 2 | 3 | cholesterol biosynthetic process via lathosterol |
| GO:0086017 | 0.0015 | 88.0922 | 0.067 | 2 | 3 | Purkinje myocyte action potential |
| GO:0060548 | 0.0017 | 1.8104 | 19.9569 | 34 | 894 | negative regulation of cell death |
| GO:0045599 | 0.0019 | 6.3331 | 0.8929 | 5 | 40 | negative regulation of fat cell differentiation |
| GO:0051128 | 0.0019 | 1.5332 | 46.5214 | 66 | 2084 | regulation of cellular component organization |
| GO:0098754 | 0.0019 | 4.3247 | 1.7635 | 7 | 79 | detoxification |
| GO:0032989 | 0.0021 | 1.6152 | 33.1275 | 50 | 1484 | cellular component morphogenesis |
| GO:0038061 | 0.0021 | 3.7512 | 2.2993 | 8 | 103 | NIK/NF-kappaB signaling |
| GO:0032886 | 0.0022 | 3.1457 | 3.3931 | 10 | 152 | regulation of microtubule-based process |
| GO:0003206 | 0.0024 | 3.6734 | 2.3439 | 8 | 105 | cardiac chamber morphogenesis |
| GO:0051603 | 0.0025 | 1.9493 | 13.5501 | 25 | 607 | proteolysis involved in cellular protein catabolic process |
| GO:0007167 | 0.0025 | 1.6659 | 26.8324 | 42 | 1202 | enzyme linked receptor protein signaling pathway |
| GO:0042692 | 0.0025 | 2.2782 | 7.8801 | 17 | 353 | muscle cell differentiation |
| GO:0018105 | 0.0026 | 2.6014 | 5.2906 | 13 | 237 | peptidyl-serine phosphorylation |
| GO:0007173 | 0.0027 | 2.2644 | 7.9247 | 17 | 355 | epidermal growth factor receptor signaling pathway |
| GO:0061669 | 0.0029 | 44.0432 | 0.0893 | 2 | 4 | spontaneous neurotransmitter secretion |
| GO:0070294 | 0.0029 | 44.0432 | 0.0893 | 2 | 4 | renal sodium ion absorption |
| GO:0097500 | 0.0029 | 44.0432 | 0.0893 | 2 | 4 | receptor localization to nonmotile primary cilium |
| GO:1900825 | 0.0029 | 44.0432 | 0.0893 | 2 | 4 | regulation of membrane depolarization during cardiac muscle cell action potential |
| GO:2000060 | 0.0031 | 3.9397 | 1.9198 | 7 | 86 | positive regulation of protein ubiquitination involved in ubiquitin-dependent protein catabolic process |
| GO:0034394 | 0.0032 | 5.5396 | 1.0045 | 5 | 45 | protein localization to cell surface |
| GO:0043620 | 0.0032 | 4.5143 | 1.451 | 6 | 65 | regulation of DNA-templated transcription in response to stress |
| GO:0098609 | 0.0032 | 1.7625 | 19.1979 | 32 | 860 | cell-cell adhesion |
| GO:0000209 | 0.0033 | 2.6455 | 4.7995 | 12 | 215 | protein polyubiquitination |
| GO:0003161 | 0.0033 | 12.0394 | 0.3125 | 3 | 14 | cardiac conduction system development |
| GO:0033209 | 0.0033 | 2.9565 | 3.594 | 10 | 161 | tumor necrosis factor-mediated signaling pathway |
| GO:0048667 | 0.0034 | 1.7899 | 17.7023 | 30 | 793 | cell morphogenesis involved in neuron differentiation |
| GO:0008589 | 0.0035 | 4.4388 | 1.4733 | 6 | 66 | regulation of smoothened signaling pathway |
| GO:0048814 | 0.0035 | 4.4388 | 1.4733 | 6 | 66 | regulation of dendrite morphogenesis |
| GO:0090090 | 0.0035 | 2.9368 | 3.6163 | 10 | 162 | negative regulation of canonical Wnt signaling pathway |
| GO:2000117 | 0.0035 | 3.8419 | 1.9644 | 7 | 88 | negative regulation of cysteine-type endopeptidase activity |
| GO:0051493 | 0.0035 | 2.1446 | 8.84 | 18 | 396 | regulation of cytoskeleton organization |
| GO:0045184 | 0.0036 | 1.5114 | 42.5479 | 60 | 1906 | establishment of protein localization |
| GO:0046907 | 0.0037 | 1.5225 | 40.0477 | 57 | 1794 | intracellular transport |
| GO:0060993 | 0.0037 | 3.7948 | 1.9868 | 7 | 89 | kidney morphogenesis |
| GO:0072080 | 0.004 | 3.7488 | 2.0091 | 7 | 90 | nephron tubule development |
| GO:0048858 | 0.004 | 1.669 | 23.4616 | 37 | 1051 | cell projection morphogenesis |
| GO:0060307 | 0.0041 | 11.0354 | 0.3348 | 3 | 15 | regulation of ventricular cardiac muscle cell membrane repolarization |
| GO:0045216 | 0.0041 | 2.5686 | 4.9334 | 12 | 221 | cell-cell junction organization |
| GO:0006605 | 0.0042 | 1.842 | 14.8672 | 26 | 666 | protein targeting |
| GO:0050766 | 0.0042 | 5.1521 | 1.0715 | 5 | 48 | positive regulation of phagocytosis |
| GO:0030029 | 0.0043 | 1.8858 | 13.3939 | 24 | 600 | actin filament-based process |
| GO:0022607 | 0.0045 | 1.4543 | 51.7674 | 70 | 2319 | cellular component assembly |
| GO:0002001 | 0.0048 | 29.3602 | 0.1116 | 2 | 5 | renin secretion into blood stream |
| GO:0003284 | 0.0048 | 29.3602 | 0.1116 | 2 | 5 | septum primum development |
| GO:0072162 | 0.0048 | 29.3602 | 0.1116 | 2 | 5 | metanephric mesenchymal cell differentiation |
| GO:0086068 | 0.0048 | 29.3602 | 0.1116 | 2 | 5 | Purkinje myocyte to ventricular cardiac muscle cell communication |
| GO:2001268 | 0.0048 | 29.3602 | 0.1116 | 2 | 5 | negative regulation of cysteine-type endopeptidase activity involved in apoptotic signaling pathway |
| GO:0098602 | 0.0049 | 1.7775 | 16.5861 | 28 | 743 | single organism cell adhesion |
| GO:0038095 | 0.005 | 2.3153 | 6.3621 | 14 | 285 | Fc-epsilon receptor signaling pathway |
| GO:0071702 | 0.005 | 1.4347 | 55.54 | 74 | 2488 | organic substance transport |
| GO:0035295 | 0.0051 | 1.8589 | 13.5725 | 24 | 608 | tube development |
| GO:1901575 | 0.0052 | 1.5049 | 38.9539 | 55 | 1745 | organic substance catabolic process |
| GO:0042592 | 0.0053 | 1.5373 | 33.8642 | 49 | 1517 | homeostatic process |
| GO:0007093 | 0.0053 | 2.7537 | 3.8396 | 10 | 172 | mitotic cell cycle checkpoint |
| GO:0010647 | 0.0054 | 1.53 | 34.7348 | 50 | 1556 | positive regulation of cell communication |
| GO:0006511 | 0.0054 | 1.9027 | 12.1438 | 22 | 544 | ubiquitin-dependent protein catabolic process |
| GO:0048518 | 0.0056 | 1.335 | 117.1295 | 140 | 5247 | positive regulation of biological process |
| GO:0043067 | 0.0057 | 1.5507 | 31.4533 | 46 | 1409 | regulation of programmed cell death |
| GO:0072088 | 0.0057 | 3.9732 | 1.6296 | 6 | 73 | nephron epithelium morphogenesis |
| GO:0043066 | 0.0058 | 1.7186 | 18.3719 | 30 | 823 | negative regulation of apoptotic process |
| GO:0090183 | 0.0059 | 4.7124 | 1.1608 | 5 | 52 | regulation of kidney development |
| GO:0072074 | 0.0059 | 9.4577 | 0.3795 | 3 | 17 | kidney mesenchyme development |
| GO:0006694 | 0.0063 | 2.8636 | 3.3261 | 9 | 149 | steroid biosynthetic process |
| GO:0002376 | 0.0063 | 1.4187 | 56.0534 | 74 | 2511 | immune system process |
| GO:2000027 | 0.0065 | 2.6704 | 3.9512 | 10 | 177 | regulation of organ morphogenesis |
| GO:0006606 | 0.0065 | 2.3174 | 5.8933 | 13 | 264 | protein import into nucleus |
| GO:0009395 | 0.0067 | 5.8957 | 0.759 | 4 | 34 | phospholipid catabolic process |
| GO:0016358 | 0.0067 | 2.6543 | 3.9735 | 10 | 178 | dendrite development |
| GO:0046822 | 0.0069 | 2.5054 | 4.6209 | 11 | 207 | regulation of nucleocytoplasmic transport |
| GO:0070848 | 0.0069 | 1.6645 | 20.2248 | 32 | 906 | response to growth factor |
| GO:0038034 | 0.007 | 3.8022 | 1.6966 | 6 | 76 | signal transduction in absence of ligand |
| GO:0018401 | 0.007 | 22.0187 | 0.1339 | 2 | 6 | peptidyl-proline hydroxylation to 4-hydroxy-L-proline |
| GO:0097527 | 0.007 | 22.0187 | 0.1339 | 2 | 6 | necroptotic signaling pathway |
| GO:0044773 | 0.0071 | 3.3435 | 2.2323 | 7 | 100 | mitotic DNA damage checkpoint |
| GO:0033157 | 0.0073 | 2.0807 | 8.0587 | 16 | 361 | regulation of intracellular protein transport |
| GO:0051170 | 0.0074 | 2.2805 | 5.9826 | 13 | 268 | nuclear import |
| GO:0043632 | 0.0074 | 1.8477 | 12.4786 | 22 | 559 | modification-dependent macromolecule catabolic process |
| GO:0007289 | 0.0082 | 8.2744 | 0.4241 | 3 | 19 | spermatid nucleus differentiation |
| GO:0034612 | 0.0083 | 2.2446 | 6.0719 | 13 | 272 | response to tumor necrosis factor |
| GO:0072006 | 0.0084 | 2.9401 | 2.8797 | 8 | 129 | nephron development |
| GO:0007159 | 0.0087 | 1.9112 | 10.4026 | 19 | 466 | leukocyte cell-cell adhesion |
| GO:0007166 | 0.0088 | 1.5201 | 31.4615 | 45 | 1479 | cell surface receptor signaling pathway |
| GO:0032885 | 0.009 | 5.3586 | 0.826 | 4 | 37 | regulation of polysaccharide biosynthetic process |
| GO:0008543 | 0.0091 | 2.1458 | 6.8309 | 14 | 306 | fibroblast growth factor receptor signaling pathway |
| GO:1903828 | 0.0092 | 2.8919 | 2.9243 | 8 | 131 | negative regulation of cellular protein localization |
| GO:0002719 | 0.0095 | 7.7871 | 0.4465 | 3 | 20 | negative regulation of cytokine production involved in immune response |
| GO:0051179 | 0.0097 | 1.3052 | 119.786 | 141 | 5366 | localization |
| GO:0006927 | 0.0097 | 17.6138 | 0.1563 | 2 | 7 | transformed cell apoptotic process |
| GO:0007406 | 0.0097 | 17.6138 | 0.1563 | 2 | 7 | negative regulation of neuroblast proliferation |
| GO:0051823 | 0.0097 | 17.6138 | 0.1563 | 2 | 7 | regulation of synapse structural plasticity |
| GO:0070508 | 0.0097 | 17.6138 | 0.1563 | 2 | 7 | cholesterol import |
| GO:2001012 | 0.0097 | 17.6138 | 0.1563 | 2 | 7 | mesenchymal cell differentiation involved in renal system development |
| GOMFID | Pvalue | OddsRatio | ExpCount | Count | Size | Term |
| GO:0007190 | 4e-04 | 9.2261 | 0.6386 | 5 | 32 | activation of adenylate cyclase activity |
| GO:0046709 | 4e-04 | Inf | 0.0399 | 2 | 2 | IDP catabolic process |
| GO:0032508 | 6e-04 | 6.3725 | 1.0577 | 6 | 53 | DNA duplex unwinding |
| GO:0001921 | 9e-04 | 21.2413 | 0.1996 | 3 | 10 | positive regulation of receptor recycling |
| GO:0001922 | 0.0012 | 98.8452 | 0.0599 | 2 | 3 | B-1 B cell homeostasis |
| GO:0010636 | 0.0012 | 98.8452 | 0.0599 | 2 | 3 | positive regulation of mitochondrial fusion |
| GO:0072666 | 0.0014 | 9.4626 | 0.4989 | 4 | 25 | establishment of protein localization to vacuole |
| GO:0032259 | 0.0015 | 2.4865 | 6.8251 | 16 | 342 | methylation |
| GO:0005975 | 0.0016 | 1.8409 | 19.1183 | 33 | 958 | carbohydrate metabolic process |
| GO:0070126 | 0.0016 | 4.4283 | 1.7163 | 7 | 86 | mitochondrial translational termination |
| GO:0032984 | 0.0017 | 2.5376 | 6.2663 | 15 | 314 | macromolecular complex disassembly |
| GO:1901137 | 0.0017 | 1.8838 | 16.9431 | 30 | 849 | carbohydrate derivative biosynthetic process |
| GO:0016051 | 0.0017 | 3.04 | 3.8516 | 11 | 193 | carbohydrate biosynthetic process |
| GO:0044249 | 0.0019 | 1.4087 | 114.7699 | 140 | 5751 | cellular biosynthetic process |
| GO:0009137 | 0.0023 | 49.4194 | 0.0798 | 2 | 4 | purine nucleoside diphosphate catabolic process |
| GO:0016080 | 0.0023 | 49.4194 | 0.0798 | 2 | 4 | synaptic vesicle targeting |
| GO:0008152 | 0.0023 | 1.4886 | 209.0505 | 231 | 10800 | metabolic process |
| GO:0006414 | 0.0025 | 2.8951 | 4.0312 | 11 | 202 | translational elongation |
| GO:0048199 | 0.0031 | 4.5324 | 1.4369 | 6 | 72 | vesicle targeting, to, from or within Golgi |
| GO:0090329 | 0.0032 | 7.3569 | 0.6187 | 4 | 31 | regulation of DNA-dependent DNA replication |
| GO:0043624 | 0.0033 | 2.5286 | 5.4282 | 13 | 272 | cellular protein complex disassembly |
| GO:0008156 | 0.0034 | 5.4086 | 1.0178 | 5 | 51 | negative regulation of DNA replication |
| GO:0051650 | 0.0035 | 2.7632 | 4.2108 | 11 | 211 | establishment of vesicle localization |
| GO:0018279 | 0.0036 | 2.6132 | 4.8494 | 12 | 243 | protein N-linked glycosylation via asparagine |
| GO:0006486 | 0.0036 | 2.1948 | 8.1622 | 17 | 409 | protein glycosylation |
| GO:0019896 | 0.0038 | 32.9441 | 0.0998 | 2 | 5 | axon transport of mitochondrion |
| GO:2000535 | 0.0038 | 32.9441 | 0.0998 | 2 | 5 | regulation of entry of bacterium into host cell |
| GO:0070085 | 0.004 | 2.1721 | 8.242 | 17 | 413 | glycosylation |
| GO:1902582 | 0.0043 | 1.5681 | 32.7287 | 48 | 1640 | single-organism intracellular transport |
| GO:0005977 | 0.0044 | 4.2118 | 1.5367 | 6 | 77 | glycogen metabolic process |
| GO:0031281 | 0.0044 | 5.0764 | 1.0777 | 5 | 54 | positive regulation of cyclase activity |
| GO:0051349 | 0.0044 | 5.0764 | 1.0777 | 5 | 54 | positive regulation of lyase activity |
| GO:0044042 | 0.0046 | 4.1531 | 1.5566 | 6 | 78 | glucan metabolic process |
| GO:0060113 | 0.0055 | 4.7826 | 1.1375 | 5 | 57 | inner ear receptor cell differentiation |
| GO:0031952 | 0.0055 | 6.2054 | 0.7184 | 4 | 36 | regulation of protein autophosphorylation |
| GO:0001842 | 0.0056 | 24.7065 | 0.1197 | 2 | 6 | neural fold formation |
| GO:0009052 | 0.0056 | 24.7065 | 0.1197 | 2 | 6 | pentose-phosphate shunt, non-oxidative branch |
| GO:0009191 | 0.0056 | 24.7065 | 0.1197 | 2 | 6 | ribonucleoside diphosphate catabolic process |
| GO:0009987 | 0.0057 | 1.875 | 283.542 | 296 | 14208 | cellular process |
| GO:0045824 | 0.0061 | 6.0169 | 0.7384 | 4 | 37 | negative regulation of innate immune response |
| GO:0034641 | 0.0061 | 1.3435 | 121.9742 | 144 | 6112 | cellular nitrogen compound metabolic process |
| GO:0001887 | 0.0065 | 3.3912 | 2.1952 | 7 | 110 | selenium compound metabolic process |
| GO:0007018 | 0.007 | 2.6372 | 3.9913 | 10 | 200 | microtubule-based movement |
| GO:0072593 | 0.007 | 2.4971 | 4.6299 | 11 | 232 | reactive oxygen species metabolic process |
| GO:0033554 | 0.0076 | 1.4912 | 37.1989 | 52 | 1864 | cellular response to stress |
| GO:0015871 | 0.0078 | 19.7639 | 0.1397 | 2 | 7 | choline transport |
| GO:0034656 | 0.0078 | 19.7639 | 0.1397 | 2 | 7 | nucleobase-containing small molecule catabolic process |
| GO:0043112 | 0.0083 | 2.9385 | 2.8737 | 8 | 144 | receptor metabolic process |
| GO:0033692 | 0.0084 | 4.2862 | 1.2573 | 5 | 63 | cellular polysaccharide biosynthetic process |
| GO:0032088 | 0.0089 | 4.2133 | 1.2772 | 5 | 64 | negative regulation of NF-kappaB transcription factor activity |
| GO:0045761 | 0.0089 | 4.2133 | 1.2772 | 5 | 64 | regulation of adenylate cyclase activity |
| GO:0060122 | 0.0092 | 7.8196 | 0.439 | 3 | 22 | inner ear receptor stereocilium organization |
| GO:0071216 | 0.0092 | 2.6793 | 3.5323 | 9 | 177 | cellular response to biotic stimulus |
| GO:0000724 | 0.0094 | 2.8745 | 2.9336 | 8 | 147 | double-strand break repair via homologous recombination |
| GO:0044711 | 0.0094 | 1.5334 | 29.0454 | 42 | 1490 | single-organism biosynthetic process |
| GO:0009100 | 0.0095 | 1.8949 | 10.4971 | 19 | 526 | glycoprotein metabolic process |
| GO:1903146 | 0.0096 | 5.2235 | 0.8382 | 4 | 42 | regulation of mitophagy |
| GO:0043170 | 0.0097 | 1.322 | 171.2667 | 192 | 8582 | macromolecule metabolic process |
| GO:0006979 | 0.0098 | 2.0638 | 7.6034 | 15 | 381 | response to oxidative stress |
| GOMFID | Pvalue | OddsRatio | ExpCount | Count | Size | Term |
| GO:0045454 | 2e-04 | 5.5945 | 1.5817 | 8 | 88 | cell redox homeostasis |
| GO:0048535 | 3e-04 | 15.8216 | 0.3235 | 4 | 18 | lymph node development |
| GO:0042113 | 4e-04 | 3.4497 | 3.7385 | 12 | 208 | B cell activation |
| GO:0034612 | 4e-04 | 3.0678 | 4.8888 | 14 | 272 | response to tumor necrosis factor |
| GO:0010529 | 4e-04 | 27.6025 | 0.1618 | 3 | 9 | negative regulation of transposition |
| GO:0097300 | 8e-04 | 7.7078 | 0.7369 | 5 | 41 | programmed necrotic cell death |
| GO:0048245 | 9e-04 | 20.6992 | 0.1977 | 3 | 11 | eosinophil chemotaxis |
| GO:0002366 | 0.001 | 3.2513 | 3.6127 | 11 | 201 | leukocyte activation involved in immune response |
| GO:0002244 | 0.0012 | 3.7022 | 2.6062 | 9 | 145 | hematopoietic progenitor cell differentiation |
| GO:0002323 | 0.0015 | 9.2232 | 0.5033 | 4 | 28 | natural killer cell activation involved in immune response |
| GO:0010939 | 0.0025 | 7.9036 | 0.5752 | 4 | 32 | regulation of necrotic cell death |
| GO:0033209 | 0.0026 | 3.309 | 2.8938 | 9 | 161 | tumor necrosis factor-mediated signaling pathway |
| GO:0010942 | 0.0028 | 2.0609 | 10.7842 | 21 | 600 | positive regulation of cell death |
| GO:0070098 | 0.003 | 4.5669 | 1.4199 | 6 | 79 | chemokine-mediated signaling pathway |
| GO:0035556 | 0.0031 | 1.5235 | 45.1318 | 63 | 2511 | intracellular signal transduction |
| GO:0050859 | 0.0031 | 36.6786 | 0.0899 | 2 | 5 | negative regulation of B cell receptor signaling pathway |
| GO:0072112 | 0.0032 | 11.8235 | 0.3056 | 3 | 17 | glomerular visceral epithelial cell differentiation |
| GO:1902041 | 0.0033 | 5.4355 | 1.0065 | 5 | 56 | regulation of extrinsic apoptotic signaling pathway via death domain receptors |
| GO:0071345 | 0.0033 | 1.9345 | 13.1387 | 24 | 731 | cellular response to cytokine stimulus |
| GO:0035850 | 0.0034 | 7.1373 | 0.6291 | 4 | 35 | epithelial cell differentiation involved in kidney development |
| GO:0065008 | 0.0036 | 1.4561 | 61.5058 | 81 | 3422 | regulation of biological quality |
| GO:0007166 | 0.0038 | 1.4953 | 48.1873 | 66 | 2681 | cell surface receptor signaling pathway |
| GO:0060759 | 0.0038 | 3.3791 | 2.5163 | 8 | 140 | regulation of response to cytokine stimulus |
| GO:0048518 | 0.0038 | 1.4006 | 94.3077 | 116 | 5247 | positive regulation of biological process |
| GO:0002286 | 0.004 | 4.2727 | 1.5098 | 6 | 84 | T cell activation involved in immune response |
| GO:0035304 | 0.0042 | 3.3282 | 2.5523 | 8 | 142 | regulation of protein dephosphorylation |
| GO:0006925 | 0.0045 | 10.3442 | 0.3415 | 3 | 19 | inflammatory cell apoptotic process |
| GO:0030593 | 0.0045 | 4.1654 | 1.5457 | 6 | 86 | neutrophil chemotaxis |
| GO:0001775 | 0.0046 | 1.7921 | 16.5537 | 28 | 921 | cell activation |
| GO:0006620 | 0.0046 | 27.5072 | 0.1078 | 2 | 6 | posttranslational protein targeting to membrane |
| GO:0016139 | 0.0046 | 27.5072 | 0.1078 | 2 | 6 | glycoside catabolic process |
| GO:0097527 | 0.0046 | 27.5072 | 0.1078 | 2 | 6 | necroptotic signaling pathway |
| GO:2000503 | 0.0046 | 27.5072 | 0.1078 | 2 | 6 | positive regulation of natural killer cell chemotaxis |
| GO:0030595 | 0.0048 | 2.9907 | 3.1813 | 9 | 177 | leukocyte chemotaxis |
| GO:0032402 | 0.0052 | 9.7351 | 0.3595 | 3 | 20 | melanosome transport |
| GO:0072010 | 0.0052 | 9.7351 | 0.3595 | 3 | 20 | glomerular epithelium development |
| GO:0097296 | 0.0052 | 9.7351 | 0.3595 | 3 | 20 | activation of cysteine-type endopeptidase activity involved in apoptotic signaling pathway |
| GO:1901623 | 0.0052 | 9.7351 | 0.3595 | 3 | 20 | regulation of lymphocyte chemotaxis |
| GO:0050854 | 0.0056 | 6.144 | 0.7189 | 4 | 40 | regulation of antigen receptor-mediated signaling pathway |
| GO:0060338 | 0.0056 | 6.144 | 0.7189 | 4 | 40 | regulation of type I interferon-mediated signaling pathway |
| GO:0050921 | 0.0057 | 3.4765 | 2.1389 | 7 | 119 | positive regulation of chemotaxis |
| GO:0051905 | 0.006 | 9.1936 | 0.3774 | 3 | 21 | establishment of pigment granule localization |
| GO:0046898 | 0.0064 | 22.0043 | 0.1258 | 2 | 7 | response to cycloheximide |
| GO:0007220 | 0.0069 | 8.7092 | 0.3954 | 3 | 22 | Notch receptor processing |
| GO:0044070 | 0.0074 | 3.2984 | 2.2467 | 7 | 125 | regulation of anion transport |
| GO:0010923 | 0.0075 | 4.3967 | 1.2222 | 5 | 68 | negative regulation of phosphatase activity |
| GO:0070227 | 0.0075 | 4.3967 | 1.2222 | 5 | 68 | lymphocyte apoptotic process |
| GO:0030098 | 0.0082 | 2.3335 | 5.3921 | 12 | 300 | lymphocyte differentiation |
| GO:0035970 | 0.0084 | 18.3357 | 0.1438 | 2 | 8 | peptidyl-threonine dephosphorylation |
| GO:0060371 | 0.0084 | 18.3357 | 0.1438 | 2 | 8 | regulation of atrial cardiac muscle cell membrane depolarization |
| GO:0051179 | 0.0084 | 1.3529 | 96.4466 | 116 | 5366 | localization |
| GO:0048878 | 0.0097 | 1.6836 | 17.5243 | 28 | 975 | chemical homeostasis |
| GOMFID | Pvalue | OddsRatio | ExpCount | Count | Size | Term |
| GO:0010529 | 2e-04 | 38.3682 | 0.1174 | 3 | 9 | negative regulation of transposition |
| GO:0048245 | 3e-04 | 28.7724 | 0.1435 | 3 | 11 | eosinophil chemotaxis |
| GO:0070098 | 6e-04 | 6.3748 | 1.0308 | 6 | 79 | chemokine-mediated signaling pathway |
| GO:0030593 | 9e-04 | 5.8144 | 1.1222 | 6 | 86 | neutrophil chemotaxis |
| GO:0010936 | 0.0017 | 50.9142 | 0.0652 | 2 | 5 | negative regulation of macrophage cytokine production |
| GO:0035609 | 0.0017 | 50.9142 | 0.0652 | 2 | 5 | C-terminal protein deglutamylation |
| GO:0042908 | 0.0017 | 50.9142 | 0.0652 | 2 | 5 | xenobiotic transport |
| GO:0070723 | 0.0024 | 12.7794 | 0.274 | 3 | 21 | response to cholesterol |
| GO:2000503 | 0.0025 | 38.1832 | 0.0783 | 2 | 6 | positive regulation of natural killer cell chemotaxis |
| GO:0097530 | 0.0032 | 4.4656 | 1.4353 | 6 | 110 | granulocyte migration |
| GO:0046209 | 0.0035 | 5.2857 | 1.0178 | 5 | 78 | nitric oxide metabolic process |
| GO:0048246 | 0.0046 | 9.9981 | 0.3393 | 3 | 26 | macrophage chemotaxis |
| GO:0002507 | 0.0051 | 9.5808 | 0.3523 | 3 | 27 | tolerance induction |
| GO:0042113 | 0.006 | 3.1082 | 2.7141 | 8 | 208 | B cell activation |
| GO:0016339 | 0.0062 | 8.8427 | 0.3784 | 3 | 29 | calcium-dependent cell-cell adhesion via plasma membrane cell adhesion molecules |
| GO:0006527 | 0.0071 | 19.0866 | 0.1305 | 2 | 10 | arginine catabolic process |
| GO:0042775 | 0.0078 | 5.4907 | 0.7829 | 4 | 60 | mitochondrial ATP synthesis coupled electron transport |
| GO:0032965 | 0.0082 | 7.9264 | 0.4176 | 3 | 32 | regulation of collagen biosynthetic process |
| GO:0070232 | 0.0097 | 7.4141 | 0.4436 | 3 | 34 | regulation of T cell apoptotic process |
| GOMFID | Pvalue | OddsRatio | ExpCount | Count | Size | Term |
| GO:0000281 | 3e-04 | 14.5739 | 0.3205 | 4 | 30 | mitotic cytokinesis |
| GO:0034067 | 0.0043 | 10.0865 | 0.3311 | 3 | 31 | protein localization to Golgi apparatus |
| GO:0008272 | 0.0095 | 15.6111 | 0.1495 | 2 | 14 | sulfate transport |
| GO:0032506 | 0.0095 | 15.6111 | 0.1495 | 2 | 14 | cytokinetic process |
| GOMFID | Pvalue | OddsRatio | ExpCount | Count | Size | Term |
| GO:1901687 | 1e-04 | 12.2335 | 0.4912 | 5 | 30 | glutathione derivative biosynthetic process |
| GO:0070433 | 8e-04 | 121.0787 | 0.0491 | 2 | 3 | negative regulation of nucleotide-binding oligomerization domain containing 2 signaling pathway |
| GO:1901224 | 0.0011 | 10.1548 | 0.4585 | 4 | 28 | positive regulation of NIK/NF-kappaB signaling |
| GO:0006750 | 0.0021 | 14.0149 | 0.262 | 3 | 16 | glutathione biosynthetic process |
| GO:0042246 | 0.0026 | 5.76 | 0.9497 | 5 | 58 | tissue regeneration |
| GO:0002724 | 0.003 | 12.1447 | 0.2947 | 3 | 18 | regulation of T cell cytokine production |
| GO:0010761 | 0.003 | 7.381 | 0.6059 | 4 | 37 | fibroblast migration |
| GO:0006868 | 0.0038 | 30.2638 | 0.0982 | 2 | 6 | glutamine transport |
| GO:0051000 | 0.004 | 10.7145 | 0.3275 | 3 | 20 | positive regulation of nitric-oxide synthase activity |
| GO:0051310 | 0.0048 | 6.4077 | 0.6877 | 4 | 42 | metaphase plate congression |
| GO:0022616 | 0.0053 | 6.243 | 0.7041 | 4 | 43 | DNA strand elongation |
| GO:0042592 | 0.0053 | 1.6381 | 24.8402 | 38 | 1517 | homeostatic process |
| GO:0034394 | 0.0062 | 5.9377 | 0.7369 | 4 | 45 | protein localization to cell surface |
| GO:0090278 | 0.0067 | 5.7959 | 0.7532 | 4 | 46 | negative regulation of peptide hormone secretion |
| GO:0046755 | 0.0068 | 8.6714 | 0.393 | 3 | 24 | viral budding |
| GO:1902590 | 0.0068 | 8.6714 | 0.393 | 3 | 24 | multi-organism organelle organization |
| GO:0032092 | 0.0069 | 4.485 | 1.1953 | 5 | 73 | positive regulation of protein binding |
| GO:0043653 | 0.007 | 20.1732 | 0.131 | 2 | 8 | mitochondrial fragmentation involved in apoptotic process |
| GO:1901841 | 0.007 | 20.1732 | 0.131 | 2 | 8 | regulation of high voltage-gated calcium channel activity |
| GO:0046849 | 0.0081 | 4.2947 | 1.2445 | 5 | 76 | bone remodeling |
| GO:0033629 | 0.0089 | 17.2902 | 0.1474 | 2 | 9 | negative regulation of cell adhesion mediated by integrin |
| GO:0034139 | 0.0089 | 17.2902 | 0.1474 | 2 | 9 | regulation of toll-like receptor 3 signaling pathway |
| GO:0048311 | 0.0089 | 17.2902 | 0.1474 | 2 | 9 | mitochondrion distribution |
| GO:0061042 | 0.0089 | 17.2902 | 0.1474 | 2 | 9 | vascular wound healing |
| GO:0070424 | 0.0089 | 17.2902 | 0.1474 | 2 | 9 | regulation of nucleotide-binding oligomerization domain containing signaling pathway |
| GO:0002507 | 0.0095 | 7.586 | 0.4421 | 3 | 27 | tolerance induction |
| GO:0044803 | 0.0095 | 7.586 | 0.4421 | 3 | 27 | multi-organism membrane organization |
| GO:0002753 | 0.0096 | 5.1776 | 0.8351 | 4 | 51 | cytoplasmic pattern recognition receptor signaling pathway |
| GOMFID | Pvalue | OddsRatio | ExpCount | Count | Size | Term |
| GO:0030345 | 8e-04 | 123.8876 | 0.048 | 2 | 3 | structural constituent of tooth enamel |
| GO:0004842 | 0.0028 | 2.4861 | 5.9564 | 14 | 372 | ubiquitin-protein transferase activity |
| GO:0016740 | 0.0038 | 1.5844 | 33.5766 | 49 | 2097 | transferase activity |
| GO:0048037 | 0.0075 | 2.6033 | 4.035 | 10 | 252 | cofactor binding |
| GOMFID | Pvalue | OddsRatio | ExpCount | Count | Size | Term |
| GO:0042288 | 1e-04 | 21.1196 | 0.2446 | 4 | 18 | MHC class I protein binding |
| GO:0005134 | 0.0018 | 48.8468 | 0.0679 | 2 | 5 | interleukin-2 receptor binding |
| GO:0050544 | 0.0018 | 48.8468 | 0.0679 | 2 | 5 | arachidonic acid binding |
| GO:0033218 | 0.0026 | 3.0598 | 3.4649 | 10 | 255 | amide binding |
| GO:0097493 | 0.0027 | 36.6327 | 0.0815 | 2 | 6 | structural molecule activity conferring elasticity |
| GO:1901567 | 0.0027 | 36.6327 | 0.0815 | 2 | 6 | fatty acid derivative binding |
| GO:0042287 | 0.006 | 21.314 | 0.1201 | 2 | 9 | MHC protein binding |
| GO:0033293 | 0.0066 | 5.7837 | 0.7473 | 4 | 55 | monocarboxylic acid binding |
| GOMFID | Pvalue | OddsRatio | ExpCount | Count | Size | Term |
| GO:0004066 | 3e-04 | Inf | 0.0334 | 2 | 2 | asparagine synthase (glutamine-hydrolyzing) activity |
| GO:0008409 | 9e-04 | 19.8263 | 0.2006 | 3 | 12 | 5'-3' exonuclease activity |
| GO:0000287 | 0.0013 | 3.3966 | 3.1421 | 10 | 188 | magnesium ion binding |
| GO:0042802 | 0.0032 | 1.7757 | 19.2539 | 32 | 1152 | identical protein binding |
| GO:0004518 | 0.0037 | 3.1157 | 3.0586 | 9 | 183 | nuclease activity |
| GO:0004520 | 0.0039 | 6.8638 | 0.6471 | 4 | 39 | endodeoxyribonuclease activity |
| GO:0048256 | 0.004 | 29.6346 | 0.1003 | 2 | 6 | flap endonuclease activity |
| GO:0000405 | 0.0055 | 23.7062 | 0.117 | 2 | 7 | bubble DNA binding |
| GO:0004709 | 0.0072 | 8.4903 | 0.4011 | 3 | 24 | MAP kinase kinase kinase activity |
| GO:0030368 | 0.0073 | 19.7538 | 0.1337 | 2 | 8 | interleukin-17 receptor activity |
| GO:0016879 | 0.0083 | 5.4158 | 0.8022 | 4 | 48 | ligase activity, forming carbon-nitrogen bonds |
| GOMFID | Pvalue | OddsRatio | ExpCount | Count | Size | Term |
| GO:0004591 | 0.0013 | 65.9744 | 0.0602 | 2 | 4 | oxoglutarate dehydrogenase (succinyl-transferring) activity |
| GO:0070717 | 0.0016 | 15.2793 | 0.2409 | 3 | 16 | poly-purine tract binding |
| GO:0005112 | 0.0027 | 12.412 | 0.286 | 3 | 19 | Notch binding |
| GO:0035612 | 0.0033 | 32.9829 | 0.0903 | 2 | 6 | AP-2 adaptor complex binding |
| GO:0050656 | 0.0033 | 32.9829 | 0.0903 | 2 | 6 | 3'-phosphoadenosine 5'-phosphosulfate binding |
| GO:0003857 | 0.0045 | 26.3846 | 0.1054 | 2 | 7 | 3-hydroxyacyl-CoA dehydrogenase activity |
| GO:0016836 | 0.0058 | 6.0329 | 0.7226 | 4 | 48 | hydro-lyase activity |
| GO:0030246 | 0.0079 | 2.5834 | 4.0648 | 10 | 270 | carbohydrate binding |
| GOMFID | Pvalue | OddsRatio | ExpCount | Count | Size | Term |
| GO:0019899 | 0.0016 | 1.6008 | 36.9078 | 55 | 1639 | enzyme binding |
| GO:0016209 | 0.0029 | 4.631 | 1.4187 | 6 | 63 | antioxidant activity |
| GO:0044183 | 0.0034 | 11.9314 | 0.3153 | 3 | 14 | protein binding involved in protein folding |
| GO:0019871 | 0.0048 | 29.0978 | 0.1126 | 2 | 5 | sodium channel inhibitor activity |
| GO:0031698 | 0.0048 | 29.0978 | 0.1126 | 2 | 5 | beta-2 adrenergic receptor binding |
| GO:0032405 | 0.0048 | 29.0978 | 0.1126 | 2 | 5 | MutLalpha complex binding |
| GO:0003777 | 0.0064 | 3.879 | 1.6664 | 6 | 74 | microtubule motor activity |
| GO:0042802 | 0.007 | 1.5857 | 25.9413 | 39 | 1152 | identical protein binding |
| GO:0019787 | 0.0071 | 2.0391 | 8.7372 | 17 | 388 | ubiquitin-like protein transferase activity |
| GO:0005246 | 0.0084 | 5.4767 | 0.8107 | 4 | 36 | calcium channel regulator activity |
| GO:0043167 | 0.0088 | 1.3045 | 129.0986 | 151 | 5733 | ion binding |
| GO:0008157 | 0.0097 | 7.7173 | 0.4504 | 3 | 20 | protein phosphatase 1 binding |
| GO:0031418 | 0.0097 | 7.7173 | 0.4504 | 3 | 20 | L-ascorbic acid binding |
| GO:0019237 | 0.0099 | 17.4564 | 0.1576 | 2 | 7 | centromeric DNA binding |
| GO:0034190 | 0.0099 | 17.4564 | 0.1576 | 2 | 7 | apolipoprotein receptor binding |
| GO:0070097 | 0.0099 | 17.4564 | 0.1576 | 2 | 7 | delta-catenin binding |
| GOMFID | Pvalue | OddsRatio | ExpCount | Count | Size | Term |
| GO:0032394 | 1e-04 | Inf | 0.0237 | 2 | 2 | MHC class Ib receptor activity |
| GO:0030620 | 0.002 | 42.0815 | 0.0712 | 2 | 6 | U2 snRNA binding |
| GO:0030515 | 0.0028 | 12.0757 | 0.2848 | 3 | 24 | snoRNA binding |
| GO:0008035 | 0.0037 | 28.0507 | 0.0949 | 2 | 8 | high-density lipoprotein particle binding |
| GO:0022857 | 0.0058 | 1.9741 | 10.8093 | 20 | 911 | transmembrane transporter activity |
| GO:0008331 | 0.0059 | 21.0353 | 0.1187 | 2 | 10 | high voltage-gated calcium channel activity |
| GO:0042803 | 0.0074 | 2.0916 | 8.104 | 16 | 683 | protein homodimerization activity |
| GO:0015075 | 0.0099 | 1.977 | 9.1007 | 17 | 767 | ion transmembrane transporter activity |
| GOMFID | Pvalue | OddsRatio | ExpCount | Count | Size | Term |
| GO:0032394 | 2e-04 | Inf | 0.029 | 2 | 2 | MHC class Ib receptor activity |
| GO:0008502 | 6e-04 | 137.3156 | 0.0434 | 2 | 3 | melatonin receptor activity |
| GO:0016874 | 0.0013 | 2.7087 | 5.5027 | 14 | 380 | ligase activity |
| GO:0042288 | 0.0021 | 13.7804 | 0.2607 | 3 | 18 | MHC class I protein binding |
| GO:0097493 | 0.003 | 34.3222 | 0.0869 | 2 | 6 | structural molecule activity conferring elasticity |
| GO:0001223 | 0.0055 | 22.8785 | 0.1158 | 2 | 8 | transcription coactivator binding |
| GO:0008035 | 0.0055 | 22.8785 | 0.1158 | 2 | 8 | high-density lipoprotein particle binding |
| GO:0036094 | 0.0075 | 1.5216 | 35.7529 | 50 | 2469 | small molecule binding |
| GO:0043168 | 0.0092 | 1.5024 | 36.1294 | 50 | 2495 | anion binding |
| GO:0030554 | 0.0093 | 1.6416 | 20.7943 | 32 | 1436 | adenyl nucleotide binding |
| GOMFID | Pvalue | OddsRatio | ExpCount | Count | Size | Term |
| GO:0000033 | 0.0012 | 99.4434 | 0.0595 | 2 | 3 | alpha-1,3-mannosyltransferase activity |
| GO:0003953 | 0.0012 | 99.4434 | 0.0595 | 2 | 3 | NAD+ nucleosidase activity |
| GO:0004748 | 0.0012 | 99.4434 | 0.0595 | 2 | 3 | ribonucleoside-diphosphate reductase activity, thioredoxin disulfide as acceptor |
| GO:0016427 | 0.0012 | 99.4434 | 0.0595 | 2 | 3 | tRNA (cytosine) methyltransferase activity |
| GO:0016728 | 0.0012 | 99.4434 | 0.0595 | 2 | 3 | oxidoreductase activity, acting on CH or CH2 groups, disulfide as acceptor |
| GO:0035650 | 0.0012 | 99.4434 | 0.0595 | 2 | 3 | AP-1 adaptor complex binding |
| GO:0003824 | 0.0014 | 1.4296 | 104.5131 | 130 | 5268 | catalytic activity |
| GO:0003678 | 0.0023 | 5.9613 | 0.9324 | 5 | 47 | DNA helicase activity |
| GO:0016836 | 0.0025 | 5.8223 | 0.9523 | 5 | 48 | hydro-lyase activity |
| GO:0015036 | 0.0028 | 7.6868 | 0.5952 | 4 | 30 | disulfide oxidoreductase activity |
| GO:0016741 | 0.0035 | 2.7662 | 4.2059 | 11 | 212 | transferase activity, transferring one-carbon groups |
| GO:0016462 | 0.0038 | 1.8583 | 14.7802 | 26 | 745 | pyrophosphatase activity |
| GO:0016817 | 0.0041 | 1.8475 | 14.8596 | 26 | 749 | hydrolase activity, acting on acid anhydrides |
| GO:1990247 | 0.0077 | 19.8835 | 0.1389 | 2 | 7 | N6-methyladenosine-containing RNA binding |
| GO:0008173 | 0.0094 | 5.2553 | 0.8332 | 4 | 42 | RNA methyltransferase activity |
| GOMFID | Pvalue | OddsRatio | ExpCount | Count | Size | Term |
| GO:0050544 | 0.0011 | 61.8922 | 0.0539 | 2 | 5 | arachidonic acid binding |
| GO:1901567 | 0.0017 | 46.4162 | 0.0647 | 2 | 6 | fatty acid derivative binding |
| GO:0008035 | 0.0031 | 30.9401 | 0.0862 | 2 | 8 | high-density lipoprotein particle binding |
| GO:0030544 | 0.0037 | 10.7607 | 0.3126 | 3 | 29 | Hsp70 protein binding |
| GO:0031492 | 0.0037 | 10.7607 | 0.3126 | 3 | 29 | nucleosomal DNA binding |
| GO:0047485 | 0.0043 | 4.999 | 1.0673 | 5 | 99 | protein N-terminus binding |
| GO:0005391 | 0.0049 | 23.2021 | 0.1078 | 2 | 10 | sodium:potassium-exchanging ATPase activity |
| GO:0000980 | 0.0053 | 6.1385 | 0.7008 | 4 | 65 | RNA polymerase II distal enhancer sequence-specific DNA binding |
| GO:0051787 | 0.0071 | 18.5593 | 0.1294 | 2 | 12 | misfolded protein binding |
| GO:1990381 | 0.0071 | 18.5593 | 0.1294 | 2 | 12 | ubiquitin-specific protease binding |
| GO:0032182 | 0.0073 | 4.388 | 1.2075 | 5 | 112 | ubiquitin-like protein binding |
| GO:0043566 | 0.0078 | 4.3069 | 1.229 | 5 | 114 | structure-specific DNA binding |
| GO:0036041 | 0.0083 | 16.871 | 0.1402 | 2 | 13 | long-chain fatty acid binding |
| GOMFID | Pvalue | OddsRatio | ExpCount | Count | Size | Term |
| GO:0031720 | 3e-04 | Inf | 0.0366 | 2 | 2 | haptoglobin binding |
| GO:0015035 | 6e-04 | 12.0699 | 0.4028 | 4 | 22 | protein disulfide oxidoreductase activity |
| GO:0016667 | 0.002 | 6.1835 | 0.8971 | 5 | 49 | oxidoreductase activity, acting on a sulfur group of donors |
| GO:0015038 | 0.0032 | 35.9906 | 0.0915 | 2 | 5 | glutathione disulfide oxidoreductase activity |
| GO:0031726 | 0.0048 | 26.9912 | 0.1098 | 2 | 6 | CCR1 chemokine receptor binding |
| GO:0016209 | 0.0059 | 4.6867 | 1.1534 | 5 | 63 | antioxidant activity |
| GO:0016494 | 0.0066 | 21.5916 | 0.1282 | 2 | 7 | C-X-C chemokine receptor activity |
| GO:0003756 | 0.0072 | 8.5452 | 0.4028 | 3 | 22 | protein disulfide isomerase activity |
| GO:0005031 | 0.0082 | 8.1174 | 0.4211 | 3 | 23 | tumor necrosis factor-activated receptor activity |
| GOMFID | Pvalue | OddsRatio | ExpCount | Count | Size | Term |
| GO:0030362 | 2e-04 | Inf | 0.026 | 2 | 2 | protein phosphatase type 4 regulator activity |
| GO:0042910 | 0.001 | 76.5842 | 0.0521 | 2 | 4 | xenobiotic transporter activity |
| GO:0031726 | 0.0024 | 38.2871 | 0.0781 | 2 | 6 | CCR1 chemokine receptor binding |
| GO:0004181 | 0.0036 | 10.9815 | 0.3123 | 3 | 24 | metallocarboxypeptidase activity |
| GO:0004950 | 0.0036 | 10.9815 | 0.3123 | 3 | 24 | chemokine receptor activity |
| GO:0042379 | 0.0068 | 5.7104 | 0.7548 | 4 | 58 | chemokine receptor binding |
| GO:0005125 | 0.0068 | 3.0397 | 2.7719 | 8 | 213 | cytokine activity |
| GOMFID | Pvalue | OddsRatio | ExpCount | Count | Size | Term |
| GO:0008484 | 0.0056 | 21.2661 | 0.1151 | 2 | 11 | sulfuric ester hydrolase activity |
| GO:0016709 | 0.0073 | 8.2398 | 0.3976 | 3 | 38 | oxidoreductase activity, acting on paired donors, with incorporation or reduction of molecular oxygen, NAD(P)H as one donor, and incorporation of one atom of oxygen |
| GOMFID | Pvalue | OddsRatio | ExpCount | Count | Size | Term |
| GO:0046923 | 0.002 | 46.1824 | 0.0718 | 2 | 5 | ER retention sequence binding |
| GO:0050544 | 0.002 | 46.1824 | 0.0718 | 2 | 5 | arachidonic acid binding |
| GO:0050998 | 0.002 | 13.9063 | 0.2584 | 3 | 18 | nitric-oxide synthase binding |
| GO:1901567 | 0.003 | 34.6345 | 0.0861 | 2 | 6 | fatty acid derivative binding |
| GO:0042277 | 0.0064 | 2.8453 | 3.3299 | 9 | 232 | peptide binding |
| GO:0016874 | 0.0089 | 2.3091 | 5.4542 | 12 | 380 | ligase activity |
| GO:0043236 | 0.0098 | 7.4435 | 0.4449 | 3 | 31 | laminin binding |
| GOMFID | Pvalue | OddsRatio | ExpCount | Count | Size | Term |
| GO:0016748 | 3e-04 | Inf | 0.0344 | 2 | 2 | succinyltransferase activity |
| GO:0019784 | 0.0017 | 57.4776 | 0.0689 | 2 | 4 | NEDD8-specific protease activity |
| GO:0004904 | 0.0029 | 38.3159 | 0.0861 | 2 | 5 | interferon receptor activity |
| GO:0015186 | 0.0029 | 38.3159 | 0.0861 | 2 | 5 | L-glutamine transmembrane transporter activity |
| GO:0042015 | 0.0029 | 38.3159 | 0.0861 | 2 | 5 | interleukin-20 binding |
| GO:0003746 | 0.0034 | 11.5288 | 0.31 | 3 | 18 | translation elongation factor activity |
| GO:0000049 | 0.0068 | 5.7767 | 0.7578 | 4 | 44 | tRNA binding |
| GO:0004364 | 0.0078 | 8.2317 | 0.4134 | 3 | 24 | glutathione transferase activity |
| GO:0016879 | 0.0092 | 5.2502 | 0.8267 | 4 | 48 | ligase activity, forming carbon-nitrogen bonds |
| GO:0019901 | 0.0095 | 1.9746 | 9.0253 | 17 | 524 | protein kinase binding |
| GO:0004716 | 0.0098 | 16.4168 | 0.155 | 2 | 9 | receptor signaling protein tyrosine kinase activity |
| GOMFID | Pvalue | OddsRatio | ExpCount | Count | Size | Term |
| GO:0008296 | 0.004 | 29.6346 | 0.1003 | 2 | 6 | 3'-5'-exodeoxyribonuclease activity |
| GO:0003723 | 0.0055 | 1.6325 | 24.8863 | 38 | 1489 | RNA binding |
| GO:0004709 | 0.0072 | 8.4903 | 0.4011 | 3 | 24 | MAP kinase kinase kinase activity |
| GO:1901363 | 0.0094 | 1.3598 | 91.3223 | 110 | 5464 | heterocyclic compound binding |
| NA. |
| n/a |
| NA. |
| n/a |
| NA. |
| n/a |
| NA. |
| n/a |
| NA. |
| n/a |
| NA. |
| n/a |
| NA. |
| n/a |
| NA. |
| n/a |
| NA. |
| n/a |
| NA. |
| n/a |
| NA. |
| n/a |
| NA. |
| n/a |
| NA. |
| n/a |
| NA. |
| n/a |
| NA. |
| n/a |
| NA. |
| n/a |
| NA. |
| n/a |
| NA. |
| n/a |
| NA. |
| n/a |
| NA. |
| n/a |
| NA. |
| n/a |
| NA. |
| n/a |
| NA. |
| n/a |
| NA. |
| n/a |
| NA. |
| n/a |
| NA. |
| n/a |
| NA. |
| n/a |
| NA. |
| n/a |
| NA. |
| n/a |
| NA. |
| n/a |
| NA. |
| n/a |
| NA. |
| n/a |
| NA. |
| n/a |
| NA. |
| n/a |
| NA. |
| n/a |
| NA. |
| n/a |
| NA. |
| n/a |
| NA. |
| n/a |
| NA. |
| n/a |
| NA. |
| n/a |
| NA. |
| n/a |
| NA. |
| n/a |
| NA. |
| n/a |
| NA. |
| n/a |
| NA. |
| n/a |
| NA. |
| n/a |
| NA. |
| n/a |
| NA. |
| n/a |
| NA. |
| n/a |
| NA. |
| n/a |
| NA. |
| n/a |
| NA. |
| n/a |
| NA. |
| n/a |
| NA. |
| n/a |
| NA. |
| n/a |
| NA. |
| n/a |
| NA. |
| n/a |
| NA. |
| n/a |
| NA. |
| n/a |
| NA. |
| n/a |
| NA. |
| n/a |
| NA. |
| n/a |
| NA. |
| n/a |
| NA. |
| n/a |
| GOMFID | Pvalue | OddsRatio | ExpCount | Count | Size | Term |
| GO:0043603 | 0 | 1.8975 | 31.3022 | 55 | 914 | cellular amide metabolic process |
| GO:0044249 | 0 | 1.4297 | 197.368 | 242 | 5763 | cellular biosynthetic process |
| GO:0044710 | 1e-04 | 1.5257 | 88.2486 | 120 | 2747 | single-organism metabolic process |
| GO:0006732 | 4e-04 | 2.971 | 5.4795 | 15 | 162 | coenzyme metabolic process |
| GO:0006413 | 5e-04 | 2.4435 | 8.7673 | 20 | 256 | translational initiation |
| GO:0016259 | 6e-04 | 3.864 | 2.8768 | 10 | 84 | selenocysteine metabolic process |
| GO:1901564 | 6e-04 | 1.5409 | 54.3179 | 78 | 1621 | organonitrogen compound metabolic process |
| GO:0043407 | 7e-04 | 4.1462 | 2.4316 | 9 | 71 | negative regulation of MAP kinase activity |
| GO:0071877 | 7e-04 | 28.3521 | 0.2055 | 3 | 6 | regulation of adrenergic receptor signaling pathway |
| GO:0044281 | 8e-04 | 1.4264 | 87.1255 | 115 | 2544 | small molecule metabolic process |
| GO:0006415 | 9e-04 | 2.7429 | 5.8906 | 15 | 172 | translational termination |
| GO:0048286 | 0.001 | 4.9868 | 1.6096 | 7 | 47 | lung alveolus development |
| GO:0001812 | 0.0012 | Inf | 0.0685 | 2 | 2 | positive regulation of type I hypersensitivity |
| GO:0035498 | 0.0012 | Inf | 0.0685 | 2 | 2 | carnosine metabolic process |
| GO:0060373 | 0.0013 | 21.2626 | 0.2397 | 3 | 7 | regulation of ventricular cardiac muscle cell membrane depolarization |
| GO:0071850 | 0.0014 | 10.3237 | 0.5137 | 4 | 15 | mitotic cell cycle arrest |
| GO:0044238 | 0.0018 | 1.3237 | 309.1865 | 341 | 9227 | primary metabolic process |
| GO:0000184 | 0.0018 | 3.0536 | 3.9042 | 11 | 114 | nuclear-transcribed mRNA catabolic process, nonsense-mediated decay |
| GO:0043043 | 0.002 | 1.7538 | 21.6444 | 36 | 632 | peptide biosynthetic process |
| GO:0019362 | 0.0024 | 2.9387 | 4.0412 | 11 | 118 | pyridine nucleotide metabolic process |
| GO:0031398 | 0.0024 | 2.5388 | 5.8906 | 14 | 172 | positive regulation of protein ubiquitination |
| GO:0000122 | 0.0028 | 1.6786 | 24.4527 | 39 | 714 | negative regulation of transcription from RNA polymerase II promoter |
| GO:0016051 | 0.0028 | 2.4022 | 6.644 | 15 | 194 | carbohydrate biosynthetic process |
| GO:0001829 | 0.0028 | 8.1099 | 0.6165 | 4 | 18 | trophectodermal cell differentiation |
| GO:0046483 | 0.0029 | 1.2878 | 187.2651 | 218 | 5468 | heterocycle metabolic process |
| GO:0009059 | 0.0034 | 1.2886 | 167.607 | 197 | 4894 | macromolecule biosynthetic process |
| GO:0008292 | 0.0034 | 56.6056 | 0.1027 | 2 | 3 | acetylcholine biosynthetic process |
| GO:0043096 | 0.0034 | 56.6056 | 0.1027 | 2 | 3 | purine nucleobase salvage |
| GO:0090361 | 0.0034 | 56.6056 | 0.1027 | 2 | 3 | regulation of platelet-derived growth factor production |
| GO:0006725 | 0.0034 | 1.281 | 187.8815 | 218 | 5486 | cellular aromatic compound metabolic process |
| GO:0006414 | 0.0041 | 2.2982 | 6.918 | 15 | 202 | translational elongation |
| GO:0043241 | 0.0042 | 2.024 | 10.4112 | 20 | 304 | protein complex disassembly |
| GO:0009987 | 0.0047 | 1.5952 | 480.3142 | 497 | 14167 | cellular process |
| GO:1990748 | 0.0048 | 3.3038 | 2.6371 | 8 | 77 | cellular detoxification |
| GO:0009108 | 0.0048 | 2.6628 | 4.4179 | 11 | 129 | coenzyme biosynthetic process |
| GO:0006739 | 0.005 | 5.0735 | 1.1302 | 5 | 33 | NADP metabolic process |
| GO:0019985 | 0.0057 | 4.0627 | 1.6439 | 6 | 48 | translesion synthesis |
| GO:0006520 | 0.0058 | 1.7481 | 16.7812 | 28 | 490 | cellular amino acid metabolic process |
| GO:0046638 | 0.0064 | 4.7346 | 1.1987 | 5 | 35 | positive regulation of alpha-beta T cell differentiation |
| GO:0048662 | 0.0064 | 4.7346 | 1.1987 | 5 | 35 | negative regulation of smooth muscle cell proliferation |
| GO:0007584 | 0.0064 | 2.2505 | 6.5755 | 14 | 192 | response to nutrient |
| GO:0034654 | 0.0066 | 1.2783 | 136.5446 | 162 | 3987 | nucleobase-containing compound biosynthetic process |
| GO:1901360 | 0.0066 | 1.2537 | 195.1762 | 223 | 5699 | organic cyclic compound metabolic process |
| GO:0046102 | 0.0067 | 28.3009 | 0.137 | 2 | 4 | inosine metabolic process |
| GO:0050955 | 0.0067 | 28.3009 | 0.137 | 2 | 4 | thermoception |
| GO:1904479 | 0.0067 | 28.3009 | 0.137 | 2 | 4 | negative regulation of intestinal absorption |
| GO:0035337 | 0.0069 | 3.8775 | 1.7124 | 6 | 50 | fatty-acyl-CoA metabolic process |
| GO:0048566 | 0.0072 | 4.5816 | 1.2329 | 5 | 36 | embryonic digestive tract development |
| GO:1901576 | 0.0081 | 1.5579 | 27.9476 | 41 | 897 | organic substance biosynthetic process |
| GO:0006734 | 0.0082 | 4.4381 | 1.2672 | 5 | 37 | NADH metabolic process |
| GO:0006614 | 0.0083 | 2.7584 | 3.4932 | 9 | 102 | SRP-dependent cotranslational protein targeting to membrane |
| GO:0045787 | 0.0088 | 1.8757 | 11.1647 | 20 | 326 | positive regulation of cell cycle |
| GO:0043436 | 0.0089 | 1.4468 | 39.7955 | 55 | 1162 | oxoacid metabolic process |
| GO:0032374 | 0.0091 | 4.3034 | 1.3014 | 5 | 38 | regulation of cholesterol transport |
| GO:0042592 | 0.0095 | 1.3881 | 52.1589 | 69 | 1523 | homeostatic process |
| GO:0035383 | 0.0098 | 2.8837 | 2.9795 | 8 | 87 | thioester metabolic process |
| GO:0015918 | 0.0099 | 3.1614 | 2.3973 | 7 | 70 | sterol transport |
| GOMFID | Pvalue | OddsRatio | ExpCount | Count | Size | Term |
| GO:0048732 | 1e-04 | 2.4664 | 10.4487 | 24 | 444 | gland development |
| GO:0061029 | 2e-04 | 18.6326 | 0.3059 | 4 | 13 | eyelid development in camera-type eye |
| GO:0048704 | 4e-04 | 4.4259 | 2.2357 | 9 | 95 | embryonic skeletal system morphogenesis |
| GO:0032601 | 6e-04 | Inf | 0.0471 | 2 | 2 | connective tissue growth factor production |
| GO:1903660 | 6e-04 | Inf | 0.0471 | 2 | 2 | negative regulation of complement-dependent cytotoxicity |
| GO:0001977 | 6e-04 | 12.8961 | 0.4001 | 4 | 17 | renal system process involved in regulation of blood volume |
| GO:0006413 | 0.0011 | 2.6496 | 6.0245 | 15 | 256 | translational initiation |
| GO:0002831 | 0.0012 | 2.7304 | 5.4597 | 14 | 232 | regulation of response to biotic stimulus |
| GO:0002479 | 0.0016 | 4.4666 | 1.7179 | 7 | 73 | antigen processing and presentation of exogenous peptide antigen via MHC class I, TAP-dependent |
| GO:0009169 | 0.0016 | 83.4332 | 0.0706 | 2 | 3 | purine ribonucleoside monophosphate catabolic process |
| GO:0014707 | 0.0016 | 83.4332 | 0.0706 | 2 | 3 | branchiomeric skeletal muscle development |
| GO:0060279 | 0.0016 | 83.4332 | 0.0706 | 2 | 3 | positive regulation of ovulation |
| GO:0043043 | 0.0021 | 1.919 | 14.873 | 27 | 632 | peptide biosynthetic process |
| GO:0050927 | 0.0022 | 8.3786 | 0.5648 | 4 | 24 | positive regulation of positive chemotaxis |
| GO:0031341 | 0.0024 | 4.8503 | 1.3649 | 6 | 58 | regulation of cell killing |
| GO:0001774 | 0.0024 | 13.9362 | 0.2824 | 3 | 12 | microglial cell activation |
| GO:0046130 | 0.0024 | 13.9362 | 0.2824 | 3 | 12 | purine ribonucleoside catabolic process |
| GO:0009952 | 0.0025 | 2.7482 | 4.6358 | 12 | 198 | anterior/posterior pattern specification |
| GO:0044271 | 0.0029 | 1.3693 | 107.2877 | 132 | 4559 | cellular nitrogen compound biosynthetic process |
| GO:2000352 | 0.003 | 7.6159 | 0.6119 | 4 | 26 | negative regulation of endothelial cell apoptotic process |
| GO:0008284 | 0.003 | 1.769 | 19.1089 | 32 | 812 | positive regulation of cell proliferation |
| GO:0033152 | 0.0032 | 41.7139 | 0.0941 | 2 | 4 | immunoglobulin V(D)J recombination |
| GO:1900133 | 0.0032 | 41.7139 | 0.0941 | 2 | 4 | regulation of renin secretion into blood stream |
| GO:0009887 | 0.0039 | 1.6939 | 21.8152 | 35 | 927 | organ morphogenesis |
| GO:0043488 | 0.0047 | 3.0129 | 3.177 | 9 | 135 | regulation of mRNA stability |
| GO:0010155 | 0.0048 | 10.4501 | 0.353 | 3 | 15 | regulation of proton transport |
| GO:0048863 | 0.0049 | 2.3192 | 6.354 | 14 | 270 | stem cell differentiation |
| GO:0009058 | 0.0051 | 1.3225 | 139.6693 | 164 | 5935 | biosynthetic process |
| GO:0006195 | 0.0052 | 4.8773 | 1.1296 | 5 | 48 | purine nucleotide catabolic process |
| GO:0007386 | 0.0053 | 27.8074 | 0.1177 | 2 | 5 | compartment pattern specification |
| GO:0033578 | 0.0053 | 27.8074 | 0.1177 | 2 | 5 | protein glycosylation in Golgi |
| GO:0035912 | 0.0053 | 27.8074 | 0.1177 | 2 | 5 | dorsal aorta morphogenesis |
| GO:0036018 | 0.0053 | 27.8074 | 0.1177 | 2 | 5 | cellular response to erythropoietin |
| GO:0046416 | 0.0053 | 27.8074 | 0.1177 | 2 | 5 | D-amino acid metabolic process |
| GO:0006399 | 0.0054 | 2.5975 | 4.4713 | 11 | 190 | tRNA metabolic process |
| GO:0009059 | 0.0061 | 1.3258 | 115.1713 | 138 | 4894 | macromolecule biosynthetic process |
| GO:0072395 | 0.0065 | 3.8769 | 1.6709 | 6 | 71 | signal transduction involved in cell cycle checkpoint |
| GO:0002888 | 0.0069 | 8.9561 | 0.4001 | 3 | 17 | positive regulation of myeloid leukocyte mediated immunity |
| GO:0043302 | 0.0069 | 8.9561 | 0.4001 | 3 | 17 | positive regulation of leukocyte degranulation |
| GO:0010467 | 0.0076 | 1.3127 | 117.7835 | 140 | 5005 | gene expression |
| GO:0035270 | 0.0077 | 2.769 | 3.4358 | 9 | 146 | endocrine system development |
| GO:0001999 | 0.0078 | 20.8542 | 0.1412 | 2 | 6 | renal response to blood flow involved in circulatory renin-angiotensin regulation of systemic arterial blood pressure |
| GO:0003105 | 0.0078 | 20.8542 | 0.1412 | 2 | 6 | negative regulation of glomerular filtration |
| GO:0009125 | 0.0078 | 20.8542 | 0.1412 | 2 | 6 | nucleoside monophosphate catabolic process |
| GO:0046184 | 0.0078 | 20.8542 | 0.1412 | 2 | 6 | aldehyde biosynthetic process |
| GO:0060842 | 0.0078 | 20.8542 | 0.1412 | 2 | 6 | arterial endothelial cell differentiation |
| GO:0001912 | 0.008 | 5.5821 | 0.8001 | 4 | 34 | positive regulation of leukocyte mediated cytotoxicity |
| GO:0009954 | 0.008 | 5.5821 | 0.8001 | 4 | 34 | proximal/distal pattern formation |
| GO:0017145 | 0.008 | 5.5821 | 0.8001 | 4 | 34 | stem cell division |
| GO:0006414 | 0.0085 | 2.4324 | 4.7537 | 11 | 202 | translational elongation |
| GO:1901564 | 0.009 | 1.413 | 49.6785 | 66 | 2111 | organonitrogen compound metabolic process |
| GO:0002474 | 0.0093 | 3.1642 | 2.3533 | 7 | 100 | antigen processing and presentation of peptide antigen via MHC class I |
| GO:0035272 | 0.0093 | 4.1926 | 1.2943 | 5 | 55 | exocrine system development |
| GO:0048557 | 0.0095 | 7.8356 | 0.4471 | 3 | 19 | embryonic digestive tract morphogenesis |
| GO:0007389 | 0.0098 | 1.8877 | 10.5193 | 19 | 447 | pattern specification process |
| GO:0043900 | 0.01 | 1.8501 | 11.2959 | 20 | 480 | regulation of multi-organism process |
| GOMFID | Pvalue | OddsRatio | ExpCount | Count | Size | Term |
| GO:0071167 | 5e-04 | Inf | 0.0435 | 2 | 2 | ribonucleoprotein complex import into nucleus |
| GO:0009749 | 5e-04 | 3.3339 | 3.871 | 12 | 178 | response to glucose |
| GO:0051103 | 8e-04 | 22.682 | 0.1957 | 3 | 9 | DNA ligation involved in DNA repair |
| GO:0034284 | 9e-04 | 3.1067 | 4.132 | 12 | 190 | response to monosaccharide |
| GO:0038091 | 0.0014 | 90.4897 | 0.0652 | 2 | 3 | positive regulation of cell proliferation by VEGF-activated platelet derived growth factor receptor signaling pathway |
| GO:0060435 | 0.0014 | 90.4897 | 0.0652 | 2 | 3 | bronchiole development |
| GO:0072275 | 0.0014 | 90.4897 | 0.0652 | 2 | 3 | metanephric glomerulus morphogenesis |
| GO:0072277 | 0.0014 | 90.4897 | 0.0652 | 2 | 3 | metanephric glomerular capillary formation |
| GO:0045351 | 0.0015 | 17.0092 | 0.2392 | 3 | 11 | type I interferon biosynthetic process |
| GO:0035924 | 0.0017 | 6.5068 | 0.8699 | 5 | 40 | cellular response to vascular endothelial growth factor stimulus |
| GO:0050926 | 0.0019 | 8.6579 | 0.5437 | 4 | 25 | regulation of positive chemotaxis |
| GO:0035990 | 0.0027 | 45.2419 | 0.087 | 2 | 4 | tendon cell differentiation |
| GO:0048254 | 0.0027 | 45.2419 | 0.087 | 2 | 4 | snoRNA localization |
| GO:0060574 | 0.0027 | 45.2419 | 0.087 | 2 | 4 | intestinal epithelial cell maturation |
| GO:0072599 | 0.0028 | 3.5888 | 2.3922 | 8 | 110 | establishment of protein localization to endoplasmic reticulum |
| GO:0050930 | 0.0031 | 12.3679 | 0.3045 | 3 | 14 | induction of positive chemotaxis |
| GO:0001756 | 0.0036 | 4.4132 | 1.4788 | 6 | 68 | somitogenesis |
| GO:0006807 | 0.0039 | 1.3482 | 139.4446 | 164 | 6412 | nitrogen compound metabolic process |
| GO:0007386 | 0.0045 | 30.1593 | 0.1087 | 2 | 5 | compartment pattern specification |
| GO:0034465 | 0.0045 | 30.1593 | 0.1087 | 2 | 5 | response to carbon monoxide |
| GO:0043308 | 0.0045 | 30.1593 | 0.1087 | 2 | 5 | eosinophil degranulation |
| GO:0045359 | 0.0045 | 30.1593 | 0.1087 | 2 | 5 | positive regulation of interferon-beta biosynthetic process |
| GO:0061419 | 0.0045 | 30.1593 | 0.1087 | 2 | 5 | positive regulation of transcription from RNA polymerase II promoter in response to hypoxia |
| GO:0072103 | 0.0045 | 30.1593 | 0.1087 | 2 | 5 | glomerulus vasculature morphogenesis |
| GO:0002070 | 0.0046 | 10.4638 | 0.348 | 3 | 16 | epithelial cell maturation |
| GO:0048608 | 0.0051 | 2.0654 | 9.1557 | 18 | 421 | reproductive structure development |
| GO:0060575 | 0.0055 | 9.7158 | 0.3697 | 3 | 17 | intestinal epithelial cell differentiation |
| GO:0060749 | 0.0055 | 9.7158 | 0.3697 | 3 | 17 | mammary gland alveolus development |
| GO:2000241 | 0.0063 | 3.0989 | 2.7402 | 8 | 126 | regulation of reproductive process |
| GO:1901576 | 0.0065 | 1.3255 | 127.3748 | 150 | 5857 | organic substance biosynthetic process |
| GO:0001731 | 0.0065 | 9.0675 | 0.3915 | 3 | 18 | formation of translation preinitiation complex |
| GO:0035989 | 0.0067 | 22.618 | 0.1305 | 2 | 6 | tendon development |
| GO:0043307 | 0.0067 | 22.618 | 0.1305 | 2 | 6 | eosinophil activation |
| GO:0044281 | 0.0067 | 1.4185 | 55.3255 | 73 | 2544 | small molecule metabolic process |
| GO:0006614 | 0.0068 | 3.363 | 2.2182 | 7 | 102 | SRP-dependent cotranslational protein targeting to membrane |
| GO:0055123 | 0.0069 | 2.8209 | 3.3709 | 9 | 155 | digestive system development |
| GO:0009108 | 0.0072 | 3.0215 | 2.8054 | 8 | 129 | coenzyme biosynthetic process |
| GO:0048339 | 0.0076 | 8.5002 | 0.4132 | 3 | 19 | paraxial mesoderm development |
| GO:0048557 | 0.0076 | 8.5002 | 0.4132 | 3 | 19 | embryonic digestive tract morphogenesis |
| GO:0050678 | 0.008 | 2.2545 | 6.0458 | 13 | 278 | regulation of epithelial cell proliferation |
| GO:0006111 | 0.0082 | 5.5053 | 0.8047 | 4 | 37 | regulation of gluconeogenesis |
| GO:0044249 | 0.0086 | 1.3119 | 125.3305 | 147 | 5763 | cellular biosynthetic process |
| GO:0006561 | 0.0092 | 18.0932 | 0.1522 | 2 | 7 | proline biosynthetic process |
| GO:0031584 | 0.0092 | 18.0932 | 0.1522 | 2 | 7 | activation of phospholipase D activity |
| GO:0045084 | 0.0092 | 18.0932 | 0.1522 | 2 | 7 | positive regulation of interleukin-12 biosynthetic process |
| GO:0061438 | 0.0092 | 18.0932 | 0.1522 | 2 | 7 | renal system vasculature morphogenesis |
| GO:0090045 | 0.0092 | 18.0932 | 0.1522 | 2 | 7 | positive regulation of deacetylase activity |
| GO:0097084 | 0.0092 | 18.0932 | 0.1522 | 2 | 7 | vascular smooth muscle cell development |
| GO:2000402 | 0.0092 | 18.0932 | 0.1522 | 2 | 7 | negative regulation of lymphocyte migration |
| GO:0019319 | 0.0094 | 3.55 | 1.805 | 6 | 83 | hexose biosynthetic process |
| GO:0090150 | 0.0097 | 2.0671 | 7.5899 | 15 | 349 | establishment of protein localization to membrane |
| GO:0006139 | 0.0098 | 1.3095 | 115.131 | 136 | 5294 | nucleobase-containing compound metabolic process |
| GO:0035967 | 0.0098 | 2.8549 | 2.9577 | 8 | 136 | cellular response to topologically incorrect protein |
| GO:0001525 | 0.0098 | 1.9646 | 9.0469 | 17 | 416 | angiogenesis |
| GO:0048145 | 0.0099 | 3.5042 | 1.8268 | 6 | 84 | regulation of fibroblast proliferation |
| GOMFID | Pvalue | OddsRatio | ExpCount | Count | Size | Term |
| GO:0006414 | 0 | 3.4987 | 5.6555 | 18 | 202 | translational elongation |
| GO:0009952 | 0 | 3.4796 | 5.6835 | 18 | 203 | anterior/posterior pattern specification |
| GO:0016259 | 0 | 5.3402 | 2.3518 | 11 | 84 | selenocysteine metabolic process |
| GO:0006614 | 0 | 4.731 | 2.8557 | 12 | 102 | SRP-dependent cotranslational protein targeting to membrane |
| GO:0006725 | 0 | 1.4887 | 153.594 | 194 | 5486 | cellular aromatic compound metabolic process |
| GO:0043043 | 0 | 2.195 | 17.6944 | 36 | 632 | peptide biosynthetic process |
| GO:0044271 | 0 | 2.3657 | 14.3819 | 31 | 572 | cellular nitrogen compound biosynthetic process |
| GO:0010467 | 0 | 1.4858 | 140.1272 | 179 | 5005 | gene expression |
| GO:0072599 | 1e-04 | 4.3425 | 3.0797 | 12 | 110 | establishment of protein localization to endoplasmic reticulum |
| GO:0090304 | 1e-04 | 1.4747 | 132.7639 | 170 | 4742 | nucleic acid metabolic process |
| GO:0046483 | 1e-04 | 1.4542 | 153.0901 | 191 | 5468 | heterocycle metabolic process |
| GO:0006415 | 1e-04 | 3.3989 | 4.8156 | 15 | 172 | translational termination |
| GO:1901360 | 1e-04 | 1.4409 | 159.5575 | 197 | 5699 | organic cyclic compound metabolic process |
| GO:0009059 | 3e-04 | 1.4915 | 94.6889 | 125 | 3518 | macromolecule biosynthetic process |
| GO:0043603 | 3e-04 | 1.84 | 25.5897 | 44 | 914 | cellular amide metabolic process |
| GO:0006413 | 3e-04 | 2.6952 | 7.1673 | 18 | 256 | translational initiation |
| GO:0048935 | 4e-04 | 15.5627 | 0.364 | 4 | 13 | peripheral nervous system neuron development |
| GO:0034654 | 4e-04 | 1.4371 | 110.5724 | 142 | 3973 | nucleobase-containing compound biosynthetic process |
| GO:0009058 | 4e-04 | 1.6212 | 50.2563 | 73 | 1961 | biosynthetic process |
| GO:0006612 | 7e-04 | 2.9378 | 5.1235 | 14 | 183 | protein targeting to membrane |
| GO:0034655 | 0.0011 | 2.187 | 10.667 | 22 | 381 | nucleobase-containing compound catabolic process |
| GO:0048663 | 0.0013 | 4.1417 | 2.1278 | 8 | 76 | neuron fate commitment |
| GO:0060037 | 0.0014 | 10.0013 | 0.504 | 4 | 18 | pharyngeal system development |
| GO:0000184 | 0.0014 | 3.3927 | 3.1917 | 10 | 114 | nuclear-transcribed mRNA catabolic process, nonsense-mediated decay |
| GO:0009889 | 0.0016 | 1.3747 | 111.4578 | 139 | 3981 | regulation of biosynthetic process |
| GO:0006402 | 0.0017 | 2.6376 | 5.6555 | 14 | 202 | mRNA catabolic process |
| GO:0007389 | 0.0018 | 2.0259 | 12.5149 | 24 | 447 | pattern specification process |
| GO:0032330 | 0.0019 | 5.1372 | 1.3159 | 6 | 47 | regulation of chondrocyte differentiation |
| GO:0044033 | 0.0021 | 2.5684 | 5.7955 | 14 | 207 | multi-organism metabolic process |
| GO:0019083 | 0.0023 | 2.6579 | 5.2075 | 13 | 186 | viral transcription |
| GO:0014738 | 0.0023 | 69.7483 | 0.084 | 2 | 3 | regulation of muscle hyperplasia |
| GO:0021524 | 0.0023 | 69.7483 | 0.084 | 2 | 3 | visceral motor neuron differentiation |
| GO:0043241 | 0.0024 | 2.2357 | 8.5112 | 18 | 304 | protein complex disassembly |
| GO:0003203 | 0.0025 | 8.2348 | 0.5879 | 4 | 21 | endocardial cushion morphogenesis |
| GO:1901564 | 0.0026 | 1.4494 | 59.1026 | 80 | 2111 | organonitrogen compound metabolic process |
| GO:0001708 | 0.0038 | 3.8069 | 2.0038 | 7 | 72 | cell fate specification |
| GO:0009650 | 0.004 | 11.6453 | 0.336 | 3 | 12 | UV protection |
| GO:0030326 | 0.004 | 2.8887 | 3.6957 | 10 | 132 | embryonic limb morphogenesis |
| GO:0034661 | 0.0041 | 6.9982 | 0.6719 | 4 | 24 | ncRNA catabolic process |
| GO:0051253 | 0.0042 | 1.5458 | 34.1569 | 50 | 1220 | negative regulation of RNA metabolic process |
| GO:0035137 | 0.0044 | 5.1528 | 1.0919 | 5 | 39 | hindlimb morphogenesis |
| GO:0044265 | 0.0044 | 1.6304 | 25.1697 | 39 | 899 | cellular macromolecule catabolic process |
| GO:0010917 | 0.0045 | 34.8719 | 0.112 | 2 | 4 | negative regulation of mitochondrial membrane potential |
| GO:0021520 | 0.0051 | 10.48 | 0.364 | 3 | 13 | spinal cord motor neuron cell fate specification |
| GO:0060272 | 0.0051 | 10.48 | 0.364 | 3 | 13 | embryonic skeletal joint morphogenesis |
| GO:0051171 | 0.0053 | 1.3196 | 112.9977 | 137 | 4036 | regulation of nitrogen compound metabolic process |
| GO:0051216 | 0.0053 | 2.4914 | 5.0955 | 12 | 182 | cartilage development |
| GO:0035136 | 0.0055 | 4.8659 | 1.1479 | 5 | 41 | forelimb morphogenesis |
| GO:0051384 | 0.0057 | 2.5857 | 4.5076 | 11 | 161 | response to glucocorticoid |
| GO:0003148 | 0.0063 | 9.5267 | 0.392 | 3 | 14 | outflow tract septum morphogenesis |
| GO:0007501 | 0.0063 | 9.5267 | 0.392 | 3 | 14 | mesodermal cell fate specification |
| GO:0043101 | 0.0063 | 9.5267 | 0.392 | 3 | 14 | purine-containing compound salvage |
| GO:0071025 | 0.0063 | 9.5267 | 0.392 | 3 | 14 | RNA surveillance |
| GO:0045746 | 0.0064 | 6.0842 | 0.7559 | 4 | 27 | negative regulation of Notch signaling pathway |
| GO:2000112 | 0.0066 | 1.3187 | 102.4427 | 125 | 3659 | regulation of cellular macromolecule biosynthetic process |
| GO:0006399 | 0.0073 | 2.3782 | 5.3195 | 12 | 190 | tRNA metabolic process |
| GO:0097193 | 0.0074 | 2.0816 | 8.0633 | 16 | 288 | intrinsic apoptotic signaling pathway |
| GO:0000467 | 0.0074 | 23.2464 | 0.14 | 2 | 5 | exonucleolytic trimming to generate mature 3'-end of 5.8S rRNA from tricistronic rRNA transcript (SSU-rRNA, 5.8S rRNA, LSU-rRNA) |
| GO:0060750 | 0.0074 | 23.2464 | 0.14 | 2 | 5 | epithelial cell proliferation involved in mammary gland duct elongation |
| GO:0061056 | 0.0074 | 23.2464 | 0.14 | 2 | 5 | sclerotome development |
| GO:0071038 | 0.0074 | 23.2464 | 0.14 | 2 | 5 | nuclear polyadenylation-dependent tRNA catabolic process |
| GO:0072526 | 0.0074 | 23.2464 | 0.14 | 2 | 5 | pyridine-containing compound catabolic process |
| GO:1903507 | 0.0074 | 1.5117 | 32.673 | 47 | 1167 | negative regulation of nucleic acid-templated transcription |
| GO:0008284 | 0.0075 | 1.6127 | 22.7339 | 35 | 812 | positive regulation of cell proliferation |
| GO:0010558 | 0.0076 | 1.4695 | 38.6925 | 54 | 1382 | negative regulation of macromolecule biosynthetic process |
| GO:0036037 | 0.0077 | 8.7322 | 0.42 | 3 | 15 | CD8-positive, alpha-beta T cell activation |
| GO:0048704 | 0.0078 | 3.2973 | 2.282 | 7 | 82 | embryonic skeletal system morphogenesis |
| GO:0002377 | 0.008 | 3.2766 | 2.2958 | 7 | 82 | immunoglobulin production |
| GO:0048645 | 0.0082 | 3.6913 | 1.7638 | 6 | 63 | organ formation |
| GO:0060349 | 0.0086 | 3.2333 | 2.3238 | 7 | 83 | bone morphogenesis |
| GO:0015031 | 0.0092 | 1.4057 | 49.5555 | 66 | 1770 | protein transport |
| GO:0003206 | 0.0093 | 2.8979 | 2.9397 | 8 | 105 | cardiac chamber morphogenesis |
| GO:0000028 | 0.0093 | 8.06 | 0.448 | 3 | 16 | ribosomal small subunit assembly |
| GO:0002467 | 0.0093 | 8.06 | 0.448 | 3 | 16 | germinal center formation |
| GO:0006974 | 0.0096 | 1.6065 | 21.474 | 33 | 767 | cellular response to DNA damage stimulus |
| GOMFID | Pvalue | OddsRatio | ExpCount | Count | Size | Term |
| GO:0019742 | 5e-04 | Inf | 0.0431 | 2 | 2 | pentacyclic triterpenoid metabolic process |
| GO:0050992 | 5e-04 | Inf | 0.0431 | 2 | 2 | dimethylallyl diphosphate biosynthetic process |
| GO:0006805 | 7e-04 | 3.2276 | 3.9879 | 12 | 185 | xenobiotic metabolic process |
| GO:0009410 | 0.0011 | 3.0492 | 4.2034 | 12 | 195 | response to xenobiotic stimulus |
| GO:0006720 | 0.0012 | 3.7536 | 2.5867 | 9 | 120 | isoprenoid metabolic process |
| GO:0006069 | 0.0019 | 15.2567 | 0.2587 | 3 | 12 | ethanol oxidation |
| GO:0070525 | 0.0019 | 15.2567 | 0.2587 | 3 | 12 | tRNA threonylcarbamoyladenosine metabolic process |
| GO:0003150 | 0.0027 | 45.6548 | 0.0862 | 2 | 4 | muscular septum morphogenesis |
| GO:0061043 | 0.0027 | 45.6548 | 0.0862 | 2 | 4 | regulation of vascular wound healing |
| GO:0090086 | 0.0027 | 45.6548 | 0.0862 | 2 | 4 | negative regulation of protein deubiquitination |
| GO:0030433 | 0.0032 | 4.5273 | 1.4443 | 6 | 67 | ER-associated ubiquitin-dependent protein catabolic process |
| GO:0071236 | 0.0037 | 11.4403 | 0.3233 | 3 | 15 | cellular response to antibiotic |
| GO:0007021 | 0.0044 | 30.4345 | 0.1078 | 2 | 5 | tubulin complex assembly |
| GO:0008078 | 0.0044 | 30.4345 | 0.1078 | 2 | 5 | mesodermal cell migration |
| GO:1901228 | 0.0044 | 30.4345 | 0.1078 | 2 | 5 | positive regulation of transcription from RNA polymerase II promoter involved in heart development |
| GO:0060055 | 0.0054 | 9.8047 | 0.3665 | 3 | 17 | angiogenesis involved in wound healing |
| GO:0010830 | 0.006 | 4.6862 | 1.164 | 5 | 54 | regulation of myotube differentiation |
| GO:1901741 | 0.0064 | 9.1504 | 0.388 | 3 | 18 | positive regulation of myoblast fusion |
| GO:0003149 | 0.0066 | 22.8244 | 0.1293 | 2 | 6 | membranous septum morphogenesis |
| GO:0019348 | 0.0066 | 22.8244 | 0.1293 | 2 | 6 | dolichol metabolic process |
| GO:0060022 | 0.0066 | 22.8244 | 0.1293 | 2 | 6 | hard palate development |
| GO:0071108 | 0.0099 | 7.6239 | 0.4527 | 3 | 21 | protein K48-linked deubiquitination |
| GOMFID | Pvalue | OddsRatio | ExpCount | Count | Size | Term |
| GO:0009058 | 1e-04 | 1.4781 | 151.0246 | 188 | 5935 | biosynthetic process |
| GO:0044271 | 1e-04 | 1.4855 | 116.0103 | 150 | 4559 | cellular nitrogen compound biosynthetic process |
| GO:0006807 | 1e-04 | 1.4522 | 163.1625 | 199 | 6412 | nitrogen compound metabolic process |
| GO:0060795 | 2e-04 | 8.0295 | 0.8906 | 6 | 35 | cell fate commitment involved in formation of primary germ layer |
| GO:0018130 | 4e-04 | 1.4501 | 103.0835 | 133 | 4051 | heterocycle biosynthetic process |
| GO:0019438 | 5e-04 | 1.4486 | 103.1598 | 133 | 4054 | aromatic compound biosynthetic process |
| GO:1901362 | 5e-04 | 1.4398 | 106.2134 | 136 | 4174 | organic cyclic compound biosynthetic process |
| GO:0006500 | 6e-04 | Inf | 0.0509 | 2 | 2 | N-terminal protein palmitoylation |
| GO:0006880 | 6e-04 | Inf | 0.0509 | 2 | 2 | intracellular sequestering of iron ion |
| GO:0060809 | 6e-04 | Inf | 0.0509 | 2 | 2 | mesodermal to mesenchymal transition involved in gastrulation |
| GO:0080135 | 7e-04 | 2.0032 | 15.9295 | 30 | 626 | regulation of cellular response to stress |
| GO:0000122 | 7e-04 | 1.933 | 18.1687 | 33 | 714 | negative regulation of transcription from RNA polymerase II promoter |
| GO:0001829 | 0.001 | 11.043 | 0.458 | 4 | 18 | trophectodermal cell differentiation |
| GO:0044237 | 0.0013 | 1.3917 | 245.9143 | 275 | 9664 | cellular metabolic process |
| GO:0044238 | 0.0014 | 1.388 | 247.2629 | 276 | 9717 | primary metabolic process |
| GO:0071704 | 0.0016 | 1.3887 | 254.9987 | 283 | 10021 | organic substance metabolic process |
| GO:0090304 | 0.0018 | 1.3717 | 120.667 | 148 | 4742 | nucleic acid metabolic process |
| GO:0048850 | 0.0019 | 76.9773 | 0.0763 | 2 | 3 | hypophysis morphogenesis |
| GO:0006402 | 0.002 | 2.6893 | 5.1402 | 13 | 202 | mRNA catabolic process |
| GO:0034645 | 0.0031 | 1.378 | 97.2391 | 121 | 4001 | cellular macromolecule biosynthetic process |
| GO:1901566 | 0.0031 | 1.5738 | 33.7165 | 50 | 1325 | organonitrogen compound biosynthetic process |
| GO:0006412 | 0.0035 | 1.843 | 15.4205 | 27 | 606 | translation |
| GO:0006021 | 0.0037 | 38.4861 | 0.1018 | 2 | 4 | inositol biosynthetic process |
| GO:0006446 | 0.0039 | 3.7721 | 2.0103 | 7 | 79 | regulation of translational initiation |
| GO:0034655 | 0.0042 | 2.0606 | 9.6951 | 19 | 381 | nucleobase-containing compound catabolic process |
| GO:0071897 | 0.0044 | 2.8416 | 3.7406 | 10 | 147 | DNA biosynthetic process |
| GO:0008584 | 0.0047 | 3.0169 | 3.1808 | 9 | 125 | male gonad development |
| GO:0007501 | 0.0048 | 10.5165 | 0.3562 | 3 | 14 | mesodermal cell fate specification |
| GO:0070972 | 0.0054 | 2.9403 | 3.2571 | 9 | 128 | protein localization to endoplasmic reticulum |
| GO:0016259 | 0.0055 | 3.526 | 2.1375 | 7 | 84 | selenocysteine metabolic process |
| GO:0044710 | 0.0057 | 1.3102 | 134.6371 | 159 | 5291 | single-organism metabolic process |
| GO:0032774 | 0.0061 | 3.1275 | 2.7352 | 8 | 115 | RNA biosynthetic process |
| GO:0019367 | 0.0061 | 25.6558 | 0.1272 | 2 | 5 | fatty acid elongation, saturated fatty acid |
| GO:0060750 | 0.0061 | 25.6558 | 0.1272 | 2 | 5 | epithelial cell proliferation involved in mammary gland duct elongation |
| GO:0048333 | 0.0067 | 5.9416 | 0.7634 | 4 | 30 | mesodermal cell differentiation |
| GO:0010818 | 0.0072 | 8.8974 | 0.4071 | 3 | 16 | T cell chemotaxis |
| GO:0006974 | 0.0075 | 1.6648 | 19.5174 | 31 | 767 | cellular response to DNA damage stimulus |
| GO:0000398 | 0.0079 | 2.1863 | 6.7179 | 14 | 264 | mRNA splicing, via spliceosome |
| GO:0000289 | 0.0085 | 5.5165 | 0.8143 | 4 | 32 | nuclear-transcribed mRNA poly(A) tail shortening |
| GO:0042776 | 0.0085 | 8.2614 | 0.4326 | 3 | 17 | mitochondrial ATP synthesis coupled proton transport |
| GO:0048853 | 0.0085 | 8.2614 | 0.4326 | 3 | 17 | forebrain morphogenesis |
| GO:0048332 | 0.0087 | 3.63 | 1.7812 | 6 | 70 | mesoderm morphogenesis |
| GO:0045137 | 0.0088 | 2.3147 | 5.4455 | 12 | 214 | development of primary sexual characteristics |
| GO:0000375 | 0.0089 | 2.1513 | 6.8196 | 14 | 268 | RNA splicing, via transesterification reactions |
| GO:0097659 | 0.009 | 1.3244 | 88.7317 | 109 | 3487 | nucleic acid-templated transcription |
| GO:0003402 | 0.0091 | 19.2406 | 0.1527 | 2 | 6 | planar cell polarity pathway involved in axis elongation |
| GO:0008216 | 0.0091 | 19.2406 | 0.1527 | 2 | 6 | spermidine metabolic process |
| GO:0071877 | 0.0091 | 19.2406 | 0.1527 | 2 | 6 | regulation of adrenergic receptor signaling pathway |
| GO:1902177 | 0.0091 | 19.2406 | 0.1527 | 2 | 6 | positive regulation of oxidative stress-induced intrinsic apoptotic signaling pathway |
| GO:0075733 | 0.0094 | 5.3259 | 0.8397 | 4 | 33 | intracellular transport of virus |
| GO:0006518 | 0.0099 | 1.6418 | 19.1103 | 30 | 751 | peptide metabolic process |
| GOMFID | Pvalue | OddsRatio | ExpCount | Count | Size | Term |
| GO:0034641 | 1e-04 | 1.522 | 138.3264 | 174 | 6127 | cellular nitrogen compound metabolic process |
| GO:0006044 | 3e-04 | 15.9117 | 0.3386 | 4 | 15 | N-acetylglucosamine metabolic process |
| GO:0034654 | 3e-04 | 1.5 | 90.0126 | 119 | 3987 | nucleobase-containing compound biosynthetic process |
| GO:0010467 | 4e-04 | 1.4586 | 112.9955 | 143 | 5005 | gene expression |
| GO:0045091 | 6e-04 | 26.1897 | 0.1806 | 3 | 8 | regulation of single stranded viral RNA replication via double stranded DNA intermediate |
| GO:0075713 | 6e-04 | 26.1897 | 0.1806 | 3 | 8 | establishment of integrated proviral latency |
| GO:1901576 | 6e-04 | 1.4269 | 132.2307 | 162 | 5857 | organic substance biosynthetic process |
| GO:0046483 | 9e-04 | 1.4169 | 123.4485 | 152 | 5468 | heterocycle metabolic process |
| GO:0097659 | 9e-04 | 1.4686 | 78.7244 | 104 | 3487 | nucleic acid-templated transcription |
| GO:0016070 | 0.001 | 1.4498 | 89.1471 | 115 | 4027 | RNA metabolic process |
| GO:1901360 | 0.001 | 1.407 | 128.6636 | 157 | 5699 | organic cyclic compound metabolic process |
| GO:0019042 | 0.0012 | 18.7045 | 0.2258 | 3 | 10 | viral latency |
| GO:2001141 | 0.0016 | 1.4471 | 75.4282 | 99 | 3341 | regulation of RNA biosynthetic process |
| GO:0019219 | 0.0017 | 1.4278 | 84.662 | 109 | 3750 | regulation of nucleobase-containing compound metabolic process |
| GO:0036314 | 0.0019 | 8.7463 | 0.5418 | 4 | 24 | response to sterol |
| GO:0042742 | 0.002 | 2.6921 | 5.1249 | 13 | 227 | defense response to bacterium |
| GO:0009889 | 0.0022 | 1.4076 | 89.8772 | 114 | 3981 | regulation of biosynthetic process |
| GO:0034645 | 0.0025 | 1.3909 | 100.6751 | 125 | 4543 | cellular macromolecule biosynthetic process |
| GO:0006355 | 0.0025 | 1.4252 | 74.638 | 97 | 3306 | regulation of transcription, DNA-templated |
| GO:1904431 | 0.003 | 43.5341 | 0.0903 | 2 | 4 | positive regulation of t-circle formation |
| GO:0006699 | 0.0034 | 7.2867 | 0.6321 | 4 | 28 | bile acid biosynthetic process |
| GO:0039694 | 0.0035 | 11.8998 | 0.3161 | 3 | 14 | viral RNA genome replication |
| GO:0046827 | 0.0035 | 11.8998 | 0.3161 | 3 | 14 | positive regulation of protein export from nucleus |
| GO:0001887 | 0.0035 | 3.451 | 2.4834 | 8 | 110 | selenium compound metabolic process |
| GO:0031424 | 0.0044 | 5.092 | 1.0837 | 5 | 48 | keratinization |
| GO:0042255 | 0.0044 | 5.092 | 1.0837 | 5 | 48 | ribosome assembly |
| GO:0043043 | 0.0048 | 1.8426 | 14.2684 | 25 | 632 | peptide biosynthetic process |
| GO:0045541 | 0.0049 | 29.0208 | 0.1129 | 2 | 5 | negative regulation of cholesterol biosynthetic process |
| GO:0072526 | 0.0049 | 29.0208 | 0.1129 | 2 | 5 | pyridine-containing compound catabolic process |
| GO:0001937 | 0.005 | 6.4758 | 0.6999 | 4 | 31 | negative regulation of endothelial cell proliferation |
| GO:0030490 | 0.005 | 6.4758 | 0.6999 | 4 | 31 | maturation of SSU-rRNA |
| GO:0071826 | 0.0054 | 2.5963 | 4.4702 | 11 | 198 | ribonucleoprotein complex subunit organization |
| GO:0006112 | 0.0055 | 2.7382 | 3.8606 | 10 | 171 | energy reserve metabolic process |
| GO:0050810 | 0.0062 | 4.6574 | 1.174 | 5 | 52 | regulation of steroid biosynthetic process |
| GO:0006414 | 0.0063 | 2.5413 | 4.5605 | 11 | 202 | translational elongation |
| GO:0006401 | 0.0064 | 2.4204 | 5.2152 | 12 | 231 | RNA catabolic process |
| GO:0010792 | 0.0072 | 21.7642 | 0.1355 | 2 | 6 | DNA double-strand break processing involved in repair via single-strand annealing |
| GO:0022613 | 0.0074 | 2.0802 | 8.0598 | 16 | 357 | ribonucleoprotein complex biogenesis |
| GO:0016925 | 0.0075 | 3.0056 | 2.8221 | 8 | 125 | protein sumoylation |
| GO:0046638 | 0.0077 | 5.6387 | 0.7902 | 4 | 35 | positive regulation of alpha-beta T cell differentiation |
| GO:0006614 | 0.0083 | 3.2342 | 2.3028 | 7 | 102 | SRP-dependent cotranslational protein targeting to membrane |
| GO:0010906 | 0.0083 | 3.2342 | 2.3028 | 7 | 102 | regulation of glucose metabolic process |
| GO:0071285 | 0.0085 | 8.1784 | 0.429 | 3 | 19 | cellular response to lithium ion |
| GO:0006040 | 0.0085 | 5.4621 | 0.8128 | 4 | 36 | amino sugar metabolic process |
| GO:0006725 | 0.0097 | 1.3138 | 111.3388 | 132 | 5052 | cellular aromatic compound metabolic process |
| GO:0042127 | 0.0098 | 1.49 | 33.3004 | 47 | 1475 | regulation of cell proliferation |
| GO:0035947 | 0.0099 | 17.4102 | 0.158 | 2 | 7 | regulation of gluconeogenesis by regulation of transcription from RNA polymerase II promoter |
| GO:0046898 | 0.0099 | 17.4102 | 0.158 | 2 | 7 | response to cycloheximide |
| GO:0051256 | 0.0099 | 17.4102 | 0.158 | 2 | 7 | mitotic spindle midzone assembly |
| GO:1901626 | 0.0099 | 17.4102 | 0.158 | 2 | 7 | regulation of postsynaptic membrane organization |
| GO:0019439 | 0.01 | 1.9201 | 9.7982 | 18 | 434 | aromatic compound catabolic process |
| GOMFID | Pvalue | OddsRatio | ExpCount | Count | Size | Term |
| GO:0016259 | 0 | 5.9693 | 2.1161 | 11 | 84 | selenocysteine metabolic process |
| GO:0006614 | 0 | 5.2898 | 2.5695 | 12 | 102 | SRP-dependent cotranslational protein targeting to membrane |
| GO:0006612 | 0 | 3.8217 | 4.61 | 16 | 183 | protein targeting to membrane |
| GO:0044033 | 0 | 3.573 | 5.2146 | 17 | 207 | multi-organism metabolic process |
| GO:0072599 | 0 | 4.8554 | 2.771 | 12 | 110 | establishment of protein localization to endoplasmic reticulum |
| GO:0000184 | 0 | 4.6638 | 2.8718 | 12 | 114 | nuclear-transcribed mRNA catabolic process, nonsense-mediated decay |
| GO:0006414 | 1e-04 | 3.427 | 5.0886 | 16 | 202 | translational elongation |
| GO:0019083 | 1e-04 | 3.4889 | 4.6856 | 15 | 186 | viral transcription |
| GO:0043241 | 1e-04 | 2.8171 | 7.6582 | 20 | 304 | protein complex disassembly |
| GO:0006415 | 1e-04 | 3.518 | 4.3329 | 14 | 172 | translational termination |
| GO:0044403 | 4e-04 | 1.935 | 20.4554 | 37 | 812 | symbiosis, encompassing mutualism through parasitism |
| GO:0044764 | 4e-04 | 1.9407 | 19.8256 | 36 | 787 | multi-organism cellular process |
| GO:0006402 | 6e-04 | 2.9508 | 5.0886 | 14 | 202 | mRNA catabolic process |
| GO:0019742 | 6e-04 | Inf | 0.0504 | 2 | 2 | pentacyclic triterpenoid metabolic process |
| GO:0006413 | 8e-04 | 2.6464 | 6.449 | 16 | 256 | translational initiation |
| GO:0016071 | 0.0015 | 2.2236 | 9.5262 | 20 | 387 | mRNA metabolic process |
| GO:1904030 | 0.0016 | 3.9789 | 2.1916 | 8 | 87 | negative regulation of cyclin-dependent protein kinase activity |
| GO:0019058 | 0.0016 | 2.1186 | 10.9834 | 22 | 436 | viral life cycle |
| GO:0000379 | 0.0019 | 77.7812 | 0.0756 | 2 | 3 | tRNA-type intron splice site recognition and cleavage |
| GO:0061024 | 0.0021 | 1.6781 | 26.5517 | 42 | 1054 | membrane organization |
| GO:0006707 | 0.0023 | 14.6145 | 0.2771 | 3 | 11 | cholesterol catabolic process |
| GO:0006706 | 0.0024 | 8.2197 | 0.5794 | 4 | 23 | steroid catabolic process |
| GO:0033365 | 0.0026 | 1.7419 | 21.2363 | 35 | 843 | protein localization to organelle |
| GO:0008380 | 0.0037 | 2.1372 | 8.8673 | 18 | 352 | RNA splicing |
| GO:0001806 | 0.0037 | 38.888 | 0.1008 | 2 | 4 | type IV hypersensitivity |
| GO:0015760 | 0.0037 | 38.888 | 0.1008 | 2 | 4 | glucose-6-phosphate transport |
| GO:0032849 | 0.0037 | 38.888 | 0.1008 | 2 | 4 | positive regulation of cellular pH reduction |
| GO:0090086 | 0.0037 | 38.888 | 0.1008 | 2 | 4 | negative regulation of protein deubiquitination |
| GO:0043123 | 0.0037 | 2.7426 | 4.2573 | 11 | 169 | positive regulation of I-kappaB kinase/NF-kappaB signaling |
| GO:0034655 | 0.0038 | 2.0831 | 9.5979 | 19 | 381 | nucleobase-containing compound catabolic process |
| GO:0042273 | 0.0039 | 5.2834 | 1.058 | 5 | 42 | ribosomal large subunit biogenesis |
| GO:0019221 | 0.0039 | 1.8493 | 14.7873 | 26 | 587 | cytokine-mediated signaling pathway |
| GO:0016482 | 0.0043 | 1.5803 | 30.1036 | 45 | 1195 | cytoplasmic transport |
| GO:0006886 | 0.0047 | 1.6374 | 24.4608 | 38 | 971 | intracellular protein transport |
| GO:1902580 | 0.0058 | 1.5525 | 30.5823 | 45 | 1214 | single-organism cellular localization |
| GO:0051122 | 0.006 | 25.9237 | 0.126 | 2 | 5 | hepoxilin biosynthetic process |
| GO:2000609 | 0.006 | 25.9237 | 0.126 | 2 | 5 | regulation of thyroid hormone generation |
| GO:0034097 | 0.0064 | 1.6593 | 20.8836 | 33 | 829 | response to cytokine |
| GO:0030949 | 0.007 | 8.9906 | 0.4031 | 3 | 16 | positive regulation of vascular endothelial growth factor receptor signaling pathway |
| GO:1902582 | 0.0079 | 1.4556 | 41.4145 | 57 | 1644 | single-organism intracellular transport |
| GO:0008535 | 0.0083 | 8.3478 | 0.4283 | 3 | 17 | respiratory chain complex IV assembly |
| GO:0019348 | 0.0089 | 19.4415 | 0.1511 | 2 | 6 | dolichol metabolic process |
| GO:0071462 | 0.0089 | 19.4415 | 0.1511 | 2 | 6 | cellular response to water stimulus |
| GO:0097211 | 0.0089 | 19.4415 | 0.1511 | 2 | 6 | cellular response to gonadotropin-releasing hormone |
| GO:0070167 | 0.0095 | 3.5567 | 1.8138 | 6 | 72 | regulation of biomineral tissue development |
| GOMFID | Pvalue | OddsRatio | ExpCount | Count | Size | Term |
| GO:0043241 | 1e-04 | 2.9751 | 6.902 | 19 | 304 | protein complex disassembly |
| GO:0005980 | 2e-04 | 10.9003 | 0.5676 | 5 | 25 | glycogen catabolic process |
| GO:0006414 | 2e-04 | 3.2958 | 4.5862 | 14 | 202 | translational elongation |
| GO:0006413 | 3e-04 | 2.9576 | 5.8122 | 16 | 256 | translational initiation |
| GO:0071345 | 3e-04 | 2.0603 | 16.6421 | 32 | 733 | cellular response to cytokine stimulus |
| GO:0019083 | 3e-04 | 3.3193 | 4.223 | 13 | 186 | viral transcription |
| GO:0021762 | 3e-04 | 7.28 | 0.9536 | 6 | 42 | substantia nigra development |
| GO:0000272 | 4e-04 | 9.4767 | 0.6357 | 5 | 28 | polysaccharide catabolic process |
| GO:0002576 | 5e-04 | 4.8027 | 1.839 | 8 | 81 | platelet degranulation |
| GO:0071506 | 5e-04 | Inf | 0.0454 | 2 | 2 | cellular response to mycophenolic acid |
| GO:0006415 | 6e-04 | 3.3061 | 3.9051 | 12 | 172 | translational termination |
| GO:0016259 | 6e-04 | 4.6122 | 1.9071 | 8 | 84 | selenocysteine metabolic process |
| GO:0061077 | 8e-04 | 6.0921 | 1.1125 | 6 | 49 | chaperone-mediated protein folding |
| GO:0044033 | 9e-04 | 2.9559 | 4.6997 | 13 | 207 | multi-organism metabolic process |
| GO:0006605 | 0.0014 | 1.9586 | 15.1663 | 28 | 668 | protein targeting |
| GO:0086064 | 0.0014 | 9.6629 | 0.4995 | 4 | 22 | cell communication by electrical coupling involved in cardiac conduction |
| GO:1903799 | 0.0015 | 86.5706 | 0.0681 | 2 | 3 | negative regulation of production of miRNAs involved in gene silencing by miRNA |
| GO:0002682 | 0.0016 | 1.6322 | 33.4885 | 51 | 1475 | regulation of immune system process |
| GO:0016032 | 0.0016 | 1.8719 | 17.573 | 31 | 774 | viral process |
| GO:0046849 | 0.0017 | 4.4344 | 1.7255 | 7 | 76 | bone remodeling |
| GO:0009058 | 0.0017 | 1.3815 | 134.7487 | 162 | 5935 | biosynthetic process |
| GO:0044419 | 0.0017 | 1.8416 | 18.4357 | 32 | 812 | interspecies interaction between organisms |
| GO:0006595 | 0.0019 | 4.3089 | 1.7709 | 7 | 78 | polyamine metabolic process |
| GO:0046209 | 0.0021 | 4.2488 | 1.7936 | 7 | 79 | nitric oxide metabolic process |
| GO:0006614 | 0.0022 | 3.7246 | 2.3158 | 8 | 102 | SRP-dependent cotranslational protein targeting to membrane |
| GO:0051412 | 0.0023 | 8.2808 | 0.5676 | 4 | 25 | response to corticosterone |
| GO:0050778 | 0.0023 | 1.9301 | 14.2355 | 26 | 627 | positive regulation of immune response |
| GO:0032570 | 0.0025 | 5.8855 | 0.9536 | 5 | 42 | response to progesterone |
| GO:1903649 | 0.0026 | 2.1174 | 9.9671 | 20 | 439 | regulation of cytoplasmic transport |
| GO:0090150 | 0.0027 | 2.2645 | 7.9237 | 17 | 349 | establishment of protein localization to membrane |
| GO:0019372 | 0.0028 | 13.0147 | 0.2952 | 3 | 13 | lipoxygenase pathway |
| GO:0051969 | 0.0028 | 13.0147 | 0.2952 | 3 | 13 | regulation of transmission of nerve impulse |
| GO:0003104 | 0.003 | 43.2825 | 0.0908 | 2 | 4 | positive regulation of glomerular filtration |
| GO:0070920 | 0.003 | 43.2825 | 0.0908 | 2 | 4 | regulation of production of small RNA involved in gene silencing by RNA |
| GO:0090261 | 0.003 | 43.2825 | 0.0908 | 2 | 4 | positive regulation of inclusion body assembly |
| GO:0002714 | 0.003 | 7.5598 | 0.613 | 4 | 27 | positive regulation of B cell mediated immunity |
| GO:0072599 | 0.0036 | 3.4307 | 2.4974 | 8 | 110 | establishment of protein localization to endoplasmic reticulum |
| GO:0001959 | 0.0037 | 3.1284 | 3.0651 | 9 | 135 | regulation of cytokine-mediated signaling pathway |
| GO:0009059 | 0.0038 | 1.3561 | 111.1138 | 135 | 4894 | macromolecule biosynthetic process |
| GO:0031349 | 0.0039 | 2.0769 | 9.6265 | 19 | 424 | positive regulation of defense response |
| GO:1901564 | 0.0039 | 1.4778 | 47.9283 | 66 | 2111 | organonitrogen compound metabolic process |
| GO:1902580 | 0.0041 | 1.6151 | 27.5628 | 42 | 1214 | single-organism cellular localization |
| GO:0009199 | 0.0042 | 2.5601 | 4.9495 | 12 | 218 | ribonucleoside triphosphate metabolic process |
| GO:0045723 | 0.0043 | 10.8442 | 0.3406 | 3 | 15 | positive regulation of fatty acid biosynthetic process |
| GO:0000184 | 0.0045 | 3.3004 | 2.5883 | 8 | 114 | nuclear-transcribed mRNA catabolic process, nonsense-mediated decay |
| GO:0045732 | 0.0045 | 2.4336 | 5.6306 | 13 | 248 | positive regulation of protein catabolic process |
| GO:0019320 | 0.0045 | 5.0623 | 1.0898 | 5 | 48 | hexose catabolic process |
| GO:0032651 | 0.0045 | 5.0623 | 1.0898 | 5 | 48 | regulation of interleukin-1 beta production |
| GO:0044283 | 0.0046 | 1.9329 | 11.9651 | 22 | 527 | small molecule biosynthetic process |
| GO:0032612 | 0.0047 | 4.1527 | 1.5666 | 6 | 69 | interleukin-1 production |
| GO:0002361 | 0.0049 | 28.8531 | 0.1135 | 2 | 5 | CD4-positive, CD25-positive, alpha-beta regulatory T cell differentiation |
| GO:0010936 | 0.0049 | 28.8531 | 0.1135 | 2 | 5 | negative regulation of macrophage cytokine production |
| GO:0030644 | 0.0049 | 28.8531 | 0.1135 | 2 | 5 | cellular chloride ion homeostasis |
| GO:0050713 | 0.0049 | 28.8531 | 0.1135 | 2 | 5 | negative regulation of interleukin-1 beta secretion |
| GO:0051343 | 0.0049 | 28.8531 | 0.1135 | 2 | 5 | positive regulation of cyclic-nucleotide phosphodiesterase activity |
| GO:0072126 | 0.0049 | 28.8531 | 0.1135 | 2 | 5 | positive regulation of glomerular mesangial cell proliferation |
| GO:0072223 | 0.0049 | 28.8531 | 0.1135 | 2 | 5 | metanephric glomerular mesangium development |
| GO:1901029 | 0.0049 | 28.8531 | 0.1135 | 2 | 5 | negative regulation of mitochondrial outer membrane permeabilization involved in apoptotic signaling pathway |
| GO:0043043 | 0.0052 | 1.8312 | 14.349 | 25 | 632 | peptide biosynthetic process |
| GO:0006004 | 0.0052 | 10.0094 | 0.3633 | 3 | 16 | fucose metabolic process |
| GO:0045830 | 0.0052 | 10.0094 | 0.3633 | 3 | 16 | positive regulation of isotype switching |
| GO:0044275 | 0.0054 | 4.0244 | 1.612 | 6 | 71 | cellular carbohydrate catabolic process |
| GO:0042306 | 0.0055 | 2.7392 | 3.8597 | 10 | 170 | regulation of protein import into nucleus |
| GO:0007179 | 0.0057 | 2.5809 | 4.4954 | 11 | 198 | transforming growth factor beta receptor signaling pathway |
| GO:0045124 | 0.0057 | 6.2078 | 0.7265 | 4 | 32 | regulation of bone resorption |
| GO:0050704 | 0.0057 | 6.2078 | 0.7265 | 4 | 32 | regulation of interleukin-1 secretion |
| GO:0046034 | 0.0059 | 2.567 | 4.5181 | 11 | 199 | ATP metabolic process |
| GO:0038095 | 0.0061 | 2.2569 | 6.5161 | 14 | 287 | Fc-epsilon receptor signaling pathway |
| GO:0022411 | 0.0063 | 1.7391 | 16.9145 | 28 | 745 | cellular component disassembly |
| GO:0009126 | 0.0067 | 2.406 | 5.2446 | 12 | 231 | purine nucleoside monophosphate metabolic process |
| GO:0001775 | 0.0068 | 1.653 | 21.0013 | 33 | 925 | cell activation |
| GO:0046456 | 0.0069 | 4.5335 | 1.2033 | 5 | 53 | icosanoid biosynthetic process |
| GO:0002700 | 0.0069 | 3.3575 | 2.225 | 7 | 98 | regulation of production of molecular mediator of immune response |
| GO:0006091 | 0.0069 | 1.9575 | 10.1714 | 19 | 448 | generation of precursor metabolites and energy |
| GO:0006693 | 0.0071 | 5.7932 | 0.7719 | 4 | 34 | prostaglandin metabolic process |
| GO:0009146 | 0.0073 | 21.6384 | 0.1362 | 2 | 6 | purine nucleoside triphosphate catabolic process |
| GO:0030309 | 0.0073 | 21.6384 | 0.1362 | 2 | 6 | poly-N-acetyllactosamine metabolic process |
| GO:0042997 | 0.0073 | 21.6384 | 0.1362 | 2 | 6 | negative regulation of Golgi to plasma membrane protein transport |
| GO:0043410 | 0.0074 | 1.821 | 13.2365 | 23 | 583 | positive regulation of MAPK cascade |
| GO:1901575 | 0.0076 | 1.4712 | 39.6867 | 55 | 1748 | organic substance catabolic process |
| GO:0072594 | 0.0076 | 1.8715 | 11.7565 | 21 | 526 | establishment of protein localization to organelle |
| GO:1901568 | 0.0077 | 3.2849 | 2.2704 | 7 | 100 | fatty acid derivative metabolic process |
| GO:0030216 | 0.0081 | 2.9624 | 2.8607 | 8 | 126 | keratinocyte differentiation |
| GO:0006073 | 0.0086 | 3.6314 | 1.7709 | 6 | 78 | cellular glucan metabolic process |
| GO:0060395 | 0.0087 | 4.266 | 1.2714 | 5 | 56 | SMAD protein signal transduction |
| GO:0006839 | 0.0089 | 2.222 | 6.1301 | 13 | 270 | mitochondrial transport |
| GO:0070848 | 0.009 | 1.6309 | 20.5926 | 32 | 907 | response to growth factor |
| GO:0009161 | 0.0092 | 2.2994 | 5.4717 | 12 | 241 | ribonucleoside monophosphate metabolic process |
| GO:0046890 | 0.0092 | 2.8884 | 2.9288 | 8 | 129 | regulation of lipid biosynthetic process |
| GO:0061024 | 0.0093 | 1.581 | 23.9301 | 36 | 1054 | membrane organization |
| GO:0032768 | 0.0094 | 4.1837 | 1.2941 | 5 | 57 | regulation of monooxygenase activity |
| GO:0001932 | 0.0095 | 1.5124 | 30.6732 | 44 | 1351 | regulation of protein phosphorylation |
| GO:0009144 | 0.0095 | 2.3882 | 4.8332 | 11 | 214 | purine nucleoside triphosphate metabolic process |
| GO:0015031 | 0.0097 | 1.45 | 40.1862 | 55 | 1770 | protein transport |
| GO:1903035 | 0.0097 | 2.6596 | 3.5645 | 9 | 157 | negative regulation of response to wounding |
| GO:1901360 | 0.0098 | 1.2979 | 129.3906 | 151 | 5699 | organic cyclic compound metabolic process |
| GO:0044271 | 0.0099 | 1.3123 | 103.5079 | 124 | 4559 | cellular nitrogen compound biosynthetic process |
| GOMFID | Pvalue | OddsRatio | ExpCount | Count | Size | Term |
| GO:0007186 | 1e-04 | 2.1088 | 18.7079 | 36 | 1131 | G-protein coupled receptor signaling pathway |
| GO:0017144 | 3e-04 | 9.9399 | 0.5871 | 5 | 35 | drug metabolic process |
| GO:0050911 | 4e-04 | 2.805 | 6.1054 | 16 | 364 | detection of chemical stimulus involved in sensory perception of smell |
| GO:0007214 | 4e-04 | 13.2124 | 0.369 | 4 | 22 | gamma-aminobutyric acid signaling pathway |
| GO:0009593 | 5e-04 | 2.5792 | 7.464 | 18 | 445 | detection of chemical stimulus |
| GO:0005989 | 8e-04 | 118.1303 | 0.0503 | 2 | 3 | lactose biosynthetic process |
| GO:0006069 | 9e-04 | 19.7538 | 0.2013 | 3 | 12 | ethanol oxidation |
| GO:0043129 | 9e-04 | 19.7538 | 0.2013 | 3 | 12 | surfactant homeostasis |
| GO:0006805 | 0.0012 | 3.4426 | 3.103 | 10 | 185 | xenobiotic metabolic process |
| GO:0051935 | 0.0016 | 59.0613 | 0.0671 | 2 | 4 | glutamate reuptake |
| GO:1903361 | 0.0016 | 59.0613 | 0.0671 | 2 | 4 | protein localization to basolateral plasma membrane |
| GO:0009410 | 0.0017 | 3.2544 | 3.2707 | 10 | 195 | response to xenobiotic stimulus |
| GO:0007606 | 0.0019 | 2.3468 | 7.682 | 17 | 458 | sensory perception of chemical stimulus |
| GO:0050906 | 0.0019 | 2.3468 | 7.682 | 17 | 458 | detection of stimulus involved in sensory perception |
| GO:0006072 | 0.0027 | 39.3716 | 0.0839 | 2 | 5 | glycerol-3-phosphate metabolic process |
| GO:1903802 | 0.0027 | 39.3716 | 0.0839 | 2 | 5 | L-glutamate(1-) import into cell |
| GO:0019373 | 0.0032 | 11.8477 | 0.3019 | 3 | 18 | epoxygenase P450 pathway |
| GO:1902837 | 0.004 | 29.5268 | 0.1006 | 2 | 6 | amino acid import into cell |
| GO:0033141 | 0.0043 | 10.4525 | 0.3355 | 3 | 20 | positive regulation of peptidyl-serine phosphorylation of STAT protein |
| GO:1903779 | 0.0047 | 4.9603 | 1.0902 | 5 | 65 | regulation of cardiac conduction |
| GO:0001974 | 0.0053 | 6.2504 | 0.7045 | 4 | 42 | blood vessel remodeling |
| GO:0007586 | 0.0054 | 3.1717 | 2.6669 | 8 | 159 | digestion |
| GO:1901890 | 0.0064 | 8.8829 | 0.3858 | 3 | 23 | positive regulation of cell junction assembly |
| GO:0043330 | 0.0073 | 5.6536 | 0.7716 | 4 | 46 | response to exogenous dsRNA |
| GO:0005984 | 0.0073 | 19.682 | 0.1342 | 2 | 8 | disaccharide metabolic process |
| GO:0071420 | 0.0073 | 19.682 | 0.1342 | 2 | 8 | cellular response to histamine |
| GO:2000352 | 0.0091 | 7.7227 | 0.4361 | 3 | 26 | negative regulation of endothelial cell apoptotic process |
| GO:0097267 | 0.0093 | 16.8692 | 0.151 | 2 | 9 | omega-hydroxylase P450 pathway |
| GOMFID | Pvalue | OddsRatio | ExpCount | Count | Size | Term |
| GO:0003735 | 1e-04 | 3.5627 | 4.5877 | 15 | 195 | structural constituent of ribosome |
| GO:0032394 | 6e-04 | Inf | 0.0471 | 2 | 2 | MHC class Ib receptor activity |
| GO:0042288 | 7e-04 | 11.9774 | 0.4235 | 4 | 18 | MHC class I protein binding |
| GO:0000295 | 0.0032 | 41.7255 | 0.0941 | 2 | 4 | adenine nucleotide transmembrane transporter activity |
| GO:0005346 | 0.0032 | 41.7255 | 0.0941 | 2 | 4 | purine ribonucleotide transmembrane transporter activity |
| GO:0015215 | 0.0048 | 10.453 | 0.3529 | 3 | 15 | nucleotide transmembrane transporter activity |
| GO:0003723 | 0.0069 | 1.5043 | 35.172 | 50 | 1495 | RNA binding |
| GOMFID | Pvalue | OddsRatio | ExpCount | Count | Size | Term |
| GO:0046979 | 0.0014 | 89.9532 | 0.0656 | 2 | 3 | TAP2 binding |
| GO:0046982 | 0.0021 | 2.1621 | 9.7773 | 20 | 447 | protein heterodimerization activity |
| GO:0003723 | 0.0022 | 2.3169 | 7.7742 | 17 | 371 | RNA binding |
| GO:0004540 | 0.0023 | 4.1835 | 1.8155 | 7 | 83 | ribonuclease activity |
| GO:0008097 | 0.0028 | 44.9737 | 0.0875 | 2 | 4 | 5S rRNA binding |
| GO:0046978 | 0.0028 | 44.9737 | 0.0875 | 2 | 4 | TAP1 binding |
| GO:0098518 | 0.0028 | 44.9737 | 0.0875 | 2 | 4 | polynucleotide phosphatase activity |
| GO:0005159 | 0.0039 | 11.2691 | 0.3281 | 3 | 15 | insulin-like growth factor receptor binding |
| GO:0001537 | 0.0046 | 29.9805 | 0.1094 | 2 | 5 | N-acetylgalactosamine 4-O-sulfotransferase activity |
| GO:0044822 | 0.0049 | 1.6348 | 24.5855 | 38 | 1124 | poly(A) RNA binding |
| GO:0061133 | 0.0068 | 22.4839 | 0.1312 | 2 | 6 | endopeptidase activator activity |
| GO:0001228 | 0.0092 | 2.1402 | 6.8463 | 14 | 313 | transcriptional activator activity, RNA polymerase II transcription regulatory region sequence-specific binding |
| GO:0004523 | 0.0093 | 17.986 | 0.1531 | 2 | 7 | RNA-DNA hybrid ribonuclease activity |
| GOMFID | Pvalue | OddsRatio | ExpCount | Count | Size | Term |
| GO:0003676 | 5e-04 | 1.4787 | 87.1179 | 115 | 3693 | nucleic acid binding |
| GO:0003700 | 0.0011 | 1.7346 | 26.468 | 43 | 1122 | transcription factor activity, sequence-specific DNA binding |
| GO:0000983 | 0.0031 | 12.5103 | 0.3067 | 3 | 13 | transcription factor activity, RNA polymerase II core promoter sequence-specific |
| GO:0016860 | 0.0053 | 4.865 | 1.1323 | 5 | 48 | intramolecular oxidoreductase activity |
| GO:0043565 | 0.0067 | 1.6187 | 23.4013 | 36 | 992 | sequence-specific DNA binding |
| GO:0008134 | 0.009 | 1.8397 | 11.9365 | 21 | 506 | transcription factor binding |
| GOMFID | Pvalue | OddsRatio | ExpCount | Count | Size | Term |
| GO:0004938 | 0.0021 | 72.6983 | 0.0807 | 2 | 3 | alpha2-adrenergic receptor activity |
| GO:0003700 | 0.0028 | 1.6134 | 30.1778 | 46 | 1122 | transcription factor activity, sequence-specific DNA binding |
| GO:0003676 | 0.003 | 1.3636 | 99.3285 | 124 | 3693 | nucleic acid binding |
| GO:0004082 | 0.0042 | 36.3468 | 0.1076 | 2 | 4 | bisphosphoglycerate mutase activity |
| GO:0046538 | 0.0042 | 36.3468 | 0.1076 | 2 | 4 | 2,3-bisphosphoglycerate-dependent phosphoglycerate mutase activity |
| GO:0004083 | 0.0068 | 24.2296 | 0.1345 | 2 | 5 | bisphosphoglycerate 2-phosphatase activity |
| GO:0042809 | 0.0069 | 9.1024 | 0.4034 | 3 | 15 | vitamin D receptor binding |
| GO:1901338 | 0.0069 | 9.1024 | 0.4034 | 3 | 15 | catecholamine binding |
| GOMFID | Pvalue | OddsRatio | ExpCount | Count | Size | Term |
| GO:0016861 | 5e-04 | 27.6377 | 0.1714 | 3 | 8 | intramolecular oxidoreductase activity, interconverting aldoses and ketoses |
| GO:0030515 | 0.0018 | 8.7911 | 0.5357 | 4 | 25 | snoRNA binding |
| GO:0004735 | 0.0027 | 45.9343 | 0.0857 | 2 | 4 | pyrroline-5-carboxylate reductase activity |
| GO:0005149 | 0.0037 | 11.5105 | 0.3214 | 3 | 15 | interleukin-1 receptor binding |
| GO:0048487 | 0.0041 | 6.8348 | 0.6643 | 4 | 31 | beta-tubulin binding |
| GO:0003700 | 0.0059 | 1.6261 | 24.0423 | 37 | 1122 | transcription factor activity, sequence-specific DNA binding |
| GO:0003910 | 0.0065 | 22.9642 | 0.1286 | 2 | 6 | DNA ligase (ATP) activity |
| GOMFID | Pvalue | OddsRatio | ExpCount | Count | Size | Term |
| GO:0003735 | 2e-04 | 3.3749 | 4.4885 | 14 | 195 | structural constituent of ribosome |
| GO:0003676 | 0.002 | 1.4162 | 85.0045 | 109 | 3693 | nucleic acid binding |
| GOMFID | Pvalue | OddsRatio | ExpCount | Count | Size | Term |
| GO:0003676 | 0 | 1.6385 | 104.9641 | 148 | 3693 | nucleic acid binding |
| GO:0043565 | 1e-04 | 2.6016 | 9.1073 | 22 | 329 | sequence-specific DNA binding |
| GO:0003735 | 1e-04 | 3.1318 | 5.5424 | 16 | 195 | structural constituent of ribosome |
| GO:0000981 | 0.001 | 1.9231 | 17.0819 | 31 | 601 | RNA polymerase II transcription factor activity, sequence-specific DNA binding |
| GO:0002060 | 0.0024 | 68.6697 | 0.0853 | 2 | 3 | purine nucleobase binding |
| GO:0043295 | 0.0032 | 12.8986 | 0.3126 | 3 | 11 | glutathione binding |
| GO:0097027 | 0.0076 | 22.8869 | 0.1421 | 2 | 5 | ubiquitin-protein transferase activator activity |
| GO:0005243 | 0.008 | 8.5968 | 0.4263 | 3 | 15 | gap junction channel activity |
| GO:0010181 | 0.008 | 8.5968 | 0.4263 | 3 | 15 | FMN binding |
| GO:1990837 | 0.0083 | 1.6647 | 18.8441 | 30 | 663 | sequence-specific double-stranded DNA binding |
| GO:0003700 | 0.0097 | 1.7509 | 14.3287 | 24 | 521 | transcription factor activity, sequence-specific DNA binding |
| GOMFID | Pvalue | OddsRatio | ExpCount | Count | Size | Term |
| GO:0004452 | 5e-04 | Inf | 0.0429 | 2 | 2 | isopentenyl-diphosphate delta-isomerase activity |
| GO:0016918 | 0.003 | 12.5577 | 0.3 | 3 | 14 | retinal binding |
| GO:0004046 | 0.0044 | 30.6209 | 0.1071 | 2 | 5 | aminoacylase activity |
| GO:0004977 | 0.0065 | 22.9642 | 0.1286 | 2 | 6 | melanocortin receptor activity |
| GO:0042813 | 0.0085 | 8.1224 | 0.4286 | 3 | 20 | Wnt-activated receptor activity |
| GO:1901677 | 0.0085 | 8.1224 | 0.4286 | 3 | 20 | phosphate transmembrane transporter activity |
| GO:0004032 | 0.009 | 18.3701 | 0.15 | 2 | 7 | alditol:NADP+ 1-oxidoreductase activity |
| GO:0016714 | 0.009 | 18.3701 | 0.15 | 2 | 7 | oxidoreductase activity, acting on paired donors, with incorporation or reduction of molecular oxygen, reduced pteridine as one donor, and incorporation of one atom of oxygen |
| GOMFID | Pvalue | OddsRatio | ExpCount | Count | Size | Term |
| GO:0003676 | 3e-04 | 1.4761 | 94.8669 | 125 | 3693 | nucleic acid binding |
| GO:0004090 | 0.0038 | 38.1119 | 0.1028 | 2 | 4 | carbonyl reductase (NADPH) activity |
| GO:0097027 | 0.0063 | 25.4063 | 0.1284 | 2 | 5 | ubiquitin-protein transferase activator activity |
| GOMFID | Pvalue | OddsRatio | ExpCount | Count | Size | Term |
| GO:0001222 | 6e-04 | 26.7374 | 0.177 | 3 | 8 | transcription corepressor binding |
| GO:0003735 | 0.0014 | 2.9657 | 4.3149 | 12 | 195 | structural constituent of ribosome |
| GO:0004090 | 0.0028 | 44.4422 | 0.0885 | 2 | 4 | carbonyl reductase (NADPH) activity |
| GO:0003676 | 0.0066 | 1.3611 | 81.717 | 102 | 3693 | nucleic acid binding |
| GO:0008821 | 0.0069 | 22.2182 | 0.1328 | 2 | 6 | crossover junction endodeoxyribonuclease activity |
| GO:0017108 | 0.0069 | 22.2182 | 0.1328 | 2 | 6 | 5'-flap endonuclease activity |
| GO:0003924 | 0.0072 | 2.4899 | 4.6468 | 11 | 210 | GTPase activity |
| GO:0016788 | 0.0078 | 1.7652 | 14.8476 | 25 | 671 | hydrolase activity, acting on ester bonds |
| GO:0016894 | 0.008 | 8.3495 | 0.4204 | 3 | 19 | endonuclease activity, active with either ribo- or deoxyribonucleic acids and producing 3'-phosphomonoesters |
| GOMFID | Pvalue | OddsRatio | ExpCount | Count | Size | Term |
| GO:0004930 | 0 | 2.666 | 14.5676 | 35 | 774 | G-protein coupled receptor activity |
| GO:0004984 | 0 | 3.3591 | 6.8509 | 21 | 364 | olfactory receptor activity |
| GO:0099600 | 0 | 2.1974 | 22.7548 | 45 | 1209 | transmembrane receptor activity |
| GO:0038023 | 0 | 2.151 | 23.7523 | 46 | 1262 | signaling receptor activity |
| GO:0060089 | 0 | 2.0117 | 28.1941 | 51 | 1498 | molecular transducer activity |
| GO:0032810 | 4e-04 | Inf | 0.0376 | 2 | 2 | sterol response element binding |
| GO:0030943 | 0.001 | 104.966 | 0.0565 | 2 | 3 | mitochondrion targeting sequence binding |
| GO:0005126 | 0.0016 | 2.7669 | 4.9876 | 13 | 265 | cytokine receptor binding |
| GO:0030246 | 0.0019 | 2.7122 | 5.0817 | 13 | 270 | carbohydrate binding |
| GO:0008320 | 0.0044 | 10.5229 | 0.3388 | 3 | 18 | protein transmembrane transporter activity |
| GO:0005549 | 0.0047 | 4.1256 | 1.5622 | 6 | 83 | odorant binding |
| GO:0019957 | 0.007 | 20.9878 | 0.1317 | 2 | 7 | C-C chemokine binding |
| GOMFID | Pvalue | OddsRatio | ExpCount | Count | Size | Term |
| GO:0050656 | 3e-04 | 39.8338 | 0.148 | 3 | 6 | 3'-phosphoadenosine 5'-phosphosulfate binding |
| GO:0003735 | 4e-04 | 3.1349 | 4.8108 | 14 | 195 | structural constituent of ribosome |
| GO:0004860 | 0.0011 | 4.228 | 2.0724 | 8 | 84 | protein kinase inhibitor activity |
| GO:0019207 | 0.0016 | 2.9171 | 4.3914 | 12 | 178 | kinase regulator activity |
| GO:0050698 | 0.0018 | 79.4715 | 0.074 | 2 | 3 | proteoglycan sulfotransferase activity |
| GO:0051120 | 0.0018 | 79.4715 | 0.074 | 2 | 3 | hepoxilin A3 synthase activity |
| GO:0000213 | 0.0035 | 39.7332 | 0.0987 | 2 | 4 | tRNA-intron endonuclease activity |
| GO:0001733 | 0.0035 | 39.7332 | 0.0987 | 2 | 4 | galactosylceramide sulfotransferase activity |
| GO:0016426 | 0.0035 | 39.7332 | 0.0987 | 2 | 4 | tRNA (adenine) methyltransferase activity |
| GO:0015605 | 0.0066 | 9.1864 | 0.3947 | 3 | 16 | organophosphate ester transmembrane transporter activity |
| GO:0016836 | 0.007 | 4.538 | 1.2089 | 5 | 49 | hydro-lyase activity |
| GO:0019843 | 0.007 | 4.538 | 1.2089 | 5 | 49 | rRNA binding |
| GO:0051082 | 0.0086 | 3.2209 | 2.3191 | 7 | 94 | unfolded protein binding |
| GOMFID | Pvalue | OddsRatio | ExpCount | Count | Size | Term |
| GO:0031800 | 0.0016 | 85.3556 | 0.0691 | 2 | 3 | type 3 metabotropic glutamate receptor binding |
| GO:0031997 | 0.0016 | 85.3556 | 0.0691 | 2 | 3 | N-terminal myristoylation domain binding |
| GO:0051787 | 0.0023 | 14.2581 | 0.2762 | 3 | 12 | misfolded protein binding |
| GO:0004634 | 0.0031 | 42.675 | 0.0921 | 2 | 4 | phosphopyruvate hydratase activity |
| GO:0003735 | 0.0056 | 2.5856 | 4.4885 | 11 | 195 | structural constituent of ribosome |
| GO:0050998 | 0.0076 | 8.5515 | 0.4143 | 3 | 18 | nitric-oxide synthase binding |
| GOMFID | Pvalue | OddsRatio | ExpCount | Count | Size | Term |
| GO:0003735 | 3e-04 | 3.1784 | 4.7488 | 14 | 195 | structural constituent of ribosome |
| GO:0019843 | 0.0012 | 5.6632 | 1.1933 | 6 | 49 | rRNA binding |
| GO:0015485 | 0.0019 | 6.3294 | 0.9011 | 5 | 37 | cholesterol binding |
| GO:0030246 | 0.0026 | 2.4119 | 6.5753 | 15 | 270 | carbohydrate binding |
| GO:0003676 | 0.005 | 1.3576 | 89.9357 | 112 | 3693 | nucleic acid binding |
| GO:0071253 | 0.0056 | 26.8434 | 0.1218 | 2 | 5 | connexin binding |
| GO:0015036 | 0.0058 | 6.218 | 0.7306 | 4 | 30 | disulfide oxidoreductase activity |
| GO:0051082 | 0.008 | 3.2648 | 2.2892 | 7 | 94 | unfolded protein binding |
| GO:0008517 | 0.0083 | 20.1312 | 0.1461 | 2 | 6 | folic acid transporter activity |
| GO:0050750 | 0.0089 | 8.0679 | 0.4384 | 3 | 18 | low-density lipoprotein particle receptor binding |
| GOMFID | Pvalue | OddsRatio | ExpCount | Count | Size | Term |
| GO:0004024 | 0 | 189.5265 | 0.0631 | 3 | 4 | alcohol dehydrogenase activity, zinc-dependent |
| GO:0004890 | 1e-04 | 21.1298 | 0.2523 | 4 | 16 | GABA-A receptor activity |
| GO:0099600 | 2e-04 | 2.071 | 19.0648 | 36 | 1209 | transmembrane receptor activity |
| GO:0060089 | 2e-04 | 1.9636 | 23.6221 | 42 | 1498 | molecular transducer activity |
| GO:0004984 | 2e-04 | 2.9986 | 5.7399 | 16 | 364 | olfactory receptor activity |
| GO:0038023 | 4e-04 | 1.9742 | 19.9006 | 36 | 1262 | signaling receptor activity |
| GO:0004930 | 5e-04 | 2.2047 | 12.2053 | 25 | 774 | G-protein coupled receptor activity |
| GO:0035276 | 7e-04 | 125.8374 | 0.0473 | 2 | 3 | ethanol binding |
| GO:0005132 | 0.0019 | 14.5677 | 0.2523 | 3 | 16 | type I interferon receptor binding |
| GO:0070330 | 0.0048 | 9.9635 | 0.3469 | 3 | 22 | aromatase activity |
| GO:0051117 | 0.0062 | 4.5953 | 1.1669 | 5 | 74 | ATPase binding |
| NA. |
| n/a |
| NA. |
| n/a |
| NA. |
| n/a |
| NA. |
| n/a |
| NA. |
| n/a |
| NA. |
| n/a |
| NA. |
| n/a |
| NA. |
| n/a |
| NA. |
| n/a |
| NA. |
| n/a |
| NA. |
| n/a |
| NA. |
| n/a |
| NA. |
| n/a |
| NA. |
| n/a |
| NA. |
| n/a |
| NA. |
| n/a |
| NA. |
| n/a |
| NA. |
| n/a |
| NA. |
| n/a |
| NA. |
| n/a |
| NA. |
| n/a |
| NA. |
| n/a |
| NA. |
| n/a |
| NA. |
| n/a |
| NA. |
| n/a |
| NA. |
| n/a |
| NA. |
| n/a |
| NA. |
| n/a |
| NA. |
| n/a |
| NA. |
| n/a |
| NA. |
| n/a |
| NA. |
| n/a |
| NA. |
| n/a |
| NA. |
| n/a |
| NA. |
| n/a |
| NA. |
| n/a |
| NA. |
| n/a |
| NA. |
| n/a |
| NA. |
| n/a |
| NA. |
| n/a |
| NA. |
| n/a |
| NA. |
| n/a |
| NA. |
| n/a |
| NA. |
| n/a |
| NA. |
| n/a |
| NA. |
| n/a |
| NA. |
| n/a |
| NA. |
| n/a |
| NA. |
| n/a |
| NA. |
| n/a |
| NA. |
| n/a |
| NA. |
| n/a |
| NA. |
| n/a |
| NA. |
| n/a |
| NA. |
| n/a |
| NA. |
| n/a |
| NA. |
| n/a |
| NA. |
| n/a |
| NA. |
| n/a |
| NA. |
| n/a |
| NA. |
| n/a |
| NA. |
| n/a |
| NA. |
| n/a |
| NA. |
| n/a |
| GOMFID | Pvalue | OddsRatio | ExpCount | Count | Size | Term |
| GO:0006549 | 2e-04 | 85.9753 | 0.1356 | 3 | 4 | isoleucine metabolic process |
| GO:0070294 | 2e-04 | 85.9753 | 0.1356 | 3 | 4 | renal sodium ion absorption |
| GO:0007030 | 3e-04 | 3.9309 | 3.1188 | 11 | 92 | Golgi organization |
| GO:0006103 | 3e-04 | 10.2653 | 0.6441 | 5 | 19 | 2-oxoglutarate metabolic process |
| GO:0000209 | 4e-04 | 2.6603 | 7.2886 | 18 | 215 | protein polyubiquitination |
| GO:0006620 | 7e-04 | 28.6546 | 0.2034 | 3 | 6 | posttranslational protein targeting to membrane |
| GO:0097531 | 7e-04 | 12.7545 | 0.4407 | 4 | 13 | mast cell migration |
| GO:0050930 | 0.001 | 11.4783 | 0.4746 | 4 | 14 | induction of positive chemotaxis |
| GO:0043490 | 0.0011 | Inf | 0.0678 | 2 | 2 | malate-aspartate shuttle |
| GO:0051892 | 0.0011 | Inf | 0.0678 | 2 | 2 | negative regulation of cardioblast differentiation |
| GO:0019530 | 0.0012 | 21.4896 | 0.2373 | 3 | 7 | taurine metabolic process |
| GO:1902582 | 0.0012 | 1.4961 | 55.5968 | 78 | 1640 | single-organism intracellular transport |
| GO:0006573 | 0.0019 | 17.1905 | 0.2712 | 3 | 8 | valine metabolic process |
| GO:0032446 | 0.002 | 1.6481 | 28.8154 | 45 | 850 | protein modification by small protein conjugation |
| GO:0061024 | 0.0025 | 1.5671 | 35.6972 | 53 | 1053 | membrane organization |
| GO:0034219 | 0.0027 | 8.1966 | 0.6102 | 4 | 18 | carbohydrate transmembrane transport |
| GO:0015014 | 0.0034 | 57.2083 | 0.1017 | 2 | 3 | heparan sulfate proteoglycan biosynthetic process, polysaccharide chain biosynthetic process |
| GO:0019065 | 0.0034 | 57.2083 | 0.1017 | 2 | 3 | receptor-mediated endocytosis of virus by host cell |
| GO:0033489 | 0.0034 | 57.2083 | 0.1017 | 2 | 3 | cholesterol biosynthetic process via desmosterol |
| GO:0033490 | 0.0034 | 57.2083 | 0.1017 | 2 | 3 | cholesterol biosynthetic process via lathosterol |
| GO:0044211 | 0.0034 | 57.2083 | 0.1017 | 2 | 3 | CTP salvage |
| GO:0072156 | 0.0034 | 57.2083 | 0.1017 | 2 | 3 | distal tubule morphogenesis |
| GO:0010939 | 0.0041 | 5.3182 | 1.0848 | 5 | 32 | regulation of necrotic cell death |
| GO:0033365 | 0.0046 | 1.585 | 28.4764 | 43 | 840 | protein localization to organelle |
| GO:0051641 | 0.0049 | 1.329 | 97.3283 | 121 | 2871 | cellular localization |
| GO:0043482 | 0.0052 | 10.7419 | 0.3729 | 3 | 11 | cellular pigment accumulation |
| GO:0050772 | 0.0058 | 3.5332 | 2.1696 | 7 | 64 | positive regulation of axonogenesis |
| GO:0032400 | 0.0059 | 6.3735 | 0.7458 | 4 | 22 | melanosome localization |
| GO:0010256 | 0.0061 | 1.8037 | 14.5261 | 25 | 435 | endomembrane system organization |
| GO:0045329 | 0.0066 | 28.6023 | 0.1356 | 2 | 4 | carnitine biosynthetic process |
| GO:0046449 | 0.0066 | 28.6023 | 0.1356 | 2 | 4 | creatinine metabolic process |
| GO:0070836 | 0.0066 | 28.6023 | 0.1356 | 2 | 4 | caveola assembly |
| GO:1903361 | 0.0066 | 28.6023 | 0.1356 | 2 | 4 | protein localization to basolateral plasma membrane |
| GO:0048814 | 0.0068 | 3.413 | 2.2374 | 7 | 66 | regulation of dendrite morphogenesis |
| GO:0006040 | 0.0069 | 4.6307 | 1.2204 | 5 | 36 | amino sugar metabolic process |
| GO:0046794 | 0.0069 | 4.6307 | 1.2204 | 5 | 36 | transport of virus |
| GO:0043161 | 0.0076 | 1.8417 | 12.5093 | 22 | 369 | proteasome-mediated ubiquitin-dependent protein catabolic process |
| GO:1902579 | 0.0078 | 4.4857 | 1.2543 | 5 | 37 | multi-organism localization |
| GO:0033036 | 0.0085 | 1.3116 | 89.8024 | 111 | 2649 | macromolecule localization |
| GO:0043473 | 0.0087 | 2.9524 | 2.9154 | 8 | 86 | pigmentation |
| GO:0051603 | 0.0091 | 1.6236 | 20.5776 | 32 | 607 | proteolysis involved in cellular protein catabolic process |
| GO:0006457 | 0.0092 | 2.0859 | 7.5598 | 15 | 223 | protein folding |
| GO:0050926 | 0.0094 | 5.4619 | 0.8475 | 4 | 25 | regulation of positive chemotaxis |
| GO:0019068 | 0.0098 | 4.2213 | 1.3221 | 5 | 39 | virion assembly |
| GO:0071158 | 0.0099 | 2.8782 | 2.9832 | 8 | 88 | positive regulation of cell cycle arrest |
| GOMFID | Pvalue | OddsRatio | ExpCount | Count | Size | Term |
| GO:0002717 | 0.0022 | 8.5533 | 0.5668 | 4 | 21 | positive regulation of natural killer cell mediated immunity |
| GO:0046952 | 0.0042 | 36.2143 | 0.108 | 2 | 4 | ketone body catabolic process |
| GO:0000398 | 0.0055 | 2.2147 | 7.126 | 15 | 264 | mRNA splicing, via spliceosome |
| GO:0051457 | 0.0057 | 9.8943 | 0.3779 | 3 | 14 | maintenance of protein location in nucleus |
| GO:0000375 | 0.0063 | 2.1791 | 7.234 | 15 | 268 | RNA splicing, via transesterification reactions |
| GO:0071681 | 0.0069 | 24.1413 | 0.135 | 2 | 5 | cellular response to indole-3-methanol |
| GOMFID | Pvalue | OddsRatio | ExpCount | Count | Size | Term |
| GO:0044860 | 3e-04 | 45.7651 | 0.1596 | 3 | 5 | protein localization to plasma membrane raft |
| GO:0000917 | 0.001 | Inf | 0.0638 | 2 | 2 | barrier septum assembly |
| GO:0006529 | 0.001 | Inf | 0.0638 | 2 | 2 | asparagine biosynthetic process |
| GO:1902824 | 0.001 | Inf | 0.0638 | 2 | 2 | positive regulation of late endosome to lysosome transport |
| GO:0043603 | 0.0014 | 1.6773 | 29.045 | 46 | 910 | cellular amide metabolic process |
| GO:0044091 | 0.002 | 6.3727 | 0.9256 | 5 | 29 | membrane biogenesis |
| GO:0042982 | 0.0024 | 6.1174 | 0.9575 | 5 | 30 | amyloid precursor protein metabolic process |
| GO:0009397 | 0.003 | 60.9014 | 0.0958 | 2 | 3 | folic acid-containing compound catabolic process |
| GO:0050893 | 0.003 | 60.9014 | 0.0958 | 2 | 3 | sensory processing |
| GO:0001765 | 0.0033 | 13.0714 | 0.3192 | 3 | 10 | membrane raft assembly |
| GO:0008306 | 0.0039 | 3.4087 | 2.5534 | 8 | 80 | associative learning |
| GO:0007040 | 0.0045 | 4.2715 | 1.564 | 6 | 49 | lysosome organization |
| GO:0042254 | 0.0048 | 2.2571 | 7.0219 | 15 | 220 | ribosome biogenesis |
| GO:0006749 | 0.005 | 4.1742 | 1.5959 | 6 | 50 | glutathione metabolic process |
| GO:1902991 | 0.0057 | 10.1653 | 0.383 | 3 | 12 | regulation of amyloid precursor protein catabolic process |
| GO:0045636 | 0.0058 | 30.4487 | 0.1277 | 2 | 4 | positive regulation of melanocyte differentiation |
| GO:0046952 | 0.0058 | 30.4487 | 0.1277 | 2 | 4 | ketone body catabolic process |
| GO:0070836 | 0.0058 | 30.4487 | 0.1277 | 2 | 4 | caveola assembly |
| GO:1903335 | 0.0058 | 30.4487 | 0.1277 | 2 | 4 | regulation of vacuolar transport |
| GO:1903361 | 0.0058 | 30.4487 | 0.1277 | 2 | 4 | protein localization to basolateral plasma membrane |
| GO:0001556 | 0.0066 | 6.1071 | 0.766 | 4 | 24 | oocyte maturation |
| GO:0045943 | 0.0073 | 9.1482 | 0.4149 | 3 | 13 | positive regulation of transcription from RNA polymerase I promoter |
| GO:0051569 | 0.0076 | 5.8159 | 0.7979 | 4 | 25 | regulation of histone H3-K4 methylation |
| GO:0016079 | 0.0079 | 3.747 | 1.7555 | 6 | 55 | synaptic vesicle exocytosis |
| GO:0061024 | 0.008 | 1.4964 | 33.6092 | 48 | 1053 | membrane organization |
| GO:0006413 | 0.0082 | 2.0559 | 8.1709 | 16 | 256 | translational initiation |
| GO:0032092 | 0.0086 | 3.2484 | 2.33 | 7 | 73 | positive regulation of protein binding |
| GO:0000188 | 0.0088 | 5.5511 | 0.8299 | 4 | 26 | inactivation of MAPK activity |
| GO:0045324 | 0.009 | 8.316 | 0.4468 | 3 | 14 | late endosome to vacuole transport |
| GO:0042940 | 0.0095 | 20.2978 | 0.1596 | 2 | 5 | D-amino acid transport |
| GO:0044857 | 0.0095 | 20.2978 | 0.1596 | 2 | 5 | plasma membrane raft organization |
| GO:1902004 | 0.0095 | 20.2978 | 0.1596 | 2 | 5 | positive regulation of beta-amyloid formation |
| GO:1902035 | 0.0095 | 20.2978 | 0.1596 | 2 | 5 | positive regulation of hematopoietic stem cell proliferation |
| GO:2000535 | 0.0095 | 20.2978 | 0.1596 | 2 | 5 | regulation of entry of bacterium into host cell |
| GOMFID | Pvalue | OddsRatio | ExpCount | Count | Size | Term |
| GO:0002673 | 2e-04 | 4.9477 | 2.0611 | 9 | 69 | regulation of acute inflammatory response |
| GO:0008154 | 2e-04 | 3.1727 | 5.1378 | 15 | 172 | actin polymerization or depolymerization |
| GO:0006446 | 6e-04 | 4.2381 | 2.3598 | 9 | 79 | regulation of translational initiation |
| GO:0034315 | 6e-04 | 13.0946 | 0.4182 | 4 | 14 | regulation of Arp2/3 complex-mediated actin nucleation |
| GO:0032618 | 9e-04 | Inf | 0.0597 | 2 | 2 | interleukin-15 production |
| GO:0006268 | 0.0013 | 19.606 | 0.239 | 3 | 8 | DNA unwinding involved in DNA replication |
| GO:0022618 | 0.0015 | 2.6786 | 5.5858 | 14 | 187 | ribonucleoprotein complex assembly |
| GO:1901137 | 0.0017 | 1.7104 | 25.3603 | 41 | 849 | carbohydrate derivative biosynthetic process |
| GO:0051447 | 0.0017 | 9.3508 | 0.5377 | 4 | 18 | negative regulation of meiotic cell cycle |
| GO:0030832 | 0.0019 | 2.8514 | 4.5105 | 12 | 151 | regulation of actin filament length |
| GO:0060124 | 0.0019 | 16.3373 | 0.2688 | 3 | 9 | positive regulation of growth hormone secretion |
| GO:0030833 | 0.0021 | 2.9748 | 3.9728 | 11 | 133 | regulation of actin filament polymerization |
| GO:0043543 | 0.0023 | 2.5446 | 5.8547 | 14 | 196 | protein acylation |
| GO:0044281 | 0.0024 | 1.4066 | 75.6926 | 99 | 2534 | small molecule metabolic process |
| GO:0006270 | 0.0024 | 6.0686 | 0.9559 | 5 | 32 | DNA replication initiation |
| GO:0018242 | 0.0026 | 65.2301 | 0.0896 | 2 | 3 | protein O-linked glycosylation via serine |
| GO:0019858 | 0.0026 | 65.2301 | 0.0896 | 2 | 3 | cytosine metabolic process |
| GO:0070634 | 0.0026 | 65.2301 | 0.0896 | 2 | 3 | transepithelial ammonium transport |
| GO:0018065 | 0.0027 | 14.0025 | 0.2987 | 3 | 10 | protein-cofactor linkage |
| GO:0032970 | 0.0037 | 2.1392 | 8.8716 | 18 | 297 | regulation of actin filament-based process |
| GO:0008360 | 0.0038 | 2.9151 | 3.6741 | 10 | 123 | regulation of cell shape |
| GO:0016574 | 0.0041 | 5.2842 | 1.0753 | 5 | 36 | histone ubiquitination |
| GO:0000727 | 0.0051 | 32.6129 | 0.1195 | 2 | 4 | double-strand break repair via break-induced replication |
| GO:0010693 | 0.0051 | 32.6129 | 0.1195 | 2 | 4 | negative regulation of alkaline phosphatase activity |
| GO:0018243 | 0.0051 | 32.6129 | 0.1195 | 2 | 4 | protein O-linked glycosylation via threonine |
| GO:0032100 | 0.0051 | 32.6129 | 0.1195 | 2 | 4 | positive regulation of appetite |
| GO:0010771 | 0.0053 | 2.9608 | 3.2559 | 9 | 109 | negative regulation of cell morphogenesis involved in differentiation |
| GO:0044711 | 0.0059 | 1.4301 | 50.2725 | 68 | 1683 | single-organism biosynthetic process |
| GO:0038096 | 0.0061 | 3.4818 | 2.1806 | 7 | 73 | Fc-gamma receptor signaling pathway involved in phagocytosis |
| GO:0032736 | 0.0061 | 9.7998 | 0.3883 | 3 | 13 | positive regulation of interleukin-13 production |
| GO:0032392 | 0.0069 | 3.8576 | 1.7026 | 6 | 57 | DNA geometric change |
| GO:0033120 | 0.007 | 5.9474 | 0.7766 | 4 | 26 | positive regulation of RNA splicing |
| GO:0043243 | 0.007 | 5.9474 | 0.7766 | 4 | 26 | positive regulation of protein complex disassembly |
| GO:0045069 | 0.007 | 3.3789 | 2.2403 | 7 | 75 | regulation of viral genome replication |
| GO:1902589 | 0.007 | 1.3518 | 74.8263 | 95 | 2505 | single-organism organelle organization |
| GO:1901566 | 0.0073 | 1.4671 | 39.4294 | 55 | 1320 | organonitrogen compound biosynthetic process |
| GO:0043966 | 0.0075 | 3.7832 | 1.7325 | 6 | 58 | histone H3 acetylation |
| GO:0072539 | 0.0075 | 8.9083 | 0.4182 | 3 | 14 | T-helper 17 cell differentiation |
| GO:0030705 | 0.0076 | 2.7921 | 3.4351 | 9 | 115 | cytoskeleton-dependent intracellular transport |
| GO:0045010 | 0.0078 | 5.721 | 0.8021 | 4 | 27 | actin nucleation |
| GO:0010970 | 0.008 | 2.9865 | 2.8676 | 8 | 96 | establishment of localization by movement along microtubule |
| GO:0051289 | 0.0081 | 3.7115 | 1.7624 | 6 | 59 | protein homotetramerization |
| GO:0018394 | 0.0082 | 22.0264 | 0.1475 | 2 | 5 | peptidyl-lysine acetylation |
| GO:0006771 | 0.0084 | 21.7405 | 0.1494 | 2 | 5 | riboflavin metabolic process |
| GO:0008078 | 0.0084 | 21.7405 | 0.1494 | 2 | 5 | mesodermal cell migration |
| GO:0051461 | 0.0084 | 21.7405 | 0.1494 | 2 | 5 | positive regulation of corticotropin secretion |
| GO:0060126 | 0.0084 | 21.7405 | 0.1494 | 2 | 5 | somatotropin secreting cell differentiation |
| GO:0060398 | 0.0084 | 21.7405 | 0.1494 | 2 | 5 | regulation of growth hormone receptor signaling pathway |
| GO:0090383 | 0.0084 | 21.7405 | 0.1494 | 2 | 5 | phagosome acidification |
| GO:2000343 | 0.0084 | 21.7405 | 0.1494 | 2 | 5 | positive regulation of chemokine (C-X-C motif) ligand 2 production |
| GO:0030730 | 0.0092 | 8.1654 | 0.4481 | 3 | 15 | sequestering of triglyceride |
| GO:0032012 | 0.0092 | 8.1654 | 0.4481 | 3 | 15 | regulation of ARF protein signal transduction |
| GO:0051127 | 0.0092 | 8.1654 | 0.4481 | 3 | 15 | positive regulation of actin nucleation |
| GO:0033043 | 0.0092 | 1.5091 | 30.528 | 44 | 1022 | regulation of organelle organization |
| GO:0016569 | 0.0096 | 1.8273 | 12.0081 | 21 | 402 | covalent chromatin modification |
| GO:0018393 | 0.0098 | 2.5116 | 4.2118 | 10 | 141 | internal peptidyl-lysine acetylation |
| GOMFID | Pvalue | OddsRatio | ExpCount | Count | Size | Term |
| GO:0070727 | 0 | 1.8511 | 46.4554 | 78 | 1464 | cellular macromolecule localization |
| GO:0098609 | 0 | 2.0205 | 27.3941 | 51 | 860 | cell-cell adhesion |
| GO:0008104 | 0 | 1.5849 | 73.6456 | 106 | 2312 | protein localization |
| GO:0030111 | 1e-04 | 2.6384 | 9.8428 | 24 | 309 | regulation of Wnt signaling pathway |
| GO:0033365 | 1e-04 | 1.9319 | 26.7571 | 48 | 840 | protein localization to organelle |
| GO:0098602 | 2e-04 | 1.8966 | 23.6673 | 42 | 743 | single organism cell adhesion |
| GO:0090263 | 3e-04 | 3.4114 | 4.1728 | 13 | 131 | positive regulation of canonical Wnt signaling pathway |
| GO:0009894 | 3e-04 | 1.9244 | 21.0553 | 38 | 661 | regulation of catabolic process |
| GO:0022610 | 4e-04 | 1.6163 | 44.4358 | 67 | 1395 | biological adhesion |
| GO:0098869 | 5e-04 | 4.3344 | 2.3253 | 9 | 73 | cellular oxidant detoxification |
| GO:2001241 | 6e-04 | 13.6095 | 0.4141 | 4 | 13 | positive regulation of extrinsic apoptotic signaling pathway in absence of ligand |
| GO:1903546 | 6e-04 | 30.5717 | 0.1911 | 3 | 6 | protein localization to photoreceptor outer segment |
| GO:0007030 | 7e-04 | 3.762 | 2.9305 | 10 | 92 | Golgi organization |
| GO:0048699 | 7e-04 | 1.5607 | 49.405 | 72 | 1551 | generation of neurons |
| GO:0044248 | 7e-04 | 1.5441 | 52.0489 | 75 | 1634 | cellular catabolic process |
| GO:0045216 | 7e-04 | 2.587 | 7.0397 | 17 | 221 | cell-cell junction organization |
| GO:0098754 | 9e-04 | 3.9613 | 2.5164 | 9 | 79 | detoxification |
| GO:0033043 | 9e-04 | 1.6644 | 32.5544 | 51 | 1022 | regulation of organelle organization |
| GO:1904591 | 0.001 | 3.5446 | 3.0898 | 10 | 97 | positive regulation of protein import |
| GO:0010769 | 0.0012 | 2.2225 | 10.0339 | 21 | 315 | regulation of cell morphogenesis involved in differentiation |
| GO:1900182 | 0.0014 | 3.1726 | 3.7587 | 11 | 118 | positive regulation of protein localization to nucleus |
| GO:0045599 | 0.0015 | 5.4168 | 1.2741 | 6 | 40 | negative regulation of fat cell differentiation |
| GO:0060371 | 0.0016 | 18.3406 | 0.2548 | 3 | 8 | regulation of atrial cardiac muscle cell membrane depolarization |
| GO:0090316 | 0.0017 | 2.3744 | 7.613 | 17 | 239 | positive regulation of intracellular protein transport |
| GO:1903729 | 0.0018 | 3.9062 | 2.2616 | 8 | 71 | regulation of plasma membrane organization |
| GO:0071158 | 0.0019 | 3.5079 | 2.8031 | 9 | 88 | positive regulation of cell cycle arrest |
| GO:0090090 | 0.0021 | 2.6961 | 5.1603 | 13 | 162 | negative regulation of canonical Wnt signaling pathway |
| GO:0042592 | 0.0024 | 1.4938 | 48.322 | 68 | 1517 | homeostatic process |
| GO:0046824 | 0.0025 | 3.1125 | 3.472 | 10 | 109 | positive regulation of nucleocytoplasmic transport |
| GO:0048667 | 0.0028 | 1.6682 | 25.2599 | 40 | 793 | cell morphogenesis involved in neuron differentiation |
| GO:0038034 | 0.0028 | 3.6178 | 2.4209 | 8 | 76 | signal transduction in absence of ligand |
| GO:0010899 | 0.003 | 61.0282 | 0.0956 | 2 | 3 | regulation of phosphatidylcholine catabolic process |
| GO:0033489 | 0.003 | 61.0282 | 0.0956 | 2 | 3 | cholesterol biosynthetic process via desmosterol |
| GO:0033490 | 0.003 | 61.0282 | 0.0956 | 2 | 3 | cholesterol biosynthetic process via lathosterol |
| GO:0061184 | 0.003 | 61.0282 | 0.0956 | 2 | 3 | positive regulation of dermatome development |
| GO:0086017 | 0.003 | 61.0282 | 0.0956 | 2 | 3 | Purkinje myocyte action potential |
| GO:0090296 | 0.003 | 61.0282 | 0.0956 | 2 | 3 | regulation of mitochondrial DNA replication |
| GO:0097694 | 0.003 | 61.0282 | 0.0956 | 2 | 3 | establishment of RNA localization to telomere |
| GO:0097695 | 0.003 | 61.0282 | 0.0956 | 2 | 3 | establishment of macromolecular complex localization to telomere |
| GO:0042306 | 0.003 | 2.5739 | 5.3833 | 13 | 169 | regulation of protein import into nucleus |
| GO:1903828 | 0.0031 | 2.8264 | 4.1728 | 11 | 131 | negative regulation of cellular protein localization |
| GO:0032446 | 0.0032 | 1.6333 | 27.0756 | 42 | 850 | protein modification by small protein conjugation |
| GO:1904951 | 0.0032 | 1.8538 | 15.3216 | 27 | 481 | positive regulation of establishment of protein localization |
| GO:0007411 | 0.0033 | 1.7911 | 17.6151 | 30 | 553 | axon guidance |
| GO:1903827 | 0.0034 | 2.0239 | 10.934 | 21 | 350 | regulation of cellular protein localization |
| GO:0018105 | 0.0039 | 2.2403 | 7.5493 | 16 | 237 | peptidyl-serine phosphorylation |
| GO:0090003 | 0.004 | 4.3827 | 1.529 | 6 | 48 | regulation of establishment of protein localization to plasma membrane |
| GO:0032990 | 0.0041 | 1.5446 | 34.0834 | 50 | 1070 | cell part morphogenesis |
| GO:1904375 | 0.0041 | 3.7715 | 2.0386 | 7 | 64 | regulation of protein localization to cell periphery |
| GO:0035413 | 0.0044 | 11.4606 | 0.3504 | 3 | 11 | positive regulation of catenin import into nucleus |
| GO:2000188 | 0.0044 | 11.4606 | 0.3504 | 3 | 11 | regulation of cholesterol homeostasis |
| GO:0032879 | 0.0044 | 1.3773 | 73.4864 | 95 | 2307 | regulation of localization |
| GO:2000027 | 0.0044 | 2.447 | 5.6381 | 13 | 177 | regulation of organ morphogenesis |
| GO:0044744 | 0.0048 | 2.1305 | 8.4094 | 17 | 264 | protein targeting to nucleus |
| GO:1902593 | 0.0048 | 2.1305 | 8.4094 | 17 | 264 | single-organism nuclear import |
| GO:0000902 | 0.0052 | 1.4605 | 44.7544 | 62 | 1405 | cell morphogenesis |
| GO:0050764 | 0.0058 | 3.5233 | 2.166 | 7 | 68 | regulation of phagocytosis |
| GO:0061669 | 0.0058 | 30.5121 | 0.1274 | 2 | 4 | spontaneous neurotransmitter secretion |
| GO:0070294 | 0.0058 | 30.5121 | 0.1274 | 2 | 4 | renal sodium ion absorption |
| GO:0097500 | 0.0058 | 30.5121 | 0.1274 | 2 | 4 | receptor localization to nonmotile primary cilium |
| GO:0100012 | 0.0058 | 30.5121 | 0.1274 | 2 | 4 | regulation of heart induction by canonical Wnt signaling pathway |
| GO:1900825 | 0.0058 | 30.5121 | 0.1274 | 2 | 4 | regulation of membrane depolarization during cardiac muscle cell action potential |
| GO:0048812 | 0.0059 | 1.5881 | 26.4067 | 40 | 829 | neuron projection morphogenesis |
| GO:0051053 | 0.0059 | 2.914 | 3.3128 | 9 | 104 | negative regulation of DNA metabolic process |
| GO:0030517 | 0.006 | 4.787 | 1.1786 | 5 | 37 | negative regulation of axon extension |
| GO:0070507 | 0.007 | 2.6533 | 4.0136 | 10 | 126 | regulation of microtubule cytoskeleton organization |
| GO:0016236 | 0.007 | 1.9189 | 10.9258 | 20 | 343 | macroautophagy |
| GO:0007088 | 0.0071 | 2.5099 | 4.6506 | 11 | 146 | regulation of mitotic nuclear division |
| GO:0048705 | 0.0072 | 2.2163 | 6.6574 | 14 | 209 | skeletal system morphogenesis |
| GO:0043388 | 0.0076 | 4.5048 | 1.2423 | 5 | 39 | positive regulation of DNA binding |
| GO:0030163 | 0.0078 | 1.5862 | 24.3999 | 37 | 766 | protein catabolic process |
| GO:0055085 | 0.0078 | 1.4454 | 42.1424 | 58 | 1323 | transmembrane transport |
| GO:0009201 | 0.0078 | 3.7549 | 1.752 | 6 | 55 | ribonucleoside triphosphate biosynthetic process |
| GO:0032386 | 0.0079 | 1.6716 | 18.7618 | 30 | 589 | regulation of intracellular transport |
| GO:0055092 | 0.0079 | 3.3056 | 2.2935 | 7 | 72 | sterol homeostasis |
| GO:0007159 | 0.0079 | 1.7612 | 14.8438 | 25 | 466 | leukocyte cell-cell adhesion |
| GO:0016055 | 0.0079 | 2.7713 | 3.4641 | 9 | 112 | Wnt signaling pathway |
| GO:0010506 | 0.0079 | 2.2653 | 6.0522 | 13 | 190 | regulation of autophagy |
| GO:0007264 | 0.0081 | 1.5444 | 27.7764 | 41 | 872 | small GTPase mediated signal transduction |
| GO:0051130 | 0.0083 | 1.4868 | 34.5294 | 49 | 1084 | positive regulation of cellular component organization |
| GO:0007169 | 0.0083 | 1.5346 | 28.6364 | 42 | 899 | transmembrane receptor protein tyrosine kinase signaling pathway |
| GO:0086010 | 0.0084 | 4.3758 | 1.2741 | 5 | 40 | membrane depolarization during action potential |
| GO:0006023 | 0.0085 | 2.7398 | 3.5039 | 9 | 110 | aminoglycan biosynthetic process |
| GO:0040011 | 0.0086 | 1.3831 | 56.381 | 74 | 1770 | locomotion |
| GO:1901575 | 0.0089 | 1.3832 | 55.5846 | 73 | 1745 | organic substance catabolic process |
| GO:0016265 | 0.0089 | 1.3675 | 60.936 | 79 | 1913 | death |
| GO:0003161 | 0.009 | 8.3333 | 0.446 | 3 | 14 | cardiac conduction system development |
| GO:0030213 | 0.009 | 8.3333 | 0.446 | 3 | 14 | hyaluronan biosynthetic process |
| GO:0007093 | 0.0091 | 2.3111 | 5.4788 | 12 | 172 | mitotic cell cycle checkpoint |
| GO:0034109 | 0.0091 | 1.7189 | 15.7994 | 26 | 496 | homotypic cell-cell adhesion |
| GO:0000209 | 0.0091 | 2.1493 | 6.8485 | 14 | 215 | protein polyubiquitination |
| GO:1902580 | 0.0092 | 1.517 | 29.6674 | 43 | 948 | single-organism cellular localization |
| GO:0000018 | 0.0093 | 3.6071 | 1.8157 | 6 | 57 | regulation of DNA recombination |
| GO:0002001 | 0.0095 | 20.3401 | 0.1593 | 2 | 5 | renin secretion into blood stream |
| GO:0003284 | 0.0095 | 20.3401 | 0.1593 | 2 | 5 | septum primum development |
| GO:0050847 | 0.0095 | 20.3401 | 0.1593 | 2 | 5 | progesterone receptor signaling pathway |
| GO:0072162 | 0.0095 | 20.3401 | 0.1593 | 2 | 5 | metanephric mesenchymal cell differentiation |
| GO:0086068 | 0.0095 | 20.3401 | 0.1593 | 2 | 5 | Purkinje myocyte to ventricular cardiac muscle cell communication |
| GO:2001268 | 0.0095 | 20.3401 | 0.1593 | 2 | 5 | negative regulation of cysteine-type endopeptidase activity involved in apoptotic signaling pathway |
| GO:0042692 | 0.0095 | 1.86 | 11.2443 | 20 | 353 | muscle cell differentiation |
| GO:0071456 | 0.0096 | 2.5218 | 4.2047 | 10 | 132 | cellular response to hypoxia |
| GO:0009156 | 0.0098 | 3.1591 | 2.389 | 7 | 75 | ribonucleoside monophosphate biosynthetic process |
| GO:0006935 | 0.0098 | 1.5409 | 26.4385 | 39 | 830 | chemotaxis |
| GO:0022607 | 0.0099 | 1.3318 | 73.8686 | 93 | 2319 | cellular component assembly |
| GO:0060306 | 0.01 | 5.3205 | 0.86 | 4 | 27 | regulation of membrane repolarization |
| GO:1900026 | 0.01 | 5.3205 | 0.86 | 4 | 27 | positive regulation of substrate adhesion-dependent cell spreading |
| GO:0012501 | 0.01 | 1.3695 | 57.6551 | 75 | 1810 | programmed cell death |
| GOMFID | Pvalue | OddsRatio | ExpCount | Count | Size | Term |
| GO:0006024 | 0.0016 | 3.3155 | 3.2699 | 10 | 109 | glycosaminoglycan biosynthetic process |
| GO:0007030 | 0.0017 | 3.5552 | 2.7599 | 9 | 92 | Golgi organization |
| GO:1901606 | 0.002 | 3.4711 | 2.8199 | 9 | 94 | alpha-amino acid catabolic process |
| GO:1901566 | 0.0021 | 1.5547 | 39.5983 | 58 | 1320 | organonitrogen compound biosynthetic process |
| GO:0006446 | 0.0025 | 3.6892 | 2.3699 | 8 | 79 | regulation of translational initiation |
| GO:0030887 | 0.0026 | 64.9422 | 0.09 | 2 | 3 | positive regulation of myeloid dendritic cell activation |
| GO:1904398 | 0.0026 | 64.9422 | 0.09 | 2 | 3 | positive regulation of neuromuscular junction development |
| GO:2000502 | 0.0026 | 64.9422 | 0.09 | 2 | 3 | negative regulation of natural killer cell chemotaxis |
| GO:0042446 | 0.003 | 4.0159 | 1.9199 | 7 | 64 | hormone biosynthetic process |
| GO:0009396 | 0.0037 | 12.1972 | 0.33 | 3 | 11 | folic acid-containing compound biosynthetic process |
| GO:0030204 | 0.0045 | 4.2593 | 1.5599 | 6 | 52 | chondroitin sulfate metabolic process |
| GO:0051790 | 0.0052 | 32.469 | 0.12 | 2 | 4 | short-chain fatty acid biosynthetic process |
| GO:0072592 | 0.0052 | 32.469 | 0.12 | 2 | 4 | oxygen metabolic process |
| GO:0001556 | 0.0053 | 6.514 | 0.72 | 4 | 24 | oocyte maturation |
| GO:0046395 | 0.0067 | 2.2344 | 6.5997 | 14 | 220 | carboxylic acid catabolic process |
| GO:0007224 | 0.0073 | 2.8062 | 3.4199 | 9 | 114 | smoothened signaling pathway |
| GO:0071025 | 0.0076 | 8.8689 | 0.42 | 3 | 14 | RNA surveillance |
| GO:0002439 | 0.0085 | 21.6445 | 0.15 | 2 | 5 | chronic inflammatory response to antigenic stimulus |
| GO:0008582 | 0.0085 | 21.6445 | 0.15 | 2 | 5 | regulation of synaptic growth at neuromuscular junction |
| GO:0015867 | 0.0085 | 21.6445 | 0.15 | 2 | 5 | ATP transport |
| GO:0072162 | 0.0085 | 21.6445 | 0.15 | 2 | 5 | metanephric mesenchymal cell differentiation |
| GO:2000064 | 0.0085 | 21.6445 | 0.15 | 2 | 5 | regulation of cortisol biosynthetic process |
| GO:1901264 | 0.009 | 4.2896 | 1.2899 | 5 | 43 | carbohydrate derivative transport |
| GOMFID | Pvalue | OddsRatio | ExpCount | Count | Size | Term |
| GO:0044249 | 0 | 1.8768 | 43.602 | 73 | 1199 | cellular biosynthetic process |
| GO:0035089 | 0 | 24.4878 | 0.3953 | 5 | 10 | establishment of apical/basal cell polarity |
| GO:0009059 | 0 | 1.4163 | 193.2189 | 240 | 4888 | macromolecule biosynthetic process |
| GO:0006139 | 0 | 1.404 | 208.9515 | 256 | 5286 | nucleobase-containing compound metabolic process |
| GO:0032508 | 0 | 5.7271 | 2.095 | 10 | 53 | DNA duplex unwinding |
| GO:0061339 | 1e-04 | 15.3018 | 0.5139 | 5 | 13 | establishment or maintenance of monopolar cell polarity |
| GO:0044711 | 4e-04 | 1.5203 | 64.1652 | 91 | 1637 | single-organism biosynthetic process |
| GO:0010467 | 5e-04 | 1.3303 | 197.5671 | 236 | 4998 | gene expression |
| GO:0090162 | 7e-04 | 8.7404 | 0.7511 | 5 | 19 | establishment of epithelial cell polarity |
| GO:1901576 | 8e-04 | 1.8047 | 24.5149 | 41 | 711 | organic substance biosynthetic process |
| GO:0044818 | 9e-04 | 8.1572 | 0.7906 | 5 | 20 | mitotic G2/M transition checkpoint |
| GO:0045930 | 0.001 | 2.3133 | 9.2498 | 20 | 234 | negative regulation of mitotic cell cycle |
| GO:0044271 | 0.001 | 1.3136 | 179.9371 | 215 | 4552 | cellular nitrogen compound biosynthetic process |
| GO:0010608 | 0.0011 | 1.9198 | 17.1162 | 31 | 433 | posttranscriptional regulation of gene expression |
| GO:0006807 | 0.0013 | 1.6352 | 35.7123 | 54 | 1002 | nitrogen compound metabolic process |
| GO:0006270 | 0.0014 | 5.6523 | 1.2649 | 6 | 32 | DNA replication initiation |
| GO:0007190 | 0.0014 | 5.6523 | 1.2649 | 6 | 32 | activation of adenylate cyclase activity |
| GO:0032715 | 0.0014 | 5.6523 | 1.2649 | 6 | 32 | negative regulation of interleukin-6 production |
| GO:0061245 | 0.0014 | 5.6523 | 1.2649 | 6 | 32 | establishment or maintenance of bipolar cell polarity |
| GO:0060122 | 0.0014 | 7.1965 | 0.8696 | 5 | 22 | inner ear receptor stereocilium organization |
| GO:0043933 | 0.0015 | 1.3756 | 97.321 | 125 | 2462 | macromolecular complex subunit organization |
| GO:0030200 | 0.0016 | Inf | 0.0791 | 2 | 2 | heparan sulfate proteoglycan catabolic process |
| GO:0044752 | 0.0016 | Inf | 0.0791 | 2 | 2 | response to human chorionic gonadotropin |
| GO:0046709 | 0.0016 | Inf | 0.0791 | 2 | 2 | IDP catabolic process |
| GO:1901990 | 0.0017 | 2.1657 | 10.3171 | 21 | 261 | regulation of mitotic cell cycle phase transition |
| GO:0044710 | 0.0017 | 1.4085 | 84.0266 | 109 | 2309 | single-organism metabolic process |
| GO:0009889 | 0.0018 | 1.3072 | 157.0892 | 189 | 3974 | regulation of biosynthetic process |
| GO:0044786 | 0.002 | 4.3996 | 1.8183 | 7 | 46 | cell cycle DNA replication |
| GO:0043043 | 0.0022 | 1.6921 | 24.9034 | 40 | 630 | peptide biosynthetic process |
| GO:0006260 | 0.0023 | 1.9955 | 12.7284 | 24 | 322 | DNA replication |
| GO:1902750 | 0.0026 | 6.1158 | 0.9882 | 5 | 25 | negative regulation of cell cycle G2/M phase transition |
| GO:0001821 | 0.003 | 14.6449 | 0.3162 | 3 | 8 | histamine secretion |
| GO:0007028 | 0.003 | 14.6449 | 0.3162 | 3 | 8 | cytoplasm organization |
| GO:0030643 | 0.003 | 14.6449 | 0.3162 | 3 | 8 | cellular phosphate ion homeostasis |
| GO:0044281 | 0.003 | 1.3409 | 100.1671 | 126 | 2534 | small molecule metabolic process |
| GO:0006516 | 0.003 | 8.1455 | 0.6325 | 4 | 16 | glycoprotein catabolic process |
| GO:0033683 | 0.003 | 4.7391 | 1.4626 | 6 | 37 | nucleotide-excision repair, DNA incision |
| GO:0044774 | 0.0031 | 2.8463 | 4.1901 | 11 | 106 | mitotic DNA integrity checkpoint |
| GO:0005975 | 0.0034 | 1.5268 | 37.869 | 55 | 958 | carbohydrate metabolic process |
| GO:1902589 | 0.0038 | 1.332 | 99.0207 | 124 | 2505 | single-organism organelle organization |
| GO:0046500 | 0.0038 | 7.5184 | 0.672 | 4 | 17 | S-adenosylmethionine metabolic process |
| GO:0048538 | 0.0042 | 3.8115 | 2.0555 | 7 | 52 | thymus development |
| GO:0001922 | 0.0046 | 48.75 | 0.1186 | 2 | 3 | B-1 B cell homeostasis |
| GO:0010636 | 0.0046 | 48.75 | 0.1186 | 2 | 3 | positive regulation of mitochondrial fusion |
| GO:0019065 | 0.0046 | 48.75 | 0.1186 | 2 | 3 | receptor-mediated endocytosis of virus by host cell |
| GO:0071930 | 0.0046 | 48.75 | 0.1186 | 2 | 3 | negative regulation of transcription involved in G1/S transition of mitotic cell cycle |
| GO:1904380 | 0.0046 | 48.75 | 0.1186 | 2 | 3 | endoplasmic reticulum mannose trimming |
| GO:0010948 | 0.0046 | 2.0482 | 9.8032 | 19 | 248 | negative regulation of cell cycle process |
| GO:0071840 | 0.0047 | 1.2463 | 234.5665 | 266 | 5934 | cellular component organization or biogenesis |
| GO:0006974 | 0.0047 | 1.5662 | 30.1213 | 45 | 762 | cellular response to DNA damage stimulus |
| GO:0006895 | 0.0048 | 6.9809 | 0.7115 | 4 | 18 | Golgi to endosome transport |
| GO:0043241 | 0.0048 | 1.9286 | 12.0169 | 22 | 304 | protein complex disassembly |
| GO:0016070 | 0.0048 | 1.2653 | 168.0388 | 197 | 4251 | RNA metabolic process |
| GO:0022411 | 0.0049 | 1.5701 | 29.3702 | 44 | 743 | cellular component disassembly |
| GO:2000134 | 0.0057 | 2.7585 | 3.9134 | 10 | 99 | negative regulation of G1/S transition of mitotic cell cycle |
| GO:0001921 | 0.006 | 10.4592 | 0.3953 | 3 | 10 | positive regulation of receptor recycling |
| GO:0060158 | 0.006 | 10.4592 | 0.3953 | 3 | 10 | phospholipase C-activating dopamine receptor signaling pathway |
| GO:1902806 | 0.0062 | 2.351 | 5.8899 | 13 | 149 | regulation of cell cycle G1/S phase transition |
| GO:0051656 | 0.0064 | 1.8459 | 13.0842 | 23 | 331 | establishment of organelle localization |
| GO:0006413 | 0.0065 | 1.978 | 10.1195 | 19 | 256 | translational initiation |
| GO:1901564 | 0.0065 | 1.3631 | 68.0212 | 88 | 1750 | organonitrogen compound metabolic process |
| GO:0006414 | 0.0065 | 2.1191 | 7.9849 | 16 | 202 | translational elongation |
| GO:0070126 | 0.0068 | 2.8672 | 3.3995 | 9 | 86 | mitochondrial translational termination |
| GO:0009116 | 0.0069 | 1.8093 | 13.9143 | 24 | 352 | nucleoside metabolic process |
| GO:0090329 | 0.0069 | 4.7026 | 1.2254 | 5 | 31 | regulation of DNA-dependent DNA replication |
| GO:0060113 | 0.0069 | 3.4292 | 2.2532 | 7 | 57 | inner ear receptor cell differentiation |
| GO:1903902 | 0.0071 | 2.668 | 4.032 | 10 | 102 | positive regulation of viral life cycle |
| GO:0033962 | 0.0071 | 6.1075 | 0.7906 | 4 | 20 | cytoplasmic mRNA processing body assembly |
| GO:0048199 | 0.0074 | 3.0639 | 2.8461 | 8 | 72 | vesicle targeting, to, from or within Golgi |
| GO:1901137 | 0.0079 | 1.4944 | 33.5603 | 48 | 849 | carbohydrate derivative biosynthetic process |
| GO:0032211 | 0.008 | 9.1512 | 0.4348 | 3 | 11 | negative regulation of telomere maintenance via telomerase |
| GO:0044794 | 0.008 | 9.1512 | 0.4348 | 3 | 11 | positive regulation by host of viral process |
| GO:0045779 | 0.008 | 9.1512 | 0.4348 | 3 | 11 | negative regulation of bone resorption |
| GO:0044764 | 0.0081 | 1.5129 | 31.07 | 45 | 786 | multi-organism cellular process |
| GO:2000112 | 0.0082 | 1.2565 | 144.4003 | 170 | 3653 | regulation of cellular macromolecule biosynthetic process |
| GO:0051701 | 0.0085 | 2.1096 | 7.5106 | 15 | 190 | interaction with host |
| GO:0060255 | 0.0089 | 1.2261 | 216.7388 | 245 | 5483 | regulation of macromolecule metabolic process |
| GO:0000727 | 0.0089 | 24.3734 | 0.1581 | 2 | 4 | double-strand break repair via break-induced replication |
| GO:0002349 | 0.0089 | 24.3734 | 0.1581 | 2 | 4 | histamine production involved in inflammatory response |
| GO:0002553 | 0.0089 | 24.3734 | 0.1581 | 2 | 4 | histamine secretion by mast cell |
| GO:0008295 | 0.0089 | 24.3734 | 0.1581 | 2 | 4 | spermidine biosynthetic process |
| GO:0009137 | 0.0089 | 24.3734 | 0.1581 | 2 | 4 | purine nucleoside diphosphate catabolic process |
| GO:0016080 | 0.0089 | 24.3734 | 0.1581 | 2 | 4 | synaptic vesicle targeting |
| GO:0033595 | 0.0089 | 24.3734 | 0.1581 | 2 | 4 | response to genistein |
| GO:0060921 | 0.0089 | 24.3734 | 0.1581 | 2 | 4 | sinoatrial node cell differentiation |
| GO:1904382 | 0.0089 | 24.3734 | 0.1581 | 2 | 4 | mannose trimming involved in glycoprotein ERAD pathway |
| GO:0006979 | 0.0094 | 1.7361 | 15.0606 | 25 | 381 | response to oxidative stress |
| GO:0032259 | 0.0094 | 1.7809 | 13.519 | 23 | 342 | methylation |
| GO:0051171 | 0.0095 | 1.2426 | 159.1842 | 185 | 4027 | regulation of nitrogen compound metabolic process |
| GO:0015980 | 0.0095 | 1.7546 | 14.3096 | 24 | 362 | energy derivation by oxidation of organic compounds |
| GO:0009987 | 0.0099 | 1.4736 | 517.9692 | 534 | 13422 | cellular process |
| GO:0019538 | 0.01 | 1.2228 | 211.4023 | 239 | 5348 | protein metabolic process |
| GOMFID | Pvalue | OddsRatio | ExpCount | Count | Size | Term |
| GO:0042176 | 5e-04 | 2.3556 | 9.9614 | 22 | 378 | regulation of protein catabolic process |
| GO:0097359 | 7e-04 | Inf | 0.0527 | 2 | 2 | UDP-glucosylation |
| GO:0036503 | 0.0015 | 3.9992 | 2.1873 | 8 | 83 | ERAD pathway |
| GO:0009057 | 0.0028 | 1.6234 | 29.357 | 45 | 1114 | macromolecule catabolic process |
| GO:1903573 | 0.003 | 5.6545 | 1.0014 | 5 | 38 | negative regulation of response to endoplasmic reticulum stress |
| GO:0006000 | 0.0033 | 12.3985 | 0.3162 | 3 | 12 | fructose metabolic process |
| GO:1990573 | 0.004 | 37.122 | 0.1054 | 2 | 4 | potassium ion import across plasma membrane |
| GO:2001270 | 0.004 | 37.122 | 0.1054 | 2 | 4 | regulation of cysteine-type endopeptidase activity involved in execution phase of apoptosis |
| GO:0006768 | 0.0043 | 11.1579 | 0.3426 | 3 | 13 | biotin metabolic process |
| GO:2001242 | 0.0046 | 2.8222 | 3.7685 | 10 | 143 | regulation of intrinsic apoptotic signaling pathway |
| GO:0044248 | 0.005 | 1.478 | 43.0605 | 60 | 1634 | cellular catabolic process |
| GO:0031334 | 0.0052 | 2.493 | 5.0861 | 12 | 193 | positive regulation of protein complex assembly |
| GO:0018279 | 0.0052 | 2.303 | 6.4037 | 14 | 243 | protein N-linked glycosylation via asparagine |
| GO:0044257 | 0.0054 | 1.7587 | 16.7077 | 28 | 634 | cellular protein catabolic process |
| GO:0097190 | 0.0056 | 1.7736 | 15.9698 | 27 | 606 | apoptotic signaling pathway |
| GO:0006552 | 0.0066 | 24.7463 | 0.1318 | 2 | 5 | leucine catabolic process |
| GO:0019640 | 0.0066 | 24.7463 | 0.1318 | 2 | 5 | glucuronate catabolic process to xylulose 5-phosphate |
| GO:0030263 | 0.0066 | 24.7463 | 0.1318 | 2 | 5 | apoptotic chromosome condensation |
| GO:0051167 | 0.0066 | 24.7463 | 0.1318 | 2 | 5 | xylulose 5-phosphate metabolic process |
| GO:0071681 | 0.0066 | 24.7463 | 0.1318 | 2 | 5 | cellular response to indole-3-methanol |
| GO:0072595 | 0.0067 | 5.9596 | 0.7642 | 4 | 29 | maintenance of protein localization in organelle |
| GO:0097320 | 0.0079 | 8.5813 | 0.4216 | 3 | 16 | membrane tubulation |
| GO:0010498 | 0.0084 | 1.9194 | 10.3567 | 19 | 393 | proteasomal protein catabolic process |
| GO:0045927 | 0.0084 | 2.2424 | 6.0875 | 13 | 231 | positive regulation of growth |
| GO:0008219 | 0.0088 | 1.4072 | 50.4129 | 67 | 1913 | cell death |
| GO:0009225 | 0.0095 | 5.32 | 0.8433 | 4 | 32 | nucleotide-sugar metabolic process |
| GO:0097194 | 0.0096 | 3.1526 | 2.3718 | 7 | 90 | execution phase of apoptosis |
| GO:0006048 | 0.0097 | 18.5585 | 0.1581 | 2 | 6 | UDP-N-acetylglucosamine biosynthetic process |
| GO:0031394 | 0.0097 | 18.5585 | 0.1581 | 2 | 6 | positive regulation of prostaglandin biosynthetic process |
| GO:0006511 | 0.0098 | 1.7489 | 14.3359 | 24 | 544 | ubiquitin-dependent protein catabolic process |
| GOMFID | Pvalue | OddsRatio | ExpCount | Count | Size | Term |
| GO:0009435 | 6e-04 | 13.0002 | 0.4116 | 4 | 15 | NAD biosynthetic process |
| GO:0034144 | 0.001 | 21.4085 | 0.2195 | 3 | 8 | negative regulation of toll-like receptor 4 signaling pathway |
| GO:0072595 | 0.001 | 7.4592 | 0.7958 | 5 | 29 | maintenance of protein localization in organelle |
| GO:0019363 | 0.0013 | 10.2124 | 0.4939 | 4 | 18 | pyridine nucleotide biosynthetic process |
| GO:0006621 | 0.0015 | 17.8392 | 0.247 | 3 | 9 | protein retention in ER lumen |
| GO:0051299 | 0.0015 | 17.8392 | 0.247 | 3 | 9 | centrosome separation |
| GO:0086046 | 0.0022 | 71.2131 | 0.0823 | 2 | 3 | membrane depolarization during SA node cell action potential |
| GO:0032286 | 0.0043 | 35.6042 | 0.1098 | 2 | 4 | central nervous system myelin maintenance |
| GO:1902410 | 0.0043 | 35.6042 | 0.1098 | 2 | 4 | mitotic cytokinetic process |
| GO:0045668 | 0.0045 | 5.1112 | 1.0976 | 5 | 40 | negative regulation of osteoblast differentiation |
| GO:0046496 | 0.0052 | 2.9678 | 3.2379 | 9 | 118 | nicotinamide nucleotide metabolic process |
| GO:0060828 | 0.0066 | 2.2359 | 6.5856 | 14 | 240 | regulation of canonical Wnt signaling pathway |
| GO:1901224 | 0.0068 | 5.9533 | 0.7683 | 4 | 28 | positive regulation of NIK/NF-kappaB signaling |
| GO:0006552 | 0.0071 | 23.7346 | 0.1372 | 2 | 5 | leucine catabolic process |
| GO:0019640 | 0.0071 | 23.7346 | 0.1372 | 2 | 5 | glucuronate catabolic process to xylulose 5-phosphate |
| GO:0051167 | 0.0071 | 23.7346 | 0.1372 | 2 | 5 | xylulose 5-phosphate metabolic process |
| GO:0060372 | 0.0071 | 23.7346 | 0.1372 | 2 | 5 | regulation of atrial cardiac muscle cell membrane repolarization |
| GO:0051023 | 0.0073 | 8.9161 | 0.4116 | 3 | 15 | regulation of immunoglobulin secretion |
| GO:0051186 | 0.0073 | 1.9864 | 9.4943 | 18 | 346 | cofactor metabolic process |
| GO:0072524 | 0.0075 | 2.7874 | 3.43 | 9 | 125 | pyridine-containing compound metabolic process |
| GO:0032703 | 0.0088 | 8.2297 | 0.439 | 3 | 16 | negative regulation of interleukin-2 production |
| GO:0044238 | 0.0088 | 1.2848 | 266.1699 | 290 | 9700 | primary metabolic process |
| GO:1901605 | 0.0093 | 1.9761 | 9.0004 | 17 | 328 | alpha-amino acid metabolic process |
| GO:0006284 | 0.0099 | 4.1581 | 1.3171 | 5 | 48 | base-excision repair |
| GOMFID | Pvalue | OddsRatio | ExpCount | Count | Size | Term |
| GO:0006868 | 0 | 61.2713 | 0.1911 | 4 | 6 | glutamine transport |
| GO:2000349 | 0.001 | Inf | 0.0637 | 2 | 2 | negative regulation of CD40 signaling pathway |
| GO:0034144 | 0.0016 | 18.3406 | 0.2548 | 3 | 8 | negative regulation of toll-like receptor 4 signaling pathway |
| GO:0042593 | 0.0016 | 2.4665 | 6.9122 | 16 | 217 | glucose homeostasis |
| GO:1901687 | 0.0024 | 6.1302 | 0.9556 | 5 | 30 | glutathione derivative biosynthetic process |
| GO:0002277 | 0.003 | 61.0282 | 0.0956 | 2 | 3 | myeloid dendritic cell activation involved in immune response |
| GO:0006867 | 0.003 | 61.0282 | 0.0956 | 2 | 3 | asparagine transport |
| GO:0015817 | 0.003 | 61.0282 | 0.0956 | 2 | 3 | histidine transport |
| GO:0034499 | 0.003 | 61.0282 | 0.0956 | 2 | 3 | late endosome to Golgi transport |
| GO:0070433 | 0.003 | 61.0282 | 0.0956 | 2 | 3 | negative regulation of nucleotide-binding oligomerization domain containing 2 signaling pathway |
| GO:0072237 | 0.003 | 61.0282 | 0.0956 | 2 | 3 | metanephric proximal tubule development |
| GO:0086046 | 0.003 | 61.0282 | 0.0956 | 2 | 3 | membrane depolarization during SA node cell action potential |
| GO:0089709 | 0.003 | 61.0282 | 0.0956 | 2 | 3 | L-histidine transmembrane transport |
| GO:0010824 | 0.0032 | 5.6754 | 1.0193 | 5 | 32 | regulation of centrosome duplication |
| GO:0051000 | 0.0033 | 7.6518 | 0.6371 | 4 | 20 | positive regulation of nitric-oxide synthase activity |
| GO:0006112 | 0.0033 | 2.541 | 5.447 | 13 | 171 | energy reserve metabolic process |
| GO:0030073 | 0.0047 | 2.2619 | 7.0078 | 15 | 220 | insulin secretion |
| GO:0071702 | 0.005 | 1.3588 | 79.2519 | 101 | 2488 | organic substance transport |
| GO:0002790 | 0.0054 | 2.1045 | 8.5049 | 17 | 267 | peptide secretion |
| GO:0007161 | 0.0058 | 30.5121 | 0.1274 | 2 | 4 | calcium-independent cell-matrix adhesion |
| GO:0071947 | 0.0058 | 30.5121 | 0.1274 | 2 | 4 | protein deubiquitination involved in ubiquitin-dependent protein catabolic process |
| GO:0002369 | 0.0065 | 6.1198 | 0.7645 | 4 | 24 | T cell cytokine production |
| GO:0046755 | 0.0065 | 6.1198 | 0.7645 | 4 | 24 | viral budding |
| GO:1902590 | 0.0065 | 6.1198 | 0.7645 | 4 | 24 | multi-organism organelle organization |
| GO:1901222 | 0.0068 | 4.6416 | 1.2104 | 5 | 38 | regulation of NIK/NF-kappaB signaling |
| GO:0071375 | 0.0071 | 1.7574 | 15.4809 | 26 | 486 | cellular response to peptide hormone stimulus |
| GO:0070208 | 0.0072 | 9.1673 | 0.4141 | 3 | 13 | protein heterotrimerization |
| GO:1901652 | 0.0075 | 1.663 | 19.4944 | 31 | 612 | response to peptide |
| GO:0005980 | 0.0076 | 5.828 | 0.7963 | 4 | 25 | glycogen catabolic process |
| GO:0001934 | 0.0076 | 1.5209 | 30.9936 | 45 | 973 | positive regulation of protein phosphorylation |
| GO:0045184 | 0.0082 | 1.3735 | 60.7131 | 79 | 1906 | establishment of protein localization |
| GO:0071900 | 0.0082 | 1.6654 | 18.8255 | 30 | 591 | regulation of protein serine/threonine kinase activity |
| GO:0003333 | 0.0086 | 3.6795 | 1.7838 | 6 | 56 | amino acid transmembrane transport |
| GO:0032874 | 0.0087 | 2.5642 | 4.141 | 10 | 130 | positive regulation of stress-activated MAPK cascade |
| GO:1902533 | 0.0094 | 1.5063 | 30.5477 | 44 | 959 | positive regulation of intracellular signal transduction |
| GO:0038027 | 0.0095 | 20.3401 | 0.1593 | 2 | 5 | apolipoprotein A-I-mediated signaling pathway |
| GO:1990822 | 0.0095 | 20.3401 | 0.1593 | 2 | 5 | basic amino acid transmembrane transport |
| GO:0044803 | 0.01 | 5.3205 | 0.86 | 4 | 27 | multi-organism membrane organization |
| GO:0050856 | 0.01 | 5.3205 | 0.86 | 4 | 27 | regulation of T cell receptor signaling pathway |
| GOMFID | Pvalue | OddsRatio | ExpCount | Count | Size | Term |
| GO:0051000 | 2e-04 | 11.4686 | 0.5706 | 5 | 20 | positive regulation of nitric-oxide synthase activity |
| GO:0034612 | 8e-04 | 2.4727 | 7.7595 | 18 | 272 | response to tumor necrosis factor |
| GO:0007017 | 0.001 | 1.9524 | 16.2892 | 30 | 571 | microtubule-based process |
| GO:1901841 | 0.0012 | 20.5639 | 0.2282 | 3 | 8 | regulation of high voltage-gated calcium channel activity |
| GO:0072595 | 0.0012 | 7.1636 | 0.8273 | 5 | 29 | maintenance of protein localization in organelle |
| GO:0044260 | 0.0013 | 1.3458 | 227.1365 | 259 | 7962 | cellular macromolecule metabolic process |
| GO:0051353 | 0.0013 | 5.5839 | 1.2267 | 6 | 43 | positive regulation of oxidoreductase activity |
| GO:0098901 | 0.0015 | 9.8087 | 0.5135 | 4 | 18 | regulation of cardiac muscle cell action potential |
| GO:0006621 | 0.0017 | 17.1354 | 0.2567 | 3 | 9 | protein retention in ER lumen |
| GO:0006732 | 0.0018 | 2.2977 | 8.3015 | 18 | 291 | coenzyme metabolic process |
| GO:0006464 | 0.0022 | 1.3661 | 105.7232 | 132 | 3706 | cellular protein modification process |
| GO:0033209 | 0.0023 | 2.7908 | 4.5929 | 12 | 161 | tumor necrosis factor-mediated signaling pathway |
| GO:0043412 | 0.0023 | 1.3586 | 110.5158 | 137 | 3874 | macromolecule modification |
| GO:0045760 | 0.0024 | 14.6866 | 0.2853 | 3 | 10 | positive regulation of action potential |
| GO:0030259 | 0.0024 | 68.4099 | 0.0856 | 2 | 3 | lipid glycosylation |
| GO:0033133 | 0.0024 | 68.4099 | 0.0856 | 2 | 3 | positive regulation of glucokinase activity |
| GO:0086046 | 0.0024 | 68.4099 | 0.0856 | 2 | 3 | membrane depolarization during SA node cell action potential |
| GO:0044070 | 0.0031 | 3.0062 | 3.5659 | 10 | 125 | regulation of anion transport |
| GO:0015074 | 0.0032 | 12.8499 | 0.3138 | 3 | 11 | DNA integration |
| GO:0090399 | 0.0042 | 11.4214 | 0.3423 | 3 | 12 | replicative senescence |
| GO:0019538 | 0.0047 | 1.2995 | 152.5654 | 179 | 5348 | protein metabolic process |
| GO:1902514 | 0.0047 | 34.2027 | 0.1141 | 2 | 4 | regulation of generation of L-type calcium current |
| GO:0021532 | 0.0048 | 5.0534 | 1.1126 | 5 | 39 | neural tube patterning |
| GO:0086004 | 0.0051 | 6.5361 | 0.7132 | 4 | 25 | regulation of cardiac muscle cell contraction |
| GO:0051651 | 0.0054 | 3.2074 | 2.6816 | 8 | 94 | maintenance of location in cell |
| GO:0071704 | 0.0055 | 1.3067 | 285.3327 | 311 | 10002 | organic substance metabolic process |
| GO:0032414 | 0.0066 | 3.8941 | 1.6831 | 6 | 59 | positive regulation of ion transmembrane transporter activity |
| GO:0051220 | 0.0066 | 4.6427 | 1.1982 | 5 | 42 | cytoplasmic sequestering of protein |
| GO:0086065 | 0.0073 | 4.5202 | 1.2267 | 5 | 43 | cell communication involved in cardiac conduction |
| GO:0050859 | 0.0077 | 22.8003 | 0.1426 | 2 | 5 | negative regulation of B cell receptor signaling pathway |
| GO:0060372 | 0.0077 | 22.8003 | 0.1426 | 2 | 5 | regulation of atrial cardiac muscle cell membrane repolarization |
| GO:1901026 | 0.0077 | 22.8003 | 0.1426 | 2 | 5 | ripoptosome assembly involved in necroptotic process |
| GO:0016310 | 0.008 | 1.3831 | 58.995 | 77 | 2068 | phosphorylation |
| GO:0070076 | 0.0088 | 5.4889 | 0.8273 | 4 | 29 | histone lysine demethylation |
| GO:0038061 | 0.0092 | 2.9018 | 2.9383 | 8 | 103 | NIK/NF-kappaB signaling |
| GO:0045653 | 0.0098 | 7.905 | 0.4564 | 3 | 16 | negative regulation of megakaryocyte differentiation |
| GO:1902307 | 0.0098 | 7.905 | 0.4564 | 3 | 16 | positive regulation of sodium ion transmembrane transport |
| GO:0044380 | 0.01 | 5.2774 | 0.8558 | 4 | 30 | protein localization to cytoskeleton |
| GOMFID | Pvalue | OddsRatio | ExpCount | Count | Size | Term |
| GO:0030071 | 0.0012 | 5.6234 | 1.1891 | 6 | 55 | regulation of mitotic metaphase/anaphase transition |
| GO:0021847 | 0.0014 | 91.0417 | 0.0649 | 2 | 3 | ventricular zone neuroblast division |
| GO:0071174 | 0.0028 | 5.7267 | 0.9729 | 5 | 45 | mitotic spindle checkpoint |
| GO:0033047 | 0.003 | 4.5892 | 1.4269 | 6 | 66 | regulation of mitotic sister chromatid segregation |
| GO:1902100 | 0.003 | 5.5867 | 0.9945 | 5 | 46 | negative regulation of metaphase/anaphase transition of cell cycle |
| GO:2000816 | 0.0037 | 5.3261 | 1.0377 | 5 | 48 | negative regulation of mitotic sister chromatid separation |
| GO:0008209 | 0.0038 | 7.0336 | 0.6486 | 4 | 30 | androgen metabolic process |
| GO:0045071 | 0.004 | 5.2048 | 1.0594 | 5 | 49 | negative regulation of viral genome replication |
| GO:0071051 | 0.0045 | 30.3433 | 0.1081 | 2 | 5 | polyadenylation-dependent snoRNA 3'-end processing |
| GO:2000347 | 0.0045 | 30.3433 | 0.1081 | 2 | 5 | positive regulation of hepatocyte proliferation |
| GO:0033046 | 0.0048 | 4.9778 | 1.1026 | 5 | 51 | negative regulation of sister chromatid segregation |
| GO:0009612 | 0.0057 | 2.5783 | 4.4969 | 11 | 208 | response to mechanical stimulus |
| GO:0007031 | 0.006 | 6.0942 | 0.7351 | 4 | 34 | peroxisome organization |
| GO:0030216 | 0.0064 | 3.0918 | 2.7457 | 8 | 127 | keratinocyte differentiation |
| GO:0051304 | 0.0064 | 3.8754 | 1.6647 | 6 | 77 | chromosome separation |
| GO:0043144 | 0.0066 | 22.756 | 0.1297 | 2 | 6 | snoRNA processing |
| GO:0045046 | 0.0066 | 22.756 | 0.1297 | 2 | 6 | protein import into peroxisome membrane |
| GO:0060236 | 0.0075 | 8.5522 | 0.4108 | 3 | 19 | regulation of mitotic spindle organization |
| GO:0051894 | 0.0087 | 8.0486 | 0.4324 | 3 | 20 | positive regulation of focal adhesion assembly |
| GO:0051984 | 0.0087 | 8.0486 | 0.4324 | 3 | 20 | positive regulation of chromosome segregation |
| GO:0022615 | 0.0091 | 18.2036 | 0.1513 | 2 | 7 | protein to membrane docking |
| GO:0045839 | 0.0095 | 4.1608 | 1.2972 | 5 | 60 | negative regulation of mitotic nuclear division |
| GO:0042403 | 0.01 | 7.601 | 0.454 | 3 | 21 | thyroid hormone metabolic process |
| GO:0048103 | 0.01 | 7.601 | 0.454 | 3 | 21 | somatic stem cell division |
| GOMFID | Pvalue | OddsRatio | ExpCount | Count | Size | Term |
| GO:0016740 | 5e-04 | 1.4938 | 70.0962 | 97 | 2097 | transferase activity |
| GO:0005515 | 9e-04 | 1.3539 | 337.4111 | 371 | 10094 | protein binding |
| GO:0004842 | 0.0017 | 2.0419 | 12.4348 | 24 | 372 | ubiquitin-protein transferase activity |
| GO:0000033 | 0.0033 | 58.0498 | 0.1003 | 2 | 3 | alpha-1,3-mannosyltransferase activity |
| GO:0030345 | 0.0033 | 58.0498 | 0.1003 | 2 | 3 | structural constituent of tooth enamel |
| GO:0070878 | 0.0033 | 58.0498 | 0.1003 | 2 | 3 | primary miRNA binding |
| GO:0005351 | 0.005 | 10.9002 | 0.3677 | 3 | 11 | sugar:proton symporter activity |
| GO:0004849 | 0.0064 | 29.023 | 0.1337 | 2 | 4 | uridine kinase activity |
| GO:0016531 | 0.0064 | 29.023 | 0.1337 | 2 | 4 | copper chaperone activity |
| GO:0051119 | 0.0077 | 5.82 | 0.8022 | 4 | 24 | sugar transmembrane transporter activity |
| GO:0017056 | 0.0083 | 8.719 | 0.4345 | 3 | 13 | structural constituent of nuclear pore |
| GOMFID | Pvalue | OddsRatio | ExpCount | Count | Size | Term |
| GO:0042288 | 1e-04 | 14.127 | 0.4823 | 5 | 18 | MHC class I protein binding |
| GO:0004329 | 7e-04 | Inf | 0.0536 | 2 | 2 | formate-tetrahydrofolate ligase activity |
| GO:0008260 | 7e-04 | Inf | 0.0536 | 2 | 2 | 3-oxoacid CoA-transferase activity |
| GO:0016798 | 0.0036 | 3.1597 | 3.0544 | 9 | 114 | hydrolase activity, acting on glycosyl bonds |
| GO:0008097 | 0.0041 | 36.4928 | 0.1072 | 2 | 4 | 5S rRNA binding |
| GO:0019104 | 0.0056 | 9.9706 | 0.3751 | 3 | 14 | DNA N-glycosylase activity |
| GO:0005134 | 0.0068 | 24.327 | 0.134 | 2 | 5 | interleukin-2 receptor binding |
| GO:0050544 | 0.0068 | 24.327 | 0.134 | 2 | 5 | arachidonic acid binding |
| GO:0032794 | 0.0068 | 9.1391 | 0.4019 | 3 | 15 | GTPase activating protein binding |
| GOMFID | Pvalue | OddsRatio | ExpCount | Count | Size | Term |
| GO:0004066 | 0.001 | Inf | 0.064 | 2 | 2 | asparagine synthase (glutamine-hydrolyzing) activity |
| GO:0044822 | 0.0016 | 1.5968 | 35.8343 | 54 | 1119 | poly(A) RNA binding |
| GO:0042802 | 0.0019 | 1.5789 | 36.891 | 55 | 1152 | identical protein binding |
| GO:0004520 | 0.003 | 4.6945 | 1.4411 | 6 | 45 | endodeoxyribonuclease activity |
| GO:0008409 | 0.0058 | 10.1303 | 0.3843 | 3 | 12 | 5'-3' exonuclease activity |
| GO:0035368 | 0.0059 | 30.344 | 0.1281 | 2 | 4 | selenocysteine insertion sequence binding |
| GO:0043125 | 0.0059 | 30.344 | 0.1281 | 2 | 4 | ErbB-3 class receptor binding |
| GO:0004518 | 0.0061 | 2.3463 | 5.8603 | 13 | 183 | nuclease activity |
| GO:0004364 | 0.0066 | 6.0859 | 0.7686 | 4 | 24 | glutathione transferase activity |
| GOMFID | Pvalue | OddsRatio | ExpCount | Count | Size | Term |
| GO:0008140 | 0.002 | 16.2741 | 0.2698 | 3 | 9 | cAMP response element binding protein binding |
| GO:0003743 | 0.0024 | 4.9028 | 1.3792 | 6 | 46 | translation initiation factor activity |
| GO:0017069 | 0.0024 | 6.045 | 0.9594 | 5 | 32 | snRNA binding |
| GO:0035650 | 0.0026 | 64.9786 | 0.0899 | 2 | 3 | AP-1 adaptor complex binding |
| GO:0005515 | 0.0028 | 1.3308 | 300.5806 | 329 | 10082 | protein binding |
| GO:0016836 | 0.003 | 4.6687 | 1.4391 | 6 | 48 | hydro-lyase activity |
| GO:0051787 | 0.0048 | 10.8473 | 0.3598 | 3 | 12 | misfolded protein binding |
| GO:0004591 | 0.0052 | 32.4872 | 0.1199 | 2 | 4 | oxoglutarate dehydrogenase (succinyl-transferring) activity |
| GO:0016520 | 0.0052 | 32.4872 | 0.1199 | 2 | 4 | growth hormone-releasing hormone receptor activity |
| GO:0016715 | 0.0052 | 32.4872 | 0.1199 | 2 | 4 | oxidoreductase activity, acting on paired donors, with incorporation or reduction of molecular oxygen, reduced ascorbate as one donor, and incorporation of one atom of oxygen |
| GOMFID | Pvalue | OddsRatio | ExpCount | Count | Size | Term |
| GO:0016209 | 9e-04 | 4.4517 | 2.0175 | 8 | 63 | antioxidant activity |
| GO:0019899 | 0.0014 | 1.5035 | 52.4865 | 74 | 1639 | enzyme binding |
| GO:0004842 | 0.0044 | 1.9412 | 11.9127 | 22 | 372 | ubiquitin-protein transferase activity |
| GO:0005515 | 0.0075 | 1.2905 | 256.4867 | 281 | 8446 | protein binding |
| GO:0005048 | 0.0086 | 4.3515 | 1.2809 | 5 | 40 | signal sequence binding |
| GO:0044183 | 0.0091 | 8.2873 | 0.4483 | 3 | 14 | protein binding involved in protein folding |
| GO:0000403 | 0.0096 | 20.228 | 0.1601 | 2 | 5 | Y-form DNA binding |
| GO:0015038 | 0.0096 | 20.228 | 0.1601 | 2 | 5 | glutathione disulfide oxidoreductase activity |
| GO:0019871 | 0.0096 | 20.228 | 0.1601 | 2 | 5 | sodium channel inhibitor activity |
| GO:0031698 | 0.0096 | 20.228 | 0.1601 | 2 | 5 | beta-2 adrenergic receptor binding |
| GO:0032405 | 0.0096 | 20.228 | 0.1601 | 2 | 5 | MutLalpha complex binding |
| GO:1904929 | 0.0096 | 20.228 | 0.1601 | 2 | 5 | coreceptor activity involved in Wnt signaling pathway, planar cell polarity pathway |
| GO:0043130 | 0.0099 | 2.8748 | 2.9782 | 8 | 93 | ubiquitin binding |
| GOMFID | Pvalue | OddsRatio | ExpCount | Count | Size | Term |
| GO:0030515 | 0 | 12.0008 | 0.6568 | 6 | 24 | snoRNA binding |
| GO:0032394 | 7e-04 | Inf | 0.0547 | 2 | 2 | MHC class Ib receptor activity |
| GO:0086075 | 7e-04 | Inf | 0.0547 | 2 | 2 | gap junction channel activity involved in cardiac conduction electrical coupling |
| GO:0017069 | 0.0016 | 6.6474 | 0.8757 | 5 | 32 | snRNA binding |
| GO:0070182 | 0.0037 | 11.9233 | 0.3284 | 3 | 12 | DNA polymerase binding |
| GO:0042803 | 0.0041 | 1.7436 | 18.6914 | 31 | 683 | protein homodimerization activity |
| GO:0008093 | 0.0059 | 9.7542 | 0.3831 | 3 | 14 | cytoskeletal adaptor activity |
| GO:0051880 | 0.0071 | 23.8002 | 0.1368 | 2 | 5 | G-quadruplex DNA binding |
| GO:0071253 | 0.0071 | 23.8002 | 0.1368 | 2 | 5 | connexin binding |
| GO:0030544 | 0.0076 | 5.7306 | 0.7936 | 4 | 29 | Hsp70 protein binding |
| GOMFID | Pvalue | OddsRatio | ExpCount | Count | Size | Term |
| GO:0032394 | 9e-04 | Inf | 0.0597 | 2 | 2 | MHC class Ib receptor activity |
| GO:0042288 | 0.0017 | 9.3559 | 0.5374 | 4 | 18 | MHC class I protein binding |
| GO:0008502 | 0.0026 | 65.2661 | 0.0896 | 2 | 3 | melatonin receptor activity |
| GO:0043167 | 0.0031 | 1.3049 | 171.1562 | 200 | 5733 | ion binding |
| GO:0008409 | 0.0048 | 10.8953 | 0.3583 | 3 | 12 | 5'-3' exonuclease activity |
| GO:0070182 | 0.0048 | 10.8953 | 0.3583 | 3 | 12 | DNA polymerase binding |
| GO:0017108 | 0.0051 | 32.6309 | 0.1194 | 2 | 4 | 5'-flap endonuclease activity |
| GO:0019788 | 0.0051 | 32.6309 | 0.1194 | 2 | 4 | NEDD8 transferase activity |
| GO:0034481 | 0.0051 | 32.6309 | 0.1194 | 2 | 4 | chondroitin sulfotransferase activity |
| GO:0016874 | 0.0052 | 1.9432 | 11.3447 | 21 | 380 | ligase activity |
| GO:0005245 | 0.0058 | 4.8196 | 1.1643 | 5 | 39 | voltage-gated calcium channel activity |
| GO:0016597 | 0.007 | 3.058 | 2.8063 | 8 | 94 | amino acid binding |
| GO:0008297 | 0.0084 | 21.7525 | 0.1493 | 2 | 5 | single-stranded DNA exodeoxyribonuclease activity |
| GO:0015085 | 0.0093 | 2.6913 | 3.5527 | 9 | 119 | calcium ion transmembrane transporter activity |
| GO:0032813 | 0.0097 | 4.2003 | 1.3136 | 5 | 44 | tumor necrosis factor receptor superfamily binding |
| GOMFID | Pvalue | OddsRatio | ExpCount | Count | Size | Term |
| GO:0016462 | 0 | 1.9834 | 29.4654 | 54 | 745 | pyrophosphatase activity |
| GO:0016817 | 0 | 1.9714 | 29.6236 | 54 | 749 | hydrolase activity, acting on acid anhydrides |
| GO:0003824 | 3e-04 | 1.3487 | 198.988 | 239 | 5101 | catalytic activity |
| GO:0070035 | 3e-04 | 3.6041 | 3.7178 | 12 | 94 | purine NTP-dependent helicase activity |
| GO:0004003 | 0.0012 | 5.8753 | 1.2261 | 6 | 31 | ATP-dependent DNA helicase activity |
| GO:0042623 | 0.0013 | 2.1258 | 11.5093 | 23 | 291 | ATPase activity, coupled |
| GO:0044877 | 0.0022 | 1.4673 | 54.0265 | 75 | 1366 | macromolecular complex binding |
| GO:0016829 | 0.0026 | 2.4311 | 6.605 | 15 | 167 | lyase activity |
| GO:0016836 | 0.0026 | 4.182 | 1.8984 | 7 | 48 | hydro-lyase activity |
| GO:0070063 | 0.003 | 4.7363 | 1.4634 | 6 | 37 | RNA polymerase binding |
| GO:0003676 | 0.0033 | 1.2917 | 145.9033 | 175 | 3689 | nucleic acid binding |
| GO:0000033 | 0.0046 | 48.7217 | 0.1187 | 2 | 3 | alpha-1,3-mannosyltransferase activity |
| GO:0003953 | 0.0046 | 48.7217 | 0.1187 | 2 | 3 | NAD+ nucleosidase activity |
| GO:0004748 | 0.0046 | 48.7217 | 0.1187 | 2 | 3 | ribonucleoside-diphosphate reductase activity, thioredoxin disulfide as acceptor |
| GO:0004768 | 0.0046 | 48.7217 | 0.1187 | 2 | 3 | stearoyl-CoA 9-desaturase activity |
| GO:0004832 | 0.0046 | 48.7217 | 0.1187 | 2 | 3 | valine-tRNA ligase activity |
| GO:0015018 | 0.0046 | 48.7217 | 0.1187 | 2 | 3 | galactosylgalactosylxylosylprotein 3-beta-glucuronosyltransferase activity |
| GO:0016427 | 0.0046 | 48.7217 | 0.1187 | 2 | 3 | tRNA (cytosine) methyltransferase activity |
| GO:0016728 | 0.0046 | 48.7217 | 0.1187 | 2 | 3 | oxidoreductase activity, acting on CH or CH2 groups, disulfide as acceptor |
| GO:0035650 | 0.0046 | 48.7217 | 0.1187 | 2 | 3 | AP-1 adaptor complex binding |
| GO:0043167 | 0.006 | 1.2386 | 226.7453 | 257 | 5733 | ion binding |
| GO:0015036 | 0.006 | 4.8881 | 1.1865 | 5 | 30 | disulfide oxidoreductase activity |
| GO:0015924 | 0.006 | 10.4531 | 0.3955 | 3 | 10 | mannosyl-oligosaccharide mannosidase activity |
| GO:0016799 | 0.007 | 6.1234 | 0.7886 | 4 | 20 | hydrolase activity, hydrolyzing N-glycosyl compounds |
| GO:0008168 | 0.0072 | 2.095 | 8.0684 | 16 | 204 | methyltransferase activity |
| GO:0034604 | 0.0089 | 24.3592 | 0.1582 | 2 | 4 | pyruvate dehydrogenase (NAD+) activity |
| GO:0004386 | 0.0095 | 3.6301 | 1.8339 | 6 | 47 | helicase activity |
| GO:0032555 | 0.0096 | 1.3376 | 69.0163 | 88 | 1745 | purine ribonucleotide binding |
| GOMFID | Pvalue | OddsRatio | ExpCount | Count | Size | Term |
| GO:0003980 | 7e-04 | Inf | 0.0529 | 2 | 2 | UDP-glucose:glycoprotein glucosyltransferase activity |
| GO:0004485 | 7e-04 | Inf | 0.0529 | 2 | 2 | methylcrotonoyl-CoA carboxylase activity |
| GO:0001948 | 0.001 | 3.8663 | 2.5415 | 9 | 96 | glycoprotein binding |
| GO:0004861 | 0.0034 | 12.3398 | 0.3177 | 3 | 12 | cyclin-dependent protein serine/threonine kinase inhibitor activity |
| GO:0045295 | 0.0034 | 12.3398 | 0.3177 | 3 | 12 | gamma-catenin binding |
| GO:0036041 | 0.0043 | 11.1051 | 0.3442 | 3 | 13 | long-chain fatty acid binding |
| GO:0042623 | 0.0048 | 2.1852 | 7.7038 | 16 | 291 | ATPase activity, coupled |
| GO:0002020 | 0.006 | 3.1379 | 2.7268 | 8 | 103 | protease binding |
| GO:0005134 | 0.0066 | 24.6295 | 0.1324 | 2 | 5 | interleukin-2 receptor binding |
| GO:0045545 | 0.0066 | 24.6295 | 0.1324 | 2 | 5 | syndecan binding |
| GO:0050544 | 0.0066 | 24.6295 | 0.1324 | 2 | 5 | arachidonic acid binding |
| GO:0008022 | 0.0086 | 2.4315 | 4.7652 | 11 | 180 | protein C-terminus binding |
| GO:0015288 | 0.0098 | 18.4709 | 0.1588 | 2 | 6 | porin activity |
| GO:1901567 | 0.0098 | 18.4709 | 0.1588 | 2 | 6 | fatty acid derivative binding |
| GOMFID | Pvalue | OddsRatio | ExpCount | Count | Size | Term |
| GO:0004950 | 4e-04 | 9.3381 | 0.6645 | 5 | 24 | chemokine receptor activity |
| GO:0030362 | 8e-04 | Inf | 0.0554 | 2 | 2 | protein phosphatase type 4 regulator activity |
| GO:0048407 | 0.0029 | 13.2546 | 0.3045 | 3 | 11 | platelet-derived growth factor binding |
| GO:0005488 | 0.0042 | 1.494 | 366.5578 | 386 | 13240 | binding |
| GO:0004722 | 0.0044 | 4.2594 | 1.5504 | 6 | 56 | protein serine/threonine phosphatase activity |
| GO:0031727 | 0.0044 | 35.2778 | 0.1107 | 2 | 4 | CCR2 chemokine receptor binding |
| GO:0042910 | 0.0044 | 35.2778 | 0.1107 | 2 | 4 | xenobiotic transporter activity |
| GO:0042379 | 0.0052 | 4.0951 | 1.6058 | 6 | 58 | chemokine receptor binding |
| GO:0019956 | 0.0061 | 9.6378 | 0.3876 | 3 | 14 | chemokine binding |
| GO:0032552 | 0.0072 | 23.517 | 0.1384 | 2 | 5 | deoxyribonucleotide binding |
| GO:0010181 | 0.0075 | 8.8341 | 0.4153 | 3 | 15 | FMN binding |
| GO:0046966 | 0.008 | 5.6621 | 0.8029 | 4 | 29 | thyroid hormone receptor binding |
| GOMFID | Pvalue | OddsRatio | ExpCount | Count | Size | Term |
| GO:0004984 | 0.0038 | 2.0822 | 9.603 | 19 | 361 | olfactory receptor activity |
| GO:0047115 | 0.0041 | 36.7639 | 0.1064 | 2 | 4 | trans-1,2-dihydrobenzene-1,2-diol dehydrogenase activity |
| GO:1990380 | 0.0041 | 36.7639 | 0.1064 | 2 | 4 | Lys48-specific deubiquitinase activity |
| GO:0008234 | 0.0045 | 2.675 | 4.3626 | 11 | 164 | cysteine-type peptidase activity |
| GO:0004843 | 0.007 | 3.8261 | 1.7025 | 6 | 64 | thiol-dependent ubiquitin-specific protease activity |
| GOMFID | Pvalue | OddsRatio | ExpCount | Count | Size | Term |
| GO:0004485 | 8e-04 | Inf | 0.0555 | 2 | 2 | methylcrotonoyl-CoA carboxylase activity |
| GO:0042277 | 8e-04 | 2.6562 | 6.4379 | 16 | 232 | peptide binding |
| GO:0016874 | 0.001 | 2.2145 | 10.5448 | 22 | 380 | ligase activity |
| GO:0000980 | 0.0021 | 4.2814 | 1.8037 | 7 | 65 | RNA polymerase II distal enhancer sequence-specific DNA binding |
| GO:0036041 | 0.0049 | 10.5771 | 0.3607 | 3 | 13 | long-chain fatty acid binding |
| GO:0047485 | 0.0063 | 3.1191 | 2.7472 | 8 | 99 | protein N-terminus binding |
| GO:0008017 | 0.0066 | 2.4144 | 5.2446 | 12 | 189 | microtubule binding |
| GO:0015186 | 0.0073 | 23.4611 | 0.1387 | 2 | 5 | L-glutamine transmembrane transporter activity |
| GO:0046923 | 0.0073 | 23.4611 | 0.1387 | 2 | 5 | ER retention sequence binding |
| GO:0050544 | 0.0073 | 23.4611 | 0.1387 | 2 | 5 | arachidonic acid binding |
| GO:0031492 | 0.008 | 5.6486 | 0.8047 | 4 | 29 | nucleosomal DNA binding |
| GO:0004672 | 0.0086 | 1.7273 | 15.7339 | 26 | 567 | protein kinase activity |
| GOMFID | Pvalue | OddsRatio | ExpCount | Count | Size | Term |
| GO:0015186 | 0 | 120.8685 | 0.1614 | 4 | 5 | L-glutamine transmembrane transporter activity |
| GO:0016748 | 0.001 | Inf | 0.0646 | 2 | 2 | succinyltransferase activity |
| GO:0034188 | 0.001 | Inf | 0.0646 | 2 | 2 | apolipoprotein A-I receptor activity |
| GO:0003746 | 0.0023 | 8.6261 | 0.581 | 4 | 18 | translation elongation factor activity |
| GO:0005310 | 0.0025 | 6.0459 | 0.9684 | 5 | 30 | dicarboxylic acid transmembrane transporter activity |
| GO:0005290 | 0.0031 | 60.1944 | 0.0968 | 2 | 3 | L-histidine transmembrane transporter activity |
| GO:0015182 | 0.0031 | 60.1944 | 0.0968 | 2 | 3 | L-asparagine transmembrane transporter activity |
| GO:0019961 | 0.0031 | 60.1944 | 0.0968 | 2 | 3 | interferon binding |
| GO:0097153 | 0.0045 | 11.3037 | 0.3551 | 3 | 11 | cysteine-type endopeptidase activity involved in apoptotic process |
| GO:0003824 | 0.0046 | 1.2806 | 170.0439 | 198 | 5268 | catalytic activity |
| GO:0004842 | 0.0048 | 1.9247 | 12.0077 | 22 | 372 | ubiquitin-protein transferase activity |
| GO:0004090 | 0.006 | 30.0952 | 0.1291 | 2 | 4 | carbonyl reductase (NADPH) activity |
| GO:0019784 | 0.006 | 30.0952 | 0.1291 | 2 | 4 | NEDD8-specific protease activity |
| GO:0035368 | 0.006 | 30.0952 | 0.1291 | 2 | 4 | selenocysteine insertion sequence binding |
| GO:0015171 | 0.0073 | 3.3638 | 2.2595 | 7 | 70 | amino acid transmembrane transporter activity |
| GO:0030507 | 0.0079 | 5.7481 | 0.807 | 4 | 25 | spectrin binding |
| GO:1901682 | 0.0091 | 5.4864 | 0.8392 | 4 | 26 | sulfur compound transmembrane transporter activity |
| GO:0019104 | 0.0093 | 8.2192 | 0.4519 | 3 | 14 | DNA N-glycosylase activity |
| GO:0070696 | 0.0093 | 8.2192 | 0.4519 | 3 | 14 | transmembrane receptor protein serine/threonine kinase binding |
| GO:0004904 | 0.0097 | 20.0622 | 0.1614 | 2 | 5 | interferon receptor activity |
| GO:0042015 | 0.0097 | 20.0622 | 0.1614 | 2 | 5 | interleukin-20 binding |
| GOMFID | Pvalue | OddsRatio | ExpCount | Count | Size | Term |
| GO:0050998 | 0.0014 | 9.8358 | 0.5121 | 4 | 18 | nitric-oxide synthase binding |
| GO:0043167 | 0.0018 | 1.3343 | 163.1104 | 193 | 5733 | ion binding |
| GO:0005057 | 0.0036 | 2.7655 | 4.2392 | 11 | 149 | receptor signaling protein activity |
| GO:0035639 | 0.0038 | 1.4679 | 48.4807 | 67 | 1704 | purine ribonucleoside triphosphate binding |
| GO:0000166 | 0.0043 | 1.4124 | 61.9381 | 82 | 2177 | nucleotide binding |
| GO:0032550 | 0.0043 | 1.4579 | 48.7652 | 67 | 1714 | purine ribonucleoside binding |
| GO:0004709 | 0.0044 | 6.8824 | 0.6828 | 4 | 24 | MAP kinase kinase kinase activity |
| GO:0033192 | 0.0047 | 34.2973 | 0.1138 | 2 | 4 | calmodulin-dependent protein phosphatase activity |
| GO:0001882 | 0.0049 | 1.449 | 49.0213 | 67 | 1723 | nucleoside binding |
| GO:0003777 | 0.005 | 3.6086 | 2.1054 | 7 | 74 | microtubule motor activity |
| GO:0016874 | 0.0063 | 1.9392 | 10.8114 | 20 | 380 | ligase activity |
| GO:0032555 | 0.0065 | 1.4277 | 49.6472 | 67 | 1745 | purine ribonucleotide binding |
| GO:0032452 | 0.0068 | 5.9835 | 0.7682 | 4 | 27 | histone demethylase activity |
| GO:0003824 | 0.0074 | 1.2903 | 136.1328 | 160 | 4888 | catalytic activity |
| GO:0004704 | 0.0076 | 22.8634 | 0.1423 | 2 | 5 | NF-kappaB-inducing kinase activity |
| GO:0015186 | 0.0076 | 22.8634 | 0.1423 | 2 | 5 | L-glutamine transmembrane transporter activity |
| GO:0008017 | 0.008 | 2.3515 | 5.3773 | 12 | 189 | microtubule binding |
| GO:0003723 | 0.0085 | 1.4415 | 42.3637 | 58 | 1489 | RNA binding |
| GOMFID | Pvalue | OddsRatio | ExpCount | Count | Size | Term |
| GO:0050840 | 7e-04 | 6.2176 | 1.0909 | 6 | 49 | extracellular matrix binding |
| GO:0042134 | 0.0029 | 44.1643 | 0.0891 | 2 | 4 | rRNA primary transcript binding |
| GO:0000268 | 0.0047 | 29.4409 | 0.1113 | 2 | 5 | peroxisome targeting sequence binding |
| GO:0004563 | 0.0047 | 29.4409 | 0.1113 | 2 | 5 | beta-N-acetylhexosaminidase activity |
| GO:0097109 | 0.0047 | 29.4409 | 0.1113 | 2 | 5 | neuroligin family protein binding |
| GO:0005057 | 0.0062 | 2.8715 | 3.3172 | 9 | 149 | receptor signaling protein activity |
| NA. |
| n/a |
| NA. |
| n/a |
| NA. |
| n/a |
| NA. |
| n/a |
| NA. |
| n/a |
| NA. |
| n/a |
| NA. |
| n/a |
| NA. |
| n/a |
| NA. |
| n/a |
| NA. |
| n/a |
| NA. |
| n/a |
| NA. |
| n/a |
| NA. |
| n/a |
| NA. |
| n/a |
| NA. |
| n/a |
| NA. |
| n/a |
| NA. |
| n/a |
| NA. |
| n/a |
| NA. |
| n/a |
| NA. |
| n/a |
| NA. |
| n/a |
| NA. |
| n/a |
| NA. |
| n/a |
| NA. |
| n/a |
| NA. |
| n/a |
| NA. |
| n/a |
| NA. |
| n/a |
| NA. |
| n/a |
| NA. |
| n/a |
| NA. |
| n/a |
| NA. |
| n/a |
| NA. |
| n/a |
| NA. |
| n/a |
| NA. |
| n/a |
| NA. |
| n/a |
| NA. |
| n/a |
| NA. |
| n/a |
| NA. |
| n/a |
| NA. |
| n/a |
| NA. |
| n/a |
| NA. |
| n/a |
| NA. |
| n/a |
| NA. |
| n/a |
| NA. |
| n/a |
| NA. |
| n/a |
| NA. |
| n/a |
| NA. |
| n/a |
| NA. |
| n/a |
| NA. |
| n/a |
| NA. |
| n/a |
| NA. |
| n/a |
| NA. |
| n/a |
| NA. |
| n/a |
| NA. |
| n/a |
| NA. |
| n/a |
| NA. |
| n/a |
| NA. |
| n/a |
| NA. |
| n/a |
| NA. |
| n/a |
| NA. |
| n/a |
| NA. |
| n/a |
| NA. |
| n/a |
| NA. |
| n/a |
| NA. |
| n/a |
| NA. |
| n/a |
| NA. |
| n/a |
| NA. |
| n/a |
| NA. |
| n/a |
| NA. |
| n/a |
| NA. |
| n/a |
| NA. |
| n/a |
| NA. |
| n/a |
| NA. |
| n/a |
| NA. |
| n/a |
| NA. |
| n/a |
| NA. |
| n/a |
| NA. |
| n/a |
| NA. |
| n/a |
| NA. |
| n/a |
| NA. |
| n/a |
| NA. |
| n/a |
| NA. |
| n/a |
| NA. |
| n/a |
| NA. |
| n/a |
| NA. |
| n/a |
| NA. |
| n/a |
| NA. |
| n/a |
| NA. |
| n/a |
| NA. |
| n/a |
| NA. |
| n/a |
| NA. |
| n/a |
| NA. |
| n/a |
| NA. |
| n/a |
| NA. |
| n/a |
| NA. |
| n/a |
| NA. |
| n/a |
| NA. |
| n/a |
| NA. |
| n/a |
| NA. |
| n/a |
| NA. |
| n/a |
| NA. |
| n/a |
| NA. |
| n/a |
| NA. |
| n/a |
| NA. |
| n/a |
| NA. |
| n/a |
| NA. |
| n/a |
| NA. |
| n/a |
| NA. |
| n/a |
| NA. |
| n/a |
| NA. |
| n/a |
| NA. |
| n/a |
| NA. |
| n/a |
| NA. |
| n/a |
| NA. |
| n/a |
| NA. |
| n/a |
| NA. |
| n/a |
| NA. |
| n/a |
| NA. |
| n/a |
| NA. |
| n/a |
| NA. |
| n/a |
| NA. |
| n/a |
| NA. |
| n/a |
| NA. |
| n/a |
| NA. |
| n/a |
| NA. |
| n/a |
| NA. |
| n/a |
| NA. |
| n/a |
| NA. |
| n/a |
| NA. |
| n/a |
| NA. |
| n/a |
| NA. |
| n/a |
| NA. |
| n/a |
| NA. |
| n/a |
| NA. |
| n/a |
| NA. |
| n/a |
| NA. |
| n/a |
| NA. |
| n/a |
| NA. |
| n/a |
| NA. |
| n/a |
| NA. |
| n/a |
| NA. |
| n/a |
| NA. |
| n/a |
| NA. |
| n/a |
| NA. |
| n/a |
| NA. |
| n/a |
| NA. |
| n/a |
| NA. |
| n/a |
| NA. |
| n/a |
| NA. |
| n/a |
| NA. |
| n/a |
| NA. |
| n/a |
| NA. |
| n/a |
| NA. |
| n/a |
| NA. |
| n/a |
| NA. |
| n/a |
| NA. |
| n/a |
| NA. |
| n/a |
| NA. |
| n/a |
| NA. |
| n/a |
| NA. |
| n/a |
| NA. |
| n/a |
| NA. |
| n/a |
| NA. |
| n/a |
| NA. |
| n/a |
| NA. |
| n/a |
| NA. |
| n/a |
| NA. |
| n/a |
| NA. |
| n/a |
| NA. |
| n/a |
| NA. |
| n/a |
| NA. |
| n/a |
| NA. |
| n/a |
| NA. |
| n/a |
| NA. |
| n/a |
| NA. |
| n/a |
| NA. |
| n/a |
| NA. |
| n/a |
| NA. |
| n/a |
| NA. |
| n/a |
| NA. |
| n/a |
| NA. |
| n/a |
| NA. |
| n/a |
| NA. |
| n/a |
| NA. |
| n/a |
| NA. |
| n/a |
| NA. |
| n/a |
| NA. |
| n/a |
| NA. |
| n/a |
| NA. |
| n/a |
| NA. |
| n/a |
| NA. |
| n/a |
| NA. |
| n/a |
| NA. |
| n/a |
| NA. |
| n/a |
| NA. |
| n/a |
| NA. |
| n/a |
| NA. |
| n/a |
| NA. |
| n/a |
| NA. |
| n/a |
| NA. |
| n/a |
| NA. |
| n/a |
| NA. |
| n/a |
| NA. |
| n/a |
| NA. |
| n/a |
| NA. |
| n/a |
| NA. |
| n/a |
| NA. |
| n/a |
| NA. |
| n/a |
| NA. |
| n/a |
| NA. |
| n/a |
| NA. |
| n/a |
| NA. |
| n/a |
| NA. |
| n/a |
| NA. |
| n/a |
| NA. |
| n/a |
| NA. |
| n/a |
| NA. |
| n/a |
| NA. |
| n/a |
| NA. |
| n/a |
| NA. |
| n/a |
| NA. |
| n/a |
| NA. |
| n/a |
| NA. |
| n/a |
| NA. |
| n/a |
| NA. |
| n/a |
| NA. |
| n/a |
| NA. |
| n/a |
| NA. |
| n/a |
| NA. |
| n/a |
| NA. |
| n/a |
| NA. |
| n/a |
| NA. |
| n/a |
| NA. |
| n/a |
| NA. |
| n/a |
| NA. |
| n/a |
| NA. |
| n/a |
| NA. |
| n/a |
| NA. |
| n/a |
| NA. |
| n/a |
| NA. |
| n/a |
| NA. |
| n/a |
| NA. |
| n/a |
| NA. |
| n/a |
| NA. |
| n/a |
| NA. |
| n/a |
| NA. |
| n/a |
| NA. |
| n/a |
| NA. |
| n/a |
| NA. |
| n/a |
| NA. |
| n/a |
| NA. |
| n/a |
| NA. |
| n/a |
| NA. |
| n/a |
| NA. |
| n/a |
| NA. |
| n/a |
| NA. |
| n/a |