Sequencing Coverage Plots
The sequencing coverage plots visualized effective read coverage at all CpGs in the sequenced genome. In case certain samples seem to have significantly decreased coverage, they should be excluded from the analysis.
| Sample labels |
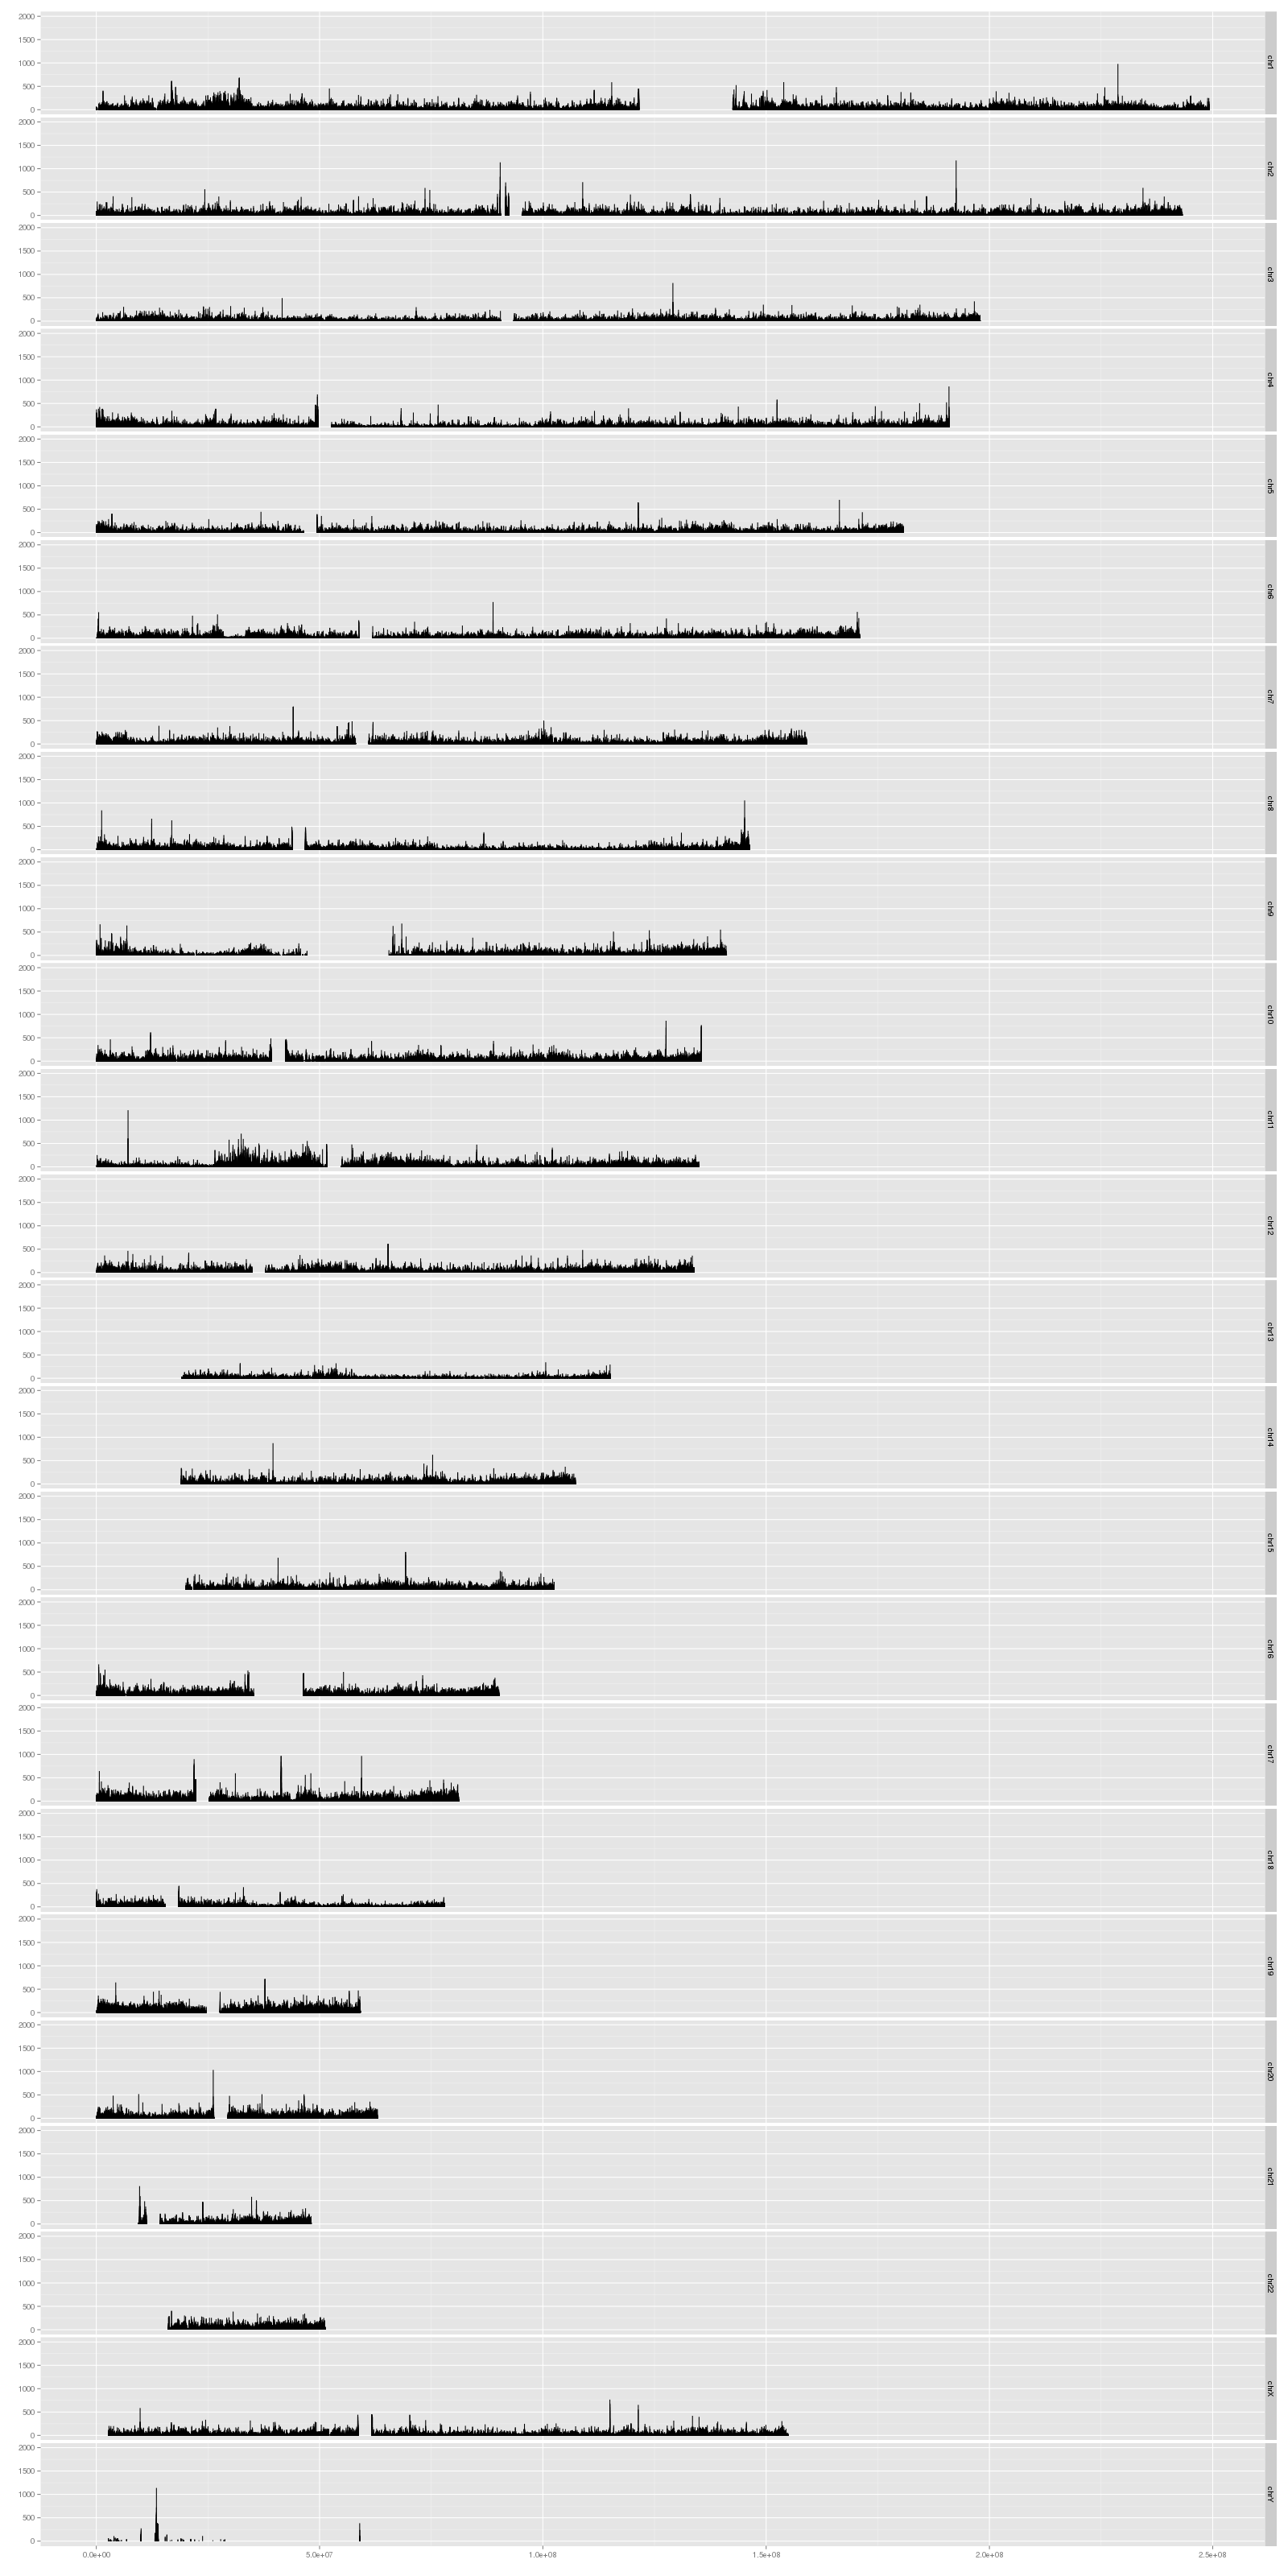
Sequencing coverage plots visualize effective read coverage over all chromosomes of the genome.
Sequencing Coverage Thresholds
In total, between 1.0 and 13.7 million sites are covered in all samples of the dataset. The figure below shows the change in supports for different coverage thresholds. The exact values are available in a dedicated comma-separated file accompanying this report.
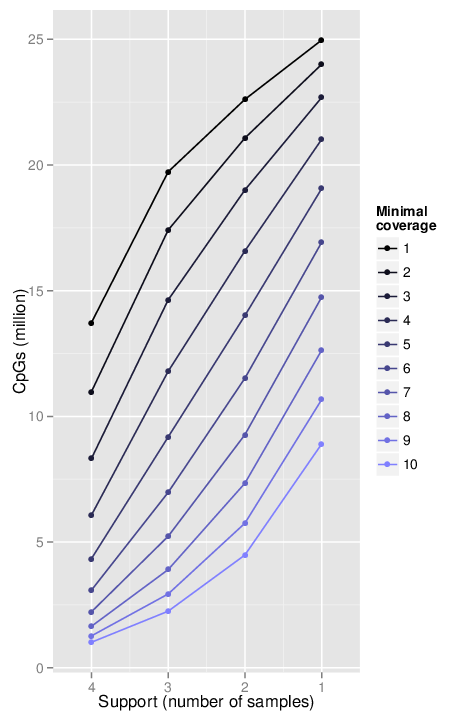
Line plot showing the number of CpG sites with a given support for different thresholds of minimal coverage. The support of a CpG site is the minimal number of samples that interrogate it.