Epigenome data analysis for: DNA methylation details

Data

Each of the links below opens epigenome profile tracks in the UCSC Genome Browser and "CpG methylation" reports DNA methylation data per CpG, summarizing over all observed reads. "RRBS reads" shows DNA methylation data for each read separately. A more detailed explanation of these browser tracks is available in the RRBS track documentation sheet.

hES_HUES1_p28.RRBS CpG methylation RRBS reads
hES_HUES3_p27.RRBS CpG methylation RRBS reads
hES_HUES6_p25.RRBS CpG methylation RRBS reads
hES_HUES8_p30.RRBS CpG methylation RRBS reads
hES_HUES9_p21.RRBS CpG methylation RRBS reads
hES_HUES13_p47.RRBS CpG methylation RRBS reads
hES_HUES28_p17.RRBS CpG methylation RRBS reads
hES_HUES44_p18.RRBS CpG methylation RRBS reads
hES_HUES45_p20.RRBS CpG methylation RRBS reads
hES_HUES48_p19.RRBS CpG methylation RRBS reads
hES_HUES49_p17.RRBS CpG methylation RRBS reads
hES_HUES53_p17.RRBS CpG methylation RRBS reads
hES_HUES62_p14.RRBS CpG methylation RRBS reads
hES_HUES63_p19.RRBS CpG methylation RRBS reads
hES_HUES64_p19.RRBS CpG methylation RRBS reads
hES_HUES65_p19.RRBS CpG methylation RRBS reads
hES_HUES66_p20.RRBS CpG methylation RRBS reads
hES_H1_p37.RRBS CpG methylation RRBS reads
hES_H7_p48.RRBS CpG methylation RRBS reads
hES_H9_p58.RRBS CpG methylation RRBS reads
hiPS_11a_p22.RRBS CpG methylation RRBS reads
hiPS_11b_p13.RRBS CpG methylation RRBS reads
hiPS_11c_p23.RRBS CpG methylation RRBS reads
hiPS_15b_p27.RRBS CpG methylation RRBS reads
hiPS_17a_p14.RRBS CpG methylation RRBS reads
hiPS_17b_p32.RRBS CpG methylation RRBS reads
hiPS_18a_p30.RRBS CpG methylation RRBS reads
hiPS_18b_p27.RRBS CpG methylation RRBS reads
hiPS_18c_p36.RRBS CpG methylation RRBS reads
hiPS_20b_p43.RRBS CpG methylation RRBS reads
hiPS_27b_p31.RRBS CpG methylation RRBS reads
hiPS_27e_p32.RRBS CpG methylation RRBS reads
hFib_11_p8.RRBS CpG methylation RRBS reads
hFib_15_p7.RRBS CpG methylation RRBS reads
hFib_17_p7.RRBS CpG methylation RRBS reads
hFib_18_p7.RRBS CpG methylation RRBS reads
hFib_20_p7.RRBS CpG methylation RRBS reads
hFib_27_p7.RRBS CpG methylation RRBS reads
hEB16d_HUES1_p29.RRBS CpG methylation RRBS reads
hEB16d_HUES3_p22.RRBS CpG methylation RRBS reads
hEB16d_HUES6_p30.RRBS CpG methylation RRBS reads
hEB16d_HUES45_p21.RRBS CpG methylation RRBS reads
hEB16d_H1_p38.RRBS CpG methylation RRBS reads

Analysis

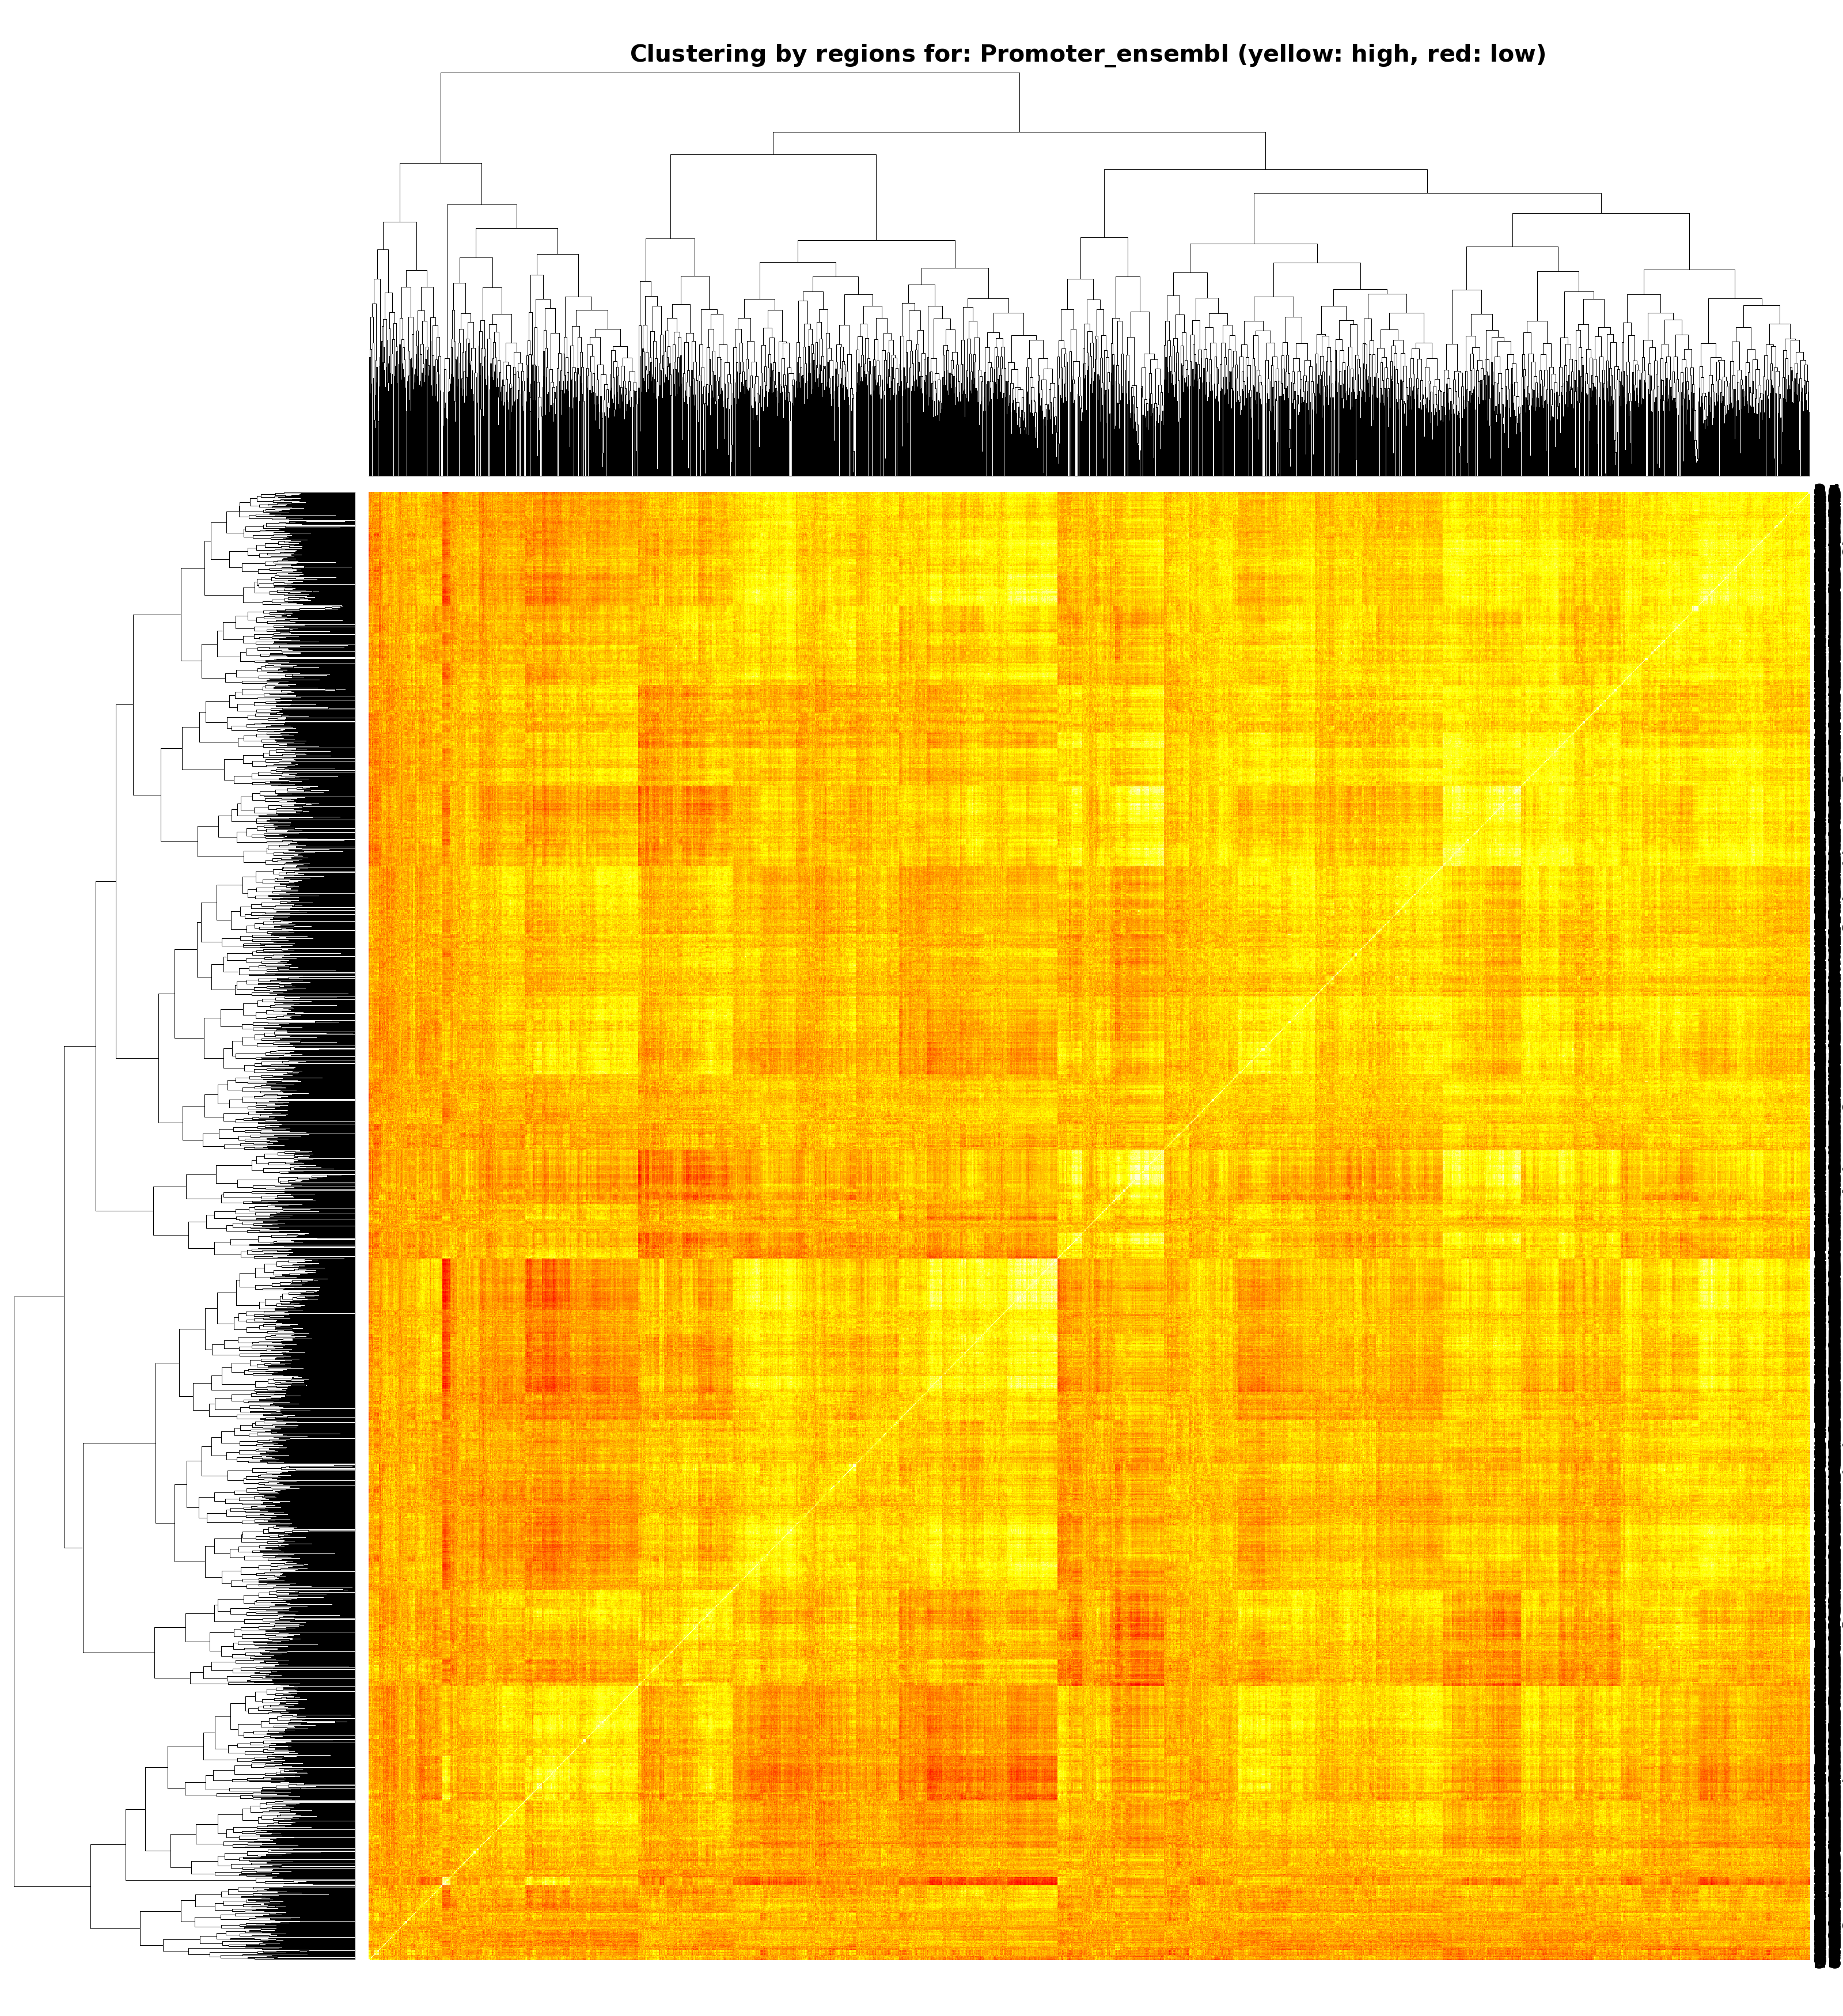
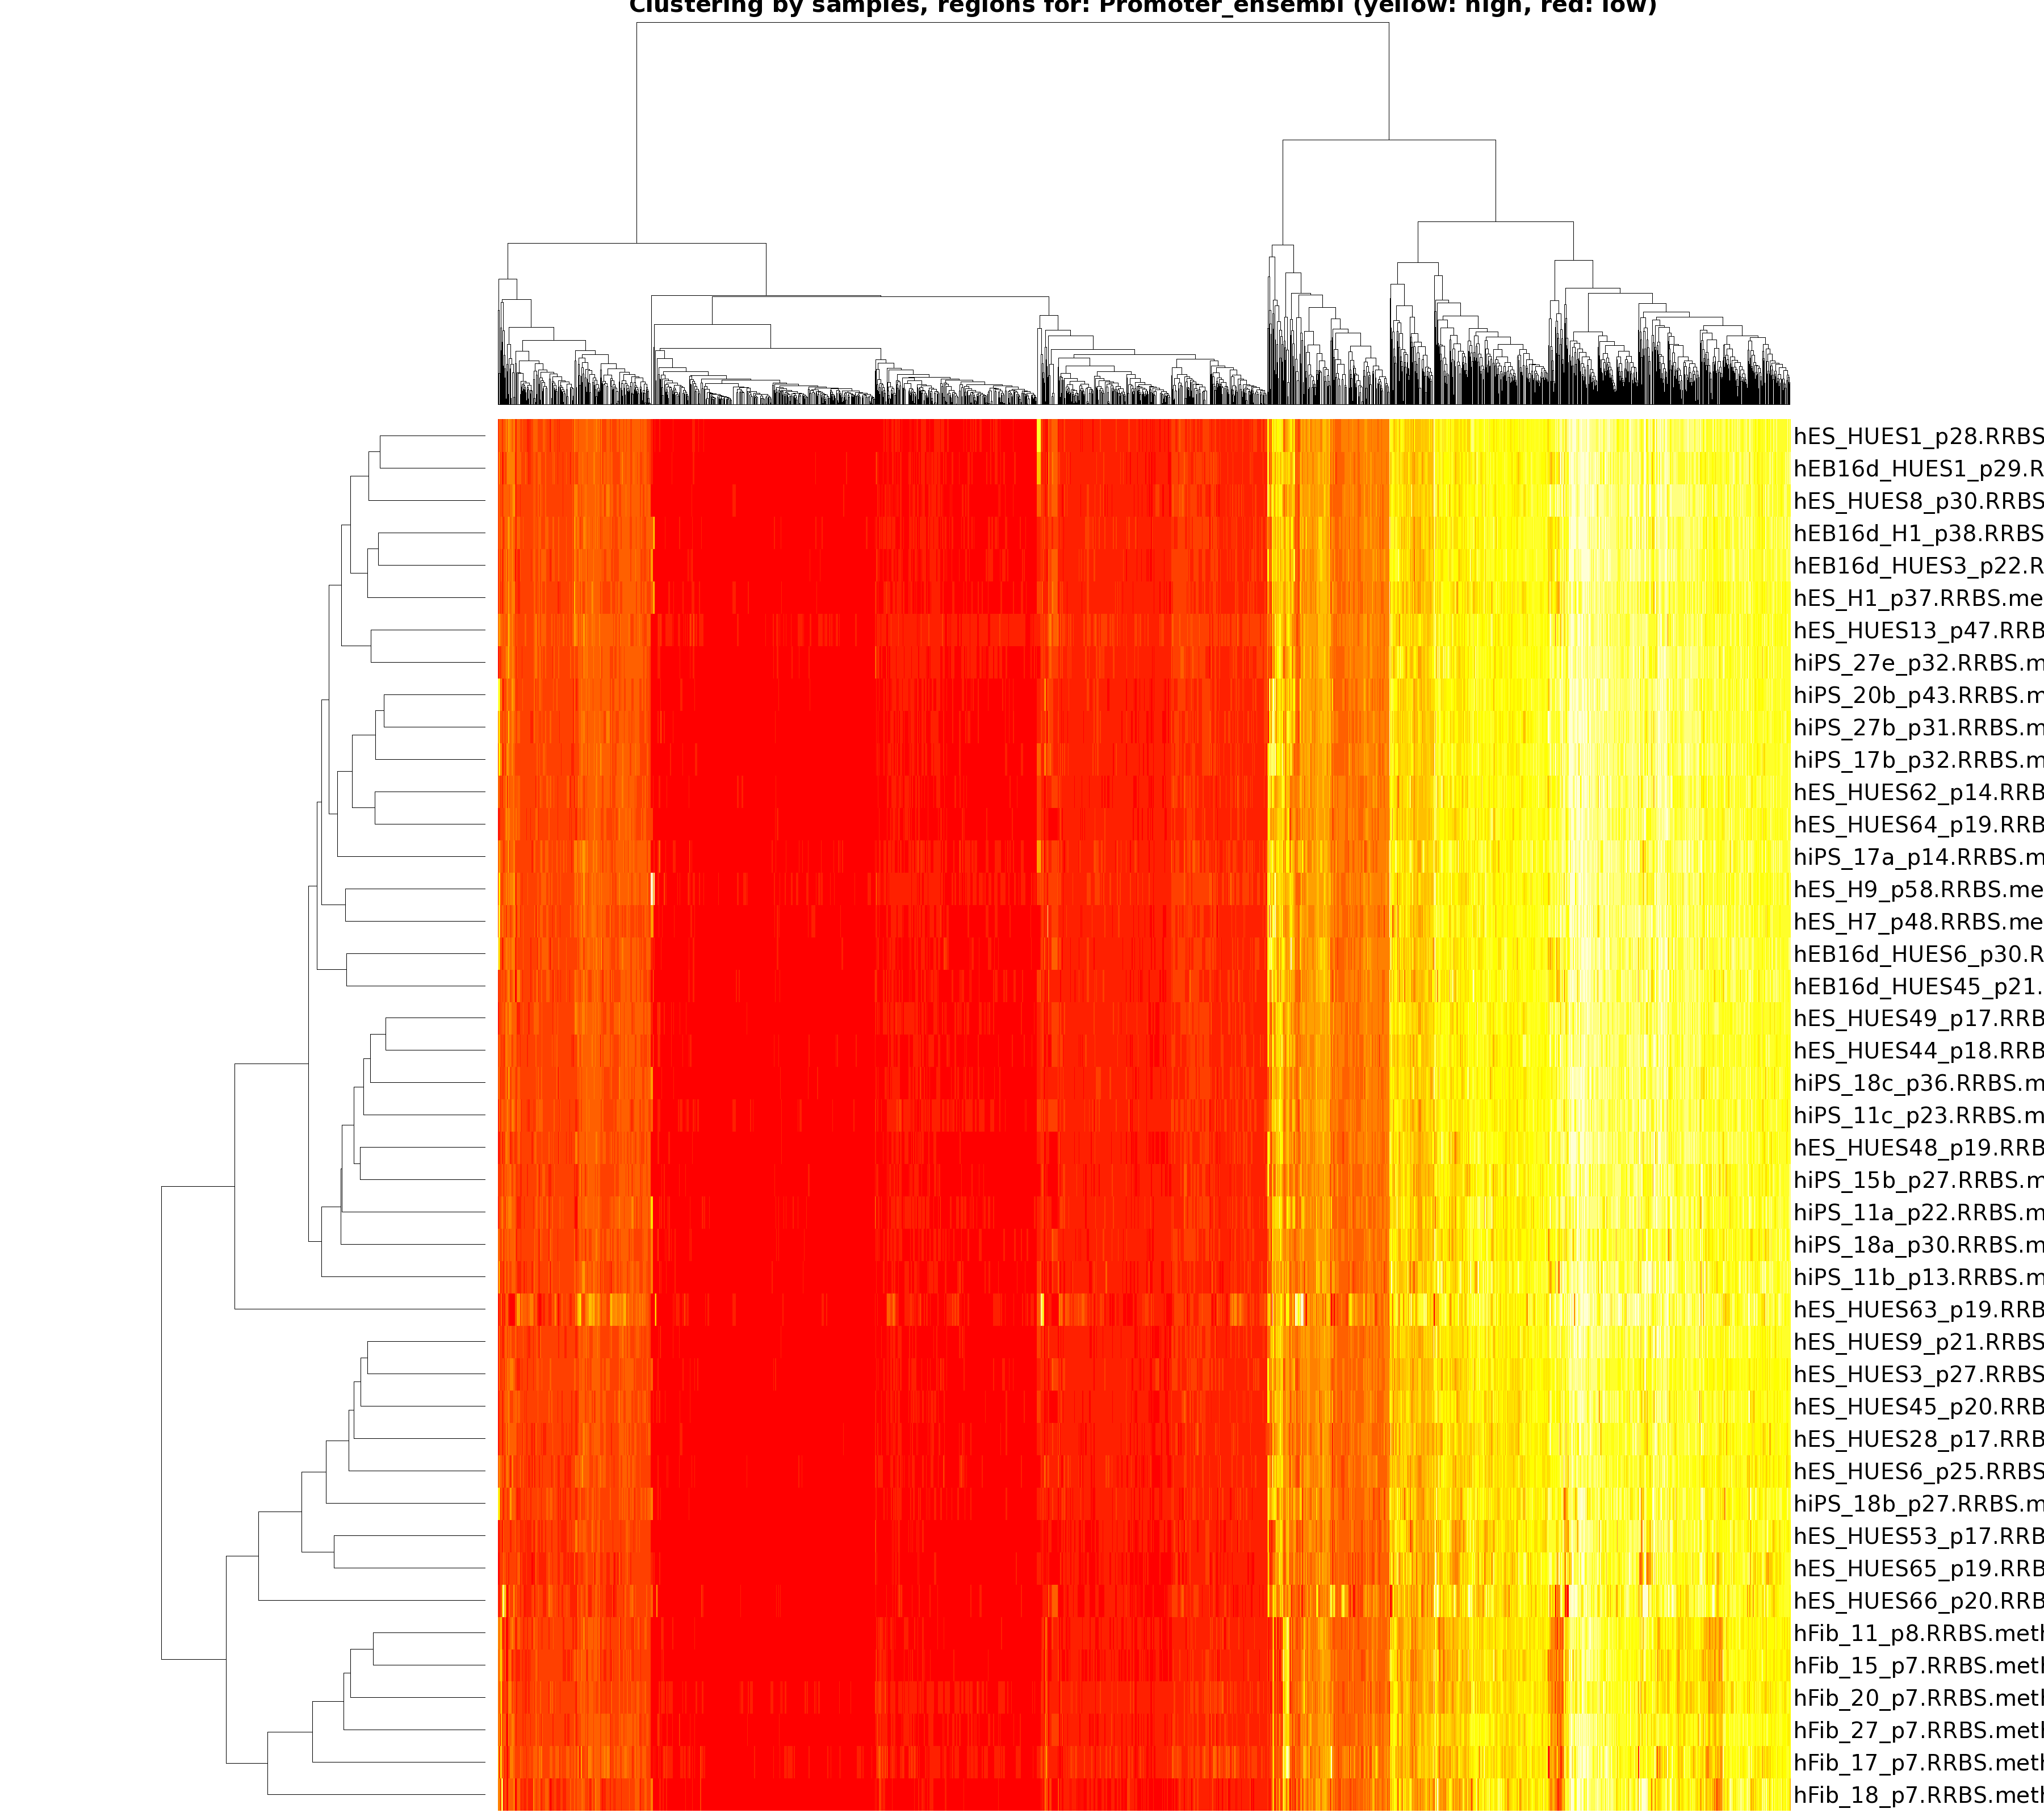
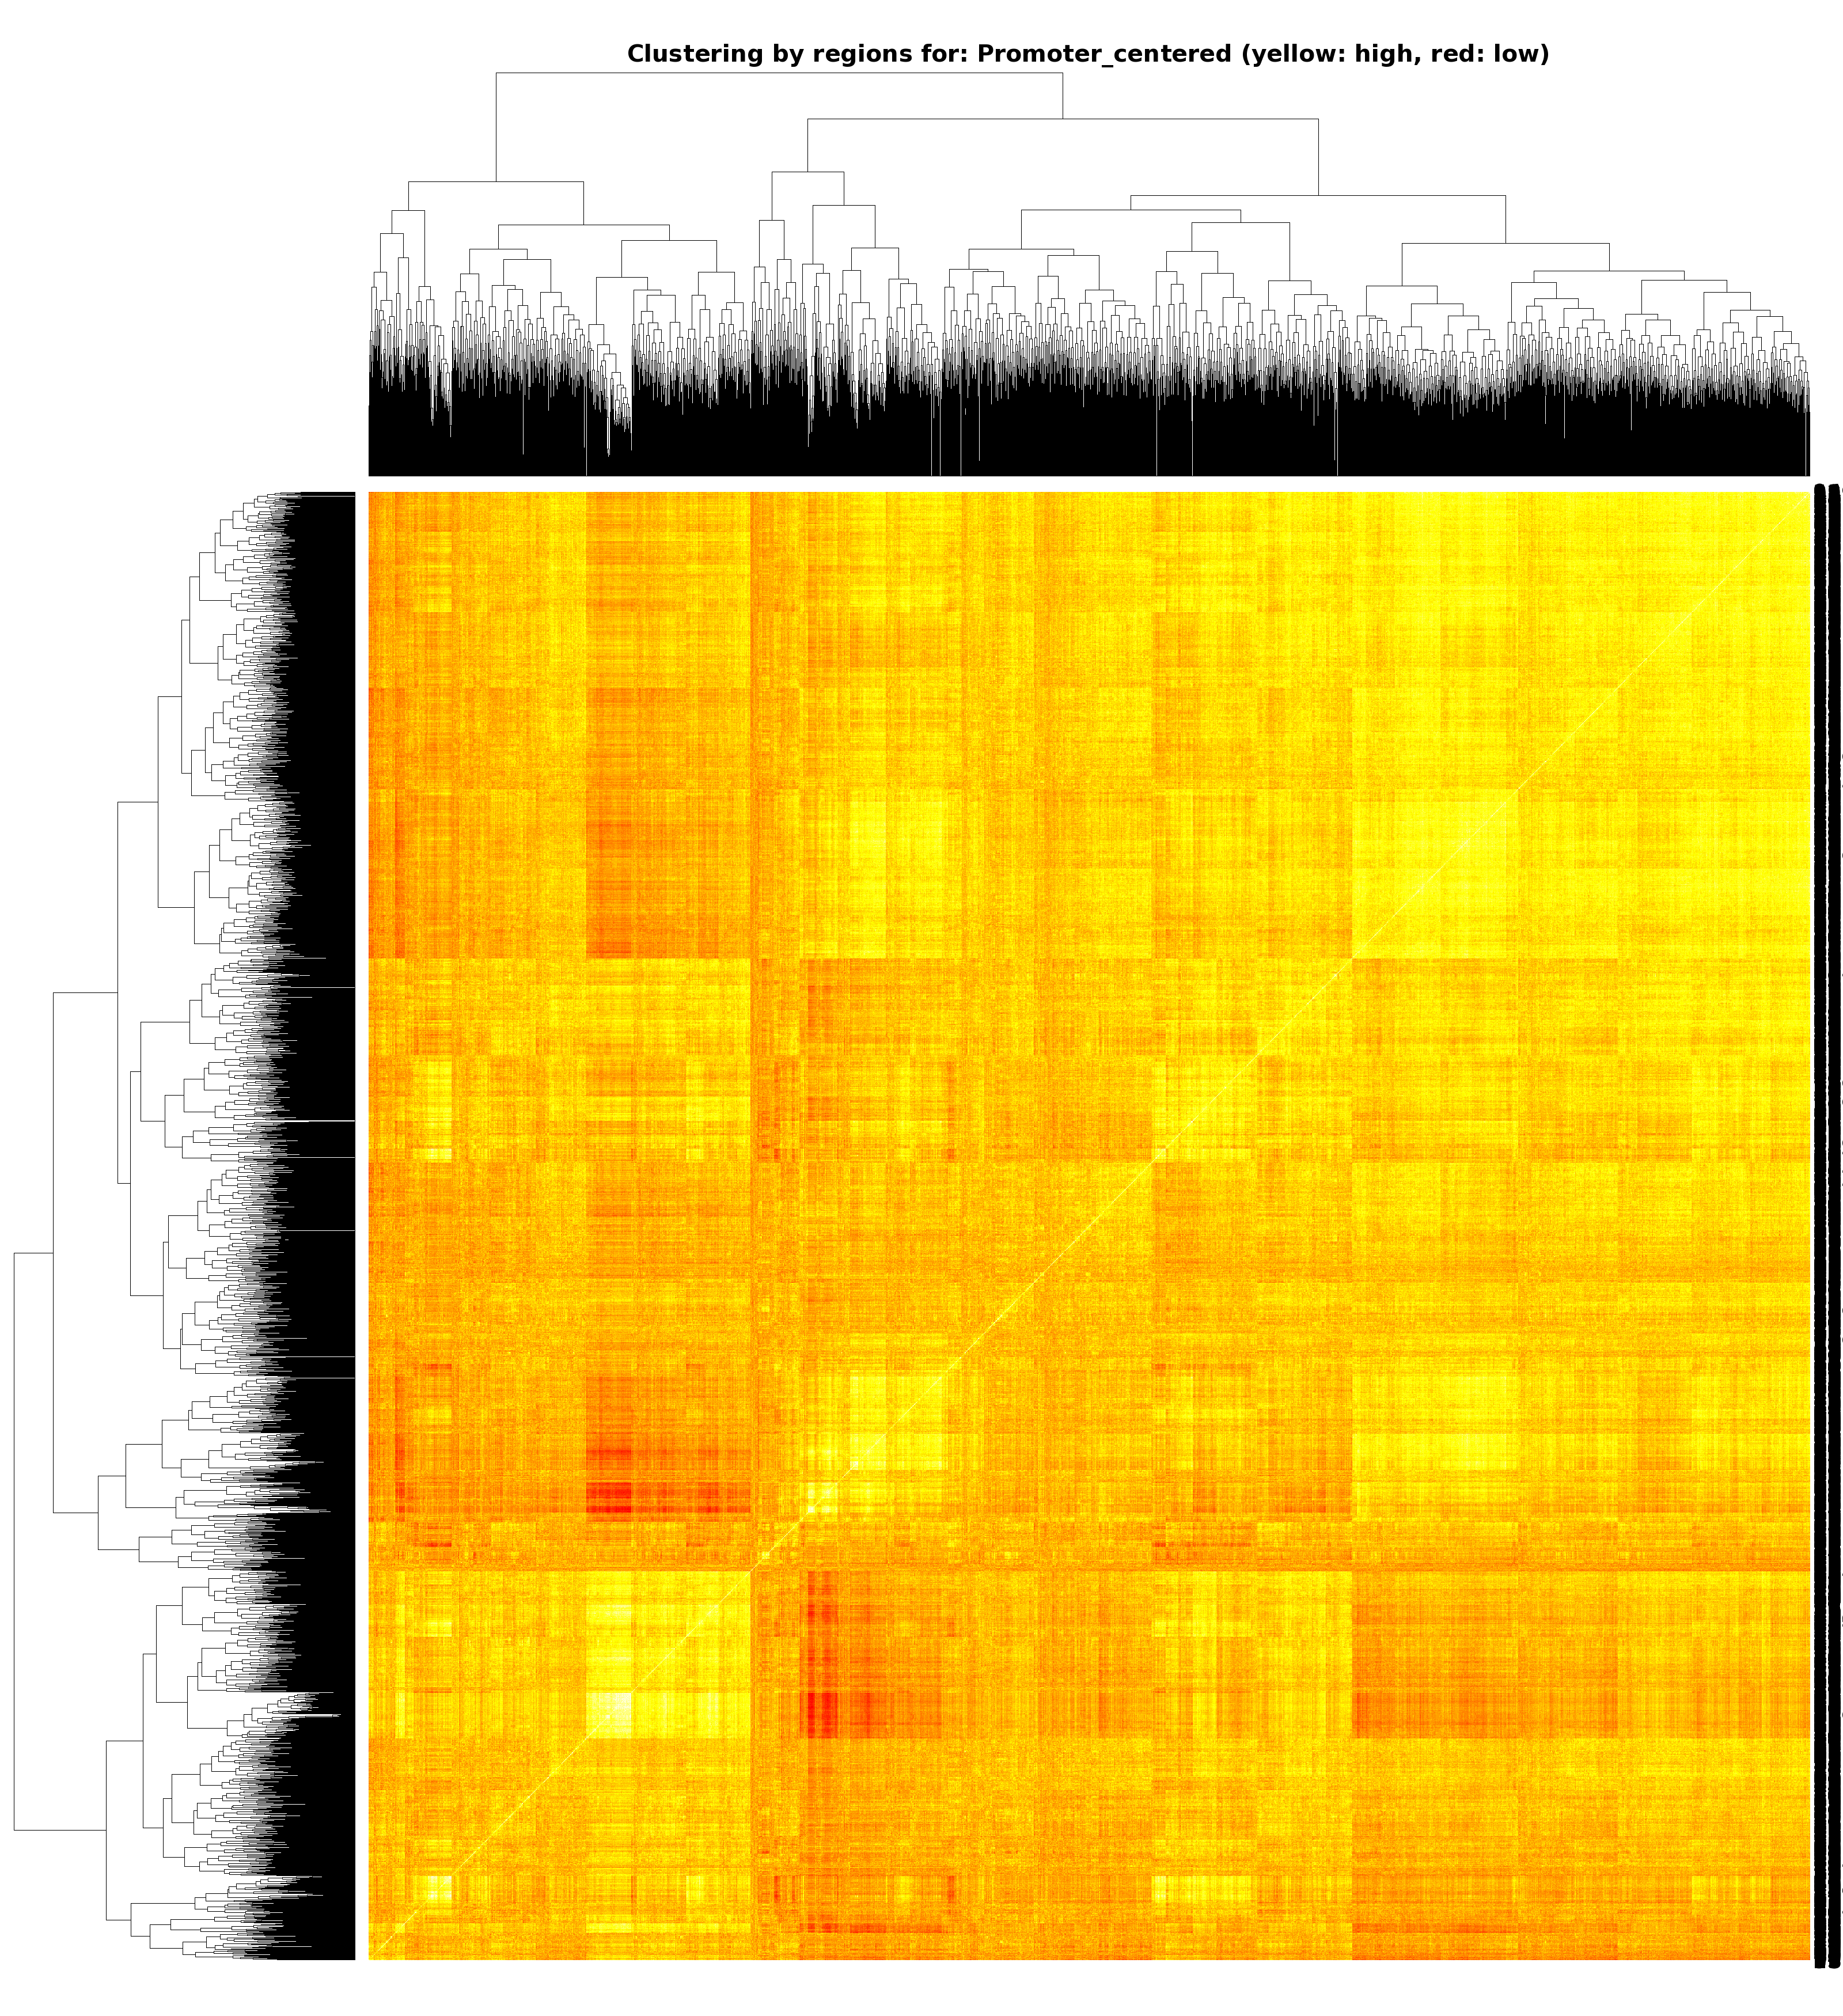
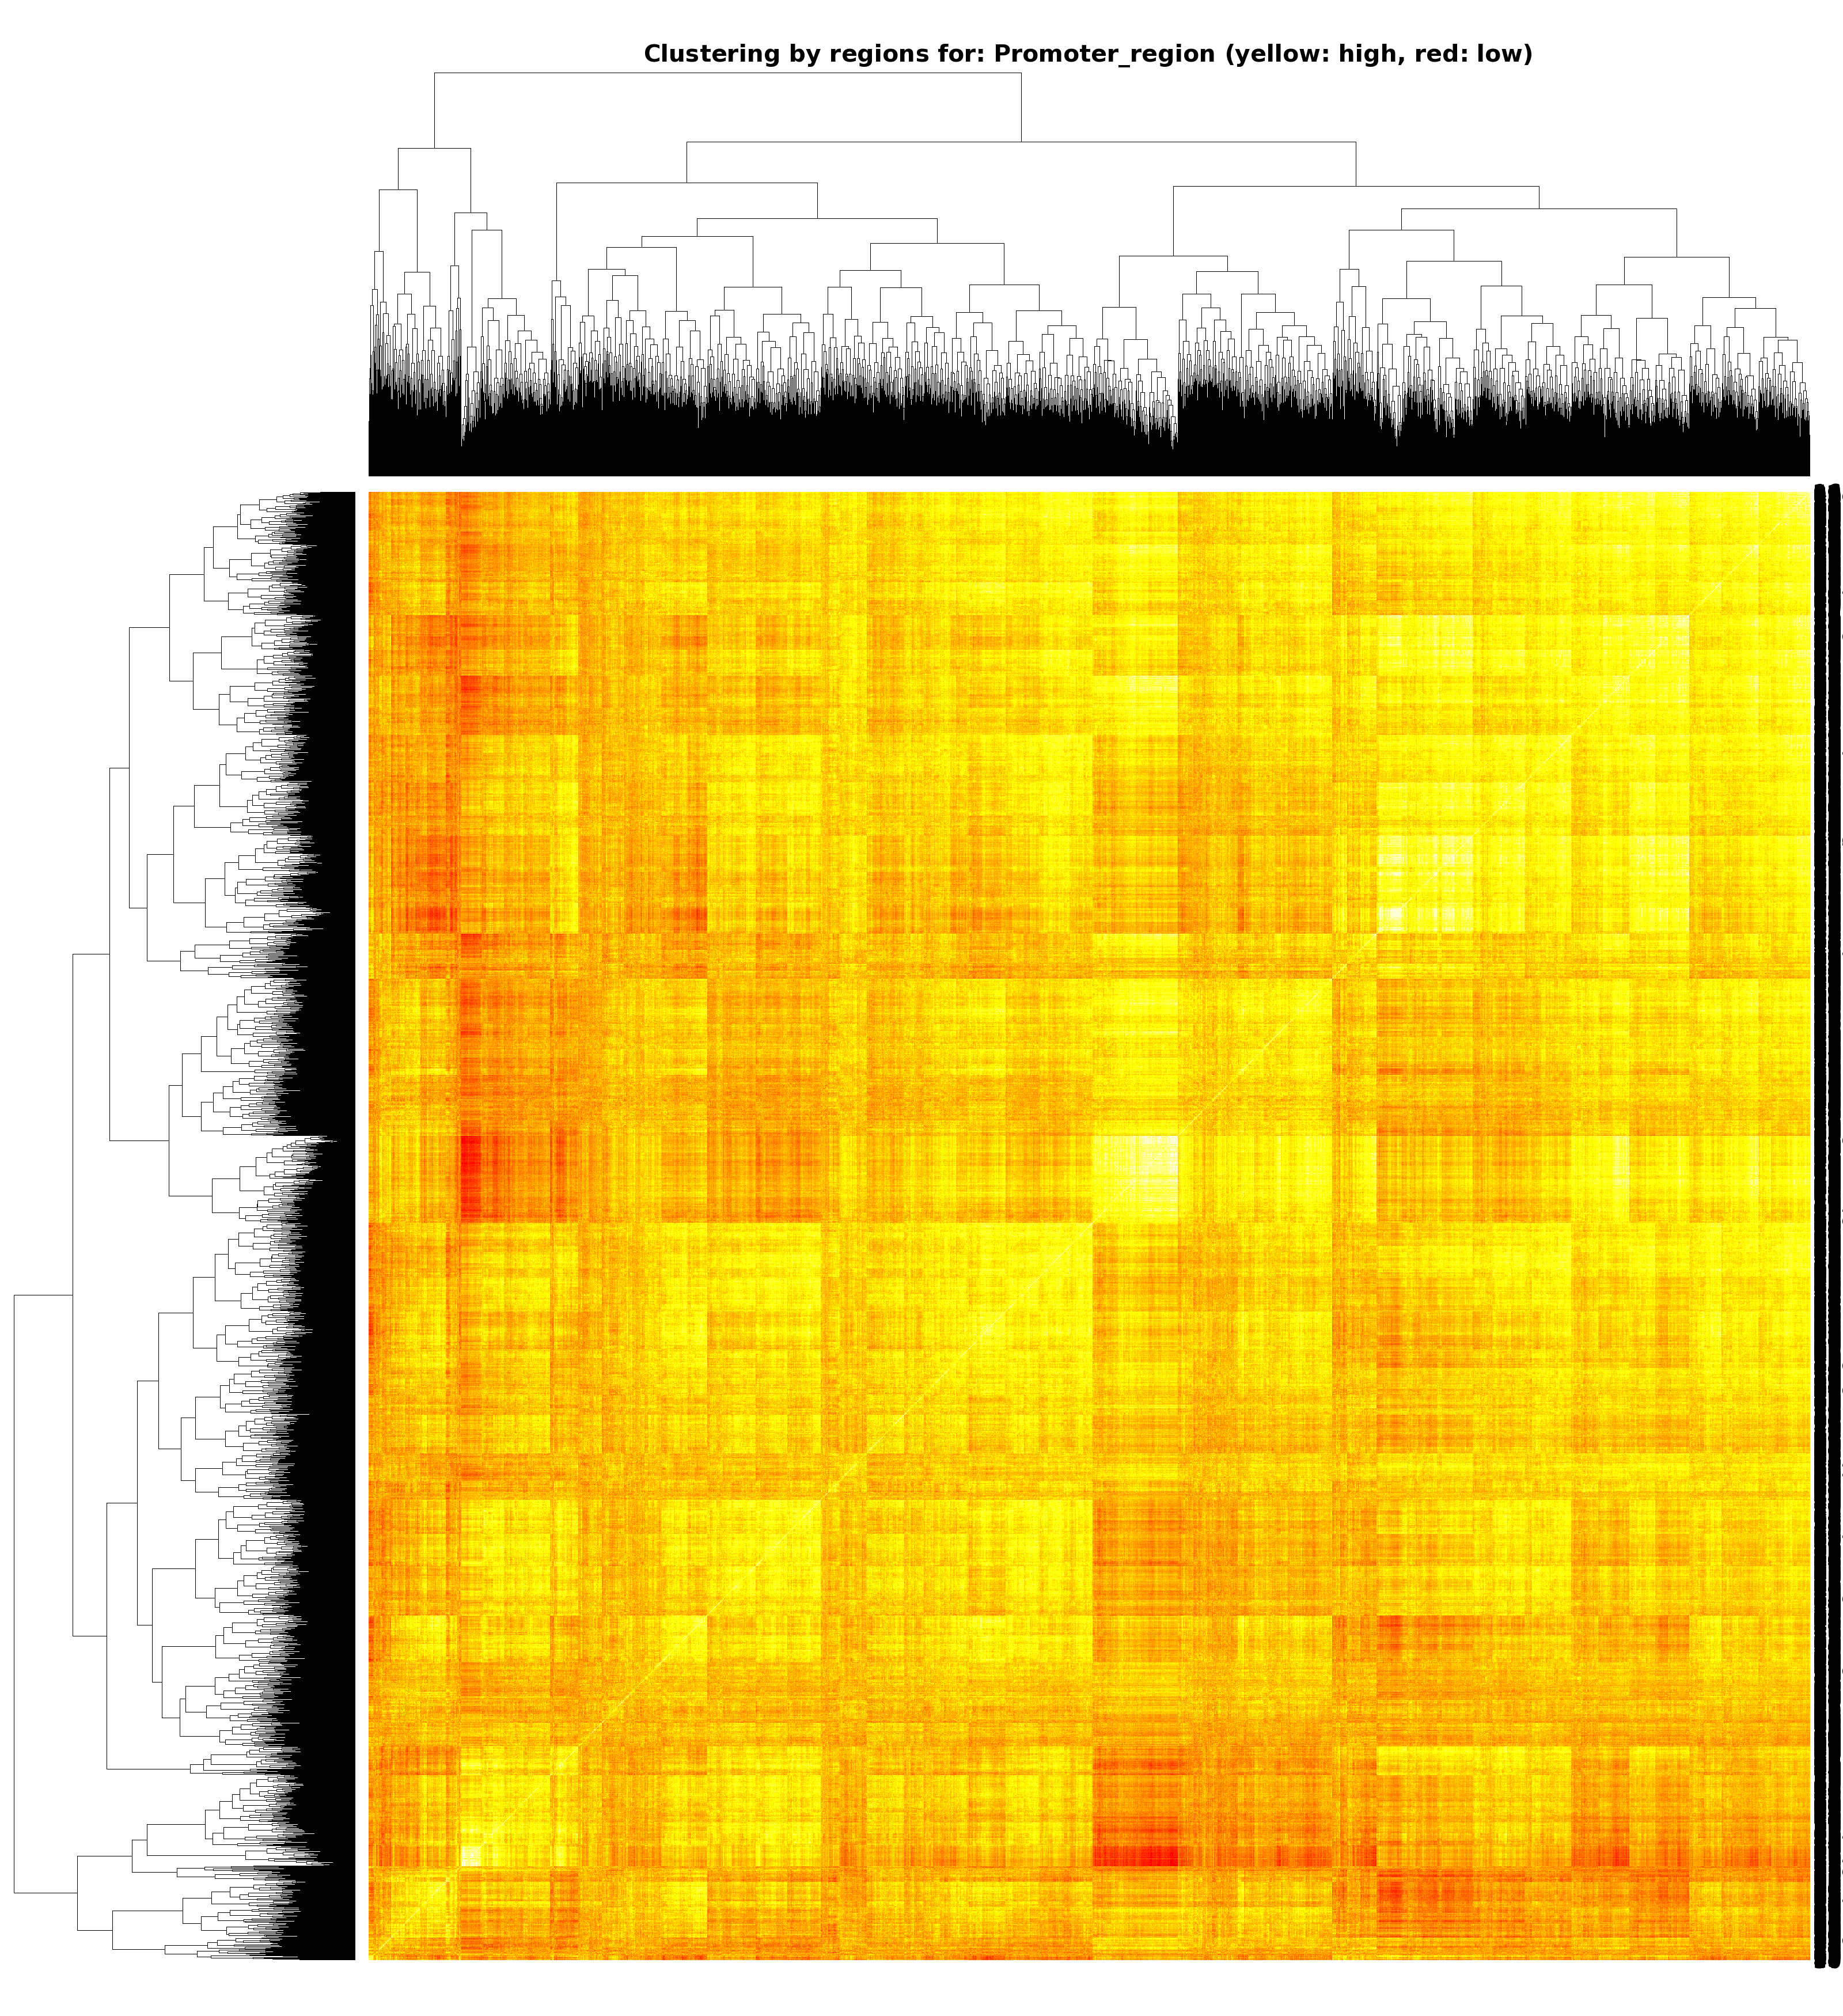
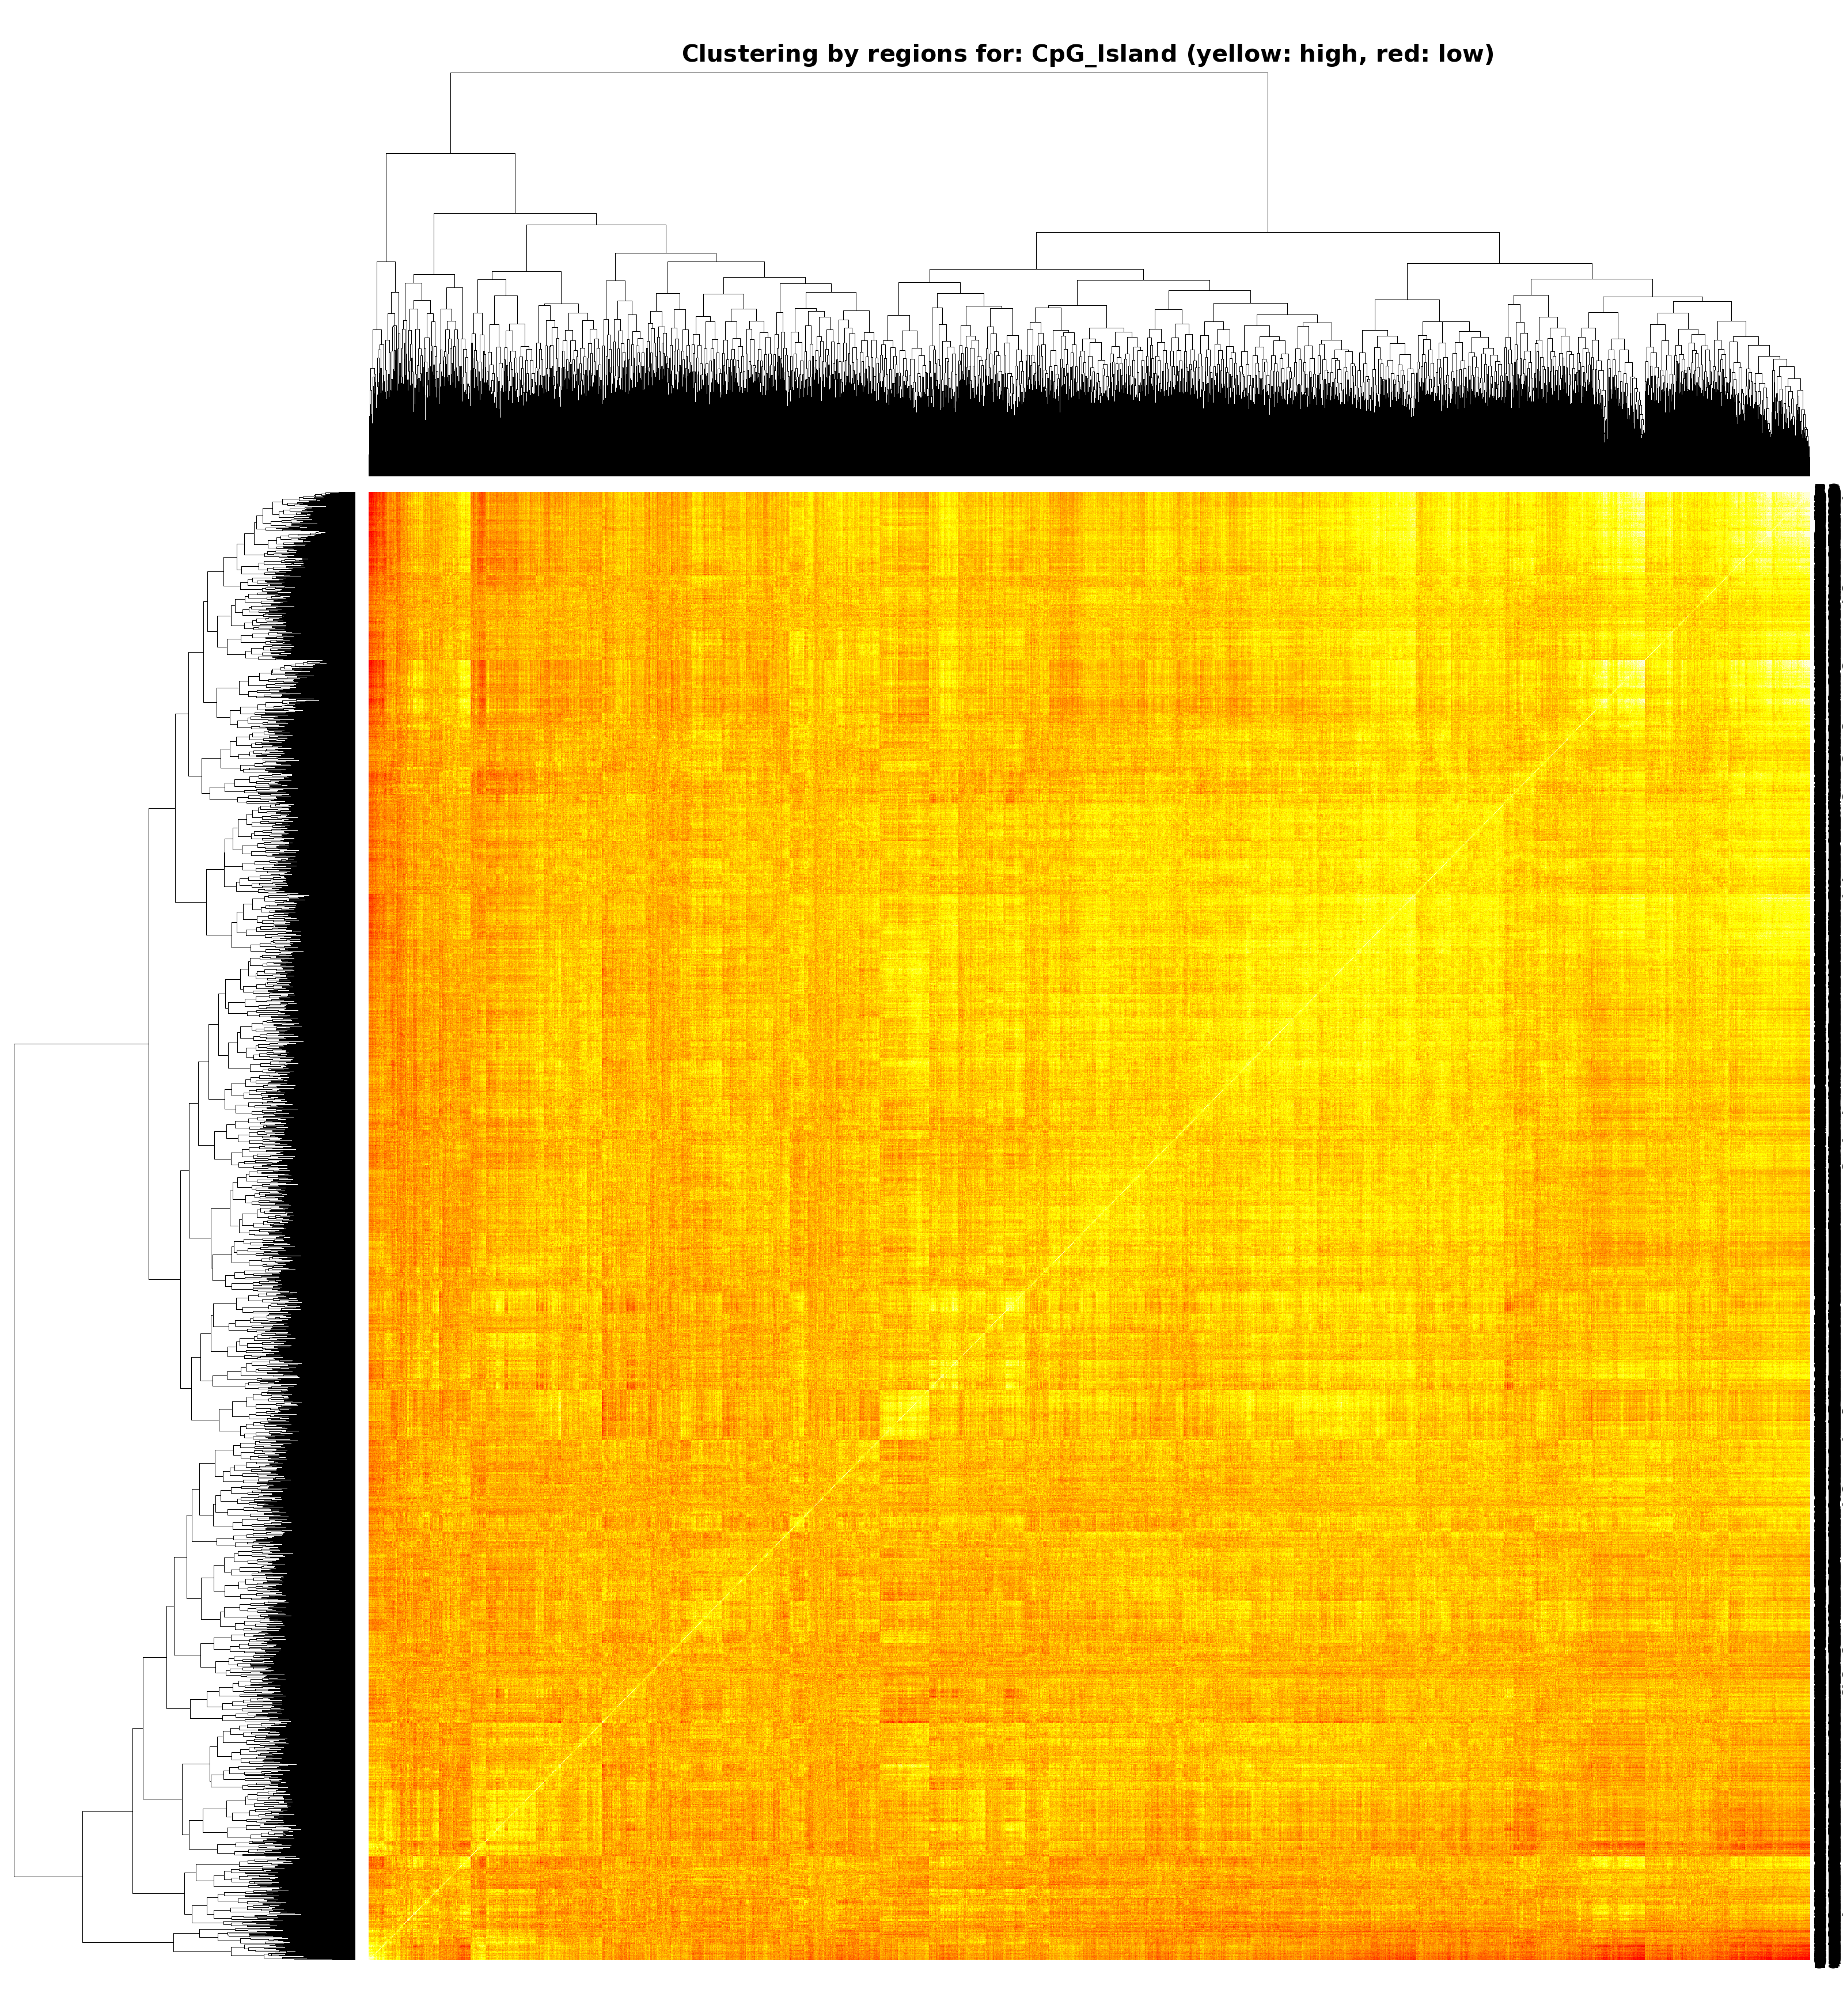
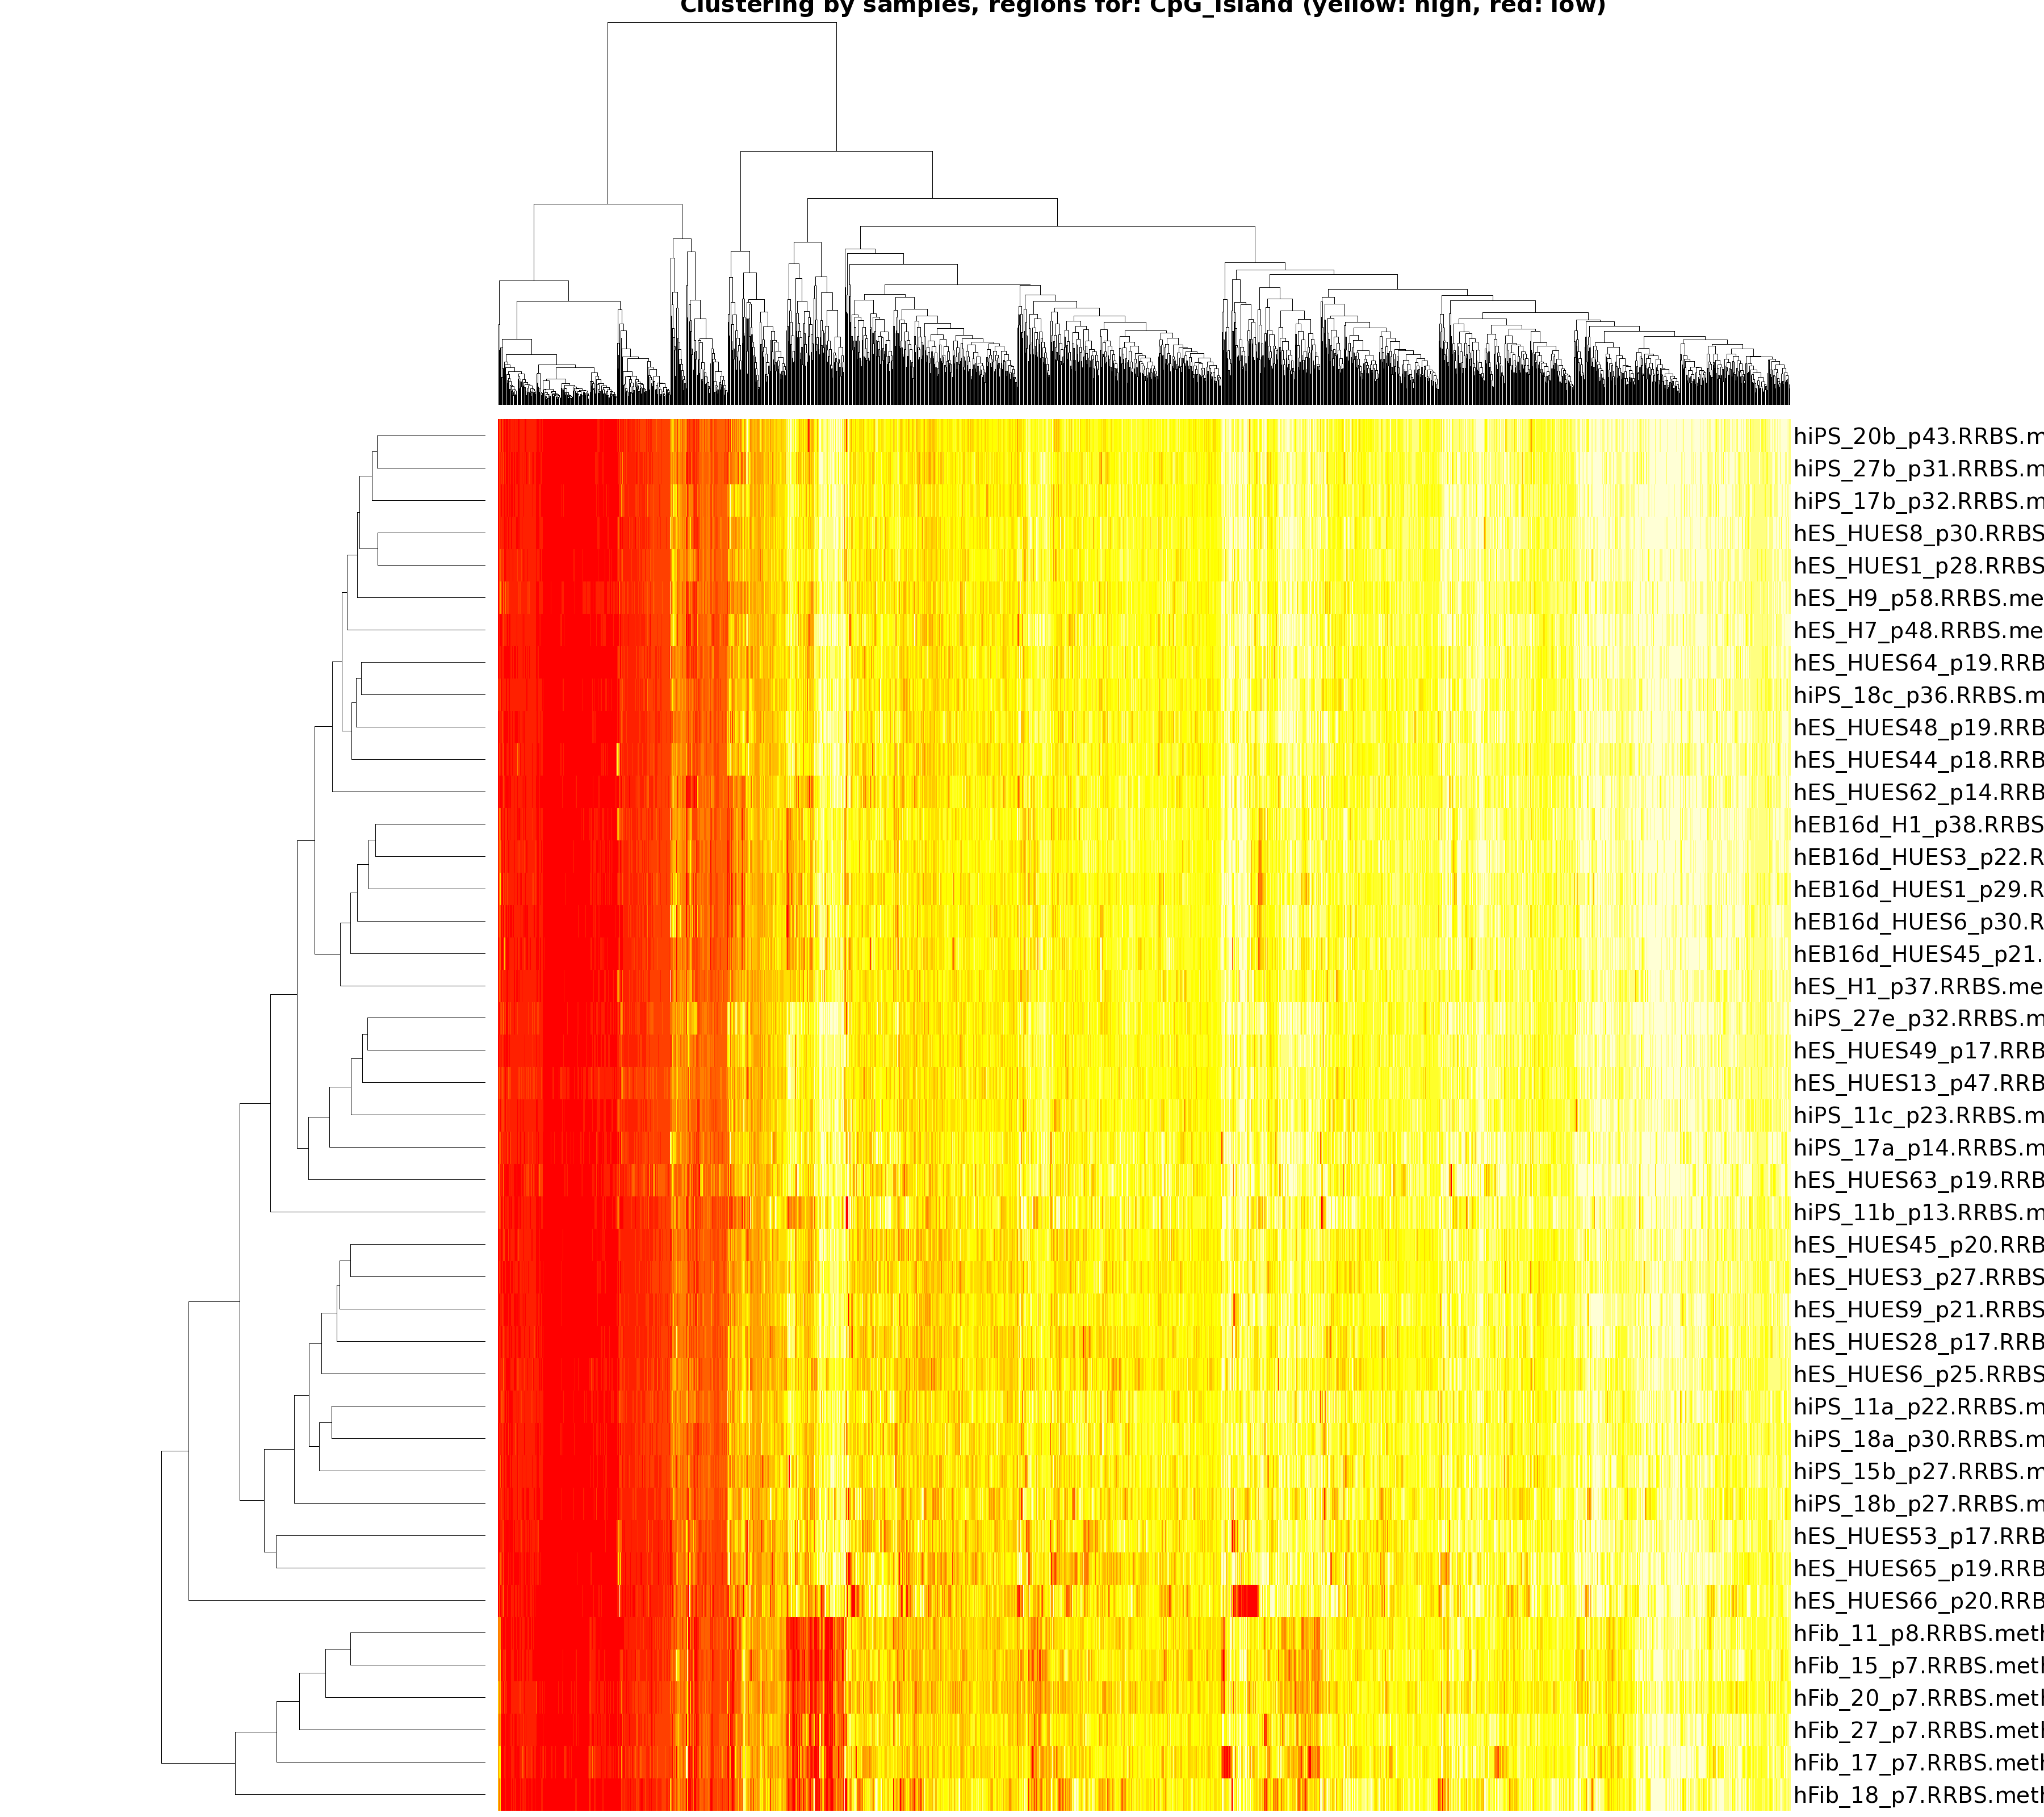
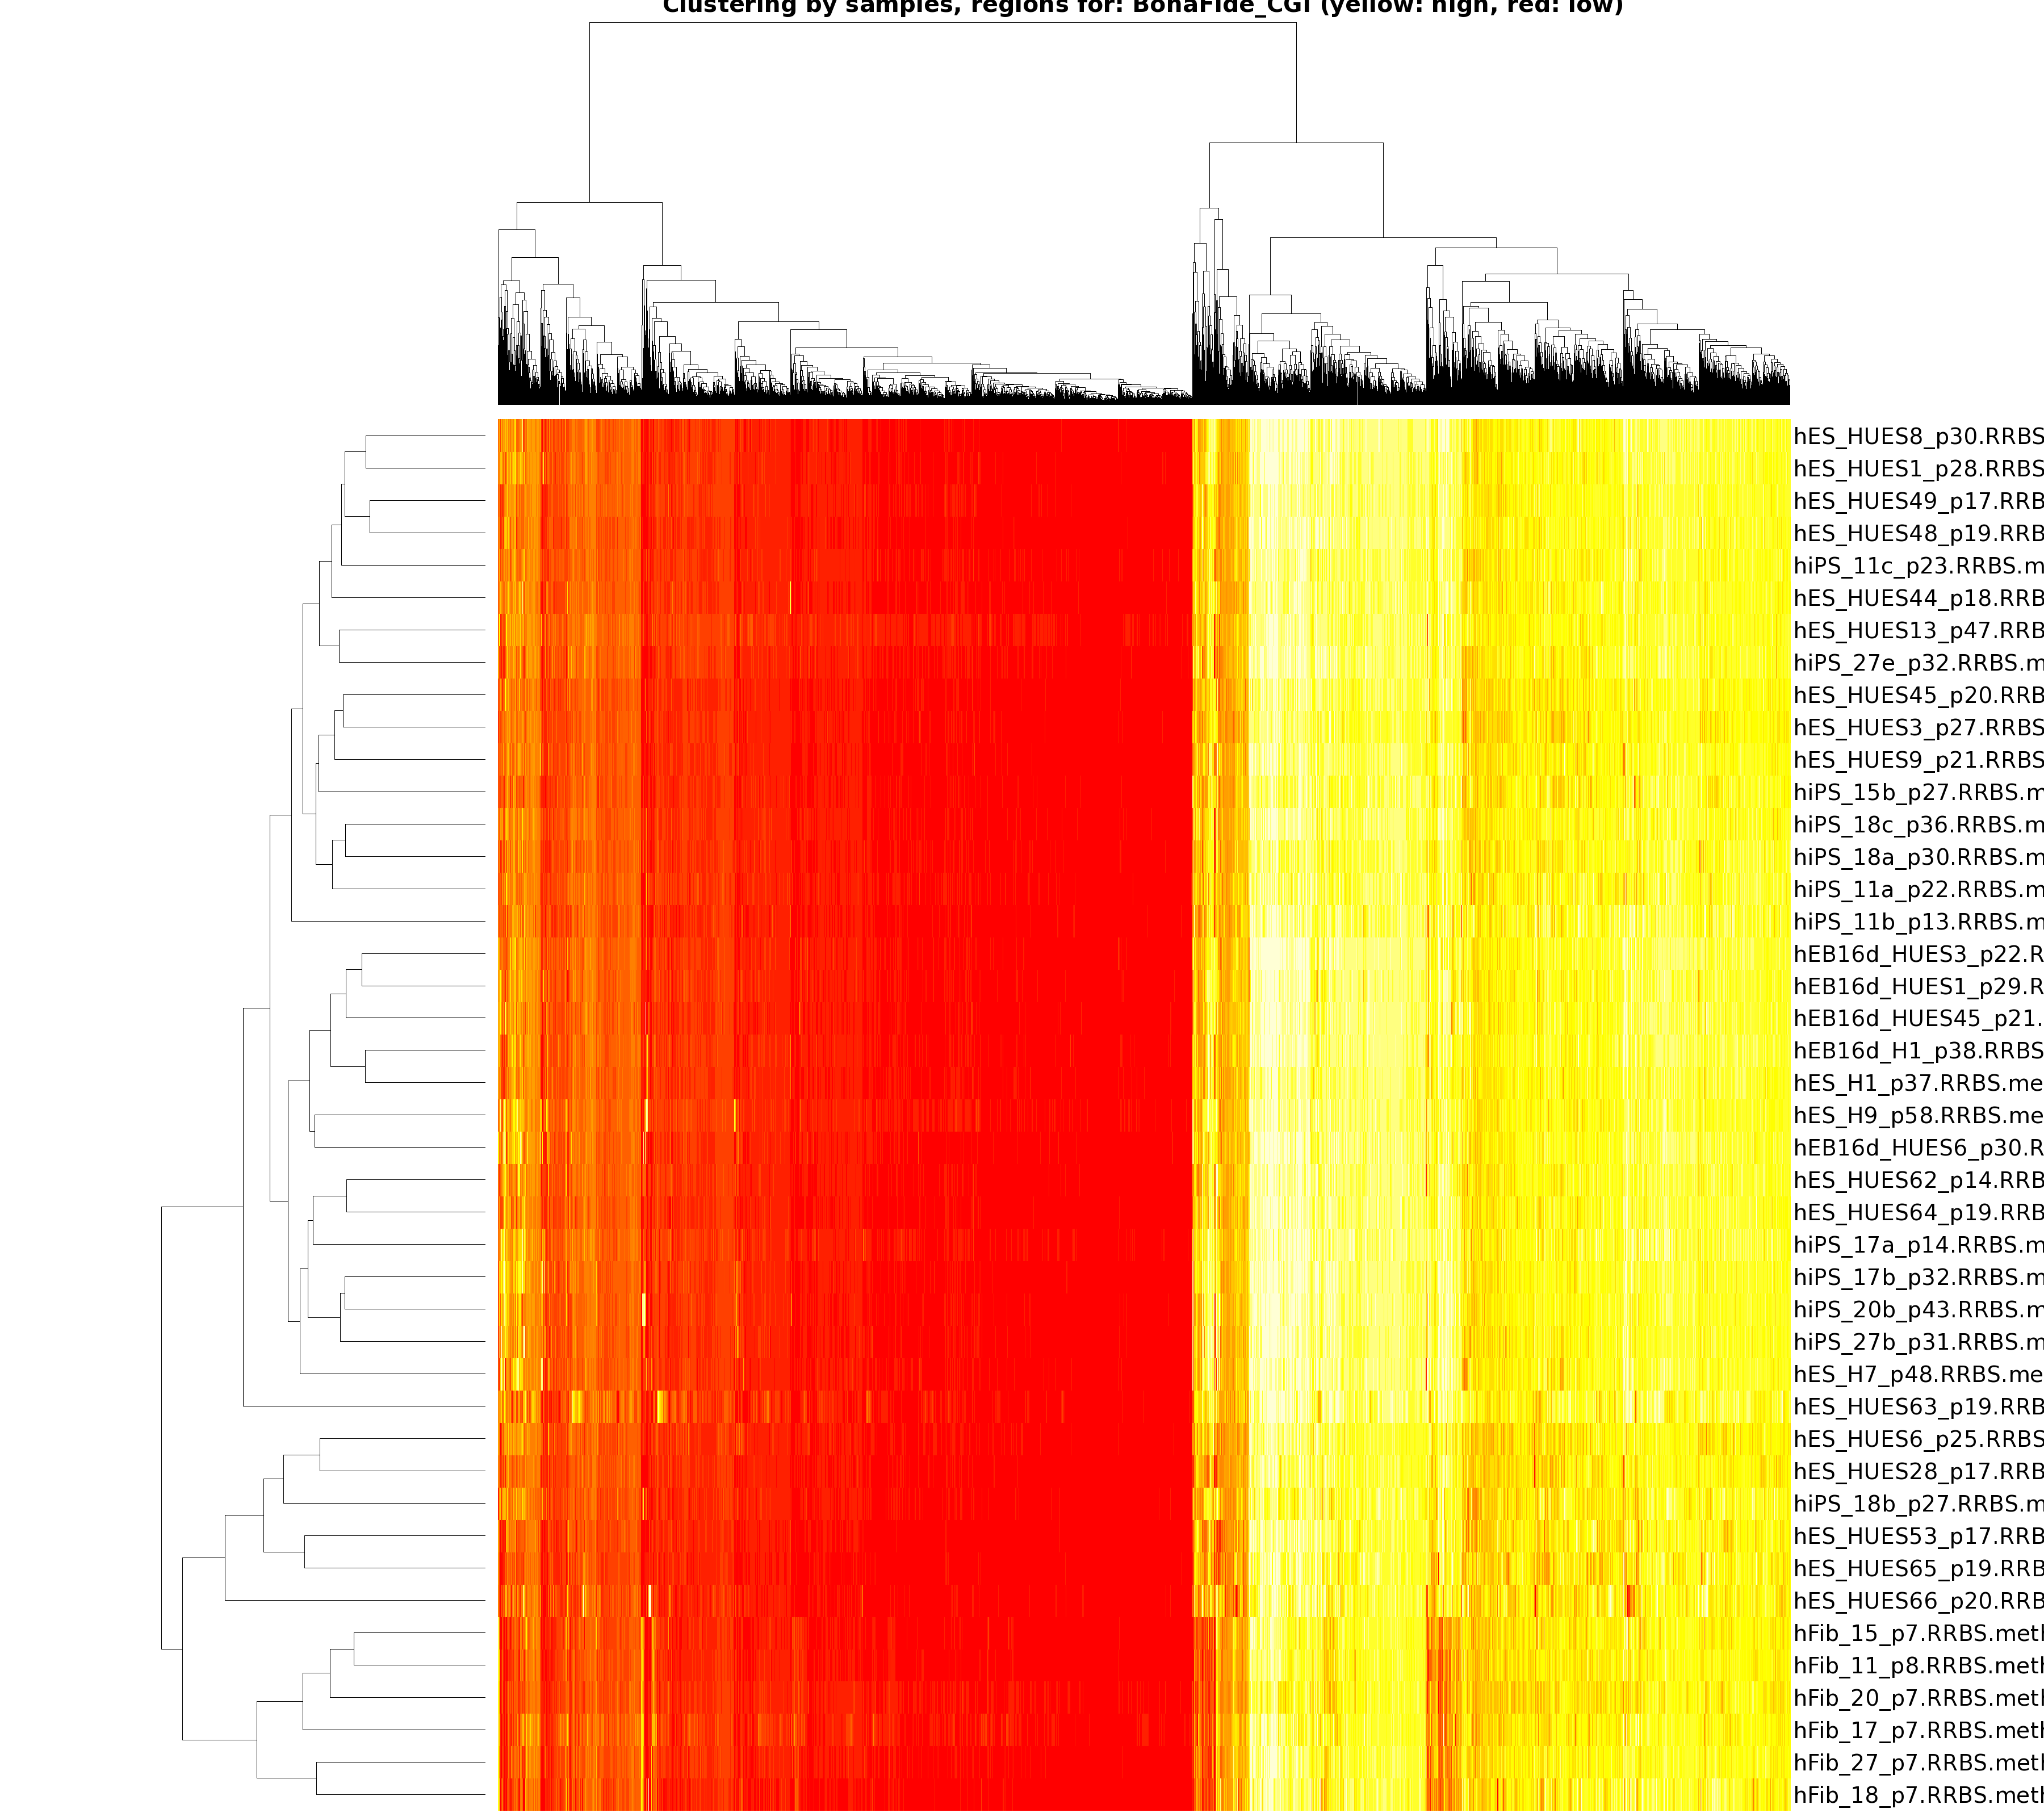
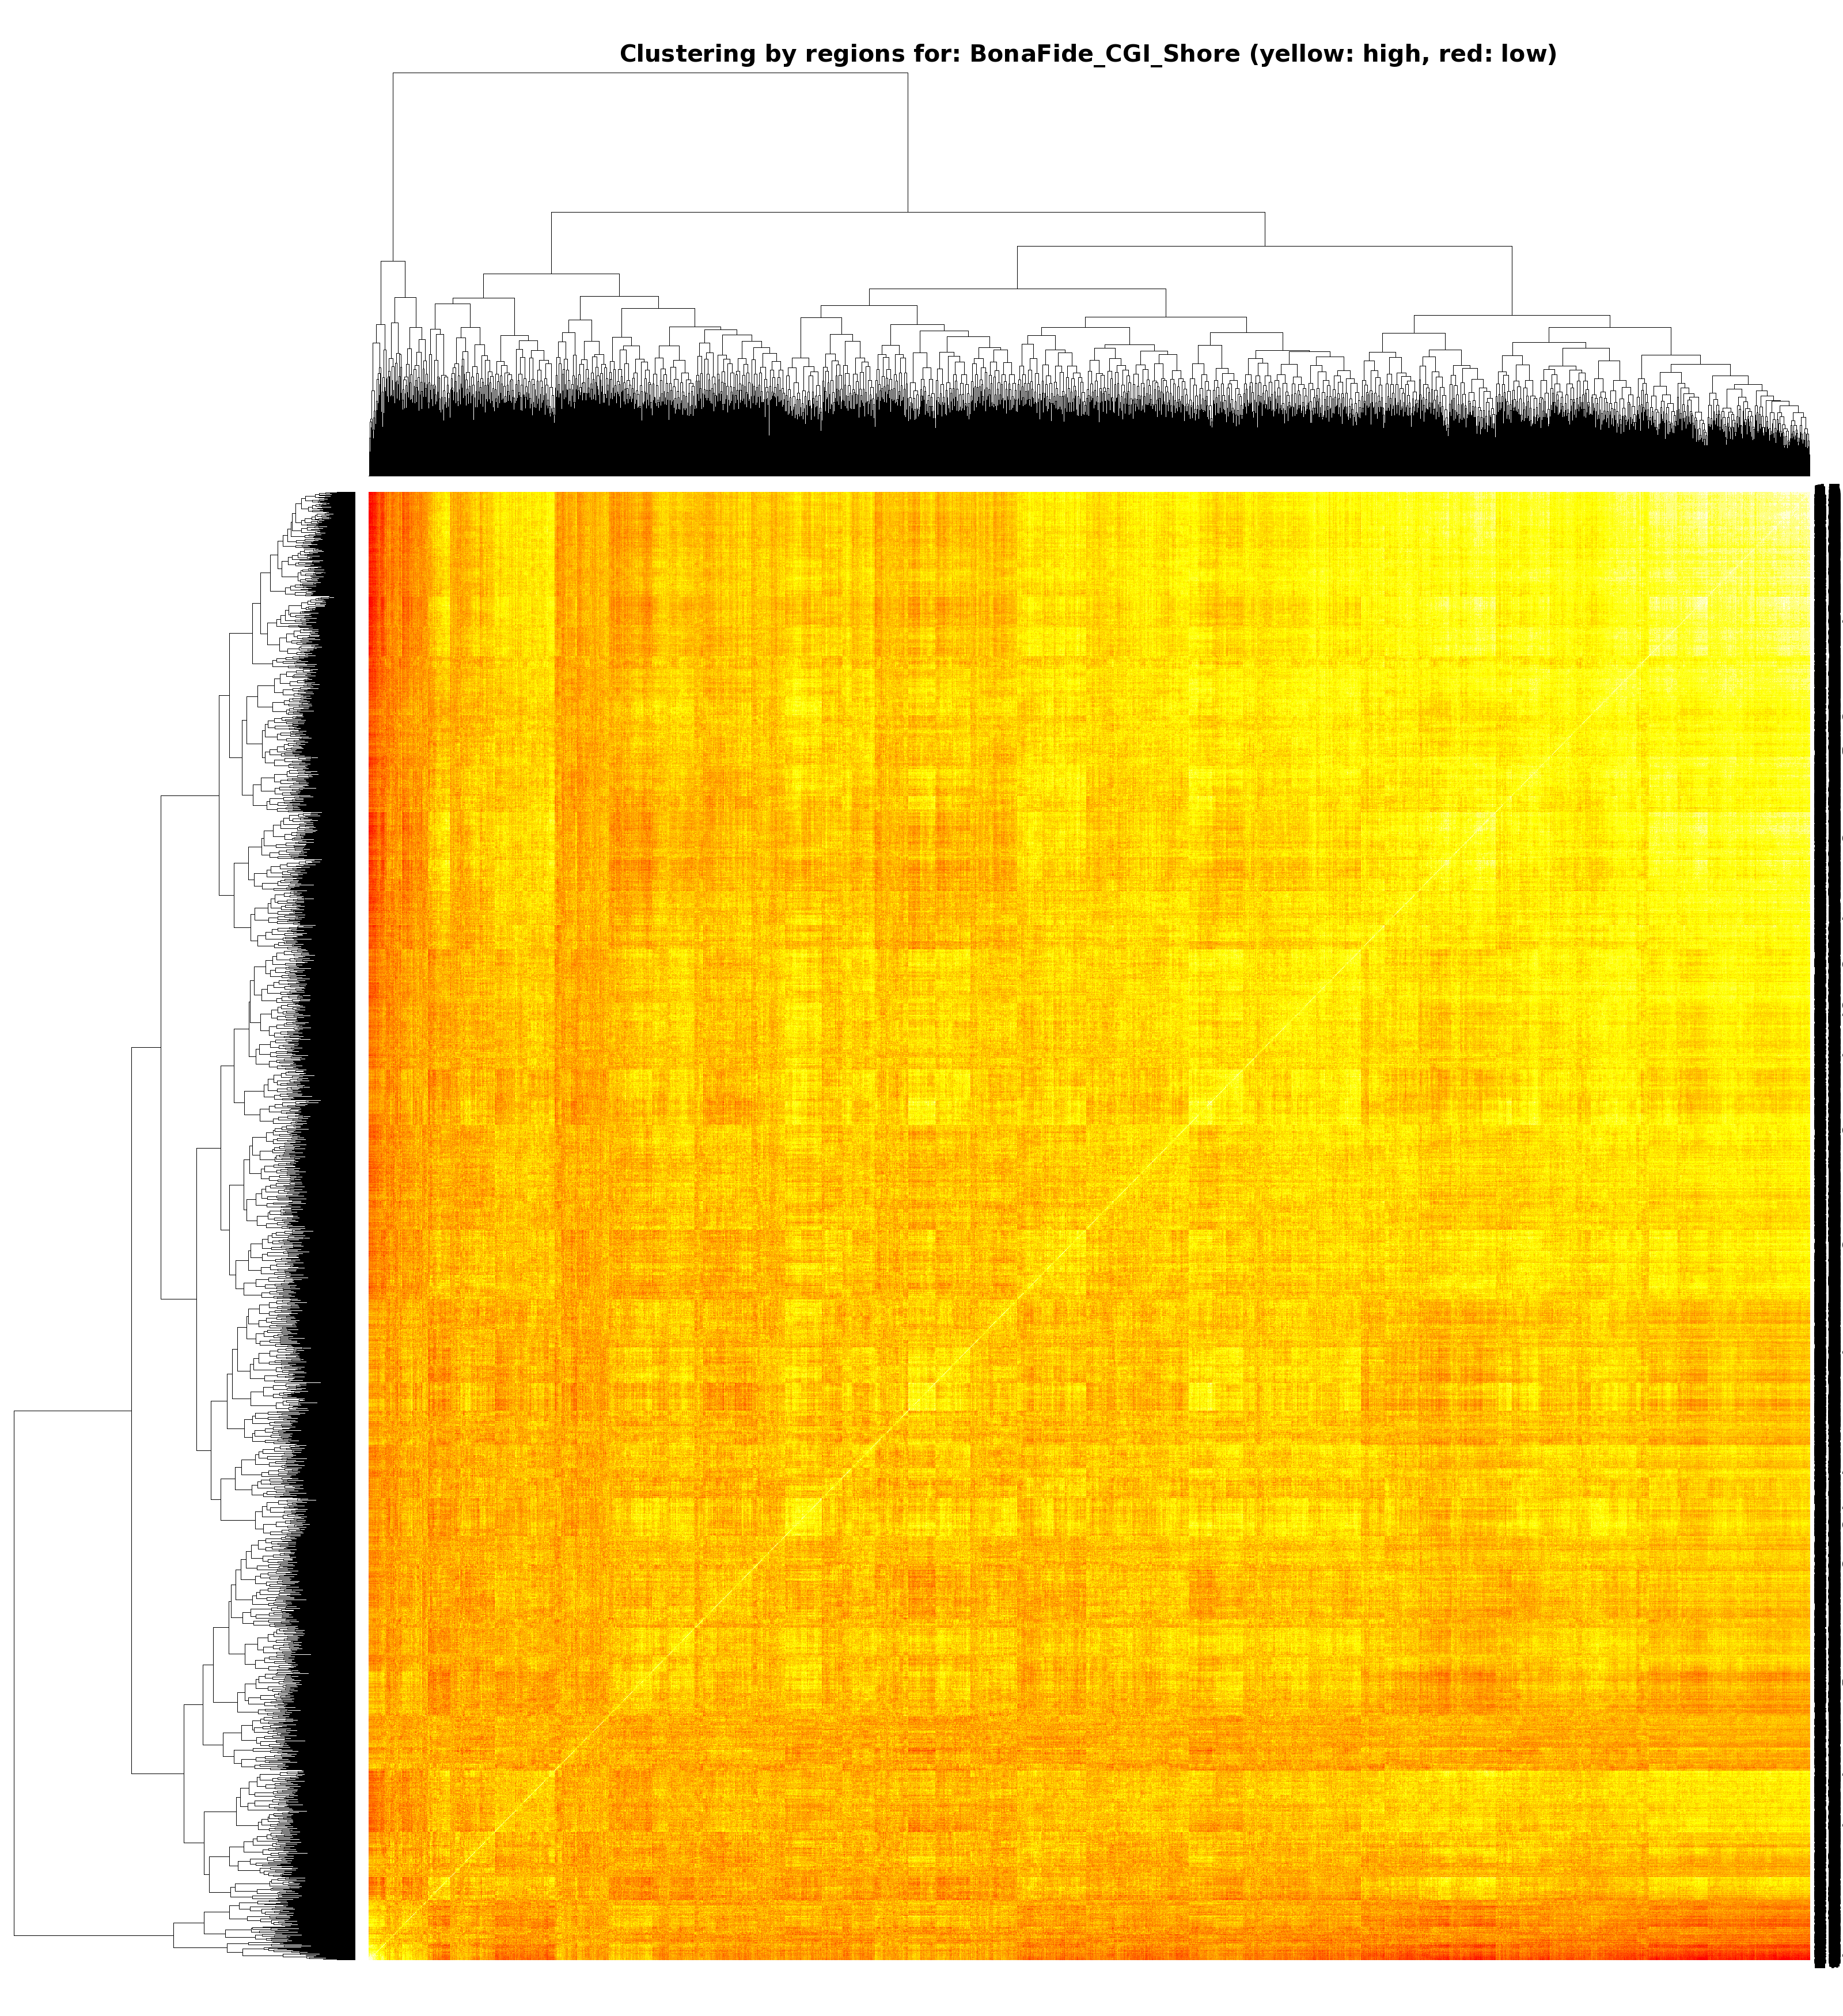
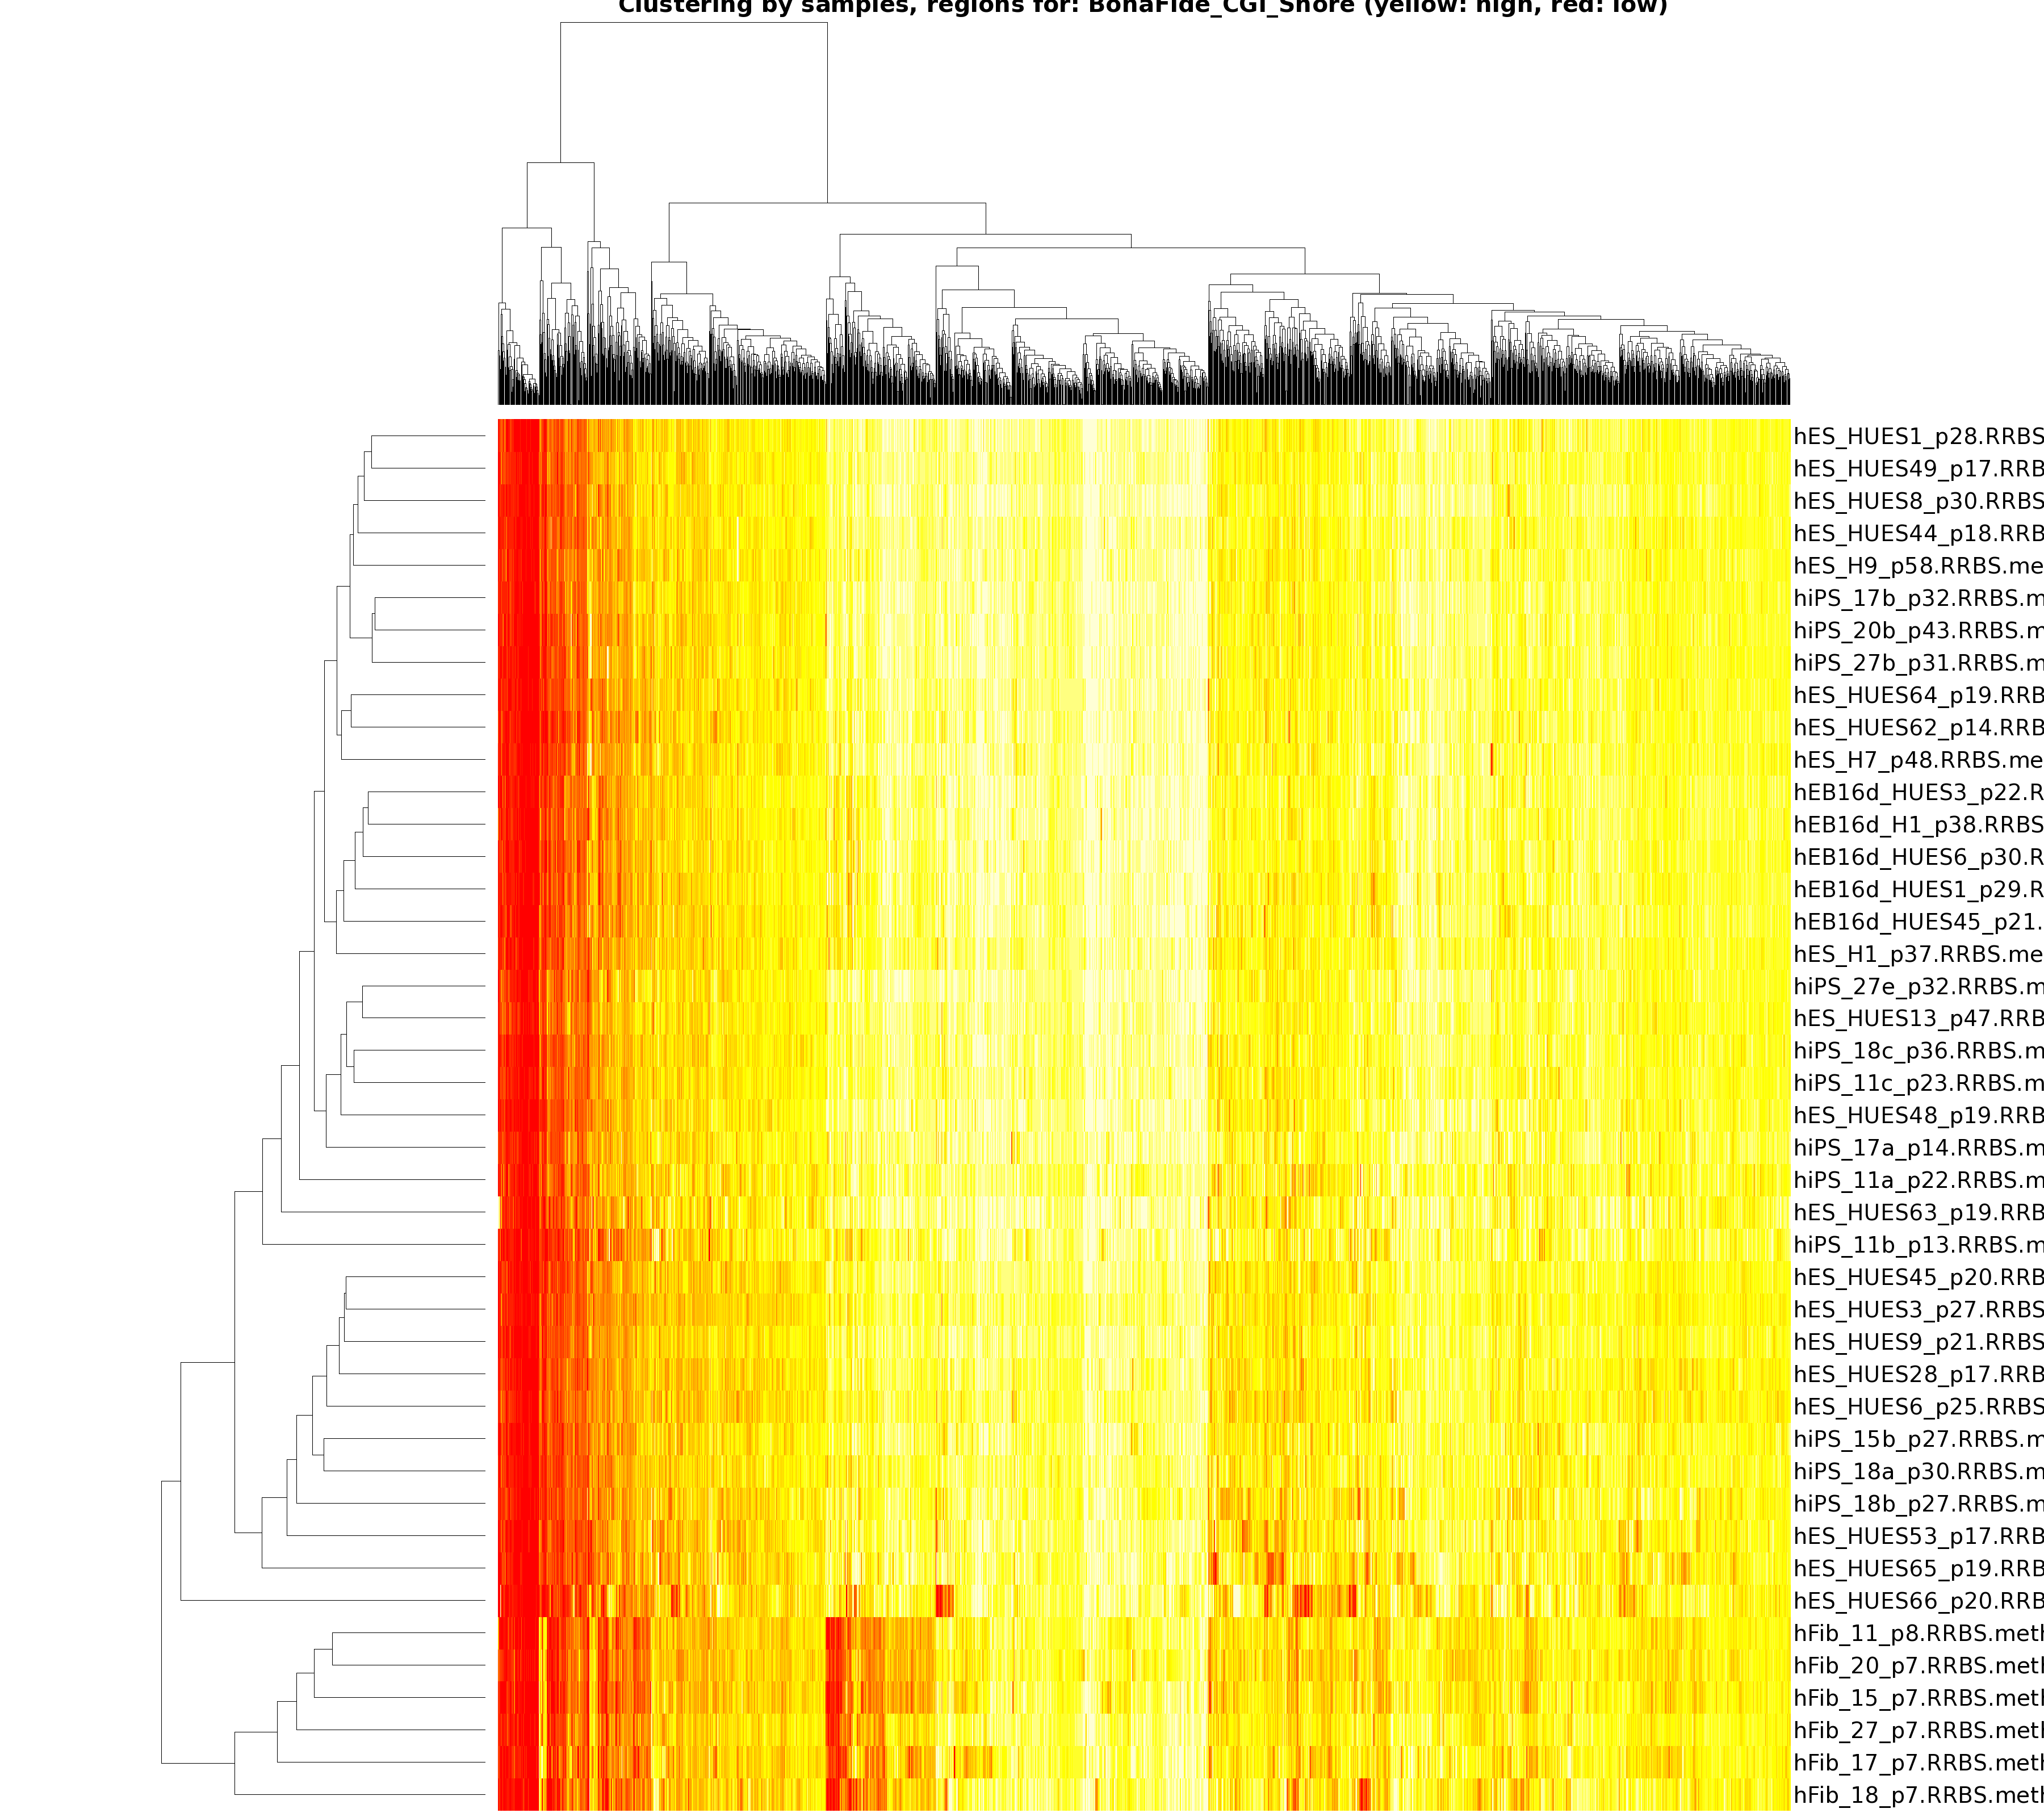
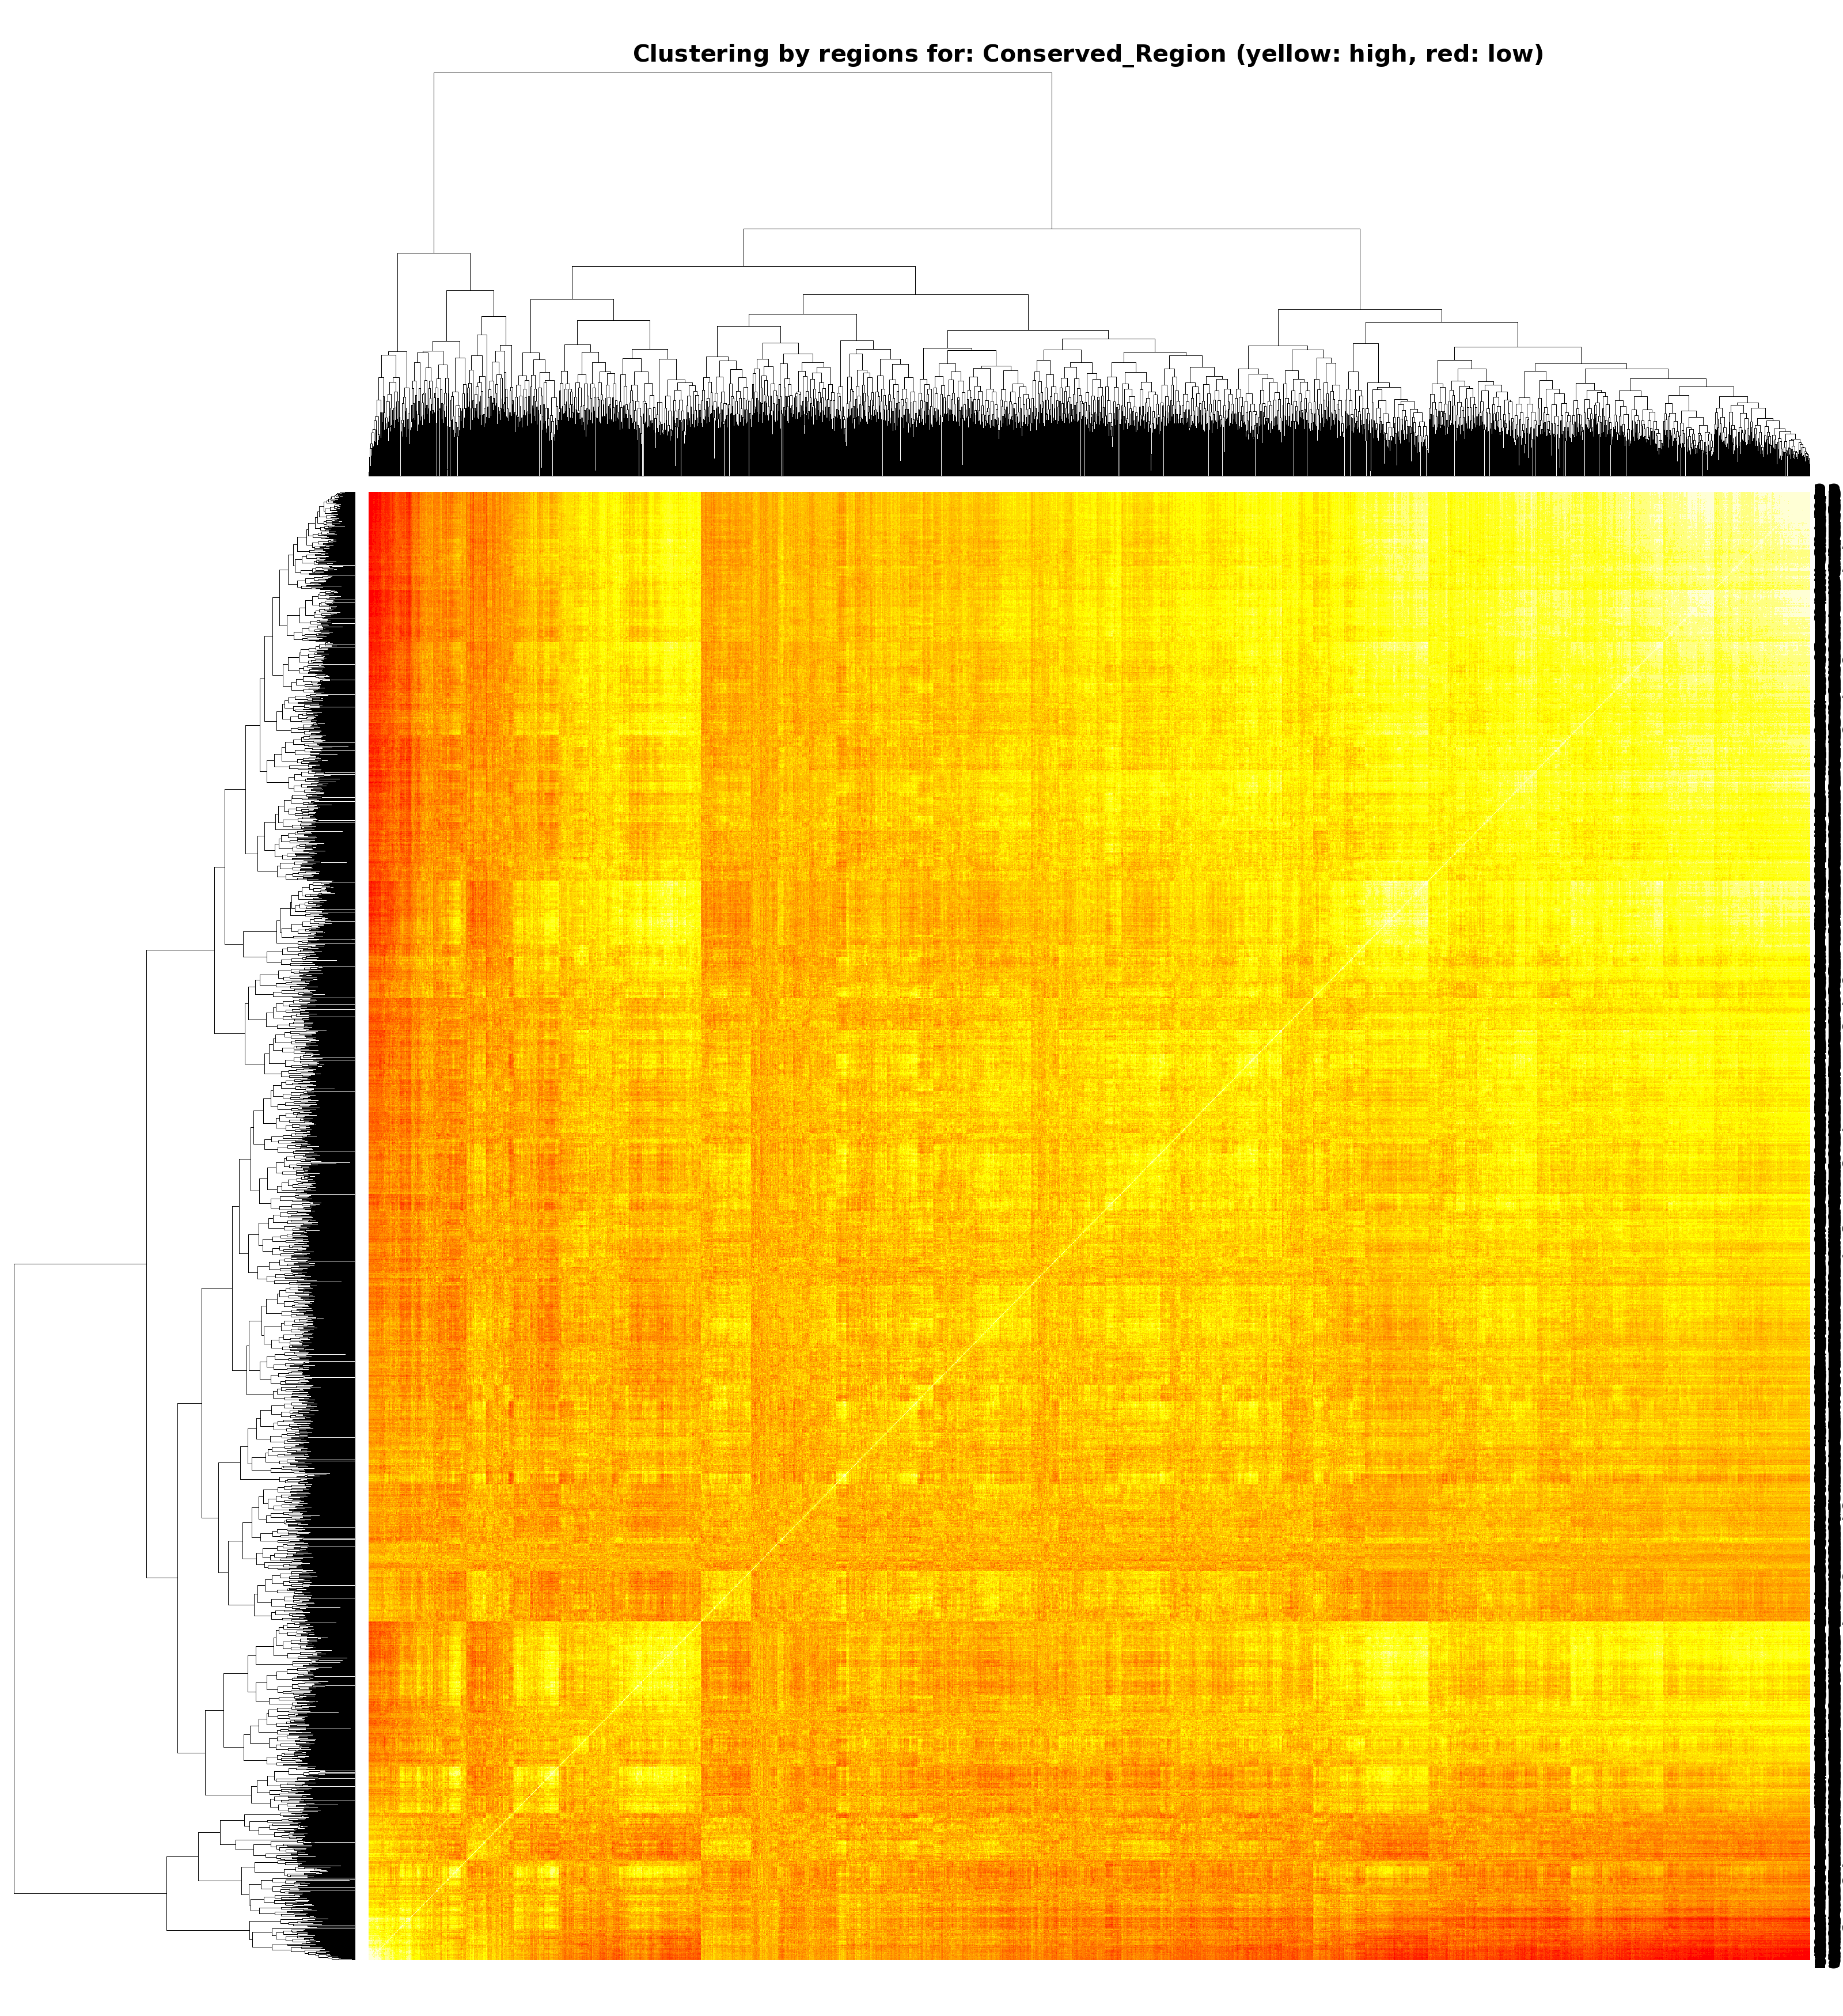
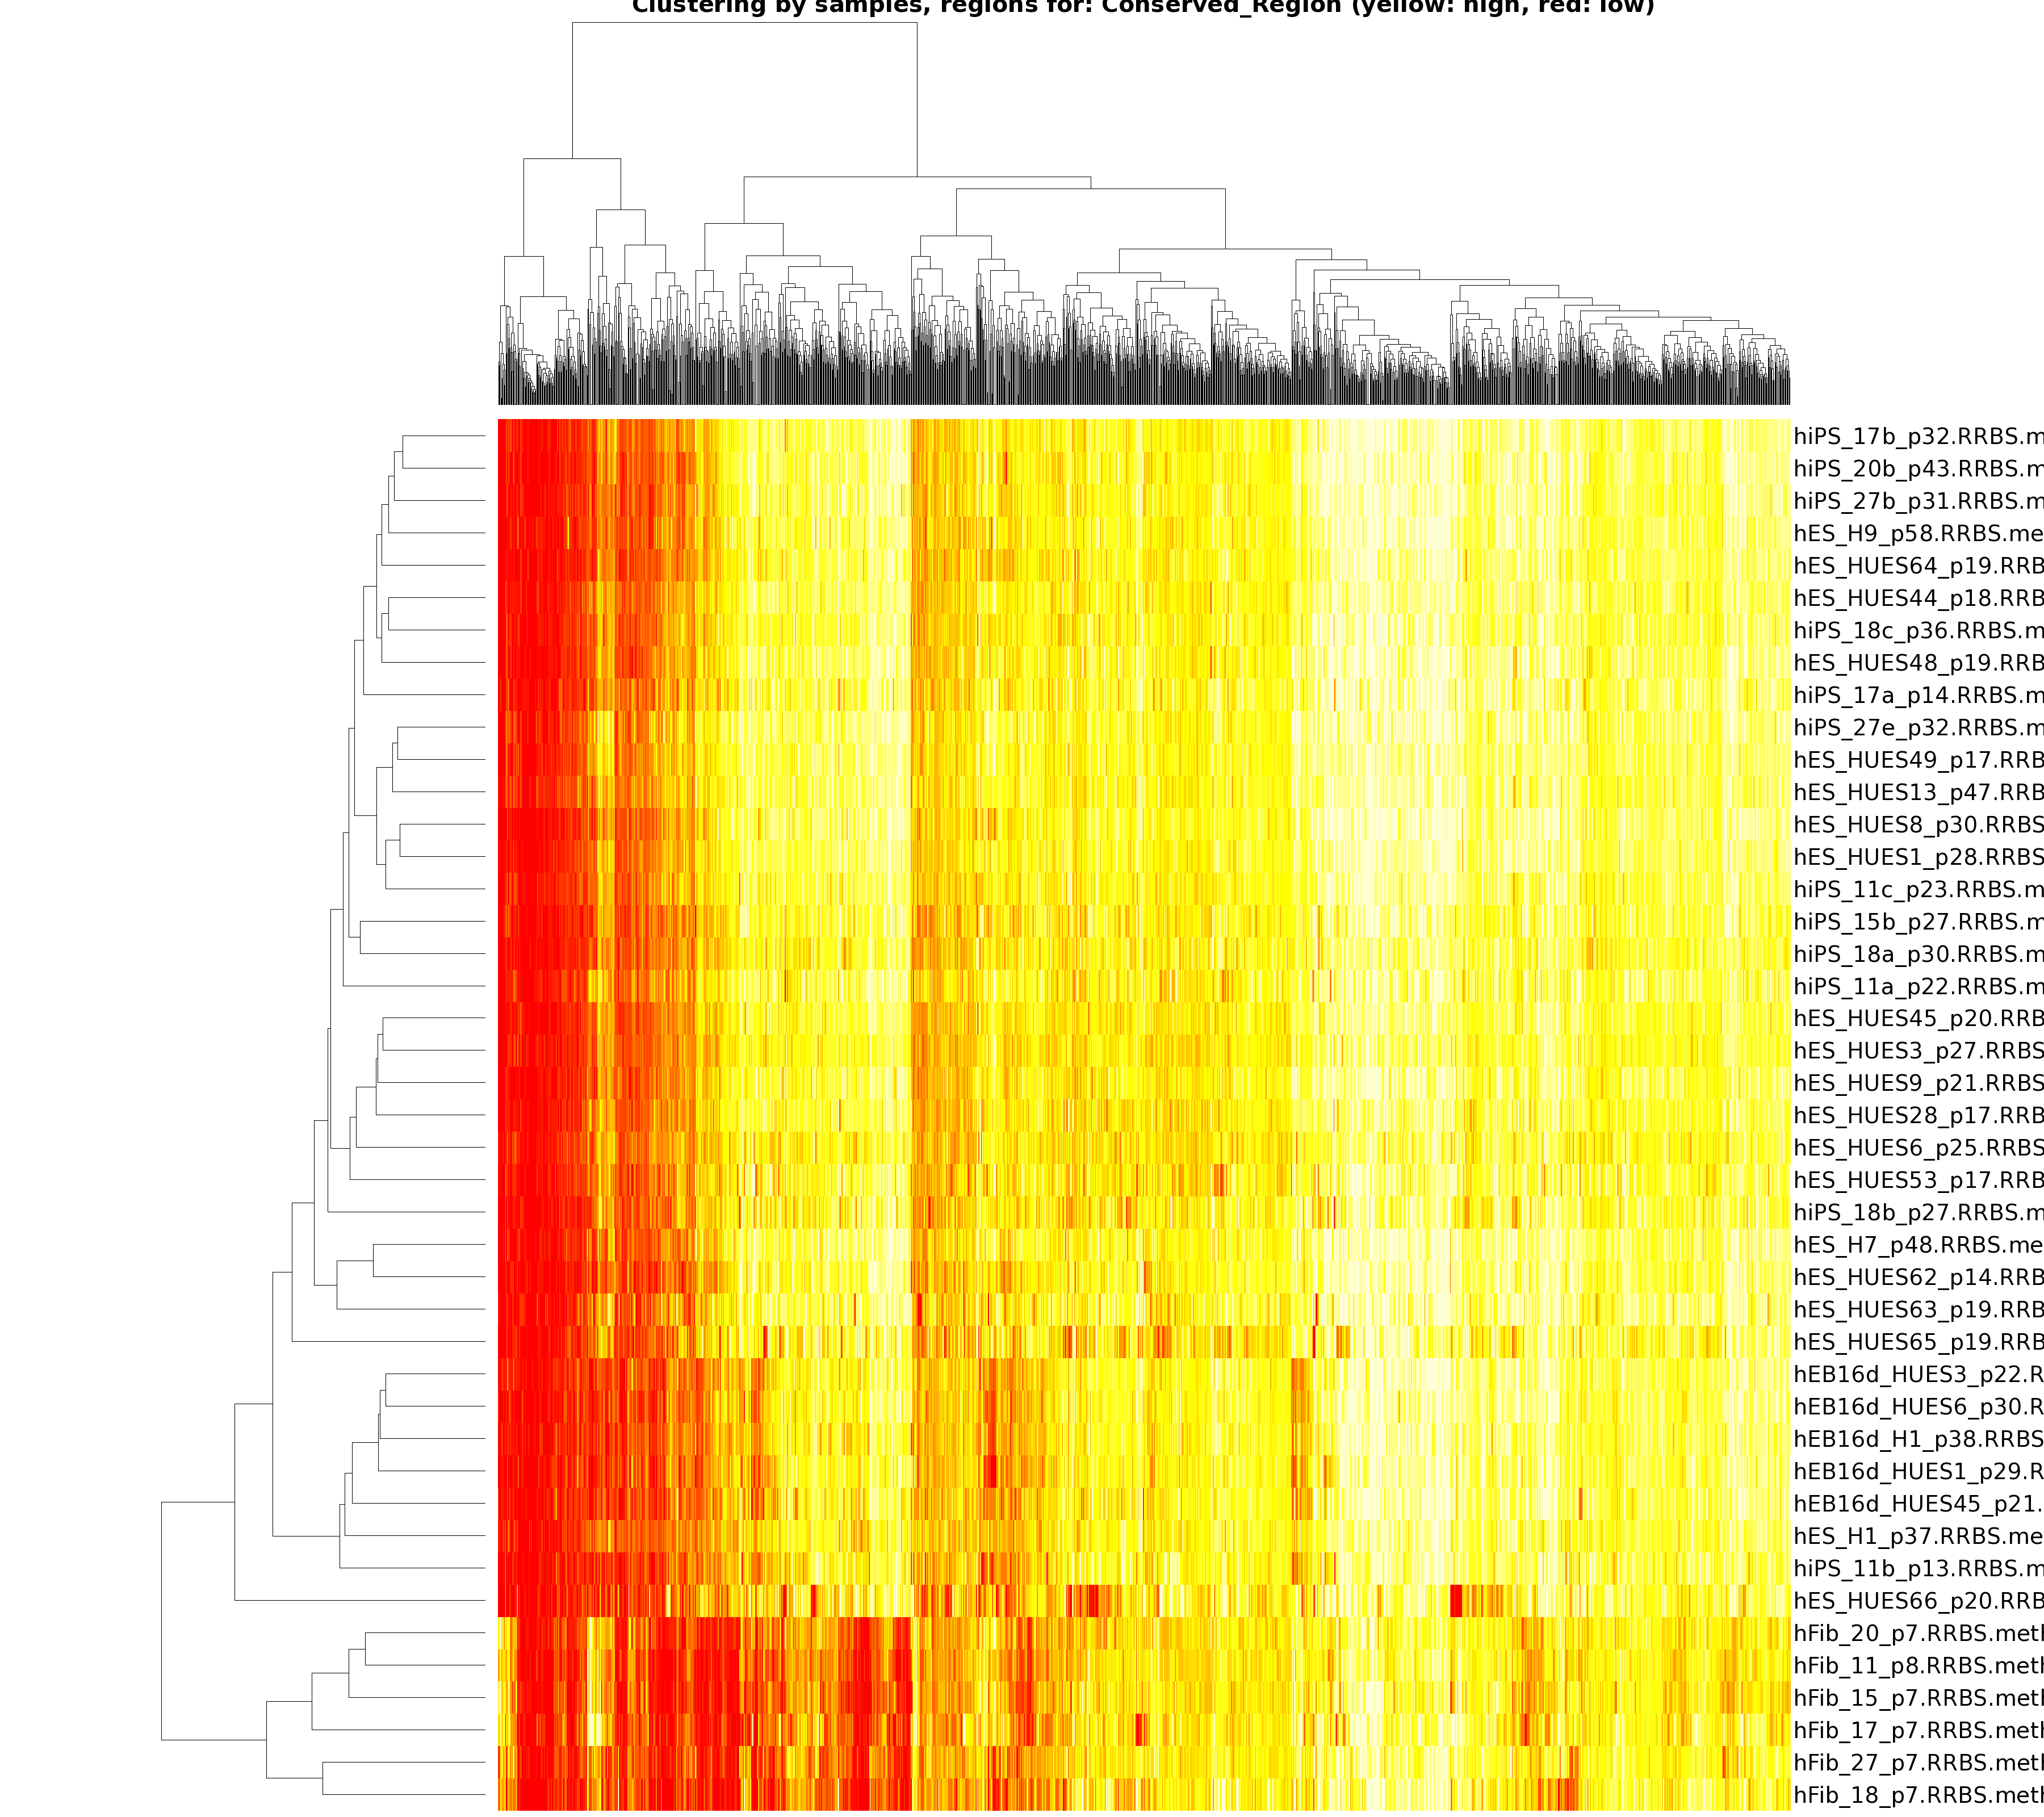
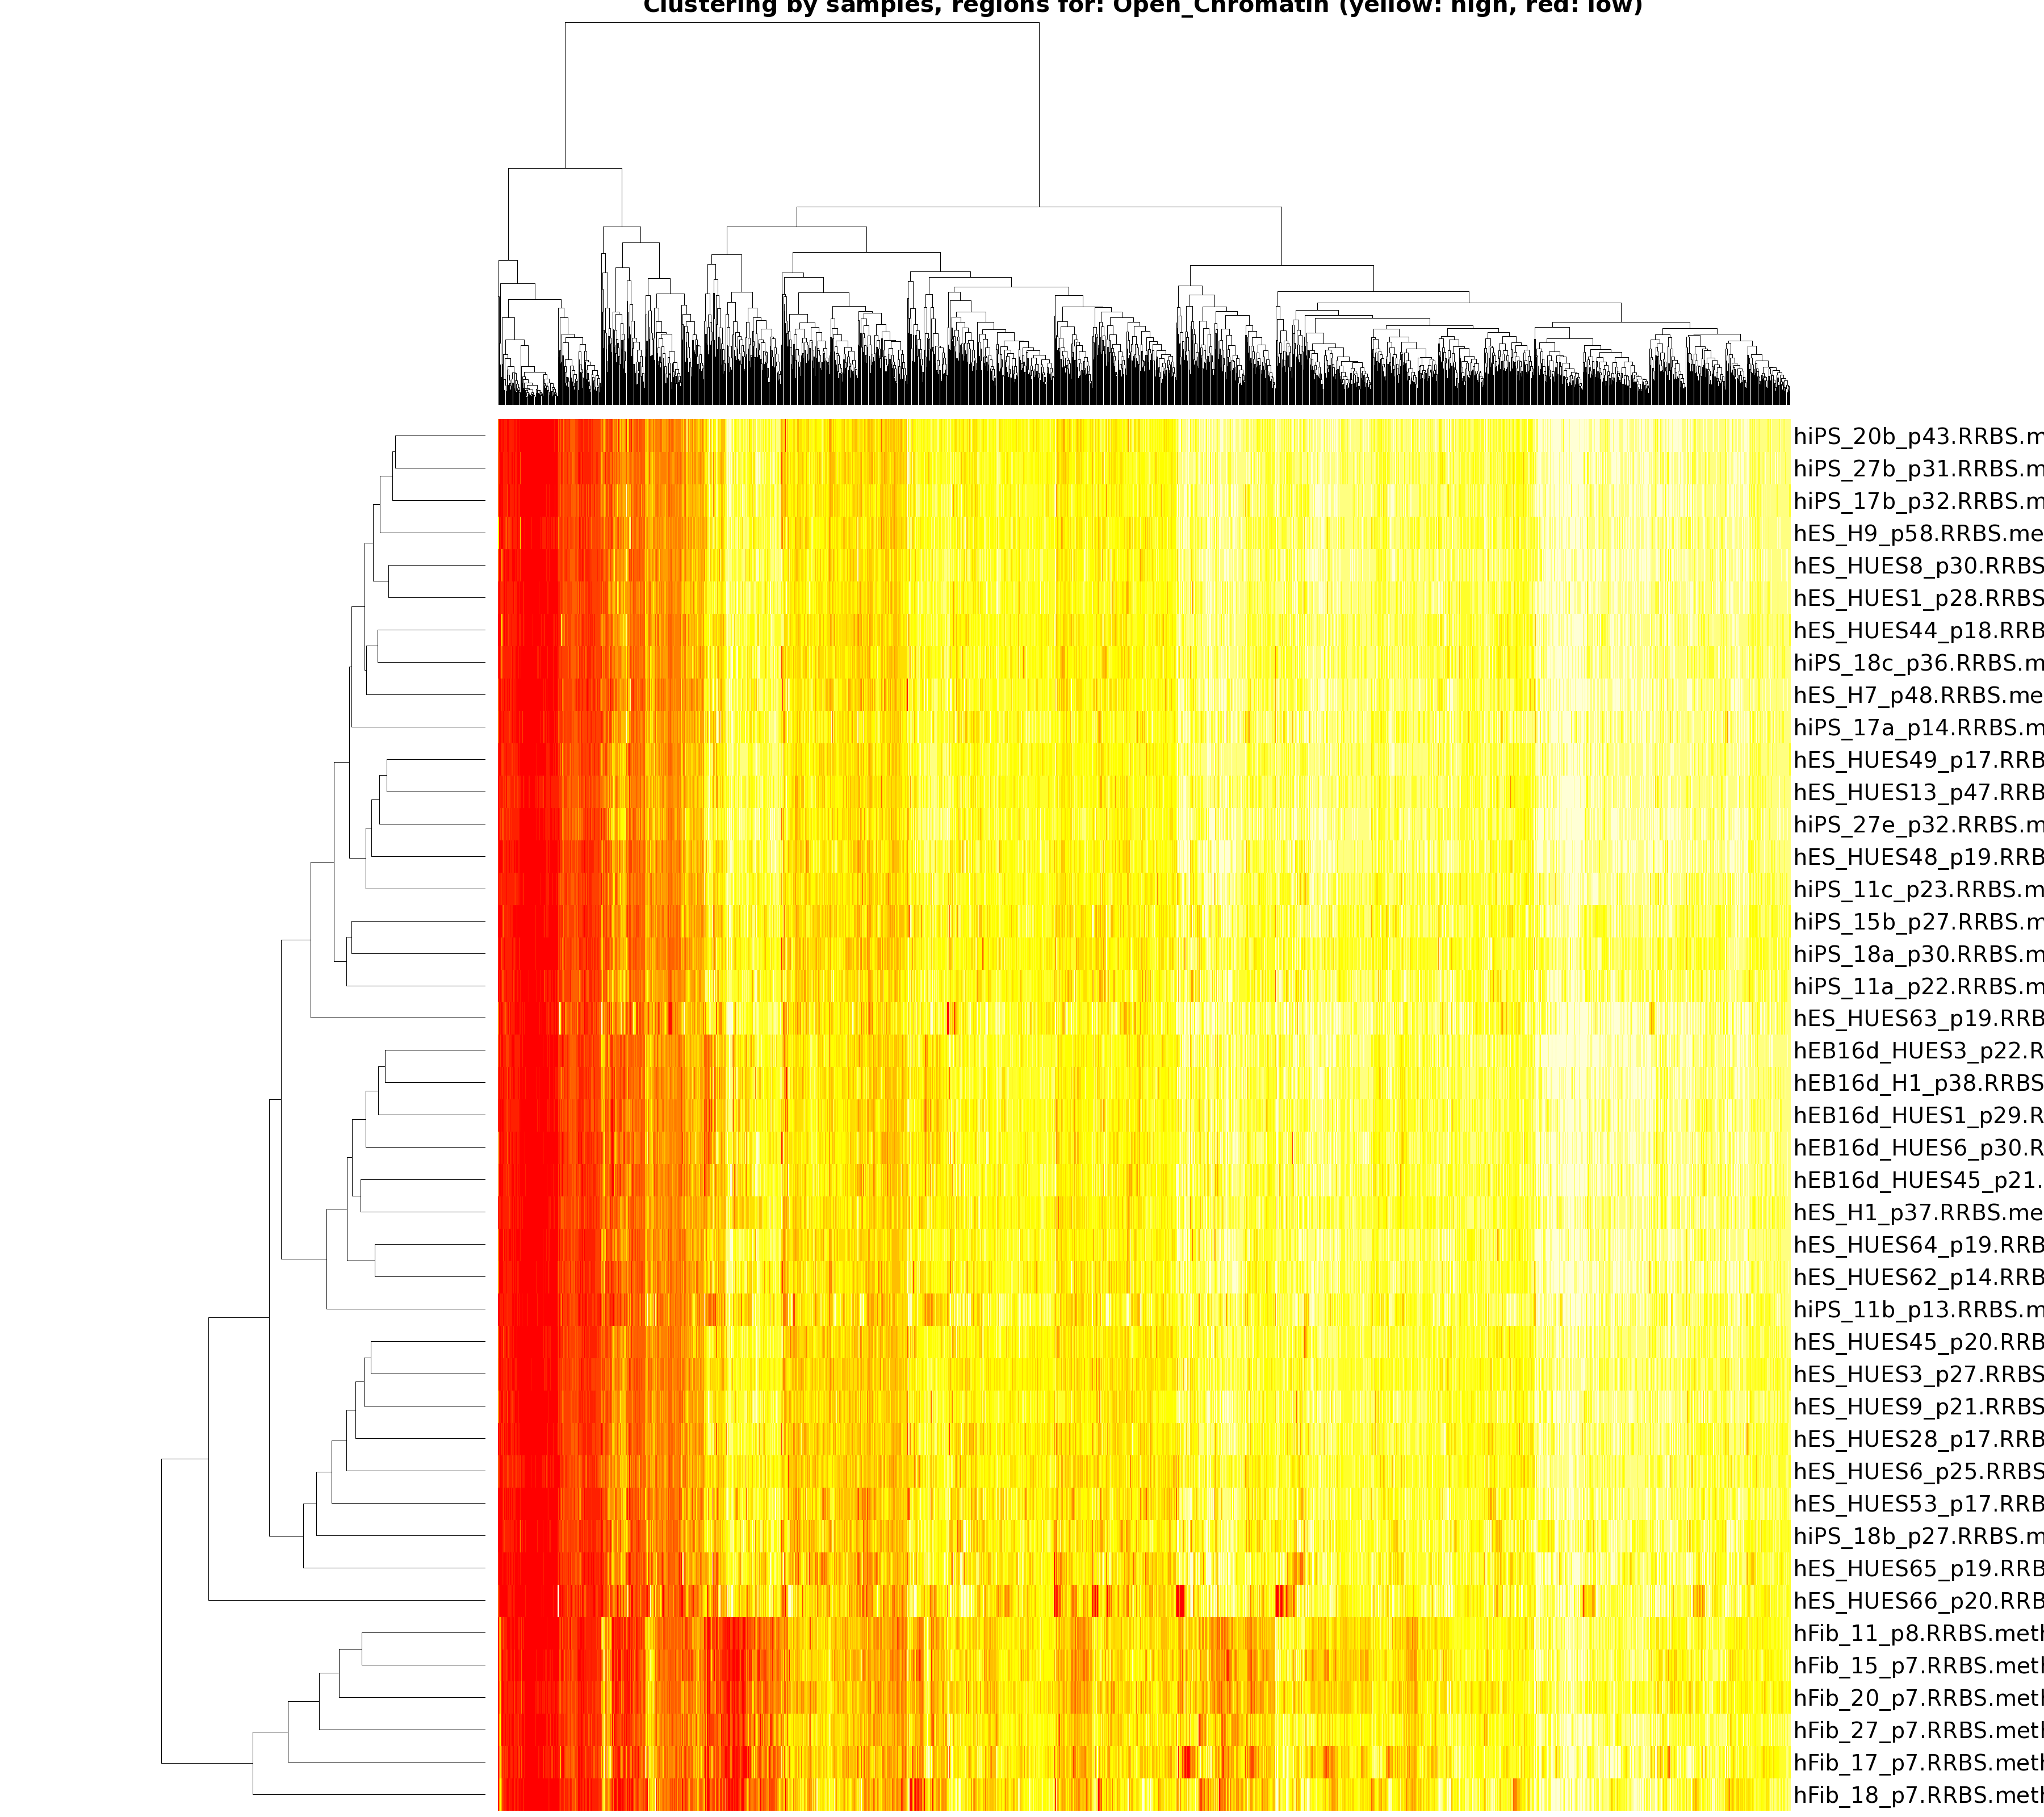
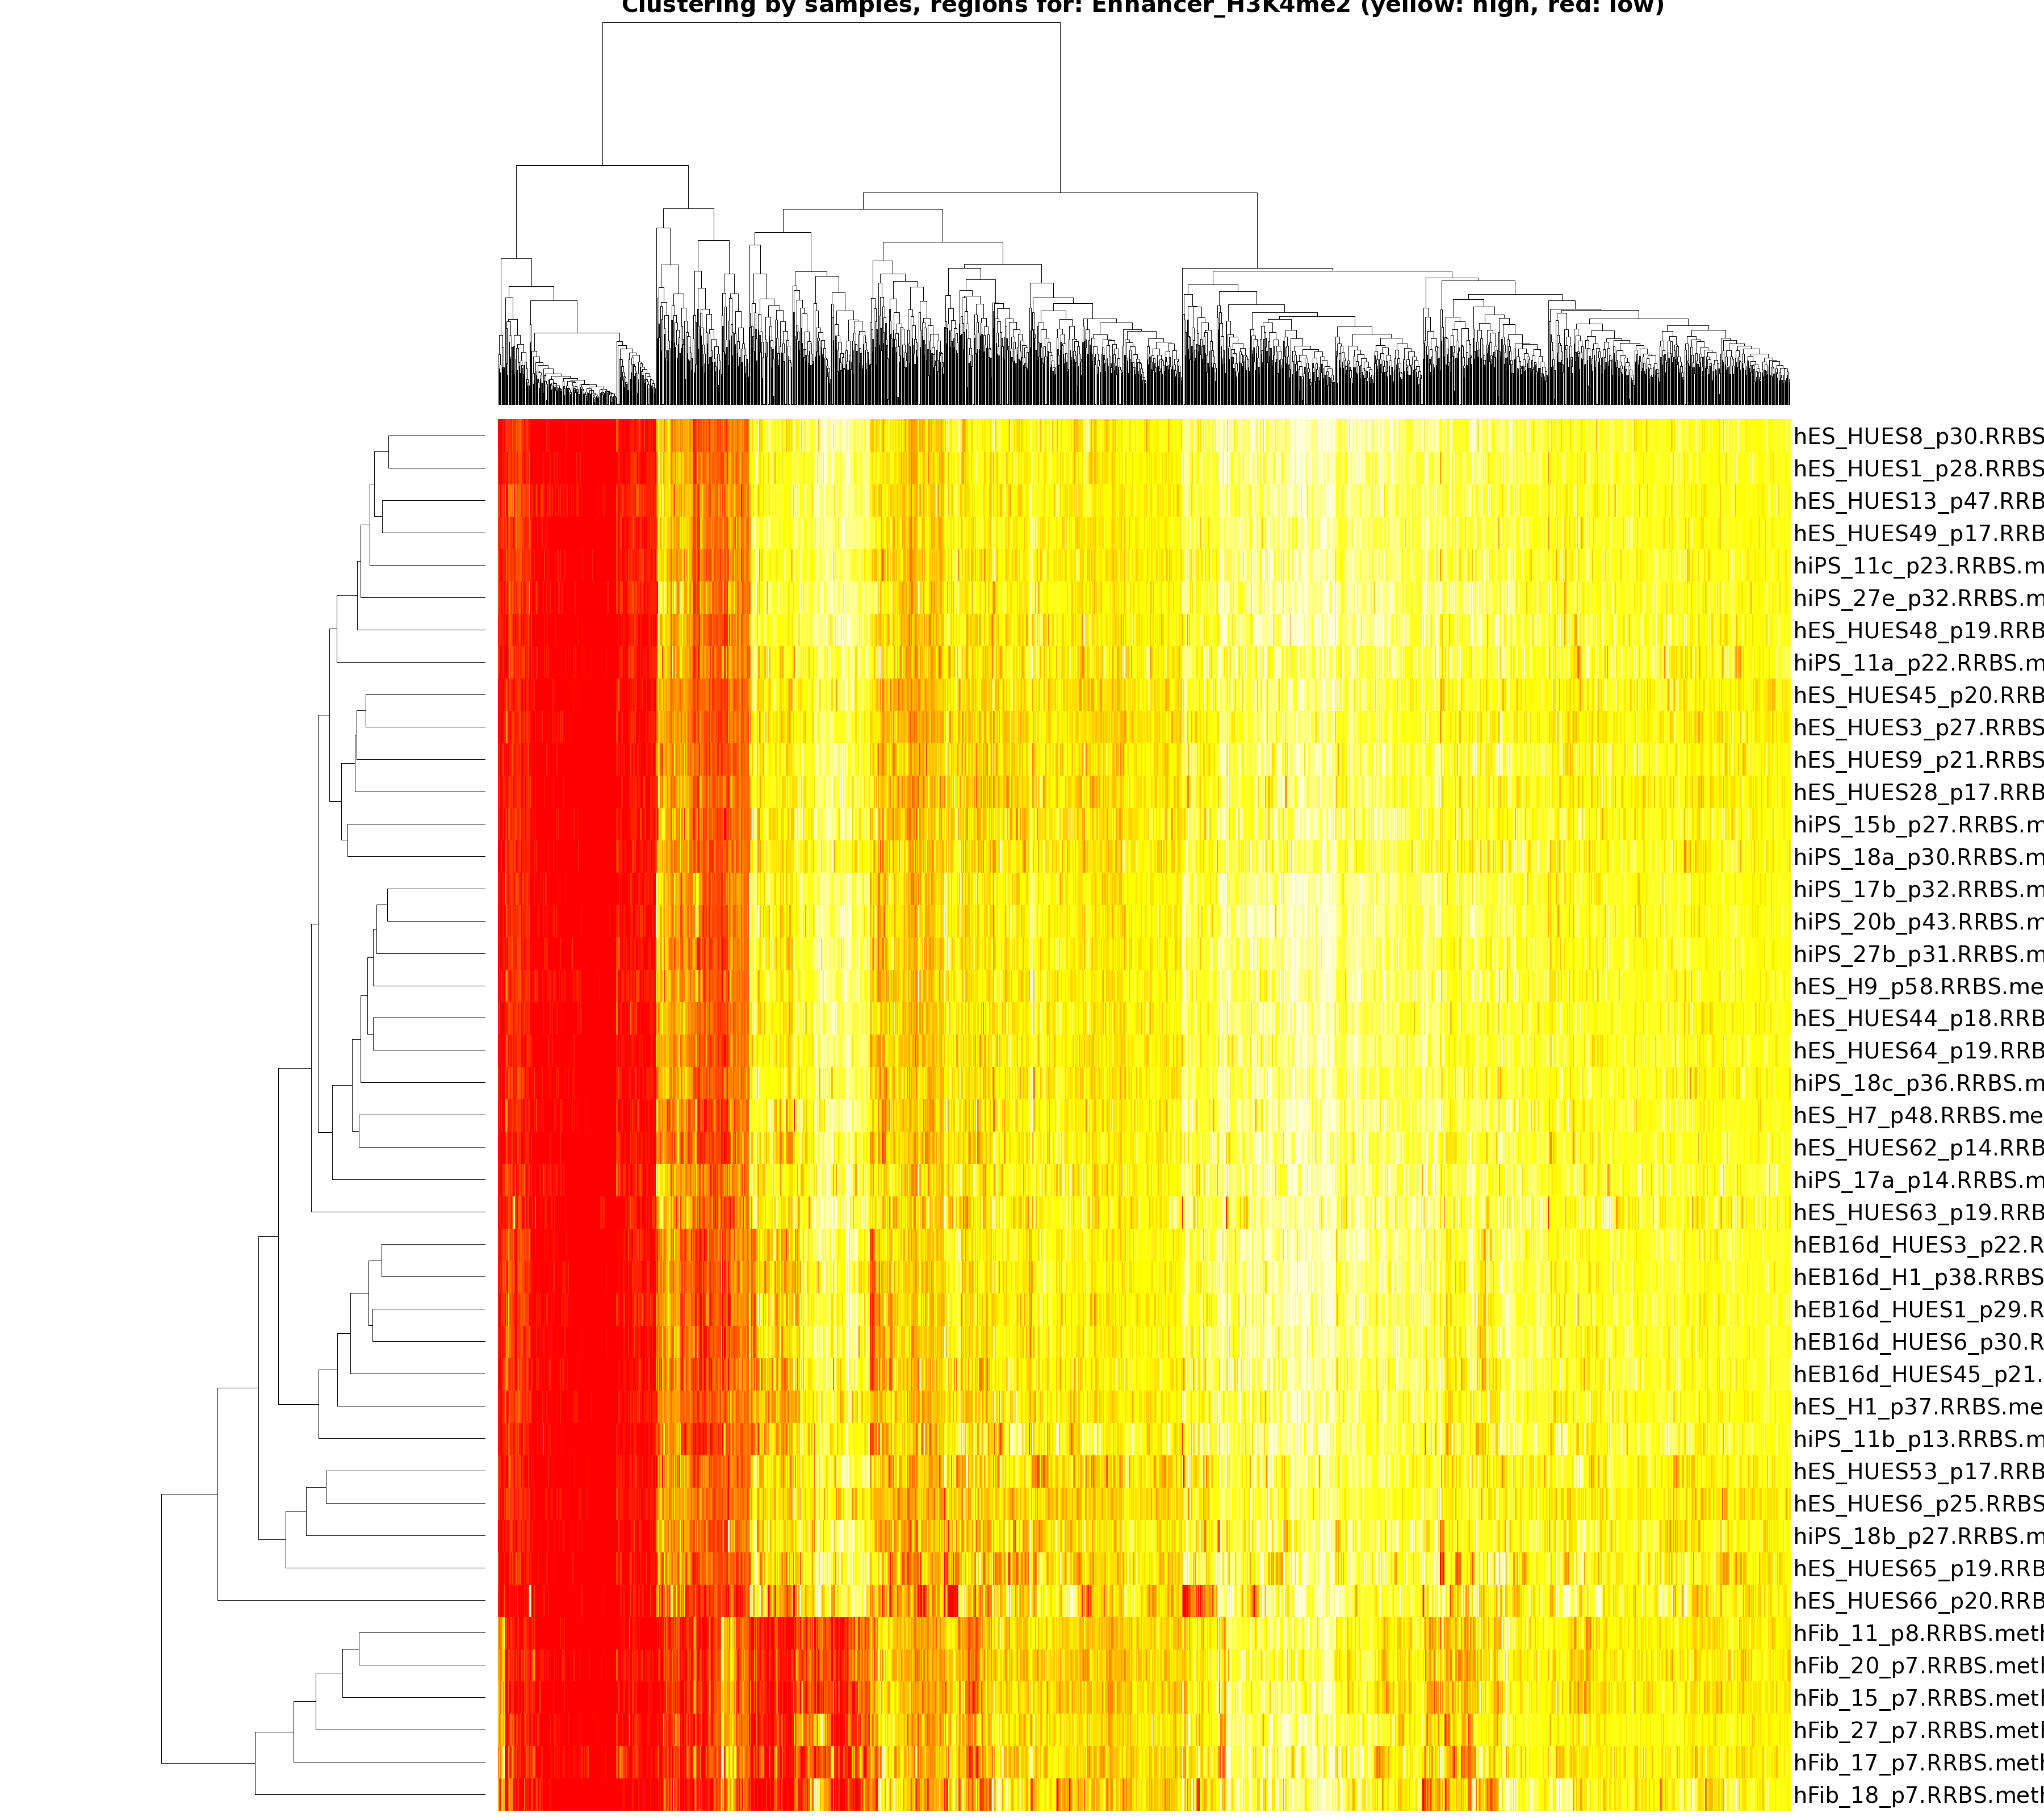
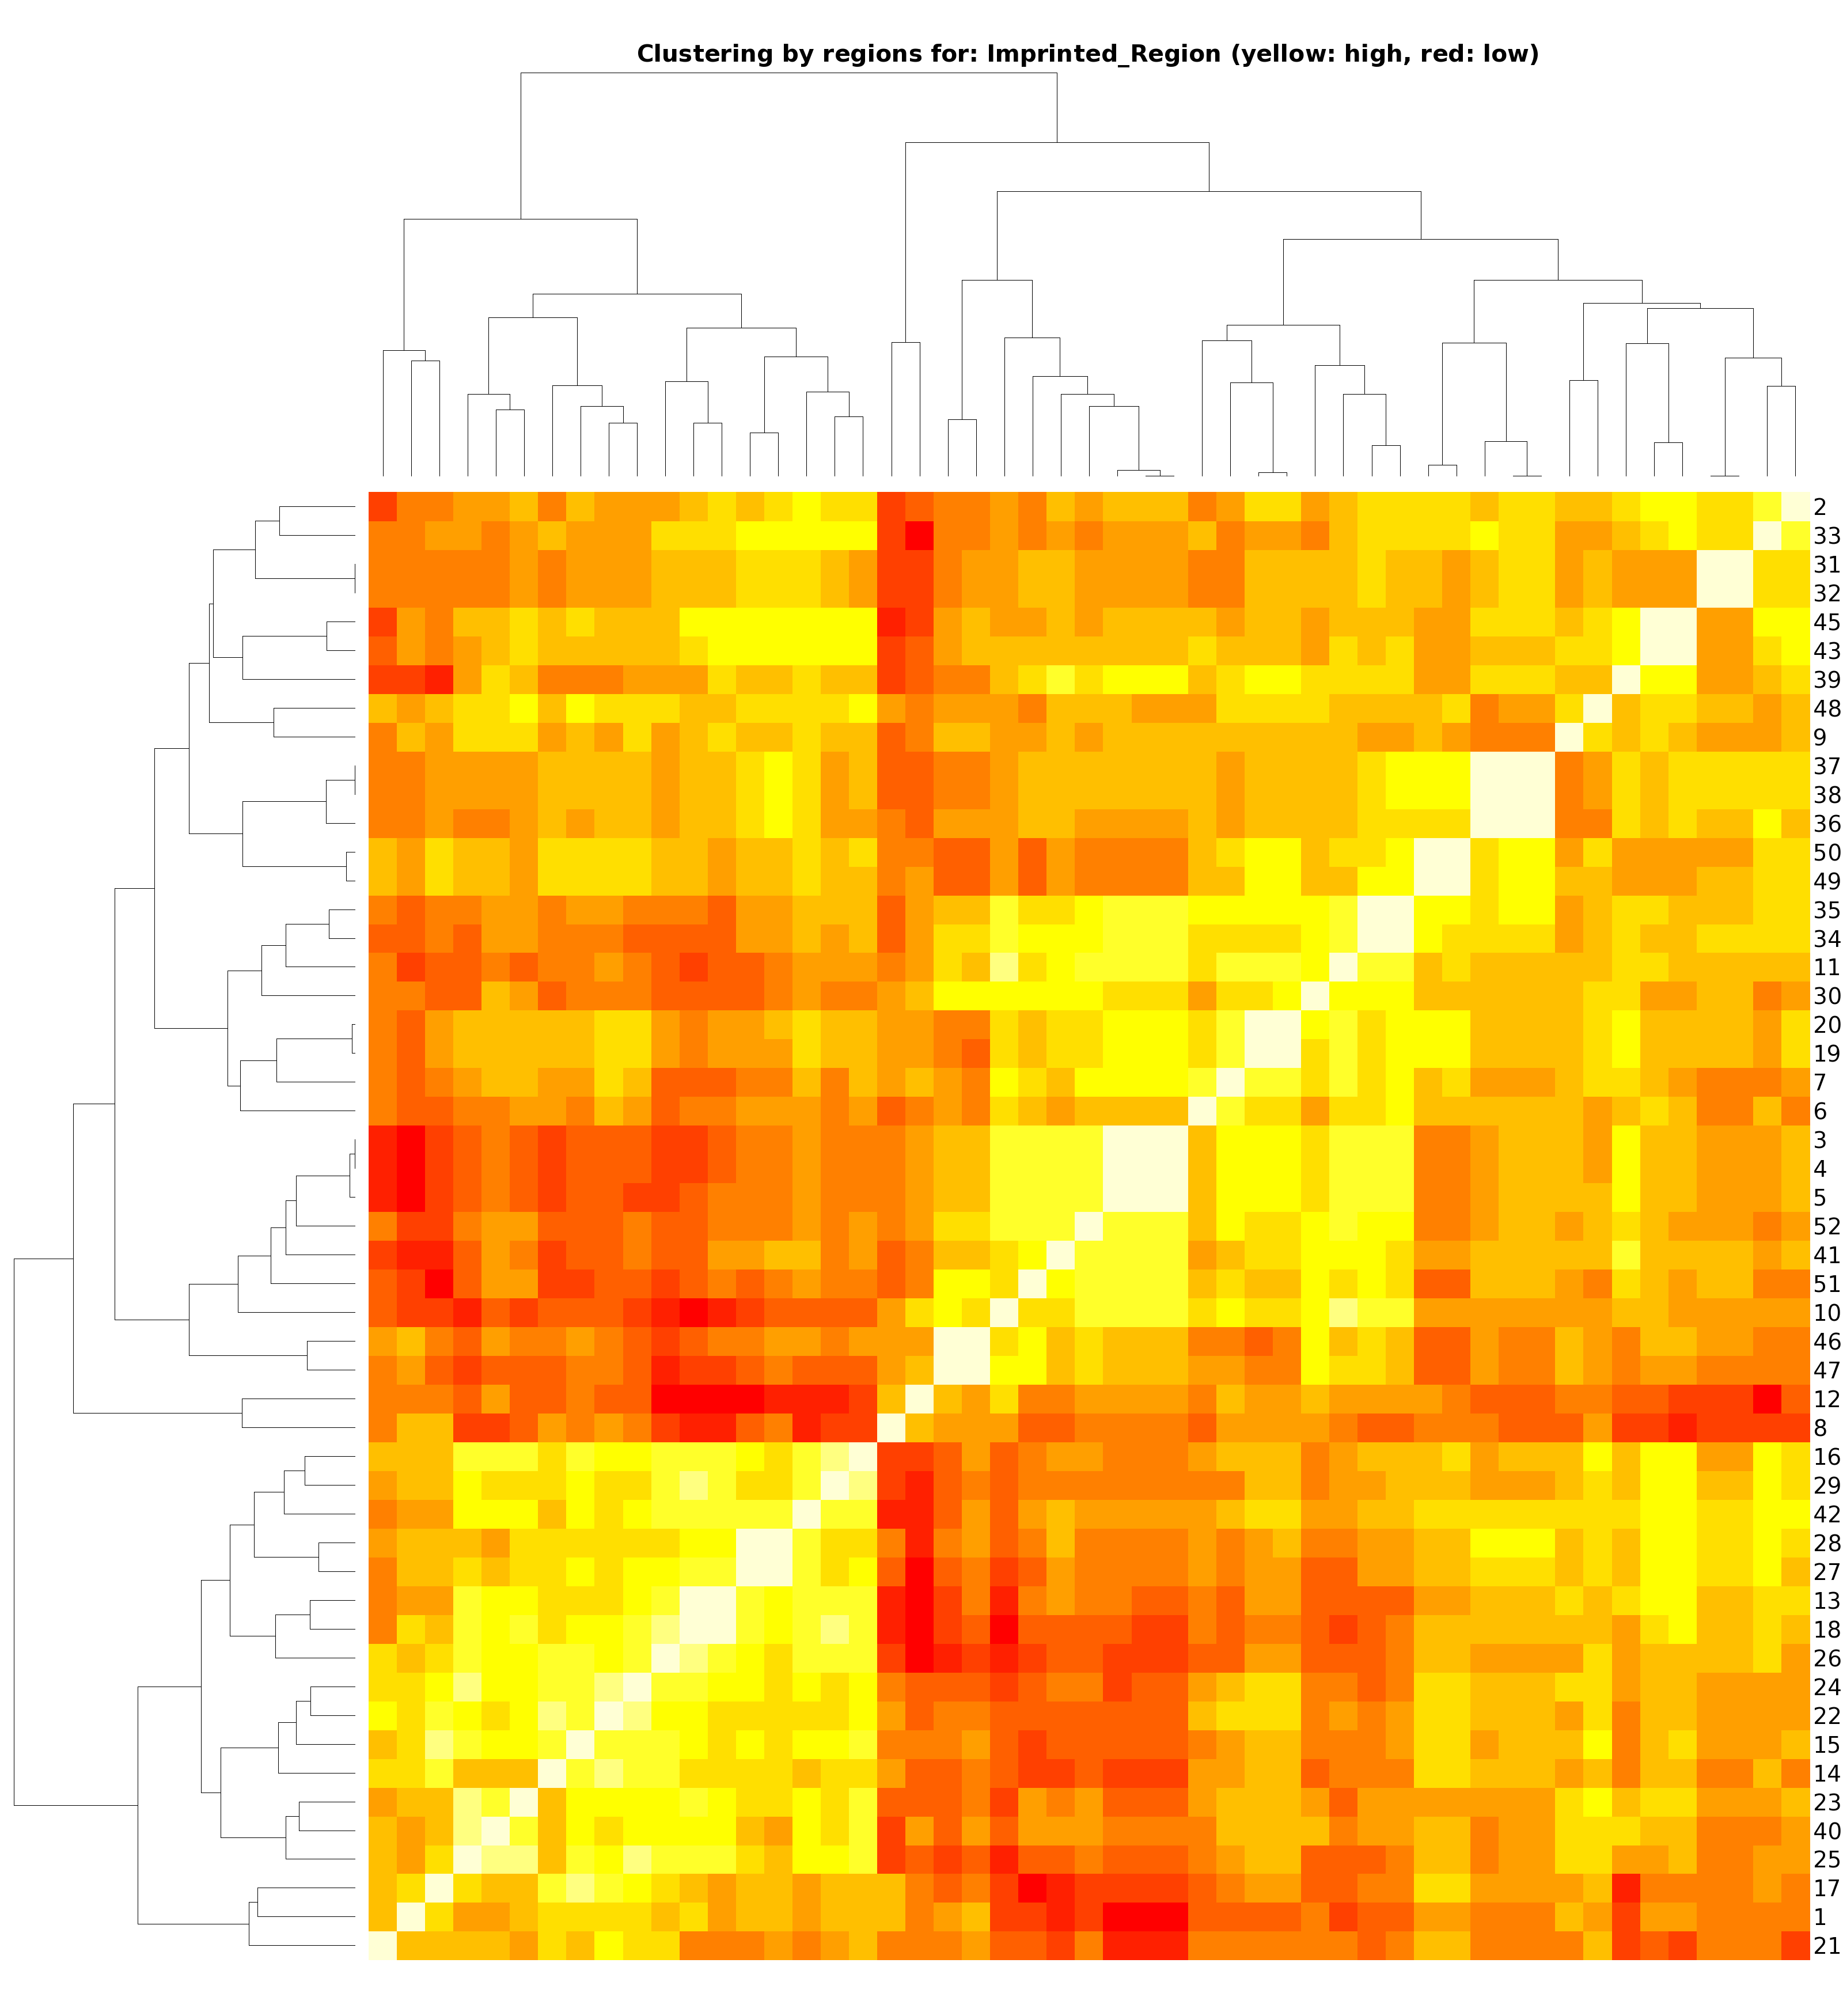
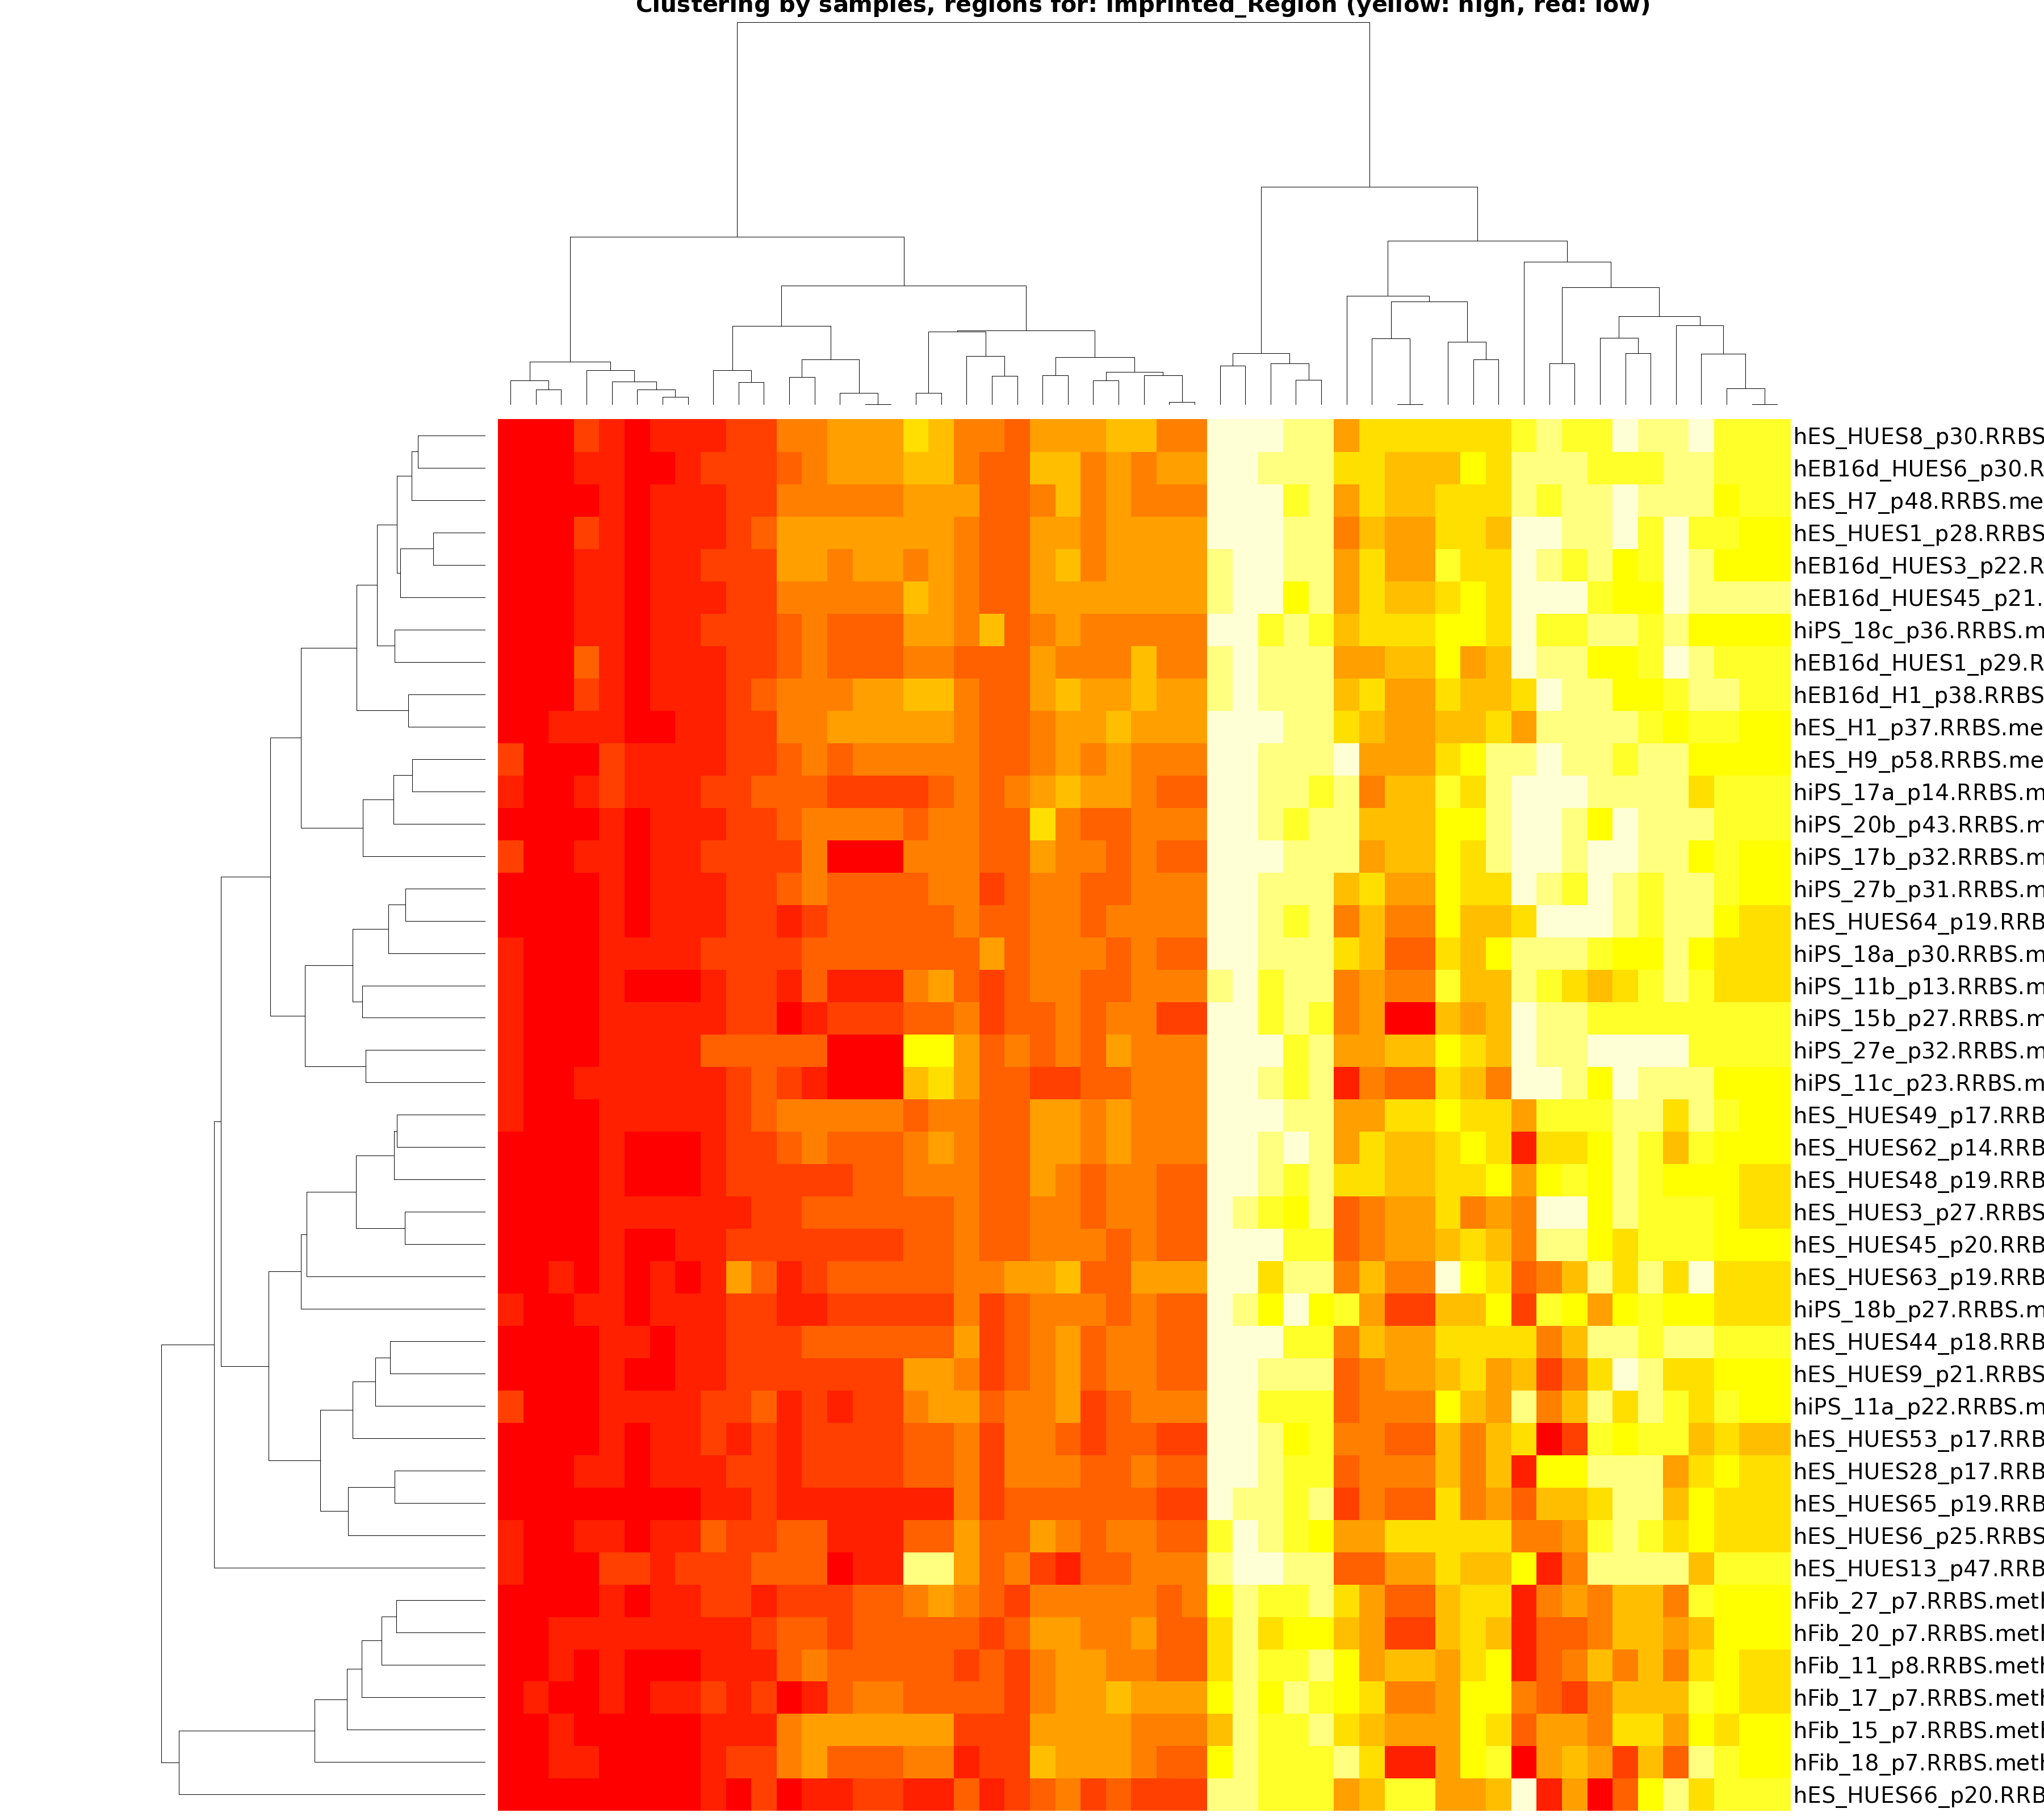
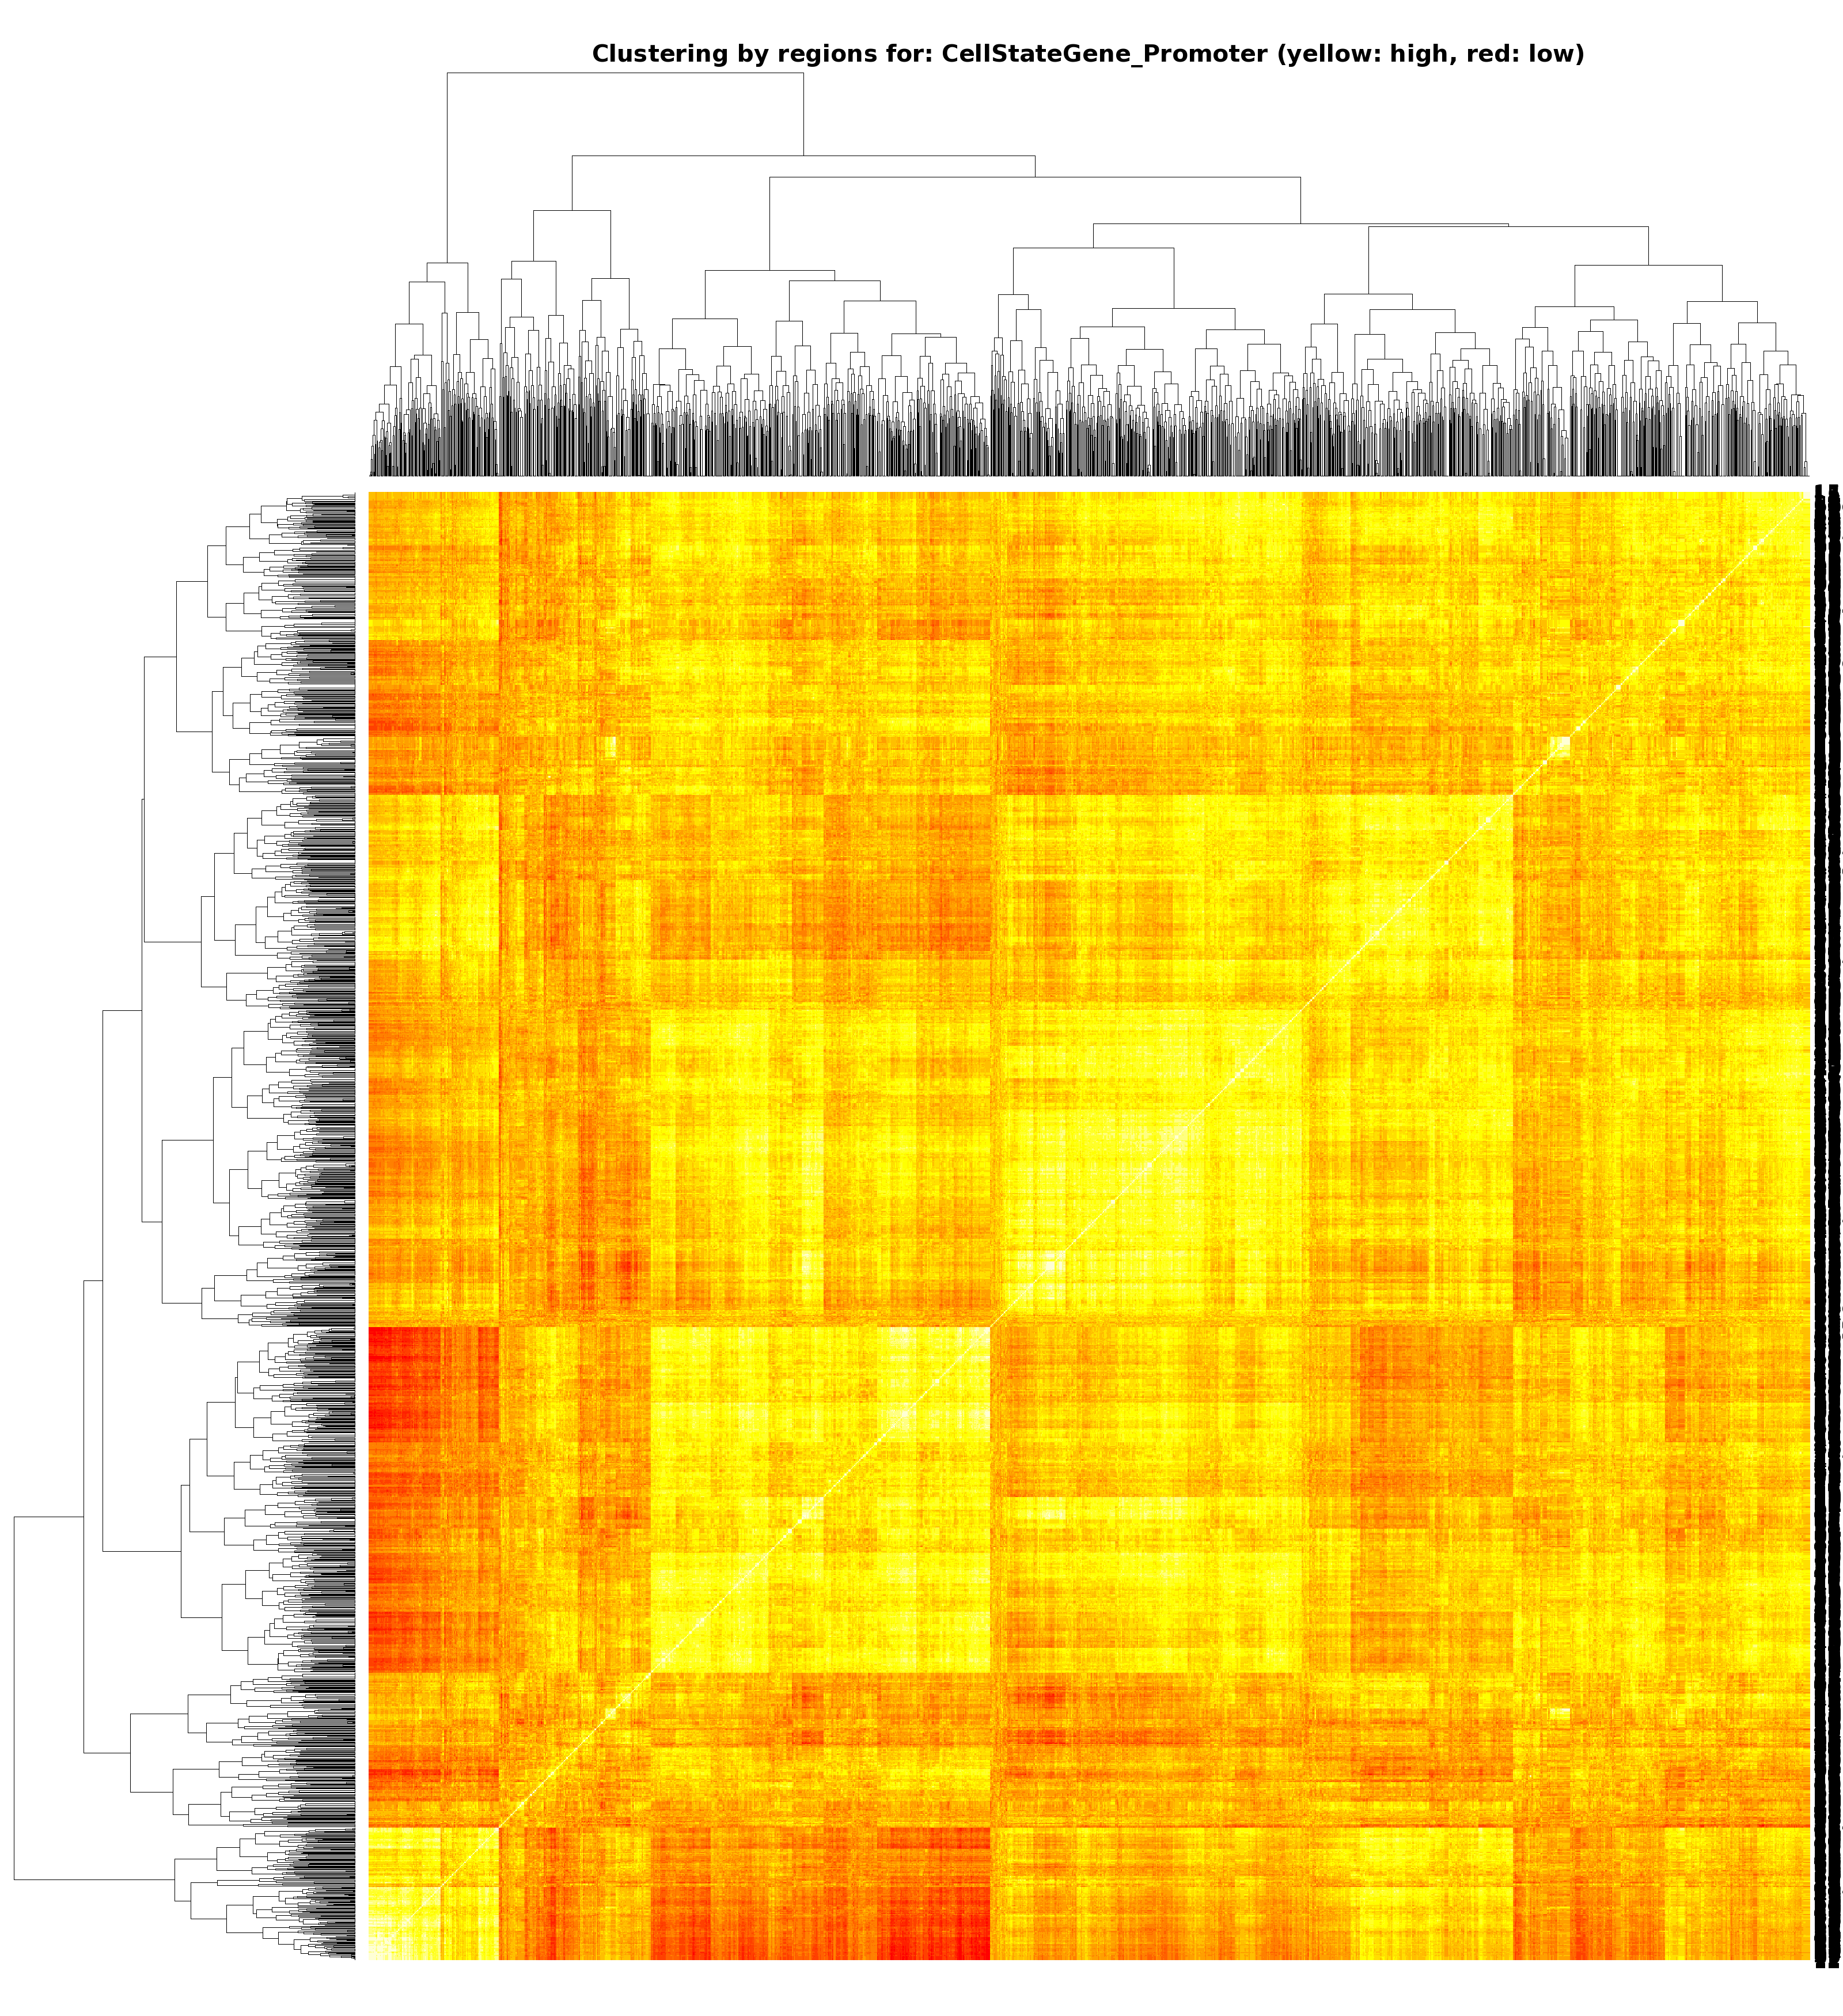
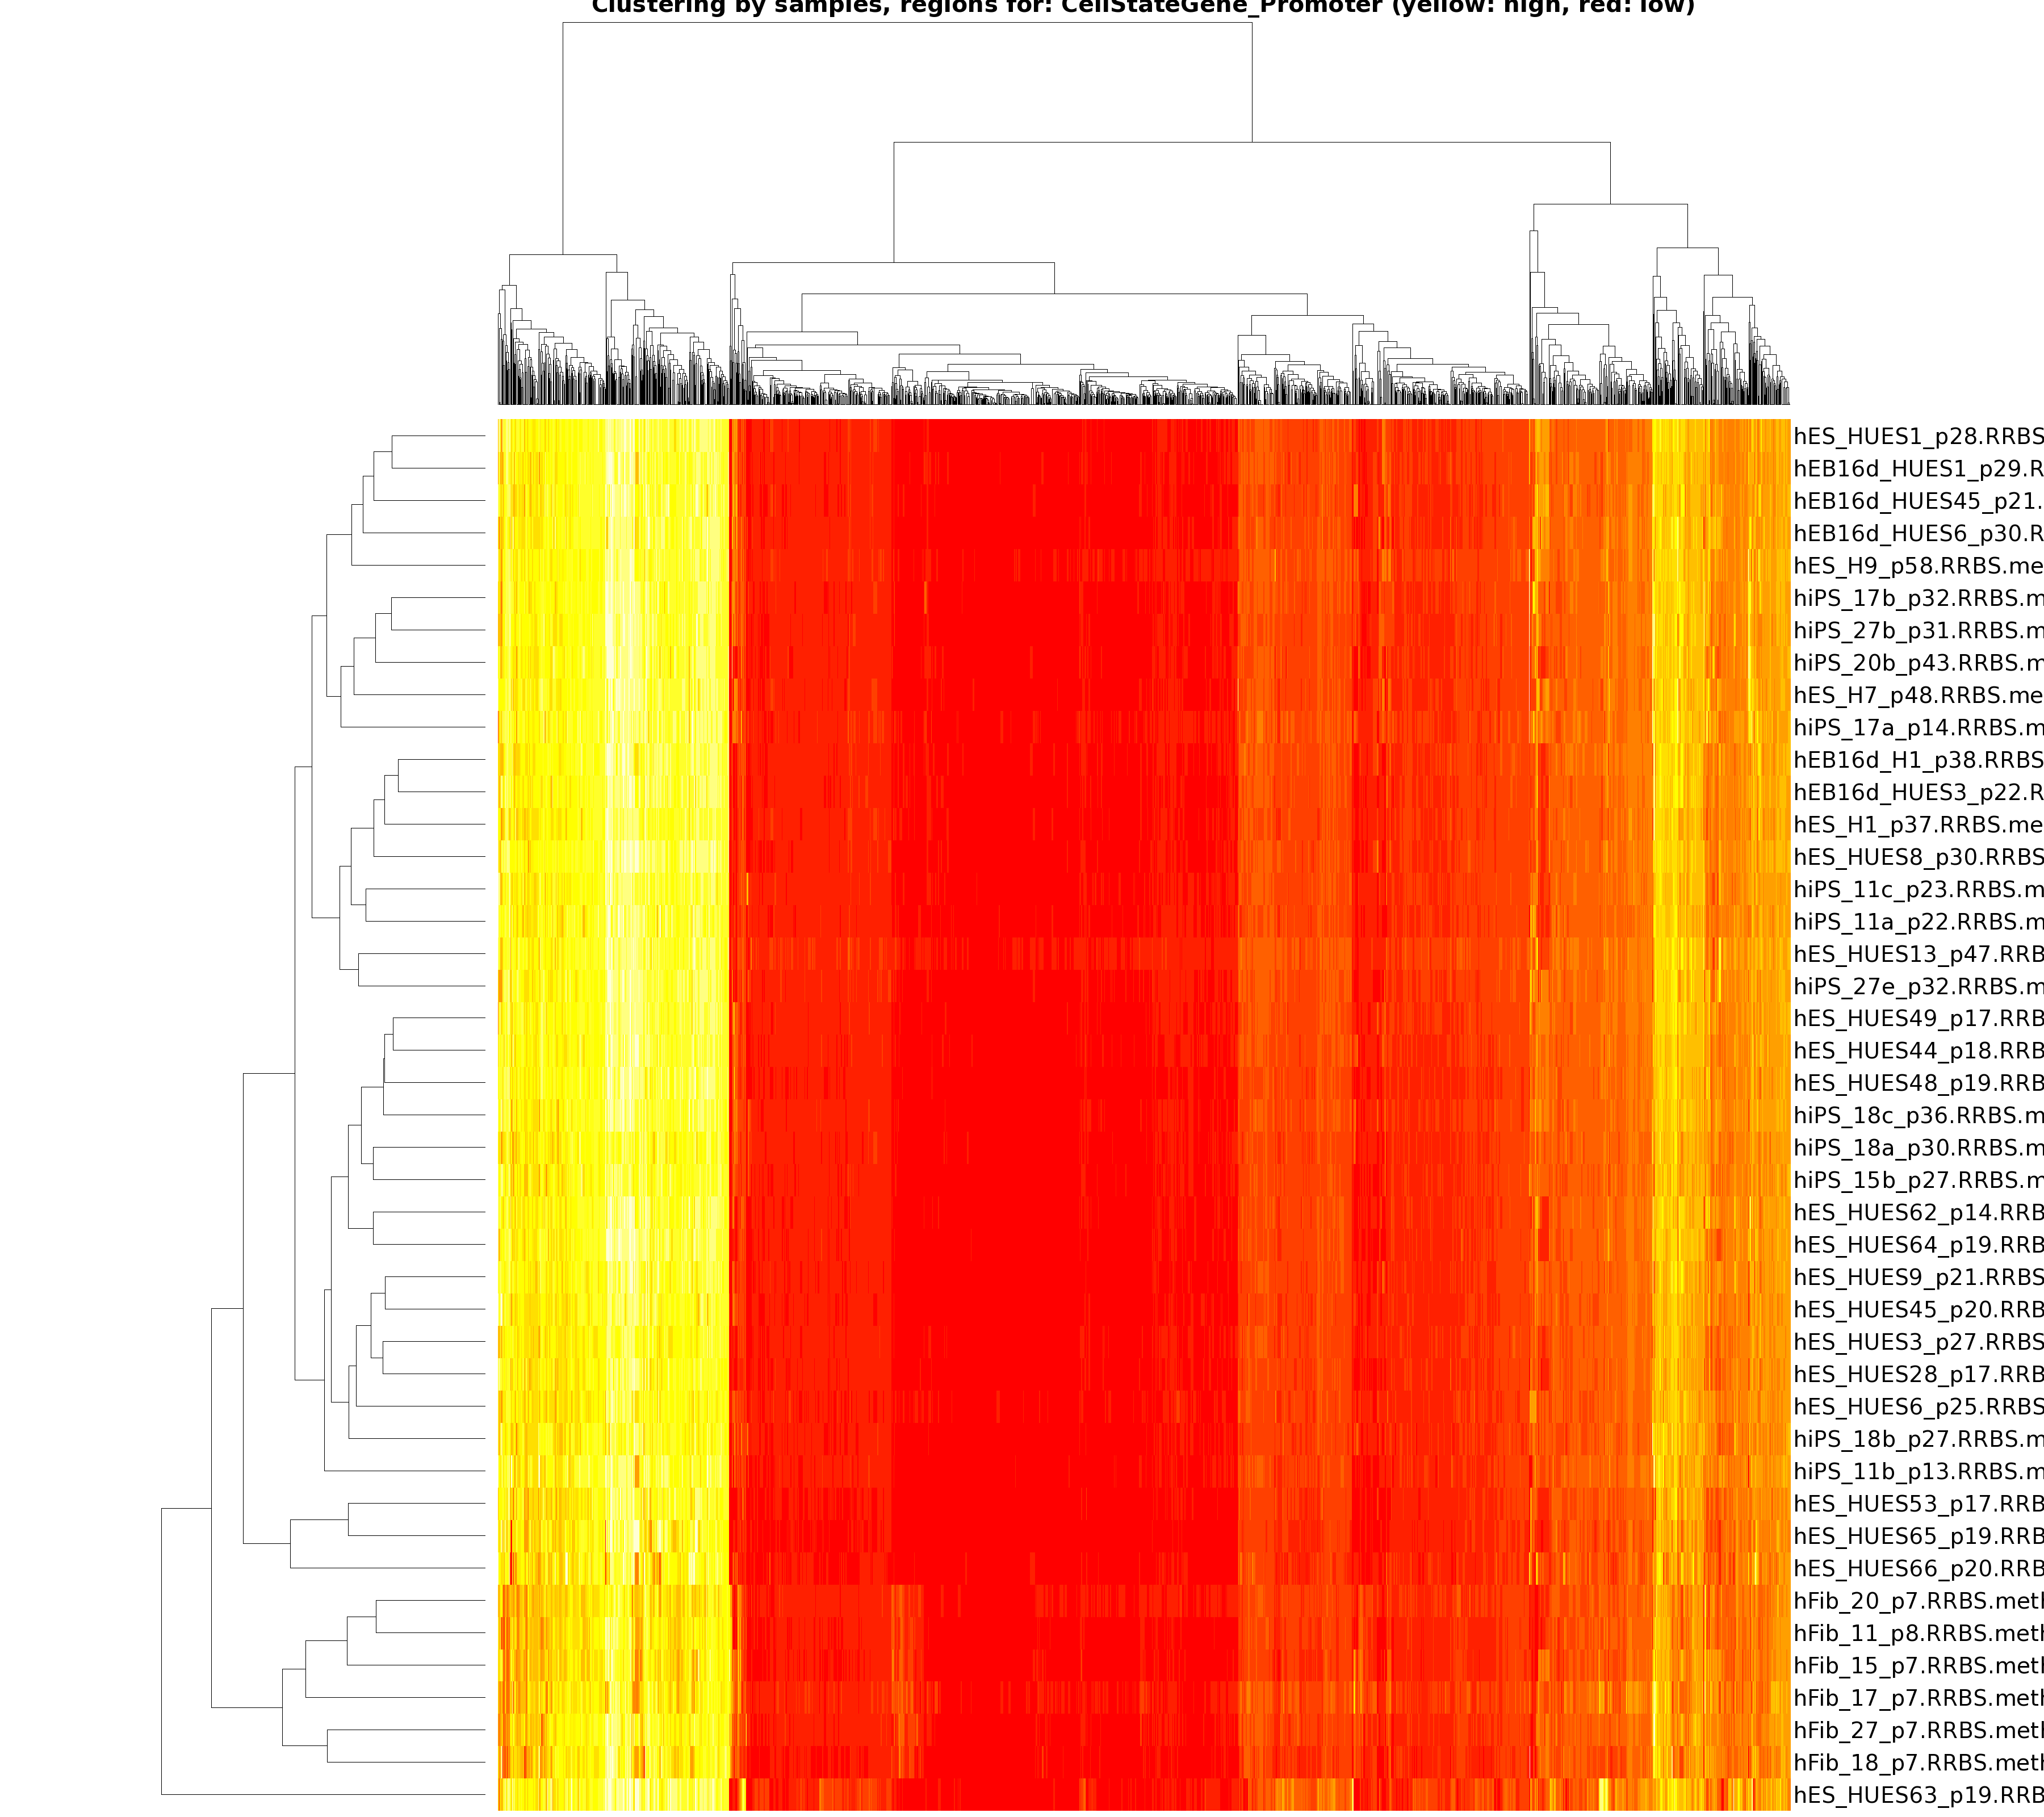
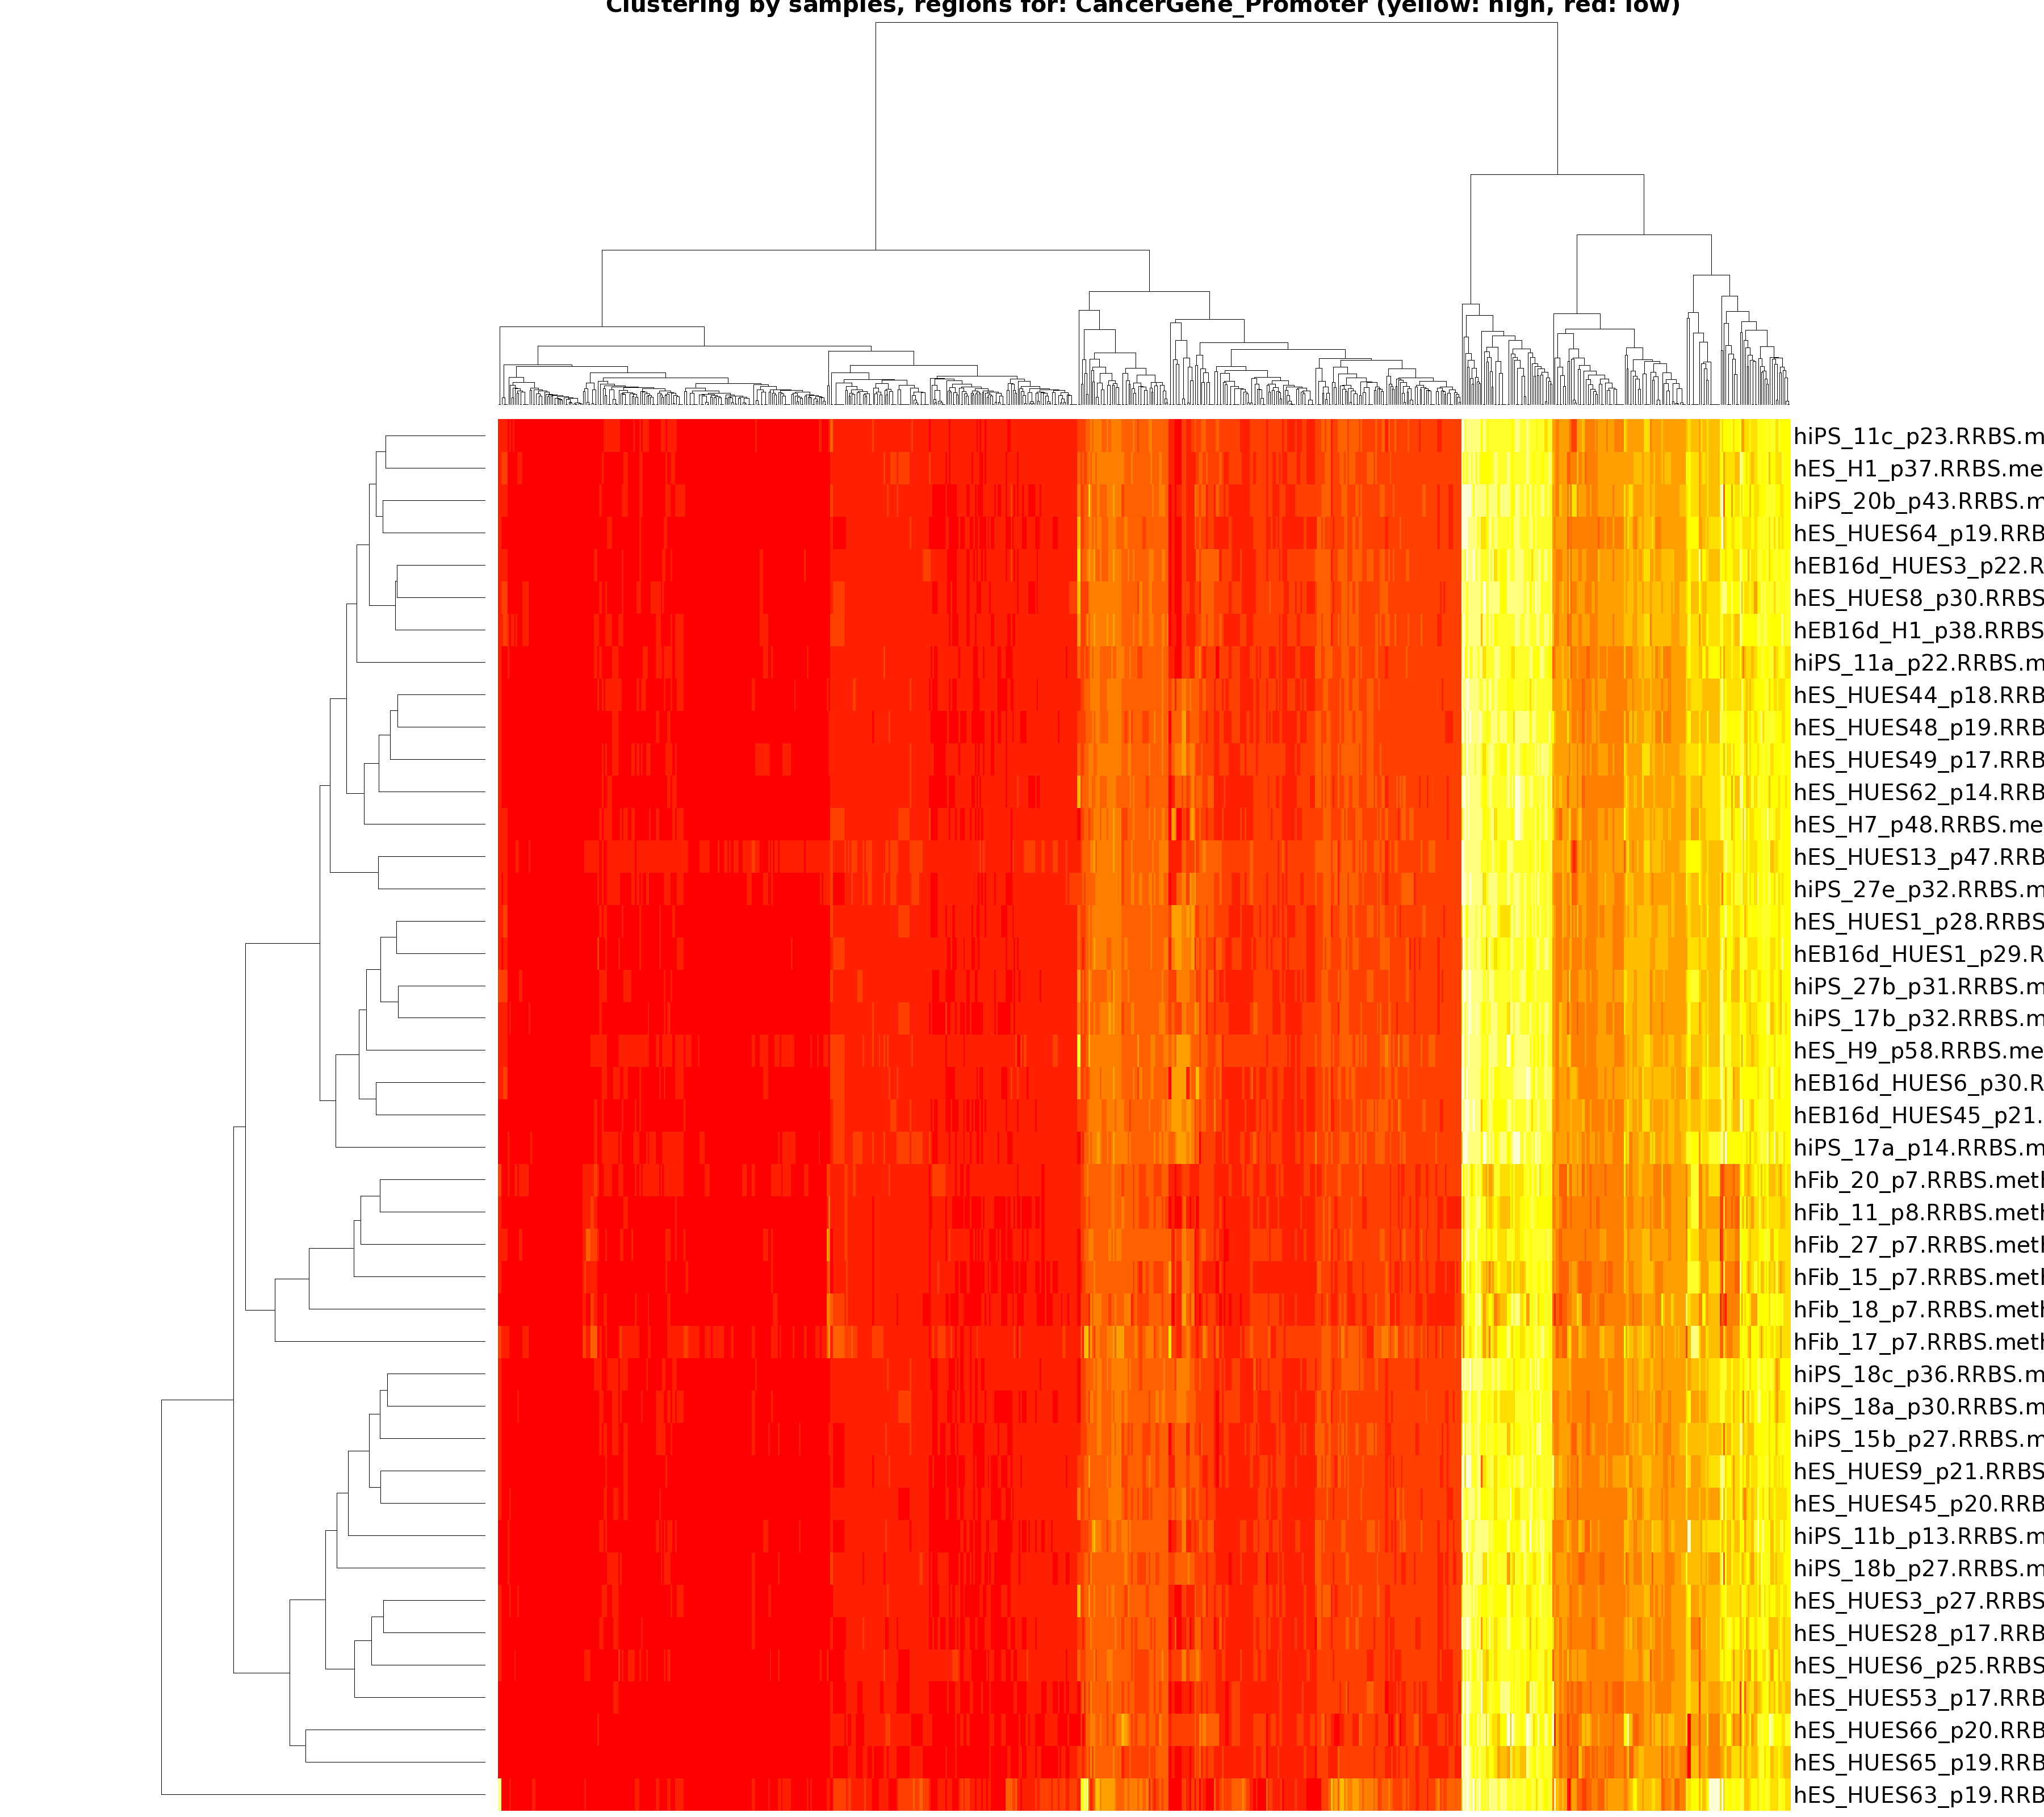
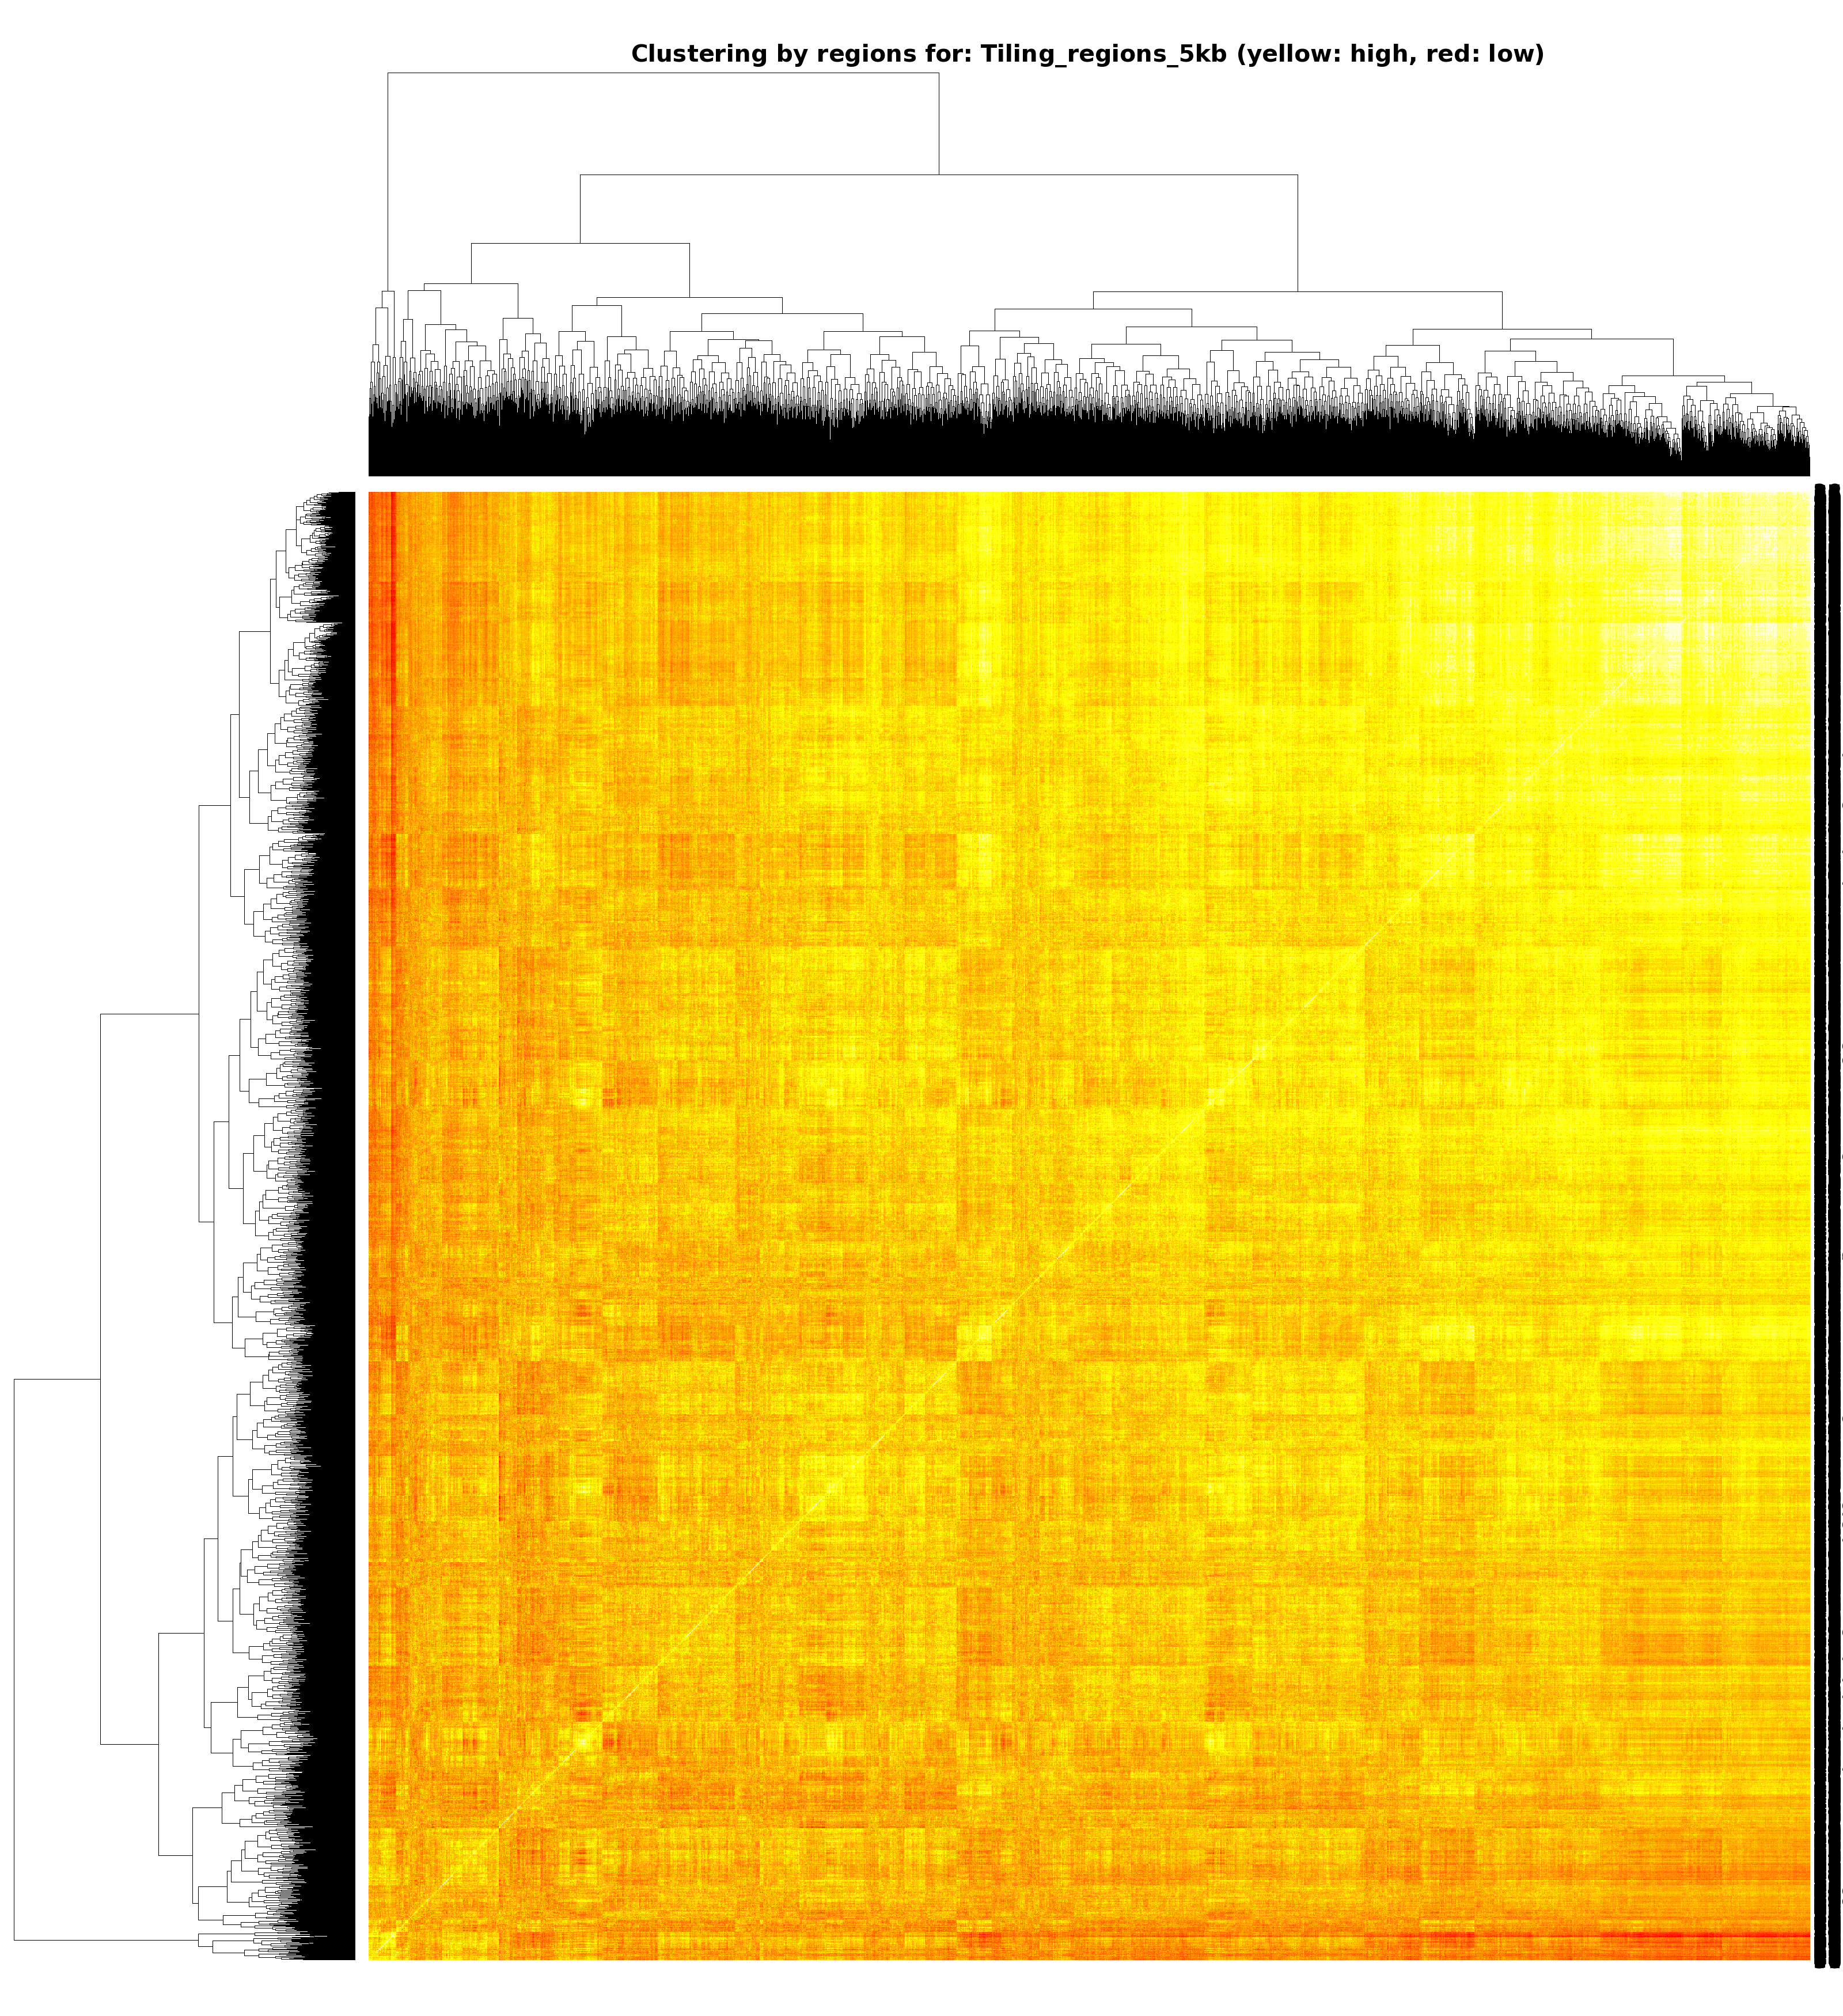
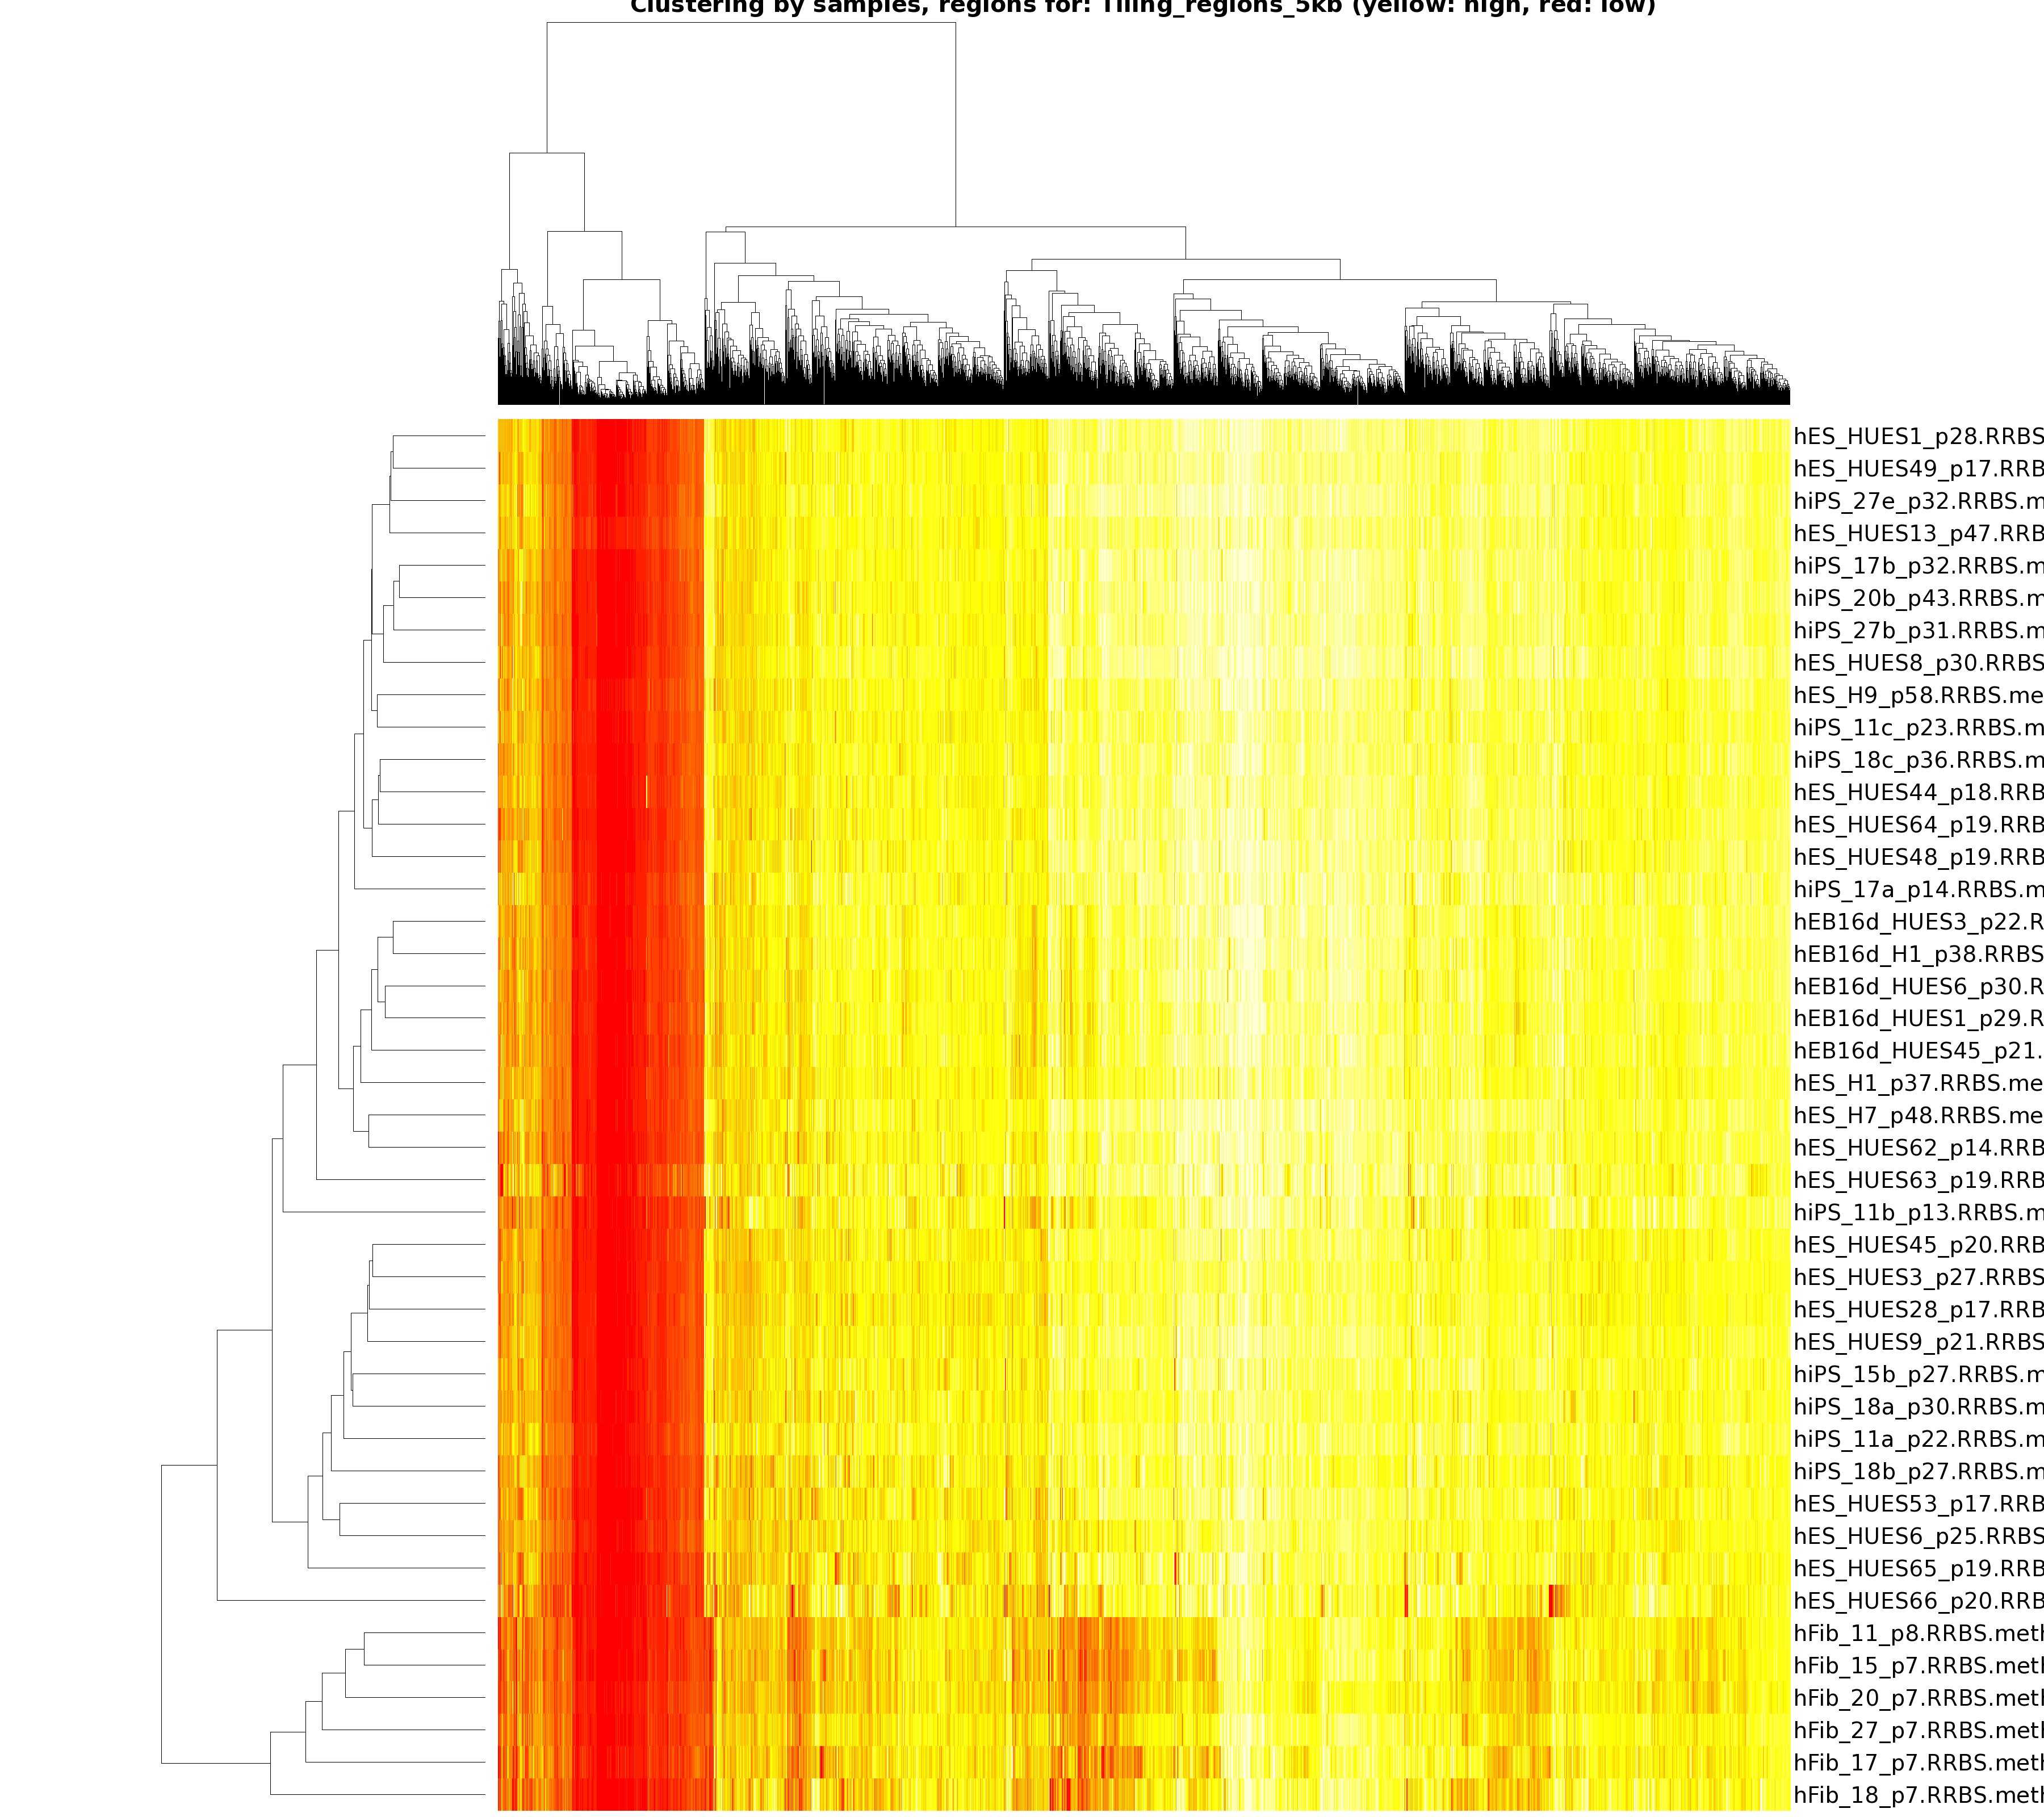
The following diagrams summarize the statistical analysis of all included epigenome data.

Promoter_ensembl Coverage pie chart Boxplot diagram Significance barchart Scatterplot (entire region) Clustered heatmap (samples) Clustered heatmap (regions) Clustered heatmap (samples, regions)
Promoter_centered Coverage pie chart Boxplot diagram Significance barchart Scatterplot (entire region) Clustered heatmap (samples) Clustered heatmap (regions) Clustered heatmap (samples, regions)
Promoter_region Coverage pie chart Boxplot diagram Significance barchart Scatterplot (entire region) Clustered heatmap (samples) Clustered heatmap (regions) Clustered heatmap (samples, regions)
CpG_Island Coverage pie chart Boxplot diagram Significance barchart Scatterplot (entire region) Clustered heatmap (samples) Clustered heatmap (regions) Clustered heatmap (samples, regions)
BonaFide_CGI Coverage pie chart Boxplot diagram Significance barchart Scatterplot (entire region) Clustered heatmap (samples) Clustered heatmap (regions) Clustered heatmap (samples, regions)
BonaFide_CGI_Shore Coverage pie chart Boxplot diagram Significance barchart Scatterplot (entire region) Clustered heatmap (samples) Clustered heatmap (regions) Clustered heatmap (samples, regions)
Conserved_Region Coverage pie chart Boxplot diagram Significance barchart Scatterplot (entire region) Clustered heatmap (samples) Clustered heatmap (regions) Clustered heatmap (samples, regions)
Open_Chromatin Coverage pie chart Boxplot diagram Significance barchart Scatterplot (entire region) Clustered heatmap (samples) Clustered heatmap (regions) Clustered heatmap (samples, regions)
Enhancer_H3K4me2 Coverage pie chart Boxplot diagram Significance barchart Scatterplot (entire region) Clustered heatmap (samples) Clustered heatmap (regions) Clustered heatmap (samples, regions)
Imprinted_Region Coverage pie chart Boxplot diagram Significance barchart Scatterplot (entire region) Clustered heatmap (samples) Clustered heatmap (regions) Clustered heatmap (samples, regions)
CellStateGene_Promoter Coverage pie chart Boxplot diagram Significance barchart Scatterplot (entire region) Clustered heatmap (samples) Clustered heatmap (regions) Clustered heatmap (samples, regions)
CancerGene_Promoter Coverage pie chart Boxplot diagram Significance barchart Scatterplot (entire region) Clustered heatmap (samples) Clustered heatmap (regions) Clustered heatmap (samples, regions)
Tiling_regions_5kb Coverage pie chart Boxplot diagram Significance barchart Scatterplot (entire region) Clustered heatmap (samples) Clustered heatmap (regions) Clustered heatmap (samples, regions)

Supplementary Tables

The following tables contain the raw data behind all analyses reported above.

Promoter_ensembl (hg18) RRBS Basic table Comprehensive table Comprehensive table (filtered) Groupwise comparison (filtered)
Promoter_centered (hg18) RRBS Basic table Comprehensive table Comprehensive table (filtered) Groupwise comparison (filtered)
Promoter_region (hg18) RRBS Basic table Comprehensive table Comprehensive table (filtered) Groupwise comparison (filtered)
CpG_Island (hg18) RRBS Basic table Comprehensive table Comprehensive table (filtered) Groupwise comparison (filtered)
BonaFide_CGI (hg18) RRBS Basic table Comprehensive table Comprehensive table (filtered) Groupwise comparison (filtered)
BonaFide_CGI_Shore (hg18) RRBS Basic table Comprehensive table Comprehensive table (filtered) Groupwise comparison (filtered)
Conserved_Region (hg18) RRBS Basic table Comprehensive table Comprehensive table (filtered) Groupwise comparison (filtered)
Open_Chromatin (hg18) RRBS Basic table Comprehensive table Comprehensive table (filtered) Groupwise comparison (filtered)
Enhancer_H3K4me2 (hg18) RRBS Basic table Comprehensive table Comprehensive table (filtered) Groupwise comparison (filtered)
Imprinted_Region (hg18) RRBS Basic table Comprehensive table Comprehensive table (filtered) Groupwise comparison (filtered)
CellStateGene_Promoter (hg18) RRBS Basic table Comprehensive table Comprehensive table (filtered) Groupwise comparison (filtered)
CancerGene_Promoter (hg18) RRBS Basic table Comprehensive table Comprehensive table (filtered) Groupwise comparison (filtered)
Tiling_regions_5kb (hg18) RRBS Basic table Comprehensive table Comprehensive table (filtered) Groupwise comparison (filtered)